Embed Size (px)
Citation preview
This presentation is for informational use and may not reflect views
shared by the Department of Pesticide Regulation
Waterborne Env ronmental, IncMay 2012
1
Waterborne Env ronmental, IncMay 2012
4
i . Waterborne Environmental, Inc.
May 2012 1
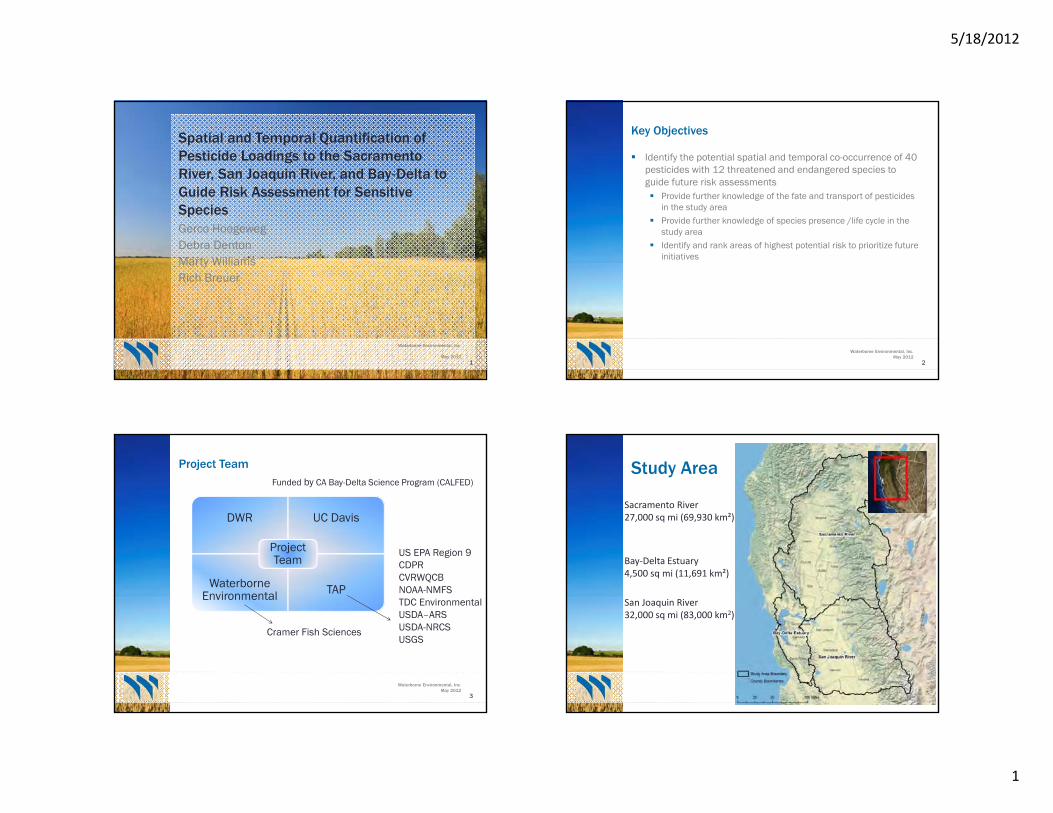
Spatial and Temporal Quantification of Pesticide Loadings to the Sacramento River, San Joaquin River, and Bay‐Delta to Guide Risk Assessment for Sensitive Species Gerco Hoogeweg Debra Denton Marty Williams Rich Breuer
Waterborne Environmental, Inc. May 2012
3
Project Team Funded by CA Bay-Delta Science Program (CALFED)
DWR UC Davis
Waterborne Environmental TAP
Project Team
US EPA Region 9 CDPR CVRWQCB NOAA-NMFS TDC Environmental USDA–ARS USDA-NRCS Cramer Fish Sciences USGS
Waterborne Environmental, Inc. May 2012
2
Key Objectives
Identify the potential spatial and temporal co-occurrence of 40 pesticides with 12 threatened and endangered species to guide future risk assessments Provide further knowledge of the fate and transport of pesticides
in the study area Provide further knowledge of species presence /life cycle in the
study area Identify and rank areas of highest potential risk to prioritize future
initiatives
i .
Study Area
Sacramento River 27,000 sq mi (69,930 km²)
Bay‐Delta Estuary 4,500 sq mi (11,691 km²)
San Joaquin River 32,000 sq mi (83,000 km2)
5/18/2012
1
Waterborne Env ronmental, IncMay 2012
5
Spring Run Chinook Salmon
Waterborne Env ronmental, IncMa 2012
5/18/2012
i .
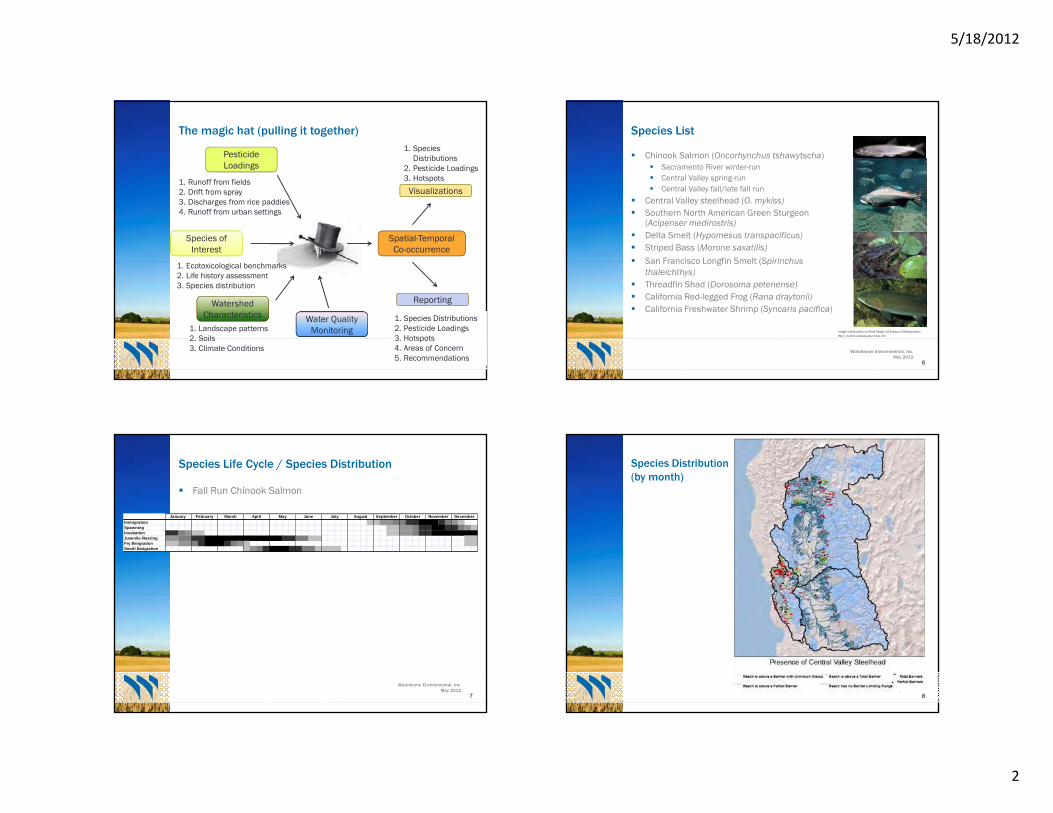
The magic hat (pulling it together)
Pesticide Loadings
1. Runoff from fields 2. Drift from spray 3. Discharges from rice paddies 4. Runoff from urban settings
Species of Interest
1. Ecotoxicological benchmarks 2. Life history assessment 3. Species distribution
Watershed Characteristics
1. Landscape patterns 2. Soils 3. Climate Conditions
Water Quality Monitoring
Spatial-Temporal Co-occurrence
Visualizations
Reporting
1. Species Distributions
2. Pesticide Loadings 3. Hotspots
1. Species Distributions 2. Pesticide Loadings 3. Hotspots 4. Areas of Concern 5. Recommendations
Waterborne Environmental, Inc. May 2012
6
Species List
Chinook Salmon (Oncorhynchus tshawytscha) Sacramento River winter-run Central Valley spring-run Central Valley fall/late fall run
Central Valley steelhead (O. mykiss) Southern North American Green Sturgeon
(Acipenser medirostris) Delta Smelt (Hypomesus transpacificus) Striped Bass (Morone saxatilis) San Francisco Longfin Smelt (Spirinchus
thaleichthys) Threadfin Shad (Dorosoma petenense) California Red-legged Frog (Rana draytonii) California Freshwater Shrimp (Syncaris pacifica)
Longfin smelt photo by René Reyes, US Bureau of Reclamation. http://calfish.ucdavis.edu/index.cfm
Waterborne Environmental, Inc. May 2012
7
Species Life Cycle / Species Distribution
Fall Run Chinook Salmon
Immigration Spawning Incubation Juvenile Rearing Fry Emigration Smolt Emigration
June May April March February January August July December November October September
Species Distribution (by month)
i . y
8
2
Waterborne Environmental, Inc. May 2012
99
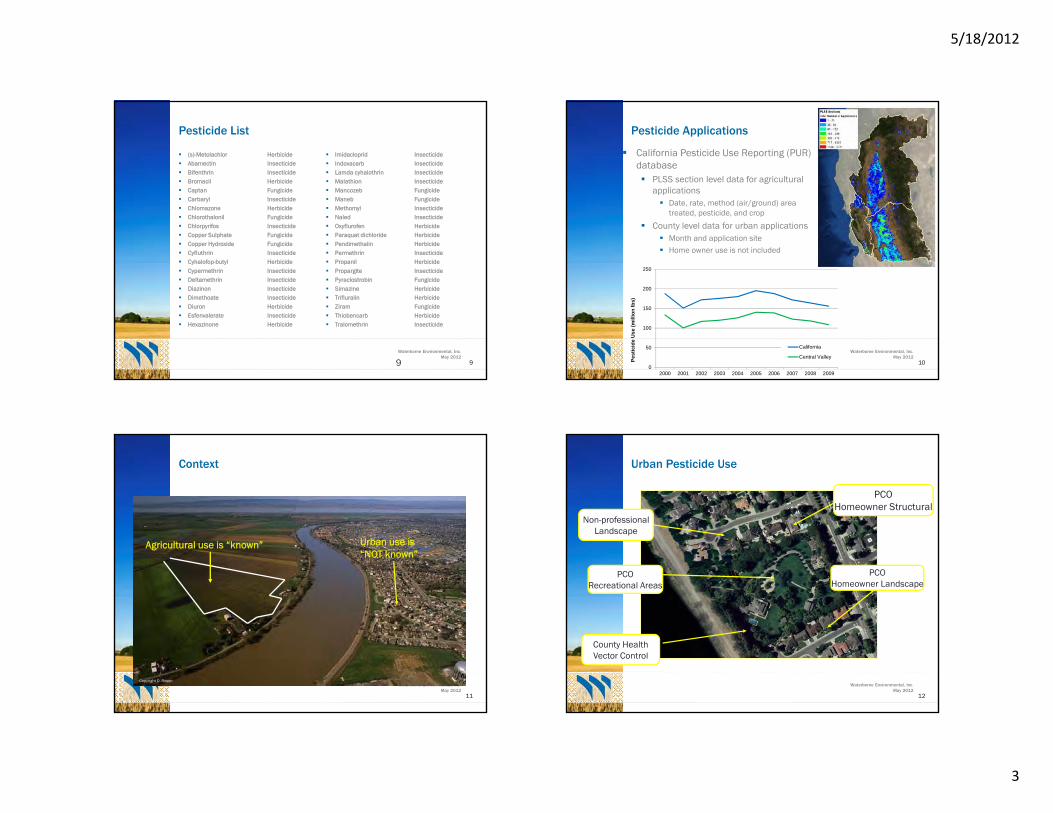
Pesticide List
(s)-Metolachlor Herbicide Abamectin Insecticide Bifenthrin Insecticide Bromacil Herbicide Captan Fungicide Carbaryl Insecticide Chlomazone Herbicide Chlorothalonil Fungicide Chlorpyrifos Insecticide Copper Sulphate Fungicide Copper Hydroxide Fungicide Cyfluthrin Insecticide Cyhalofop-butyl Herbicide Cypermethrin Insecticide Deltamethrin Insecticide Diazinon Insecticide Dimethoate Insecticide Diuron Herbicide Esfenvalerate Insecticide Hexazinone Herbicide
Waterborne Environmental, Inc. May 2012
10
Pesticide Applications
California Pesticide Use Reporting (PUR) database PLSS section level data for agricultural
applications Date, rate, method (air/ground) area
treated, pesticide, and crop
County level data for urban applications Month and application site Home owner use is not included
0
50
100
150
200
250
2000 2001 2002 2003 2004 2005 2006 2007 2008 2009
Pest
icid
e U
se (m
illio
n lb
s)
California
Central Valley
Imidacloprid Indoxacarb Lamda cyhalothrin Malathion Mancozeb Maneb Methomyl Naled Oxyflurofen Paraquat dichloride Pendimethalin Permethrin Propanil Propargite Pyraclostrobin Simazine Trifluralin Ziram Thiobencarb Tralomethrin
Insecticide Insecticide Insecticide Insecticide Fungicide Fungicide Insecticide Insecticide Herbicide Herbicide Herbicide Insecticide Herbicide Insecticide Fungicide Herbicide Herbicide Fungicide Herbicide Insecticide
Waterborne Environmental, Inc. May 2012
11
Context
Urban use is “NOT known”
Agricultural use is “known”
Copyright D. Rosen Waterborne Environmental, Inc.
May 2012 12
Urban Pesticide Use
Non-professional Landscape
PCO Recreational Areas
PCO Homeowner Landscape
PCO Homeowner Structural
County Health Vector Control
5/18/2012
3
5/18/2012
Waterborne Environmental, Inc. May 2012
13
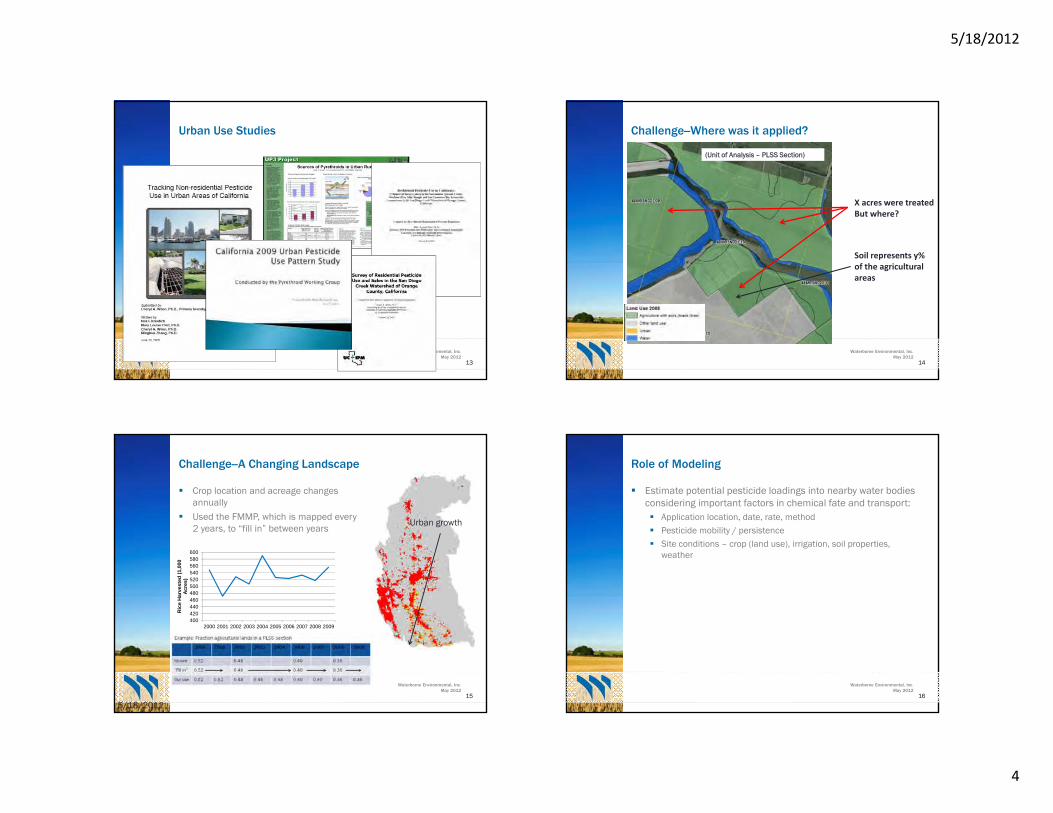
Urban Use Studies
Waterborne Environmental, Inc. May 2012
14
Challenge--Where was it applied?
X acres were treated But where?
Soil represents y% of the agricultural areas
(Unit of Analysis – PLSS Section)
Waterborne Environmental, Inc. May 2012
15
Challenge--A Changing Landscape
Crop location and acreage changes annually
Used the FMMP, which is mapped every 2 years, to “fill in” between years
5/18/2012
400 420 440 460 480 500 520 540 560 580 600
2000 2001 2002 2003 2004 2005 2006 2007 2008 2009
Ric
e H
arve
sted
(1,0
00
Acre
s)
Urban growth
Waterborne Environmental, Inc. May 2012
16
Role of Modeling
Estimate potential pesticide loadings into nearby water bodies considering important factors in chemical fate and transport: Application location, date, rate, method Pesticide mobility / persistence Site conditions – crop (land use), irrigation, soil properties,
weather
4
Waterborne Env ronmental, IncMay 2012
19
Waterborne Env ronmental, May
5/18/2012
Waterborne Environmental, Inc. May 2012
17
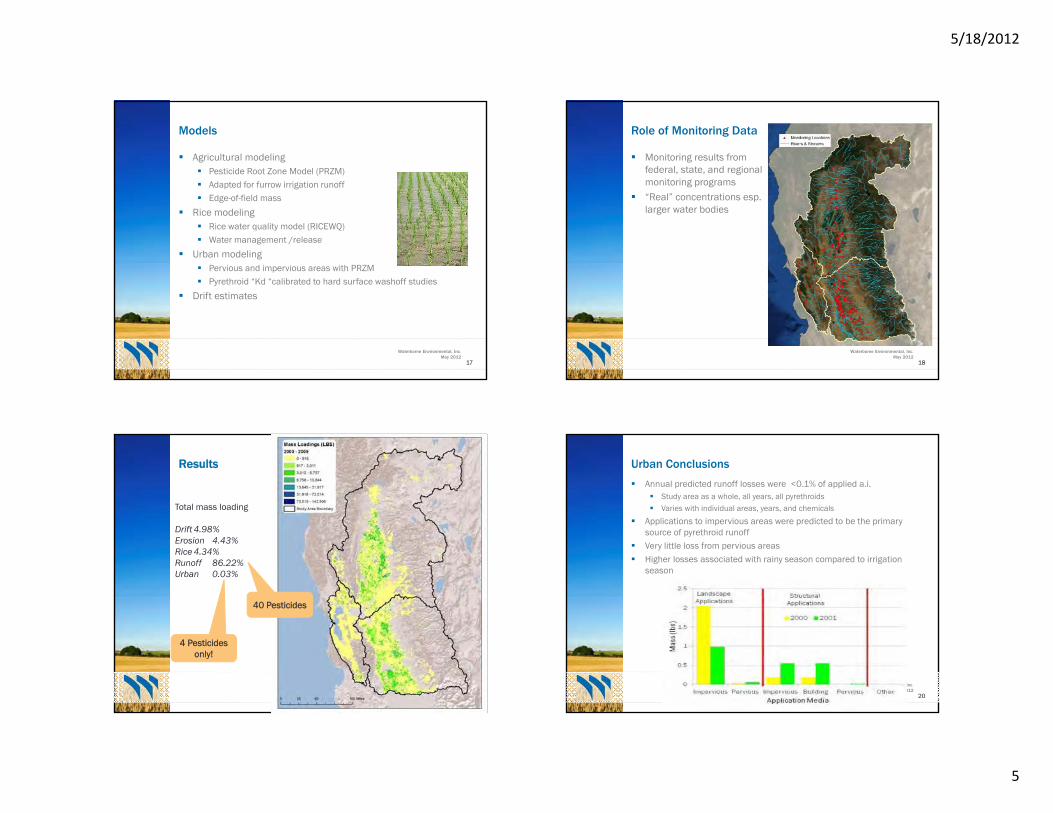
Models
Agricultural modeling Pesticide Root Zone Model (PRZM) Adapted for furrow irrigation runoff Edge-of-field mass
Rice modeling Rice water quality model (RICEWQ) Water management /release
Urban modeling Pervious and impervious areas with PRZM Pyrethroid “Kd “calibrated to hard surface washoff studies
Drift estimates
Waterborne Environmental, Inc. May 2012
18
Role of Monitoring Data
Monitoring results from federal, state, and regional monitoring programs
“Real” concentrations esp. larger water bodies
i .
4 Pesticides only!
40 Pesticides
Results
Total mass loading
Drift 4.98% Erosion 4.43% Rice 4.34% Runoff 86.22% Urban 0.03%
i Inc. 2012
20
Urban Conclusions
Annual predicted runoff losses were <0.1% of applied a.i. Study area as a whole, all years, all pyrethroids Varies with individual areas, years, and chemicals
Applications to impervious areas were predicted to be the primary source of pyrethroid runoff
Very little loss from pervious areas Higher losses associated with rainy season compared to irrigation
season
5

5/18/2012
Waterborne Environmental, Inc. May 2012
21
Spatial Distribution of Urban Pyrethroid “Loads”
Waterborne Environmental, Inc. May 2012
22
Co-occurrence
What is co-occurring? Species of concern Pesticides in surface water
Requirement for co-occurrence Same location (PLSS section level) Same time (monthly)
Goal is to develop an scalable index that takes into account available species and pesticide information
Waterborne Environmental, Inc. May 2012
23
Questions to consider when developing a Co-occurrence Index
RQ ≥ 1
What if two pesticides have RQ ≥ 1 on the
same day?
Do we need to consider additive/cumulative
effects?
What time period do we consider?
Can we calculate a fraction of events
exceeding the benchmarks?
Can we kill the same fish or shrimp twice?
Do we know which pesticide affects which
species?
Do we consider all events where RQ ≥ 1?
Do we need to consider sublethal
effects?
Are we doing a absolute or relative
ranking?
Consider Indirect effects?
Is species presence as important as richness? Waterborne Environmental, Inc.
May 2012 24
Co-occurrence Index
Indicator days - day that one or more pesticides exceed the toxicity threshold On monthly basis compute the number of indicator days within a
PLSS Determine the percentile points from all PLSS (10th, 20th, … 90th,
100th)
Species richness – the number of species present in a given area On a monthly basis compute the number of species present within
a PLSS Determine the percentile points from all PLSS (10th, 20th, … 90th,
100th)
Flexible and scalable to the questions be asked
6

Waterborne Env ronmental,
Waterborne Env ronmental, IncMay 2012
Wat
5/18/2012
Indicator Days by Month
Waterborne Environmental, Inc. May 2012
25
Indicator Days
Distribution of Indicator Days for randomly selected PLSS Sections
0.000
0.100
0.200
0.300
0.400
0.500
0.600
0.700
0.800
0.900
1 2 3 4 5 6 7 8 9 10 11 12
Frac
tion
of In
dica
tor D
ays
Month
i Inc. May 2012
26
i .
27
Species Richness / Indicator Days
erborne Environmental, Inc. May 2012
28
0
0
Multi-dimensional Index
No potential co-occurrence
Increased potential cooccurrence
Fraction Indicator Days
Sp
ecie
s R
ichn
ess
No co-occurrence
No co-occurrence
7

210
5
61
Waterborne Env ronmental, IncMay 2012
30
5/18/2012
Waterborne Environmental, Inc. May 2012
29
0 1 2 3 4 5 6 7 8 9 10
0 00 01 02 03 04 05 06 07 08 09 010
1 10 11 12 13 14 15 16 17 18 19 110
2 20 21 22 23 24 25 26 27 28 29
3 30 31 32 33 34 35 36 37 38 39 310
4 40 41 42 43 44 45 46 47 48 49 410
50 51 52 53 54 55 56 57 58 59 510
6 60 62 63 64 65 66 67 68 69 610
7 70 71 72 73 74 75 76 77 78 79 710
8 80 81 82 83 84 85 86 87 88 89 810
9 90 91 92 93 94 95 96 97 98 99 910
10 100 101 102 103 104 105 106 107 108 109 1010
Sp
ecie
s R
ichn
ess What
does 73 mean?
73 means that at least 70% of the species are present and the top 70 percentile of the indicator events. Emphasis would be on the species
What does 37
mean?
37 means that top 70
Multi-dimensional Index Implementation Indicator Days
Q: Show all areas with at least half the species present and 50th percentile indicator events for the month of July?
percentile of the indicator events are considered and at least 30% of the species are present. Emphasis would be on the pesticides.
i .
Species Indicator Days
Waterborne Environmental, Inc. May 2012
31
Results Processing
Pesticide mass loading
Spatial & temporal co-occurrence
No concern
Need additional study
No concern
Aquatic habitat concentration
Monitoring
Benchmark
Compare concentrations with benchmarks
Determine cooccurrence
Are there monitoring stations present downstream?
Species
Waterborne Environmental, Inc. May 2012
32
Co-occurrence predictions do not indicate adverse effects
Caveats based on data limitations and uncertainty
PUR precision / accuracy Pesticide properties Field-specific characteristics Hydrography Hydrology / hydraulics Species distributions Dissipation processes not represented Standardized assumptions
8

Waterborne Env ronmental, IncMay 2012
36
Waterborne Env ronmental, Inc
Some Conference Somewhere about Someth ng 36
5/18/2012
Use of Results
Relative risk Prioritize research Where to focus refined risk assessments Support future monitoring programs
(strategic locations, sampling frequency) Aid in developing plans to improve ecosystem quality and water
quality (e.g., BMPs, hydrologic operations)
Waterborne Environmental, Inc. May 2012
33
Next steps
Where to house data? Development of GIS user interface? Data mining
Causal assessment BMP assessments Other “what-if” scenarios
Refine data gaps and areas of uncertainty Upgrade components Extend species further upstream Link to routing models
Foundation for other initiatives Address additional pesticides and/or other constituents Future trends
climate change land use change
Link with population models
Program specific needs
Waterborne Environmental, Inc. May 2012
34
Data and Framework Retained for Future Analysis
GIS products Species of concern maps – by species by month Land use changes Mass loadings – by pesticide by source by day Indicator days – by pesticide by day Etc
Model ready input Cropping parameters Soil properties Weather data Pesticide properties Etc.
Waterborne Environmental, Inc. May 2012
35
i . i .
i
Questions? Photo credit: D. Rosen
9

Waterborne Env ronmenta
5/18/2012
Urban Approach
Bifenthrin, cypermethrin, and cyfluthrin Highest urban uses (DPR-PUR) and most often contributing to
toxicity (Moran, 2010)
Permethrin Highest urban use (DPR-PUR)
Professional pest control operator (PCO) use from PUR Structural, landscape, other (right-of-way, uncultivated non-ag,
turf/sod)
Homeowner use Bifenthrin only - assume 0.25 x PCO use (Moran, 2010)
i l, Inc. May 2012
37
10

Rich Breuer, CDWR at 916‐376‐9694 [email protected]
Debra Denton, USEPA Region 9 at 916‐341‐5520 [email protected]
Gerco Hoogeweg, Waterborne Environmental Inc. hoogewegg@waterborne‐env.com
Marty Williams, Waterborne Environmental Inc. williamsm@waterborne‐env.com
To download report and see overview of project: http://www.waterborne‐env.com/projects_featured.asp