Embed Size (px)
Citation preview

This presentation is an overview of MHI’s financial results for the first quarter of fiscal year 2019, the period from April through June 2019.
0

Some financial data in our quarterly results reports and results highlights for fiscal year 2018 has been retroactively amended in line with the booking of lease assets to the balance sheet in accordance with IFRS16. In this presentation, however, in order to facilitate comparison with past figures, financial data for fiscal 2018 has not been amended.
1

2

Here we see the results highlights for the first quarter of fiscal 2019.
Orders received, revenue, and profit from business activities all increased year‐on‐year. These results indicate steady progress toward achieving our full‐year forecasts.
3

Orders received reached 750.2 billion yen, making for a year‐on‐year increase of 43.1 billion yen. Growth was achieved on the back of robust orders especially for GTCC. Year‐on‐year increases were also achieved in revenue, profit from business activities, profit attributable to owners of parent, and EBITDA.
Free cash flow deteriorated by 72.5 billion yen – the result of declines in trade payables and contract liabilities. We do not believe this is a serious problem, however, in terms of our ongoing efforts to improve our balance sheet and raise our asset turnover.
4

The first quarter saw a cash outlay of 33.1 billion yen for investment in the SpaceJet(MRJ). Of that amount, profit from business activities was impacted by 5.4 billion yen. The difference was booked to the balance sheet as an asset.
On a full‐year basis, we have made no change to our forecast of cash outlays totaling 100 billion yen, with 80 billion yen of that amount treated as an expenditure.
5
Orders received increased year‐on‐year in the Power Systems, Industry & Infrastructure, and Aircraft, Defense & Space segments. In the Power Systems segment, a decrease in orders for steam power was offset by increased orders for GTCC.
Revenue decreased in the Industry & Infrastructure segment. This was attributable to sluggish orders for mass‐manufactured products –turbochargers, engines and material handling equipment – compared to the year before. Revenue in the Aircraft, Defense & Space segment was generally unchanged from the previous year level.
Profit from business activities decreased by 5.9 billion yen year‐on‐year in the Power Systems segment, finishing at 19.2 billion yen. Profit from GTCC increased from fiscal 2018, but overall, profit in this segment was down mainly due to a low progress rate of nuclear power construction to which the percentage of completion method is applied.
In the Industry & Infrastructure segment, profit from business activities declined slightly year‐on‐year. The term saw improvement in profit/loss from commercial ship and metals machinery operations, but revenue from mass‐manufactured products was sluggish.
In the Aircraft, Defense & Space segment, profit from business activities increased year‐on‐year. This owed mainly to reduced impact from SpaceJet (MRJ) investment and relatively solid profit in the commercial aircraft Tier1 business.
6

As of June 30, 2019, total assets stood at 5,216.1 billion yen. Although this represented an increase by 73.3 billion yen from March 31, 2019, the total includes 96.8 billion yen in assets from the booking of lease assets – which were previously off the book – in line with the adoption of IFRS16. When the latter impact is factored out, total assets actually decreased year‐on‐year. Overall, the Company’s assets are in an expansionary trend, as indicated by the quarterly increase in inventories, etc. from construction progress. We view this unusual decrease in total assets as a result of our ongoing efforts to improve our balance sheet and its efficiency.
Turning to liabilities, as already noted, trade payables and contract liabilities both decreased from their respective levels as of March 31st. What these decreases mean is that trade payables and contract liabilities were converted to cash and expended. In the near term, we intend to increase capital mainly through commercial papers; we have no intention of increasing our borrowings.
Equity decreased from the level of March 31st, owing to dividend payout and a decrease in other comprehensive income. Other comprehensive income incorporates unrealized holding gains on investment securities, etc. and overseas assets, which were impacted by strengthening of the yen.
We might add that during the first quarter our cash conversion cycle – which doesn’t appear in this presentation – was 37 days, marking an improvement year‐on‐year.
7
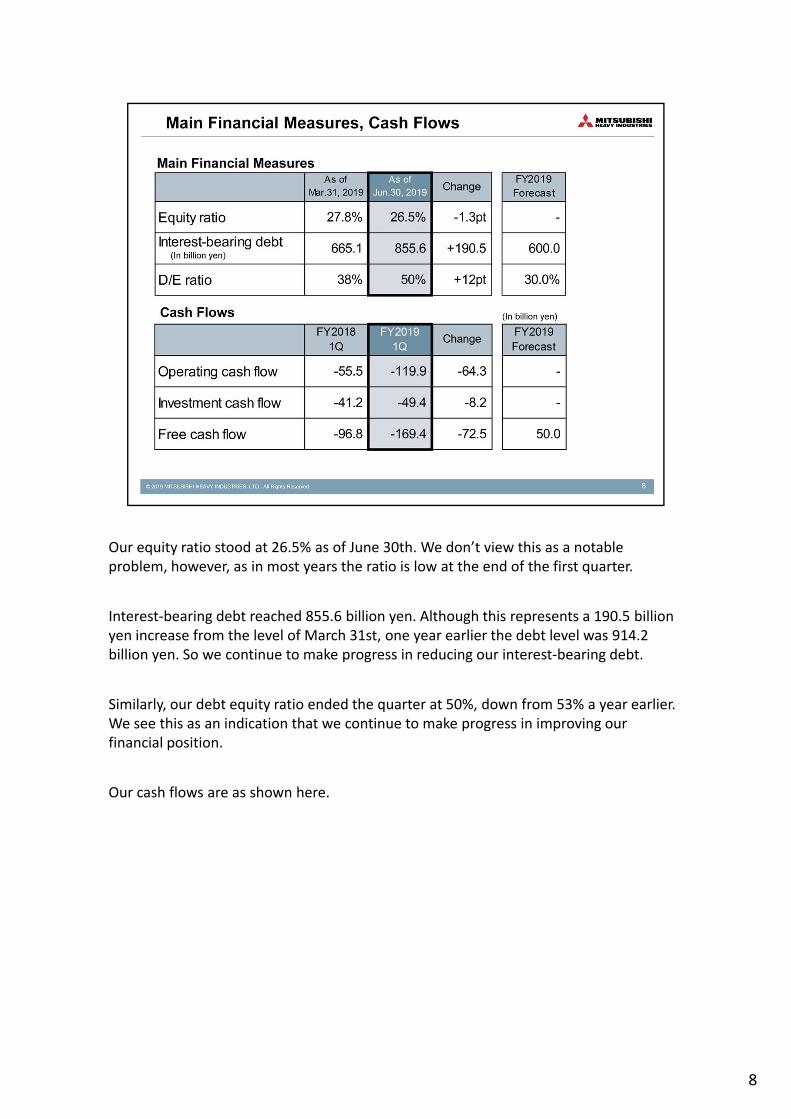
Our equity ratio stood at 26.5% as of June 30th. We don’t view this as a notable problem, however, as in most years the ratio is low at the end of the first quarter.
Interest‐bearing debt reached 855.6 billion yen. Although this represents a 190.5 billion yen increase from the level of March 31st, one year earlier the debt level was 914.2 billion yen. So we continue to make progress in reducing our interest‐bearing debt.
Similarly, our debt equity ratio ended the quarter at 50%, down from 53% a year earlier. We see this as an indication that we continue to make progress in improving our financial position.
Our cash flows are as shown here.
8
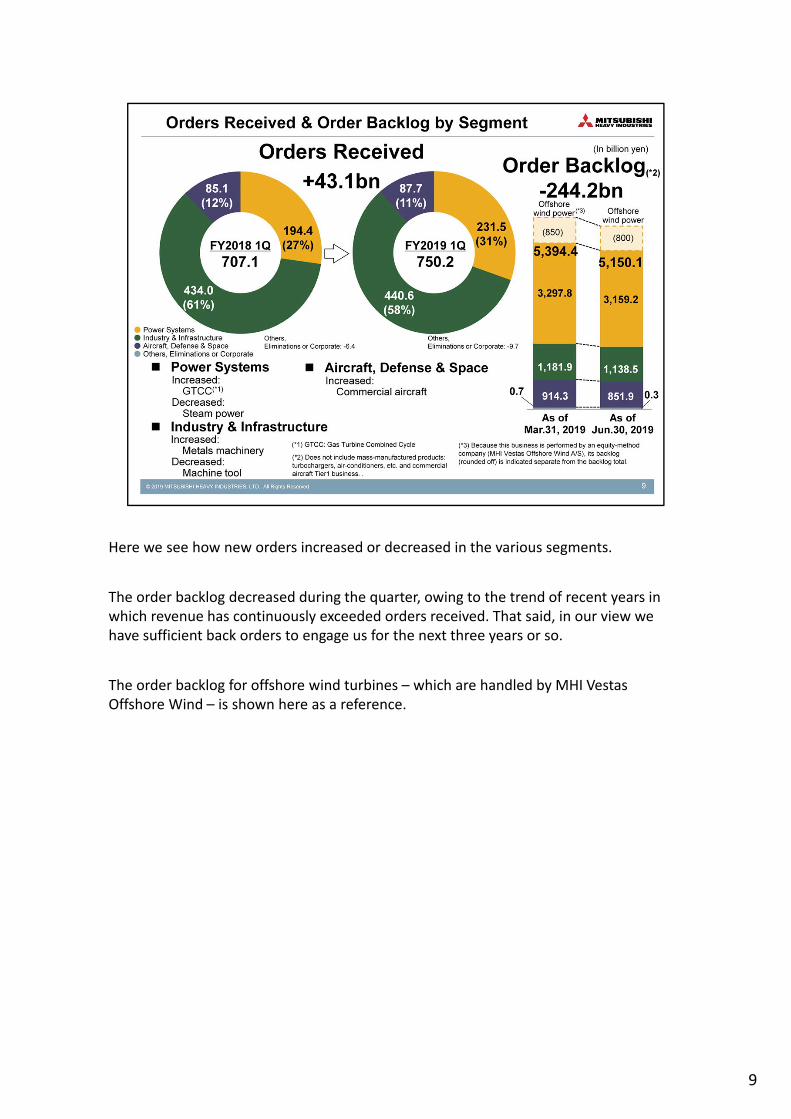
Here we see how new orders increased or decreased in the various segments.
The order backlog decreased during the quarter, owing to the trend of recent years in which revenue has continuously exceeded orders received. That said, in our view we have sufficient back orders to engage us for the next three years or so.
The order backlog for offshore wind turbines – which are handled by MHI Vestas Offshore Wind – is shown here as a reference.
9

The segment‐based revenue figures are indicated here.
10
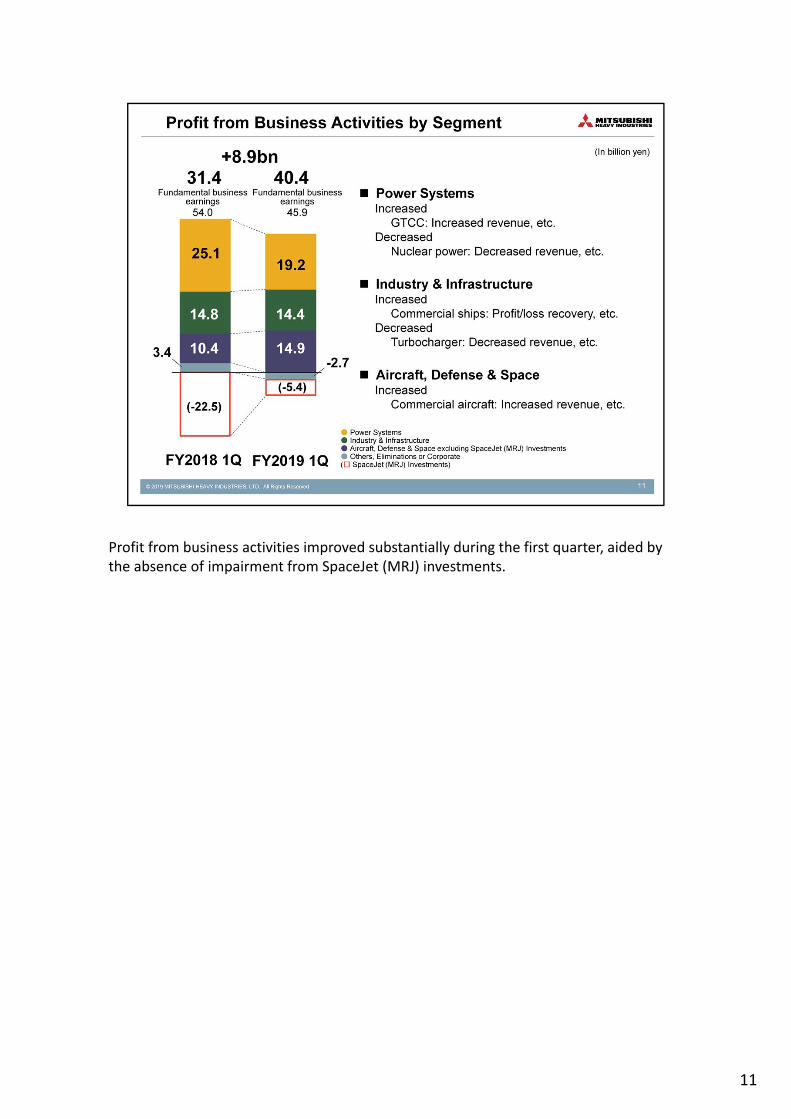
Profit from business activities improved substantially during the first quarter, aided by the absence of impairment from SpaceJet (MRJ) investments.
11

12
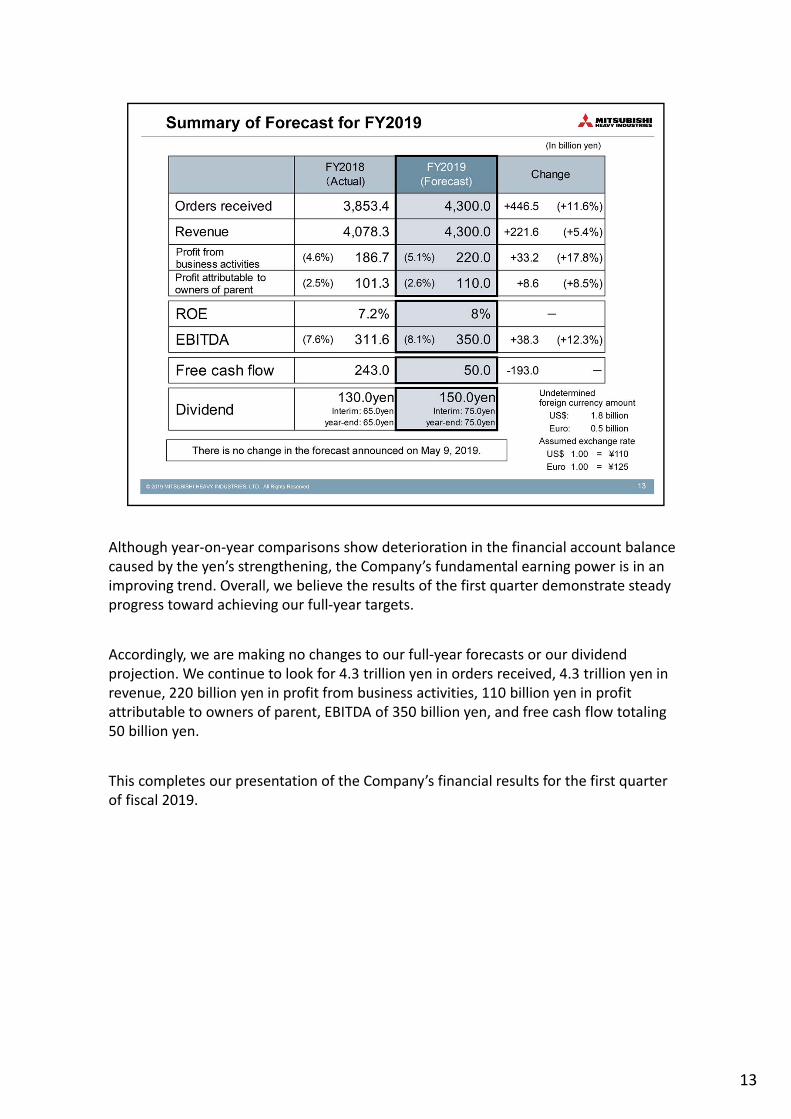
Although year‐on‐year comparisons show deterioration in the financial account balance caused by the yen’s strengthening, the Company’s fundamental earning power is in an improving trend. Overall, we believe the results of the first quarter demonstrate steady progress toward achieving our full‐year targets.
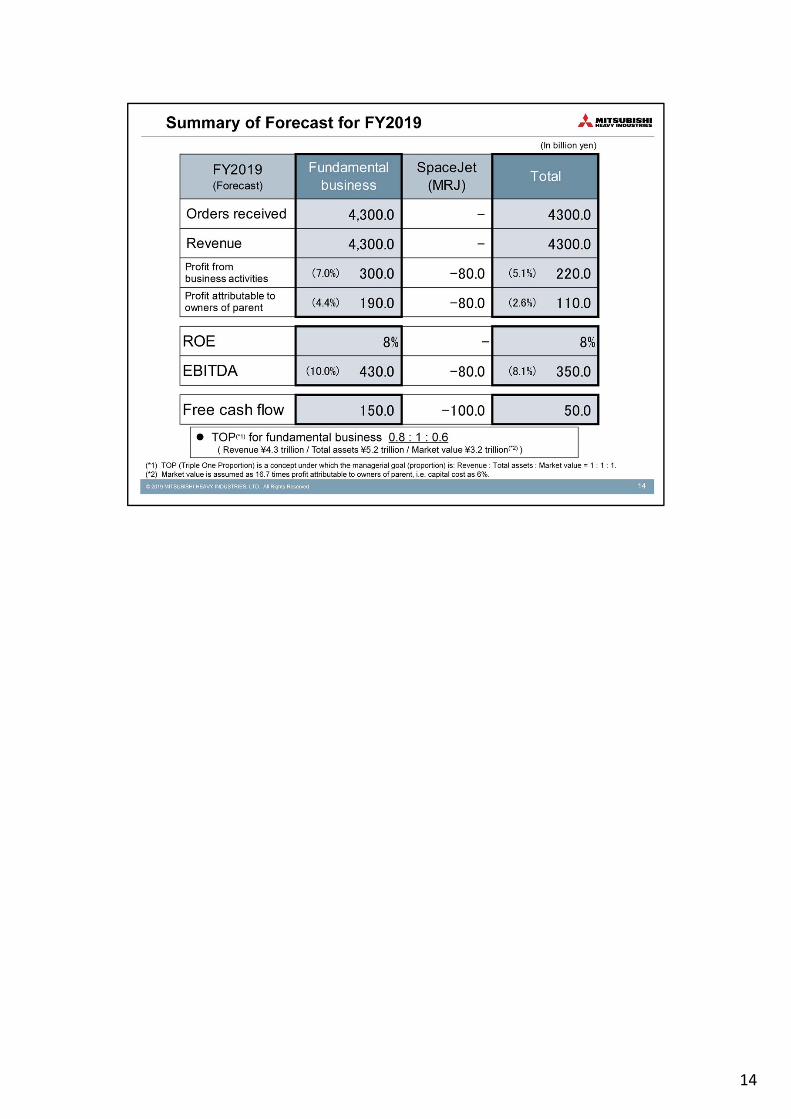
Accordingly, we are making no changes to our full‐year forecasts or our dividend projection. We continue to look for 4.3 trillion yen in orders received, 4.3 trillion yen in revenue, 220 billion yen in profit from business activities, 110 billion yen in profit attributable to owners of parent, EBITDA of 350 billion yen, and free cash flow totaling 50 billion yen.
This completes our presentation of the Company’s financial results for the first quarter of fiscal 2019.
13
14

15
16

17

18

19

20

21
![Financial Inclusion: General Overview, Central Banks …...Financial Inclusion [General Overview] •Financial inclusion or inclusive financing is the delivery of financial services](https://img.pdfslide.us/doc/110x75/5e95eef43708446e852354fe/financial-inclusion-general-overview-central-banks-financial-inclusion-general.jpg)