Embed Size (px)
Citation preview

This pre-publication material is for review purposes only. Any typographical or technical errors will be
corrected prior to publication.
Copyright © 2013 Pearson Canada Inc. All rights reserved.


C HAPTER 6
Databases and Information Management
O P E N I N G C A S E
G overnments around the world are opening up their data stores to the pub-lic. If we think about the kinds of data that are available, the imagination can run away with ideas about research, interesting stories, and even the ability to hold offi cials accountable. We might try to fi nd out how much a particular city councillor spent on travel or how that councillor voted. We might conduct research on how a particular region of Canada was affected by World War I. Or we might want to see which areas were prone to fl ooding or bedbugs.
W ith open data, all this is possible, and the City of Toronto recently took a giant step forward in opening up its data for the world to see. Toronto’s open data initiative is led by a small team in the city authority’s Web Department. The Department updates the data daily with raw datasets on a variety of t opics. Trish Garner, the team’s head, states: “I think
there’s a large community of develop-ers in Toronto and across Canada which is inspired by what’s going on in the U.K. . . . and want to see change here at home. A good majority have registered with us and are quite avidly following what we’re doing.”
I n fact, Canada’s biggest open data sites, the cities of Toronto, Vancouver, Ottawa, and Edmonton, are beginning to work together to compile a series of open data standards that would permit data among the cities to be merged to be used for research and other purposes. Jury Konga, who has been helping to cre-ate the G4 Open Data Framework, s ays that cities across Canada are beginning their own open data initiatives. According to Konga, “We have also seen Open Data surface in the political arena where one of the political parties recently put forward a new policy of Open Gov–Open Data and mayoral candidates in
Toronto advocated increasing the open data program in Toronto.”
T he city of Toronto is still trying to decide exactly what data to make available to the public. A quick check of the open data Web site, located at Toronto.ca/ open, revealed a wide vari-ety of datasets: bicycle counts and loca-tions, apartment standards, bikeways, city wards, data from food and health inspections, election results by polling place, fi re station locations, attendance and voting records of city councillors, sign permit applications, traffi c signal locations, and much more.
A host of location-based applications will be enabled by these datasets. The majority of data opening up is geo-graphically based. Toronto CIO Dave Wallace indicated that the Child Care Finder dataset is one of the most pop-ular. While only a few cities have data catalogues that are “interesting” and that
T oronto Opens Up Its Data
176
�
L E A R N I N G O B J E C T I V E S
A fter reading this chapter, you will be able to answer the following questions:
1. What are the problems of managing data resources in a traditional fi le environment, and how are they solved by a database manage-ment system?
2. What are the major capabilities of database management systems (DBMS), and why is a relational DBMS so powerful?
3. What are some important principles of data-base design?
4. What are the principal tools and technologies for accessing information from databases to improve business performance and decision making?
5. Why are information policy, data administra-tion, and data quality assurance essential for managing the fi rm’s data resources?
06_ch06_laud.indd 17606_ch06_laud.indd 176 28/11/11 6:13 PM28/11/11 6:13 PM
Copyri
ght ©
2013
Pea
rson C
anad
a Inc
. All r
ights
reserv
ed

developers can mash up, Peter Corbett, Founder of Apps for Democracy in the United States, says, “Within 10 years, I’d say there [are] going to be hundreds of them, so this is very early stuff.”
A ccording to a city release, “More datasets will become available in the future. Each new dataset will be reviewed to ensure that the privacy of the public is protected.” If a citizen wants to request a new dataset, the city’s new Web site, datato.org, allows a citizen to enter a request, sets priority levels on the datasets by casting votes,
and permits discussions and debates about specifi c datasets. You can also follow Toronto’s open data initiative on Twitter, at @open_to.
A ccording to then Toronto mayor David Miller, “Anyone can download, analyze, and mash up our data or write applications to make it more acces-sible and useful. It is an invitation to Torontonians to do what they do best: create, innovate, and build a better city.”
E ven the federal government has begun an open data initiative, called the GC Open Data Portal, making more than
260 000 datasets available to the public. Robert Giggey, IT account manager for the City of Ottawa, stated: “Now that the feds are doing it, it gives more incentive for the provinces to get on board.”
S ources: Jennifer Kavur, “Thinking Like the Web,” ComputerWorld Canada, December 4, 2009; Allison Hanes, “Toronto Opens Up,” The National Post, November 2, 2009; “How Canada Became an Open Data and Data Journalism Powerhouse,” www.guardian. co. uk/ news/ datablog/ 2010/ nov/ 09/ canada-open-data, accessed April 2, 2011; Toronto. ca/ open, accessed April 2, 2011; Jennifer Kavur, “Federal Government Launches Pilot Open Data Portal,” ComputerWorld Canada, April 2 011.
�
The City of Toronto’s experience illustrates the importance of data man-agement for the public. Even in gov-ernment, performance depends on what an organization can or cannot do with its data. How organizations store, organize, and manage their data has a tremendous impact on organizational effectiveness.
T he chapter-opening diagram calls attention to important points raised by this case and this chapter. Government leaders decided that the city needed to open up the city’s data to the public. Previously, data about councillors, serv-ices, traffi c and transit, and other impor-tant datasets had been stored where the public could not easily retrieve and
analyze them. Citizens were unable to access data they wanted, and the city needed to provide better service and support.
I n addition to using appropriate technology, the city had to ensure that privacy rights were protected and that requested datasets could be consid-ered for the open data initiative.
FPO
06_ch06_laud.indd 17706_ch06_laud.indd 177 28/11/11 6:13 PM28/11/11 6:13 PM
Copyri
ght ©
2013
Pea
rson C
anad
a Inc
. All r
ights
reserv
ed

6 .1 Organizing Data in a Traditional File Environment
A n effective information system provides users with accurate, timely, and relevant infor-mation. Accurate information is free of errors. Information is timely when it is available to decision makers when it is needed. Information is relevant when it is useful and appro-priate for the types of work and decisions that require it.
Y ou might be surprised to learn that many businesses do not have timely, accurate, or relevant information because the data in their information systems have been poorly organized and maintained. That is why data management is so essential. To understand the problem, let’s look at how information systems arrange data in computer fi les and traditional methods of fi le management.
F ile Organization Terms and Concepts
A computer system organizes data in a hierarchy that starts with bits and bytes and progresses to fi elds, records, fi les, and databases (see Figure 6-1). A bit represents the smallest unit of data a computer can handle. A group of bits, called a byte, represents a single character, which can be a letter, a number, or another symbol. A grouping of characters i nto a word, a group of words, or a complete number (such as a person’s name or age) is called a fi eld . A group of related fi elds, such as the student’s name, the course taken, the date, and the grade, makes up a record ; a group of records of the same type is called a fi le .
F or example, the records in Figure 6-1 could constitute a student course fi le. A group of related fi les makes up a database . The student course fi le illustrated in Figure 6-1 could be grouped with fi les on students’ personal histories and fi nancial backgrounds to create a student database.
A record describes an entity. An entity is a person, place, thing, or event about which we store and maintain information. Each characteristic or quality describing a particu-lar entity is called an attribute . For example, Student_ID, Course, Date, and Grade are attributes of the entity COURSE. The specifi c values that these attributes can have are found in the fi elds of the record describing the entity COURSE.
• Decide which datasets to make available• Dataset standards• Privacy
• Government officials• Management• IS personnel• Development community
• Systems that were not integrated• Transparency for the public• Enabling the public to access needed public information
BusinessChallenges
Management
Organization
Technology
InformationSystem
BusinessSolutions
• Open datasets• Mashup technology
• Data catalogues• Discussion and voting systems• Database management systems
• Enables the public to freely access non- private data and to manipulate the data• Enables transparent government
178 Part II Information Technology Infrastructure
Field
Record
File
Database
Entity
Attribute
06_ch06_laud.indd 17806_ch06_laud.indd 178 28/11/11 6:13 PM28/11/11 6:13 PM
Copyri
ght ©
2013
Pea
rson C
anad
a Inc
. All r
ights
reserv
ed

Chapter 6 Databases and Information Management 179
P roblems with the Traditional File Environment I n most organizations, systems tended to grow independently without a company-wide plan. Accounting, fi nance, manufacturing, human resources, and sales and marketing all developed their own systems and data fi les. Figure 6-2 illustrates the traditional approach to information processing.
E ach application, of course, required its own fi les and its own computer programs to operate. For example, the human resources functional area might have a personnel master fi le, a payroll fi le, a medical insurance fi le, a pension fi le, a mailing list fi le, and so forth until tens, perhaps hundreds, of fi les and programs existed. In the company as a whole, this process led to multiple m aster fi les created, maintained, and operated by separate divisions or departments. As this process goes on for fi ve or ten years, the organization is saddled with hundreds of programs and applications that are very diffi cult to maintain and manage. The resulting problems are data redundancy and inconsistency, program–data dependence, infl exibility, poor data security, and an inability to share data among applications.
D ata Redundancy and Inconsistency Data redundancy is the presence of duplicate data in multiple data fi les so that the same data are stored in more than one place or location. Data redundancy occurs when different groups in an organization independently collect the same piece of data and store it independently of each other. Data redundancy wastes storage resources and also leads to data inconsistency , i n which the same attribute may have different values. For example, in instances of the entity COURSE illustrated in Figure 6-1, the Date fi eld might be updated in some systems but not in others. The same attribute, Student_ID, might also have different fi eld names in different systems in the organization. Some systems might use Student_ID and others might use ID, for example.
A dditional confusion might result from using different coding systems to represent values for an attribute. For instance, the sales, inventory, and manufacturing systems of
A computer system organizes data in a hierarchy that starts with the bit, which represents either a 0 or a 1. Bits can be grouped to form a byte to represent one character, number, or symbol. Bytes can be grouped to form a fi eld, and related fi elds can be grouped to form a record. Related records can be collected to form a fi le, and related fi les can be organized into a database.
F IGURE 6-1 The data hierarchy.
Data redundancy
Data inconsistency
06_ch06_laud.indd 17906_ch06_laud.indd 179 28/11/11 6:13 PM28/11/11 6:13 PM
Copyri
ght ©
2013
Pea
rson C
anad
a Inc
. All r
ights
reserv
ed

180 Part II Information Technology Infrastructure
a clothing retailer might use different codes to represent clothing size. One system might represent clothing size as “extra large” while another might use the code “XL” for the same purpose. The resulting confusion would make it diffi cult for companies to create customer relationship management, supply chain management, or enterprise systems that integrate data from different sources.
P rogram–Data Dependence Program–data dependence refers to the coupling of data stored in fi les and the specifi c programs required to update and maintain those fi les so that changes in programs require changes to the data. Every traditional computer pro-gram has to describe the location and nature of the data with which it works. In a tra-ditional fi le environment, any change in a software program could require a change in t he data accessed by that program. One program might be modifi ed from a six-digit to a seven-digit postal code to incorporate the space between the fi rst three and last three characters. If the original data fi le were changed from six-digit to seven-digit postal codes, other programs that required the six-digit postal code would no longer work properly. These changes would cost millions of dollars to implement properly.
L ack of Flexibility A traditional fi le system can deliver routine scheduled reports after extensive programming efforts, but it cannot deliver ad hoc reports or respond to unan-ticipated information requirements in a timely fashion. The information required by ad hoc requests is somewhere in the system but may be too expensive to retrieve. Several programmers might have to work for weeks to put together the required data items in a new fi le.
P oor Security Because there is little control or management of data, access to and dissemi-nation of information may be out of control. Management may have no way of knowing who is accessing or even making changes to the organization’s data.
L ack of Data Sharing and Availability Because pieces of information in different fi les and different parts of the organization cannot be related to one another, it is virtually impos-sible for information to be shared or accessed in a timely manner. Information cannot fl ow freely across different functional areas or different parts of the organization. If users fi nd different values of the same piece of information in two different systems, they might not want to use these systems because they cannot trust the accuracy of their data.
F IGURE 6-2 Traditional file processing.
T he use of a traditional approach to fi le processing encourages each functional area in a corporation to develop specialized applications. Each application requires a unique data fi le that is likely to be a subset of the master fi le or simply a fi le that is managed separately. These subsets of the master fi le lead to data redundancy and inconsistency, processing infl exibility, and wasted storage resources.
Program–data dependence
06_ch06_laud.indd 18006_ch06_laud.indd 180 28/11/11 6:13 PM28/11/11 6:13 PM
Copyri
ght ©
2013
Pea
rson C
anad
a Inc
. All r
ights
reserv
ed

Chapter 6 Databases and Information Management 181
6 .2 The Database Approach to Data Management
D atabase technology cuts through many of the problems of traditional fi le organization. A more rigorous defi nition of a database is a collection of data organized to serve many applications effi ciently by centralizing the data and managing redundant data. Rather than storing data in separate fi les for each application, data are stored so as t o appear to users as being stored in only one location. A single database services multiple applica-tions. For example, instead of a corporation storing employee data in separate informa-tion systems and separate fi les for personnel, payroll, and benefi ts, the corporation could create a single common human resources database.
D atabase Management Systems
A database management system (DBMS) is software that permits an organization to cen-tralize data, manage them effi ciently, and provide access to the stored data by application programs. The DBMS acts as an interface between application programs and the physi-cal data fi les. When the application program calls for a data item, such as g ross pay, the DBMS fi nds this item in the database and presents it to the application program. Using traditional data fi les, the programmer would have to specify the size and format of each data element used in the program and then tell the computer where they were located.
T he DBMS relieves the programmer or end user from the task of understanding where and how the data are actually stored by separating the logical and physical views of the data. The logical view presents data as they would be perceived by end users or business specialists while the physical view shows how data are actually organized and structured on physical storage media.
T he database management software makes the physical database available for different logical views required by users. For example, for the human resources database illustrated in Figure 6-3, a benefi ts specialist might require a view consisting of the employee’s name, social insurance number, and supplemental health insurance coverage. A payroll depart-ment member might need data such as the employee’s name, social insurance number, gross pay, and net pay. The data for all these views are stored in a single database where they can be more easily managed by the organization.
H ow a DBMS Solves the Problems of the Traditional File Environment A DBMS reduces data redundancy and inconsistency by minimizing isolated fi les in which the same data are repeated. The DBMS may not enable the organization to eliminate data redundancy
F IGURE 6-3 Human resources database with multiple views.
A single human resources database provides many different views of data, depending on the information requirements of the user. Illustrated here are two possible views, one of interest to a benefi ts specialist and one of interest to a member of the company’s payroll department.
Database (rigorous defi nition)
Database managementsystem (DBMS)
Logical view
Physical view
06_ch06_laud.indd 18106_ch06_laud.indd 181 28/11/11 6:13 PM28/11/11 6:13 PM
Copyri
ght ©
2013
Pea
rson C
anad
a Inc
. All r
ights
reserv
ed

182 Part II Information Technology Infrastructure
entirely, but it can help control redundancy by integrating various fi les into one DBMS. Even if the organization maintains some redundant data, using a DBMS eliminates data inconsistency because the DBMS can help the organization ensure t hat every occurrence of redundant data has the same values. The DBMS uncouples programs and data, enabling data to stand on their own. Access and availability of information will be increased and program development and maintenance costs reduced because users and programmers can perform ad hoc queries of data in the database. The DBMS enables the organization to cen-trally manage data, their use, and security through the use of a data dictionary (see below).
R elational DBMS Contemporary DBMS use different database models to keep track of enti-ties, attributes, and relationships. The most popular type of DBMS today for PCs as well as for larger computers and mainframes is the relational DBMS . Relational databases repre-sent data as two-dimensional tables (called relations). Tables are also referred to as fi les . Each table contains data on an entity and its attributes. Microsoft Access is a relational DBMS for desktop systems while DB2, Oracle Database, and Microsoft SQL Server are relational DBMS for large mainframes and midrange computers. MySQL is a popular open-source DBMS, and Oracle Database Lite is a DBMS for small handheld computing devices.
L et us look at how a relational database organizes data about suppliers and parts (see Figure 6-4). The database has a separate table for the entity SUPPLIER and a table for the entity PART. Each table consists of a grid of columns and rows of data. Each individual
A relational database organizes data in the form of two-dimensional tables. Illustrated here are tables for the entities SUPPLIER and PART showing how they represent each entity and its attributes. Supplier_Number is a primary key for the SUPPLIER table and a foreign key for the PART table.
F IGURE 6-4 Relational database tables.
Relational DBMS
06_ch06_laud.indd 18206_ch06_laud.indd 182 28/11/11 6:13 PM28/11/11 6:13 PM
Copyri
ght ©
2013
Pea
rson C
anad
a Inc
. All r
ights
reserv
ed

Chapter 6 Databases and Information Management 183
element of data for each entity is stored as a s eparate fi eld, and each fi eld represents an attribute for that entity. Fields in a relational database are also called columns. For the entity SUPPLIER, the supplier identifi cation number, name, street, city, province, and postal code are stored as separate fi elds within the SUPPLIER table, and each fi eld repre-sents an attribute for the entity SUPPLIER.
T he actual information about a single supplier that resides in a table is called a row. Rows are commonly referred to as records , or in very technical terms, as tuples . Data for the entity PART have their own separate t able.
The fi eld for Supplier_Number in the SUPPLIER table uniquely identifi es each record so that the record can be retrieved, updated, or sorted, and it is called a key fi eld . Every table in a relational database has one fi eld designated as its primary key . This key fi eld is the unique identifi er for all the information in any row of the table, and this primary key cannot be duplicated. Supplier_Number is t he primary key for the SUPPLIER table, and Part_Number is the primary key for the PART table. Note that Supplier_Number appears in both the SUPPLIER and PART tables. In the SUPPLIER table, Supplier_Number is the primary key. When the fi eld Supplier_Number appears in the PART table, it is called a foreign key and is essentially a lookup fi eld to look up data about the supplier of a specifi c part.
O perations of a Relational DBMS Relational database tables can be combined easily to deliver data required by users, provided that any two tables share a common data ele-ment. Suppose we wanted to fi nd in this database the names of suppliers who could pro-vide us with part number 137 or part number 150. We would need information from two tables: the SUPPLIER table and the PART table. Note that these two fi les have a shared data element: Supplier_Number.
I n a relational database, three basic operations, as shown in Figure 6-5, are used to develop useful sets of data: select, join, and project. The select operation creates a subset consisting of all records in the fi le that meet stated criteria. Select creates, in other words, a subset of rows that meet certain criteria. In our example, we want to select records ( rows) from the PART table where the Part_Number equals 137 or 150. The join opera-tion combines relational tables to provide the user with more information than is avail-able in individual tables. In our example, we want to join the now-shortened PART table (only parts 137 or 150 will be presented) and the SUPPLIER table into a single new table.
T he project operation creates a subset consisting of columns in a table, permitting the user to create new tables that contain only the information required. In our example, we want to extract from the new table only the following columns: Part_Number, Part_Name, Supplier_Number, and Supplier_Name.
F IGURE 6-5 The three basic operations of a relational DBMS.
T he select, join, and project operations enable data from two different tables to be combined and only selected attributes to be displayed.
Records (in relational database)
Tuple
Key fi eld
Primary key
Foreign key
06_ch06_laud.indd 18306_ch06_laud.indd 183 28/11/11 6:13 PM28/11/11 6:13 PM
Copyri
ght ©
2013
Pea
rson C
anad
a Inc
. All r
ights
reserv
ed

184 Part II Information Technology Infrastructure
O bject-Oriented DBMS Many applications today require databases that can store and retrieve not only structured numbers and characters, but also drawings, images, photo-graphs, voice, and full-motion video. DBMS designed for organizing structured data into rows and columns are not well suited to handling graphics-based or multimedia applica-tions. Object-oriented databases are better suited for this purpose.
A n object-oriented DBMS stores the data and procedures that act on those data as objects that can be automatically retrieved and shared. Object-oriented database manage-ment systems (OODBMS) are becoming popular because they can be used to manage the various multimedia components or Java applets used in Web applications, which typi-cally integrate pieces of information from a variety of sources.
A lthough object-oriented databases can store more complex types of information than relational DBMS, they are relatively slow compared with relational DBMS for processing large numbers of transactions. Hybrid object-relational DBMS systems are now available to provide capabilities of both object-oriented and relational DBMS.
D atabases in the Cloud Suppose your company wants to use cloud computing services. Is there a way to manage data in the cloud? The answer is a qualifi ed “Yes.” Cloud comput-ing providers offer database management services, but these services typically have less functionality than their on-premises counterparts. At the moment, the primary customer base for cloud-based data management consists of Web-focused startups or small to medium-sized businesses looking for database capabilities at a lower price than a stand-ard relational DBMS.
A mazon Web Services has both a simple non-relational database called SimpleDB and a Relational Database Service, which is based on an online implementation of the MySQL open source DBMS. Amazon Relational Database Service (Amazon RDS) offers the full range of capabilities of MySQL. Pricing is based on usage. (Charges run from 11 cents per hour for a s mall database using 1.7 GB of server memory to $3.10 per hour for a large database using 68 GB of server memory.) There are also charges for the volume of data stored, the number of input–output requests, the amount of data written to the database, and the amount of data read from the database.
A mazon Web Services additionally offers Oracle customers the option to license Oracle Database 11g, Oracle Enterprise Manager, and Oracle Fusion Middleware to run on the Amazon EC2 (Elastic Cloud Compute) platform.
M icrosoft SQL Azure Database is a cloud-based relational database service based on Microsoft’s SQL Server DBMS. It provides a highly available, scalable database service hosted by Microsoft in the cloud. SQL Azure Database helps reduce costs by integrating with existing software tools and providing symmetry with on-premises and cloud databases.
T icketDirect, which sells tickets to concerts, sporting events, theatre performances, and movies in Australia and New Zealand, adopted the SQL Azure Database cloud platform in order to improve management of peak system loads during major ticket sales. It migrated its data to the SQL Azure database. By moving to a cloud solution, TicketDirect is able to scale its computing resources in response to real-time demand while keeping costs low.
O f course, there is a downside to using databases located in the cloud. When the cloud is down or unavailable, businesses cannot access their data. Recently, Amazon’s cloud was down for a period that ranged from 11 hours to fi ve days for their customers that used some of their Eastern-U.S.-based Elastic Cloud Computer ( EC2) services. What would your company do if its cloud-based databases were unavailable? What sort of backup data would you need? Where would it be stored, and how would it be accessed? These are just some of the questions to be answered before putting critical databases on the cloud.
C apabilities of Database Management Systems
A DBMS includes tools for organizing, managing, and accessing the data in the database. The most important are its data defi nition language, data dictionary, and data manipula-tion language.
D BMS have a data defi nition capability to specify the structure of the content of the database. It would be used to create database tables and to defi ne the characteristics of the
Object-oriented DBMS
Object-relational DBMS
Data defi nition
06_ch06_laud.indd 18406_ch06_laud.indd 184 28/11/11 6:13 PM28/11/11 6:13 PM
Copyri
ght ©
2013
Pea
rson C
anad
a Inc
. All r
ights
reserv
ed

Chapter 6 Databases and Information Management 185
fi elds in each table. This information about the database would be documented in a data dictionary , an automated or manual fi le that stores defi nitions of data elements and their characteristics.
M icrosoft Access has a rudimentary data dictionary capability that displays informa-tion about the name, description, size, type, format, and other properties of each fi eld in a table (see Figure 6-6). Data dictionaries for large corporate databases may capture addi-tional information, such as usage; ownership (who in the organization is responsible for maintaining the data); authorization; security; and the individuals, business functions, programs, and reports that use each data element.
Q uerying and Reporting DBMS include tools for accessing and manipulating informa-tion in databases. Most DBMS have a specialized language called a data manipulation language that is used to add, change, delete, and retrieve the data in the database.
T his language contains commands that permit end users and programming specialists to extract data from the database to satisfy information requests and develop applications. The most prominent data manipulation language today is Structured Query Language , or SQL . Figure 6-7 illustrates the SQL query that would produce the new table in Figure 6-5. You can fi nd out more about how to perform SQL queries in our Learning Tracks for this chapter.
U sers of DBMS for large and midrange computers, such as DB2, Oracle, or SQL Server, would use SQL to retrieve information they need from a database. Microsoft Access also uses SQL, but it provides its own set of user-friendly tools for querying databases (known as Query by Example or QBE) and for organizing data from databases into more polished reports.
F IGURE 6-6 Microsoft Access data dictionary features.
M icrosoft Access has a rudimentary data dictionary capability that displays information about the size, format, and other characteristics of each fi eld in a database. Displayed here is the information maintained in the SUPPLIER table. The small key icon to the left of Supplier_Number indicates that it is a key fi eld.
F IGURE 6-7 An SQL query.
I llustrated here are the SQL statements for a query to select suppliers for parts 137 or 150. They produce a list with the same results as Figure 6-5.
Data dictionary
Data manipulation language
Structured Query Language (SQL)
06_ch06_laud.indd 18506_ch06_laud.indd 185 28/11/11 6:13 PM28/11/11 6:13 PM
Copyri
ght ©
2013
Pea
rson C
anad
a Inc
. All r
ights
reserv
ed

186 Part II Information Technology Infrastructure
I n Microsoft Access, you will fi nd features that enable users to create queries by iden-tifying the tables and fi elds they want and the results, and then selecting the rows from the database that meet particular criteria. These actions in turn are translated into SQL commands. Figure 6-8 illustrates how the same query as the SQL query to select parts and suppliers would be constructed using the Microsoft query-building tools.
M icrosoft Access and other DBMS include capabilities for report generation, so that the data of interest can be displayed in a more structured and polished format than would be possible just by querying. Crystal Reports, a popular report generator for large cor-porate DBMS, can be used with Access. Access also has capabilities for developing desk-top system applications. These include tools for creating data entry screens, reports, and developing the logic for processing transactions.
D esigning Databases
T o create a database, you must understand the relationships among the data, the type of data that will be maintained in the database, how the data will be used, and how the organi-zation will need to change to manage data from a company-wide perspective. The database requires both a conceptual design and a physical design. The conceptual, or logical, design of a database is an abstract model of the database from a business perspective; the physical design shows how the database is actually arranged on direct-access storage devices.
N ormalization and Entity-Relationship Diagrams The conceptual database design describes how the data elements in the database are to be grouped. The design process identifi es relationships among data elements and the most effi cient way of grouping data elements to meet business information requirements. The process also identifi es redundant data elements and the groupings of data elements required for specifi c application programs. Groups of data are organized, refi ned, and streamlined until an overall logical view of the relationships among all the data in the database emerges.
T o use a relational database model effectively, complex groupings of data must be stream-lined to minimize redundant data elements and awkward many-to-many relationships. The
F IGURE 6-8 A Microsoft Access query.
I llustrated here is how the query in Figure 6-7 would be constructed using Microsoft Access query-building tools. It shows the tables, fi elds, and selection criteria used for the query.
06_ch06_laud.indd 18606_ch06_laud.indd 186 28/11/11 6:13 PM28/11/11 6:13 PM
Copyri
ght ©
2013
Pea
rson C
anad
a Inc
. All r
ights
reserv
ed

Chapter 6 Databases and Information Management 187
process of creating small, stable, yet fl exible and adaptive data structures from complex groups of data is called normalization . Figures 6-9 and 6-10 illustrate this process.
I n the particular business modelled here, an order can have more than one part, but each part is provided by only one supplier. If we build a relation called ORDER with all the fi elds included here, we would have to repeat the name and address of the supplier for every part on the order, even though the order is for parts from a single supplier. This relationship contains repeating data groups , so called because there c an be many parts on a single order to a given supplier. A more effi cient way to arrange the data is to break down ORDER into smaller relations, each of which describes a single entity. If we go step by step and normalize the relation ORDER, we emerge with the relations illustrated in Figure 6-10. You can fi nd out more about normalization, entity-relationship diagram-ming, and database design in the Learning Tracks for this chapter.
R elational database systems try to enforce referential integrity rules to ensure that relationships between coupled tables remain consistent. When one table has a foreign key that points to another table, you may not add a record to the table with the foreign key unless there is a corresponding record in the linked table. In the database we exam-ined earlier in this chapter, the foreign key Supplier_Number links the PART table to the S UPPLIER table. We may not add a new record to the PART table for a part with Supplier_Number 8266 unless there is a corresponding record in the SUPPLIER table for Supplier_Number 8266. We must also delete the corresponding record in the PART table if we delete the record in the SUPPLIER table for Supplier_Number 8266. In other words, we should not have parts from nonexistent suppliers!
D atabase designers document their data model with an entity-relationship diagram , illustrated in Figure 6-11. This diagram illustrates the relationships among the entities SUPPLIER, PART, LINE_ITEM, and ORDER. The boxes represent entities. The lines connecting the boxes represent relationships. A line connecting two entities that ends in
F IGURE 6-9 An unnormalized relation for ORDER.
A n unnormalized relation contains repeating groups. For example, there can be many parts and suppliers for each order. There is only a one-to-one correspondence between Order_Number and Order_Date.
F IGURE 6-10 Normalized tables created from ORDER.
A fter normalization, the original relation ORDER has been broken down into four smaller relations. The relation ORDER is left with only two attributes and the relation LINE_ITEM has a combined, or concatenated, key consisting of Order_Number and Part_Number.
Normalization
Repeating data groups
Referential integrity
Entity-relationship diagram
06_ch06_laud.indd 18706_ch06_laud.indd 187 28/11/11 6:13 PM28/11/11 6:13 PM
Copyri
ght ©
2013
Pea
rson C
anad
a Inc
. All r
ights
reserv
ed

188 Part II Information Technology Infrastructure
two short marks designates a one-to-one relationship. A line connecting two entities that ends w ith a crow’s foot topped by a short mark indicates a one-to-many relationship. Figure 6-11 shows that one ORDER can contain many LINE_ITEMs. (A PART can be ordered many times and appear many times as a line item in a single order.) Each PART can have only one SUPPLIER, but many PARTs can be provided by the same SUPPLIER.
I t cannot be emphasized enough: if the business does not get its data model right, the system will not be able to serve the business well. The company’s systems will not be as effective as they could be because they will have to work with data that may be inaccurate, incomplete, or diffi cult to retrieve. Understanding the organization’s data and how they should be represented in a database is perhaps the most important lesson you can learn from this course.
F or example, Famous Footwear, a shoe store chain with more than 1100 locations in the 50 states and 300 stores in Canada under the Naturalizer, F.X. La Salle, Franco Sarto, and Brown Shoe Closet names, could not achieve its goal of having “the right style of shoe in the right store for sale at the right price” because its database was not properly designed for rapidly adjusting store inventory. The company had an Oracle relational d atabase running on an IBM AS/ 400 midrange computer, but the database was designed primarily for pro-ducing standard reports for management rather than for reacting to marketplace changes. Management could not obtain precise data on specifi c items in inventory in each of its stores. The company had to work around this problem by building a new database in which the sales and inventory data could be better organized for analysis and inventory management.
6 .3 Using Databases to Improve Business Performance and Decision Making
B usinesses use their databases to keep track of basic transactions, such as paying suppliers, processing orders, keeping track of customers, and paying employees. But they also need databases to provide information that will help the company run the business more effi ciently and help managers and employees make better decisions. If a company wants to know which product is the most popular or who its most profi table customer is, the answer lies in the data. See Chapter 11 for more on how businesses can manage their knowledge bases.
F or example, Canada Post saved millions of dollars last year alone through its use of the software, according to Brian Shea, the organization’s general manager, business ana-lytics and revenue management. While using analytics to hone its pricing, Canada Post also extracted value in other areas, such as marketing automation and health and safety, said Shea. This allowed the team to predict who was likely to have an accident in the workplace, and how long injured workers would be off the job.
I n a large company, with large databases or large systems for separate functions, such as manufacturing, sales, and accounting, special capabilities and tools are required for analyzing vast quantities of data and for accessing data from multiple systems. These capabilities include data warehousing, data mining, and tools for accessing internal data-bases through the Web.
F IGURE 6-11 An entity-relationship diagram.
T his diagram shows the relationships among the entities SUPPLIER, PART, LINE_ITEM, and ORDER that might be used to model the database in Figure 6-11.
06_ch06_laud.indd 18806_ch06_laud.indd 188 28/11/11 6:13 PM28/11/11 6:13 PM
Copyri
ght ©
2013
Pea
rson C
anad
a Inc
. All r
ights
reserv
ed

Chapter 6 Databases and Information Management 189
D ata Warehouses
S uppose you want concise, reliable information about current operations, trends, and changes across the company. If you worked in a large company, obtaining this might be diffi cult, because data are often maintained in separate systems, such as sales, manufac-turing, or accounting. Some of the data you need might be found in the sales system and other pieces in the manufacturing system. Many of these systems are older legacy systems that use outdated data management technologies or fi le systems in which information is diffi cult to access.
Y ou might spend an inordinate amount of time locating and gathering the data you need, or be forced to make your decision on the basis of incomplete knowledge. If you want information about trends, you might also have trouble fi nding data about past events because most fi rms only make their current data immediately available. Data ware-housing addresses these problems.
W hat Is a Data Warehouse? A data warehouse is a database that stores current and his-torical data of potential interest to decision makers throughout the company. The data originate in many core operational transaction systems, such as systems for sales, cus-tomer accounts, and manufacturing, and may include data from Web site transactions. The data warehouse consolidates and standardizes information from different opera-tional databases so that the information can be used across the enterprise for manage-ment analysis and decision making.
F igure 6-12 illustrates how a data warehouse works. The data warehouse makes the data available for anyone to access as needed, but it cannot be altered. A data warehouse system also provides a range of ad hoc and standardized query tools, analytical tools, and graphical reporting facilities. Many fi rms use intranet portals to make the data warehouse information widely available throughout the fi rm.
P etro-Canada established its data warehouse just a few years ago. Store associates, who manage the stores independently and own their store’s inventory, are most interested in their cash fl ow, which means they must closely manage inventory levels; understand the impact of promotions and price changes; and manage operating expenses, receivables, and payables. Today, they are also able to compare performance to prior months, quar-ters, and years, analyze trends, and make course corrections. The data warehouse also simplifi ed access to information for multi-unit operators. These associates can now com-pare performance across all stores for which they are responsible.
F IGURE 6-12 Components of a data warehouse.
T he data warehouse extracts current and historical data from multiple operational systems inside the organization. These data are combined with data from external sources and reorganized into a central database designed for management reporting and analysis. The information directory provides users with information about the data available in the warehouse.
Data warehouse
06_ch06_laud.indd 18906_ch06_laud.indd 189 28/11/11 6:13 PM28/11/11 6:13 PM
Copyri
ght ©
2013
Pea
rson C
anad
a Inc
. All r
ights
reserv
ed

190 Part II Information Technology Infrastructure
H SBC Bank Canada is the largest foreign-owned bank and the seventh-largest bank in Canada. When HSBC Bank Canada implemented its data warehouse, it had to clean and consolidate its data. The bank then developed applications to access the data in the ware-house, primarily for customer relationship management and cross-selling to current cus-tomers. Reports that used t o take weeks to prepare are now fi nished in minutes. Analysis can be done across an entire household, not just at the individual customer level. The bank also gave its branch marketing personnel access to appropriate portions of the data warehouse, enabling the branch personnel to more effectively support their customers.
D ata Marts Although companies often build a central data warehouse that serves the entire organization, they might decide to create smaller, decentralized warehouses. Each of these data marts is a subset of the data warehouse in which a summarized or highly focused portion of the organization’s data is put in a separate database for a s pecifi c pop-ulation of users. For example, a company might develop marketing and sales data marts to deal with customer information. A data mart, focused as it is on a single subject area or line of business, can usually be constructed more rapidly and at lower cost than a central data warehouse.
T ools for Business Intelligence: Multidimensional Data Analysis and Data Mining
O nce data have been captured and organized in data warehouses and data marts, they are available for further analysis using tools for business intelligence, which we introduced briefl y in Chapter 2. Business intelligence tools enable users to analyze data to see new patterns, relationships, and insights that are useful for guiding decision making.
P rincipal tools for business intelligence include software for database querying and reporting, tools for multidimensional data analysis (online analytical processing), and tools for data mining. This section will introduce you to these tools, with more detail about business intelligence analytics and applications in the Chapter 12 discussion of decision making.
O nline Analytical Processing (OLAP) Suppose your company sells four different products—nuts, bolts, washers, and screws—in the East, West, and Prairies regions. If you wanted to ask a fairly straightforward question, such as how many washers were sold during the past quarter, you could easily fi nd the answer by querying your sales database. But what if you wanted to know how many washers sold in each of your sales regions and compare actual results with projected sales?
T o obtain the answer, you would use online analytical processing (OLAP) . OLAP supports multidimensional data analysis, enabling users to view the same data in differ-ent ways using multiple dimensions. Each aspect of information—product, pricing, cost, region, or time period—represents a different dimension. So a product manager could use a multidimensional data analysis tool to learn how many washers were s old in the East in June, how that compares with the previous month and the previous June, and how it compares with the sales forecast. OLAP enables users to obtain online answers to ad hoc questions such as these fairly rapidly, even when the data are stored in very large databases, such as sales fi gures for multiple years.
F igure 6-13 shows a multidimensional model that might be created to represent prod-ucts, regions, actual sales, and projected sales. A matrix of actual sales can be stacked on top of a matrix of projected sales to form a cube with six faces. If you rotate the cube 90 degrees one way, the face showing will be product versus actual and projected sales. If you rotate the cube 9 0 degrees again, you will see region versus actual and projected sales. If you rotate 180 degrees from the original view, you will see projected sales and prod-uct versus region. Cubes can be nested within cubes to build complex views of data. A company would use either a specialized multidimensional database or a tool that creates multidimensional views of data in relational databases.
Data mart
Online analytical processing (OLAP)
06_ch06_laud.indd 19006_ch06_laud.indd 190 28/11/11 6:14 PM28/11/11 6:14 PM
Copyri
ght ©
2013
Pea
rson C
anad
a Inc
. All r
ights
reserv
ed

Chapter 6 Databases and Information Management 191
D ata Mining Traditional database queries answer such questions as, “How many units of product number 403 were shipped in February 2010?” OLAP, or multidimensional analysis, supports much more complex requests for information, such as “Compare sales of product 403 relative to plan by quarter and sales region for the past two years.” With OLAP and query-oriented data analysis, users need to have a good idea about the infor-mation for which they are looking.
D ata mining is more discovery-driven. Data mining provides insights into corporate data that cannot be obtained with OLAP by fi nding hidden patterns and relationships in large databases and inferring rules from them to predict future behaviour. The patterns and rules are used to guide decision making and forecast the effect of those decisions. The types of information obtainable from data mining include associations, sequences, clas-sifi cations, clusters, and forecasts.
• Associations are occurrences linked to a single event. For instance, a study of supermar-ket purchasing patterns might reveal that when corn chips are purchased, a cola drink is purchased 65 percent of the time, but when there is a promotion, cola is purchased 85 percent of the time. This information helps managers make better decisions because they have learned the profi tability of a promotion.
• In sequences, events are linked over time. We might fi nd, for example, that if a house is purchased, a new refrigerator will be purchased within two weeks 65 percent of the time, and an oven will be bought within one month of the home purchase 45 percent of the time.
• Classifi cation recognizes patterns that describe the group to which an item belongs by examining existing items that have been classifi ed and by inferring a set of rules. For example, businesses such as credit card or telephone companies worry about the loss of steady customers. Classifi cation helps discover the characteristics of customers who are likely to leave and can provide a model to help managers predict who those customers are so that the managers can devise special campaigns to retain such customers.
• Clustering works in a manner similar to classifi cation when no groups have yet been defi ned. A data mining tool can discover different groupings within data, such as fi nd-ing affi nity groups for bank cards or partitioning a database into groups of customers based on demographics and types of personal investments.
• Although these applications involve predictions, forecasting uses predictions in a dif-ferent way. It uses a series of existing values to forecast what other values will be. For example, forecasting might fi nd patterns in data to help managers estimate the future value of continuous variables, such as sales fi gures.
Projected
Actual
Nuts
BoltsPRODUCT
Washers
Screws
East
WestPrairies
REGION
F IGURE 6-13 Multidimensional data model.
T he view that is showing is product versus region. If you rotate the cube 90 degrees, the face will show product versus actual and projected sales. If you rotate the cube 90 degrees again, you will see region versus actual and projected sales. Other views are possible.
Data mining
06_ch06_laud.indd 19106_ch06_laud.indd 191 28/11/11 6:14 PM28/11/11 6:14 PM
Copyri
ght ©
2013
Pea
rson C
anad
a Inc
. All r
ights
reserv
ed
192 Part II Information Technology Infrastructure
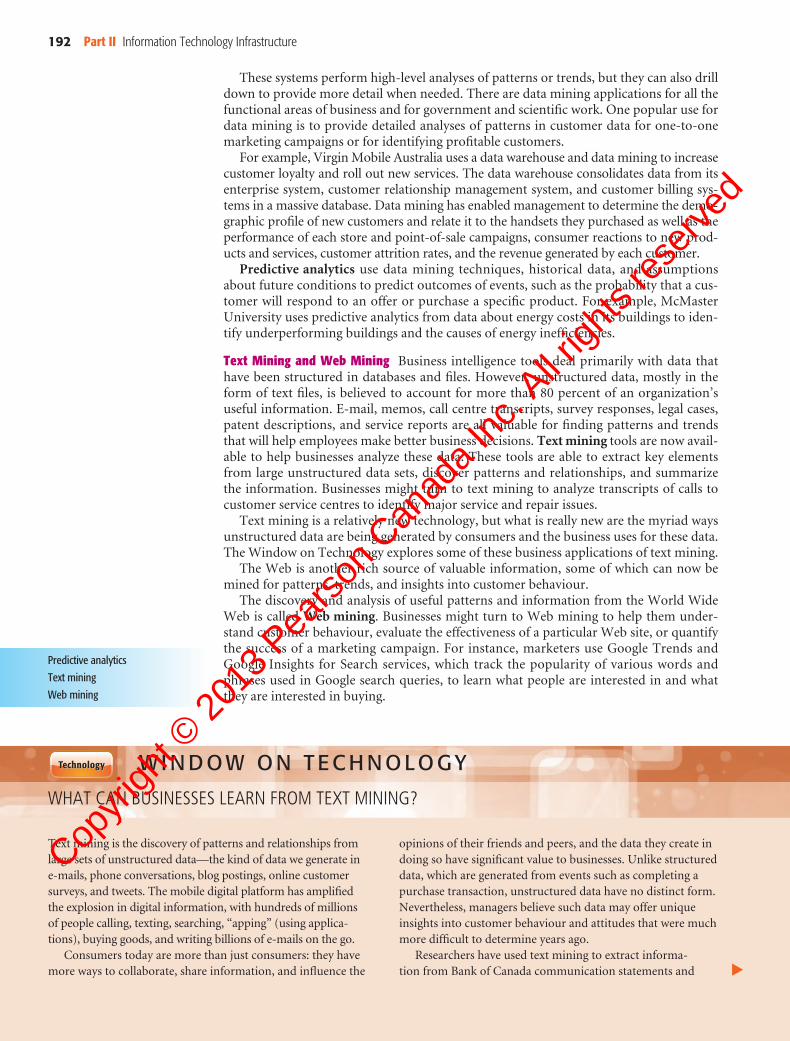
T hese systems perform high-level analyses of patterns or trends, but they can also drill down to provide more detail when needed. There are data mining applications for all the functional areas of business and for government and scientifi c work. One popular use for data mining is to provide detailed analyses of patterns in customer data for one-to-one marketing campaigns or for identifying profi table customers.
F or example, Virgin Mobile Australia uses a data warehouse and data mining to increase customer loyalty and roll out new services. The data warehouse consolidates data from its enterprise system, customer relationship management system, and customer billing sys-tems in a massive database. Data mining has enabled management to determine the demo-graphic profi le of new customers and relate it to the handsets they purchased as well as the performance of each store and point-of-sale campaigns, consumer reactions to new prod-ucts and services, customer attrition rates, and the revenue generated by each customer.
P redictive analytics use data mining techniques, historical data, and assumptions about future conditions to predict outcomes of events, such as the probability that a cus-tomer will respond to an offer or purchase a specifi c product. For example, McMaster University uses predictive analytics from data about energy costs in its buildings to iden-tify underperforming buildings and the causes of energy ineffi ciencies.
T ext Mining and Web Mining Business intelligence tools deal primarily with data that have been structured in databases and fi les. However, unstructured data, mostly in the form of text fi les, is believed to account for more than 80 percent of an organization’s useful information. E-mail, memos, call centre transcripts, survey responses, legal cases, patent descriptions, and service reports are all valuable for fi nding patterns and trends t hat will help employees make better business decisions. Text mining tools are now avail-able to help businesses analyze these data. These tools are able to extract key elements from large unstructured data sets, discover patterns and relationships, and summarize the information. Businesses might turn to text mining to analyze transcripts of calls to customer service centres to identify major service and repair issues.
T ext mining is a relatively new technology, but what is really new are the myriad ways unstructured data are being generated by consumers and the business uses for these data. The Window on Technology explores some of these business applications of text mining.
T he Web is another rich source of valuable information, some of which can now be mined for patterns, trends, and insights into customer behaviour.
T he discovery and analysis of useful patterns and information from the World Wide Web is called Web mining . Businesses might turn to Web mining to help them under-stand customer behaviour, evaluate the effectiveness of a particular Web site, or quantify the success of a marketing campaign. For instance, marketers use Google Trends and Google Insights for Search services, which track the popularity of various words and phrases used in Google search queries, to learn what people are interested in and what they are interested in buying.
T ext mining is the discovery of patterns and relationships from large sets of unstructured data—the kind of data we generate in e-mails, phone conversations, blog postings, online customer surveys, and tweets. The mobile digital platform has amplifi ed the explosion in digital information, with hundreds of millions of people calling, texting, searching, “apping” (using applica-tions), buying goods, and writing billions of e-mails on the go.
C onsumers today are more than just consumers: they have more ways to collaborate, share information, and infl uence the
W HAT CAN BUSINESSES LEARN FROM TEXT MINING?
opinions of their friends and peers, and the data they create in doing so have signifi cant value to businesses. Unlike structured data, which are generated from events such as completing a purchase transaction, unstructured data have no distinct form. Nevertheless, managers believe such data may offer unique insights into customer behaviour and attitudes that were much more diffi cult to determine years ago.
R esearchers have used text mining to extract informa-tion from Bank of Canada communication statements and
W I N D O W O N T E C H N O L O G Y
�
Predictive analytics
Text mining
Web mining
06_ch06_laud.indd 19206_ch06_laud.indd 192 28/11/11 6:14 PM28/11/11 6:14 PM
Copyri
ght ©
2013
Pea
rson C
anad
a Inc
. All r
ights
reserv
ed

Chapter 6 Databases and Information Management 193
W eb mining looks for patterns in data through content mining, structure mining, and usage mining. Web content mining is the process of extracting knowledge from the content of Web pages, which may include text, image, audio, and video data. Web structure min-ing extracts useful information from the links embedded in Web documents. For example, links pointing to a document indicate the popularity of the document, while links com-ing out of a document indicate the richness or perhaps the v ariety of topics covered in the document. Web usage mining examines user interaction data recorded by a Web server whenever requests for a Web site’s resources are received. The usage data records a user’s behaviour when that user browses or makes transactions on the Web site and collects the data in a server log. Analyzing these data can help companies determine the value of partic-ular customers, cross-marketing strategies, and the effectiveness of promotional campaigns.
investigate what type of information affected returns and vola-tility in short-term as well as long-term interest rate markets over the 2002–2008 period. Discussions about geopolitical risk and other external shocks, major domestic shocks (e.g., the SARS epidemic and BSE, also known as mad-cow disease, which affected Alberta cattle in 2003), the balance of risks to the economic projection, and various forward looking s tate-ments were found to signifi cantly affect market returns and volatility, especially for short-term markets. Hotel chains such as Gaylord Hotels and Choice Hotels are using text mining software to glean insights from thousands of customer satisfac-tion surveys provided by their guests. Gaylord Hotels is using a text analytics solution as a cloud-based software service to gather and analyze customer feedback from surveys, e-mail, chat messaging, staffed call centres, and online forums associ-ated with guests’ and meeting planners’ e xperiences at the company’s convention resorts. The software from analytics software vendor Clarabridge sorts through the hotel chain’s customer surveys and gathers positive and negative comments, organizing them into a variety of categories to reveal less obvi-ous insights. For example, guests complained about many things more frequently than noisy rooms, but complaints of noisy rooms were most frequently correlated with surveys indi-cating an unwillingness to return to the hotel for another stay.
A nalyzing customer surveys used to take weeks, but now takes only days, thanks to the Clarabridge software. Location managers and corporate executives have also used fi ndings from text mining to infl uence decisions on building improvements.
W endy’s International adopted Clarabridge software to analyze nearly 500 000 messages it collects each year from its Web-based feedback forum, call centre notes, e-mail messages, receipt-based surveys, and social media. The chain’s customer satisfaction team had previously used spreadsheets and keyword searches to review customer comments, a very slow, manual approach. Wendy’s management was looking for a better tool to speed analysis, detect emerging issues, and pinpoint troubled areas of the business at the store, regional, or corporate level.
T he Clarabridge technology enables Wendy’s to track customer experiences down to the store level within minutes. This timely information helps store, regional, and corporate managers spot and address problems related to meal quality, cleanliness, and speed of service.
T ext analytics software caught on fi rst with government agencies and larger companies with information systems departments that had the means to properly use the compli-cated software, but Clarabridge is now offering a version of its product for small businesses. The technology has already caught on with law enforcement, search tool interfaces, and “listening platforms” such as Nielsen Online. Listening plat-forms are text mining tools that focus on brand management, allowing companies to determine how consumers feel about their brand and take steps to respond to negative sentiment.
S tructured data analysis will not be rendered obsolete by text analytics, but companies that are able to use both methods to develop a clearer picture of their customers’ attitudes will have an easier time establishing and building their brand and gleaning insights that will enhance profi tability.
S ources: Doug Henschen, “Wendy’s Taps Text Analytics to Mine Customer Feedback,” Information Week, March 23, 2010; David Stodder, “How Text Analytics Drive Customer Insight,” Information Week, February 1, 2010; Nancy David Kho, “Customer Experience and Sentiment Analysis,” KMWorld, February 1, 2010; Siobhan Gorman, “Details of Einstein Cyber-Shield Disclosed by White House,” The Wall Street Journal, March 2, 2010; www.attensity. com, accessed June 16, 2010; and www.clarabridge. com, accessed J une 17, 2010.
C ase Study Questions
1 . What challenges does the increase in unstructured data present for businesses?
2 . How does text mining improve decision making? What are the challenges involved in text mining?
3 . What kinds of companies are most likely to benefi t from text mining software? Explain your answer.
4 . How might text mining lead to the erosion of personal information privacy? (See Chapter 4.) Explain.
W hat Do You Think?
V isit a Web site such as Chapters.Indigo.ca or TripAdvisor.com detailing products or services that have customer reviews. Pick a product, hotel, or other service with at least 15 customer reviews and read those reviews, both positive and negative. How could Web content mining help the offering company improve or better market this product or service? What pieces of information should highlighted?
06_ch06_laud.indd 19306_ch06_laud.indd 193 28/11/11 6:14 PM28/11/11 6:14 PM
Copyri
ght ©
2013
Pea
rson C
anad
a Inc
. All r
ights
reserv
ed

194 Part II Information Technology Infrastructure
F IGURE 6-14 Linking internal databases to the Web.
U sers access an organization’s internal database through the Web using their desktop PCs and Web browser software.
D atabases and the Web
H ave you ever tried to use the Web to place an order or view a product catalogue? If so, you were probably using a Web site linked to an internal corporate database. Many companies now use the Web to make some of the information in their internal databases available to customers and business partners.
S uppose, for example, a customer with a Web browser wants to search an online retail-er’s database for pricing information. Figure 6-14 illustrates how that customer might access the retailer’s internal database over the Web. The user accesses the retailer’s Web site over the Internet using Web browser software on his or her client PC. The user’s Web browser software requests data from the organization’s database, using HTML com-mands to communicate with the Web server.
B ecause many back-end databases cannot interpret commands written in HTML, the Web server passes these requests for data to software that translates HTML commands into SQL so that they can be processed by the DBMS working with the database. In a client/ server environment, the DBMS resides on a dedicated computer called a database server . The DBMS receives the SQL requests and provides the required data. The mid-dleware transfers information from the organization’s internal database back to the Web server for delivery in the form of a Web page to the user.
F igure 6-14 shows that the middleware working between the Web server and the DBMS is an application server running on its own dedicated computer (see Chapter 5). The appli-cation server software handles all application operations, including transaction processing and data access, between browser-based computers and a company’s back-end business applications or databases. The application server takes requests from the W eb server, runs the business logic to process transactions based on those requests, and provides connec-tivity to the organization’s back-end systems or databases. Alternatively, the software for handling these operations might be a custom program or a CGI script, a compact program using the common gateway interface specifi cation for processing data on a Web server.
T here are a number of advantages to using the Web to access an organization’s inter-nal databases. First, Web browser software is much easier to use than proprietary query tools. Second, the Web interface requires few or no changes to the internal database. It costs much less to add a Web interface in front of a legacy system than to redesign and rebuild the system to improve user access.
A ccessing corporate databases through the Web is creating new effi ciencies, opportu-nities, and business models. ThomasNet.com provides an up-to-date online directory of more than 600 000 suppliers of industrial products, such as chemicals, metals, plastics, rubber, and automotive equipment. The company, formerly known as Thomas Register, used to send out huge paper catalogues with this information. Now it provides this infor-mation to users online via its Web site and has become a smaller, leaner company.
O ther companies have created entirely new businesses based on access to large data-bases through the Web. One is the social networking site Facebook, which helps users stay connected with each other or meet new people. Facebook features music, comedy, videos, and “profi les” with information supplied by more than 500 million users about their age, hometown, dating preferences, marital status, and interests. It maintains a massive data-base to house and manage all of this content. Facebook uses a similar database.
Database server
06_ch06_laud.indd 19406_ch06_laud.indd 194 28/11/11 6:14 PM28/11/11 6:14 PM
Copyri
ght ©
2013
Pea
rson C
anad
a Inc
. All r
ights
reserv
ed
Chapter 6 Databases and Information Management 195
S imilar social networking sites include LinkedIn for professional networking, Twitter for quick and short status updates (with links to longer updates), Flickr for posting pho-tographs, and YouTube for posting videos. All these sites can make use of the data gener-ated for commercial purposes, such as online advertising.
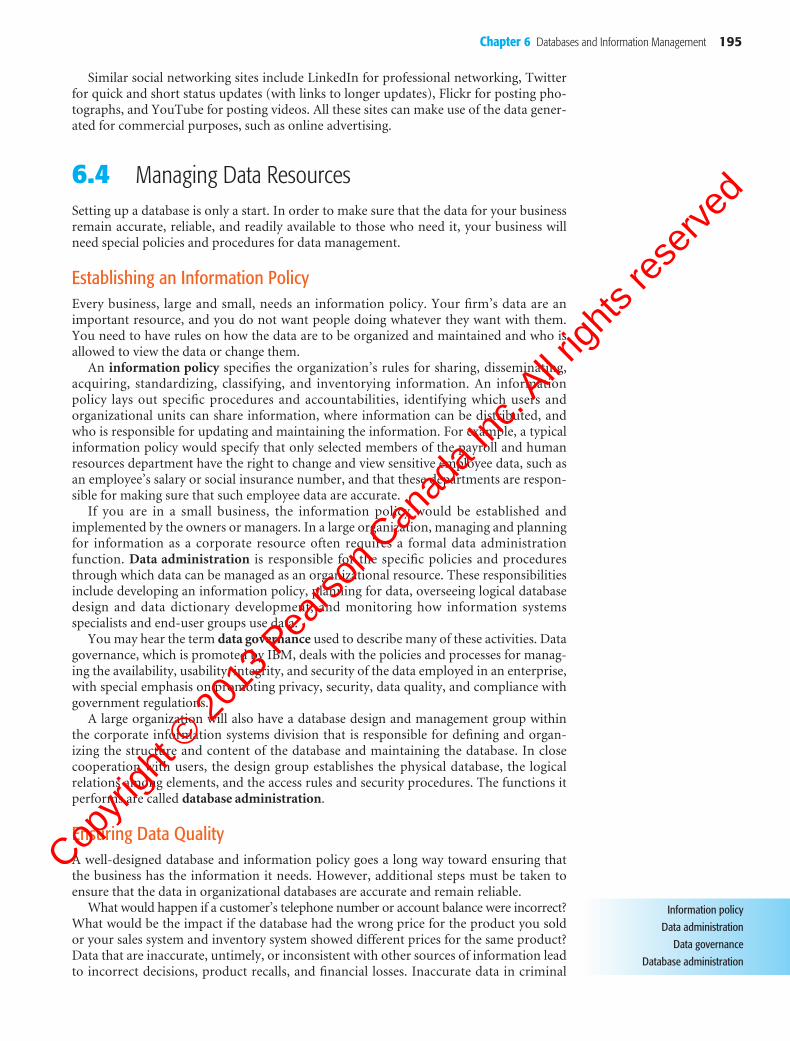
6 .4 Managing Data Resources
S etting up a database is only a start. In order to make sure that the data for your business remain accurate, reliable, and readily available to those who need it, your business will need special policies and procedures for data management.
E stablishing an Information Policy
E very business, large and small, needs an information policy. Your fi rm’s data are an important resource, and you do not want people doing whatever they want with them. You need to have rules on how the data are to be organized and maintained and who is allowed to view the data or change them.
A n information policy specifi es the organization’s rules for sharing, disseminating, acquiring, standardizing, classifying, and inventorying information. An information policy lays out specifi c procedures and accountabilities, identifying which users and organizational units can share information, where information can be distributed, and who is responsible for updating and maintaining the information. For example, a typical i nformation policy would specify that only selected members of the payroll and human resources department have the right to change and view sensitive employee data, such as an employee’s salary or social insurance number, and that these departments are respon-sible for making sure that such employee data are accurate.
I f you are in a small business, the information policy would be established and implemented by the owners or managers. In a large organization, managing and planning for information as a corporate resource often requires a formal data administration function. Data administration is responsible for the specifi c policies and procedures through which data can be managed as an organizational resource. These responsibilities include developing an information policy, planning for data, overseeing logical database design and data dictionary development, and monitoring how information systems specialists and end-user groups use data.
Y ou may hear the term data governance used to describe many of these activities. Data governance, which is promoted by IBM, deals with the policies and processes for manag-ing the availability, usability, integrity, and security of the data employed in an enterprise, with special emphasis on promoting privacy, security, data quality, and compliance with government regulations.
A large organization will also have a database design and management group within the corporate information systems division that is responsible for defi ning and organ-izing the structure and content of the database and maintaining the database. In close cooperation with users, the design group establishes the physical database, the logical relations among elements, and the access rules and security procedures. The functions it performs are called database administration .
E nsuring Data Quality
A well-designed database and information policy goes a long way toward ensuring that the business has the information it needs. However, additional steps must be taken to ensure that the data in organizational databases are accurate and remain reliable.
W hat would happen if a customer’s telephone number or account balance were incorrect? What would be the impact if the database had the wrong price for the product you sold or your sales system and inventory system showed different prices for the same product? Data that are inaccurate, untimely, or inconsistent with other sources of information lead to incorrect decisions, product recalls, and fi nancial losses. Inaccurate data in criminal
Information policy
Data administration
Data governance
Database administration
06_ch06_laud.indd 19506_ch06_laud.indd 195 28/11/11 6:14 PM28/11/11 6:14 PM
Copyri
ght ©
2013
Pea
rson C
anad
a Inc
. All r
ights
reserv
ed

196 Part II Information Technology Infrastructure
justice and national security databases might even subject you to unnecessary surveillance or detention, as described in the chapter-ending case study.
A ccording to Forrester Research, 20 percent of U.S. mail and commercial package deliveries were returned because of incorrect names or addresses. Gartner Inc. reported that more than 25 percent of the critical data in large Fortune 1000 companies’ data-bases is inaccurate or incomplete, including bad product codes and product descriptions, faulty inventory descriptions, erroneous fi nancial data, incorrect supplier information, and incorrect employee data (Gartner, 2007).
T hink of all the times you have received several pieces of the same direct mail advertis-ing on the same day. This is very likely the result of having your name maintained mul-tiple times in a database. Your name may have been misspelled, or you used your middle initial on one occasion and not on another, or the information was initially entered onto a paper form and not scanned properly into the system. Because of these inconsistencies, the database would treat you as different people! Your Canadian author often receives redundant mail addressed to Brabston, Bradston, or Brabstone.
I f a database is properly designed and enterprise-wide data standards established, duplicate or inconsistent data elements should be minimal. Most data quality problems, however, such as misspelled names, transposed numbers, or incorrect or missing codes, stem from errors during data input. The incidence of such errors is rising as companies move their businesses to the Web and allow customers and suppliers to enter data into their Web sites that directly update internal systems.
B efore a new database is in place, organizations need to identify and correct their faulty data and establish better routines for editing data once their database is in opera-tion. Analysis of data quality often begins with a data quality audit , which is a structured survey of the accuracy and level of completeness of the data in an information system. Data quality audits can be performed by surveying entire data fi les, surveying samples from data fi les, or surveying end users for their perceptions of data quality.
D ata cleansing , also known as data scrubbing, consists of activities for detecting and correcting data in a database that are incorrect, incomplete, improperly formatted, or redundant. Data cleansing not only corrects errors but also enforces consistency among different sets of data that originated in separate information systems. Specialized data-cleansing software is available to automatically survey data fi les, correct errors in the data, and integrate the data in a consistent company-wide format.
D ata quality problems are not just business problems. They also pose serious prob-lems for individuals, affecting their fi nancial condition and even their jobs. The Window on Organizations describes some of these impacts as it details the data quality problems found in the companies that collect and report consumer credit data. As you read this case, look for the management, organization, and technology factors behind this problem and whether existing solutions are adequate.
Y ou have found the car of your dreams. You have a good job and enough money for a down payment. All you need is an auto loan for $14 000. You have a few credit card bills, which you diligently pay off each month. But when you apply for the loan you are turned down. When you ask why, you are told you have an overdue loan from a bank you have never heard of. You have just become one of the millions of people who have been victimized by inaccurate or outdated data in credit bureaus’ information systems.
C REDIT BUREAU ERRORS—BIG PEOPLE PROBLEMS
M ost data on Canadian consumers’ credit histories are collected and maintained by two national credit reporting agencies: Equifax and TransUnion. (A third agency, Experian, ceased credit bureau functions in Canada in April 2010.) These two organizations collect data from various sources to create a detailed dossier of an individual’s borrowing and bill paying habits. This information helps lenders assess a person’s cred-itworthiness a nd the ability to pay back a loan and can affect the interest rate and other terms of a loan, including whether
W I N D O W O N O R G A N I Z A T I O N S
�
Data quality audit
Data cleansing
06_ch06_laud.indd 19606_ch06_laud.indd 196 28/11/11 6:14 PM28/11/11 6:14 PM
Copyri
ght ©
2013
Pea
rson C
anad
a Inc
. All r
ights
reserv
ed

Chapter 6 Databases and Information Management 197
a loan will be granted in the fi rst place. It can even affect the chances of fi nding or keeping a job: at least one-third of employers check credit reports when making hiring, fi ring, or promotion decisions.
C redit bureaus collect personal information and fi nancial data from a variety of sources, including creditors, lenders, utilities, debt collection agencies, and the courts. These data are aggregated and stored in massive databases maintained by the credit bureaus. The credit bureaus then sell this informa-tion to other companies to use for credit assessment.
T he credit bureaus claim they know which credit cards are in each consumer’s wallet, how much is due on the mortgage, and whether the electric bill is paid on time. But if the wrong information gets into their systems, whether through identity theft or errors transmitted by creditors, watch out! Untangling the mess can be almost impossible.
T he bureaus understand the importance of providing accurate information to both lenders and consumers. But they also recognize that their own systems are responsible for many credit-report errors. Some mistakes occur because of the pro-cedures for matching loans to individual credit reports.
T he sheer volume of information being transmitted from creditors to credit bureaus increases the likelihood of mistakes. Experian, which quit operating in Canada in 2010, for exam-ple, updates 30 million credit reports every day and roughly 2 billion credit reports every month. It matches the identifying personal information in a credit application or credit account with the i dentifying personal information in a consumer credit fi le. Identifying personal information includes items such as name (fi rst name, last name, and middle initial), full current address and postal code, full previous address and postal code, and social insurance number. The new credit information goes into the consumer credit fi le that it best matches.
T he credit bureaus rarely receive information that matches in all the fi elds in credit fi les, so they have to determine how much variation to allow and still call it a match. Imperfect data lead to imperfect matches. A consumer might provide incomplete or inaccurate information on a credit application. A creditor might submit incomplete or inaccurate information to the credit bureaus. If the wrong person matches better than anyone else, the data could unfortunately go into the wrong account.
P erhaps the consumer did not write clearly on the account application. Name variations on different credit accounts can also result in less-than-perfect matches. Take the name Edward Jeffrey Johnson. One account might say Edward Johnson. Another might say Ed Johnson. Another might say Edward J. Johnson. Suppose the last two digits of Edward’s social insur-ance number get transposed—more chance for mismatches.
I f the name or social insurance number on another person’s account partially matches the data in your fi le, the computer might attach that person’s data to your record. Your record might likewise be corrupted if workers in companies supplying tax and bankruptcy data from court and government records accidentally transpose a digit or misread a document.
T he credit bureaus claim it is impossible for them to moni-tor the accuracy of the 3.5 billion pieces of credit account
information they receive every month. They must continually contend with bogus claims from consumers who falsify lender information or use shady credit-repair companies that chal-lenge all the negative information on a credit report regard-less of its validity. To separate the good from the bad, the credit bureaus use an automated e-OSCAR (Electronic Online Solution for Complete and Accurate Reporting) system to for-ward consumer disputes to lenders for verifi cation.
I f your credit report showed an error, the bureaus usually do not contact the lender directly to correct the information. To save money, the bureaus send consumer protests and evi-dence to a data processing centre run by a third-party contrac-tor. The contractors rapidly summarize every complaint with a short comment and two-digit code from a menu of 26 options. For example, the code A3 designates “belongs to another indi-vidual with a similar name.” These summaries are often too brief to include the background banks need to understand a complaint.
A lthough this system fi xes large numbers of errors (data are updated or corrected for 72 percent of disputes), consum-ers have few options if the system fails. Consumers who fi le a second dispute without providing new information might have their dispute dismissed as “frivolous.” If the consumer tries to contact the lender that made the error on their own, banks have no obligation to investigate the dispute—unless it is sent by a credit bureau.
S ources: Dennis McCafferty, “Bad Credit Could Cost You a Job,” Baseline, June 7, 2010; Kristen McNamara, “Bad Credit Derails Job Seekers,” The Wall Street Journal, March 16, 2010; Anne Kadet and Lucy Lazarony, “Your Name Can Mess Up Your Credit Report,” Bankrate.com, accessed July 1, 2009; “Credit Report Fix a Headache,” Atlanta Journal-Constitution, June 14, 2009; and “Why Credit Bureaus Can’t Get It Right,” Smart Money , March 2009.
C ase Study Questions
1 . Assess the business impact of credit bureaus’ data quality problems for the credit bureaus, for lenders, and for individuals.
2 . Are any ethical issues raised by credit bureaus’ data quality problems? Explain your answer.
3 . Analyze the management, organization, and technology fac-tors responsible for credit bureaus’ data quality problems.
4 . What can be done to solve these problems?
W hat Do You Think?
G o to the Equifax Canada or TransUnion Canada Web site ( www.equifax. ca or www.transunion. ca) and explore the site, paying special attention to services for businesses and small businesses.
T hen answer the following questions:
1 . List and describe fi ve services for businesses, and explain how each uses consumer data. Describe the kinds of busi-nesses that would use these services.
2 . Explain how each of these services is affected by inaccurate consumer data.
06_ch06_laud.indd 19706_ch06_laud.indd 197 28/11/11 6:14 PM28/11/11 6:14 PM
Copyri
ght ©
2013
Pea
rson C
anad
a Inc
. All r
ights
reserv
ed

198 Part II Information Technology Infrastructure
6 .5 Hands-on MIS Projects
T he projects in this section give you hands-on experience in analyzing data quality problems, establishing company-wide data standards, creating a database for inven-tory management, and using the Web to search online databases for overseas business resources.
M anagement Decision Problems
1 . Emerson Process Management, a fi ctional global supplier of measurement, analytical, and monitoring instruments and services based in Fredericton, New Brunswick, had a new data warehouse designed for analyzing customer activity to improve service and marketing that was full of inaccurate and redundant data. The data in the warehouse came from numerous transaction processing systems in Europe, Asia, and other loca-tions around the world. The team that designed the warehouse had assumed t hat sales groups in all these areas would enter customer names and addresses the same way, regardless of their location. In fact, cultural differences combined with complications from absorbing companies that Emerson had acquired led to multiple ways of enter-ing quotes, billing, shipping, and other data. Assess the potential business impact of these data quality problems. What decisions have to be made and steps taken to reach a solution?
2 . Your industrial supply company wants to create a data warehouse in which manage-ment can obtain a single, corporate-wide view of critical sales information to iden-tify best-selling products in specifi c geographic areas, key customers, and sales trends. Your sales and product information are stored in two different systems: a divisional sales system running on a Unix server and a corporate sales system running on an IBM mainframe. You would like to create a single standard format that consolidates the data from both systems. The following format has been proposed.
P roduct_ P roduct _ID Description C ost_per_Unit Units_ Sold S ales_Region Division C ustomer_ID
The following are sample fi les from the two systems that would supply the data for the data warehouse:
C orporate Sales System
P roduct_ID Product_ Description U nit_Cost Units_Sold S ales_Territory Division
6 0231 Bearing, 4” 5 .28 900 245 E ast Parts
8 5773 SS assembly unit 1 2.45 992 111 W est Parts
M echanical Parts Division Sales System
P rod_No Product_ Description C ost_per_Unit Units_Sold S ales_Region Customer_ID
6 0231 4” Steel bearing 5 .28 900 245 E . Anderson
8 5773 SS assembly unit 1 2.45 992 111 W . Kelly Industries
06_ch06_laud.indd 19806_ch06_laud.indd 198 28/11/11 6:14 PM28/11/11 6:14 PM
Copyri
ght ©
2013
Pea
rson C
anad
a Inc
. All r
ights
reserv
ed

Chapter 6 Databases and Information Management 199
• What business problems are created by not having these data in a single standard format?
• How easy would it be to create a database with a single standard format that could store the data from both systems? Identify the problems that would have to be addressed.
• Should the problems be solved by database specialists or general business managers? Explain.
• Who should have the authority to fi nalize a single company-wide format for this infor-mation in the data warehouse?
A chieving Operational Excellence: Building a Relational Database for Inventory Management
S oftware skills: Database design, querying, and reporting
B usiness skills: Inventory management
B usinesses today depend on databases to provide reliable information about items in inventory, items that need restocking, and inventory costs. In this exercise, you will use database software to design a database for managing inventory for a small business.
F ictional Sylvester’s Bike Shop, located in Hamilton, Ontario, sells road, mountain, hybrid, leisure, and children’s bicycles. Currently, Sylvester’s purchases bikes from three suppliers but plans to add new suppliers in the near future. This rapidly growing business needs a database system to manage this information.
I nitially, the database should house information about suppliers and products. The database will contain two tables: a supplier table and a product table. The reorder level refers to the number of items in inventory that triggers a decision to order more items to prevent a stockout. (In other words, if the number of units of a particular item in inven-tory falls below the reorder level, the item should be reordered.) The user should be able to perform several queries and produce several managerial reports based on the data con-tained in the two tables.
U sing the information found in the tables in MyMISLab, build a simple relational data-base for Sylvester’s. Once you have built the database, perform the following activities:
• Prepare a report that identifi es the fi ve most expensive bicycles. The report should list the bicycles in descending order from most expensive to least expensive, the quantity on hand for each, and the markup percentage for each.
• Prepare a report that lists each supplier, its products, the quantities on hand, and asso-ciated reorder levels. The report should be sorted alphabetically by supplier. Within each supplier category, the products should be sorted alphabetically.
• Prepare a report listing only the bicycles that are low in stock and need to be reordered. The report should provide supplier information for the items identifi ed.
• Write a brief description of how the database could be enhanced to further improve management of the business. What tables or fi elds should be added? What additional reports would be useful?
I mproving Decision Making: Searching Online Databases for Overseas Business Resources
S oftware skills: Online databases
B usiness skills: Researching services for overseas operations
I nternet users have access to many thousands of Web-enabled databases with informa-tion on services and products in faraway locations. This project develops skills in search-ing these online databases.
06_ch06_laud.indd 19906_ch06_laud.indd 199 28/11/11 6:14 PM28/11/11 6:14 PM
Copyri
ght ©
2013
Pea
rson C
anad
a Inc
. All r
ights
reserv
ed

200 Part II Information Technology Infrastructure
Y our company is located in Calgary, Alberta, and manufactures offi ce furniture of various types. You have recently acquired several new customers in Australia, and a study you commissioned indicates that, with a presence there, you could greatly increase your sales. Moreover, your study indicates that you could do even better if you actually manu-factured many of your products locally (in Australia). First, you need to set up an offi ce in Melbourne to establish a presence, and then you need to begin importing from Canada. You then can plan to start producing locally.
Y ou will soon be travelling to the area to make plans to actually set up an offi ce, and you want to meet with organizations that can help you with your operation. You will need to engage people or organizations that offer many services necessary for you to open your offi ce, including lawyers, accountants, import–export experts, telecom-munications equipment and support, and even trainers who can help you to prepare your future employees to work for you. S tart by searching for advice from the Canada Department of Trade and Commerce on doing business in Australia. Then try the follow-ing online databases to locate companies that you would like to meet with during your coming trip: Australian Business Register (abr.business.gov.au), Australia Trade Now (australiatradenow.com), and the Nationwide Business Directory of Australia ( www.nationwide. com. au). If necessary, you might also try search engines such as Yahoo! and Google. Then perform the following activities:
• List the companies you would contact to interview on your trip to determine whether they can help you with these and any other functions you think vital to establishing your offi ce.
• Rate the databases you used for accuracy of name, completeness, ease of use, and gen-eral helpfulness.
• What does this exercise tell you about the design of databases?
L earning Track Modules
T he following Learning Tracks provide content relevant to topics covered in this chapter:
1 . Database Design, Normalization, and Entity-Relationship Diagramming
2 . Introduction to SQL
3 . Hierarchical and Network Data Models
1. What are the problems of managing data resources in a traditional fi le environment, and how are they solved by a database management system?
T raditional fi le management techniques make it diffi -cult for organizations to keep track of all of the pieces of data they use in a systematic way and to organize these data so that they can be easily accessed. Different functional areas and groups were allowed to develop their own fi les independently. Over time, this traditional fi le management environment creates problems such a s data redundancy and inconsistency, program–data dependence, infl exibil-ity, poor security, and lack of data sharing and availabil-ity. A database management system (DBMS) solves these problems with software that permits centralization of data and data management so that businesses have a single,
consistent source for all their data needs. Using a DBMS minimizes redundant and inconsistent fi les.
2 . What are the major capabilities of DBMS, and why is a relational DBMS so powerful?
T he principal capabilities of a DBMS includes a data defi nition capability, a data dictionary capability, and a data manipulation language. The data defi nition capa-bility specifi es the structure and content of the data-base. The data dictionary is an automated or manual fi le that stores information about the data in the database, including names, defi nitions, formats, and descriptions of data elements. The data manipulation language, such as SQL, is a specialized language for accessing and manipulating the data in the database.
REVIEW S UMMARY
06_ch06_laud.indd 20006_ch06_laud.indd 200 28/11/11 6:14 PM28/11/11 6:14 PM
Copyri
ght ©
2013
Pea
rson C
anad
a Inc
. All r
ights
reserv
ed
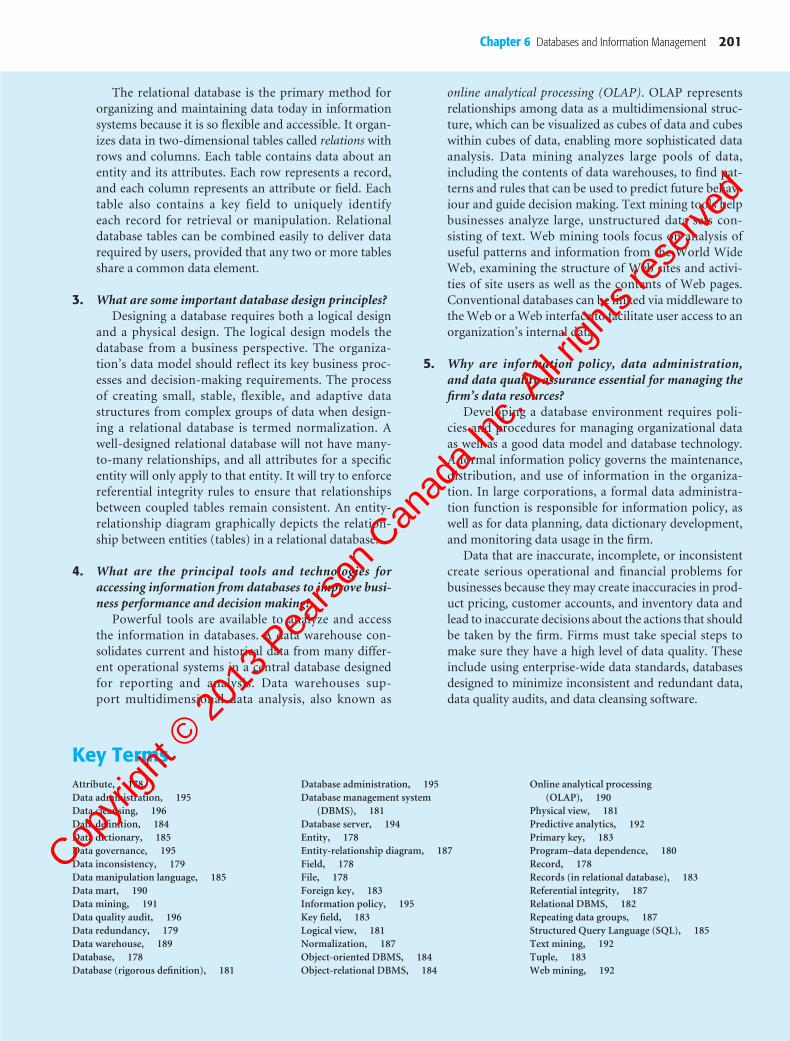
Chapter 6 Databases and Information Management 201
T he relational database is the primary method for organizing and maintaining data today in information systems because it is so fl exible and accessible. It organ-izes data in two-dimensional tables called relations with rows and columns. Each table contains data about an entity and its attributes. Each row represents a record, and each column represents an attribute or fi eld. Each table also contains a key field to uniquely identify each record for retrieval or manipulation. Relational database tables can be combined easily to deliver data required by users, provided that any two or more tables share a common data element.
3 . What are some important database design principles? D esigning a database requires both a logical design
and a physical design. The logical design models the database from a business perspective. The organiza-tion’s data model should refl ect its key business proc-esses and decision-making requirements. The process of creating small, stable, flexible, and adaptive data structures from complex groups of data when design-ing a relational database is termed n ormalization. A well-designed relational database will not have many-to-many relationships, and all attributes for a specifi c entity will only apply to that entity. It will try to enforce referential integrity rules to ensure that relationships between coupled tables remain consistent. An entity-relationship diagram graphically depicts the relation-ship between entities (tables) in a relational database.
4 . What are the principal tools and technologies for accessing information from databases to improve busi-ness performance and decision making?
P owerful tools are available to analyze and access the information in databases. A data warehouse con-solidates current and historical data from many differ-ent operational systems in a central database designed for reporting and analysis. Data warehouses sup-port multidimensional data analysis, also known as
online analytical processing (OLAP). OLAP represents relationships among data as a multidimensional struc-ture, which can be visualized as cubes of data and cubes within cubes of data, enabling more sophisticated data analysis. Data mining analyzes large pools of data, including the contents of data warehouses, to f ind pat-terns and rules that can be used to predict future behav-iour and guide decision making. Text mining tools help businesses analyze large, unstructured data sets con-sisting of text. Web mining tools focus on analysis of useful patterns and information from the World Wide Web, examining the structure of Web sites and activi-ties of site users as well as the contents of Web pages. Conventional databases can be linked via middleware to the Web or a Web interface to facilitate user access to an organization’s internal data.
5 . Why are information policy, data administration, and data quality assurance essential for managing the fi rm’s data resources?
D eveloping a database environment requires poli-cies and procedures for managing organizational data as well as a good data model and database technology. A formal information policy governs the maintenance, distribution, and use of information in the organiza-tion. In large corporations, a formal data administra-tion function is responsible for information policy, as well as for data planning, data dictionary development, and monitoring data usage in the fi rm.
D ata that are inaccurate, incomplete, or inconsistent create serious operational and fi nancial problems for businesses because they may create inaccuracies in prod-uct pricing, customer accounts, and inventory data and lead to inaccurate decisions about the actions that should be taken by the fi rm. Firms must take special steps to make sure they have a high level of data quality. These include using enterprise-wide data standards, databases designed to minimize inconsistent and redundant data, data quality audits, and data cleansing software.
K ey Terms
A ttribute, 178 D ata administration, 195 D ata cleansing, 196 D ata defi nition, 184 D ata dictionary, 185 D ata governance, 195 D ata inconsistency, 179 D ata manipulation language, 185 D ata mart, 190 D ata mining, 191 D ata quality audit, 196 D ata redundancy, 179 D ata warehouse, 189 D atabase, 178 D atabase (rigorous defi nition), 181
D atabase administration, 195 D atabase management system
(DBMS), 181 D atabase server, 194 E ntity, 178 E ntity-relationship diagram, 187 F ield, 178 F ile, 178 F oreign key, 183 I nformation policy, 195 K ey fi eld, 183 L ogical view, 181 N ormalization, 187 O bject-oriented DBMS, 184 O bject-relational DBMS, 184
O nline analytical processing (OLAP), 190
P hysical view, 181 P redictive analytics, 192 P rimary key, 183 P rogram–data dependence, 180 R ecord, 178 R ecords (in relational database), 183 R eferential integrity, 187 R elational DBMS, 182 R epeating data groups, 187 S tructured Query Language (SQL), 185 T ext mining, 192 T uple, 183 W eb mining, 192
06_ch06_laud.indd 20106_ch06_laud.indd 201 28/11/11 6:14 PM28/11/11 6:14 PM
Copyri
ght ©
2013
Pea
rson C
anad
a Inc
. All r
ights
reserv
ed

202 Part II Information Technology Infrastructure
R eview Questions
1. What are the problems of managing data resources in a tra-ditional fi le environment, and how are they solved by a database management system?
• L ist and describe each of the components in the data hierarchy.
• D efi ne and explain the signifi cance of entities, attributes, and key fi elds.
• L ist and describe the problems of the traditional fi le environment.
• D efi ne a database and a database management system and describe how it solves the problems of a traditional fi le environment.
2. What are the major capabilities of DBMS, and why is a relational DBMS so powerful?
• N ame and briefl y describe the capabilities of a DBMS.
• D efi ne a relational DBMS, and explain how it organizes data.
• L ist and describe the three operations of a relational DBMS.
3. What are some important database design principles?
• D efi ne and describe normalization and referential integ-rity, and explain how they contribute to a well-designed relational database.
• D efi ne and describe an entity-relationship diagram, and explain its role in database design.
4. What are the principal tools and technologies for accessing information from databases to improve business perform-ance and decision making?
• D efi ne a data warehouse, explaining how it works and how it benefi ts organizations.
• D efine business intelligence, and explain how it is related to database technology.
• D escribe the capabilities of online analytical processing (OLAP).
• D efi ne data mining, describing how it differs from OLAP and the types of information it provides.
• E xplain how text mining and Web mining differ from conventional data mining.
• D escribe how users can access information from a com-pany’s internal databases through the Web.
5. Why are information policy, data administration, and data quality assurance essential for managing a fi rm’s data resources?
• D escribe the roles of information policy and data admin-istration in information management.
• E xplain why data quality audits and data cleansing are essential.
D iscussion Questions
1 . It has been said that you do not need database management software to create a database environment. Discuss.
2 . To what extent should end users be involved in the selection of a database management system and database design?
3 . What are the consequences of an organization not having an information policy?
C ollaboration and Teamwork:
Identifying Entities and Attributes in an Online Database
W ith your team of three or four students, select an online database to explore, such as AOL Music, iGo.com, or the Internet Movie Database (IMDb). Explore one of these Web sites to see what information it provides. Then list the enti-ties and attributes that the company running the Web site must keep track of in its d atabases. Diagram the relation-
ship between the entities you have identifi ed. If possible, use Google Sites to post links to Web pages, for team com-munications, to post work assignments, to brainstorm, and to work collaboratively on project documents. Try to use Google Docs to develop a presentation of your fi ndings for the class.
06_ch06_laud.indd 20206_ch06_laud.indd 202 28/11/11 6:14 PM28/11/11 6:14 PM
Copyri
ght ©
2013
Pea
rson C
anad
a Inc
. All r
ights
reserv
ed

Chapter 6 Databases and Information Management 203
W hen we think of crime, we think of law enforcement. With the variety of crime lab shows on television, we assume that all law enforcement agencies should have access to the latest and greatest technologies, not only in laboratory technologies, but also in databases. A quick look at what the Royal Canadian Mounted Police (RCMP) is doing with data certainly supports that view. Let us look at two different data applications the RCMP has implemented and how they work: the DNA database and the crime analysis database.
T he national DNA database used by most Canadian law enforcement agencies is called the National DNA Data Bank (NDDB). Also available to foreign law enforcement agencies, the NDDB uses the Sample Tracking and Control System (STaCS) to automate and track processing DNA samples of those convicted of crimes for which DNA was part of the evidence. While criminals can wear gloves to avoid leaving f ingerprints at the scenes of their crimes, it is a lot harder to avoid leaving DNA in the form of hairs or epithelial cells. DNA is the newest form of evidence that can be analyzed to identify criminals, and it can be used in court to convict those guilty of a variety of crimes, from sex crimes to murders and robberies.
T he NDDB, located in Ottawa, uses the same CODIS (Combined DNA Index System) software used by the U.S. FBI and that is so frequently referenced on television shows such as CSI: Crime Scene Investigation. STaCS software works with the CODIS software to ensure that data can be shared between the two systems and also to ensure privacy for those whose DNA is in the database.
T here are a number of scientifi c, legislative, and ethical issues associated with using DNA in solving crime. Is the DNA actually from a specifi c person? When was it left at the crime scene? Can DNA be used in court? How close a match must the DNA be to certify that it is a match, presenting both a legal and a probability issue? Does collecting DNA violate the privacy of the individual giving the DNA sample? What legal and ethical considerations must be thought through before seeking or granting a search warrant on an individual’s DNA? What is an appropriate “margin of error” for processing a DNA sample and linking it to a specifi c individual?
A number of strategies were developed in order to reduce the margin of error and improve accountability. The STaCS system, developed by the RCMP in conjunction with Anjura Technology, is intended to track, control, and document every step in the process that converts the biological DNA sample into simplifi ed numeric DNA profi les. The process must be transparent so that anyone can see exactly the proc-ess the DNA sample went through, ensuring t hat it is in fact the sample that started the process and has not been tam-pered with, so there is an audit trail of every activity that takes place in the system. STaCS includes a report portal to permit everyone using the system to see where a DNA sample is in process and what the results are, as well as machine mainte-nance records and workload on the system.
I n developing STaCS, the RCMP gained the licence to the software. The RCMP has since earned revenue from selling the licence to other law enforcement agencies, such as the Florida Department of Law Enforcement. Anjura has the right to market and sell STaCS, but the royalties the RCMP receives are to be used to upgrade the system to maintain the high-est level of bioinformatics tools. (Bioinformatics relates to the information about a person’s physical characteristics, includ-ing DNA, fi ngerprints, and retinal scans.)
D r. Ron Fourney, the Offi cer in Charge of the NDDB, RCMP, states, “The National DNA Data Bank has become the number one tool in the forensic investigative toolbox for good reason. STaCS provides the ability to develop turnkey solutions at half the cost, run by half the staff, at double the effi ciency.” For example, STaCS’ plug-and-play design could be used by a host of other DNA-type applications, from ani-mal husbandry to paternity cases.
I n addition to DNA analysis and tracking with the NDDB, the RCMP uses a variety of other data applications to help pre-vent, solve, track, and report crimes. All law enforcement agen-cies want to know where crimes are occurring and how often, and what kinds of crime are occurring in specifi c locations.
L aw enforcement offi cers who want to gather information about the types and frequency of specifi c criminal activities typically have to do the research manually—sifting through fi les and then using their handwritten fi ndings to place col-oured pins on a map to indicate the number and type of crimes occurring in a particular area. A number of pins in one area would indicate a trend in criminal activity. To auto-mate this process, the RCMP implemented CADVIEW, a data application to track criminal activity. CADVIEW yields better, more timely information, and its data can be mined to pro-vide reports that can indicate where more law enforcement offi cers may need to be sent in advance of surges in criminal activity in that area.
T he data in CADVIEW comes from computer-aided dis-patch. Integrating geographic information system data along with tabular data about crimes permits the system to help law enforcement to focus on areas where crime is high—so-called “hot spots.” The RCMP dispatch system sends the data to CADVIEW, where a PowerBuilder-based database applica-tion developed by xwave, a consulting fi rm and subdivision of Bell Aliant, stores the data and permits it to be mined by an intuitive i nterface. Onscreen reports can show frequency, number of all crimes in an area, types of crimes in an area, or even the sequence of crimes in an area. This visual repre-sentation is extremely helpful not only for the RCMP, but also for the community—such as showing what is happening to a Block Watch meeting of concerned citizens. This application has been deployed to the RCMP’s 35 communication cen-tres across Canada.
N ancy MacDonald, the xwave developer who developed the CADVIEW program, explains how the CADVIEW map can
T he RCMP and Its Data: More and More and More Data—and What the RCMP Does with Its Data C ASE STUDY
06_ch06_laud.indd 20306_ch06_laud.indd 203 28/11/11 6:14 PM28/11/11 6:14 PM
Copyri
ght ©
2013
Pea
rson C
anad
a Inc
. All r
ights
reserv
ed

204 Part II Information Technology Infrastructure
be used at shift change briefi ngs. “At some detachments, the map is also used as a ‘pin map’ that is handed out to the offi cers at the start of their shift. They can see what is hap-pening in their jurisdiction. As the offi cers go on duty, they know exactly what sort of crimes occurred and what investi-gations are in progress.”
T hinking of data as dry and dense helps us to realize that dry, dense data can be used to better society and to support law enforcement in protecting us from crime. The use of the National DNA Data Bank, STaCS, and CADVIEW systems certainly shows that data can come to life and help protect human life.
A third RCMP data initiative. the National Integrated Interagency Information (N-III) system, is an information-sharing system for police, public safety, and federal agencies across Canada. To begin, N-III uses two tools: the Police Information Portal (PIP) for law enforcement agencies and the Integrated Query Tool (IQT) for federal government departments and public safety agencies. IQT provides access to police information fi lters that ensure that data-sharing laws are respected and the various agencies access only the data to which they are legally entitled.
A lmost all of the 192 Canadian police agencies participate while the remaining agencies. Several federal agencies are also involved. “There is nothing like it,” said Superintendent Charles Richer, N-III project director, RCMP. “As far as records management systems go, there’s nothing out there, has never been anything. . . . This is groundbreaking with respect to providing that kind of information to police offi cers everywhere.”
P IP is a searchable index of all police agency Record Management Systems (RMS) across the country. PIP oper-ates as an information broker. “The PIP portal sits among all participants, acting as an information search engine and request broker. Individual agencies decide what informa-tion they want to make available to other law enforcement agencies, while retaining ownership of the data. The p ortal contains only an index of information and not the contents of an electronic record, according to the RCMP Web site” PIP utilizes pre-existing networks. “It’s more about having record management systems that can speak to each other,” said Richer. [PIP] is targeted to assist front-line offi cers and investi-gators in knowing with whom they are dealing.
W hile information-sharing initiatives may stir up privacy rights concerns, criminals such as Paul Bernardo, the infa-mous convicted criminal, have used the lack of information sharing across jurisdictions to their gross advantage. Mr. Justice Archie Campbell highlighted the need for police infor-mation sharing in the 1996 Bernardo Investigation Review. “That’s where all this stemmed from, sharing information,”
said Richer. “You can solve crimes; you can save lives; that’s pretty much what we’re about.”
I n October, 2010, the RCMP reported that they had found DNA on an anonymous letter written six months before that might help identify the EnCana pipeline bomber. Whether the DNA is related to the person who wrote the letter still remains a mystery. And, of course, there are still ethical ques-tions about DNA collection.
A s this is being written, the RCMP are asking most if not all of the taxi drivers who work with Prince George Taxi in British Columbia for “voluntary” DNA samples as it investigates the disappearance or murders of four individuals near the so-called Highway of Tears. This has raised ethical concerns among pri-vacy advocates and even the taxi company manager. “I think they were treating it (the list of cabbies’ names he had handed over to the RCMP) like a suspect list,” said Sam Kuuluvainen, who has managed the company for the past 10 years.
C ASE STUDY QUESTIONS
1. Evaluate the RCMP’s reasons for implementing STaCS and CADVIEW. Compare the need for effi ciency with the need for effectiveness. Were both effi ciency and effectiveness key factors in these solutions?
2. What management, organization, and technology factors were responsible for the decision to implement these systems?
3. What problems were to be addressed by these systems? How did data management address these problems? How effective are these solutions?
4. What privacy issues arise from the use of these two data-bases? Are there simple solutions to these issues, or are the privacy issues complex, requiring the courts to adjudi-cate them?
S ources: Microsoft, “The Royal Canadian Mounted Police: Microsoft Software Helps Solve Crimes,” www.jinan. edu. lb/ Syllabus/ idara/ bi/ exams/ bi-exams. htm, accessed September 13, 2011; “2005 Computerworld Honors Case Study: CADVIEW,” www.cwhonors. org/ laureates/ government/ 20055332. pdf, accessed September 13, 2011; Government Technology, “Case Study: Royal Canadian Mounted Police,” www.govtech. net/ digitalcommunities/ studies/ sybase_RCMPv2. pdf, accessed April 10, 2007; Jennifer Kavur, “RCMP Push National Police Data-Sharing Project,” Computer World Canada, August 18, 2008; “DNA Found on Pipeline Bomber Letter: RCMP,” www.cbc. ca/ news/ canada/ british-columbia/ story/ 2010/ 10/ 14/ bc-pipeline-bombings-letter-dna. html, accessed September 13, 2011; “Cab Drivers Asked for DNA Samples for RCMP Murder Probe,” www.globaltvedmonton. com/ cab+drivers+asked+for+dna+samples+for+rcmp+murder+probe/ 95852/ story. html, accessed April 4, 2011.
06_ch06_laud.indd 20406_ch06_laud.indd 204 28/11/11 6:14 PM28/11/11 6:14 PM
Copyri
ght ©
2013
Pea
rson C
anad
a Inc
. All r
ights
reserv
ed