Embed Size (px)
Citation preview

This PDF is a selection from a published volume from the National Bureau of Economic Research
Volume Title: The Industrial Composition of Income and Product
Volume Author/Editor: John W. Kendrick, editor
Volume Publisher: NBER
Volume ISBN: 0-870-14487-1
Volume URL: http://www.nber.org/books/kend68-1
Conference Date:
Publication Date: 1968
Chapter Title: Comparison of Federal Reserve and OBE Measures of Real Manufacturing Output, 1947–64
Chapter Author(s): Jack J. Gottsegen, Richard C. Ziemer
Chapter URL: http://www.nber.org/chapters/c1142
Chapter pages in book: (p. 225 - 370)

Part IIIThe Basic Industry Product Estimates


Comparison of Federal Reserve and OBE Measures
of Real Manufacturing Output, 1947—64
JACK J. GOTTSEGENRICHARD C. ZIEMER
OFFICE OF BUSINESS ECONOMICS
U.S. DEPARTMENT OF COMMERCE
Annual estimates of gross product originating in manufacturing in-dustries and the subgroups, durable and nondurable goods industries,for the postwar period were first published in the October 1962 issueof the Survey of Current Business. These OBE measures have beencompared with those of the Federal Reserve Board (FRB) anddifferences in growth rates and in year-to-year changes noted.
Although the two series differ conceptually and statistically thebroad pattern of manufacturing output reflected by both the OBE andFRB series has been similar for the postwar period. As discussed in
NOTE: The following abbreviations are used in this article:
OBE = Office of Business EconomicsFRB = Federal Reserve BoardGPO = Gross product originating; an industry's contribution to GNPReal Product = Gross product originating in constant (1958) prices.
Similar comparisons for the mining industries and for the utilities industries,the remaining components of the FRB's "Index of Industrial Production," are notmade for the following reasons. The OBE indexes for mining are based on theindexes for the separate mining activities as computed by the Federal ReserveBoard. The utility industry, as defined by the SIC, determines the industry com-position for purposes of compiling GNP data. The latter (Major Group 49) in-cludes only privately owned companies engaged in the generation, transmission,and/or distribution of electricity or gas or steam and also those operating waterand irrigation systems, and sanitary systems engaged in collecting and disposingof garbage, sewage, and other wastes. In contrast, the output of utilities as meas-ured by the FRB indexes relates to the production and distribution of onlyelectricity and gas by both privately owned and publicly owned utilities as wellas by power plants which are auxiliary units or departments of manufacturingand mining establishments.

226 Basic Industry Product Estimates
more detail below, both series exhibit a sharp rate of increase from1948—53, a slower rate of gain until 1960, and rapid gains since 1960(Chart 1). However, manufacturing output has increased more rapidlyfrom 1948—64, when measured by the FRB series. Higher growth ratesreflected by the latter measures, compared with the indexes of realproduct, also prevail during the 1953—60 period. The FRB and OBEseries for the durable (Chart 2) and nondurable (Chart 3) manufactur-ing industries also show similar movements.
A detailed examination of the relationship between the manufacturingcomponents of the FRB index and the OBE gross-product-originatingmeasures has been postponed until the latter could be revised to reflectthe statistical and definitional revisions which were incorporated intothe national accounts in August 1965. The revised GPO series alsoincorporate information from more recent and comprehensive sourcesincluding the 1958 input—output study, as well as improvements inestimating methods, and reflect changes in industry classifications asprovided by the 1957 edition of the Standard Industrial Classification(SIC) Manual. It is recognized that some of the observations indicatedbelow may not apply when the FRB revisions are completed, butexplanations of the fundamental relationships, particularly at a detailedmanufacturing industry level, are possible.'
Conceptual Differences and Measurement Problems
While the annual production indexes prepared by both OBE and FRBand those developed from the Census data are designed to measurechanges in real output for manufacturing industries, they differ withrespect to concepts and methods of measurement.
GPO AND FRB MEASURES
Gross product originating in an industry is a measure of an industry'scontributions to the nation's total output of goods and services as
1 The revised FRB series are planned for release in 1968. They will be ad-justed to the Census-Federal Reserve Benchmark Indexes of Manufacturing for1958 and 1963. (The authors are indebted to Mr. C. Gehman and Mrs. C. J.Motheral, Federal Reserve Board, for their cooperation and assistance in providinginformation on procedures and making available unpublished FRB data in-cluding some of the tabulations prepared for Industrial Production Measurementin the United States: Concepts, Uses and Compilation Practices, Board of Gov-ernors of the Federal Reserve System, February 1964.)

Comparison of FRB and OBE Measures of Output 227
defined in the national income and product accounts. An industry'sgross product or value added may be measured as the amount bywhich the total value of its output exceeds the cost of purchasedintermediate products (materials and business services) used in pro-duction. The gross product is also equal to the sum of the industry'sfactor payments (employee compensation, profits, net interest, etc.)and of its nonf actor costs of production (indirect business taxes,depreciation, etc.). OBE uses the latter procedure to measure anindustry's output (value added) in current dollars. The constant-dollartotal is calculated by deflating the current-dollar total by an implicitdeflator derived by the "double deflation" procedure.2 The constant-dollar series represents an industry's value added for the given year'scomposite of output minus purchases, valued in base-year prices.
The FRB indexes for a two-digit SIC industry are also designed tobe measures of its value added in constant prices. In these indexes,however, the Census value-added concept is used and this value added,as discussed below,3 differs from the GPO concept principally byincluding the value of purchased services. The Census value addedfor a base year is extrapolated by quantity series representative of anindustry's total output.
Changes in total output may differ from changes in value added(also called net output or gross product). Such differences will arisewhen, for any number of reasons, the material requirements per unitof output vary over time. Such variations may occur, for example,because: (a) improved production techniques result in savings ofmaterials or in substituting less expensive materials; (b) changes inthe degree of integration of production processes or in the kinds ofproducts produced result in a shift to the use of more (or less) highlyfabricated materials; and (c) the proportion of products within anindustry with higher value added per unit of output increases (ordecreases) relative to those with lower unit value added.
In principle, the OBE data on real product should reflect the"true" movements in net output. In practice, however, the OBE seriesmay not, because of imperfections, for example, in the data for pricechanges or the lack of this information. The price index problemsarise primarily because of limitations in sample coverage, the markets
2 See Appendix A for description.See Census value added and GPO, p. 230.

228 Basic Industry Product Estimates
in which prices are measured, the differences between quoted andtransaction prices, and their adequacy to account for quality changes(the quality issue is mentioned again in the paragraph below whichrefers to the quantity series on output used in the FRB calculations).Even when individual price indexes are available, there may be diffi-culties because adequate information is unavailable on weights neededto calculate composite indexes for deflating outputs and inputs. (SeeAppendix A.) Furthermore, the current-dollar measures of value ofproduction, cost of materials, purchased services, and gross productoriginating in a manufacturing industry have statistical limitations.
The FRB series, in. principle, also represent changes in net outputif the ratio of value added per unit of output remains constant atthe detailed level selected by the FRB for estimating output. Ifstability at this level, which is generally a SIC three-digit level, doesnot occur, the movements of value added and total output are notparallel. Similarly, the relationship for a major (two-digit SIC) industryis dependent upon the value-added—output ratios for the componentseries. (The FRB indexes will, however, reflect changes in the valueadded for a major industry if output shifts occur only among the com-ponent industries at the measured level with different value-added—out-put ratios.)
Like the OBE measures, the FRB measures are affected by in-adequacies of data sources. Series on the quantity of output may notbe representative or adequate in coverage.4 The available quantityseries may also not be sufficiently detailed and thus not reflect properlychanges in the composite of output or in the quality of goods produced.Where the deflation method is used by FRB, the shortcomings of theprice data, which are a consideration in the constant-dollar OBE data,must be considered as well. For those industries where labor inputs(or, in a few cases, material inputs) are used to estimate output,there may also be a question of reliability.
The FRB indexes for manufacturing industries are calculated byusing about 200 series. These 200 series include, for a number ofindustries, a man-hour or employment series adjusted for estimatedproductivity as measures of physical volume of output. About 9 per
4 issue frequently is whether the production movements of a given productfollow more closely that of another product or whether the price movements ofthe products are more closely related.
Comparison of FRB and OBE Measures of Output 229
cent of manufacturing activity through 1957 and 55 per cent since1958 is represented by such labor-input series. The remainder arerepresented primarily by physical units of output. The productivityestimates used with man-hour or employment figures are derived froma wide variety of data including productivity patterns based on theFRB physical product series.5
The constant-(1958) dollar GPO for a given two-digit industry iscalculated by deflating the current-dollar totals by an implicit deflatorderived by a "double deflation" procedure. In this procedure, theoutput of each four-digit manufacturing industry (about 425 industries)is derived from Census Bureau data on the value of shipments andof inventory change; these are deflated separately, and then aggregatedto about sixty subgroups represented in the manufacturing segment ofOBE's 1958 input—output study. The Census cost-of-materials datafor each of these groups are also deflated separately, and subtractedfrom deflated output to yield "Census" value-added figures in constantprices. The current- and constant-dollar totals for output, materialsinput and value added of the sixty groups are then aggregated to theSIC two-digit level. At this level the current-dollar totals for valueadded are divided by the corresponding constant-dollar totals to yieldthe value added or GPO implicit deflator. In this deflation process,more than 1200 price indexes, about 70 per cent of which are speciallytabulated by the U.S. Bureau of Labor Statistics, are used by OBE.Limitations of these price indexes have been indicated above.
The GPO implicit deflator has the quality that small differences inthe level of output or input prices yield larger differences in the GPOdeflator since the latter is derived as a residual—that is, the outputprice index has a positive weight but the input price index has anegative weight.6 In addition, the GPO price index does not explicitlyinclude representation of prices for purchased business services. Somepreliminary tests, however, indicate that even for industries where suchpurchases are large, an approximation of an all-inclusive GPO deflatordiffers little from the ones actually used by OBE.7
5 See Appendix A for the proportion of each SIC two-digit industry's outputthat is based on measures of labor input. These measures are also discussed inIndustrial Production Measurement in the United States: Concepts, Uses andCompilation Practices, Board of Governors of the Federal Reserve System,February 1964, p. 13.
6 See GNP by Major Industry, Methods and Concepts, p. 3.See Appendix A.
230 Basic Industry Product Estimates
CENSUS VALUE ADDED AND GPO
The OBE gross product totals exclude all intermediate purchasesby the industry and include the excise taxes for which the industryhas legal responsibility. Census value added excludes excise taxes paidby the industry and is net only of purchased goods including fuels andelectricity consumed in the production processes but not purchasedservices other than contract. work done on reported output.
In addition, the Census value-added total does not include an adjust-ment for inventory valuation (IVA), which is included in the GPOfigures. Census value added is currently derived by subtracting thecost of materials consumed, energy used, and the cost of resales fromthe value of output. The latter is determined by the value of shipments(including receipts for resales and other activities) adjusted for changein inventories of finished goods and work in process valued at beginningof the year and end-of-the-year prices.8
According to the basic concepts of national income accounting, thevalue of current production is only truly reflected when the changein inventories is valued at average prices during the period. Reportedcorporate profits and income of unincorporated enterprises is adjustedfor inventory profit or loss. The adjustment to reported book value ofinventories results in having the change in the physical volume ofinventories valued at average prices during the current year insteadof in book values.9 When an industry's ratio of changes in inventoryvaluations to value added is relatively large, which occurs when pricesfluctuate greatly, the inventory valuation adjustments can affect signifi-cantly the current-dollar totals of GPO.
Furthermore, gross-product-originating data and Census value-addedfigures for a specified industry differ for other reasons. The Censusdata exclude intermediate purchases of materials and services used byadministrative and auxiliary establishments associated with the manu-facturing establishments; classification differences arise from independentdecisions made by the Census Bureau and by the Internal RevenueService, and State Unemployment Insurance Agencies, which are theprincipal sources of data for GPO; total compensation used by OBEdiffers from the Census sources; value added is derived by the Census
Census value of production as computed by OBE differs slightly.For further explanation and procedures which vary with the method of in-
ventory valuations (FIFO or LIFO), see National Income, 1954 edition, sup-plement to the Survey of Current Business, pp. 44—45 and 135—138.

Comparison of FRB and OBE Measures of Output 231
Bureau from reported values of shipments, inventories and cost ofmaterials, supplies, and energy consumed, while OBE derives this totalby adding the factor and nonfactor charges, which involves estimatingfrom companies' total profits and capital consumption allowances forall establishments classified in an industry; since 1954, the procedurefor calculating Census value added has been changed and there isundercoverage in the 1947 and 1949—64 Census data as well assampling errors for some years.
Statistical Framework for Analysis
Disparities between the OBE and FRB measures of manufacturingoutput stem from differences in weighting patterns, in the data andmethods used to measure output for the component manufacturingseries, and in the definitions of output. The OBE series is a measureof the manufacturing industries' contributions to total GNP. A current-dollar series, representing at market prices the increase in value resultingfrom the industry's activity, is deflated so that this total (real product)may be expressed in base-year prices. The FRB indexes are based ondetailed quantity (pounds or number produced) or proxy (man-hoursor materials consumed) measures of the total output, which areaggregated to industry and group levels by using as weights Censusvalue added for a base period.
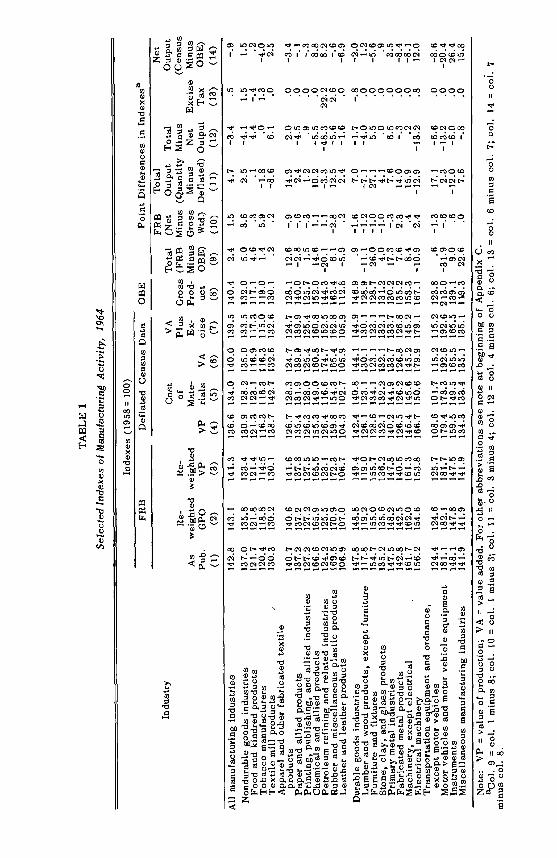
The statistical framework for analyzing the relationship betweenthe OBE and FRB indexes is shown in Table 1. The 1964 FRBindexes as published, but on a 1958 rather than 1957—59 base, areshown in column 1. These indexes reweighted by 1958 GPO and by1958 Census value of production appear respectively in columns 2and 3. The next four columns contain indexes based on a constant-dollar (1958) series for Census measures showing total output, materialinputs, net output, and net output including the appropriate federal ex-cise taxes for which the manufacturer has legal responsibility. The GPOindexes appear in column 8. These statistics provide the necessary in-formation so that among other comparisons, the following become evi-dent:
1. The difference between the published FRB and OBE indexes,when disparities due to base periods are removed (column 1 minuscolumn 8 or column 9).
TA
BL
E 1
Sele
cted
Ind
exes
of
Man
ufac
turi
ng A
ctiv
ity, 1
964
Not
e: V
P =
valu
eof
pro
duct
ion;
VA
=va
lue
adde
d. F
or o
ther
abb
revi
atio
ns s
ee n
ote
at b
egin
ning
of
App
endi
x C
.aC
ol 9
=co
l.I
min
us 8
; col
. tO
=co
l.1
min
us 3
; col
. ii =
col.
3 m
inus
4; c
ol. 1
2 =
col.
4 m
inus
co.
l. 6;
col
. 13
=m
inus
col.
8.
Indu
stry
Inde
xes
(195
8 =
100)
OB
EPo
int
Dif
fere
nces
in I
ndex
esa
FRB
Def
late
d C
ensu
sD
ata
Cos
tV
AT
otal
FRB
(Net
Tot
alO
utpu
tT
otal
Net
Out
put
Re-
Re-
ofPl
usG
ross
(FR
BM
inus
(Qua
ntity
Min
us(C
ensu
sA
sw
eigh
ted
wei
ghte
dM
ate-
Ex-
Prod
-M
inus
Gro
ssM
inus
Net
Exc
ise
Min
usPu
b.G
POV
PV
Pri
als
VA
cise
uct
OB
E)
Wtd
.)D
efla
ted)
Out
put
Tax
OB
E)
(1)
(2)
(3)
(4)
(5)
(6)
(7)
(8)
(9)
(10)
(II)
(12)
(13)
(14)
All
man
ufac
turi
ng in
dust
ries
142.
814
3.1
141.
313
6.6
134.
014
0.0
139.
514
0.4
2.4
1.5
4.7
—3.
4.5
—.9
Non
dura
ble
good
s in
dust
ries
Food
and
kin
dred
pro
duct
sT
obac
co m
anuf
actu
rers
Tex
tile
mill
pro
duct
s
137.
012
1.7
120.
413
0.3
135.
812
1.8
118.
813
0.2
133.
412
1.4
114.
513
0.1
130.
912
8.2
121.
312
3.1
116.
311
6.3
138.
714
2.7
135.
011
6.9
116.
313
2.6
133.
511
7.3
115.
013
2.6
132.
011
7.1
119.
013
0.1
5.0
4.6
1.4 .2
3.6 .3
5.9 .2
2.5
—4.
1.1
4.4
—1.
8.0
—8.
66.
1
1.5
—.4
1.3 .0
1.5 .2
—4.
02.
5A
ppar
el a
nd o
ther
fab
rica
ted
text
ilepr
oduc
tsPa
per
and
allie
d pr
oduc
tsPr
intin
g, p
ublis
hing
, and
alli
ed in
dust
ries
Che
mic
als
and
allie
d pr
oduc
tsPe
trol
eum
ref
inin
g an
d re
late
d in
dust
ries
Rub
ber
and
mis
cella
neou
s pl
astic
pro
duct
sL
eath
er a
nd le
athe
r pr
oduc
ts
140.
713
7.2
127.
216
6.6
124.
216
9.5
106.
9
140.
613
7.2
127.
216
5.9
125.
517
0.9
107.
0
141.
613
7.8
127.
516
5.5
123.
117
2.3
106.
7
126.
712
8.3
135.
413
1.9
126.
312
8.0
155.
314
9.0
126.
411
6.6
159.
815
4.3
104.
310
2.7
124.
713
9.9
125.
416
0.8
174.
716
5.4
105.
9
124.
713
9.9
125.
416
0.8
152.
516
2.8
105.
9
128.
114
0.0
125.
715
2.0
144.
316
3.4
112.
8
12.6
—2.
81.
514
.6—
20.1
6.1
—5.
9
.9—
.6—
.31.
11.
1—
2.8 .2
14.9
2.0
2.4
—4.
51.
2.9
10.2
—5.
5—
3.3
—48
.312
.5—
5.6
2.4
—1.
6
.0 .0 .0 .022
.2 2.6 .0
—3.
4—
.1 -.3
8.8
8.2
—.6
—6.
9
Dur
able
goo
ds in
dust
ries
Lum
ber
and
woo
d pr
oduc
ts, e
xcep
t fur
nitu
reFu
rnitu
re a
nd f
ixtu
res
Ston
e', c
lay,
and
gla
ss p
rodu
cts
Prim
ary
met
al in
dust
ries
Fabr
icat
ed m
etal
pro
duct
sM
achi
nery
, exc
ept e
lect
rica
l.
Ele
ctric
alm
achi
nery
Tra
nspo
rtat
ion
equi
pmen
t and
ord
nanc
e,ex
cept
mot
or v
ehic
les
Mot
or v
ehic
les
and
mot
or v
ehic
le e
quip
men
tIn
stru
men
tsM
isce
llane
ous
man
ufac
turi
ng in
dust
ries
147.
811
7.8
154.
713
5.2
147.
514
2.8
161.
715
6.2
124.
418
1.1
148.
114
1.9
148.
811
9.2
155.
013
5.6
148.
214
2.5
162.
015
4.6
124.
618
2.1
147.
814
1.9
149.
411
9.0
155.
713
6.2
147.
814
0.5
161.
315
3.8
125.
718
1.7
1.47
.514
1.9
142.
414
0.8
126.
112
3.1
128.
613
4.1
132.
113
2.2
140.
214
4.9
126.
512
6.2
145.
414
5.6
166.
715
0.6
108.
610
1.7
179.
417
3.3
159.
514
9.5
134.
313
3.4
144.
113
0.1
123.
113
2.1
133.
712
6.8
145.
217
9.9
115.
219
2.6
165.
513
5.1
144.
913
0.1
123.
113
2.1
133.
712
6.8
145.
217
9.1
115.
219
2.6
165.
513
5.1
146.
912
8.9
128.
713
1.2
130.
213
5.2
153.
316
7.1
123.
821
3.0
139.
1
.9—
11.1
26.0 4.0
17.3 7.6
8.4
—10
.9 .6—
31.9 9.0
22.6
—1.
6—
1.2
—1.
0—
1.0
—.3
2.3 .4 2.4
—1.
3—
.6 .6 .0
7.0
—1.
7—
7.1
—4.
027
.15.
54.
1.0
7.6
6.5
14.0
—.3
15.9
.2—
12.9
—13
.2
17.1
—6.
62.
3—
13.2
—12
.0—
6.0
7.6
—.8
—.8 .0 .0 .0 .0 .0 .0 .8 .0 .0 .0 .0
—2.
01.
2—
5.6 .9
3.5
—8.
4—
8.1
12.0
—8.
6—
20.4
26.4
15.8
col.
6 m
inus
col
. 7; c
ol. 1
4 =
col.
7

Comparison of FRB and OBE Measures of Output 233
2. The difference when the underlying FRB output series are com-bined with Census gross rather than with net value weights (colunmI minus column 3 or column 10).
3. The difference between total real output when measured byquantity (colunm 3) and by deflation (column 4), which appears incolumn 11.
4. The difference between deflated total (column 4) and net output(column 6) which is shown in column 12.
5. The difference in real net output resulting from the exclusionor inclusion of excise taxes in the calculation of this measure. Column13 is derived by subtracting column 7 from column 6.
6. The difference (column 14) between Census value added withtax (column 7) and OBE net value-added series (column 8).
While in principle the differences between the measures comparedare conceptual, a portion of the disparities may actually be due todata inconsistencies. For example, comparisons between columns 3and 4 imply that the same outputs are reflected by both the FRBquantity series and data derived from Census shipments and changesin inventories of finished goods and goods in process. For someindustries, such as foods, the coverage of the FRB and Census total-output series differs markedly and for years prior to 1958 Census datawere adjusted to reflect SIC changes. Limitations of the various seriesare described in Appendix C, which also contains a more detaileddescription of the indexes shown in columns 1 through 8 of Table 1and of similar tables shown in this article. The procedures, weights,and data sources used to construct the FRB and OBE indexes arebriefly discussed in Appendix A. The GPO current-dollar totals andtheir components as well as the GPO constant-( 1958) dollar totalsby industry (1947—64) are shown in Appendix B. Lastly, the implicitprice deflators for total output, cost of materials, value added, andGPO, by industry are listed in Appendix D.
Conclusions
The OBE and FRB indexes may be compared from many viewpoints.Although the magnitudes of the difference and an industry's contribu-tion to the spread between the two indexes may vary when trends,year-to-year changes, or other stated periods are compared, the under-

234 Basic Industry Product Estimates
lying causes for disparities between the two series may be illustratedby a comparison of the 1964 OBE and FRB indexes—the most recentyear for which the data are available.
If both the FRB and OBE indexes had the same (GPO) weights,then the 2.4 points excess of the 1964 FRB index over the OBEfigure for total manufacturing would have been increased to 2.7 points.This small change arises from a relatively larger decrease in re-weighted FRB indexes for nondurables, which is offset by an increasein the FRB reweighted indexes for durables. Weighting patterns accountfor 1.2 points of the 5.0 points spread between the OBE and publishedFRB series for the nondurables. For the durable goods industries,weighting differences increase the FRB and OBE gap from 0.9 to 1.9points. Weighting the 1964 FRB relatives by 1958 Census value of pro-duction also results in reducing the point spread for nondurables andincreasing the gaps for durables.
The influence of the weights stems principally from the inclusion ofexcise taxes in the GPO weights and their exclusion from the Censusvalue-added weights used by FRB. For total manufacturing, weightsreduced the point spreads because the tax incidence is associated withindustries whose 1964 output increased less rapidly since 1958 thanthe average. This applies particularly to the nondurables, where theinfluence of these taxes almost halved the spread due to other weightingdifferences.
The FRB indexes reweighted by 1958 Census value of productionexceeds the deflated Census value of production series by 4.7 pointsfor total manufacturing. The spread however is 2.5 points for thenondurables and 7.0 points for the durables. The point difference dueto measuring total output by quantity or man-hour series rather thanby deflation is 4 points or more for four of ten nondurable industriesaccounting for 18.4 per cent of the 1964 all manufacturing total(based on deflated Census value of production). For durables, thecorresponding figures are ten of the eleven industries, which accountfor 46.6 per cent of the 1964 manufacturing total. The point differencesat the aggregate levels—total durable and nondurable manufacturingindustries—are reduced because of offsetting movements. The FREtotal-output weighted indexes are higher than the deflated Census valueof production figures by 4 points or more for ten industries (54.1 percent of total manufacturing) and lower by 4 points or more for fourindustries (14.7 per cent of the 1964 manufacturing total).
Comparison of FRB and OBE Measures of Output 235
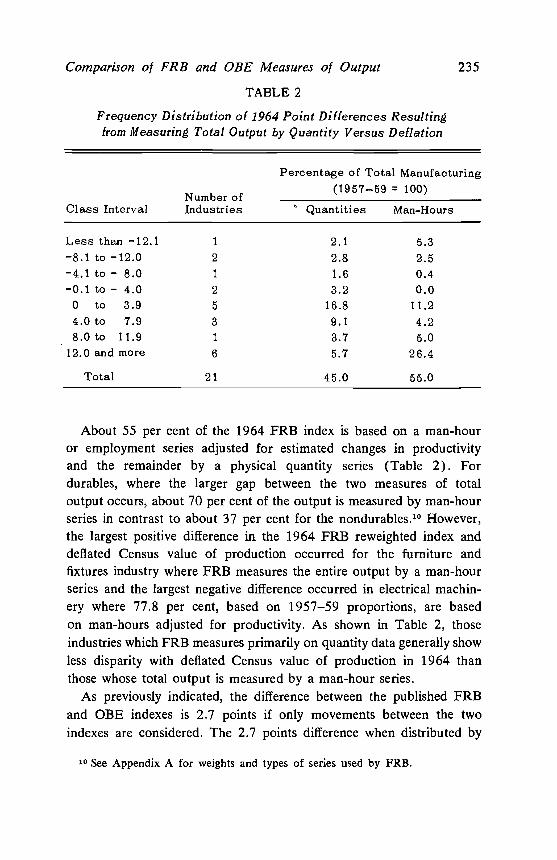
TABLE 2
Frequency Distribution of 1964 Point Differences Resultingfrom Measuring Total Output by Quantity Versus Deflation
Class IntervalNumber ofIndustries
Percentage of Total Manufacturing(1957—59 = 100)
Quantities Man-Hours
Less than —12.1 1 2.1 5.3—8.1 to —12.0 2 2.8 2.5—4.1 to — 8.0 1 1.6 0.4—0.1 to — 4.0 2 3.2 0.0
0 to 3.9 5 16.8 11.24.0 to 7.9 3 9.1 4.2
• 8.0 to 11.9 1 3.7 5.012.0 and more 6 5.7 26.4
Total 21 45.0 55.0
About 55 per cent of the 1964 FRB index is based on a man-houror employment series adjusted for estimated changes in productivityand the remainder by a physical quantity series (Table 2). Fordurables, where the larger gap between the two measures of totaloutput occurs, about 70 per cent of the output is measured by man-hourseries in contrast to about 37 per cent for the nondurables.1° However,the largest positive difference in the 1964 FRB reweighted index anddeflated Census value of production occurred for the furniture andfixtures industry where FRB measures the entire output by a man-hourseries and the largest negative difference occurred in electrical machin-ery where 77.8 per cent, based on 1957—59 proportions, are basedon man-hours adjusted for productivity. As shown in Table 2, thoseindustries which FRB measures primarily on quantity data generally showless disparity with deflated Census value of production in 1964 thanthose whose total output is measured by a man-hour series.
As previously indicated, the difference between the published FRBand OBE indexes is 2.7 points if only movements between the twoindexes are considered. The 2.7 points difference when distributed by
10 See Appendix A for weights and types of series used by FRB.

236 Basic Industry Product Estimates
categories which show changes between the Census measures of total(VP) and net (VA) output is as follows:
As indicated in Table 3, the following may be concluded:(1) Of the 2.7 points discrepancy due to movements between the
FRB and OBE series for total manufacturing, 3.9 points are contributedby industries whose 1964 Census total-output index (1958 100)exceeded net output. Based on 1957—59 proportions, these industriesaccounted for 44.4 per cent of total manufacturing.
(2) Offsetting the increase for the above series by 1.4 points arethe contributions from twelve industries which fall into the categoryof larger 1958—64 increases in value added than in value of production.
TABLE 3
Frequency Distribution of 1964 Point Differences BetweenFRB and ODE Indexes, Classified by Movements of
Census Measures of Total and Net Output
Number of
Percentage ofTotal Manufacturing
(1957—59 = 100)
Quanti- Man- PointIndustries ties Hours Contributions
VP = VA 2 2.0 2.4 0.2OBE higher than FRB 0 0.0 0.0 0.0FRBhigherthanOBE 2 2.0 2.4 0.2
VA higher than VP 12 20.5 30.7 —1.4OBE higher than FRB 6 14.3 8.1 —3.7FRB higher than OBE 6 6.2 22.6 2.3
VA smaller than VP 7 22.5 21.9 3.9OBE higher than FRB 0 0.0 0.0 0.0FRB higher than OBE 7 22.5 21.9 3.9
Totals 21 45.0 55.0 2.7
Note: VP = Value of production; VA = Value added. For otherabbreviations see note at the beginning of Appendix C.
Comparison of FRB and OBE Measures of Output 237
For six industries, which account for about 22 per cent of totalmanufacturing, the OBE indexes are higher; for six industries, con-tributing about 29 per cent, the FRB indexes are higher.
(3) The remaining two industries fall into the category where, since1958, the 1964 indexes of gross and net output are identical. Theseindustries, accounting for 4.4 per cent of total manufacturing, contributeonly 0.2 points to the 2.7 point spread between the published FRBand OBE indexes.
(4) The FRB use of a man-hour series rather than a quantity seriesto measure output predominates only in one category, namely wherenet output has increased faster than total output. Differences in 1964levels again appear to arise almost as much from quantity measures(pounds of plastics, number of tires, tons of steel) as from the use ofa man-hour series, when compared with the deflation procedure.
This should not suggest, however, that deflated Census value addedor GPO are necessarily correct, despite the fact that movements ofthese two indexes for total manufacturing are almost identical. Thereare of course, the limitations noted below with respect to deflatedoutputs. In addition, the deflation of the inputs depends not only onthe validity of the price indexes but also on the weights used toaggregate them.
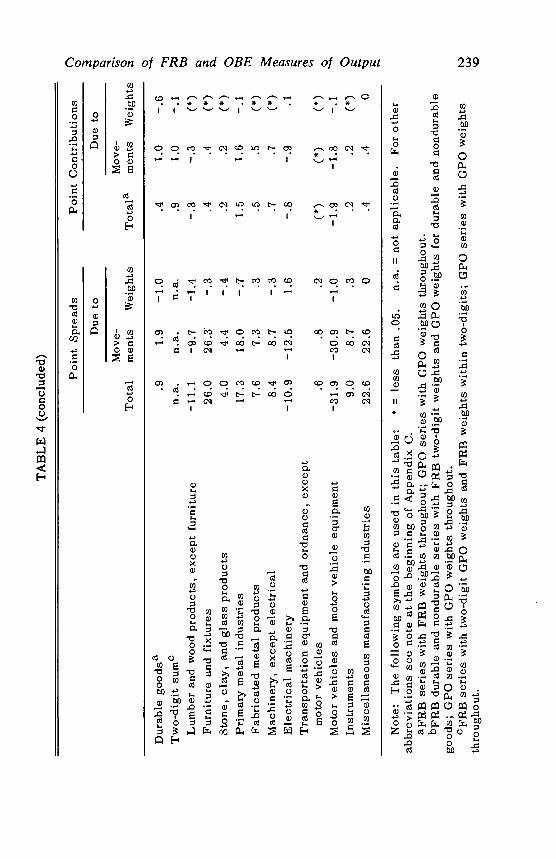
Table 4 below summarizes differences between the FRB and OBEindexes for 1964 (1958 = 100) for total manufacturing, durable, andnondurable goods industries and also isolates the differences by SICtwo-digit industries. Summary figures indicating the point spread arisingfrom weights and movements are shown separately. Because the industryweights in the FRB and OBE series differ, the sums of the industrypoint contributions do not equal the respective durable and nondurablepoint contributions. The weight differences between the two series alsoexplain why the point contributions for the durables and nondurablesdo not add to the total for all manufacturing industries.
For the nondurable goods industries, the 1964 gap principally arisesfrom the food, apparel, chemicals, and petroleum industries. For thefood and petroleum industries, the FRB indexes approximate theindexes of Census deflated value of production and the OBE indexesreflect the Census deflated value-added levels. For the chemicalsindustry the FRB index, which is 14.6 points higher than the OBEindex, is closer to the Census value-added index and the OBE series

TA
BL
E 4
FRB
and
OB
E I
ndex
es, P
oint
Spr
eads
and
Con
trib
utio
ns to
Tot
al M
anuf
actu
ring
Spr
ead
for1
964
100)
(con
tinue
d)
Poin
t Spr
eads
Poin
tC
ontr
ibut
ions
Due
toD
ue to
Mov
e-M
ove-
Tot
alm
ents
Wei
ghts
Tot
ala
mee
tsW
eigh
ts
Tot
al m
anuf
actu
ring
a2.
42.
7—
.32.
42.
7—
.3
Dur
able
s an
d no
ndur
able
sn.
a.n.
a.n.
a.2.
62.
7—
.1
Tw
o-di
git s
umC
,n.
a.n.
a.n.
a.2.
72.
70
Non
dura
ble
good
sa5.
03.
81.
22.
21.
7.5
Tw
o-di
git s
um0
n.a.
n.a.
n.a.
1.8
1.7
.1Fo
od a
nd k
indr
ed p
rodu
cts
4.6
4.7
—.1
.6.6
(*)
Tob
acco
man
ufac
ture
s1.
4—
.21.
6(*
)(*
)(*
)
Textile mill products
.2
.1
.1
(*)
(*)
(*)
App
arel
and
oth
er f
abri
cate
d te
xtile
pro
duct
s12
.612
.5.1
.5.5
(*)
Pape
r an
d al
lied
prod
ucts
—2.
8—
2.8
0—
.1—
.10
Prin
ting,
pub
lishi
ng, a
nd a
llied
indu
stri
es1.
51.
50
.1.1
0
Chemicals and
allie
d pr
oduc
ts14
.613
.9.7
1.1
1.0
.1Pe
trol
eum
ref
inin
g an
d re
late
d in
dust
ries
—20
.1—
18.8
—1.
3—
.5
Rub
ber
and
mis
cella
neou
s pl
astic
pro
duct
s6.
17.
5—
1.4
.2.2
(*)
Lea
ther
and
leat
her
prod
ucts
—5.
9—
5.8
—.1
— .1
— .1
(*)
t\) 00 C.,
TA
BL
E 4
(co
nclu
ded)
Poin
t Spr
eads
Poin
tC
ontr
ibut
ions
Due
toD
ueto
Mov
e-M
ove-
Tot
alm
ents
Wei
ghts
Tot
ala
men
tsW
eigh
ts
Dur
able
goo
dsa
.91.
9—
1.0
.41.
0—
.6
Tw
o-di
git s
umC
n.a.
n.a.
n.a.
.91.
0—
.1
Lum
ber
and
woo
d pr
oduc
ts, e
xcep
t fur
nitu
re—
11.1
9.7
—1.
4.3
.3(*
)
Furn
iture
and
fix
ture
s26
.026
.3—
.3.4
.4(*
)
Stone, clay, and glass products
4.0
4.4
—.4
.2
.2
(*)
Primary metal industries
17.3
18.0
—.7
1.5
1.6
—.1
Fabr
icat
ed m
etal
pro
duct
s7.
67.
3.3
.5.5
(*)
Mac
hine
ry, e
xcep
t ele
ctri
cal
8.4
8.7
—.3
.7.7
Ele
ctri
cal m
achi
nery
—10
.9—
12.5
1.6
—.8
—.9
.1
Tra
nspo
rtat
ion
equi
pmen
t and
ord
nanc
e, e
xcep
tm
otor
veh
icle
s.6
.8.2
(*)
(*)
(*)
Mot
or v
ehic
les
and
mot
or v
ehic
le e
quip
men
t—
31.9
—30
.9—
1.0
—1.
9—
1.8
—.1
Inst
rum
ents
9.0
8.7
.3.2
.2(*
)
Mis
cella
neou
s m
anuf
actu
ring
indu
stri
es22
.622
.60
.4.4
0
Not
e: T
he f
ollo
win
g sy
mbo
ls a
re u
sed
in th
is ta
ble:
*=
less
than
.05.
n.a.
not a
pplic
able
.Fo
r ot
her
abbr
evia
tions
see
not
e at
the
begi
nnin
g of
App
endi
x C
.se
ries
with
FR
B w
eigh
ts th
roug
hout
; GPO
ser
ies
with
GPO
wei
ghts
thro
ugho
ut.
bFR
B d
urab
le a
nd n
ondu
rabl
e se
ries
with
FR
B tw
o-di
git w
eigh
ts a
nd G
PO w
eigh
ts f
or d
urab
le a
nd n
ondu
rabl
ego
ods;
GPO
ser
ies
with
GPO
wei
ghts
thro
ugho
ut.
cFR
B s
erie
s w
ith tw
o-di
git G
PO w
eigh
ts a
nd F
RB
wei
ghts
with
in tw
o-di
gits
; GPO
ser
ies
with
GPO
wei
ghts
thro
ugho
ut.
C—
)
1k:

240 Basic Industry Product Estimates
is closer to the Census measure of total output (the gap between thesetwo Census measures is 5.5 points). For the apparel industry, whoserelative importance is about one-half that of the chemicals industry,the published 1964 FRB index exceeds both Census measures as wellas the OBE index. For both the chemicals and the apparel industry,the OBE and Census value-added series differ markedly and move inopposite directions.
If signs are ignored, the movement differences for durables areapproximately 7 points and not 1 point. About one-half of the absolutedifference of 7 points in movements within the durable group is
accounted by the indexes for primary metals (1.6 points) and formotor vehicles and equipment (1.8 point). For both of these industries,the 1964 published FRB indexes approximate the movement of totalCensus deflated output; and the OBE indexes, net output. About 26per cent of the difference occurs in four industries (SIC 32, 34, 35,39) where total and net output are approximately the same, but theFRB series is consistently higher than the OBE indexes. For the stone,clay, and glass products industry (SIC 32) the OBE index approximatesthe Census value-added figure. The gaps between the OBE and Censusvalue-added series for the remaining three industries approximate thesame magnitude as between the OBE and FRB series. About 16 percent of the difference for durables occurs in the lumber and electricalmachinery industries where Census net exceeds total output and theOBE series are higher than the FRB indexes. The 1964 OBE andCensus value-added indexes reflect about the same change from 1958for the lumber industry, but the electrical machinery figure for Censusvalue added is considerably higher than for the OBE series. Lastly,about 9 per cent of the gap is accounted for by two industries wherethe FRB exceeds OBE. For the furniture industry Census deflated netoutput is less than total output, and for instruments the converse istrue.
Comparison Between the OBE and Published FRB Series
The broad pattern of manufacturing output as reflected by the twomeasures has been similar during the postwar period (Chart 1). Assummarized in the table below (Table 5), both series exhibit a sharprate of increase from 1948 to 1953, a slower rate of gain until 1960,and a large percentage gain since 1960.

Comparison of FRB and OBE Measures of Output 241
CHART 1All Manufacturing Industries: OBE and FRB Indexes of Real Output,
1947—64
Despite these similarities, a larger growth rate is reflected by theFRI3 than by the OBE series. For 1948—64, the average annual growthfor manufacturing is 3.8 per cent according to GPO, and 4.2 per centbased on the FRB index. Approximately the same differences in trendsbetween the two series are indicated for the ten-year period, 1948—57,and for the eight-year period since 1957. Comparing the peak-to-peakyears of successive business cycles, the growth rates as measured byOBE indexes are less than those indicated by the FRB for all periods,except for the incomplete cycle period 19 60—64.
The indexes for the durable and nondurable goods industries alsoshow similar patterns but with some recent exceptions. During 1948—64,
Index (1958=100)150

242 Basic Industry Product Estimates
TABLE 5
Average Annual Percentage Change for Manufacturing Output forS elected Periods, OBE and FRB Indexes
Durable NondurableGoods Goods
Year and Series Total Industries Industries
1948—1964OBE 3.8 4.0 3.5FRB 4.2 4.4 4.1
1948—1957OBE 3.8 4.2 3.2FRB 4.3 5.0 3.7
1957—1964OBE 3.7 3.6 3.8FRB 4.0 3.6 4.6
1948—1953OBE 6.0 7.7 3.7FRB 6.1 8.3 3.8
1953—1957OBE 1.1 0.1 2.7FRB 2.1 1.0 3.7
1957—1960OBE 1.5 0.6 2.9FRB 2.6 1.4 4.2
19 60—. 19 64
OBE 5.4 6.0 4.5FRB 5.2 5.3 4.9
Note: Figures show the average annual compounded rate of changebetween the initial and terminal years of each period.
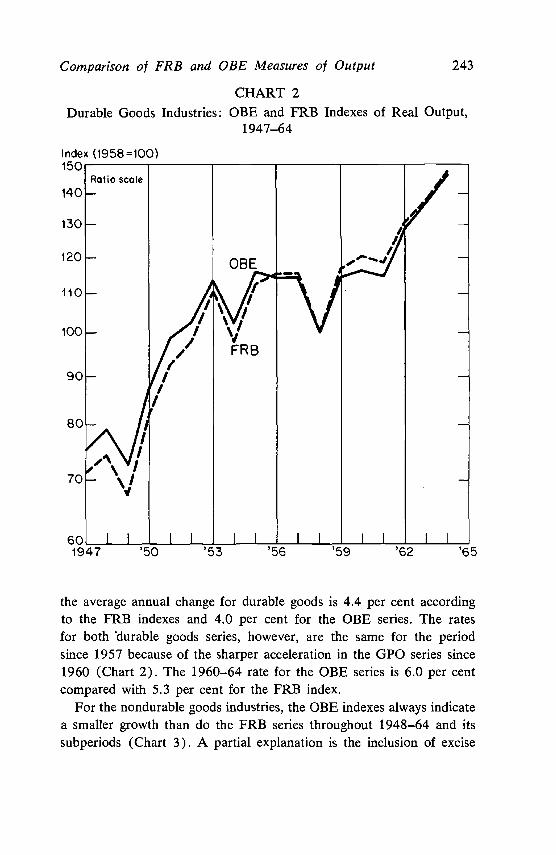
Comparison of FRB and OBE Measures of Output 243
CHART 2Durable Goods Industries: OBE and FRB Indexes of Real Output,
1947—64
Index (1958 =100)
the average annual change for durable goods is 4.4 per cent accordingto the FRB indexes and 4.0 per cent for the OBE series. The ratesfor both goods series, however, are the same for the periodsince 1957 because of the sharper acceleration in the GPO series since1960 (Chart 2). The 1960—64 rate for the OBE series is 6.0 per centcompared with 5.3 per cent for the FRB index.
For the nondurable goods industries, the OBE indexes always indicatea smaller growth than do the FRB series throughout 1948—64 and itssubperiods (Chart 3). A partial explanation is the inclusion of excise

244 Basic Industry Product Estimates
CHART 3Nondurable Goods Industries: OBE and FRB Indexes of Real Output,
1947—64
taxes in the OBE series, which gives added weight to the slower movingcomponents of the nondurable group. (See discussion below.)
The difference in growth rates between the FRB and OBE indexesfor durables is smaller than for the nondurables goods becausethe trend differences for industries within the former group are largelyoffsetting, but are not for the nondurables. Significantly higher growthrates occur in the FRB measures for the primary metals, and trans-portation equipment and ordnance, except motor vehicles industries,which in both the FRB and OBE series account for about 29 per centof the total for the durable goods industries (Table 6). However, these
Index (1958= 100)150

Comparison of FRB and OBE Measures of Output 245
TABLE 6Average Annual Percentage Change by Manufacturing industries
for Selected Periods, ORE and FRB Indexes
1948—64
OBE FRB1948—57
OBE FRB1957—64
OBE FRB
Total manufacturing 3.8 4.2 3.8 4.3 3.7 4.0
Nondurable goods 3.5 4.1 3.2 3.7 3.8 4.6Food and kindred products 2.5 2.6 2.7 2.2 2.1 3.2Tobacco manufactures 2.7 2.3 2.0 1.4 3.4 3.6
Textile mill products 1.7 1.9 0.2 0.7 3.6 3.5Apparel and other
fabricated textile products 2.6 3.5 2.0 2.5 3.4 4.8
Paper and allied products 4.5 4.7 4.3 4.6 4.7 4.8
Printing, publishing, andallied industries 3.1 3.3 3.4 3.4 2.8 3.2
Chemicals and alliedproducts 6.9 8.2 7..7 8.6 5.9 7.8
Petroleum refining andrelated industries 4.4 3.7 3.7 4.2 5.3 3.0
Rubber and miscellaneousplastic products 4.3 6.5 2.8 6.1 6.3 7.0
Leather and leather products —0.3 0.9 —1.3 1.3 0.9 0.5
Durable goods 4.0 4.4 4.2 5.0 3.6 3.6Lumber and wood products,
except furniture 1.8 1.3 0.2 0.5 3.8 2.3Furniture and fixtures 2.5 4.6 2.6 3.6 2.3 5.8
Stone, clay, and glass
products 3.3 3.6 3.0 3.6 3.7 3.6Primary metal industries 1.2 2.0 2.0 1.9 0.2 2.0
Fabricated metal products 3.6 3.4 3.8 3.1 33 3.9
Machinery, except electrical 3.2 3.7 2.6 3.4 3.9 4.2
Electrical machinery 6.9 6.3 6.8 7.4 6.9 4.8Transportation equipment
and ordnance, exceptmotor vehicles 7.9 10.3 12.5 17.3 2.2 1.9
Motor vehicles and motorvehicle equipment 5.3 4.4 5.0 4.1 5.7 4.8
Instruments 5.8 5.8 6.8 6.6 4.6 4.8Miscellaneous manufacturing
industries 2.2 2.9 2.0 1.7 2.4 4.4
Note: Figures show average annual compounded rate of changebetween the initial and terminal years of each period.
246 Basic industry Product Estimates
TABLE 7
Frequency Distribution of Number of Manufacturing Industriesby Size of Average Annual Rate of Change, 1948—64
Number of Industries
OBE FRBPercentage Change Series Series
Negative 1 0
0—0.9 0 1
1—1.9 3 2
2—2.9 5 4
3—3.9 4 6
4—4.9 3 3
5—5.9 2 1
6 or higher 4
are offset by higher growth rates in the OBE series for the electricalmachinery, motor vehicles and equipment, and lumber industries which,in aggregate, account for about 27 per cent of the group total for boththe FRB and OBE series. For the nondurable goods industries the1948—64 growth rates as measured by the FRB indexes are higher foralmost all of the industries within this group.
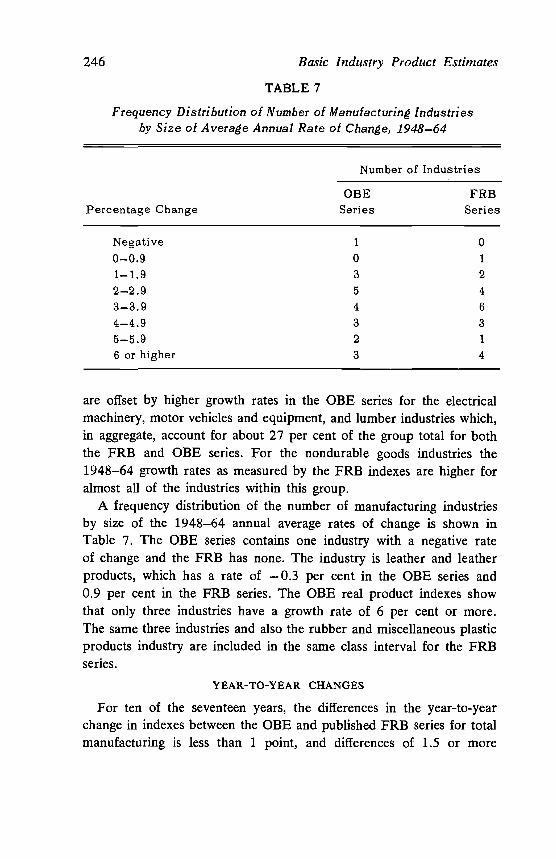
A frequency distribution of the number of manufacturing industriesby size of the 1948—64 annual average rates of change is shown inTable 7. The OBE series contains one industry with a negative rateof change and the FRB has none. The industry is leather and leatherproducts, which has a rate of —0.3 per cent in the OBE series and0.9 per cent in the FRB series. The OBE real product indexes showthat only three industries have a growth rate of 6 per cent or more.The same three industries and also the rubber and miscellaneous plasticproducts industry are included in the same class interval for the FRBseries.
YEAR-TO-YEAR CHANGES
For ten of the seventeen years, the differences in the year-to-yearchange in indexes between the OBE and published FRB series for totalmanufacturing is less than 1 point, and differences of 1.5 or more

Comparison of FRB and OBE Measures of Output 247
TABLE 8
Frequency Distribution of Number of Years: Point Differencesin Year-to-Year Chanées Between the FRB and OBE Indexes, 1947-64
PointDifferences
All ManufacturingIndustries
Durable GoodsIndustries
NonGoods
durableIndustries
Under 0.5 5 5 4
0.5—0.9 5 1 5
1.0—1.4 3 1 2
1.5—1.9 1 5 4
2.0—2.4 2 3 2
Over2.5 1 2 0
Total 17 17 17
between the indexes occur only for four periods—1950—51, 1951—52,1955—56, 1961—62. Larger differences appear among the durables thanthe nondurables. The number of years for which the indexes differby 1.5 points or more is ten for durable and six for the nondurables.
The 1951 OBE index for total manufacturing is 10.2 per cent higherand the FRB index 8.1 per cent higher than the respective 1950 figures.For the durable goods industries the percentage changes are 13.7per cent for OBE and 12.7 per cent for the FRB series. However,for the nondurable goods industries the 1951 OBE index is 5.6 per centhigher and the FRB index 3.3 per cent higher than the respective 1950figures. The larger FRB-OBE gap for the nondurable industries stemslargely from diverse movements between total and net output andbetween the Census value-added and OBE series. Such differences inthe annual changes are particularly significant in the tobacco, textiles,chemicals, rubber, and leather and leather products industries, whichare also characterized by relatively large changes in the inventoryvaluation adjustment.
The FRB indexes show higher annual percentage changes in 1952compared with 1951 for both durable nondurable goods industries.In the durable goods industries, this difference largely disappears ifGPO weights are substituted for the FRB weights in the FRB series.In the nondurable goods industries weighting is less important, and

248 Basic Industry Product Estimates
the differences stem primarily from the diverse annual movementsoccurring in the apparel, paper, chemicals, and rubber industries.
The difference in the FRB-OBE percentage change from 1955 to1956 for total manufacturing is largely due to the diverse movementsfor the durable goods industries. The FRB index for this group increased2.1 per cent and the OBE index declined 1.6 per cent. This differenceis caused primarily by the larger decline in the indexes for the motorvehicle and equipment industry (SIC 371) as measured by the OBEindexes than by the FRB indexes. The relatively large differences inthe year-to-year movements in the indexes for total manufacturingfrom 1961 to 1962 again stem from the relative size of the changesin the OBE and FRB indexes for Industry 371.
Differences due to weighting for year-to-year changes are moresignificant in the earlier than the more recent years of the periodreviewed. Generally, from 1947 through 1952 reweighting the FRBseries by GPO weights brings the annual changes for this series closerto those reflected by the OBE series (Tables 9—11). With some excep-tions, this is not true for the years since 1957.
While a portion of the dissimilarities in year-to-year movements be-tween the FRB and OBE indexes arises from the diverse movementsbetween gross and net output, these differences are relatively small fortotal durable and nondurable manufacturing industries. In addition,only a small amount of the differences for these groups is explainedby the disparities in year-to-year changes between the current-dollarseries for Census value added and gross product originating. Differencesdue to these factors for individual industries, however, are large; andare discussed below for selected industries.
DIFFERENCES DUE TO WEIGHTS
The effect of weighting differences on the growth rates for the 1948—64 period and for the two major subperiods is summarized below. Thecomparisons include a measure of the differences which result whenthe FRB indexes are weighted by 1958 GPO weights as well as whenthese indexes are recalculated with total-output rather than net-outputweights.
Only a small portion of the FRB-OBE differences in the 1948—64annual growth rates for total manufacturing is due to value-added

TA
BL
E 9
Sele
cted
Mea
sure
s of
Man
ufac
turi
ng A
ctiv
ity, A
llM
anuf
actu
ring
Ind
ustr
ies,
194
7—64
Inde
xes
(195
8 =
100)
Poin
t Dif
fere
nce
s In
Inde
xesa
Tot
al(F
RB
Min
us
FRB
Tot
al(N
etO
utpu
tM
inus
(Qua
ntity
Gro
ssM
inus
Tot
alM
inus
Net
Exc
ise
Net
Out
put
(Cen
sus
Min
us
FRB
Def
late
d C
ensu
sD
ata
OB
EG
ross
Prod
uct
As
Rew
hted
eig
Cos
tV
APl
usPu
b.G
POV
PV
PM
at.
VA
Exc
ise
OB
E)
Wtd
.)D
efltd
.)O
utpu
tT
axO
BE
)Y
ear
(1)
(2)
(3)
(4)
(5)
(6)
(7)
(8)
(9)
(10)
(11)
(12)
(13)
(14)
1947
71.2
73.1
73.7
75.7
75.6
75.8
76.2
74.2
—3.0
—2.5
—2.0
—.1
—.4
2.0
1948
73.9
75.5
76.1
77.8
—3.9
—2.2
1949
69.8
71.0
72.2
73.4
76.7
69.3
70.2
73.5
—3.7
—2.4
—1.2
4.1
—.9
—3.3
1950
81.3
82.8
83.3
83.9
83.8
84.0
84.6
85.3
—4.
0—
2.0
—.6
—.1
—.6
—.7
1951
87.9
89.8
89.5
90.7
89.4
92.2
92.4
93.9
—6.0
—1.6
—1.2
—1.5
—.2
—1.
5
1952
91.4
92.2
91.7
94.1
94.0
94.2
94.1
96.0
—4.
6—
.3—
2.4
—.1
.1—
1.9
1953
99.5
101.0
99.8
103.7 104.0
103.3
103.1
104.0
—4.5
—.3
—3.9
.4
.2
—.9
1954
92.6
93.3
93.1
94.9
95.5
94.2
94.1
96.6
—4.
0—
.5—
1.8
.7.1
—2.
5
1955
104.4
105.9
105.6
107.0 107.6
106.2
106.1
108.0
—3.6
—1.2
—1.4
.8
.1
—1.9
1956
107.5
108.3
107.6
108.3 107.9
108.8
108.5
108.4
—.9
—.1
—.7
—.5
.3
.1
1957
108.2
108.7
107.9
107.8 107.6
108.2
107.9
108.8
—.6
.3
.1
—.4
.3
—.9
1958
100.0
100.0
100.0
100.0 100.0
100.0
100.0
100.0
.0
.0
.0
.0
.0
.0
1959
113.7
114.1
113.4
111.3 110.4
112.6
112.4
112.4
1.3
.3
2.1
—1.3
.2
.0
1960
116.8
117.3
116.6
113.3 113.0
113.7
113.7
113.9
2.9
.2
3.3
—.4
.0
—.2
1961
117.6
117.6
117.1
113.2 113.2
113.2
113.2
113.5
4.1
.5
3.9
.0
.0
—.3
1962
127.4
127.5
126.4
122.5 121.4
123.9
123.6
125.0
2.4
1.0
3.9
—1.4
.3
—1.4
1963
134.0
134.2
133.0
128.8 126.5
131.7
131.5
131.3
2.7
1.0
4.2
—2.9
.2
.2
1964
142.
814
3.1
141.
313
6.6
134.
014
0.0
139.
514
0.4
2.4
1.5
4.7
—3.
4.5
—.9
Not
e: V
Pva
lue
of p
rodu
ctio
n; V
A =
valu
ead
ded.
Fo
r ot
her
abbr
evia
tions
see
not
e at
the
begi
nnin
g=
col.
1 —
col.
8; c
ol. 1
0 =
col.
1 —
col.
3; c
ol. 1
1 =
col.
3 —
col.4
;co
l. 12
=co
l.4
—co
l.6;
col.
7; c
ol. 1
4 =
col.
7 —
col.
8.
of A
ppen
dix
C.
col.
13 =
cal.
6 —

TA
BL
E 1
00
Sel
ecte
dM
easu
res
of M
anuf
actu
ring
Act
ivity
, Non
dura
ble
Goo
ds I
ndus
trie
s, 1
947—
64
dexe
s (1
958
=10
0)Po
int D
iffe
renc
es I
n In
dexe
saIn
FRB
Tot
al(N
et(F
RB
Min
usM
inus
Gro
ssO
BE
)W
td.)
Tot
alO
utpu
t(Q
uant
ityM
inus
Def
ltd.)
Tot
alM
inus
Net
Out
put
Exc
ise
Tax
Net
Out
put
(Cen
sus
Min
usO
BE
)
FRB
Def
late
d C
ensu
sD
ata
OB
EG
ross
Prod
uct
As
Pub.
Rew
eigh
ted
Cos
tV
PM
at.
VA
VA
Plus
Exc
ise
GPO
VP
Yea
r(1
)(2
)(3
)(4
)(5
)(6
)(7
)(8
)(9
)(1
0)(1
1)(1
2)(1
3)(1
4)
1947
69.4
72.0
73.0
73.2
72.9
73.7
74.6
73.0
—3.
6—
3.6
—.2
—.5
—.9
1.6
1948
71.8
73.7
74.3
76.4
—4.
6—
2.5
1949
70.6
72.3
73.2
74.1
75.8
71.6
72.6
74.8
—4.
2—
2.6
—.9
2.5
—1.
0—
2.2
1950
78.5
80.0
80.1
80.1
78.4
82.8
83.4
82.8
—4.
3—
1.6
.0—
2.7
—.6
.619
5181
.182
.683
.083
.181
.885
.185
.587
.4—
6.3
—1.
9—
.1—
2.0
—.4
—1.
9
1952
82.6
83.7
84.9
85.0
85.8
83.8
84.6
87.4
—4.
8—
2.3
—.1
1.2
—.8
—2.
819
5386
.487
.087
.889
.088
.290
.290
.591
.5—
5.1
—1.
4—
1.2
—1.
2—
.3—
1.0
1954
86.4
86.7
87.8
88.3
88.5
88.1
88.3
89.3
—2.
9—
1.4
—.5
.2—
.2—
1.0
1955
94.6
94.7
95.6
96.1
95.9
96.5
96.4
97.8
—3.
2—
1.0
—.5
—.4
.1—
1.4
1956
98.6
98.6
99.4
100.
399
.710
1.0
100.
810
1.1
—2.
5—
.8—
..9—
.7.2
—.3
1957
99.9
99.7
99.9
100.
699
.310
2.6
102.
110
1.7
—1.
8.0
—.7
—2.
0.5
.419
5810
0.0
100.
010
0.0
100.
0 10
0.0
100.
010
0.0
100.
0.0
.0.0
.0.0
.019
5911
0.0
109.
910
9.4
108.
3 10
7.5
109.
710
9.1
109.
2.8
.61.
1—
1.4
.6—
.1
1960
113.
111
2.8
112.
011
0.2
109.
511
1.4
110.
911
0.9
2.2
1.1
1.8
—1.
2.5
.019
6111
6.6
116.
311
5.4
112.
6 11
2.5
112.
711
2.4
112.
34.
31.
22.
8—
.1.3
.119
6212
3.8
123.
012
1.5
118.
5 11
7.6
120.
011
9.2
119.
64.
22.
33.
0—
1.5
.8—
.4
1963
129.
412
8.5
126.
712
3.6
121.
812
6.4
125.
412
3.7
5.7
2.7
3.1
—2.
81.
01.
719
6413
7.0
135.
813
3.4
130.
9 12
8.2
135.
01.
33.5
132.
05.
03.
62.
5—
4.1
1.5
1.5
Not
e: V
Pva
lue
of p
rodu
ctio
n; V
A =
valu
ead
ded.
For
oth
er a
bbre
viat
ions
see
not
e at
the
begi
nnin
g of
App
endi
x C
.ac
ol 9
col.
1 —
col.
8; c
ol. 1
0 =
col.
I —
col.
3; c
ol. 1
1 =
col.
3 —
col.
4; c
ol. 1
2 =
col.
4 —
col.
6; c
ol. 1
3 =
col.
6 —
col.
7; c
ol. 1
4 =
col.
7 —
col.
8.

TA
BL
E 1
1Se
lect
ed M
easu
res
of M
anuf
actu
ring
Act
ivity
, Dur
able
Goo
ds I
ndus
trie
s, 1
94
7—64
dexe
s (1
958
=10
0)Po
int D
iffe
renc
es I
n In
dexe
saIn
Tot
al(F
RB
Min
usO
BE
)
FRB
(Net
Min
usG
ross
Wtd
.)
Tot
alO
utpu
t(Q
uant
ityM
inus
Def
ltd.)
Tot
alM
inus
Net
Out
put
Exc
ise
Tax
Net
Out
put
(Cen
sus
Min
usO
BE
)
FRB
Def
late
d C
ensu
s D
ata
OB
EG
ross
Prod
uct
As
Rew
eigh
ted
VA
Cos
tPl
usV
PM
at.
VA
Exc
ise
Pub.
GPO
VP
Yea
r(1
)(2
)(3
)(4
)(5
)(6
)(7
)(8
)(9
)(1
0)(1
1)(1
2)(1
3)(1
4)
1947
71.2
73.9
74.5
78.2
78.9
77.5
77.5
75.2
—4.
0—
3.3
—3.
7.7
.02.
319
4874
.276
.977
.878
.9—
4.7
—3.
6
1949
67.4
70.0
71.3
72.7
77.7
67.5
68.0
72.5
—5.
1—
3.9
—1.
45.
2—
.5—
4.5
1950
82.1
84.9
86.6
87.7
90.3
85.0
85.6
87.3
—5.
2—
4.5
—1.
12.
7—
.6—
1.7
1951
92.5
95.4
96.1
98.3
98.5
98.0
98.4
99.0
—6.
5—
3.6
—2.
2.3
—.4
—.6
1952
98.0
98.7
98.5
103.
3 10
3.9
102.
6 10
2.5
102.
6—
4.6
—.5
—4.
8.7
.1—
.1
1953
110.
611
1.8
112.
111
8.5
123.
011
3.9
114.
111
3.7
—3.
1—
1.5
—6.
44.
6—
.2.4
1954
97.9
98.3
98.5
101.
6 10
3.9
99.1
99.3
102.
2—
4.3
—.6
—3.
12.
5—
.2—
2.9
1955
112.
811
4.5
115.
711
7.9
121.
711
3.9
114.
711
5.9
—3.
1—
2.9
—2.
24.
0—
.8—
1.2
1956
115.
211
5.7
115.
911
6.3
117.
611
5.1
115.
211
4.1
1.1
—.7
—.4
1.2
—.1
1,1
1957
115.
211
5.7
116.
111
5.1
117.
411
2.7
113.
011
4.3
.9—
.91.
02.
4—
.3—
1.3
1958
100.
010
0.0
100.
010
0.0
100.
010
0.0
100.
010
0.0
.0.0
.0.0
.0.0
1959
116.
911
7.4
117.
511
4.4
113.
911
5.0
115.
211
4.8
2.1
—.6
3.1
—.6
—.2
.4
1960
120.
212
0.7
121.
211
6.4
117.
211
5.7
116.
111
6.3
3.9
—1.
04.
8.7
—.4
—.2
1961
118.
511
8.7
118.
811
3.8
113.
911
3.7
113.
911
4.5
4.0
—.3
5.0
.1—
.2—
.6
1962
130.
613
0.9
131.
412
6.5
126.
012
7.1
127.
612
9.2
1.4
—.8
4.9
—.6
—.5
—1.
6
1963
137.
913
8.7
139.
313
4.0
132.
113
6.1
136.
813
7.3
.6—
1.4
5.3
—2.
1—
.7—
.5
1964
147.
814
8.8
149.
414
2.4
140.
814
4.1
144.
914
6.9
.9—
1.6
7.0
—1.
7—
.8—
2.0
Not
e: V
P =
valu
eof
pro
duct
ion;
VA
=va
lue
adde
d. F
or o
ther
abb
revi
atio
ns s
ee n
ote
at th
e be
ginn
ing
of A
ppen
dix
C.
acol
9co
l. 1
—co
l.8;
col
. 10
=co
l.I
—co
l.3;
col
. 11
=co
l.3
—co
l.4;
col
. 12
Co1
. 4 —
aol.
6; c
oi. 1
3 =
col.
6 —
col.
7; c
ol. 1
4ao
l. 7
—co
l.8.

252 Basic industry Product Estimates
TABLE 12
Point Differences in Trends Between Published and ReweightedFRB and OBE Indexes
Durable Nondurable. Goods Goods
Year and Series Total Industries Industries
1948—64Pub. FRB minus OBE 0.4 0.4 0.6FRB rewtd. GPO minus OBE 0.3 0.2 0.4FRB rewtd. VP minus OBE 0.1 0.2 0.2Pub. minus FRB rewtd. GPO 0.1 0.2 0.2Pub. minus FRB rewtd. VP 0.3 0.2 0.4
1948—57
Pub. FRB minus OBE 0.5 0.8 0.5FRB rewtd. GPO minus OBE 0.3 0.4 0.2FRB rewtd. VP minus OBE 0.2 0.3 0.1Pub. minus FRB rewtd. GPO 0.2 0.4 0.3Pub. minus FRB rewtd. VP 0.3 0.5 0.4
1957—64Pub. FRB minus OBE 0.3 0.0 0.8FRB rewtd. GPO minus OBE 0.3 0.1 0.7FRB rewtd. VP minus OBE 0.2 0.1 0.4Pub. minus FRB rewtd. GPO 0.0 0.1 0.1Pub. minus FRB rewtd. VP 0.1 0.1 0.4
Note: VP value of production. For other abbreviations see noteat the beginning of Appendix C.
weights.11 However, when the FRB indexes are reweighted by the 1958Census value of production the spread in the growth rates for 1948—64and for the two subperiods is sizeably reduced. For 1948—64, the dif-ference in growth rates between the OBE series and the FRB indexes
11 However, if 1947 is used as the initial year, the trend differences betweenthe OBE and the FRB series reweighted by 1958 GPO weights are halved for theperiod, as a whole, and the gap between the 1947—57 growth rates for the twoseries is substantially reduced.

Comparison of FRB and OBE Measures of Output 253
reweighted by value of production is only 0.1 point rather than 0.4points because of the closer relationship in trends for the nondurablegoods industries.
In contrast with the impact on the total indexes, differences due toweighting in the 1948—64 trends are more important for the durablesthan for the nondurable goods industries. For this period when the FRBindexes are reweighted by the 1958 GPO, the differences for thedurables are halved; for the nondurables, these are reduced by one-third.On the other hand, the influence of total-output weights is more pro-nounced on the spreads for the nondurables.
DIFFERENCES IN REAL TOTAL OUTPUT AS MEASUREDBY QUANTITY OR BY DEFLATION
As previously indicated and described in detail in Appendix A, themeasures that the FRB uses to estimate output are based on a countof quantities produced, or proxies of such counts. In recent years theprincipal proxy has been man-hours adjusted for changes in produc-tivity. In the OBE series the derivation of total output is by deflation.
To measure differences between the two methods, the detailed FRBindexes used for manufacturing were weighted by appropriate 1958Census production data and recalculated for 1947—64. Trends for1947—64 (there are no 1948 Census data) based on these reweightedFRB series and corresponding Census measures appear in Table 13below.
For 1947—64, the trends for the reweighted FRB series are higherthan for the deflated Census value of production data for total manu-facturing and for the subgroups. The point differences in the 1947—64trends between the reweighted FRB and Census value of total produc-tion indexes for total manufacturing is 0.4 points. Differences in outputfor the durables are 0.6, and 0.2 points for the nondurables.
The 1947—64 trends for fourteen of the twenty-one manufacturingindustries also show that the reweighted FRB series grows faster thanthe deflated Census VP series. Of the remaining seven industries, thedeflated Census series grows faster for five, and the trends are identicalfor two industries.
For 1957—64, the growth of the FRB series is substantially larger(2.0 points or more) in apparel, furniture, and transportation equipmentand ordnance, except motor vehicles; and substantially smaller for elec-

rn
TA
BL
E 1
3
Tre
nds
in T
otal
Out
put f
orM
anuf
actu
ring:
FRB
Ind
exes
Wei
ghte
d by
195
8 C
ensu
s V
alue
of
Prod
uctio
nan
d In
dexe
s of
Def
late
d C
ensu
s V
alue
of
Tot
al P
rodu
ctio
n, 1
947—
64, 1
94 7
—57
, 195
7—
64
SIC
Num
ber
Indu
stry
FRB
Wtd
.1947
—64
Def
late
dC
ensu
sFR
BW
td.19
47—
57
Def
late
dC
ensu
s
1957
—64
FRB
Def
late
dW
td.
Cen
sus
Man
ufac
turi
ng3.
93.
53.
93.
63.
93.
4
Non
dura
ble
good
s3.
63.
53.
23.
24.
23.
8
20Fo
od a
nd k
indr
ed p
rodu
cts
21T
obac
co m
anuf
actu
res
22T
extil
e m
ill p
rodu
cts
23an
doth
erfa
bric
ated
text
ilepr
oduc
ts26
Pape
r an
d al
lied
prod
ucts
27Pr
intin
g, p
ublis
hing
, and
alli
ed in
dust
ries
28C
hem
ical
s an
d al
lied
prod
ucts
29Pe
trol
eum
ref
inin
g an
d re
late
d in
dust
ries
30R
ubbe
r an
dmis
cella
neou
spla
stic
pro
duct
s31
Lea
ther
and
leat
her
prod
ucts
2.4
2.1
2.1
3.6
4.5
3.6
7.9
3.8
5.6
0.5
2.6
1.4
3.2
2.9
4.0
3.1
6.7
4.1
4.4
—0.
1
1.9
1.7
1.2
2.7
4.3
3.8
8.1
4.5
4.4
0.5
2.4
0.3
2.2
3.1
3.8
3.0
7.0
4.8
2.9
—0.
2
3.1
2.6
3.5
4.9
4.9
3.2
7.6
2.8
7.3
0.4
3.0
2.9
4.5
2.7
4.2
3.3
6.3
3.1
6.6
0.1
(con
tinue
d)

TA
BL
E 1
3 (c
oncl
uded
)
SIC
1947
—64
1947
—57
1957
—64
FRB
Def
late
dFR
BD
efla
ted
FRB
Def
late
dN
umbe
rIn
dust
ryW
td.
Cen
sus
Wtd
.C
ensu
sW
td.
Cen
sus
Dur
able
goo
ds4.
23.
64.
53.
93.
73.
1
24L
umbe
r ar
id w
oodp
rodu
ct.s
, exc
ept
furn
iture
1.6
1.9
1.0
1.0
2.5
3.3
25
Furniture and fixtures
4.6
3.2
3.6
3.3
5.9
3.0
32
Stone, clay, and glass products
4.3
4.3
4.6
4.8
3.8
3.6
33
Primary metal industries
2.3
1.8
2.4
1.8
2.1
1.7
34
Fabricated metal products
3.4
2.8
3.1
3.1
3.8
2.3
35
Machinery, except electrical
3.6
2.7
3.2
2.3
4.3
3.4
36
Electrical machinery
5.9
5.9
6.9
4.9
4.6
6.5
37+
19-3
71T
rans
port
. equ
ip. a
nd o
rd.,
exce
ptm
otor
veh
.9.
27.
114
.712
.91.
9—
0.7
371
Mot
or v
ehic
les
and
equi
pmen
t4.
74.
34.
74.
54.
84.
038
Inst
rum
ents
5.6
5.5
6.1
4.8
4.8
6.5
39M
isce
llane
ous
man
ufac
turi
ng in
dust
ries
3.1
3.2
2.2
2.2
4.4
4.7
0 (Ji
(11

256 Basic Industry Product Estimates
trical machinery. For all of these industries, except apparel, the FRBmeasures the quantity of output entirely or principally by the proxy,man-hours adjusted for productivity. For the eight industries wherethe 1957—64 trend differences are small (0.5 points or less) three aremeasured only by quantity measures and one only by man-hours. Ofthe remaining four industries, about 75 per cent of the output for theleather and rubber industries; 57 per cent for foods; and about 30per cent of the output for the printing and publishing, and stone, clay,and glass products industries are measured by quantity measures.
013E, FRB, and Census Measures of Net Output
In the discussion above, the FRB indexes reweighted by 1958 Censusproduction data and corresponding deflated Census totals were com-pared to determine differences in total output when measured byquantity or by deflation. In this section the OBE and published FRBindexes are compared with Census measures of net output. When theOBE series are compared with Census value added, the latter have beenadjusted to include federal excise taxes. Thus these two series arecomparable.
The relationship between the OBE and Census data reflects differ-ences or similarities in the underlying measures of net output in currentdollars. The FRB-Census differences reflect the patterns of change inthe underlying real-total-output measures as discussed above.
Differences in growth rates between Census value of production(VP) and value added (VA) for total manufacturing, durables, andnondurables are relatively small for 1947—64 and 1947—57. For the1957—64 period the trend differences are relatively large for the durablegoods industries, and this difference is also reflected in the figures fortotal manufacturing (Table 14).
From 1947 to 1957 both the OBE and FRB measures of outputshow larger increases than the Census value-added series. However, thegap between the FRB and Census is substantially larger for total man-ufacturing and for the durable goods industries than the OBE-Censusgrowth rate differences. Since 1957, the OBE and Census value-addedseries have shown about the same rate of gain. On the other hand, theFRB growth rate for nondurables is considerably larger than the Censusvalue-added rate.
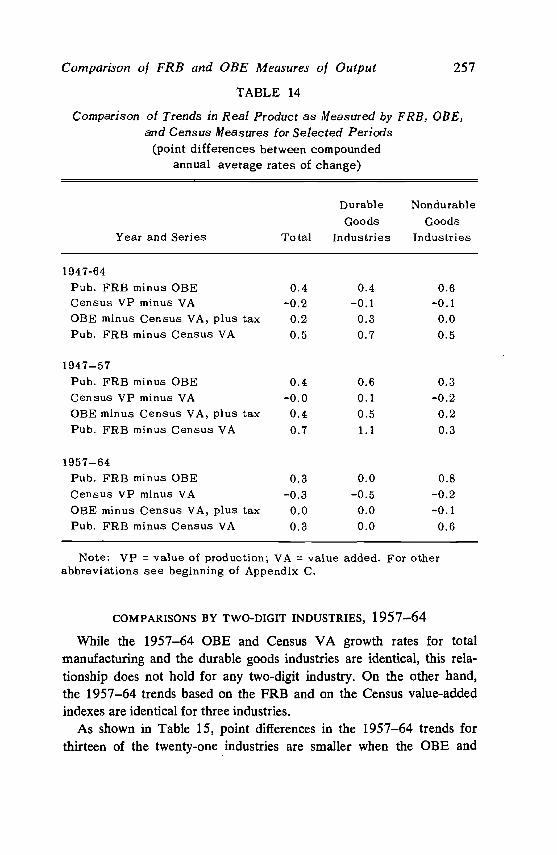
Comparison of FRB and OBE Measures of Output 257
TABLE 14
Comparison of Trends in Real Product as Measured by FRB, ORE,and Census Measures for Selected Periods
(point differences between compoundedannual average rates of change)
Year and Series Total
DurableGoods
Industries
NondurableGoods
Industries
1947-64Pub. FRB minus OBE 0.4 0.4 0.6Census VP minus VA —0.2 -0.1 -0.1OBE minus Census VA, plus tax 0.2 0.3 0.0Pub. FRB minus Census VA 0.5 0.7 0.5
1947—57Pub. FRB minus OBE 0.4 0.6 0.3Census VP minus VA —0.0 0.1 —0.2
OBE minus Census VA, plus tax 0.4 0.5 0.2Pub. FRB minus Census VA 0.7 1.1 0.3
1957—64Pub. FRB minus OBE 0.3 0.0 0.8Census VP minus VA —0.3 —0.5 —0.2
OBE minus Census VA, plus tax 0.0 0.0 —0.1
Pub. FRB minus Census VA 0.3 0.0 0.6
Note: VP value of production; VA = value added. For otherabbreviations see beginning of Appendix C.
COMPARISONS BY TWO-DIGIT INDUSTRIES, 1957—64
While the 1957—64 OBE and Census VA growth rates for totalmanufacturing and the durable goods industries are identical, this rela-tionship does not hold for any two-digit industry. On the other hand,the 1957—64 trends based on the FRB and on the Census value-addedindexes are identical for three industries.
As shown in Table 15, point differences in the 1957—64 trends forthirteen of the twenty-one industries are smaller when the OBE and

258 Basic industry Product Estimates
Census value-added series are compared than for the FRB and Censusvalue-added series. The largest disparity occurs for the petroleum refin-ing industry, which has a 3.0 per cent growth rate for 1957—64 accordingto the FRB indexes and a 7.7 per cent rate based on Census deflatedvalue added. The largest gap between the OBE and Census value-added measures occurs for the instrument industry, which has a 2.5point higher growth rate according to the Census measure. More rapidgrowth is shown for only eight industries (SIC 22, 24, 29, 31, 32, 36,371, and (37 + 19 — 371)) by the OBE measures, when comparedwith the FRB series. For five of these industries, the 1957—64 averageannual rate of change for the Census value-added series is higher thanfor the corresponding Census value-of-production series; for one in-dustry, Census net and gross output trends are identical; and for twoindustries, Census total output is higher than value added.
Comparison by industry
In this section, the principal reasons for differences in the OBE andFRB measures of output for two-digit (SIC) manufacturing industriesare summarized. While data for all two-digit SIC industries are shown(see Appendix C), only selected industries are discussed below.'2 Theseindustries illustrate more specifically the principal conditions causingvariations between the FRB and OBE series in trends or year-to-yearmovements.
Disparities in the FRB and OBE trends for some industries and forsome periods are related primarily to different movements in total andnet output as reflected by the Census measures. Changes in the ratioof value added per unit of output have occurred because the composi-tion of the products produced by an industry over time has changedand the FRB series selected to measure the industry output did notreflect this change. This is illustrated by the varying proportions ofmetal to wooden furniture produced by the household furniture in-dustry (SIC 251), which is described below. Significant changes inproduct composition even within product groupings (radios, TV's,freezers, communications equipment, etc.) for the electrical machinery
12 Discussions for all two-digit SIC manufacturing industries are availableupon request to the Office of Business Economics, U.S. Department of Com-merce, Washington, D.C. 20035.

TA
BL
E 1
5
Com
pari
son
of T
rend
s in
Rea
l Pro
duct
as
Mea
sure
d by
FR
B, O
BE
, and
Cen
sus
Mea
sure
s,by
Indu
stri
es, 1
95 7
—64
(poi
nt d
iffe
renc
es b
etw
een
com
poun
ded
annu
al a
vera
ge r
ates
of
chan
ge)
Cen
sus
OB
EPu
b.P
ub.
VP
Min
usFR
BFR
BM
inus
Cen
sus
Min
usSI
CM
inus
Cen
sus
VA
Plu
sC
ensu
sN
umbe
rO
BE
VA
Tax
VA
0T
otal
man
ufac
turi
ng0.
3—
0.3
0.0
0.3
Non
dura
ble
good
s0.
8—
0.2
—0.
10.
6n
20Fo
od a
nd k
indr
ed p
rodu
cts
1.1
1.5
0.4
1.7
21T
obac
co m
anuf
actu
res
0.2
—0.
80.
2—
0.1
22T
extil
e m
ill p
rodu
cts
—0.
10.
6—
0.3
—0.
4
23A
ppar
el a
nd o
ther
fab
rica
ted
text
ile p
rodu
cts
1.4
—0.
00.
72.
10
26Pa
per
and
allie
d pr
oduc
ts0.
1—
0.6
—0.
10.
027
Prin
ting,
pub
lishi
ng, a
nd a
llied
indu
stri
es0.
40.
4—
0. 1
0.3
28C
hem
ical
s an
d al
lied
prod
ucts
1.9
—0.
7—
1.1
0.8
29Pe
trol
eum
ref
inin
g an
d re
late
d in
dust
ries
—2.
3—
4.6
—0.
74.
720
Rub
ber
and
mis
cella
neou
s pl
astic
pro
duct
s0.
70.
0—
0.1
0.4
31L
eath
er a
nd le
athe
r pr
oduc
ts—
0.4
—0.
40.
40.
0
(con
tinue
d)

Cen
sus
OB
EPu
b.Pu
b.V
PM
inus
FRB
FRB
Min
usC
ensu
sM
inus
SIC
Min
usC
ensu
sV
A P
lus
Cen
sus
Num
ber
OB
EV
AT
axV
A
Dur
able
goo
ds0.
0-0
.50.
00.
0
24L
umbe
r an
d w
ood
prod
., ex
cept
fur
nitu
re—
1.5
0.0
0.5
—1.
0
25Fu
rnitu
re a
nd f
ixtu
res
3.5
0.8
0.1
3.6
32St
one,
cla
y, a
nd g
lass
pro
duct
s—
0.1
0.1
0.2
0.1
33Pr
imar
y m
etal
indu
stri
es1.
80.
8—
0.7
1.1
34Fa
bric
ated
met
al p
rodu
cts
0.6
0.0
1.0
1.6
35M
achi
nery
, exc
ept e
lect
rica
l0.
30.
00.
50.
836
Ele
ctri
cal m
achi
nery
—2.
1—
1.3
—0.
8—
3.0
37-3
71+
19
371
Tra
nspo
rtat
ion
equi
pmen
t and
ord
nanc
e,ex
cept
mot
or v
ehic
les
Mot
or v
ehic
les
and
mot
or v
ehic
le e
quip
men
t—
0.3
—0.
9
—1.
6
—1.
5
1.3
0.3
1.0
—0.
7
38In
stru
men
ts0.
2—
0.6
—2.
5—
2.3
39M
isce
llane
ous
man
ufac
turi
ng in
dust
ries
2.0
0.3
—2.
00.
0
TA
BL
E 1
5 (c
oncl
uded
)
Not
e: V
Ava
lue
adde
d; V
P =
Val
ueof
pro
duct
ion.
For
oth
er a
bbre
viat
ions
see
not
e at
the
begi
nnin
g of
App
endi
x C
.

Comparison of FRB and OBE Measures of Output 261
industry (SIC 36) have also occurred, which apparently are not fullyreflected by the FRB methodology. Changes in technology have alsocaused shifts in the unit cost of materials. For example, the value addedper unit of output for the blast furnace and steel mills industry (SIC331) has declined because the ores shipped from the mines in morerecent years are of a higher grade than those previously shipped. Re-finery gases, which are a source of petrochemicals, represent an in-creasing contribution to the output for the petroleum refinery industry(SIC 291), but have no explicit representation in the FRB indexes.Value added per unit of output in the dairy industry (SIC 202), whichhas been reduced by a shift from home to store and institutional de-liveries, is not reflected by the total quantities of milk produced. Rep-resentation of tobacco stemming and drying, which accounts for a vary-ing unit value added for the tobacco industry (SIC 21), by measures ofthe quantities of chewing and smoking tobacco produced contributedto differences between the OBE and FRB measures for this industry.
Differences in the measure of net output also reflect differences intotal output which arise because FRB has measured output based oncounts of quantities produced or proxies (principally man-hours) ofsuch counts and the OBE has derived such output by deflation. Forexample, the 1947—64 average annual rates for the FRB indexes re-weighted by 1958 value of production grow faster than the deflatedCensus value of production series for fourteen of the twenty-onemanufacturing industries (See Table 13). Large differences (1.0 pointor more) occur in the furniture, chemicals, rubber and plastics, fabri-cated metal products, and transportation equipment and ordnance, ex-cept motor vehicles, industries. Since 1957, almost 100 per cent ofthe total output for all of these industries, except chemicals, and rubberand plastics, was determined by a man-hour series adjusted for changesin productivity. Differences in output also arise for specified timeperiods in the apparel and shoe industries when output determined bynumber of garments cut or shoes produced is compared with deflatedvalue of production.
The use of different data sources to determine output trends alsocontributes to varying movements. As shown below, the 1958—64 FRBmovements for meat products (SIC 201) and dairy products (SIC 202)differ markedly from those of deflated value of production partiallybecause the FRB measures are based on agricultural data whose cov-erage includes establishments not classified as manufacturing plants.

262 Basic Industry Product Estimates
Differences in trends between the OBE and FRB series also arecaused by the inclusion of taxes in the OBE series and their omissionfrom the FRB measures. For example, the higher OBE growth ratecompared with the FRB rate for tobacco manufactures (SIC 21) ispartially due to this factor. Reweighting the FRB index by 1958 GPOweights also results in a greater similarity in the 1947—64 trends forrubber and plastics products (SIC 30) and transportation equipmentand ordnance, except motor vehicles (SIC 37 + 19 — 371) industries.
Differences between the published FRB and OBIE series in the year-to-year movements is also frequently related to varying movements fortotal and net output. This is particularly true for the years immediatelyafter World War II and during the Korean conflict. In addition, forsome industries, the discrepancies between the OBE and FRB seriesfor years prior to 1952 arise because the weights used for the OBEseries reflect 1958 price relationships for the 1947—64 period, whilethe currently published FRB indexes are combined with weights that em-body 1957 price relationships for post-1952 data and 1947 price rela-tionships for the years 1947—52. This relationship partially accountsfor the pre-1957 variations in movements for the paper and allied prod-ucts industry and transportation equipment and ordnance, except motorvehicles industries. Reweighting the FRB indexes reduces differences be-tween year-to-year changes for the FRB and OBE series for some yearsfor the same industries.
The direction or amplitude of change for the OBE series for someindustries differs from the FRB or Census measures because the cur-rent-dollar totals for only the former series are adjusted for inventoryvaluation. These differences appear during years when large pricemovements occur, such as during 1949—51. For example, the year-to-year changes between the OBE and Census measures of value addedwould be similar for the apparel industry, particularly for 1949—5 3and 1960—61, if the comparisons were based on GPO figures beforeadjustment for inventory valuation. The movements between Censusvalue added and OBE indexes would also be more similar for the to-bacco, furniture, rubber and leather industries, if the OBE series wereadjusted to make them comparable in concept with the other measures.
Differences in classification of industries or activities also account forannual variations. For example, during the Korean conflict substantialamounts of war goods were produced as secondary products in the

Comparison of FRB and OBE Measures of Output 263
machinery, fabricated metal, transportation equipment, and instru-ments industries. The Federal Reserve in its 1959 revision added "rep-resentation for these products to the private ordnance plant series ratherthan to the appropriate two-digit groups with the result that the formerseries is overstated and the latter industries understated in the year 1951,1952, and possibly 1953."
The sources from which the Census Bureau and the OBE derive theirdata also contribute to differences among the several measures. Suchvariations in coverage and classification of establishments are notice-able in the lumber and apparel industries particularly for the pre-1954period when the Census data were subject to high sampling errors, andthe OBE data include estimates of establishment profits based on the1958 Census-IRS link project. Significant differences in OBE andCensus payroll figures have also occurred since 1958 for instruments,fabricated metal products, leather, and lumber industries. Variations inthe movements between the Census value added and OBE indexes havealso caused differences between the FRB and OBE series.
Each of the industries which are discussed below have been selectedbecause they contain examples of the major causes of differences be-tween the OBE and FRB series. The discussion of the printing industry(SIC 27) is included for contrast since it illustrates how the OBE andFRB movements for some industries are similar despite differences inmethodology and data sources.
FOOD AND KINDRED PRODUCTS (sic 20)
The OBE and published FRB series show approximately the same1948—64 annual rates of growth for the food, beverage, and kindredproducts industries.14 The figures are 2.5 per cent and 2.6 per centrespectively. The annual average rates of change for both series, how-ever, differ substantially for the periods prior to and subsequent to1957 and are principally explained by varying movements betweennet and total output. For 1948—57, the average annual rate for the
13 Letter of May 18, 1966, from Clayton Gehman.The relative importance of this industry expressed as a percentage of the
respective manufacturing total is as follows:
1947 1958 1964
OBE 12.4 12.1 10.1
FRB (as pub.) 13.4 11.9 10.1

264 Basic Industry Product Estimates
OBE series is 2.7 per cent, and for the FRB series, 2.2 per cent.'5Since 1957, the rates are 2.1 and 3.2 per cent respectively for the OBEand the FRB series (Appendix C). Reweighting the FRB series byeither 1958 GPO or by 1958 Census value of production affects the1948—57 growth rates. The trend for the FRB indexes is 0.2 pointslower when weighted by GPO weights, and 0.2 points higher, whenweighted by gross weights, than the rates for the published series. The1957—64 trends for the reweighted and published FRB series are ap-proximately the same.
The deflated 1947—57 Census data for the food and kindred prod-ucts industry show a slightly declining ratio of quantity of materialsand energy consumed to the amount of goods produced, but a morerapidly rising ratio since 1957. Thus, the Census measures of net out-put increased less rapidly since 1957 compared with 1947—57, andthe converse applies to the annual rates of change for total TheOBE indexes of real product reflect the Census net-output pattern, andthe trend of the FRB indexes follows that of the Census value-of-pro-duction series, which shows 1957—64 as a period of more rapid increasecompared with 1947—57.
The FRB-OBE differences in year-to-year changes for some yearsare also due to diverse movements between total and net output. Forexample, larger changes in quantity of value added than in total outputoccurred between 1949—50, 1952—53, 1956—57, and even in the di-rection of the change as for 1957—58 or 1960—61 (see AppendixTable C-2). Differences in weighting also result in disparities in theyear-to-year movements, particularly for 1947—52, between the OBEand FRB indexes.
Another cause for trend and year-to-year disparities between theOBE and FRB series is the derivation of output by deflation versusquantity measures. Many of the twenty-three series used by FRB to
15 If the terminal year of 1957 is not used, then the percentage changes from1948 to 1956 or to 1958 for both indexes are approximately the same.
16 Adjusted for SIC changes. The adjustments in the Census and OBE dataand in the Annual Survey of Manufacturers data for the fluid milk industry, thefats and oils industries, and other SIC changes are relatively large in the earlyyears of this subperiod.
17 The 1957—64 higher growth rates for value of production compared withvalue added are largely due to higher than average increases in output by in-dustries characterized by low unit value added such as SIC 201—meat productsor SIC 2092—soybean oil mills.
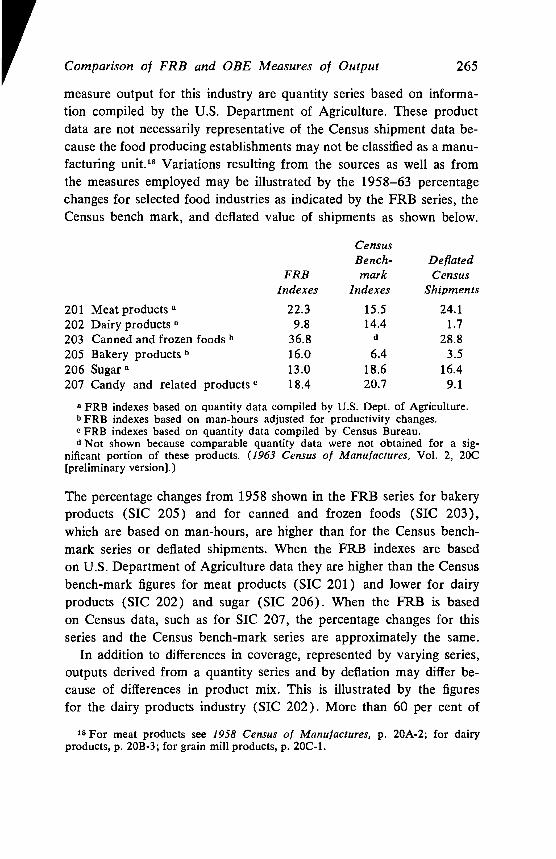
V
Comparison of FRB and OBE Measures of Output 265
measure output for this industry are quantity series based on informa-tion compiled by the U.S. Department of Agriculture. These productdata are not necessarily representative of the Census shipment data be-cause the food producing establishments may not be classified as a manu-facturing uflit.18 Variations resulting from the sources as well as fromthe measures employed may be illustrated by the 1958—63 percentagechanges for selected food industries as indicated by the FRB series, theCensus bench mark, and deflated value of shipments as shown below.
CensusBench- Deflated
FRB mark CensusIndexes indexes Shipments
201 Meat products a 22.3 15.5 24.1202 Dairy products a 9.8 14.4 1.7203 Canned and frozen foods b 36.8 d 28.8205 Bakery products b 16.0 6.4 3.5206 Sugar a 13.0 18.6 16.4207 Candy and related products C 18.4 20.7 9.1
a FRB indexes based on quantity data compiled by U.S. Dept. of Agriculture.b FRB indexes based on man-hours adjusted for productivity changes.c FRB indexes based on quantity data compiled by Census Bureau.d Not shown because comparable quantity data were not obtained for a sig-
nificant portion of these products. (1963 Census of Manufactures, Vol. 2, 20C[preliminary version].)
The percentage changes from 1958 shown in the FRB series for bakeryproducts (SIC 205) and for canned and frozen foods (SIC 203),which are based on man-hours, are higher than for the Census bench-mark series or deflated shipments. When the FRB indexes are basedon U.S. Department of Agriculture data they are higher than the Censusbench-mark figures for meat products (SIC 201) and lower for dairyproducts (SIC 202) and sugar (SIC 206). When the FRB is basedon Census data, such as for SIC 207, the percentage changes for thisseries and the Census bench-mark series are approximately the same.
In addition to differences in coverage, represented by varying series,outputs derived from a quantity series and by deflation may differ be-cause of differences in product mix. This is illustrated by the figuresfor the dairy products industry (SIC 202). More than 60 per cent of
18 For meat products see 1958 Census of Manufactures, p. 20A-2; for dairyproducts, p. 20B-3; for grain mill products, p. 20C-1.
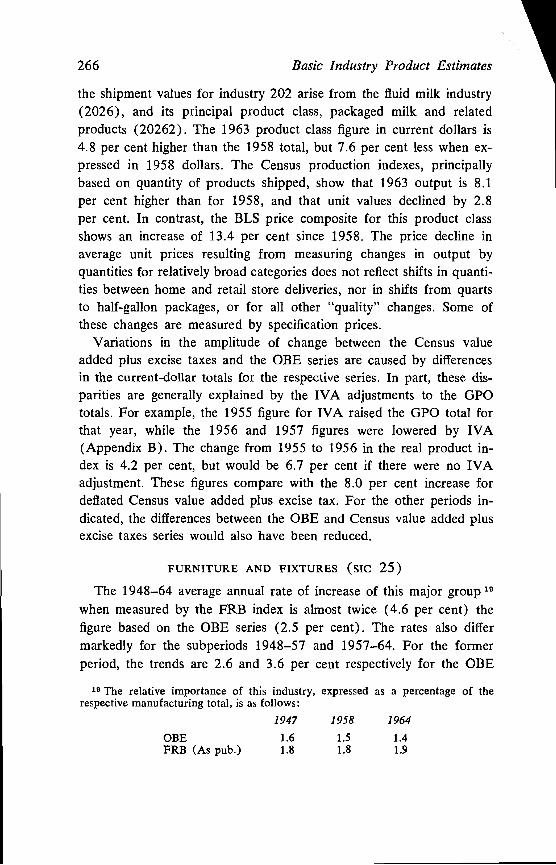
266 Basic Industry Product Estimates
the shipment values for industry 202 arise from the fluid milk industry(2026), and its principal product class, packaged milk and relatedproducts (20262). The 1963 product class figure in current dollars is4.8 per cent higher than the 1958 total, but 7.6 per cent less when ex-pressed in 1958 dollars. The Census production indexes, principallybased on quantity of products shipped, show that 1963 output is 8.1per cent higher than for 1958, and that unit values declined by 2.8per cent. In contrast, the BLS price composite for this product classshows an increase of 13.4 per cent since 1958. The price decline inaverage unit prices resulting from measuring changes in output byquantities for relatively broad categories does not reflect shifts in quanti-ties between home and retail store deliveries, nor in shifts from quartsto half-gallon packages, or for all other "quality" changes. Some ofthese changes are measured by specification prices.
Variations in the amplitude of change between the Census valueadded plus excise taxes and the OBE series are caused by differencesin the current-dollar totals for the respective series. In part, these dis-parities are generally explained by the IVA adjustments to the GPOtotals. For example, the 1955 figure for IVA raised the GPO total forthat year, while the 1956 and 1957 figures were lowered by IVA(Appendix B). The change from 1955 to 1956 in the real product in-dex is 4.2 per cent, but would be 6.7 per cent if there were no IVAadjustment. These figures compare with the 8.0 per cent increase fordeflated Census value added plus excise tax. For the other periods in-dicated, the differences between the OBE and Census value added plusexcise taxes series would also have been reduced.
FURNITURE AND FIXTURES (sic 25)
The 1948—64 average annual rate of increase of this major group '9when measured by the FRB index is almost twice (4.6 per cent) thefigure based on the OBE series (2.5 per cent). The rates also differmarkedly for the subperiods 1948—57 and 1957—64. For the formerperiod, the trends are 2.6 and 3.6 per cent respectively for the OBE
19 The relative importance of this industry, expressed as a percentage of therespective manufacturing total, is as follows:
1947 1958 1964
OBE 1.6 1.5 1.4FRB (As pub.) 1.8 1.8 1.9

Comparison of FRB and 013E Measures of Output 267
and the FRB series. In the post-1957 period, the compound annual rateof change for the OBE series is 2.3 per cent and 5.8 per cent for theFRB series. The reweighted FRB indexes (1958 GPO or Census valueof production weights) do not differ significantly in trends or in year-to-year changes from the published FRB series. The spread betweenthe 1964 published or reweighted FRB indexes and the OBE index is26 or more points (Appendix Table C-7).
The movements of the OBE series generally parallel those of Censusvalue added (VA). The annual rates of change in the Census VA seriessince 1947 are smaller (2.6 per cent) than in the Census productionseries (3.2 per cent). The 1947—64 trend toward less value added perunit of output stems from the relative changes in the product mix.These shifts occur between the household furniture industry (SIC 251)and the rest of the industries included in this major group as. well asfrom changes within the household furniture industry. The varyingaverage annual rates of change in the Census and FRB measures by in-dustry sectors 20 are indicated below:
Other FurnitureHousehold Furniture and Fixtures
(SIC 251) (SIC 252-9)
Census Measures 1947—57 1957—64 1947—57 1957—64
VP 3.7 2.8 2.4 3.6CM 4.0 3.6 3.0 4.8VA 3.3 1.9 2.0 2.7
FRB Indexes 3.4 7.0 4.1 3.3
In addition, within the household furniture group (SIC 251) there hasalso been a significant shift of product mix. For example, metal house-hold furniture shipments (2514), which have a relatively lower valueadded per unit of output than "other furniture," increased relativelymore than other household furniture from 1947 to 1957 but have beendecreasing since then.2' Conceptually, the trend for FRB indexes for
20 The FRB measures output for this industry by two series; one for SIC 251,and the other for SIC 25 2-9.
21 The ratios of constant-dollar shipment values of metal household furniture(SIC 2514) to the total for household furniture (SIC 251) for selected yearsare as follows:
1947 10.2 1957 15.71950 13.4 1958 15.01954 14.6 1963 13.5
1964 13.6

268 Basic Industry Product Estimates
SIC 251 and SIC 252-9 should show the same growth rates as Censusvalue of production (VP) for each of these sectors.
Differences between the FRB and OBE series are due not only to thelower growth rate for net compared with total output but also to dis-parities in measures of total output. Prior to 1958, the FRB de-termined output by deflated value data, and since then by man-hours.While the 1947—57 rates of increase for the published and reweightedFRB and deflated Census value of production series are thus approxi-mately the same (3.6 per cent and 3.3 per cent, respectively), the1957—64 growth rate of 5.8 per cent for the published FRB index isalmost twice the figure of 3.0 per cent for the deflated Census value-of-production series.
Differences in movement between Census value added and GPOare primarily explained by the IVA. When the IVA is excluded fromthe calculations of the indexes for GPO, the year-to-year movementsof the two series are similar.
PRINTING, PUBLISHING, AND ALLIED INDUSTRIES (sic 27)
The trends and annual movements when measured by either the FRBor OBE series are almost identical for this industry.22 For 1948—64,the OBE series shows a compounded annual rate of increase of 3.1per cent while the rate for the FRB series is 3.3 per cent. Thedifference between the two series is accounted for by the post-1957trends of 3.2 per cent for the FRB indexes and 2.8 per cent for theOBE series, since identical 1948—57 growth rates of 3.4 per cent arereflected by both series. The FRB indexes when reweighted by either the1958 GPO or value of production do not differ significantly in level ormovement from the published FRB figures.
The implicit deflator for GPO is derived by double deflation fromthe Census data on production and cost of materials, supplies, fuels,and electricity. Since the Wholesale Price Index includes no representa-tion for printing, publishing, and allied industries, special price serieswere constructed. These were used to deflate Census product groupingsof subscriptions and sales of newspapers and periodicals, advertising
22 The relative importance of this industry, expressed as a percentage of therespective manufacturing total, is as follows:
1947 1958 1964
OBE 5.0 5.0 4.3FRB (As pub.) 5.5 5.5 4.9

Comparison of FRB and OBE Measures of Output 269
receipts by medium, sales for books published by subject as well asfor job printing and allied activities. On the other hand, the FRB usesfour series to measure activity in this major group. Based on 1957—59industry proportions, 68 per cent was based on deflated value of ship-ments prior to 1958, and 68 per cent based on man-hours adjusted forproductivity since 1958. Nevertheless, the trends and year-to-yearchanges between the FRB series reweighted by 1958 Census value-of-production and the deflated Census value-of-production series are verysimilar, except for the years prior to 1952 (Appendix Table C-9).
The similarities in trends and year-to-year movements between theOBE and FRB series also stem from the fact that the differences be-tween total and net output are not large. Furthermore, the differencesin movements between Census value added and OBE are not large.
PRIMARY METAL INDUSTRIES (sic 33)
For 1948—57, the OBE and FRB indexes show an almost identicalgrowth rate of 2 per cent. If the terminal year is extended to 1964, thecompounded annual rate of increase for this industry 23 is 0.2 per centfor the OBE series compared with 2.0 per cent for the FRB. Reweight-ing the FRB indexes by 1958 GPO or Census value of production re-suits in a higher growth rate (2.2 per cent) for 1948—57, but no changefor 1957—64. Disparities between the FRB and OBE series largely arisefrom differences when output is derived from quantity measures or bydeflation and by the differing movements between total and net output.
In measuring output for the primary metal industries the FRB em-ploys twenty-three quantity series (see Appendix A). These representproduction and may include, as in the case of ferrous castings, thequantities shipped to other plants of the same company as well as theamounts produced by departments (e.g., foundries) of plants classi-fied in industries other than SIC 33. Because the ferrous and nonferrousindustries are composed of nonintegrated, partially integrated, andfully integrated plants, Census shipment data include varying amountsof duplication. The large differences in Appendix Table C-iS, column11, for 1950—53 may partially reflect comparisons of measures relating
The relative importance of this industry expressed as a percentage of therespective manufacturing total is as follows:
1947 1958 1964
OBE 12.8 8.8 8.2FRB (As pub.) 11.6 8.0 8.3

270 Basic Industry Product Estimates
to production and to shipments. These differences are also magnifiedduring these years by the independent adjustments to the Census databy FRB and OBE to reflect Census reporting procedures and the 1953FRB link.
The Census measures for Major Group 33 show a higher growthrate for total compared with net output for 1947—64 as well as for theeleven years ending in 1957 and for the eight-year period since 1957.The 1957—64 trends for the subgroups iron and steel and the non-ferrous industries, compared with those for the major industry group,are as follows:
Value of Cost of ValueProduction Materials Added
Industry 33 total 1.7 2.4 0.9Iron and steel a 0.9 1.4 0.4Nonferrous metals 3.7 4.4 2.4
a According to the output measures for the steel industry (SIC 331) com-puted by BLS, the compounded rate of change from 1957 to 1964 is 0.7 percent. Indexes of Output per Man-hour, Steel Industry, 1947—65, U.S. Departmentof Labor, BLS report 306, p. 9, June 1966.
The trends in the industry averages principally stem from the move-ments in the iron and steel subgroup, which accounts for about two-thirds 9f the industry total. Illustrative of the declining value addedper unit of output for the blast furnaces and steel mills industry hasbeen the shipment of higher grade ores from the Thus morework is done at the latter establishment and less processing is re-quired by the iron- and steel-making industry.
The effect of diverse trends for total and net output is further magni-fied by the FRB procedure in assigning the value-added weights forIndustries 3312 and 3399. Value added for each series used in de-termining output for this industry is estimated by subtracting the esti-mated value of its major inputs from the estimated value of output.25Any errors in such procedures such as in computing the selling pricesfor pig iron (about 99 per cent of which is captive production) and incosts of its raw materials may overstate its importance relative to themore highly fabricated products of the industry.
Differences in levels between the OBE real product and deflated24 Minerals Year Book, Washington, D.C., 1962, pp. 668—669.25 This procedure was used by the Census Bureau in preparing the 1954 bench-
mark indexes. For details, see 1954 Census of Manufactures, Vol. 4, Indexes ofProduction, p. 32.
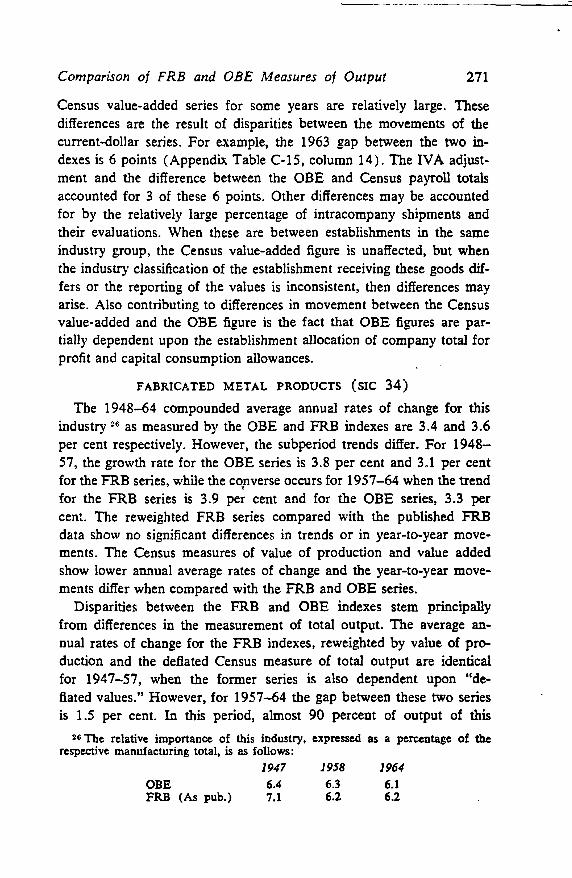
Comparison of FRB and OBE Measures of Output 271
Census value-added series for some years are relatively large. Thesedifferences are the result of disparities between the movements of thecurrent-dollar series. For example, the 1963 gap between the two in-dexes is 6 points (Appendix Table C- 15, column 14). The IVA adjust-ment and the difference between the OBE and Census payroll totalsaccounted for 3 of these 6 points. Other differences may be accountedfor by the relatively large percentage of intracompany shipments andtheir evaluations. When these are between establishments in the sameindustry group, the Census value-added figure is unaffected, but whenthe industry classification of the. establishment receiving these goods dif-fers or the reporting of the values is inconsistent, then differences mayarise. Also contributing to differences in movement between the Censusvalue-added and the OBE figure is the fact that OBE figures are par-tially dependent upon the establishment allocation of company total forprofit and capital consumption allowances.
FABRICATED METAL PRODUCTS (sic 34)
The 1948—64 compounded average annual rates of change for thisindustry 26 as measured by the OBE and FRB indexes are 3.4 and 3.6per cent respectively. However, the subperiod trends differ. For 1948—57, the growth rate for the OBE series is 3.8 per cent and 3.1 per centfor the FRB series, while the csnverse occurs for 1957—64 when the trendfor the FRB series is 3.9 per cent and for the OBE series, 3.3 percent. The reweighted FRB series compared with the published FRBdata show no significant differences in trends or in year-to-year move-ments. The Census measures of value of production and value addedshow lower annual average rates of change and the year-to-year move-ments differ when compared with the FRB and OBE series.
Disparities between the FRB and OBE indexes stem principallyfrom differences in the measurement of total output. The average an-nual rates of change for the FRB indexes, reweighted by value of pro-duction and the deflated Census measure of total output are identicalfor 1947-57, when the former series is also dependent upon "de-flated values." However, for 1957—64 the gap between these two seriesis 1.5 per cent. In this period, almost 90 percent of output of this
26 The relative importance of this industry, expressed as a percentage of therespective manufacturing total, is as follows:
1947 1958 1964
OBE 6.4 6.3 6.1FRB (As pub.) 7.1 62 6.2

272 Basic Industry Product Estimates
industry is measured by the FRB by a man-hour series. (See AppendixTable C-16.)
Industry classification differences may also contribute to the differ-ence between the two output series. The FRB includes representationfor the lighting fixture industry (SIC 3642) in this major groupbut excludes information for the valves and pipe fittings industry(SIC 3494) and the fabricated pipe and fittings industry (SIC 3498)which are assigned to Major Group 35. In addition during the Koreanconflict the FRB assigned war material made by the establishmentsclassified in this industry to private ordnance plants.
While the trends for the Census measures of total and net outputare approximately the same, this situation is a result of the relation-ship prevailing for the terminal years only. The variations in move-ments between total and net output generally explain the variationsduring 1948—64 in the amplitudes and direction of year-to-year changes.In 195 1—54, the FRB-OBE gap is partially explained by the differentmovements for the Census measures of gross and net output. During theseyears there were also large disparities in the current-dollar totals forCensus value added and GPO.
Since 1957, the growth rates for the Census value-added series isconsiderably less than that for the OBE indexes. The difference incurrent-dollar totals for these series appears to be primarily due toindustry classification as indicated below (percentage changes in cur-rent dollars, 1958—64).
Census Value Gross ProductAdded Originating
Total 32.2 41.1Payroll 26.7 35.1Other 5.5 6.0
MOTOR VEHICLES AND EQUIPMENT (sic 371)
Throughout the 1948-64 period, the OBE indexes for this industryshow higher levels of activity when compared with the FRB measures.
21 The relative importance of this industry, expressed as a percentage of therespective manufacturing total, is as
1947 1958 1964
OBE 6.6 5.7 8.7FRB (As pub.) 6.3 5.4 6.8

Comparison of FRB and ODE Measures of Output 273
The 1948—64 average annual rate of change for the OBE series is 5.3per cent; and 4.4 per cent for the FRB index. The growth rates for1948—57 are 5.0 and 4.1 per cent respectively for the OBE and FRBseries; and the corresponding figures for 1957—64 are 5.7 and 4.8 percent. The magnitude of these differences remains whether the FR.Bindexes are reweighted by 1958 GPO or Census value of production.
In measuring the output of the motor vehicle industry, the FRB usesnine series. Since 1958 about 47 per cent, based on 1957—59 propor-tions, of the industry output are based on man-hours adjusted for esti-mated changes in productivity. The quantity indexes for passenger carsinclude adjustments to reflect quality changes but, "there is no allowancein the index for the marked gains in performance of late model truckscompared with those produced in the period immediately after theSecond World War." 2$ The adjustments for quality changes are basedon production by (a) make and model, (b) certain items of equipment,and (3) body styles.29 Since the late 1950's, the quality adjustment hasbeen based on less detailed methods than employed for the precedingyears.
Adjustments for quality changes in the OBE series are largely depend-ent upon the BLS wholesale prices and their specifications. The diffi-culties encountered in this area are well known. In addition, prices fororiginal equipment may move differently from that for the replacementmarket. This error, if any, is cancelable to the extent that the originalequipment represents an intraindustry shipment. The double deflationprocedure also measures changes in value added when "trading up ordown" 80 by consumers occurs.
Between 1952 and 1955, there are large differences between the FRBindexes, reweighted by 1958 value of shipments, and the Census deflatedvalue-of-production series (Appendix Table C-20, column 11). A partof this difference stems from the reclassification by FRB of war goodsproduced as secondary products in this industry to the private ordnance
28 "The Revised Index of Industrial Production," reply by Clayton Geliman,American Economic Review, June 1963, p. 520.
" For more detailed description, see 1954 Census of Manufactures, Vol. IV, pp.33—34.
80 The term "trading up" refers to the shift in consumer demand from lowprice cars or standard models to more expensive makes, body styles, or with ad-ditional equipment. An example of "trading down" is the shift from standard-sized cars to economy compacts.
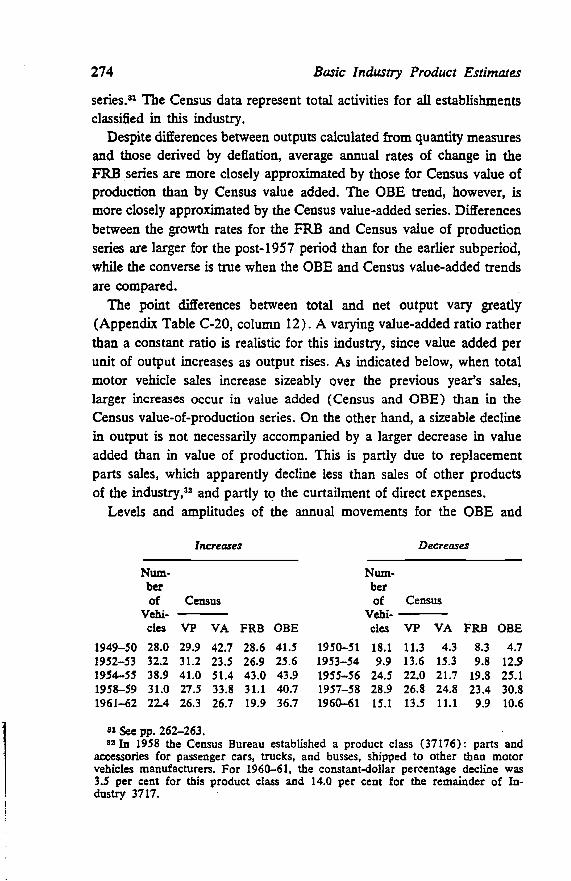
274 Basic Industry Product Estimates
series.31 The Census data represent total activities for all establishmentsclassified in this industry.
Despite differences between outputs calculated from quantity measuresand those derived by deflation, average annual rates of change in theFRB series are more closely approximated by those for Census value ofproduction than by Census value added. The OBE trend, however, ismore closely approximated by the Census value-added series. Differencesbetween the growth rates for the FRB and Census value of productionseries are larger for the post-1957 period than for the earlier subperiod,while the converse is true when the OBE and Census value-added trendsare compared.
The point differences between total and net output vary greatly(Appendix Table C-20, column 12). A varying value-added ratio ratherthan a constant ratio is realistic for this industry, since value added perunit of output increases as output rises. As indicated below, when totalmotor vehicle sales increase sizeably over the previous year's sales,larger increases occur in value added (Census and OBE) than in theCensus value-of-production series. On the other hand, a sizeable declinein output is not necessarily accompanied by a larger decrease in valueadded than in value of production. This is partly due to replacementparts sales, which apparently decline less than sales of other productsof the industry,32 and partly to the curtailment of direct expenses.
Levels and amplitudes of the annual movements for the OBE and
Increases Decreases
Num- Nurn-ber berof Census of Census
Vehi- Vehi-cles VP VA FRB OBE des VP VA FRB OBE
1949—50 28.0 29.9 42.7 28.6 41.5 1950—51 18.1 11.3 4.3 8.3 4.71952—53 32.2 31.2 23.5 26.9 25.6 1953—54 9.9 13.6 15.3 9.8 12.91954—55 38.9 41.0 51.4 43.0 43.9 1955—56 24.5 22.0 21.7 19.8 25.11958—59 31.0 27.5 33.8 31.1 40.7 1957—58 28.9 26.8 24.8 23.4 30.81961—62 224 26.3 26.7 19.9 36.7 1960—61 15.1 13.5 11.1 9.9 10.6
31 See pp. 262—263.32 In 1958 the Census Bureau established a product class (37176): parts and
accessories for passenger cars, trucks, and busses, shipped to other than motorvehicles manufacturers. For 1960—61, the constant-dollar percentage decline was3.5 per cent for this product class and 14.0 per cent for the remainder of In-dustry 3717.
Comparison of FRB and OBE Measures of Output 275
Census value-added series differ from 1949 through 1955 because ofdisparities in the two current-dollar series (Appendix Table C-20, col-umn 14). The current-dollar figures of gross product originating duringthis period exceed Census value added, while for other years the usualrelationship between these figures prevails. Significant differences inOBE and Census payroll figures also occur since 1958, as indicated bypercentage changes in current dollars shown below.
Census Value Added and GPO
Census Value Gross ProductAdded Originating
Total 97.4 118.3Payroll 70.0 59.6Other 117.0 185.3
In summary, the OBE indexes display higher growth rates than theFRB series for 1948—64. The gap between the trends for these twoseries is identical for 1948—57 and for 1957—64. The largest disparitiesoccur in 1950—55 and since 1962. The 1950—55 disparities are prin-cipally explained by differences in measuring output and by the current-dollar movements of GPO, which in contrast to the FRB series reflecttotal activity for the establishments classified in the industry. The dis-parities since 1962 are largely due to the variation in movement be-tween total and net output. The OBE measures of value added are morevolatile than the FRB measures because the former reflect the volatilityof profits due to scale of operation as well as shifts in margins as con-sumers "trade up," or "trade down" in make, model, or added equip-ment. In addition, when the data for new cars appearing in the finalproduct accounts are compared with the GPO indexes, there is someevidence that increases since 1961 in GPO for Industry 371 have beenoffset by declines in the value added for industries whose principalactivity relates to transporting or marketing new vehicles.
Appendix A: Description of FRB and OBE indexesof Manufacturing Output
1. FEDERAL RESERVE BOARD'S INDEXES
Based on the value-added weights in the 1957—59 base period, slightlyless than 90 per cent of the FRB index of industrial production is

276 Basic Industry Product Estimates
accounted for by manufacturing activity; the remainder represents theoutput for mining and electric and gas utilities. While the measuresinclude production at Government owned and operated installations,'the indexes for manufacturing predominantly relate to activities of theprivately operated sectors.
The FRB published indexes show changes in physical output by in-dustry as well as for market categories, including a division betweenfinal products and materials and a subdivision of final products betweenoutput of consumer goods and output of equipment (including ord-nance) for business and government use.
The current indexes of the FRB reflect major revisions described indetail in Industrial Production, 1959 Revisions, and those made inOctober 1962 when the comparison and weight bases were shifted from1957 to 1957_59.2 These revisions established new market groupings,expanded coverage and representation, refined procedures for estimat-ing changes in industries represented by man-hour series, and revised theseasonal-adjustment factors. In addition, the 1959 revisions incorporatedthe 1947—54 production indexes derived from the comprehensive Censusof Manufactures data for 1947 and and also adjusted the 1955—57production indexes using information compiled in the Annual Surveys ofManufactures. Moreover, the industry grouping was made to conform tothe 1957 edition of Standard Industrial Classification (SIC) Manual. Inthe 1962 revision, the annual levels for eight series in the apparel, food,and chemical groups were adjusted to take account of the informationappearing in the preliminary 1958 Census of Manufactures and the 1959and 1960 Annual Survey of Manufactures.
The total and other aggregate indexes are derived from weightedaverages of relatives. Various measures are used to represent changes
'These include arsenals (0.12 per cent) and Navy shipyards (0.35 per cent).2 For further details, see Board of Governors of the Federal Reserve System,
industrial Production: 1959 Revision, Washington, D.C., 1960; Industrial Pro-duction: 1957—59 Base, Washington, D.C., 1962; and Industrial ProductionMeasurements in the United States (reply to an inquiry from the EconomicCommission for Europe), Washington, D.C., February 1964.
3 1954 Census of Manufactures, Vol. IV, Indexes of Production, G.P.O.,Washington, D.C., 1958. "In the 1954 bench-mark 82 percent of the total valueadded for manufacturing was represented by indexes derived from product data.Of these indexes, products represented by both quantity and value data madeup about 75 percent and products represented only by deflated value data about25 percent. Another 3½ percent was represented by indexes based on materialsconsumption and the remaining 14½ percent consisted of industry values indexesdeflated by selected price or unit value indexes." (Industrial Production Measure-ment in the U.S., p. 36.)
Comparison of FRB and OBE Measures of Output 277
in the quantity of output. These changes are expressed as relatives with1957—59 = 100; each series of relatives is multiplied by a base-year-weight factor; and the product summed. The weight used for manufac-turing components is the average of the 1957—59 Census of Manufac-tures value added expressed in 1957 prices. For each series the 1957—59value-added figure in 1957 prices was obtained by dividing 1957 valueadded by the ratio of production in 1957 to production in 1957—59.Census value-added data are available either at an industry (four-, three-,or two-digit SIC) level, and for many product groupings (plants spe-cializing in shipments of specified product classes) for some series.Value-added weights are based on the assumption that value added isproportional to the value of the product within the group.4
Since the indexes prior to 1953 were not recalculated, but linked inthe 1959 revision, the weighting pattern for these indexes is based onweights derived from the 1947 Census value-added data. Because of thesubsequent revision from the 1957 base to the 1957—59 base, the linkedindexes on the 1957 base were converted to the 1957—59 base periodby a multiplying factor for each aggregate index.
The indexes of output for the annual series discussed in this paperare based on a variety of measures—number of physical units produced,deflated values, man-hours, or materials consumed. The 200 series usedfor manufacturing measures and the proportions of 1957—59 valueadded for manufacturing accounted for by these series are shown inTable A-i.
2. INDEXES OF REAL PRODUCT FOR MANUFACTURINGINDUSTRIES
Indexes of GPO for major manufacturing industries (two-digit SICindustries) are derived by deflation. The current-dollar figures for atwo-digit industry, compiled from the national income accounts of thegross national product, represent the unique contribution (value added),in market prices by the specified industry to the nation's economy. Tosecure a measure in "real terms," the current-dollar total is deflated bya gross product price index calculated by the double deflation method.5
For blast furnaces and rolling mills (SIC 331) and a few other industries,other estimating procedures are used.
The limitations of the value added implicit deflator are discussed in the OBEunpublished document, "GNP by Major Industry; Concepts and Methods," andalso by Paul A. David, "The Deflation of Value Added," The Review of Eco-nomics and Statistics, May 1962, pp. 148 if.

Prio
r to
195
819
58—
64
- M
an-H
ours
Man
-Hou
rs
SIC
No.
Ann
ual
Qua
ntity
Prod
uced
Def
late
dV
alue
Adj
uste
dfo
rPr
oduc
-tiv
itya
Impu
ted
orE
xtra
p-ol
ated
Qua
ntity
ofM
ater
ials
Con
sum
ed
Mon
thly
Qua
ntity
Prod
uced
Def
late
dV
alue
Adj
uste
dfo
rPr
oduc
-tiv
itya
Impu
ted
orE
xtra
p-ol
ated
Qua
ntity
ofM
ater
ials
Con
sum
ed
All
mfg
.43
.043
.28.
62.
23.
033
.7—
—55
.06.
15.
220
76.7
20.5
——
2.8
——
39.3
——
43.0
17.7
——
2110
0.0
——
——
——
——
100.
0—
——
——
——
—
2238
.336
.6—
—18
.66.
535
.9—
—16
.919
.327
.923
67.1
9.8
20.3
2.8
——
59.1
38.7
2.2
——
2693
.9—
——
—6.
1—
—61
.5—
——
—38
.5—
—
27—
—67
.7—
——
—32
.3—
——
—67
.7—
—32
.328
30.5
52.9
15.4
1.2
——
33.7
——
57.4
0.3
8.6
2994
.9—
——
—5.
1—
—90
.9—
—9.
1—
—
3038
.761
.3—
——
——
—33
.7—
—26
.1—
—40
.231
75.7
24.3
——
——
——
75.7
——
24.3
——
——
2468
.2—
—14
.517
.3—
—51
.9—
—20
.817
.3—
—
25—
—10
0.0
——
——
——
——
——
100.
0—
——
—
3250
.536
.40.
76.
75.
729
.1—
—70
.20.
7—
—
3393
.8—
——
—1.
44.
891
.4—
——
—3.
94.
734
5.8
77.7
9.1
——
7.4
3.0
——
89.6
——
7.4
355.
894
.2—
——
——
—7.
0—
—93
.0—
——
—
3625
.974
.1—
——
——
—28
.171
.9—
——
—
371
85.3
14.7
——
——
——
47.0
——
38.3
14.7
——
37+
19—
371
4.0
40.0
56.0
——
——
2.0
98.0
——
——
38—
—92
.47.
6—
——
——
——
—10
0.0
——
——
39—
—42
.457
.6—
——
——
——
—10
0.0
Indu
stri
al P
rodu
ctio
n M
easu
rem
ent i
n th
e U
.S.,
p. 3
6 fI
.So
urce
:aR
epre
sent
atio
n in
the
mon
thly
and
ann
ual s
erie
s al
so in
clud
e em
ploy
men
t adj
uste
d fo
r ch
ange
s in
pro
duct
ivity
.T
hese
ser
ies,
how
ever
, acc
ount
for
abo
ut o
ne-h
alf
of I
per
cen
t.
TA
BL
E A
-iPe
rcen
tage
of
the
1957
—59
Ind
ustr
y Pr
opor
tion
00

Comparison of FRB and OBE Measures of Output 279
Indexes for durable and nondurable goods industries and for totalmanufacturing are calculated by summing the constant-dollar totals forselected industries.
As described in detail in "GNP by Major Industries; Concepts andMethods," current-dollar figures are compiled by summing the appro-priate factor payments and nonfactor costs for an industry (two-digitSIC) Since the corporate profits and capital consumption allowance(CCA) components of gross product are compiled on a company ratherthan on an establishment basis, adjustments are made in these totals toreflect the establishment composition of the manufacturing industries,as defined by the Standard Industrial Classification Manual. For allindustries, except the petroleum refining industry (SIC 29), these adjust-ments are based on the company-establishment pattern weighted toreflect industry variations in profits or CCA per employee. The employ-ment data appear in the U.S. Bureau of the Census publication, Enter-prise Statistics: 1958 Part 3, Link of Census Establishment and IRSCorporation Data. For the petroleum refining industry, profits representa residual after determining the amount due to mining activities (basedon depletion allowances) and for wholesale and retail trade (based onindustry averages). Depreciation charges for the petroleum refiningindustry are allocated on the basis of information for "assets by depart-ments" as compiled in the Chase Manhattan Bank's studies for integratedoil companies.
The current-dollar measures of an industry's gross product, derived asthe sum of its factor payments and nonfactor costs, are not directly con-vertible to constant dollars because the components (employee com-pensation, profits, interest, etc.) cannot be expressed in quantity andunit prices suitable for this purpose. To calculate constant-dollar figures,the gross product originating is deflated by implicit deflators derived bydeflating output and purchases separately (double deflation). Thismethod involves the derivation of measures of output and input byspecified manufacturing industry groups separately expressed in currentdollars and also in base-year dollars and the value added obtained by
6 A methodology is available upon request to the Office of Business Economics.The only exception is for Major Group 37, transportation equipment, which is
combined with Major Group 19, ordnance. The subtotals: (a) motoi1 vehicles (SIC371) and transportation equipment, except motor vehicles (SIC 37-371 and 19), areconsidered as industry groups, rather than the combination of the major SIC in-dustries.

280 Basic Industry Product Estimates
subtraction. The implicit price deflator is calculated by dividing thecurrent-dollar figure by the constant-dollar figure for value added.
The data sources showing current dollars for total output (shipmentsfigures adjusted for changes in inventories of finished goods and goodsin process) and inputs for specified industries are the Census of Manu-factures and The Annual Survey of Manufactures. To reflect the industryclassifications appearing in the 1957 edition of the SIC manual, ship-ments and cost of materials, supplies, etc. for years prior to 1958 wereadjusted when necessary on basis of the "bridge" data appearing inthe 1958 Census of Manufactures, Vol. 1, Summary, Appendix C, Part2. The price information is obtained primarily from The Wholesale PriceIndexes, U.S. Bureau of Labor Statistics.
In order that the constant-dollar aggregate for value added may con-sist of the current year's quantity valued at prices prevailing in the baseyear, an industry's current value of shipments, inventory, and cost ofmaterials and other items consumed in the manufacturing processshould be deflated by a price index representing the given year's com-posite of products. For nearly all industries, the output composite foreach year may be reliably approximated by the Census annual shipmentvalues of each product class wherever made. However, the output for asmall number of industries consists of a significant amount of productsclassified in other industries. In these cases, the annual data on totalproduct class shipments are inadequate. For such industries, output priceindexes with current-year weights are estimated from information con-tained in the 1947, 1954, and 1958 Censuses of Manufactures, whichprovide information on the product composition of each industry's totalvalue of shipments. Weights were calculated for the three Census yearsusing these detailed product-mix data. Linear interpolations yielded theweighting pattern for the intercensal years.
Current-year weighted price indexes, as described above, are thusused to derive a constant-dollar series at a four-digit SIC industry level.These are then summed to the 1958 input—output sectors (industry) andagain aggregated to the SIC two-digit manufacturing levels.8
Inventory data for the input—output industries are adjusted to provideone set of inventory figures which reflect average prices during the given
8 Because of differences stemming from definitional changes affecting thecompiled industry statistics prior to, and subsequent to, 1958, two sets of datawere compiled: (a) 1947 through 1958 and (b) 1958 to date. Whenever a con-tinuous series from 1947 was needed, 1958 served as a link for the two series.

Comparison of FRB and OBE Measures of Output 281
year and a second set which reflect 1958 prices. The deflators used forthis adjustment are adapted from the price indexes used in the calcula-tion of the "inventory valuation adjustment" included in the nationalaccounts.
A basic problem in deflating Census data on cost of materials, supplies,components, fuel, and electricity for manufacturing industries is thatinformation on the annual composition of their intermediate purchasesis incomplete. The 1947 input—output study conducted by BLS, and the1958 study, conducted by OBE, provide estimates of the relative dollarvalues of the items purchased by an industry. Composite price indexeswere constructed using the data appearing in these studies as weights;these two sets of deflators (1947-weighted and 1958-weighted) werethen interpolated to provide an approximation of a current-year-weighted-input-price index. The weights for 1958 and subsequent yearsare based on the 1958 study.
Value added at the two-digit industry level was computed in givenyear prices and in 1958 prices by subtracting cost of materials fromvalue of production (shipments plus inventory changes) valued at therespective price levels. These two-digit industry totals were adjusted toinclude excise taxes. From the current- and constant-dollar totals of valueadded, as adjusted, implicit price deflators (1958 = 100) were com-puted. These deflators then are used to calculate the constant-dollar(1958) gross product originating in the specified industry.
The preceding discussion relates to the calculation of real grossproduct for all years except 1948 and for all manufacturing industries,except petroleum refining (SIC 29). With respect to 1948, no full-scaleCensus surveys of manufacturing industries were conducted for that year.Consequently, implicit price deflators for that year are obtained by using1948 price indexes weighted by the 1947 shipments and purchases.
The data for Industry 29, are dominated by the figures for Industry2911, petroleum refining. The ratio of cost of materials to value of ship-ments for the latter industry is among the highest, and for many yearsthe highest, of all manufacturing industries. (The ratio varies from 80to 84 per cent from 1950 to the present). Since value added is a residual,small differences in the price levels of output and input and small incon-sistencies in the measures of output and input may yield larger differ-ences in the price movements for value added. This was the experience
See above.
282 Basic Industry Product Estimates
when the double deflation method was used for SIC 29. In addition,the number of series and/or items priced and the weights used to derivegeographic and national price composites do not coincide with the re-gional activities represented by the annual values of shipments and costsof crude petroleum and intra-industry purchases, as compiled by theBureau of the Census. Furthermore, the BLS annual prices are arith-metic averages of monthly prices while shipments of the major productsof this industry are generally seasonal.
Unusually complete physical measures of output and input for petro-leum refineries for the required number of years are compiled by theU.S. Bureau of Mines. The data also reflect the technical changes whichresult in varied proportions of product outputs derived principally froma single material input. Therefore, these statistics are used to calculateindexes of physical volume comparable to the Census product classes.By extrapolating the 1958 product class shipment values by the appro-priate indexes, a constant-dollar series is calculated. For the input crudepetroleum oil a realized price based on the U.S. Bureau of Mines data issubstituted for the BLS price series. For all other industries 10 in MajorGroup 29, the standard procedures as described above are followed.
For each two-digit industry, the implicit deflator based on Censusvalue added is used to derive a constant-dollar series for the correspond-ing total of gross product originating. For Industry 29, petroleum andrelated products and Industry 21, tobacco manufactures, the deflatorderived from the Census data is used only for the sum of all com-ponents, except excise taxes. The total for these taxes is deflated sepa-rately, based on changes in the latter tax rates. For other industries, ex-cise taxes are not separately deflated since they represent a relativelysmall proportion of the gross product originating in that industry.
Data for Census cost of materials are only a partial measure of inter-mediate purchases, since purchased business services such as advertisingfees, legal services, rents, telephone and postal bills, and royalties arenot included in these totals. When the relative proportion of these busi-ness expenses to total costs is large and the price behavior of purchasedservices differs markedly from value added, the calculated implicitdeflator may be affected.
To secure an estimate of what the implicit deflator might be if dataon purchases of services were available annually, information was
10 Data for Industry 2992, lubricating oils and greases, are included with thefigures for Industry 2911.

Comparison of FRB and OBE Measures of Output 283
utilized from the 1958 and preliminary 1961 input—output tables. Basedon the calculations for three industries, for which purchased services areknown to be relatively high, the following results for 1961 were derived:
Implicit Deflator for GPO,1958 = 100
Adjusted forSIC Industry As Used Services
20 Food and kindred products 110.2 110.721 Tobacco manufactures 98.7 96.8
371 Motor vehicles and equipment 99.5 98.3
While these results are inconclusive, it is believed that for most of themanufacturing industries, for which purchased services are relativelysmall, the implicit deflator based on Census value added represents theprice movement of GPO.
3. THE WEIGHT BASE
As indicated above, the weight base for the Federal Reserve Board'sindex for manufacturing is the 1957—59 Census value-added figures in1957 prices. The base for gross product originating is 1958, a year ofrelatively low output, and is based on gross national product, whichdiffers in concept from Census value added. In production indexes,different weight periods will result in changes only if relative proportionsare widely different. If this occurs, then the use of different weights mayresult in changes in the general levels and also affect the timing andamplitude of the fluctuations in the indexes.12 A comparison of the 1958weight proportions for the two indexes appears below (Table A-2).The differences in proportions shown partly stem from the conceptualdifferences between Census value added and gross national product. Thelarger relative weights for the food and kindred products, tobacco, andpetroleum refining industries are principally accounted for by the in-clusion of excise taxes in the GPO totals and their exclusion from theCensus value-added figures. These payments are not offset by pur-chased services which are relatively high in these industries. Other differ-ences in proportions are partly accounted for by classification differences.
11 For this industry, the implicit deflator for GPO is based on a composite forCensus value added and for excise taxes. The implicit deflator for Census valueadded, excluding taxes, is 96.4 (1958= 100).
12 1954 Census of Manufactures, Vol. IV, Indexes of Production, pp. 20—26.

284 Basic Industry Product Estimates
TABLE A-2
Assigned 1958 Weights for Indexes of Manufacturing:Office of Business Economics and Federal Reserve Board
Industry OBE FRB OBE FRB
Manufacturing 100.00 100.00Nondurable goods 43.70 46.13 100.00 100.00
Food and kindred products 12.13 12.64 27.76 27.41Tobacco manufactures 2.21 1.02 5.06 2.21Textile mill products 3.33 3.39 7.62 7.35Apparel and other fabricated
textile products 3.69 4.24 8.44 9.19Paper and allied products 3.90 4.13 8.92 8.95
Printing, publishing, andallied industries 4.95 5.71 11.33 12.38
Chemicals and alliedproducts 7.45 9.02 17.05 19.55Petroleum refining and related
industries 2.53 2.38 5.79 5.16Rubber and misc. plastic products 2.33 2.27 5.33 4.92Leather and leather products 1.18 1.33 2.70 2.88
Durable goods 56.30 53.87 100.00 100.00Lumber and wood products,
except furniture 2.67 2.06 4.74 3.82Furniture and fixtures 1.55 1.77 2.75 3.29Stone, clay, and glass products 3.77 3.46 6.70 6.42Primary metal industries 8.82 7.54 15.67 14.00Fabricated metal products 6.31 6.20 11.21 11.51
Machinery, except electrical 8.83 9.19 15.68 17.05Electrical machinery 7.56 7.11 13.43 13.20Transportation equipment and
ordnance,except motor vehicles 7.11 801a 12.63 14•87a
Motor vehicles and motor vehicleequipment 5.73 4.82 10.18 8.95
Instruments .2.11 1.95 3.75 3.62Miscellaneous manufacturing
industries 1.85 1.76 3.29 3.27
alncludes government owned and government operated estab-lishments.
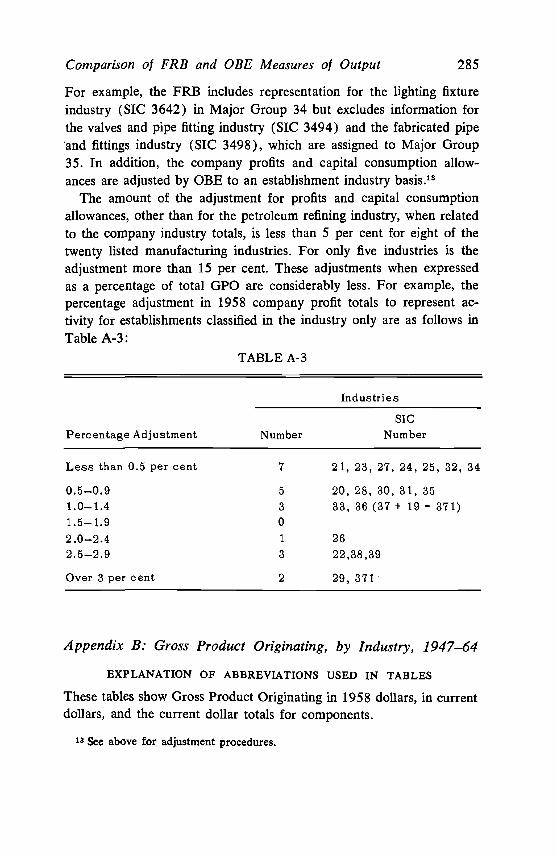
Comparison of FRB and OBE Measures of Output 285
For example, the FRB includes representation for the lighting fixtureindustry (SIC 3642) in Major Group 34 but excludes information forthe valves and pipe fitting industry (SIC 3494) and the fabricated pipeand fittings industry (SIC 3498), which are assigned to Major Group35. In addition, the company profits and capital consumption allow-ances are adjusted by OBE to an establishment industry basis.'3
The amount of the adjustment for profits and capital consumptionallowances, other than for the petroleum refining industry, when relatedto the company industry totals, is less than 5 per cent for eight of thetwenty listed manufacturing industries. For only five industries is theadjustment more than 15 per cent. These adjustments when expressedas a percentage of total GPO are considerably less. For example, thepercentage adjustment in 1958 company profit totals to represent ac-tivity for establishments classified in the industry only are as follows inTable A-3:
TABLE A-3
Industries
SICPercentage Adjustment Number Number
Less than 0.5 per cent 7 21, 23, 27, 24, 25, 32, 34
0.5—0.9 5 20, 28, 30, 31, 35
1.0—1.4 3 33, 36 (37 + 19 — 371)1.5—1.9 0
2.0—2.4 1 26
2.5—2.9 3 22,38,39
Over 3 per cent 2 29, 371
Appendix B. Gross Product Originating, by Industry, 194 7—64
EXPLANATION OF ABBREVIATIONS USED IN TABLES
These tables show Gross Product Originating in 1958 dollars, in currentdollars, and the current dollar totals for components.
18 See above for adjustment procedures.
286 Basic Industry Product Estimates
CO(1958) $ = Gross product originating in 1958 dollars. For derivation,see Appendix A; for deflators, see Appendix D.
CU $, Total = Gross product originating in current dollars. The sum offactor and nonfactor charges, which appears in the columns on the right.
Employee Compensation = Employee compensation, which consists ofwages, salaries, and supplements.
Interest = Net interest component of national income.CCA = Capital consumption allowances, which consist of depreciation and
accidental damage to fixed business property. These figures representestablishment totals (see Appendix A).
IBT = Indirect business tax and nontax liability and business transfer pay-ments. Includes federal excise taxes for which the industry has legalresponsibility.
Profit Type Income:Total = Sum of profits and IVA.Profits = Sum of corporate profits on an establishment basis and income of
unincorporated enterprises.IVA = Inventory valuation adjustment. See National Income, 1954 edition,
supplement to the Survey of Current Business, pp. 44—45 and 135—138.
Appendix C: Selected Measures of Manufacturing Activityby Industry Groups and by Industry, 1947—64
The statistical framework for analyzing the relationship between theOBE and FRB indexes involves comparisons with reweighted FRBseries and Census measures of total and net output. The text discussionsand tables below include data for selected measures of total and netoutput. Point differences between these selected measures of manufactur-ing activity are also shown. In addition, the trends of the various meas-ures for 1948—64 and for the subperiods ending and beginning with1957 were computed and are shown below. A brief description andderivation of the series appearing in these tables appears below:
FRB As Pub. (column 1) = The published indexes of the Federal ReserveBoard for the given industry or groups rebased to 1958 = 100. Theweights for these indexes are discussed in Appendix A. The series shownis derived by dividing the given year FRB index by the 1958 FRB index.
FRB Reweighted (columns 2 and 3) = The FRB (output) relatives rebasedto 1958 = 100 from 1957—59 = 100 and reweighted by (1) 1958 grossproduct originating (column 2) and (2) 1958 Census Value of Produc-tion (column 3).
Value of Production—VP (column 4) = Deflated Census value of ship-ments plus deflated change in inventories of finished goods and work in
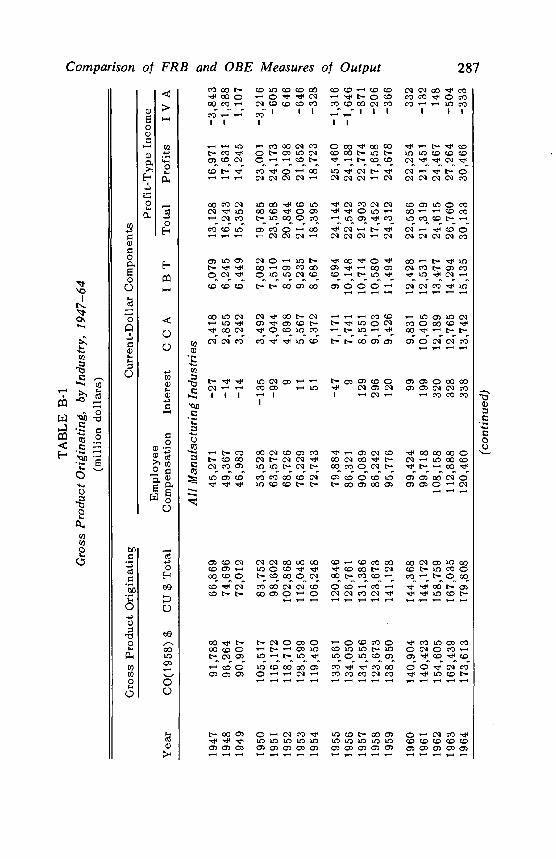
0 0 0 0
TA
BL
E B
-iG
ross
Pro
duct
Ori
gina
ting,
by
indu
stry
, 194
7—64
(mill
ion
dolla
rs)
0 0 0G
ross
Pro
duct
Ori
gina
ting
Cur
rent
-Dol
lar
Com
pone
nts
Yea
r00
(195
8) $
CU
$ T
otal
Em
ploy
eeC
ompe
nsat
ion
Inte
rest
C C
AI
B T
Prof
it-T
ype
Inco
me
Tot
alPr
ofits
I V
A
All
Man
ufac
turi
ng I
ndus
trie
s
1947
91,7
8866
,869
45,2
71—
272,
418
6,07
913
,128
16,9
71—
3,84
319
4896
,264
74,6
9649
,367
—14
2,85
56,
245
16,2
4317
,631
—1,
388
1949
90,9
0772
,012
46,9
83—
143,
242
6,44
915
,352
14,2
451,
107
1950
105,
517
83,7
5253
,528
—13
53,
492
7,08
219
,785
23,0
01—
3,21
619
5111
6,17
298
,602
63,5
72—
924,
044
7,51
023
,568
24,1
73—
605
1952
118,710
102,868
68,726
94,698
8,591
20,844
20,198
646
1953
128,599
112,048
76,229
11
5,567
9,235
21,006
21,652
—646
1954
119,
450
106,
248
72,7
4351
6,37
28,
687
18,3
9518
,723
—32
8
1955
133,561
120,846
79,884
—47
7,171
9,694
24,144
25,460
—1,316
1956
134,050
126,761
86,321
97,741
10,148
22,542
24,188
—1,646
1957
134,556
131,386
90,089
129
8,551
10,714
21,903
22,774
—871
1958
123,673
123,673
86,242
296
9,103
10,580
17,452
17,658
—206
1959
138,950
•141,128
95,776
120
9,426
11,494
24,312
24,678
—366
1960
140,904
144,368
99,424
99
9,831
12,428
22,586
22,254
332
1961
140,423
144,172
99,718
199
10,405
12,531
21,319
21,451
—132
1962
154,
605
158,
759
108,
158
320
12,1
8913,477
24,615
24,467
148
1963
162,
439
167,
035
112,888
328
12,765
14,294
26,760
27,264
—504
1964
173,
613
179,
808
120,
460
338
13,7
4215
,135
30,1
3330
,466
—33
3
(con
tinue
d)00

TA
BL
E B
-i (
cont
inue
d)
Gro
ss P
rodu
ctO
rigi
natin
gC
urre
nt-D
olla
r C
ompo
nent
s
Em
ploy
eeC
ompe
nsat
ion
Inte
rest
CC
AI
BT
Prof
it-T
ype
Inco
me
Yea
rC
O(1
958)
$C
U $
Tot
alT
otal
Prof
itsI
V A
0O 00
Non
dura
ble
Goo
ds in
dust
ries
1947
39,4
4633
,283
20,0
36—
21,
154
4,75
67,
339
9,01
1—
1,67
219
4841
,292
36,6
1421
,826
231,
373
4,71
28,
680
8,39
528
519
4940
,415
34,9
2621
,514
421,
595
4,81
16,
964
6,25
670
8
1950
44,7
3238
,033
23,5
1413
1,69
95,
157
7,65
09,
524
—1,
874
1951
47,2
1743
,279
25,9
7030
1,89
95,
378
10,0
029,
870
132
1952
47,2
5044
,057
27,2
5833
2,10
26,
147
8,51
77,
749
768
1953
1954
1955
49,4
5548
,281
52,8
72
46,2
4145
,541
50,3
10
29,1
5929
,265
31,2
66
23 66 45
2,33
82,
721
3,07
3
6,25
06,
064
6,38
1
8,47
17,
425
9,54
5
8,31
37,
445
9,50
4
158
—20 41
1956
1957
54,6
2054
,944
53,1
8253
,761
33,3
6734
,649
43 923,
341
3,67
77,
019
7,26
59,
412
8,07
89,
647
8,38
7—
235
—30
919
5819
59
1960
1961
1962
54,0
3959
,010
59,9
3960
,697
64,6
50
54,0
3959
,933
61,9
0863
,004
66,8
63
34,6
6537
,553
38,9
4539
,897
42,1
36
148 73 21 119
189
4,07
44,
280
4,33
44,
652
5,45
3
7,52
67,
925
8,59
28,
847
9,19
7
7,62
610
,102
10,0
169,
489
9,88
8
7,51
110
,120
9,86
69,
602
9,80
5
115
—18
150
—11
3 83
j19
6319
6466
,823
71,3
2369
,604
74,4
0843
,507
224
46,0
0326
0
(con
tinue
d)
5,80
06,
237
9,61
110
,141
10,4
6211
,767
10,6
9211
,680
—23
087
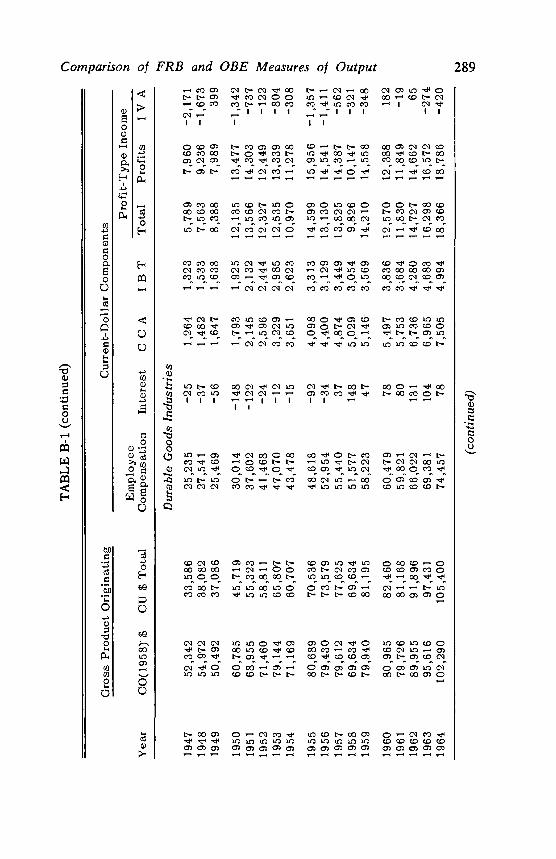
Gro
ss P
rodu
ctO
rigi
natin
gC
urre
nt-D
olla
rC
ompo
nent
s
Yea
rC
O(1
958)
$C
U $
Tot
alE
mpl
oyee
Com
pens
atio
nIn
tere
stC
C A
I B
TPr
ofit-
Typ
e In
com
eT
otal
Prof
itsI
V A
Dur
able
Goo
dsin
dust
ries
1947
52,3
4233
,586
25,2
35—
251,
264
1,32
35,
789
7,96
0—
2,17
119
4854
,972
38,0
8227
,541
—37
1,48
21,
533
7,56
39,
236
—1,
673
1949
50,4
9237
,086
25,4
69—
561,
647
1,63
88,
388
7,98
939
9
1950
60,7
8545
,719
30,0
14—
148
1,79
31,
925
12,1
3513
,477
—1,
342
1951
68,955
55,323
37,602
—122
2,145
2,132
13,566
14,303
—737
1952
71,4
6058
,811
41,4
68—
242,
596
2,44
412
,327
12,4
49—
122
1953
79,144
65,807
47,070
—12
3,229
2,985
12,535
13,339
—804
1954
71,1
6960
,707
43,4
78—
153,
651
2,62
310
,970
11,2
78—
308
1955
80,6
8970
,536
48,6
18—
924,
098
3,31
314
,599
15,9
56—
1,35
719
5679
,430
73,5
7952
,954
—34
4,40
03,
129
13,1
3014
,541
—1,
411
1957
79,6
1277
,625
55,4
4037
4,87
43,
449
13,8
2514
,387
—56
2
1958
69,6
3469
,634
51,5
7714
85,
029
3,05
49,
826
10,1
47—
321
1959
79,9
4081
,195
58,2
2347
5,14
63,
569
14,2
1014
,558
—34
8
1960
80,9
6582
,460
60,4
7978
5,49
73,
836
12,5
7012
,388
182
1961
79,726
81,168
59,821
80
5,753
3,684
11,830
11,849
—19
1962
89,955
91,896
66,022
131
6,736
4,280
14,727
14,662
65
1963
95,616
97,431
69,381
104
6,965
4,683
16,298
16,572
—274
1964
102,290
105,400
74,457
78
7,505
4,994
18,366
18,786
—420
(con
tinue
d)
TA
BL
E B
-i (
cont
inue
d)c.
.J

TA
BL
E B
-i (
cont
inue
d)
Gro
ss P
rodu
ctO
rigi
natin
gC
urre
nt-D
olla
rC
ompo
nent
s
Yea
rC
O(1
958)
$C
U $
Tot
alE
mpl
oyee
Com
pens
atio
nIn
tere
stC
CA
I B
Prof
it-T
ype
Inco
me
TT
otal
Prof
itsI
V A
C
Food
and
Kin
dred
Prod
ucts
,SI
C 2
0
1947
11,391
9,432
5,014
16
352
2,454
1,596
2,193
—597
1948
11,880
10,205
5,342
26
433
2,285
2,119
1,857
262
1949
11,3
8010
,208
5,44
532
497
2,34
61,
888
1,82
563
1950
12,3
6010
,605
5,77
933
•522
2,54
21,
729
2,03
01951
12,552
11,134
6,386
50
579
2,567
1,552
1,771
—219
1952
13,017
12,171
6,728
45
604
2,835
1,959
1,795
164
1953
13,977
12,719
7,141
28
616
2,908
2,026
1,978
48
1954
13,478
12,777
7,396
34
664
2,797
1,886
1,944
—58
1955
14,1
7413
,777
7,74
734
741
2,89
22,
363
2,16
020
319
5619
5714
,771
15,1
5814
,032
14,2
798,
246
8,52
135 46
761
808
3,08
72,
953
1,90
31,
951
2,04
61,
991
—14
3—
401958
1959
14,996
15,098
14,996
15,944
8,701
9,215
46
37
989
1,045
3,030
3,129
2,2aO
2,518
2,239
2,434
—9 84
1960
1961
1962
15,464
15,256
15,794
16,345
16,812
17,358
9,662
9,901
10,248
34
47
66
1,081
1,134
1,298
3,178
3,287
3,389
2,390
2,443
2,357
2,451
2,445
2,397
—61—2
—40
1963
1964
16,615
17,553
18,077
19,361
10,484
11,000
66
67
1,323
1,401
3,502
3,911
2,702
2,876
2,806
—174
176
(continued)

TA
BL
E B
-i (
cont
inue
d)
0 -'I 0
Gro
ss P
rodu
ctO
rigi
natin
gC
urre
nt-D
olla
rC
ompo
nent
s
Em
ploy
eeC
ompe
nsat
ion
Inte
rest
C C
AI
B T
Prof
it-T
ype
Inco
me
Yea
rC
O(1
958)
$C
U$
Tot
alT
otal
Prof
itsI
V A
Tob
acco
Man
ufac
ture
s, S
IC21
1947
2,01
11,
633
207
159
1,26
813
418
9—
551948
2,144
1,746
215
19
11
1,317
184
241
—57
1949
2,273
1,834
229
20
13
1,326
246
262
—16
1950
2,184
1,836
241
20
14
1,354
207
291
—84
1951
2,418
2,013
278
21
15
1,452
247
299
—52
1952
2,522
2,272
295
22
14
1,672
269
289
—20
1953
2,341
2,343
314
25
17
1,624
363
346
17
1954
2,200
2,262
326
24
19
1,552
341
332
9
1955
2,336
2,331
339
23
21
1,604
344
395
—51
1956
2,467
2,419
362
24
24
1,645
364
415
—51
1957
2,570
2,554
374
28
27
1,713
412
448
—36
1958
2,738
2,738
385
22
1,829
471
526
—55
1959
2,906
2,889
405
36:
1,872
557
574
—17
1960
3,027
3,025
439
22
40;
1,968
556
597
—41
1961
3,174
438
18
42
2,Q35
599
650
51
1962
3,29
33,
236
463
2252
2,04
865
164
110
1963
3,34
63,
410
476
1759
2,13
572
367
548
1964
3,25
93,
348
504
1859
2,087
680
650
30
(con
tinue
d)

t\)T
AB
LE
B-i
(co
ntin
ued)
Gro
ss P
rodu
ctO
rigi
natin
gC
urre
nt-D
olla
rC
ompo
nent
s
Yea
rC
O(1
958)
$C
U$
Tot
alE
mpl
oyee
Com
pens
atio
nIn
tere
stC
C A
I B
T
Prof
it-T
ype
Inco
me
Tot
alPr
ofits
I V
A
Tex
tile
Mill
Pro
duct
s, S
IC22
1947
1948
1949
3,73
04,
098
3,77
6
4,70
35,
253
4,20
3
3,11
4—
6
3,55
6—
5
3,17
2—5
131
157
173
59 67 62
1,40
51,
559
—15
41,
478
1,54
0—
62
801
639
162
1950
1951
1952
1953
1954
3,96
54,
079
4,07
83,987
3,793
4,59
55,
241
4,66
14,501
3,914
3,63
0—
1
3,77
114
3,65
510
3,690
7
3,322
11
192
208
216
229
240
70 76 69 71
68
704
1,19
6—
492
1,17
292
225
071
1460
251
504
470
34
273
258
15
1955
1956
1957
1958
1959
4,226
4,284
4,190
4,122
4,542
4,408
4,502
4,303
4,122
4,701
3,531
11
3,602
22
3,497
28
3,318
23
3,722
15
267
281
299
289
282
73
74
73
69
74
526
501
25
523
511
12
406
406
0
423
346
77
608
645
—37
1960
1961
1962
1963
1964
4,39
64,
396
4,80
84,
967
5,36
1
4,73
44,
506
4,95
75,
012
5,51
1
3,70
819
3,66
323
3,90
637
3,95
039
4,21
038
290
320
339
349
367
77 74 83 90 95
640
563
7742
648
0—
5459
259
3—
1
584
604
—20
801
752
49
(con
tinue
d)

TA
BL
E B
-i (
cont
inue
d)
0
Gro
ss P
rodu
ctO
rigi
natin
gC
urre
nt-D
olla
rC
ompo
nent
s
Em
ploy
eeC
ompe
nsat
ion
Inte
rest
C C
AI
BT
Prof
it-T
ype
inco
me
Yea
rC
O(1
958)
$C
U$
Tot
alT
otal
Prof
itsI
V A
App
arel
and
Rel
ated
Prod
ucts
,SI
C 2
3
1947
3,676
3,569
2,806
—7
46
38
686
797
—111
1948
3,88
83,
678
3,05
1—
455
4153
553
05
1949
3,83
93,
524
2,94
4—
564
4247
937
710
2
1950
4,18
43,
619
3,17
21
6644
336
559
—22
3
1951
4,48
04,
010
3,31
38
7144
574
474
100
1952
4,483
4,129
3,453
—3
73
45
561
481
80
1953
4,60
34,
272
3,66
6—
177
4848
244
141
1954
4,30
04,
076
3,53
0—
279
4942
041
010
1955
4,613
4,327
3,740
387
53
444
453
—9
1956
4,701
4,616
3,970
189
56
500
489
11
1957
4,62
94,
550
4,02
61
8255
386
381
5
1958
4,559
4,559
3,918
—2
95
59
489
447
42
1959
4,894
4,879
4,300
595
63
416
479
—63
1960
5,10
15,
101
4,41
44
9264
527
497
3019
615,
068
5,23
04,
451
810
770
594
587
7
1962
5,43
25,
682
4,86
416
121
7660
561
3—
8
1963
5,526
5,874
5,030
24
123
81
616
629
—13
1964
5,840
6,295
5,337
29
134
87
708
731
—23
(con
tinue
d)

TA
BL
E B
-i (
cont
inue
d)
(con
tinue
d)
Gro
ss P
rodu
ctO
rigi
natin
gC
urre
nt-D
olla
r C
ompo
nent
s
Yea
rC
O(1
958)
$C
U$
Tot
alE
mpl
oyee
Com
pens
atio
nIn
tere
stC
C A
I B
TPr
ofit-
Typ
e In
com
eT
otal
Prof
itsI
V A
Lum
ber
and
Woo
dPr
oduc
ts,
Exc
ept
Furn
iture
,SI
C 2
419
473,
285
2,65
11,
778
410
335
'T31
910
—17
91948
3,224
2,982
1,957
7144
45
829
857
—28
1949
2,979
2,562
1,732
8174
48
600
550
50
1950
3,239
3,213
2,066
6188
52
901
1,071
—170
1951
3,301
3,621
2,3T7
'T
229
58
950
925
25
1952
3,206
3,411
2,378
9242
61
721
719
2
1953
3,106
3,339
2,369
9247
60
654
633
21
1954
3,018
3,199
2,247
8250
65
629
651
—22
1955
3,487
3,'T55
2,515
9292
69
870.
912
—42
1956
3,475
3,798
2,588
14
304
77
815
776
39
1957
3,272
3,367
2,350
23
330
77
587
544
43
1958
3,306
3,306
2,297
20
295
82
612
646
—34
1959
3,619
3,861
20
322
81
822
862
—40
1960
3,550
3,674
2,555
32
339
88
660
574
86
1961
3,479
3,458
2,438
38
331
89
562
548
14
1962
3,78
43,
727
2,59
150
347
9564
465
7—
13
1963
3,96
54,
009
2,72
353
353
102
778
816
—38
1964
4,26
34,
425
2,97
064
397
109
885
896
—11
.4 .4 -4 C.,

TA
BL
E B
-i (
cont
inue
d)
(con
tinue
d)\0
Gro
ss P
rodu
ctO
rigi
natin
gC
urre
nt-D
olla
rC
ompo
nent
s
Em
ploy
eeC
ompe
nsat
ion
Inte
rest
.CC
AI
B
Prof
it-T
ype
Inco
me
TT
otal
Prof
itsI
V A
Y.e
arC
O(1
958)
$C
U $
Tot
al
Furn
iture
and
Fix
ture
s, S
IC 2
519
4719
4819
49
1,42
5'1
,'657
1,56
9
1,01
31,
238
1,21
9
901
991
949
1 1
—1
45 37 43
27 20 22
39 189
206
236
221
179
—19
7—
32 27
1950
1951
1952
1953
1954
1,90
11,
807
1,95
01,
946
1,87
2
1.,4
581,
603
1,687
1,63
6
1,16
31,
229
1,31
21,
394
1,32
9
0 1 .0 0 0
46 54 57 58 63
25 28 29 29 30
224
291
277
206
214
303
282
268
229
209
—79 9 9
—23
5
1955
1956
1957
1958
1959
2,17
12,
186
2,09
11,
911
2,18
0
1,89
32,
022
2,03
21,
911
•2,1
82
1,50
3
1,64
31,
597
1,78
7
2 2 0 1 0
71 71 70 78 87
34 38 37 41
283
316
281
198
267
325
340
277
214
278
4
—16 11
1960
1961
1962
1963
1964
2,14
72,
066
2,21
82,
282
2,46
0
2,21
12,
190
2,39
32,
487
2,71
6
1,817
1,782
1,94
32,
030
2,20
4
3 5 7 5 6
91 92 99 91 83
41 44 50 52 55
259
267
294
309
368
254
257
296
331
380
5
10 —2
—22
—12
:1

TA
BL
E B
-i (
cont
inue
d)C
'
Gro
ss P
rodu
ctO
rigi
natin
gC
urre
nt-D
olla
rC
ompo
nent
s
Yea
rC
O(1
958)
$C
U $
Tot
alE
mpl
oyee
Com
pens
atio
nIn
tere
stC
CA
I B
Prof
it-T
ype
Inco
me
TT
otal
Prof
itsI
V A
Pape
r an
d A
llied
Pro
duct
s, S
IC 2
619
473,
631
2,50
21,
408
—5
114
4094
51,
086
—14
1
1948
3,34
22,
630
1,57
3—
414
046
875
905
—30
1949
3,32
92,
457
1,54
4—
416
249
706
637
69
1950
4,32
83,
051
1,78
5—
917
754
1,04
41,
145
—10
119
514,
626
3,84
42,
053
—14
206
691,
530
1,57
1—
41
1952
4,11
43,
583
2,13
8—
1223
375
1,14
91,
118
3119
534,
528
3,80
82,
369
—14
266
811,
106
1,11
4—
8
1954
4,56
73,
923
2,45
1—
731
480
1,08
51,
081
4
1955
5,10
94,
424
2,67
9—
338
688
1,27
41,
327
—53
1956
5,28
05,
005
2,91
31
423
991,
569
1,57
5—
6
1957
4,88
24,
853
3,03
212
480
110
1,21
91,
244
—25
1958
4,82
04,
820
3,09
426
531
112
1,05
71,
060
—3
1959
5,48
05,
403
3,41
517
546
114
1,31
11,
319
—8
1960
5,39
75,
532
3,57
320
568
121
1,25
01,
199
5119
615,
737
5,73
73,
769
3762
212
81,
181
1,16
714
1962
6,12
16,
127
4,02
035
750
140
1,18
21,
155
2719
636,
584
6,17
14,
197
4075
514
81,
031
1,07
1—
4019
646,
746
6,59
84,
414
3883
215
71,
157
1,17
5—
18
(con
tinu
ed)

(con
tinue
d)
TA
BL
E B
-i (
cont
inue
d)
Gro
ss P
rodu
ctO
rigi
natin
gC
urre
nt-D
olla
rC
ompo
nent
s
Em
ploy
eeC
ompe
nsat
ion
Inte
rest
CC
AI
B
Prof
it-T
ype
Inco
me
TT
otal
Prof
itsI
V A
Yea
rC
O(1
958)
$C
U $
Tot
al
Prin
ting
and
Publ
ishi
ng, S
iC 2
7•
r.j
rzl
C.., -'I 0
1947
1948
1949
4,613
4,724
4,803
3,234
3,510
3,689
2,344
2,605
2,750
—7
—6
—3
82
103
123
54
62
69
761
746
750
825
795
744
—64
—49 6
1950
1951
1952
1953
1954
4,992
5,078
5,092
5,402
5,688
3,884
4,144
4,420
4,792
4,977
2,925
3,164
3,386
3,679
3,865
—5—5
—8
—9
—8
135
151
161
175
184
72
76
79
89
85
758
802
858
851
792
821
837
862
851
—35
—63
—35—4 0
1955
1956
1957
1958
1959
6,042
6,280
6,364
6,128
6,594
5,444
5,809
6,167
6,128
6,700
4,131
4,447
4,700
4,819
5,159
—12
—14
—20
—20
—17
217
235
265
295
311
92
99
105
110
115
1,016
1,042
1,117
924
1,132
1,037
1,070
1,147
925
1,148
—21
—28
—30
—1
—16
1960
1961
1962
1963
1964
6,764
6,765
7,041
7,018
7,701
7,122
7,239
7,689
7,923
8,671
5,487
5,668
5,900
6,138
6,550
—27
—25
—10 2 3
.
340
355
430
460
505
125
130
141
153
161
1,197
1,111
1,228
1,170
1,452
1,201
1,109
1,233
1,170
1,449
—4 2
—5 0 3

TA
BL
E B
-i (
cont
inue
d)
Gro
ss P
rodu
ctO
rigi
natin
gC
urre
nt-D
olla
r C
ompo
nent
s
Yea
rC
O(1
958)
$C
U $
Tot
alE
mpl
oyee
Com
pens
atio
nIn
tere
stC
CA
I B
Prof
it-T
ype
Inco
me
.
TT
otal
Prof
itsI
V A
00
Che
mic
als
and
Alli
ed P
rodu
cts,
SIC
28
1947
4,07
23,
685
2,17
4—
1721
662
1,25
01,
617
—36
71948
4,817
4,403
2,364
—13
279
70
1,703
1,523
180
1949
4,985
4,586
2,377
—16
331
80
1,814
1,574
240
1950
6,023
5,433
2,632
—27
374
86
2,368
2,657
—289
1951
6,503
6,542
3,200
—32
435
103
2,836
2,843
—7
1952
6,570
6,465
3,476
—5
548
126
2,320
2,205
115
1953
7,018
6,899
3,880
—3
672
133
2,217
2,233
—16
1954
7,252
7,208
4,017
8801
131
2,251
2,272
—21
1955
8,53
08,
462
4,30
05
931
145
3,08
12,
983
9819
5619
578,
981
9,39
58,
774
9,27
34,
773
5,16
1—
4 8
987
1,05
816
617
82,
852
2,86
82,
903
2,95
3—
51
—8.
5
1958
1959
1960
1961
1962
9,21
810
,92.
8
10,9
7511
,534
12,4
46
9,21
810
,775
10,7
6611
,165
11,9
61
5,23
85,
660
5,99
26,
233
6,60
0
34 13
—16 17 22
1,14
41,
252
1,24
41,
366
1,66
0
191
201
220
229
251
2,61
13,
649
3,32
03,
428
2,54
73,
564
3,29
73,
324
3,36
5
64 85 29 —4
631963
1964
13,088
14,009
12,604
13,491
6,939
7,367
30
34
-
(con
tinue
d)
1,768
1,854
293
311
3,574
3,925
3,674
4,042
—100
—117

'-4. 0 •1 0 '-4
TA
BL
E B
-i (
cont
inue
d)
Gro
ss P
rodu
ctO
rigi
natin
gC
urre
nt-D
olla
rC
ompo
nent
s
Yea
rC
O(1
958)
$C
U$
Tot
alE
mpl
oyee
Com
pens
atio
nIn
tere
stC
C A
I B
TPr
ofit-
Typ
e In
com
eT
otal
Prof
itsI
V A
Petr
oleu
m a
nd R
elat
ed I
ndus
trie
s,SI
C29
1947
2,070
1,881
965
9124
575
208
314
—106
1948
2,261
2,458
1,095
6107
630
620
652
—32
1949
2,269
1,934
1,134
19
148
650
—17
—44
27
1950
2,595
2,26.4
1,163
1135
707
258
265
—7
1951
2,624
2,798
1,395
—11
128
770
516
532
—16
1952
2,658
2,713
1,529
—16
135
1,023
42
30
12
1953
2,824
•3,144
1,626
—18
156
1,065
315
349
—34
1954
2,746
2,948
1,700
—2
276
1,091
—117
—145
28
1955
3,100
3,184
1,759
—25
252
1,192
615
—9
1956
3,179
3,678
1,858
—34
351
1,508
—5
21
—26
1957
3,144
3,291
1,991
—24
443
1,742
—861
—733
—128
1958
3,124
3,124
1,968
—1
451
1,787
—1,081
—1,137
56
1959
3,310
3,740
2,020
—30
462
1,977
—689
—726
37
1960
3,498
4,268
2,003
—57
413
2,458
—549
—499
—50
1961
3,530
4,187
2,059
—29
419
2,473
—735
—747
12
1962
3,826
4,217
2,033
—26
469
2,572
—831
—831
0
1963
4,068
4,700
2,068
—37
603
2,699
—633
—649
16
1964
4,508
4,925
2,081
—17
717
2,790
—646
—656
10
(con
tinue
d)

Gro
ss P
rodu
ctO
rigi
natin
gC
urre
nt-D
olla
r
Em
ploy
eeC
U $
Tot
alC
ompe
nsat
ion
Inte
rest
C C
A
Com
pone
nts
Yea
rC
O(1
958)
SI
B T
Prof
it-T
ype
Inco
me
Tot
alPr
ofits
I V
A
Rub
ber
and
Mis
c. P
last
ic P
rodu
cts,
SIC
30
1947
2,584
1,483
1,018
260
191
212
174
38
1948
2,403
1,442
1,008
565
178
186
190
—4
1949
2,185
1,333
941
558
170
159
126
33
1950
2,556
1,590
1,133
—1
60
212
186
410
—224
1951
3,210
2,173
1,339
—3
80
203
554
514
40
1952
3,181
2,246
1,441
090
205
510
379
131
1953
3,193
2,363
1,599
5103
213
443
385
58
1954
2,766
2,066
1,500
6118
193
249
295
—46
1955
3,187
2,521
1,785
7142
223
364
459
—95
1956
3,105
2,813
1,887
915
726
549
545
441
1957
3,067
2,941
2,015
10
180
316
420
392
28
1958
2,878
2,878
1,930
15
213
319
401
418
—17
1959
3,609
3,299
2,233
9213
360
484
509
—25
1960
3,764
3,350
2,268
14
224
358
486
408
781961
3,751
3,421
2,296
17
249
398
461
450
11
1962
4,275
3,899
2,623
20
297
473
486
476
10
1963
4,322
4,028
2,736
28
309
484
471
463
8
1964
4,703
4,360
2,96
932
321
511
527
522
5
TA
BL
E B
-i (
cont
inue
d)C p.
.r)
(con
tinue
d)

Gro
ss P
rodu
ctO
rigi
natin
gC
urre
nt-D
olla
rC
ompo
nent
s
Yea
rC
O(1
958)
$C
U $
Tot
alE
mpl
oyee
Com
pens
atio
nIn
tere
stC
C A
IB
T
Prof
it-T
ype
Inco
me
Tot
alPr
ofits
I V
A
Lea
ther
and
Lea
ther
Prod
ucts
,Si
C 3
1
1947
1,668
1,161
986
—2
20
15
142
257
—115
1948
1,735
1,289
1,017
—1
23
16
234
162
72
1949
1,57
61,
158
978
—1
2617
138
116
22
1950
1,54
51,
156
1,05
41
2416
6117
9—
118
1951
1,647
1,380
1,071
226
18
263
123
140
1952
1,535
1,397
1,157
028
18
194
155
39
1953
1,582
1,400
1,195
327
18
157
135
22
1954
1,491
1,390
1,158
226
18
186
147
39
1955
1,555
1,432
1,255
229
19
127
174
—47
1956
1,572
1,534
1,309
333
20
169
163
6
1957
1,545
1,550
1,332
335
20
160
158
2
1958
1,456
1,456
1,294
536
20
101
140
—39
1959
1,649
1,603
1,424
538
20
116
174
—58
1960
1,553
1,665
1,399
842
23
193
152
41
1961
1,486
1,575
1,419
638
23
89
137
—48
1962
1,614
1,737
1,479
737
24
190
163
27
1963
1,589
1,805
1,489
15
51
26
224
179
45
1964
1,643
1,848
1,571
18
47
31
181
209
—28
TA
BL
E B
-i (
cont
inue
d)
'.3 0 C(c
ontin
ued)

TA
BL
E B
-i (
cont
inue
d)
Gro
ss P
rodu
ctO
rigi
natin
gC
urre
nt-D
olla
rC
ompo
nent
s
Em
ploy
eeC
ompe
nsat
ion
Inte
rest
CC
AI
BT
Prof
it-T
ype
Inco
me
Yea
rC
O(1
958)
$C
U $
Tot
alT
otal
Prof
itsI
V A
Ston
e, C
lay,
and
Gla
ss P
rodu
cts,
SIC
32
1947
3,40
52,
067
1,49
5—
284
3245
851
9—
6119
483,
636
2,38
91,
699
—2
105
3655
160
9—
5819
493,
388
2,38
21,
629
—3
121
4059
559
7—
2
1950
4,05
82,
946
1,88
0—
613
642
894
927
—33
1951
4,35
63,
350
2,23
7—
715
950
911
936
—25
1952
4,11
43,
213
2,22
5—
618
655
753
763
—10
1953
4,42
33,
605
2,43
9—
923
070
875
920
—45
1954
4,32
33,
679
2,41
9—
925
065
954
973
—19
1955
4,97
34,
411
2,72
7—
1428
877
1,33
31,
368
—35
1956
4,89
74,
569
2,95
3—
1330
580
1,24
41,
288
—44
1957
4,75
54,
617
3,03
0-5
383
861,
123
1,16
1—
3819
584,
661
4,66
13,
010
—1
478
991,
075
1,10
5—
3019
595,
242
5,36
33,
416
—8
484
10.2
1,36
91,
382
—13
1960
5,12
85,
277
3,53
17
538
106
1,09
51,
095
019
615,
043
5,18
93,
485
854
911
11,
036
1,03
60
1962
5,35
85,
481
8,70
78
633
123
1,01
01,
012
—2
1963
5,73
95,
825
3,90
411
653
132
1,12
51,
123
219
646,
114
6,23
64,
191
1469
014
41,
197
1,20
7—
10
(con
tinu
ed)

C(c
ontin
ued)
TA
BL
E B
-i (
cont
inue
d)
Gro
ss P
rodu
ctO
rigi
natin
gC
urre
nt-D
olla
rC
ompo
nent
s
Yea
rC
O(1
958)
$C
U $
Tot
alE
mpl
oyee
Com
pens
atio
nIn
tere
stC
CA
IB
T
Prof
it-T
ype
Inco
me
Tot
alPr
ofits
I V
A
Prim
ary
Met
al in
dust
ries
, SIC
33
C.) -t -S. 0
1947
1948
1949
11,7
9611
,711
10,1
68
5,67
46,
277
5,98
9
4,17
34,
548
4,08
0
—1 1 6
325
352
384
111
111
122
1,06
61,
265
1,39
7
1,45
31,
539
1,28
4
—38
7—
274
113
1950
1951
1952
1953
1954
12,4
3014
,866
13,1
7115
,233
11,8
99
7,68
29,
841
8,94
310
,846
9,21
0
5,04
16,
225
6,26
57,
106
6,24
3
—14
—16 24 63 41
422
514
711
1,05
71,
229
131
152
176
221
193
2,10
22,
966
1,76
72,
399
1,50
4
2,31
53,
025
1,77
62,
457
1,56
5
—21
3—
59 —9
—58
—61
1955
1956
1957
1958
1959
14,5
7214
,308
13,9
8410
,912
12,1
81
11,7
8912
,591
13,2
,99
10,9
1212
,364
7,55
88,
262
8,67
57,
542
8,46
9
1 11 20 90 59
1,31
31,
347
1,40
01,
290
1,21
2
216
227
247
244
246
2,70
12,
744
2,95
71,
746
2,37
8
2,93
92,
826
2,81
81,
782
2,42
0
—23
8—
82
139
—36
—42
1960
1901
1962
1963
1964
12,0
0111
,286
12,0
5512
,722
14,2
08
12,5
8911
,647
12,7
4213
,371
15,1
32
8,90
58,
562
9,21
69,
492
10,4
76
58 34 59 51 47
1,32
81,
384
1,72
31,
778
1,94
2
269
278
307
323
344
2,02
91,
389
1,43
71,
727
2,32
3
1,97
01,
407
1,35
71,
782
2,48
0
59—
18 80—
55
—15
7

Gro
ss P
rodu
ctO
rigi
natin
gC
urre
nt-D
olla
rC
ompo
nent
s
Yea
rC
O(1
958)
$C
U $
Tot
alE
mpl
oyee
Com
pens
atio
nIn
tere
stC
C A
IB
TPr
ofit-
Typ
e In
com
eT
otal
Prof
itsI
V A
Fabr
icat
ed M
etal
Prod
ucts
,SI
C34
1947
5,913
4,127
3,135
—9
150
68
783
1,097
—314
1948
6,026
4,634
3,418
—6
164
82
976
1,196
—220
1949
5,403
4,225
3,176
—8
179
86
792
785
7
1950
6,56
65,
338
3,80
4—
1119
294
1,25
91,
387
—12
81951
6,908
6,355
4,524
—11
234
108
1,500
1,590
—90
1952
7,088
6,301
4,798
—5
264
116
1,128
1,202
—74
1953
7,875
6,954
5,472
—3
296
132
1,057
1,203
—146
1954
7,601
6,674
5,214
—4
318
132
1,014
1,054
—40
1955
8,089
7,377
5,768
—4
361
139
1,113
1,279
—166
1956
8,208
7,830
6,174
7362
151
1,136
1,325
—189
1957
8,409
8,291
6,526
7397
168
1,193
1,312
—119
1958
7,804
7,804
6,146
13
437
171
1,037
1,084
—47
1959.
8,726
8,630
6,830
12
453
174
1,161
1,176
—15
1960
8,750
8,706
7,063
22
501
189
931
921
10
1961
8,751
8,795
6,891
18
523
197
1,166
1,157
9
1962
9,464
9,596
7,455
28
648
215
1,250
1,234
16
1963
9,745
10,008
7,814
31
667
230
1,266
1,301
—35
1964
10,550
11,004
8,503
48
706
245
1,502
1,519
—17
TA
BL
E B
-i (
cont
inue
d)C
(con
tinue
d)
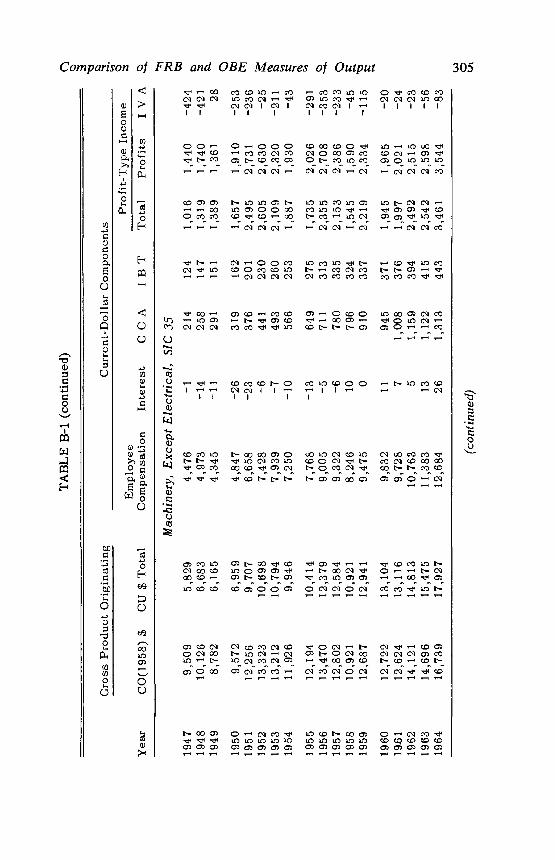
C(c
ontin
ued)
LS'
i
TA
BL
E B
-i (
cont
inue
d)
Gro
ss P
rodu
ctO
rigi
natin
gC
urre
nt-D
olla
rC
ompo
nent
s
Em
ploy
eeC
ompe
nsat
ion
Inte
rest
CC
AI
BT
Prof
it-T
ype
Inco
me
Yea
rC
O(1
958)
$C
U $
Tot
alPr
ofits
I V
A
Mac
hine
ry, E
xcep
t Ele
ctri
cal,
SIC
35
I—. 0 -t 0
1947
1948
1949
9,50
910
,126
8,78
2
5,82
96,
683
6,16
5
4,47
64,
973
4,34
5
—1
—14
—11
214
258
291
124
147
151
1,01
61,
319
1,38
9
1,44
01,
740
1,36
1
—42
4—
421 28
1950
1951
1952
1953
1954
9,57
212
,256
13,3
2313
,212
11,926
6,95
99,
707
10,6
9810
,794
9,946
4,84
76,
658
7,42
87,
939
7,250
—26
—23 —
6
—7
—10
319
376
441
493
566
162
201
230
260
253
1,65
72,
495
2,60
52,
109
1,887
1,91
02,
731
2,63
02,
320
1,930
—25
3—
236
—25
—21
1—43
1955
1956
1957
1958
1959
12,194
13,470
12,802
10,921
12,687
10,414
12,379
12,584
10,921
12,941
7,768
9,005
9,322
8,246
9,475
—13—5
—6 10 0
649
711
780
796
910
275
313
335
324
337
1,735
2,355
2,153
1,545
2,219
2,026
2,708
2,386
1,590
2,334
—291
—353
—233
—45
—115
1960
19.61
1962
1963
1964
12,722
12,624
14,121
14,696
16,739
13,104
13,116
14,813
15,475
17,927
9,832
9,728
10,763
11,383
12,684
11 7 5
13
26
945
1,008
1,159
1,122
1,313
371
376
394
415
443
1,945
1,997
2,492
2,542
3,461
1,965
2,021
2,515
2,598
3,544
—20
—24
—23
—56
—83

Gro
ss P
rodu
ctO
rigi
natin
gC
urre
nt-D
olla
rC
ompo
nent
s
Yea
rC
O(1
958)
$C
U $
Tot
alE
mpl
oyee
Com
pens
atio
nIn
tere
stC
C A
IB
TPr
ofit-
Typ
e In
com
eT
otal
Prof
itsI
V A
Ele
ctri
cal M
achi
nery
, SIC
36
1947
5,23
54,
167
3,18
9—
583
303
597
842
—24
519
485,
389
4,42
43,
342
—3
114
332
639
826
—18
719
494,
895
4,14
62,
998
—5
120
280
753
656
97
1950
6,15
75,
264
3,58
0—
2013
637
51,
193
1,36
1—
168
1951
7,06
26,
313
4,45
0—
1215
745
41,
264
1,36
5—
101
1952
8,29
97,
262
5,07
20
187
480
1,52
31,
523
019
539,
096
8,08
65,
931
—7
226
552
1,38
41,
479
—95
1954
8,12
37,
311
5,44
41
258
399
1,20
91,
240
—31
1955
8,77
97,
769
5,99
60
304
440
1,02
91,
192
—16
319
569,
501
8,67
46,
725
1134
244
81,
148
1,24
0—
92
1957
9,76
79,
552
7,15
322
380
464
1,53
31,
518
1519
589,
348
9,34
87,
063
1543
145
61,
383
1,39
1—
8
1959
11,0
8511
,185
8,41
5—
342
551
71,
831
1,87
7—
46
1960
11,6
6011
,532
9,09
7—
246
051
81,
459
1,41
841
1961
12,2
7412
,041
9,49
811
522
539
1,47
11,
461
1019
6214
,034
13,2
9010
,521
2159
159
01,
567
1,53
829
1963
-14
,770
13,6
3310
,717
2066
463
41,
598
1,61
4—
16
1964
15,6
2214
,091
11,0
83—
1071
866
71,
633
1,70
2—
69
TA
BL
E B
-i (
cont
inue
d)C C
'
(con
tinue
d)
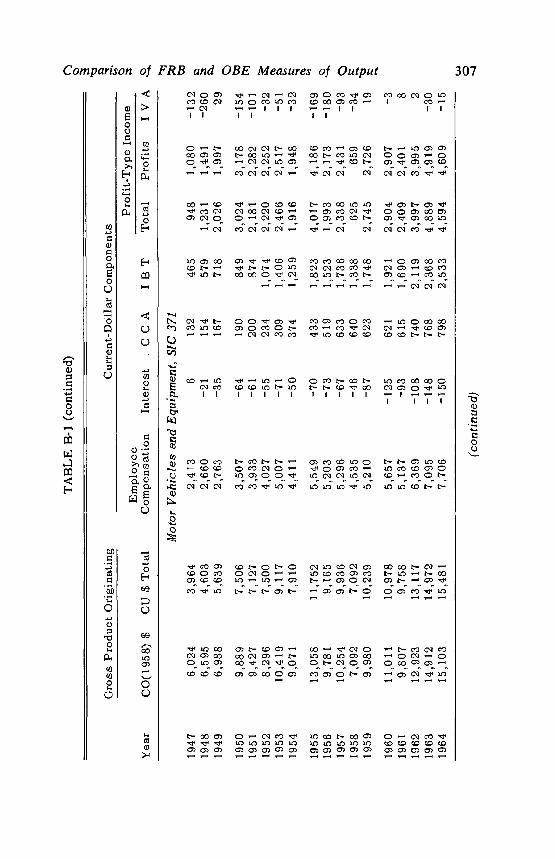
TA
BL
E B
-i (
cont
inue
d)
Gro
ss P
rodu
ctO
rigi
natin
gC
urre
nt-D
Olla
rC
ompo
nent
s
Yea
rC
O(1
958)
$C
U $
Tot
alE
mpl
oyee
Com
pens
atio
nIn
tere
stC
CA
IB
T
Prof
it-T
ype
Inco
me
.
Tot
alPr
ofits
I V
A
Mot
or V
ehic
les
and
Equ
ipm
ent,
SIC
371
1947
6,02
43,
964
2,41
36
132
465
948
1,08
0—
132
1948
6,59
54,
603
2,66
0—
2115
457
91,
231
1,49
1—
260
1949
6,98
85,
639
2,76
3—
3516
771
82,
026
1,99
729
1950
9,88
97,
506
3,50
7—
6419
084
93,
024
3,17
8—
154
1951
9,42
77,
127
3,93
3—
6120
087
42,
181
2,28
2—
101
1952
8,29
67,
500
4,02
7—
5523
41,
074
2,22
02,
252
—32
1953
10,4
199,
117
5,00
7—
7130
91,
406
2,46
62,
517
—51
1954
9,07
17,
910
4,41
1—
5037
41,
259
1,91
61,
948
—32
1955
13,0
5811
,752
5,54
9—
7043
31,
823
4,01
74,
186
—16
919
569,
781
9,16
55,
203
—73
519
1,52
31,
993
2,17
3—
180
1957
10,2
549,
936
5,29
6—
6763
31,
736
2,33
82,
431
—93
1958
7,09
27,
092
4,53
5—
4664
01,
338
625
659
—34
1959
9,98
010
,239
5,21
0—
8762
31,
748
2,74
52,
726
19
1960
11,0
1110
,978
5,65
7—
125
621
1,92
12,
904
2,90
7—
3
1961
9,80
79,
758
5,13
7—
9361
51,
690
2,40
92,
401
8
1962
12,9
2313
,117
6,36
9—
108
740
2,11
93,
997
3,99
52
1963
14,9
1214
,972
7,09
5—
148
768
2,36
84,
889
4,91
9—
30
1964
15,1
0315
,481
7,70
6—
150
798
2,53
34,
594
4,60
9—
15
C(c
ontin
ued)

TA
BL
E B
-i (
cont
inue
d)
Gro
ss P
rodu
ctO
rigi
natin
gC
urre
nt-D
olla
rC
ompo
nent
s
Yea
rC
O(1
958)
$C
U $
Tot
alE
mpl
oyee
Com
pens
atio
nIn
tere
stC
CA
IB
T
Prof
it-T
ype
Inco
me
Tot
alPr
ofits
I V
A
0 00
Tra
nspo
rtat
ion
Equ
ipm
ent a
nd O
rdna
nce,
Exc
ept M
otor
Veh
icle
s, S
IC 3
7+19
-371
1947
1948
1949
2,655
3,215
3,151
1,670
2,157
2,193
1,797
1,906
1,860
—19—4
—8
55
62 71
49
61 61
—212
132
209
—74
260
207
—138
—128 2
1950
1951
1952
1953
1954
3,324
4,890
7,598
9,139
8,763
2,360
3,927
6,063
7,311
7,107
1,913
3,391
5,145
6,240
5,813
—14—2 8 5 0
68 98
137
168
187
71
81 98
118
113
322
359
675
780
994
393
444
684
948
1,031
—71
—85—9
—168
—37
1955
1956
1957
1958
1959
8,428
8,495
9,322
8,791
8,756
7,012
7,790
9,098
8,791
8,905
5,935
6,827
7,671
7,440
7,926
—7 0
25
24
37
204
220
261
317
351
119
133
153
158
164
761
610
988
852
427
960
1,043
1,190
902
504
—199
—433
—202
—50
—77
1960
1961
1962
1963
1964
8,534
8,877
10,145
10,666
10,885
8,781
9,179
10,541
11,167
11,636
7,768
7,994
8,866
9,445
9,614
52
40
47
40 2
392
404
445
483
544
170
191
209
230
242
399
550
974
969
1,234
375
554
973
1,005
1,279
24—4 1
—36
—45
-4
C..,
(con
tinue
d)

TA
BL
E B
-i (
cont
inue
d)
Gro
ss P
rodu
ct O
rigi
natin
gC
urre
nt—
Dol
lar
Com
pone
nts
Em
ploy
eeC
ompe
nsat
ion
Inte
rest
C C
AI
B T
it-T
ype
inco
me
Yea
rC
O(1
958)
$C
U $
Tot
al
Prof
Tot
alPr
ofits
I V
A
Inst
rum
ents
and
Rel
ated
Pro
duct
s,SI
C 3
8
1947
1948
1949
1,366
1,466
1,42
9
904
1,013
1,01
9
766
—2
835
—l
806
—2
19
21
23
50
60 53
71
98
139
104
121
115
—33
—23 24
1950
1951
1952
1953
1954
1,675
2,015
2,300
2,500
2,468
1,218
1,602
1,831
2,035
2,058
950
—2
1,217
—3
1,413
0
1,595
1
1,576
0
2747
56 60
66
60
63
53
61
42
183
278
309
318
374
189
299
306
336
383
—6
—21 3
—18
—9
1955
1956
1957
1958
1959
2,61
02,
759
2,64
62,
604
2,98
0
2,20
82,
489
2,56
42,
604
3,05
4
1,68
2—
1
1,89
22
2,03
56
1,99
010
2,22
69
79 107
116
134
143
49 59 61 63 72
399
429
346
407
604
408
443
389
423
611
—9
—14
—43
—16 —
7
1960
1961
1962
1963
1964
3,01
73,
019
3,25
13,
531
3,62
2
3,15
33,
218
3,52
43,
813
3,94
1
2,33
68
2,38
26
2,55
08
2,67
713
2,78
518
160
209
232
256
192
73 77 81 9110
0
576
544
653
776
846
589
563
662
760
839
—13
—19 —
9
16 7
0 'I C., 0 C
(con
tinue
d)

TA
BL
E B
-i (
conc
lude
d)
Gro
ss P
rodu
ctO
rigi
natin
gC
urre
nt-D
olla
r C
ompo
nent
s
Yea
rC
O(1
958)
$E
mpl
oyee
CU
$ T
otal
Com
pens
atio
nIn
tere
stC
C A
IB
T
Prof
it-T
ype
Inco
me
Tot
alPr
ofits
I V
A
Mis
cella
neou
s M
anuf
actu
ring
Ind
ustr
ies,
SIC
39
1947
1,72
91,
520
1,11
23
5459
292
353
—61
1948
1,92
71,
682
1,21
25
7160
334
376
—42
1949
1,74
01,
547
1,13
13
7457
282
258
24
1950
1,97
41,
775
1,26
33
6964
376
443
—67
1951
2,06
71,
877
1,36
15
7763
371
424
—53
1952
2,11
51,
914
1,40
57
8172
349
326
2319
532,
195
2,03
31,
578
785
7628
729
7—
10
1954
2,10
51,
977
1,53
28
9072
275
294
—19
1955
2,32
82,
156
1,61
75
104
7235
836
1—
3
1956
2,35
02,
272
1,72
810
112
8234
037
9—
39
1957
2,31
02,
285
1,73
912
124
8432
636
1—
3519
582,
284
2,28
41,
711
1213
382
346
351
—5
1959
2,50
42,
471
1,85
38
136
8738
738
8—
1
1960
2,44
52,
455
1,91
812
122
9031
332
0—
7
1961
2,57
71,
924
611
692
439
444
—5
1962
2,60
22,
672
2,04
16
119
9740
942
3—
1419
632,
588
2,67
12,
101
1513
010
631
932
3—
4
1964
2,72
42,
811
2,24
113
122
112
323
331
—8
0
Not
e: S
ee th
e be
ginn
ing
of th
is a
ppen
dix
for
the
expl
anat
ion
of th
e ab
brev
iatio
ns u
sed
in th
ese
tabl
es.

Comparison of FRB and OBE Measures of Output 311
process. Value is generally fob plant and excludes excise taxes. For moredetailed explanation, see 1958 Census of Manufactures.
Cost of Materials (column 5) = Deflated cost of materials, supplies, com-ponents, semifinished goods, fuels and electricity actually consumed orput into production during the year and cost of products purchased forresale. Cost includes direct charges actually paid or payable for itemsconsumed after discounts and including freight and other direct charges.For more detailed explanation, see 1958 Census of Manufactures.
Value Added—VA (column 6) = Deflated value of production (above) lessdeflated cost of materials, etc. (above). Equivalent to adjusted Censusvalue added by manufactures.
VA plus Excise (column 7) = Deflated value added (above) plus deflatedfederal excise taxes for which the given industry is legally liable.
OBE Gross Product (column 8) = Deflated current-dollar total of grossproduct originating in the specified industry. For derivation, see Ap-pendix A.
Total (FRB — OBE) (column 9) = Published FRB index (column 1) minuspublished OBE index (column 8). Differences between the two seriesmay arise from weights and measures of output.
FR.B (Net Minus Gross Wtd.) (column 10) = Published FRB index weightedby 1957—59 Census value added (column 1) minus FRB series weightedby 1958 Census value of production (column 3). Since the identical FRBoutput relatives are used in the calculations of both indexes, discrepanciesbetween the two series arise because of weighting differences. Such dis-parities are the result of relative differences in the individual industry'scontribution to the major group when computed on a net- or gross-outputbasis.
Total Output (Quantity Minus Deflated) (column 11) = FRB series weightedby 1958 Census value of production (column 3) minus Census series ofdeflated value of production (column 4). This series generally reflectsthe difference in total output derived by a quantity extrapolationtechnique vis-à-vis a deflation procedure. However, differences betweenthe series may arise from data limitations. For example, the two seriesmay differ because of coverage (see discussion for Major Group 34),adjustments due to SIC changes particularly in years when the FRBindexes are linked (Major Group 26) and in changes since 1958 in FRBprocedures to derive annual measures (Major Group 25).
Total Minus Net Output (column 12) = Deflated Census value of produo-tion (column 4) minus deflated Census value added (column 6). Thisseries measures differences between the movement of gross and net out-put as derived from deflated Census data. Movement differences betweentotal and net output reflect the industry changes unit costs relative tounit output because of shifts in product mix, substitutions of materials,technological changes, and other circumstances influencing the amountof work done in an industry.
312 Basic industry Product Estimates
Excise Tax (column 13) = Deflated Census value added (column 6) minusdeflated Census value added plus excise tax (column 7). This differenceillustrates the effect of the addition of manufacturer's excise taxes to thevalue of net output. Since Census value added excluding excise taxes isused to weight the published FRB series and the OBE series includes thisnonfactor payment, the difference between the two series quite often is re-lated to these taxes, cf. SIC 20, 21, 29, 30, 36 and 371.
Net Output (Census — OBE) (column 14) = Census value added plus excisetaxes (column 7) minus published OBE (column 8). Disparities betweenthese two measures are based on differences in the movements of thecurrent-dollar series and partially reflect changes occasiond by the con-ceptual differences between the two measures including inventory valua-tion adjustment (IVA) in the GPO series. The use of independent datasources may also be a cause of differences and reflect differencs in classifi-cation by the several government agencies.
In addition to measures of trend, shown below, averages of the absolutevalue of the percentage changes over the entire period for each of the seriesshown in columns 1 through 8 were computed. The standard deviation ofthese percentage changes was also calculated. The results indicated thatgenerally the averages and the distribution about these averages for each ofthe series were approximately of the same magnitude by industry. The varia-tion in any one series was not significantly greater than the variation in theothers,.
GROWTH RATES
The average annual growth rates of the various series by industry forselected periods are shown below. These measures show the average annualcompounded rate of change between the initial and terminal years of eachperiod. The computations are based on the "Growth Rate Conversion Tables"appearing in Bureau of the Census, Long Term Economic Growth 1860—1965, ES-4-No. 1, October 1966, p. 115.
Appendix D: Implicit Price Deflators by industry Groups and byindustry, 1947—64
EXPLANATION OF ABBREVIATIONS USED IN TABLES
These tables contain implicit price deflators (current-dollar series dividedby constant-dollar series) for the series indicated below. A descriptionof how these price deflators are derived appears in Appendix A.
Value of Production (VP) = Census value of shipments plus change in in-ventory of finished goods and work in process.
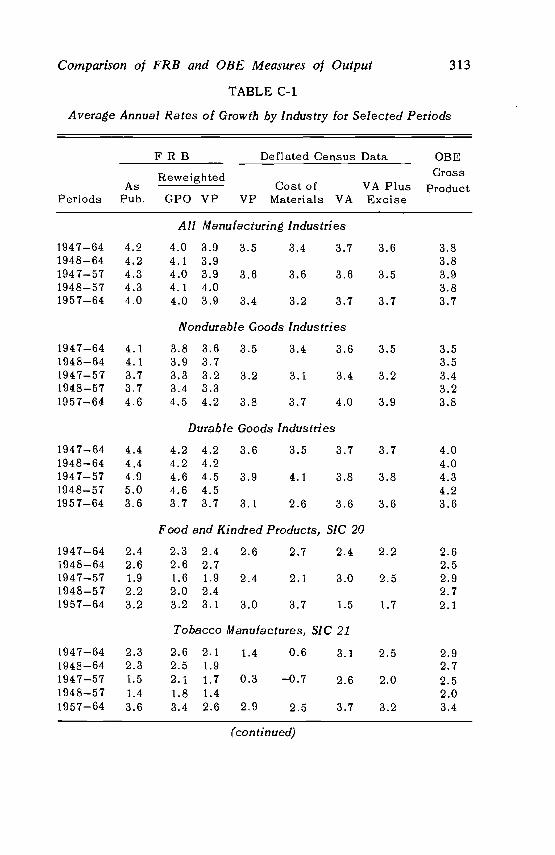
Comparison of FRB and OBE Measures of Output 313
TABLE C-i
Average Annual Rates of Growth by Industry for Selected Periods
F R B Deflated Census Data OBE
AsReweighted
Cost of VA PlusGross
ProductPeriods Pub. GPO VP VP Materials VA Excise
All Manufacturing Industries
1947—64 4.2 4.0 3.9 3.5 3.4 3.7 3.6 3.81948—64 4.2 4.1 3.9 3.81947—57 4.3 4.0 3.9 3.6 3.6 3.6 3.5 3.91948—57 4.3 4.1 4.0 3.81957—64 4.0 4.0 3.9 3.4 3.2 3.7 3.7 3.7
Nondurable Goods Industries
1947—64 4.1 3.8 3.6 3.5 3.4 3.6 3.5 3.51948—64 4.1 3.9 3.7 3.51947—57 3.7 3.3 3.2 3.2 3.1 3.4 3.2 3.41948—57 3.7 3.4 3.3 3.21957—64 4.6 4.5 4.2 3.8 3.7 4.0 3.9 3.8
Durable Goods Industries
1947—64 4.4 4.2 4.2 3.6 3.5 3.7 3.7 4.01948—64 4.4 4.2 4.2 4.01947—57 4.9 4.6 4.5 3.9 4.1 3.8 3.8 4.31948—57 5.0 4.6 4.5 4.21957—64 3.6 3.7 3.7 3.1 2.6 3.6 3.6 3.6
Food and Kindred Products, SIC 20
1947—54 2.4 2.3 2.4 2.6 2.7 2.4 2.2 2.61948—64 2.6 2.6 2.7 2.51947—57 1.9 1.6 1.9 2.4 2.1 3.0 2.5 2.91948—57 2.2 2.0 2.4 2.71957—64 3.2 3.2 3.1 3.0 3.7 1.5 1.7 2.1
Tobacco Manufactures, SIC 21
1947—64 2.3 2.6 2.1 1.4 0.6 3.1 2.5 2.91948—64 2.3 2.5 1.9 2.71947—57 1.5 2.1 1.7 0.3 —0.7 2.6 2.0 2.51948—57 1.4 1.8 1.4 2.01957—64 3.6 3.4 2.6 2.9 2.5 3.7 3.2 3.4
(continued)

314 Basic Industry Product Estimates
TABLE C-i (continued)
F R B Deflated Census Data OBEGross
ProductAsReweighted
Cost of VA PlusPeriods Pub. GPO VP VP Materials VA Excise
Textile Mill Products, SIC 22
1947—6419 48—641947—571948—57195 7—64
2.21.91.30.73.5
2.21.91.20.6
2. 11.8
3.2
1.2 2.20.6
3.5 3.5 4.5
3.5
2.5
4.9
2.7 2.7
1.9 1.9
3.9 3.9
Apparel and Related Products, SIC 23
194 7—641948— 641947— 5 7
1948—57195 7—64
3.53.52.72.54.8
3.53.42.62.44.7
3.63.52.72.54.9
2.9
3.1
2.7
3.1
3.3
2.7
2.7 2.7
2.8 2.8
2.7 2.7
Lumber and Wood Products Except Furniture, SIC 24
19 47—641948— 641947— 5 7
1948—5719 57—64
1.41.30.80.52.3
1.6 1.61.5 1.51.0 1.00.7 0.72.6 2.5
1.9
1.0
3.3
2.9
Furniture and Fixtures, SIC 25
1947—641948— 641947—571948—57195 7—64
4.54.63.63.65.8
4.54.63.63.65.9
4.64.63.63.65.9
3.2
3.3
3.0
3.8
3.7
3.9
2.6 2.6
2.9 2.9
2.2 2.2
Paper and Allied Products, SiC 26
1947—641948— 641947—5 71948—5 71957—64
4.64.74.44.64.8
4.44.54.24.44.8
4.54.64.34.54.9
4.0
3.8
4.2
4.3
4.6
3.7
3.7 3.7
2.9 2.9
4.8 4.8
(continued)
2.21.71.20.23.6
2.82.62.32.03.4
0.9 0.9
2.7 —0.7 —0.7
3.2
1.51.80.00.23.83.3 3.3
3.32.53.92.62.3
3.74.53.04.34.7
0
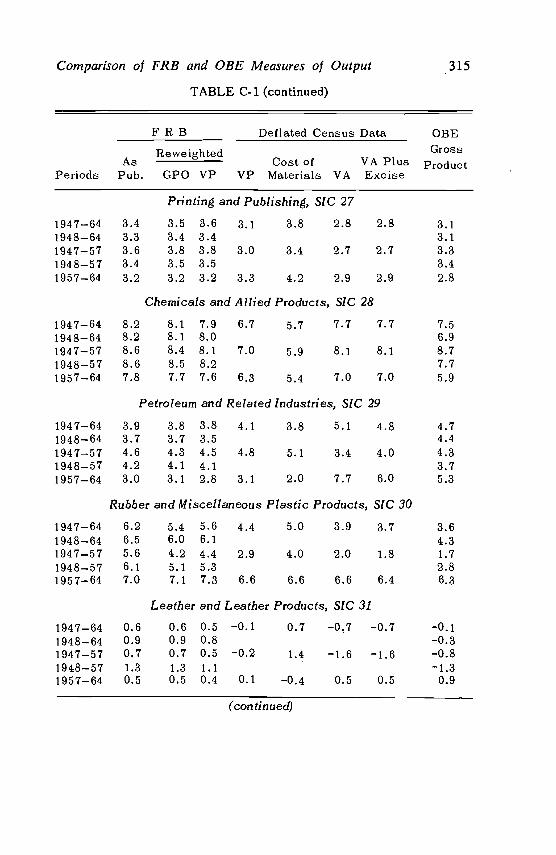
Comparison of FRB and OBE Measures of Output 315
TABLE C-i (continued)
F R B Deflated Census Data OBEGross
ProductAsReweighted
Cost of VA PlusPeriods Pub. GPO VP VP Materials VA Excise
Printing and Publishing, SIC 27
1947—64 3.4 3.5 3.6 3.1 3.8 2.8 2.8 3.11948—64 3.3 3.4 3.4 3.11947—57 3.6 3.8 3.8 3.0 3.4 2.7 2.7 3.31948—57 3.4 3.5 3.5 341957—64 3.2 3.2 3.2 3.3 4.2 2.9 2.9 2.8
Chemicals and Allied Products, SIC 28
1947—64 8.2 8.1 7.9 6.7 5.7 7.7 7.7 7.51948—64 8.2 8.1 8.0 6.91947—57 8.6 8.4 8.1 7.0 5.9 8.1 8.1 8.71948—57 8.6 8.5 8.2 7.71957—64 7.8 7.7 7.6 6.3 5.4 7.0 7.0 5.9
Petroleum and Related Industries, SIC 29
1947—64 3.9 3.8 3.8 4.1 3.8 5.1 4.8 4.71948—64 3.7 3.7 3.5 4.41947—57 4.6 4.3 4.5 4.8 5.1 3.4 4.0 4.31948—57 4.2 4.1 4.1 371957—64 3.0 3.1 2.8 3.1 2.0 7.7 6.0 5.3
Rubber and Miscellaneous Plastic Products, SIC 30
1947—64 6.2 5.4 5.6 44 5.0 3.9 3.7 3.61948—64 6.5 6.0 6.1 431947—57 5.6 4.2 4.4 2.9 4.0 2.0 1.8 1.71948—57 6.1 5.1 5.3 2.81957—64 7.0 7.1 7.3 6.6 6.6 6.6 6.4 6,3
Leather and Leather Products, SIC 31
1947—64 0.6 0.6 0.5 —0.1 0.7 —0.7 —0.7 —0.1
1948—64 0.9 0.9 0.8 —0.31947—57 0.7 0.7 0.5 —0.2 1.4 —1.6 —1.6 —0.81948—57 1.3 1.3 1.1 —1.31957—64 0.5 0.5 0.4 0.1 —0.4 0.5 0.5 0.9
(continued)
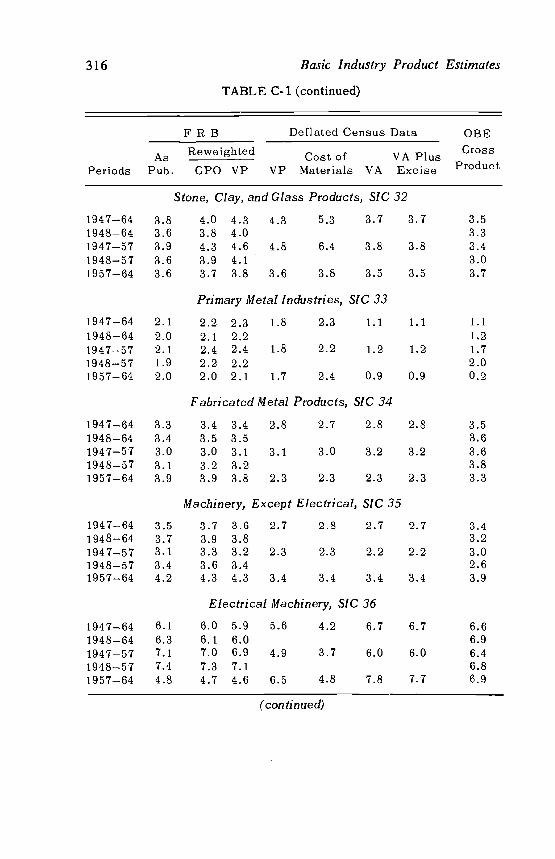
316 Basic Industry Product Estimates
TABLE C-i (continued)
AsPeriods Pub.
F R B Deflated Census Data OBEGross
ProductReweighted Cost of
GPO VP VP Materials VAVA PlusExcise
Stone, Clay, and Glass Products, SIC 32
1947—64 3.8 4.0 4.3 4.3 5.3 3.7 3.51948—64 3.6 3.8 4.0 3.31947—57 3.9 4.3 4.6 4.8 6.4 3.8 3.8 3.41948—57 3.6 3.9 4.1 3.01957—64 3.6 3.7 3.8 3.6 3.8 3.5 3.5 3.7
Primary Metal Industries, SIC 33
1947—64 2.1 2.2 2.3 1.8 2.3 1.1 1.1 1.11948—64 2.0 2.1 2.2 1.21947—57 2.1 2.4 2.4 1.8 2.2 1.2 1.2 1.71948—57 1.9 2.2 2.2 2.01957—64 2.0 2.0 2.1 1.7 2.4 0.9 0.9 0.2
Fabricated Metal Products, SiC 34
1947—64 3.3 3.4 3.4 2.8 2.7 2.8 2.8 3.51948—64 3.4 3.5 3.5 3.61947—57 3.0 3.0 3.1 3.1 3.0 3.2 3.2 3.61948—57 3.1 3.2 3.2 3.81957—64 3.9 3.9 3.8 2.3 2.3 2.3 2.3 3.3
Machinery, Except Electrical, SIC 35
1947—64 3.5 3.7 3.6 2.7 2.7 2.7 3.41948—64 3.7 3.9 3.8 3.21947—57 3.1 3.3 3.2 2.3 2.3 2.2 2.2 3.01948—57 3.4 3.6 3.4 2.61957—64 4.2 4.3 4.3 3.4 3.4 3.4 3.4 3.9
Electrical Machinery, SIC 36
1947—64 6.1 6.0 5.9 5.6 4.2 6.7 6.7 6.61948—64 6.3 6.1 6.0 6.91947—57 7.1 7.0 6.9 4.9 3.7 6.0 6.0 6.41948—57 7.4 7.3 7.1 6.81957—64 4.8 4.7 4.6 6.5 4.8 7.8 7.7 6.9
(continued)
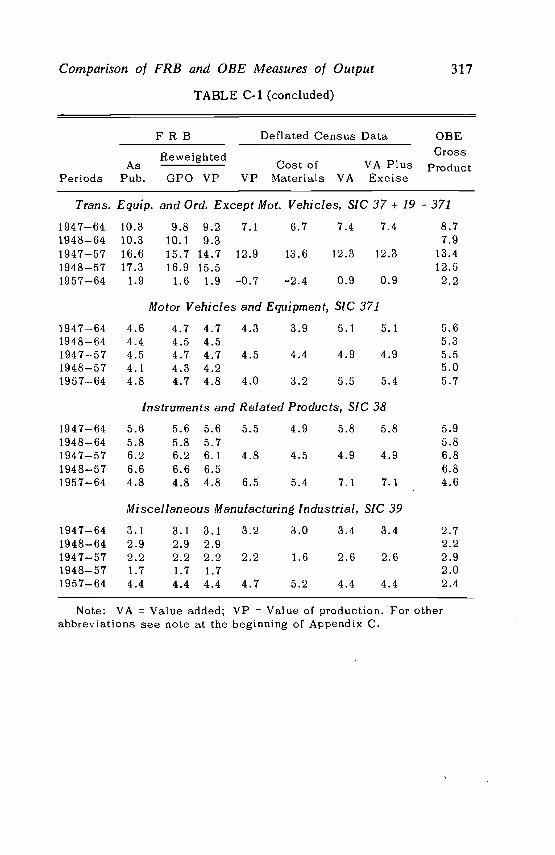
Trans.
194 7—641948—641947—571948— 5719 57—64
1947— 641948— 64194 7—5 71948—57195 7—. 64
1947— 641948— 641947—5 71948—571957— 64
1947—64194 8—641947—571948—5 7195 7—64
8.77.9
13.412.52.2
5.65.35.55.05.7
5.95.86.86.84.6
2.72.22.92.02.4
Comparison of FRB and OBE Measures of Output
TABLE C-i (concluded)
317
F R B Deflated Census Data OBEGross
ProductAsRe we i g h ted
Cost of VA PlusPeriods Pub. GPO VP VP Materials VA Excise
Equip. and Ord. Except Mot. Vehicles, SIC 37 + 19 - 371
10.3 9.8 9.2 7.1 6.7 7.4 7.410.3 10.1 9.316.6 15.7 14.7 12.9 13.6 12.3 12.317.3 16.9 15.51.9 1.6 1.9 —0.7 —2.4 0.9 0.9
Motor Vehicles and Equipment, SIC 371
4.6 4.7 4.7 4.3 3.9 5.1 5.14.4 4.5 4.54.5 4.7 4.7 4.5 4.4 4.9 4.94.1 4.3 4.24.8 4.7 4.8 4.0 3.2 5.5 5.4
Instruments and Related Products, SIC 38
5.6 5.6 5.6 5.5 4.9 5.8 5.85.8 5.8 5.76.2 6.2 6.1 4.8 4.5 4.9 4.96.6 6.6 6.54.8 4.8 4.8 6.5 5.4 7.1 7.1
Miscellaneous Manufacturing Industrial, SIC 39
3.1 3.1 3.1 3.2 3.0 3.4 3.42.9 2.9 2.92.2 2.2 2.2 2.2 1.6 2.6 2.61.7 1.7 1.74.4 4.4 4.4 4.7 5.2 4.4 4.4
Note: VA = Value added; VP Value of production. For otherabbreviations see note at the beginning of Appendix C.

Sele
cted
Mea
sure
s of
Man
ufac
turi
ng A
ctiv
ity19
47—
1964
:Fo
od a
nd K
indr
ed P
rodu
cts,
SIC
20
Inde
xes
(195
8 =
100)
Poin
t Dif
fere
nces
In
Inde
xesa
FRB
Tot
alT
otal
(Net
Out
put
Tot
al(F
RB
Min
us(Q
uant
ity M
inus
Min
us G
ross
Min
usN
etE
xcis
eO
BE
)W
td.)
Def
ltd.)
Out
put
Tax
(9)
(10)
(11)
(12)
(13)
Net
Out
put
(Cen
sus
Min
usO
BE
)(1
4)
FRB
Def
late
d C
ensu
s D
ata
OB
EG
ross
Prod
uct
(8)
Yea
r
As
Pub.
(1)
Rew
eigh
ted
VA
Cos
tPl
usG
POV
PV
PM
at.
VA
Exc
ise
(2)
(3)
(4)
(5)
(6)
(7)
1947
1948
1949
81.0
80.2
81.1
83.2
81.5
78.0
77.8
78.6
81.2
81.4
79.2
81.8
80.6
78.5
80.4
73.9
76.2
76.0
79.2
75.9
5.0
—.5
3.5
—.6
—2.
61.
01.
05.
2.5
2.1
4.6
—2.
3
5.2 .3
1950
1951
1952
1953
1954
84.0
85.6
87.4
88.7
90.7
85.7
83.2
80.3
79.4
82.4
84.7
87.2
85.5
82.4
80.9
85.9
87.5
87.4
88.1
85.3
84.8
86.6
87.9
89.2
89.1
87.6
85.6
92.3
93.1
90.6
91.2
87.3
86.9
88.2
89.0
82.4
83.7
86.8
93.2
89.9
1.6
.82.
9—
2.1
—2.
31.
9.1
3.1
—3.
5—
1.6
.6—
.72.
8—
1.3
—1.
3—
4.5
—.4
1.5
—4.
7—
.8.8
—.5
3.9
—.9
—.8
2.3
3.8
1.1
—.1
—.9
1955
1956
1957
1958
1959
94.2
97.8
97.7
100.
010
4.5
94.3
95.4
92.9
93.0
92.6
93.3
98.2
98.9
97.7
96.6
100.
310
0.8
97.6
98.1
98,5
95.6
105.
410
4.4
100.
010
0.0
100.
0 10
0.0
100.
010
4.7
105.
110
4.2
106.
499
.299
.7
94.5
98.5
101.
110
0.0
100.
7
—.3
—1.
22.
5.3
—.7
—.7
—1.
11.
2—
2.6
—.5
—3.
4—
.4—
.4—
6.9
1.0
.0.0
.0.0
.03.
8—
.6.9
5.0
—.5
—1.
22.
33.
3 .0—
1.0
1960
1961
1962
1963
1964
107.
411
1.0
114.
311
7.7
121.
7
107.
510
7.8
107.
4 10
8.5
104.
710
4.7
111.
111
1.4
109.
4 11
2.4
102.
210
3.0
114.
111
4.1
112.
7. 1
15.3
106.
610
7.2
117.
411
7.5
115.
8 11
7.4
111.
911
2.1
121.
8121.4
121.3 123.1
116.9
117.3
103.
110
1.7
105.
311
0.8
117.
1
4.3
—.4
.42.
7.0
9.3
—.4
2.0
7.2
—.8
9.0
.21.
46.
1—
.66.
9.2
1.7
3.9
—.2
4.6
.3
.1
4.4
—.4
1.6
1.3
1.9
1.3 .2
Not
e: V
P=
val
ueof
VA
=va
lue
adde
d. F
orot
her
abbr
evi
atio
ns s
ee n
ote
at th
epr
oduc
tion;
begi
nnin
g of
App
endi
x C
.aC
ol 9
col.
1 —
col.
8; c
ol. 1
0co
l.I
—co
l.3;
col
. 11
=co
l.3 —
col.
4; c
ol. 1
2 =
col.
4 —
col.
6; c
ol. 1
3 =
col.
6—co
l.7; col. 14 =
col.
7 —
col.
8.
00
TA
BL
E C
-2
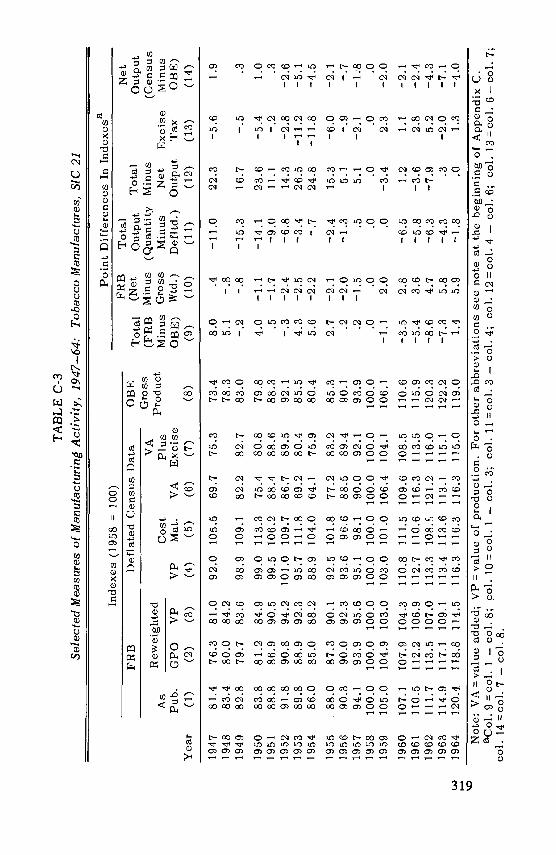
TA
BL
E C
-3Se
lect
ed M
easu
res
of M
anuf
actu
ring
Act
ivity
, 194
7—64
: Tob
acco
Man
ufac
ture
s, S
IC 2
1
Inde
xes
(195
8 =
100)
Poin
t Dif
fere
nces
In
Inde
xesa
Tot
al(F
RB
Min
usO
BE
)
FRB
(Net
Min
usG
ross
Wtd
.)
Tot
alO
utpu
t(Q
uant
ityM
inus
Def
ltd.)
Tot
alM
inus
Net
Out
put
Exc
ise
Tax
Net
Out
put
(Cen
sus
Min
usO
BE
)
FRB
Def
late
d C
ensu
sD
ata
OB
EG
ross
Prod
uct
As
Rew
eig
Cos
tV
PM
at.
VA
VA
Plus
Exc
ise
Pub.
GPO
VP
Yea
r(1)
(2)
(3)
(4)
(5)
(6)
(7)
(8)
(9)
(10)
(11)
(12)
(13)
(14)
1947
81.4
76.3
81.0
92.0
105.
569
.775
.373
.48.
0.4
—11
.022
.3—
5.6
1.9
1948
83.4
80.0
84.2
78.3
5.1
—.8
1949
82.8
79.7
83.6
98.9
109.
182
.282
.783
.0—
.2—
.8—
15.3
16.7
—.5
.3
1950
83.8
81.2
84.9
99.0
113.
375
.480
.879
.84.
0—
1.1
—14
.123
.6—
5.4
1.0
1951
88.8
86.9
90.5
99.5
106.
288
.488
.688
.3.5
—1.
7—
9.0
11.1
—.2
.319
5291
.890
.894
.210
1.0
109.
786
.789
.592
.1—
.3—
2.4
—6.
814
.3—
2.8
—2.
619
5389
.888
.992
.395
.711
1.8
69.2
80.4
85.5
4.3
—2.
5—
3.4
26.5
—11
.2—
5.1
1954
86.0
85.0
88.2
88.9
104.0
64.1
75.9
80.4
5.6
—2.2
—.7
24.8
—11.8
—4.5
1955
.88
.087.3
90.1
92.5
101.8
77.2
83.2
85.3
2.7
—2.1
—2.4
15.3
—6.0
—2.1
1956
90.3
90.0
92.3
93.6
96.6
88.5
89.4
90.1
.2
—2.0
—1.3
5.1
—.9
—.7
1957
94.1
93.9
95.6
95.1
98.1
90.0
92.1
93.9
.2
—1.5
.5
5.1
—2.1
—1.8
1958
100.
010
0.0
100.
010
0.0
100.
010
0.0
100.
010
0.0
.0.0
.0.0
.0.0
1959
105.
010
4.9
103.
010
3.0
101.
010
6.4
104.
110
6.1
—1.
12.
0.0
—3.
42.
3—
2.0
1960
107.1
107.9
104.3
110.8
111.5
109.6
108.5
110.6
—3.5
2.8
—6.5
1.2
1.1
—2.1
1961
110.
511
2.2
106.
911
2.7
110.
611
6.3
113.
511
5.9
—5.
43.
65.
8—
3.6
2.8
—2.
419
6211
1.7
113.
510
7.0
113.
310
8.E
121.
211
6.0
120.
3—
8.6
4.7
—6.
3—
7.9
5.2
—4.
319
6311
4.9
117.
110
9.1
113.
411
3.6
113.
111
5.1
122.
2—
7.3
5.8
—4.
3.3
—2.
0—
7.1
1964
120.
411
8.8
114.
511
6.3
116.
311
6.3
115.
011
9.0
1.4
5.9
—1.
8.0
1.3
—4.
0
Not
e: V
A v
alue
add
ed; V
P =
valu
eof
pro
duct
ion.
For
oth
er a
bbre
viat
ions
see
not
e at
the
begi
nnin
g of
App
endi
x C
.co
l. 1
—co
l.8;
col
. 10
=co
l.1
—co
l.3;
col
. 11
col.
3 —
col.
4; c
ol. 1
2co
l. 4
—co
l.6;
col
. 13
col.
6— c
ol. 7
;co
l. 14
coI.
7 —
col.
8.
I, \0

TA
BL
E C
-4Se
lect
ed M
easu
res
of M
anuf
actu
ring
Act
ivity
, 194
7—64
: Tex
tile
Mill
Pro
duct
s, S
iC 2
2
ndex
es (
1958
=10
0)Po
int D
iffe
renc
es I
n In
dexe
sa-
I
Tot
al(F
RB
Min
us
FRB
(Net
Min
usG
ross
Tot
alO
utpu
tT
otal
(Qua
ntity
Min
usM
inus
Net
Exc
ise
Net
Out
put
(Cen
sus
Min
us
FRB
Def
late
d C
ensu
sD
ata
OB
EG
ross
Prod
uct
As
Rew
ei h
ted
gC
ost
VA
Plus
Pub.
GPO
VP
VP
Mat
.V
AE
xcis
eO
BE
)W
td.)
Def
ltd.)
Out
put
Tax
OB
E)
Yea
r(1)
(2)
(3)
(4)
(5)
(6)
(7)
(8)
(9)
(10)
(11)
(12)
(13)
(14)
1947
90.1
90.5
91.0
81.7
80.0
84.1
84.1
90.5
—.4
—.9
9.3
—2.
4.0
—6.
419
4896
.396
.997
.299
.4—
3.1
—.9
1949
89.1
89.4
89.5
82.1
80.5
84.6
84.6
91.6
—2.
5—
.47.
4—
2.5
.0—
7.0
1950
101.
410
1.7
101.
894
.991
.699
.699
.696
.25.
2—
.46.
9—
4.7
.03.
419
5110
0.3
100.
110
0.2
93.6
95.8
90.2
90.2
99.0
1.3
.16.
63.
4.0
—8.
819
5299
.599
.499
.394
.097
.788
.588
.598
.9.6
.25.
35.
5.0
—10
.419
5310
1.5
101.
510
1.4
99.5
102
.295
.595
.596
.74.
8.1
1.9
4.0
.0—
1.2
1954
94.9
95.0
94.9
91.6
92.1
90.9
90.9
92.0
2.9
.03.
3.7
.0—
1.1
1955
104.
910
4.9
105.
010
3.6
105.
710
0.6
100.
610
2.5
2.4
—.1
1.4
3.0
.0—
1.9
1956
106.
510
6.7
106.
910
4.7
105.
610
3.4
103.
410
3.9
2.6
—.4
2.2
1.3
.0—
.5
1957
102.
310
2.4
102.
510
1.9
102.
210
1.5
101.
510
1.6
.7—
.2.6
.4.0
—.1
1958
100.
010
0.0
100.
010
0.0
100.
0 10
0.0
100.
010
0.0
.0.0
.0.0
.0.0
1959
115.
811
5.9
116.
111
1.8
112,
211
1.2
111.
211
0.2
5.6
—.3
4.3
.6.0
1.0
1960
111.
311
1.4
111.
510
9.8
110.
910
8.2
108.
210
6.6
4.7
—.2
1.7
1.6
.01.
619
6111
3.6
113.
511
3.4
114.
2 11
5.8
111.
811
1.8
106.
67.
0.2
—.8
2.4
.05.
21962
122.3
122.2
122.3
123.5 125.5
120.4
120.4
116.6
5.7
.0
—1.2
3.1
.0
1963
124.0
123.9
124.0
127.9 131.0
123.1
123.1
120.5
3.5
.0
—3.9
4.8
.0
2.6
1964
130.3
130.2
130.1
138.7 142.7
132.6
132.6
130.1
.2
.2
—8.6
6.1
.0
2.5
Not
e: V
A v
alue
add
ed;
VP
valu
e of
pro
duct
ion.
For
oth
er a
bbre
viat
ions
see
note
at th
e be
ginn
ing
of A
ppen
dix
C.
acol
9col. 1 —
col.8; col. 10
col. I —
col.
3; c
ol. 1
1co
l. 3
—co
l.4;
col
. 12
col.
4 —
col.
6;co
l. 13
col.
6— c
ol. 7
;co
l. 14
=co
l.7
—co
l.8.
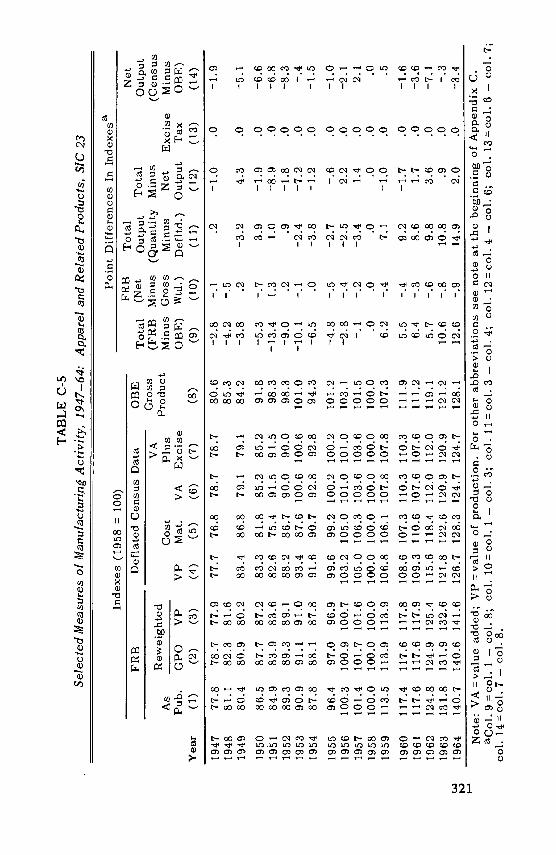
TA
BL
E C
-5S
elec
ted
Mea
sure
s of
Man
ufac
turi
ng A
ctiv
ity,
1947
—64
:A
ppar
elan
d R
elat
ed P
rodu
cts,
SIC
23
Inde
xes
(195
810
0)Po
int D
iffe
renc
es I
n In
dexe
sa
Tot
al(F
RB
Min
usO
BE
)(9
)
FRB
Tot
al(N
etO
utpu
tT
otal
Min
us(Q
uant
ity M
inus
Gro
ssM
inus
Net
Exc
ise
Wtd
.)D
efltd
.)O
utpu
tT
ax(1
0)(11)
(12)
(13)
Net
Out
put
(Cen
sus
Min
usO
BE
)(1
4)
FRB
Def
late
d C
ensu
sD
ata
OB
EG
ross
Prod
uct
(8)
Yea
r
As
Pub.
(1)
Rew
ei h
ted
Cos
tG
POV
PV
PM
at.
VA
(2)
(3)
(4)
(5)
(6)
VA
Plus
Exc
ise
(7)
1947
1948
1949
77.8
81.1
80.4
78.7
77.9
77.7
76.8
78.7
82.3
81.6
80.9
80.2
83.4
86.8
79.1
78.7
79.1
80.6
85.3
84.2
—2.
8—
4.2
—3.
8
—.1
.2—
1.0
.0—
.5 .2—
3.2
4.3
.0
—1.
9
—5.
1
1950
1952
1953
1954
86.5
84.9
89.3
90.9
87.8
87.7
87.2
83.3
81.8
85.2
83.9
83.6
82.6
75.4
91.5
89.3
89.1
88.2
86.7
90.0
91.1
91.0
93.4
87.6
100.
688
.187.8
91.6
90.7
92.8
85.2
91.5
90.0
100.
692
.8
91.8
98.3
98.3
101.
094
.3
—5.
3—
13.4
—9.0
—10
.1—
6.5
—.7
3.9
—1.9
.0
1.3
1.0
—8.9
.0.2
.9—
1.8
.0—
.1—
2.4
—7.
2.0
.0—3.8
—1.2
.0
—8.6
—6.8
—8.
3—
.4—
1.5
1955
1956
1957
1958
1959
96.4
100.
3101.4
100.0
113.5
97.0
96.9
99.6
99.2
100.
210
0.9
100.7
103.2
105.0
101.0
101.7
101.6
105.0 106.3
103.6
100.0
100.0
100.0
100.0
100.0
113.9
113.
910
6.8
106.
1
100.
210
1.0
103.6
100.0
107.8
101.
210
3.1
101.5
100.0
107.3
—4.
8—
2.8
—.1 .0
6.2
—.5
—2.
7—
.6.0
—.4
—2.5
2.2
.0
—.2
—3.4
1.4
.0
.0
.0
.0
.0
—.4
7.1
—1.
0.0
—1.
0—
2.1
2.1 .0
.5
1960
1961
1962
1963
1964
117.4
117.6
124.
8131.8
140.7
117.6
117.8
108.6
107.3
110.3
117.6
117.
910
9.3
110.
610
7.6
124.
9125.4
115.6
118.4
112.0
131.9
132.6
121.8
122.6
120.9
140.6
141.6
126.7
128.3
124.7
110.3
107.6
112.
0120.9
124.7
111.9
111.2
119.
1121.2
128.1
5.5
6.4
5.7
10.6
12.6
—.4
9.2
—1.7
.0
—.3
8.6
1.7
.0—
.69.8
3.6
.0
—.8
10.8
.9
.0
—.9
14.9
2.0
.0
—1.6
—3.6
—7.
1—.3
—3.4
of A
ppen
dix
C.
Not
e: V
A v
alue
add
ed; V
P va
lue
of p
rodu
ctio
n. F
or o
ther
abb
revi
atio
ns s
ee n
ote
at th
ebe
ginn
ing
9co
l. 1
—co
l.8;
col
. lO
col.
1 —
col.
3; c
ol. 1
1co
l. 3
—co
l.4;
col
. 12
col.
4 —
col.
6; c
ol. 1
3co
l. 6
—co
l.7;
col.
14co
l. 7
—co
l.8.

TA
BL
E C
-6Se
lect
ed M
easu
res
of M
anuf
actu
ring
Act
ivity
, 194
7—64
: Lum
ber
and
Woo
d Pr
oduc
ts, E
xcep
t Fur
nitu
re, S
iC24
Poin
t Dif
fere
nces
In
Inde
xesa
Inde
xes
(195
810
0)FR
BT
otal
FRB
Def
late
d C
ensu
s D
ata
OB
ET
otal
(Net
Out
put
Tot
alR
ewei
ghte
dV
AG
ross
(FR
B M
inus
(Qua
ntity
Min
usA
sC
ost
Plus
Prod
uct
Min
us G
ross
Min
usN
etE
xcis
e
Net
Out
put
(Cen
sus
Min
usPu
b.G
POV
PV
PM
at.
VA
Exc
ise
OB
E)
Wtd
.)D
efltd
.)O
utpu
tT
axO
BE
)Y
ear
(1)
(2)
(3)
(4)
(5)
(6)
(7)
(8)
(9)
(10)
(11)
(12)
(13)
(14)
1947
92.3
90.3
90.3
91.1
75.7
111.
311
1.3
99.4
—7.
12.
0—
.8—
20.2
.011
.919
4896
.094
.194
.197
.5—
1.5
1.9
1949
84.7
83.0
83.1
80.9
73.4
90.7
90.7
90.1
—5.
41.
62.
2.0
.6
1950
102.
910
1.5
101.
797
.787
.811
0.6
110.
698
.04.
91.
24.
0—
12.9
.012
.619
5110
2.7
101.
3 10
1.4
97.6
88.9
108.
910
8.9
99.8
2.9
1.3
3.8
—11
.3.0
9.1
1952
101.
410
0.3
100.
497
.790
.810
6.7
106.
797
.04.
41.
02.
7—
9.0
.09.
719
5310
7.1
105.
010
5.1
98.9
93.5
105.
910
5.9
94.0
13.1
2.0
6.2
—7.
0.0
11.9
1954
104.
210
2.9
103.
194
.292
.097
.097
.091
.312
.91.
18.
9—
2.8
.05.
719
5511
4.5
114.
211
4.3
107.
410
4.8
110.
811
0.8
105.
59.
0.2
6.9
—3.
4.0
5.3
1956
110.
310
9.2
109.
110
8.4
104.
711
3.2
113.
210
5.1
5.2
1.2
.7—
4.8
.08.
119
5710
0.3
99.9
99.9
100.
798
.610
3.4
103.
499
.01.
3.4
—.8
—2.
7.0
4.4
1958
100.
010
0.0
100.
010
0.0
100.
0 10
0.0
100.
010
0.0
.0.0
.0.0
.0.0
1959
113.
511
4.3
114.
210
9.3
108.
611
0.3
110.
310
9.5
4.0
—.7
4.9
—1.
0.0
.8
1960
106.
810
6.4
106.
110
7.0
107.
810
5.8
105.
810
7.4
—.6
.7—
.91.
2.0
—1.
619
6110
6.0
106.
910
6.6
106.
510
6.9
106.
010
6.0
105.
2.8
—.6
.1.5
.0.8
1962
111.
011
1.9
111.
611
2.4
111.
411
3.7
113.
711
4.5
—3.
5—
.6—
.8—
1.3
.0—
.8
1963
113.
911
5.1
114.
811
8.8
116.
312
2.2
122.
211
9.9
—6.
0—
.9—
4.0
—3.
4.0
2.3
1964 N
117.
811
9.2
119.
012
6.1
123.
113
0.1
130.
112
8.9
—11
.1—
1.2
—7.
1—
4.0
.01.
2
ote:
VA
val
ue a
dded
; VP
=va
lue
of p
rodu
ctio
n. F
or o
ther
abb
revi
atio
ns s
ee n
ote
at th
eof
App
endi
x C
.be
ginn
ing
acol
9co
I. 1
—co
l.8;
aol
. 10
coI.
1 —
col.
3; c
ol. 1
1 =
col.
3 —
col.
4; c
ol. 1
2co
I. 4
—co
l.6;
col
. 13
=co
l.6—
col
. 7;
aol.
14co
l. 7
—co
l.8.

TA
BL
E C
-7Se
lect
ed M
easu
res
of M
anuf
actu
ring
Act
ivity
, 194
7—64
: Fur
nitu
re a
nd F
ixtu
res,
SIC
25
Inde
xes
(195
8 =
100)
Pom
t Dif
fere
nce
s In
Inde
xesa
-T
otal
(FR
BM
inus
FRB
(Net
Min
usG
ross
Tot
alO
utpu
t(Q
uant
ityM
inus
Tot
alM
inus
Net
Exc
ise
Net
Out
put
(Cen
sus
Min
us
FRB
Def
late
d C
ensu
sD
ata
OB
EG
ross
Prod
uct
As
Rew
hted
eig
Cos
tV
APl
usPu
b.G
POV
PV
PM
at.
VA
Exc
ise
OB
E)
Wtd
.)D
efltd
.)O
utpu
tT
axO
BE
)Y
ear
(1)
(2)
(3)
(4)
(5)
(6)
(7)
(8)
(9)
(10)
(11)
(12)
(13)
(14)
1947
72.9
73.0
72.9
75.7
71.2
79.9
79.9
74.6
—1.
7.0
—2.
8—
4.2
.05.
319
4875
.675
.875
.786
.7—
11.1
—.1
1949
69.9
70.0
69.9
71.4
68.2
74.4
74.4
82.1
—12
.2.0
—1.
5—
3.0
.0—
7.7
195Q
85.3
85.2
85.4
87.2
82.0
92.0
92.0
99.5
—14
.2—
.1—
1.8
—4.
8.0
—7.
5
1951
80.6
80.7
80.4
84.1
80.7
87.3
87.3
94.6
—14
.0.2
—3.
7—
3.2
.0—
7.3
1952
82.3
82.8
82.8
87.3
82.6
91.7
91.7
102.
0—
19.2
.0—
4.5
—4.
4.0
—10
.3
1953
86.6
86.7
86.4
94.6
91.1
97.8
97.8
101.
8—
15.2
.2—
8.2
—3.
2.0
—4.
0
1954
90.3
90.3
90.2
91.7
88.4
94.7
94.7
98.0
—7.
7.1
—1.
5—
3.0
.0—
3.3
1955
102.
610
2.6
102.
510
4.6
100.
810
8.2
108.
211
3.6
—11
.0.1
—2.
1—
3.6
.0—
5.4
1956
105.
910
5.9
105.
510
7.5
103.
711
1.1
111.
111
4.4
—8.
5.4
—2.
0—
3.6
.0—
3.3
1957
104.
110
4.1
103.
910
4.3
102.
510
6.0
106.
010
9.4
—5.
3.2
—.4
—1.
7.0
—3.
4
1958
100.
010
0.0
100.
010
0.0
100.
010
0.0
100.
010
0.0
.0.0
.0.0
.0.0
1959
119.
511
9.6
119.
811
0.8
110.
511
1.0
111.
011
4.1
5.4
—.3
9.0
—.2
.0—
3.1
1960
124.
612
4.6
124.
510
8.0
108.
510
7.6
107.
611
2.3
12.3
.116
.5.4
.0—
4.7
1961
124.
412
4.5
124.
510
5.3
108.
510
2.2
102.
210
8.1
16.3
—.1
19.2
3.1
.0—
5.9
1962
136.
713
6.9
137.
111
4.3
117.
511
1.3
111.
311
6.1
20.6
—.4
22.8
3.0
.0—
4.8
1963
143.
614
3.8
144.
111
9.8
121.
111
8.5
118.
511
9.4
24.2
—.5
24.3
1.3
.0—
.9
1964
154.
715
5.0
155.
712
8.6
134.
112
3.1
123.
112
8.7
26.0
—1.
027
.15.
5.0
—5.
6
Not
e: V
P=
val
ueof
pro
duct
ion;
VA
=va
lue
adde
d. F
or
othe
r ab
brev
iatio
ns
see
note
at t
hebe
ginn
ing
of A
ppen
dix
C.
acol
9 =
col.
I —
col.
8; c
ol. 1
0 =
col.
1 —
col.
3; c
ol. 1
1 =
col.
3 —
col.
4; c
ol. 1
2 =
vol.
4 —
col.
6; c
ol. 1
3 =
col.
6co
l.7; coi.
14=
col.
7 —
col.
8.
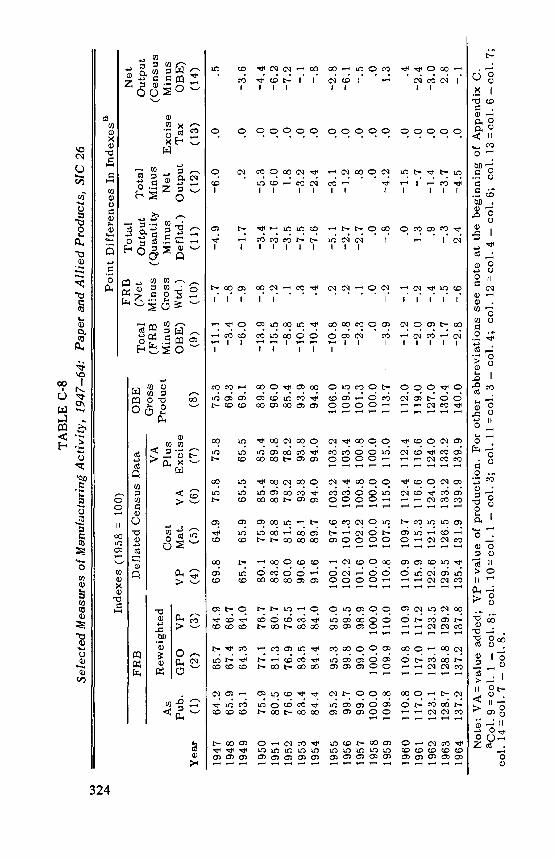
begi
nnin
gco
l. 3
—co
l.4;
col
. 12
col.
4 —
col.
6; c
ol. 1
3co
l. 6
—co
l. 7;
(J)
TA
BL
E C
-8Se
lect
ed M
easu
res
of M
anuf
actu
ring
Act
ivity
, 194
7—64
:Pa
per
and
Alli
ed P
rodu
cts,
SIC
26
Inde
xes
(195
8 =
100)
Poin
t Dif
fere
nces
In I
ndex
esa
Tot
al(F
RB
Min
usO
BE
)(9
)
FRB
Tot
al(N
etO
utpu
tM
inus
(Qua
ntity
Gro
ssM
inus
Wtd
.)D
efltd
.)(1
0)(1
1)
Tot
alM
inus
Net
Out
put
(12)
Exc
ise
Tax
(13)
Net
Out
put
(Cen
sus
Min
usO
BE
)(1
4)
FRB
Def
late
d C
ensu
sD
ata
OB
EG
ross
Prod
uct
(8)
Yea
r
As
Pub.
(1)
Rht
edew
eig
GPO
VP
(2)
(3)
Cos
tV
PM
at.
VA
(4)
(5)
(6)
VA
Plus
Exc
ise
(7)
1947
1948
1949
64.2
65.9
63.1
65.7
64.9
67.4
66.7
64.3
64.0
69.8
64.9
75.8
65.7
65.9
65.5
75.8
65.5
75.3
69.3
69.1
—11
.1—
3.4
—6.0
—.7
—4.
9—
.8
—.9
—1.7
—6.
0 .2
.0 .0
.5
—3.
6
1950
1951
1952
1953
1954
75.9
80.5
76.6
83.4
84.4
77.1
76.7
81.3
80.7
76.9
76.5
83.5
83.1
84.4
84.0
80.1
75.9
85.4
83.8
78.8
89.8
80.0
81.5
78.2
90.6
88.1
93.8
91.6
89.7
94.0
85.4
89.8
78.2
93.8
94.0
89.8
96.0
85.4
93.9
94.8
—13
.9—
15.5
—8.8
—10
.5—
10.4
—.8
—3.
4—
.2—3.1
.1
—3.
5.3
—7.
5.4
—7.6
—5.
3—
6.0
1.8
—3.2
—2.
4
.0
.0
.0
.0 .0
—4.4
—6.2
—7.2
—.1
—.8
1955
1956
1957
1958
1959
95.2
99.7
99.0
100.0
109.8
95.3
95.0
99.8
99.5
99.0
98.9
100.0 100.0
109.9
110.0
100.1
97.6
103.2
102.2
101.3
103.4
101.6
102.2
100.8
100.0
100.0
100.0
110.8
107.5
115.0
103.2
103.4
100.8
100.0
115.0
106.0
109.5
101.3
100.0
113.7
—10.8
—9.8
—2.3 .0
—3.9
.2
—5.1
.2
—2.7
.1
—2.7
.0
.0
—.2
—.8
—3.1
—1.2
.8 .0
—4.2
.0
.0
.0
.0
.0
—2.8
—6.1
—.5 .0
1.3
1960
1961
1962
1963
1964
110.8
117.0
123.
1128.7
137.
2
110.8
110.9
117.0
117.
212
3.1
123.5
128.8
129.
213
7.2
137.
8
110.9
109.7
112.4
115.9
115.
311
6.6
122.
6121.5
124.0
129.5
126.
513
3.2
135.
413
1.9
139.
9
112.4
116.6
124.
0133.2
139.
9
112.0
119.0
127.
0130.4
140.
0
—1.2
—2.0
—3.
9—1.7
—2.
8
—.1
.0
—.2
1.3
—.4
.9
—.5
—.3
—.6
2.4
—1.5
—.7
—1.
4—3.7
—4.
5
.0
.0 .0 .0 .0
.4
—2.4
—3.
02.8
—.1
Note:
added;
VPv
alue
of
prod
uctio
n. F
orot
her
abbr
evia
tions
see
note
at t
heof
App
endi
x C
.ac
01 9
col.
1 —
cot.
8; c
ol. l
Oco
I. 1
—co
l.3;
col
. 11
cot.
14co
I.7
—co
l.8.

TA
BL
EC
-9
Sele
cte
dM
easu
res
of
Ma
nu
fact
uri
ng
Acti
vit
y,
19
47
-64
:P
rin
tin
ga
nd
Pu
bli
shiA
g;S
l
Po
int
Dif
fere
nces
InIn
dex
esa
Ind
ex
es
(19
58
=10
0)F
RB
To
tal
Net
FR
BD
efl
ate
dC
en
sus
Data
aB
ET
ota
l(N
et
Ou
tpu
tT
ota
lO
utp
ut
VA
Gro
ss(F
RB
Min
us
(Qu
anti
tyM
inu
s(C
en
sus
As
Rew
eig
hte
dC
ost
Plu
sP
rod
uct
Min
us
Gro
ssM
inu
sN
et
Ex
cis
eM
inu
sP
ub
.G
PO
VP
VP
Mat
.V
AE
xcis
eaB
E)
Wtd
.)D
efl
td.)
Ou
tpu
tT
ax
aB
E)
Year
(1)
(2)
(3)
(4)
(5)
(6)
(7)
(8)
(9)
(10
)(1
1)
(12
)(1
3)
(14
)
1947
71
.97
0.4
70
.47
4.8
68
.37
8.6
78
.67
5.3
-3.4
1.5
-4.4
-3.8
.03
.319
487
5.6
74
.97
4.7
77
.1-1
.5.9
1949
77
.67
5.4
75
.07
5.9
72
.47
7.9
77
.97
8.4
-.8
2.6
-.9
-2.0
.0-.
5
19
50
81
.27
9.8
79
.47
8.6
73
.98
1.2
81
.28
1.5
-.3
1.8
.8-2
.6.0
-.3
1951
82
.88
1.8
81
.58
2.5
78
.18
5.0
85
.08
2.9
-.1
1.3
-1.0
-2.5
.02
.11
95
28
2.6
82
.18
1.8
81
.27
6.5
83
.88
3.8
83
.1-.
5.8
.6-2
.6.0
.71
95
38
6.4
86
.38
6.1
84
.48
1.1
86
.38
6.3
88
.2-1
.8.3
1.7
-1.9
.0-1
.91
95
48
9.9
89
.98
9.7
90
.98
7.4
92
.89
2.8
92
.8-2
.9.2
-1.2
-1.9
.0.0
1955
95
.59
5.4
95
.19
5.1
92
.09
6.8
96
.89
8.6
-3.1
.4.0
-1.7
.0-1
.819
561
00
.41
00
.41
00
.21
00
.59
5.4
10
3.4
10
3.4
10
2.5
-2.1
.2-.
3-2
.9.0
.91
95
71
02
.21
02
.01
02
.01
00
.495
..81
03
.01
03
.01
03
.9-1
.7.2
1.6
-2.6
.0-.
919
581
00
.01
00
.01
00
.01
00
.01
00
.01
00
.01
00
.01
00
.0.0
.0.0
.0.0
.019
591
07
.51
07
.51
07
.61
08
.11
08
.21
08
.11
08
.11
07
.6-.
1-.
1-.
5.0
.0.5
19
60
11
3.5
11
3.5
11
3.7
11
1.9
11
2.8
11
1.4
11h
41
10
.43
.1-.
21
.8.5
.01
.019
611
15
.11
15
.11
15
.41
13
.61
16
.41
12
.01
12
.01
10
.44
.7-.
31
.81
.6.0
1.6
19
62
11
8.3
11
8.3
11
8.6
11
7.0
12
0.0
11
5.3
11
5.3
11
4.9
3.4
-.3
1.6
1.7
.0.4
19
63
12
0.1
12
0.0
12
0.4
11
8.2
12
0.4
11
6.9
11
6.9
11
4.5
5.6
-.3
2.2
1.3
.02
.4w
19
64
12
7.2
12
7.2
12
7.5
12
6.3
12
8.0
12
5.4
12
5.4
12
5.7
1.5
-.3
1.2
.9.0
-.3
tv Vt
No
te:
VP
=v
alu
eo
fp
rod
uct
ion
;V
A=
valu
ead
ded
.F
or
oth
er
ab
bre
via
tio
ns
see
no
teat
the
beg
inn
ing
of
Ap
pen
dix
C.
aC
ol.
9=
col.
1-
co
l.8;
col.
10=
co
l.1
-co
l.3;
co
l.11
=co
l.3
-co
l.4;
co
l.12
=co
l.4
-co
l.6;
co
l.13
=co
l.6
-co
l.7;
co
l.14
=co
l.7
-co
l.8.

TA
BL
EC
-I0
Sel
ecte
dM
easu
res
of
Man
ufac
turi
ngA
ctiv
ity,
19
47
-64
:C
hem
ical
sa
nd
AlI
ied
Pro
duct
s,SI
C28
w tv 0\
Po
int
Dif
fere
nce
sIn
Ind
exes
aIn
dex
es(1
95
8==
10
0)
FR
BT
ota
lN
etF
RB
Def
late
dC
en
sus
Dat
aO
BE
To
tal
(Net
Ou
tpu
tT
ota
lO
utp
ut
VA
Gro
ss(F
RB
Min
us
(Qu
anti
tyM
inu
s(C
en
sus
As
Rew
eig
hte
dC
ost
Plu
sP
rod
uct
Min
us
Gro
ssM
inu
sN
etE
xcis
eM
inu
sP
ub
.G
PO
VP
VP
Mat
.V
AE
xcis
eO
BE
)W
td.)
Def
ltd
.)O
utp
ut
Tax
OB
E)
Yea
r(1
)(2
)(3
)(4
)(5
)(6
)(7
)(8
)(9
)(1
0)
(11
)(1
2)
(13
)(1
4)
19
47
43
.34
4.0
45
.25
1.5
58
.24
5.9
45
.94
4.2
-.9
-1.9
-6.3
5.6
.01
.7
19
48
46
.94
7.5
48
.65
2.3
-5.4
-1.7
1949
46
.24
6.7
47
.65
5.1
61
.84
9.5
49
.55
4.1
-7.9
-1.4
-7.5
5.6
.0-4
.6
19
50
57
.85
8.3
59
.26
7.2
70
.86
4.3
64
.36
5.3
-7.5
-1.4
-8.0
2.9
.0-1
.0
1951
65
.66
5.7
66
.57
2.3
79
.46
6.4
66
.47
0.5
-4.9
-.9
-5.8
5.9
.0-4
.1
19
52
68
.56
9.0
69
.87
5.1
80
.97
0.2
70
.27
1.3
-2.8
-1.3
-5.3
4.9
.0-1
.1
19
53
74
.17
4.5
75
.57
9.5
84
.87
5.0
75
.07
6.1
-2.0
-1.4
-4.0
4.5
.0-1
.1
19
54
73
.97
4.3
75
.17
9.9
84
.37
6.2
76
.27
8.7
-4.8
-1.2
-4.8
3.7
.0-2
.5
19
55
86
.38
6.6
87
.79
2.4
96
.08
9.5
89
.59
2.5
-6.2
-1.4
-4.7
2.9
.0-3
.0
19
56
93
.09
3.1
93
.89
9.3
10
2.1
97
.09
7.0
97
.4-4
.4-.
8-5
.52
.3.0
-.4
19
57
98
.59
8.6
98
.91
01
.41
03
.39
9.9
99
.91
01
.9-3
.4-.
4-2
.51.
5.0
-2.0
19
58
10
0.0
10
0.0
10
0.0
10
0.0
10
0.0
10
0.0
10
0.0
10
0.0
.0.0
.0.0
.0.0
19
59
11
4.6
11
4.5
11
4.9
11
6.3
11
3.8
11
8.4
11
8.4
11
8.6
-4.0
-.3
-1.4
-2.1
.0-.
2
19
60
12
1.7
12
1.4
12
1.7
11
6.9
11
4.6
11
9.0
11
9.0
11
9.1
2.6
.04
.8-2
.1.0
-.1
1961
12
8.8
12
8.3
12
8.5
12
0.5
11
6.6
12
3.9
12
3.9
12
5.1
3.7
.38
.0-3
.4.0
-1.2
19
62
14
2.1
14
1.5
14
1.3
13
2.9
12
8.3
13
6.9
13
6.9
13
5.0
7.1
.88
.4-4
.0.0
1.9
19
63
15
5.1
15
4.5
15
4.2
14
3.6
13
8.2
14
8.4
14
8.4
14
2.0
13
.1.9
10
.6-4
.8.0
6.4
19
64
16
6.6
16
5.9
16
5.5
15
5.3
14
9.0
16
0.8
16
0.8
15
2.0
14
.61.
11
0.2
-5.5
.08
.8
No
te:
VA
==v
alu
ead
ded
;V
P==
val
ue
ofp
rod
uct
ion
.F
or
oth
erab
bre
via
tio
ns
see
no
teat
the
beg
inn
ing
ofA
pp
end
ixC
.aco
l.\)
=co
l.1
-co
l.8;
col.
10=
col.
1-
col.
3;co
l.11
=co
l.3
-co
l.4;
col.
12=
col.
4-
col.
6;co
l.13
==co
l.6
-co
l.7;
oo
l,14
=co
l.7
-co
l.8.

TA
BL
E C
-li
Sel
ecte
d M
easu
res
of M
anuf
actu
ring
Act
ivity
,19
47—
64:
Petr
oleu
m a
nd R
elat
ed I
ndus
trie
s, S
IC 2
9
Inde
xes
(195
810
0)Po
int D
iffe
renc
es I
n In
dexe
saFR
BT
otal
Tot
al(N
etO
utpu
tT
otal
(FR
B M
inus
(Qua
ntity
Min
usM
inus
Gro
ssM
inus
Net
Exc
ise
OB
E)
Wtd
.)D
efltd
.)O
utpu
tT
ax(9
)(10)
(11)
(12)
(13)
Net
Out
put
(Cen
sus
Min
usO
BE
)(1
4)
FRB
Def
late
d C
ensu
s D
ata
OB
E
ro U
C
(8)
Yea
r
As
Pub.
(1)
Rew
eigh
ted
VA
Cos
tPl
usG
POV
PV
PM
at.
VA
Exc
ise
(2)
(3)
(4)
(5)
(6)
(7)
1947
1948
1949
64.6
69.9
67.8
66.4
65.6
64.0
61.8
74.8
68.5
70.6
71.0
69.7
68.5
67.4
64.9
79.5
74.4
66.3
72.4
72.6
—1.
7—
1.0
1.6
—10
.86.
3—
2.5
—1.
1—
4.8
—.7
1.1
—12
.15.
1
2.2
1.8
1950
1951
1952
1953
1954
74.6
83.5
85.5
90.6
89.8
76.7
75.8
74.2
69.9
95.3
86.3
84.6
85.2
84.3
82.5
93.1
86.4
86.2
86.8
86.4
86.1
87.7
85.7
90.7
90.9
89.9
88.6
96.0
91.8
89.7
89.9
90.3
91.0
87.1
87.7
83.1
84.0
85.1
90.4
87.9
—8.
5—
1.2
1.6
—21
.19.
0—
.5—
1.7
.9—
8.8
6.7
.4—
1.3
.4—
1.3
2.0
.2—
.31.
0—
6.1
4.2
1.9
—.1
—.4
3.2
—.6
3.2
2.4 .6 1.4
—.2
1955
1956
1957
1958
1959
96.5
101.
310
1.2
100.
010
6.7
96.4
96.5
97.5
96.4
102.
810
0.1
100.
810
1.5
102.
910
2.7
104.
110
2.4
101.
210
1.6
101.
810
1.3
104.
110
1.5
100.
0 10
0.0
100.
010
0.0
100.
010
0.0
106.
810
6.2
105.
910
5.9
105.
810
4.8
99.2
101.
810
0.6
100.
010
6.0
—2.
7.0
—1.
0—
5.3
2.7
—.5
—.2
—1.
4—
1.2
1.7
.6—
.4—
.2—
2.3
2.6
.0.0
.0.0
.0.7
.5.3
.11.
0
.9 .6 .9 .0—
1.2
1960
1961
1962
1963
1964
109.
311
1.6
115.
9120.2
124.
2
110.
110
9.0
108.
010
7.0
112.
911
0.0
111.
911
1.1
108.
710
7.0
117.
211
2.9
116.
5115.3
112.3
108.9
129.0 121.5
120.9
119.
611
9.3
113.
814
6.8
134.
712
5.5
123.
112
6.4
116.
617
4.7
152.
5
112.
011
3.0
122.
5130.2
144.
3
—2.
7.3
1.0
—4.
92.
9—
1.4
.52.
4—
8.5
4.3
—6.
6.6
3.0
—16.7
7.5
—10.0
.6.3
—27
.512
.1—
20.1
1.1
—3.
3—
48.3
22.2
—2.
0—
.1
—1.
04.5
8.2
Not
e: V
A=
val
uead
ded;
VP
valu
e of
pro
duct
ion.
For
oth
er a
bbr
evia
tions
see
not
e at
the
begi
nnin
g of
App
end
ix C
.aC
ol. 9
=co
l. 1
—co
l.8;
cot
. 10
=co
l. I
—co
l.3;
col
. 11
col.
3 —
col.
4;co
l. 12
col.
4 —
col.
6; c
ol. 1
3co
l. 6
—co
l. 7;
col.
14=
col.
7 —
col.
8.

TA
BL
E C
-12
Not
e: V
A =
valu
ead
ded;
VP
=va
lue
of p
rodu
ctio
n. F
or o
ther
abb
revi
atio
ns s
ee n
ote
at th
e be
ginn
ing
of A
ppen
dix
C.
acol
9 =
col.
1 —
col.
8; c
ol. l
Oco
l. 1
—co
l.3;
col
. 11
col.
3 —
col.
4; c
ol. 1
2co1
. 4 —
col.
6; c
ol. 1
3co
l. 6
—co
l.7;
col.
14co
1. 7
—co
l.8.
00
Sele
cted
Mea
sure
s of
Man
ufac
turi
ng A
ctiv
ity, 1
947—
64: R
ubbe
r an
d M
isc.
Pla
stic
Pro
duct
s, S
iC 3
0
Inde
xes
(195
810
0)Po
int D
iffe
renc
es I
n In
dexe
sa
Tot
al(F
RB
Min
usO
BE
)
FRB
(Net
Min
usG
ross
Wtd
.)
Tot
alO
utpu
t(Q
uant
ityM
inus
Def
ltd.)
Tot
alM
inus
Net
Out
put
Exc
ise
Tax
Net
Out
put
(Cen
sus
Min
usO
BE
)
FRB
Def
late
d C
ensu
sD
ata
OB
E
UA
sd
Cos
tV
PM
at.
VA
VA
Plus
Exc
ise
Pub.
GPO
VP
Year
(1)
(2)
(3)
(4)
(5)
(6)
(7)
(8)
(9)
(10)
(11)
(12)
(13)
(14)
1947
61.0
69.8
68.6
76.9
66.8
86.7
87.9
89.8
—28.8
—7.6
—8.3
—9.8
—1.2
—1.9
1948
61.8
67.4
66.4
83.5
—21.7
—4.6
1949
58.4
62.1
61.3
69.2
61.8
76.3
77.3
75.9
—17.5
—2.9
—7.
9—
7.1
—1.
01.
4
1950
75.6
76.2
75.3
85.1
66.0
103.6
104.4
88.8
—13
.2.3
—9.
8—
18.5
—.8
15.6
1951
77.2
79.3
78.3
89.7
71.3
107.
510
7.3
111.
5—34.3
—1.
1—
11.4
—17
.8.2
—4.
21952
79.3
80.7
79.8
90.6
79.2
101.
510
1.6
110.
5—
31.2
—.5
—10.8
—10.9
—.1
—8.
91953
85.0
86.1
85.2
97.6
86.6
108.
210
8.1
110.
9—
25.9
—.2
—12
.4—
10.6
.1—
2.8
1954
83.4
84.0
83.4
92.2
80.4
103.
610
3.1
96.1
—12
.7.0
—8.
8—
11.4
.5
7.0
1955
103.
410
4.1
103.
410
4.4
92.3
116.
211
6.0
110.
7—7.3
.0
—1.
0—
11.8
.25.
31956
100.9
101.2
100.9
101.9
96.4
107.1
107.
110
7.9
—7.
0.0
—1.
0—
5.2
.0—
.8
1957
105.
310
5.6
105.
410
2.1
98.7
105.
410
5.2
106.
6—
1.3
—.1
3.3
—3.3
.2
—1.4
1958
100.0
100.0
100.0
100.0
100.0
100.0
100.0
100.0
.0
.0
.0
.0
.0
.0
1959
120.1
120.6
120.8
121.6
114.8
128.4
127.4
125.4
—5.3
—.7
—.8
—6.8
1.0
2.0
1960
120.
412
1.4
121.
812
2.6
115.
912
9.3
128.
113
0.8
—10
.4—
1.4
—.8
—6.
71.
2—
2.7
1961
121.4
122.3
123.0
126.3
119.1
133.7
132.1
130.3
—8.9
—1.6
—3.3
—7.4
1.6
1.8
1962
141.6
142.5
143.4
140.7
134.2
147.4
145.4
148.5
—6.9
—1.8
2.7
—6.7
2.0
—3.1
1963
151.8
152.6
153.7
148.7
142.4
155.1
152.8
150.2
1.6
—1.9
5.0
—6.4
2.3
2.6
1964
169.5
170.
9172.3
159.8
154.3
165.4
162.8
163.4
6.1
—2.8
12.5
—5.6
2.6
—.6

TA
BL
E C
-13
Sele
cted
Mea
sure
s of
Man
ufac
turi
ng A
ctiv
ity, 1
947—
64: L
eath
er a
nd L
eath
er P
rodu
cts,
SIC
31
Inde
xes
(195
8 =
100)
Poin
t Dif
fere
nces
In
Inde
xesa
Tot
al(F
RB
Min
usO
BE
)
FRB
(Net
Min
usG
ross
Wtd
.)
Tot
alO
utpu
t(Q
uant
ityM
inus
Def
ltd.)
Tot
alM
inus
Net
Out
put
Exc
ise
Tax
Net
Out
put
(Cen
sus
Min
usO
BE
)
FRB
Def
late
d C
ensu
sD
ata
OB
EG
ross
Prod
uct -
As
Rew
eigh
ted
Cos
tV
PM
at.
VA
VA
Plus
Exc
ise
Pub.
GPO
VP
Yea
r(1)
(2)
(3)
(4)
(5)
(6)
(7)
(8)
(9)
(10)
(11)
(12)
(13)
(14)
1947
96.7
96.6
98.5
105.
391
.312
0.0
120.
011
4.6
—17
.9—
1.8
—6.
8—
14.7
.05.
419
4892
.192
.093
.611
9.2
—27
.1—
1.5
1949
87.6
87.5
88.7
96.6
91.9
101.
610
1.6
108.
2—
20.6
—1.
1—
7.9
—5.
0.0
—6.
6
1950
94.8
94.6
95.7
96.4
86.9
106.
310
6.3
106.
1—
11.3
—.9
—.7
—9.
9.0
.219
5188
.988
.889
.591
.484
.598
.798
.711
3.1
—24
.2—
.6—
1.9
—7.
3.0
—14
.4
1952
94.6
94.5
95.0
97.9
100.
595
.395
.310
5.4
—10
.8—
.4—
2.9
2.6
.0—
10.1
1953
94.9
94.7
95.5
102.
197
.410
7.0
107.
010
8.7
—13
.8—
.6—
6.6
—4.
9.0
—1.
7
1954
94.0
93.8
94.3
97.3
98.0
96.7
96.7
102.
4—
8.4
—.3
—3.
0.6
.0—
5.7
1955
102.
110
2.1
102.
410
4.3
104.
110
4.6
104.
610
6.8
—4.
7—
.3—
1.9
—.3
.0—
2.2
1956
104.
010
3.9
104.
110
4.8
105.
010
4.6
104.
610
8.0
—4.
0—
.1—
.7.2
.0—
3.4
1957
103.
310
3.4
103.
510
3.7
105.
310
2.0
102.
010
6.1
—2.
8—
.2—
.21.
7.0
—4.
1
1958
100.
010
0.0
100.
010
0.0
100.
010
0.0
100.
010
0.0
.0.0
.0.0
.0.0
1959
109.
110
9.2
108.
910
3.5
89.3
118.
511
8.5
113.
3—
4.2
.25.
4—
15.0
.05.
2
1960
103.
810
3.8
103.
610
0.2
99.0
101.
510
1.5
106.
7—
2.9
.23.
4—
1.3
.0—
5.2
1961
104.
310
4.3
104.
398
.694
.810
2.5
102.
510
2.1
2.2
.05.
7—
3.9
.0.4
1962
106.
610
6.7
106.
499
.996
.210
3.8
103.
811
0.9
—4.
3.2
6.5
—3.
9.0
—7.
1
1963
104.
010
4.0
103.
999
.010
0.9
97.0
97.0
109.
1—
5.1
.14.
92.
0.0
—12
.1
1964
106.
910
7.0
106.
710
4.3
102.
710
5.9
105.
911
2.8
—5.
9.2
2.4
—1.
6.0
—6.
9
Not
e: V
A =
valu
ead
ded;
VP
=va
lue
of p
rodu
ctio
n. F
or o
ther
abb
revi
atio
ns s
ee n
ote
at th
e be
ginn
ing
of A
ppen
dix
C.
acol
9 =
col.
1 —
col.
8; c
cl. 1
0 =
col.
1 —
col.
3; c
ol. 1
1 =
col.
3 —
col.
4; c
cl. 1
2co
l.co
l.6
col.
col.
14co
1.7
—co
l.8.
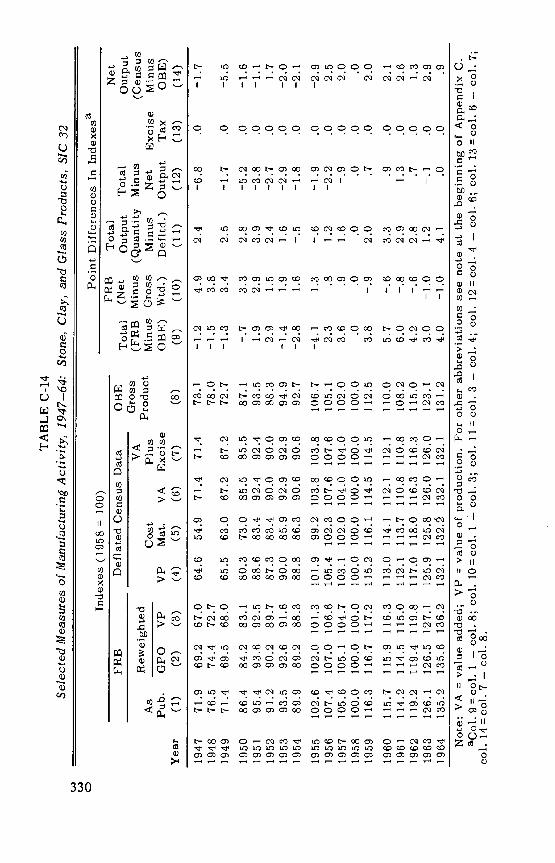
TA
BL
E C
-14
Sele
cted
Mea
sure
s of
Man
ufac
turi
ng A
ctiv
ity, 1
947—
64: S
tone
, Cla
y, a
nd G
lass
Pro
duct
s, S
IC 3
2
Inde
xes
(195
810
0)Po
int D
iffe
renc
es I
n In
dexe
sa
Tot
al(F
RB
Min
usO
BE
)(9
)
FRB
(Net
Min
usG
ross
Wtd
.)(1
0)
Tot
alO
utpu
t(Q
uant
ityM
inus
Def
ltd.)
(11)
Tot
alM
inus
Net
Out
put
(12)
Exc
ise
Tax
(13)
Net
Out
put
(Cen
sus
Min
usO
BE
)(1
4)
FRB
Def
late
d C
ensu
sD
ata
OB
EG
ross
Prod
uct
(8)
As
Rew
ei h
ted
gC
ost
VP
Mat
.V
A(4
)(5
)(6
)
VA
Plus
Exc
ise
(7)
Yea
rPu
b.(1
)G
POV
P(2
)(3
)
1947
71.9
69.2
67.0
64.6
54.9
71.4
71.4
73.1
—1.
24.
92.
4—
6.8
.0—
1.7
1948
76.5
74.4
72.7
78.0
—1.
53.
819
4971
.469
.568
.065
.563
.067
.267
.272
.7—
1.3
3.4
2.5
—1.
7.0
—5.
5
1950
86.4
84.2
83.1
80.3
73.0
85.5
85.5
87.1
—.7
3.3
2.8
—5.
2.0
—1.
619
5195
.493
.692
.588
.683
.492
.492
.493
.51.
92.
93.
9—
3.8
.0—
1.1
1952
91.2
90.2
89.7
87.3
83.4
90.0
90.0
88.3
2.9
1.5
2.4
—2.
7.0
1.7
1953
93.5
92.6
91.6
90.0
85.9
92.9
92.9
94.9
—1.
41.
91.
6—
2.9
.0—
2.0
1954
89.9
89.2
88.3
88.8
86.3
90.6
90.6
92.7
—2.
81.
6—
.5—
1.8
.0—
2.1
1955
102.
610
2.0
101.
310
1.9
99.2
103.
810
3.8
106.
7—
4.1
1.3
—.6
—1.
9.0
—2.
919
5610
7.4
107.
010
6.6
105.
410
2.3
107.
610
7.6
105.
12.
3.8
1.2
—2.
2.0
2.5
1957
105.
610
5.1
104.
710
3.1
102.
010
4.0
104.
010
2.0
3.6
.91.
6—
.9.0
2.0
1958
100.
010
0.0
100.
010
0.0
100.
010
0.0
100.
010
0.0
.0.0
.0.0
.0.0
1959
116.
311
6.7
117.
211
5.2
116.
111
4.5
114.
511
2.5
3.8
—.9
2.0
.7.0
2.0
1960
115.
711
5.9
116.
311
3.0
114.
111
2.1
112.
111
0.0
5.7
—.6
3.3
.9.0
2.1
1961
114.
211
4.5
115.
011
2.1
113.
711
0.8
110.
810
8.2
6.0
—.8
2.9
1.3
.02.
619
6211
9.2
119.
411
9.8
117.
011
8.0
116.
311
6.3
115.
04.
2—
.62.
8.7
.01.
319
6312
6.1
126.
512
7.1
125.
912
5.8
126.
012
6.0
123.
13.
0—
1.0
1.2
—.1
.02.
919
6413
5.2
135.
613
6.2
132.
113
2.1
132.
113
1.2
4.0
—1.
04.
1.0
.0.9
Not
e: V
A =
valu
ead
ded;
VP
valu
e of
pro
duct
ion.
For
oth
er a
bbre
viat
ions
see
not
e at
the
begi
nnin
g of
App
endi
x C
.ac
01 9
col.
1 —
col.
8; c
ol. 1
0co
l. I
col.
3; c
ol. 1
1 =
col.
3 —
col.
4; c
ol. 1
2 =
col.
4 —
col.
6; c
ol. 1
3co
I. 6
—co
l.7;
col.
14co
1.7
—co
l.8.

TA
BL
E C
45
= c
ol. 1
— c
ol.
8; coi.
10co
l.I
—co
l.3;
CO
1.11
=C
o1.
3—
col.
4; c
ol. 1
2co
l. 7;
001
. 14
=co
l.7 —
col.
8.
Sele
cted
Mea
sure
s of
Man
ufac
turi
ng A
ctiv
ity, 1
947—
64: P
rim
ary
Met
al I
ndus
trie
s, S
IC 3
3
Poin
t Dif
fere
nces
In
Inde
xesa
Inde
xes
(195
8 =
100)
FRB
Tot
alFR
BD
efla
ted
Cen
sus
Dat
aO
BE
Tot
al(N
etO
utpu
tT
otal
Rew
eigh
ted
VA
Gro
ss(F
RB
Min
us(Q
uant
ity M
inus
Cos
tPl
usro
uc
Min
us G
ross
Min
usN
etE
xcis
e
-N
etO
utpu
t(C
ensu
sM
inus
As
Pub.
GPO
VP
VP
Mat
.V
AE
xcis
eO
BE
)W
td.)
Def
ltd.)
Out
put
Tax
OB
E)
Year
(1)
(2)
(3)
(4)
(5)
(6)
(7)
(8)
(9)
(10)
(11)
(12)
(13)
(14)
1947
103.7
101.6
100.7
104.0
98.7
111.2
111.2
108.1
—4.4
3.0
—3.3
—7.2
.0
3.1
1948
107.8
105.9
104.7
107.3
.5
3.1
1949
90.7
89.9
89.0
91.4
91.2
91.6
91.6
93.2
—2.5
1.7
—2.4
—.2
.0
—1.6
1950
114.2
112.5
111.5
103.9
94.1
117.2
117.2
113.9
.3
2.7
7.6
—13.3
.0
3.3
1951
124.2
123.8
121.6
128.0 120.0
138.9
138.9
136.2
—12.0
2.6
—6.4
—10.9
.0
2.7
1952
113.5
113.1
111.6
119.2 114.5
125.4
125.4
120.7
—7.2
1.9
—7.6
—6.2
.0
4.7
1953
128.6
129.7
127.8
140.6 135.8
147.1
147.1
139.6
—11.0
.8
—12.8
—6.5
.0
7.5
1954
104.3
104.6
103.8
103.9
99.3
110.0
110.0
109.0
—4.7
.5
—.1
—6.1
.0
1.0
1955
135.3
135.7
133.9
131.3 126.6
137.7
137.7
133.5
1.8
1.4
2.6
—6.4
.0
4.2
1956
133.0
133.3
132.1
133.3 129.9
137.8
137.8
131.1
1.9
.9
—1.2
—4.5
.0
6.7
1957
128.2
128.9
127.8
124.2 123.1
125.7
125.7
128.2
.0
.4
3.6
—1.5
.0
—2.5
1958
100.0
100.0
100.0
100.0 100.0
100.0
100.0
100.0
.0
.0
.0
.0
.0
.0
1959
114.7
114.6
113.7
114.8 112.9
117.5
117.5
111.6
3.1
1.0
—1.1
—2.7
.0
5.9
1960
115.8
115.8
115.3
115.2 117.7
111.8
111.8
110.0
5.8
.5
.1
3.4
.0
1.8
1961
113.0
113.2
113.6
113.0 116.2
108.6
108.6
103.4
9.6
—.6
.6
4.4
.0
5.2
1962
119.5
119.7
119.9
120.7 125.0
114.9
114.9
110.5
9.0
—.4
—.8
5.8
.0
4.4
1963
129.5
130.0
129.9
126.3 129.3
122.1
122.1
116.6
12.9
—.4
3.6
4.2
.0
5.5
1964
147.5
148.2
147.8
140.2 144.9
133.7
133.7
130.2
17.3
—.3
7.6
6.5
.0
3.5
Note: VP
valu
e of
pro
duct
ion;
VA
valu
eadded. For other abbreviations see note at thebeginning
col. 4 —
col.
6; c
ol.
13 =
col.
6
of A
ppen
dix
C.
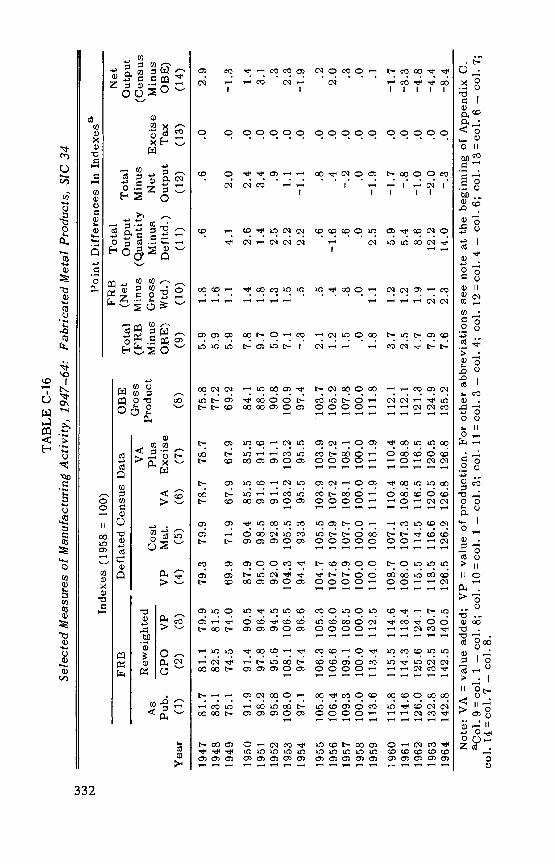
TA
BL
E C
-16
Sele
cted
Mea
sure
s of
Man
ufac
turi
ng A
ctiv
ity, 1
947—
64: F
abri
cate
d M
etal
Pro
duct
s, S
IC 3
4
Inde
xes
(195
810
0)Po
int D
iffe
renc
es I
n In
dexe
sa
Tot
al(F
RB
Min
usO
BE
)(9
)
FRB
Tot
al(N
etO
utpu
tT
otal
Min
us(Q
uant
ity M
inus
Gro
ssM
inus
Net
Exc
ise
Wtd
.)D
efltd
.)O
utpu
tT
ax(1
0)(11)
(12)
(13)
Net
Out
put
(Cen
sus
Min
usO
BE
)(1
4)
FRB
Def
late
d C
ensu
sD
ata
OB
EG
ross
Prod
uct
(8)
Yea
r
As
Pub.
(1)
Rew
ei h
ted
g
GPO
VP
(2)
(3)
Cos
tV
PM
at.
VA
(4)
(5)
(6)
VA
Plus
Exc
ise
(7)
1947
1948
1949
81.7
83.1
75.1
81.1
79.9
82.5
81.5
74.5
74.0
79.3
79.9
78.7
69.9
71.9
67.9
78.7
67.9
75.8
77.2
69.2
5.9
5.9
5.9
1.8
.6
.6
.0
1.6
1.1
4.1
2.0
.0
2.9
—1.3
1950
1951
1952
1953
1954
91.9
98.2
95.8
108.0
97.1
91.4
90.5
97.8
96.4
95.6
94.5
108.1
106.5
97.4
96.6
87.9
90.4
85.5
95.0
98.5
91.6
92.0
92.8
91.1
104.3
105.5
103.2
94.4
93.3
95.5
85.5
91.6
91.1
103.2
95.5
84.1
88.5
90.8
100.9
97.4
7.8
9.7
5.0
7.1
—.3
1.4
2.6
2.4
.01.
81.4
3.4
.01.
32.5
.9
.0
1.5
2.2
1.1
.0
.5
2.2
—1.1
.0
1.4
3.1 .3
2.3
—1.9
1955
1956
1957
1958
1959
105.8
106.4
109.3
100.0
113.6
106.3
105.3
106.6
106.0
109.1
108.5
100.0
100.0
113.4
112.5
104.7
105.5
103.9
107.6
107.9
107.2
107.9
107.7
108.1
100.0
100.0
100.0
110.0
108.1
111.9
103.9
107.2
108.1
100.0
111.9
103.7
105.2
107.8
100.0
111.8
2.1
1.2
1.5 .0
1.8
.5
.6
.8
.0
.4
—1.6
.4
.0
.8
.6
—.2
.0
.0
.0
.0
.0
1.1
2.5
—1.9
.0
.2
2.0 .3
.0
.1
1960
1961
1962
1963
1964
115.8
114.6
126.0
132.8
142.8
115.5
114.6
114.3
113.4
125.6
124.1
132.5
130.7
142.5
140.
5
108.7
107.1
110.4
108.0
107.3
108.8
115.5
114.5
116.5
118.5
116.6
120.5
126.5
126.
212
6.8
110.4
108.8
116.5
120.5
126.8
112.1
112.1
121.3
124.9
135.2
3.7
2.5
4.7
7.9
7.6
1.2
5.9
—1.7
.0
1.2
5.4
—.8
.0
1.9
8.6
—1.
0.0
2.1
12.2
—2.0
.0
2.3
14.0
—.3
.0
—1.7
—3.3
—4.8
—4.
4—8.4
Not
e: V
A=
val
uead
ded;
VP
=va
lue
of p
rodu
ctio
n. F
or o
ther
abb
revi
atio
ns
see
note
at t
he b
egin
ning
of
App
endi
x C
.12
=co
l. 4
—co
t.6;
col
. 13c
o1. 6
—co
t.7;
aCol
9 =
cot.
I —
cot.
8; c
ot. 1
0co
l. 1
—co
l.3;
col
. 11
=co
l.3
—co
t.4;
cot
.co
l.l4col.7 —
col.8
.
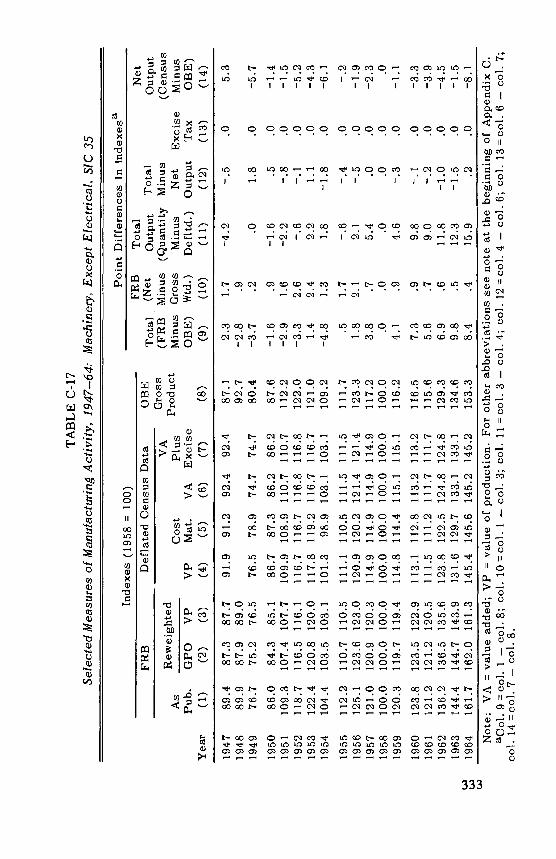
TA
BL
E C
-17
Sele
cted
Mea
sure
s of
Man
ufac
turi
ng A
ctiv
ity, 1
947—
64: M
achi
nery
, Exc
ept E
lect
rica
l, si
c 35
Inde
xes
(195
810
0)Po
int D
iffe
renc
es I
n In
dexe
sa
Tot
al(F
RB
Min
usO
BE
)
FRB
(Net
Min
usG
ross
Wtd
.)
Tot
alO
utpu
t(Q
uant
ityM
inus
Def
ltd.)
Tot
alM
inus
Net
Out
put
Exc
ise
Tax
Net
Out
put
(Cen
sus
Min
usO
BE
)
FRB
Def
late
d C
ensu
sD
ata
OB
EG
ross
Prod
uct
As
Rew
eigh
ted
Cos
tV
PM
at.
VA
VA
Plus
Exc
ise
Pub.
GPO
VP
Yea
r(1
)(2
)(3
)(4
)(5
)(6
)(7
)(8
)(9
)(1
0)(1
1)(1
2)(1
3)(1
4)
1947
89.4
87.3
87.7
91.9
91.2
92.4
92.4
87.1
2.3
1.7
—4.
2—
.5.0
5.3
1948
89.9
87.9
89.0
92.7
—2.
8.9
1949
76.7
75.2
76.5
76.5
78.9
74.7
74.7
80.4
—3.
7.2
.01.
8.0
—5.
7
1950
86.0
84.3
85.1
86.7
87.3
86.2
86.2
87.6
—1.
6.9
—1.
6.5
.0—
1.4
1951
109.
310
7.4
107.
710
9.9
108.
911
0.7
110.
711
2.2
—2.
91.
6—
2.2
—.8
.0—
1.5
1952
118.
711
6.5
116.
111
6.7
116.
711
6.8
116.
812
2.0
—3.
32.
6—
.6—
.1.0
—5.
219
5312
2.4
120.
812
0.0
117.
811
9.2
116.
711
6.7
121.
01.
42.
42.
21.
1.0
—4.
319
5410
4.4
103.
510
3.1
101.
398
.910
3.1
103.
110
9.2
—4.
81.
31.
8—
1.8
.0—
6.1
1955
112.
211
0.7
110.
511
1.1
110.
511
1.5
111.
511
1.7
.51.
7—
.6—
.4.0
—.2
1956
125.
112
3.6
123.
012
0.9
120.
212
1.4
121.
412
3.3
1.8
2.1
2.1
—.5
.0—
1.9
1957
121.
012
0.9
120.
311
4.9
114.
911
4.9
114.
911
7.2
3.8
.75.
4.0
.0—
2.3
1958
100.
010
0.0
100.
010
0.0
100.
010
0.0
100.
010
0.0
.0.0
.0.0
.0.0
1959
120.
311
9.7
119.
411
4.8
114.
411
5.1
115.
111
6.2
4.1
.94.
6—
.3.0
—1.
1
1960
123.
812
3.5
122.
911
3.1
112.
811
3.2
113.
211
6.5
7.3
.99.
8—
.1.0
—3.
319
6112
1.2
121.
212
0.5
111.
511
1.2
111.
711
1.7
115.
65.
6.7
9.0
—.2
.0—
3.9
1962
136.
213
6.5
135.
612
3.8
122.
512
4.8
124.
812
9.3
6.9
.611
.8—
1.0
.0—
4.5
1963
144.
414
4.7
143.
913
1.6
129.
713
3.1
133.
113
4.6
9.8
.512
.3—
1.5
.0—
1.5
1964
161.
716
2.0
161.
314
5.4
145.
614
5.2
145.
215
3.3
8.4
.415
.9.2
.0—
8.1
Not
e: V
A =
valu
ead
ded;
VP
=va
lue
of p
rodu
ctio
n. F
or o
ther
abb
revi
atio
ns s
ee n
ote
at th
e be
ginn
ing
of A
ppen
dix
C.
ac01
9=
col.
1 —
col.
8; c
ol. 1
0co
l. I
—co
l.3;
col
. 11
=co
l.3
—co
t.4;
col
. 12
=co
t.4
—co
t.6;
ccl
. 13
=co
t.6
—co
l.7;
col.
14co
l. 7
—co
l.8.

TA
BL
E C
-18
Sele
cted
Mea
sure
s of
Man
ufac
turi
ng A
ctiv
ity, 1
947—
64: E
lect
rica
l Mac
hine
ry, S
IC 3
6
Inde
xes
(195
810
0)Po
int D
iffe
renc
es I
n In
dexe
sa-
Total
(FRB
Min
usO
BE
)(9
)
FRB
Total
(Net
Out
put
Min
us(Q
uant
ityG
ross
Minus
Wtd.)
Def
ltd.)
(10)
(11)
Tot
alM
inus
Net
Excise
Output
Tax
(12)
(13)
Net
Output
(Cen
sus
Min
usOBE)
(14)
FRB
Deflated CensusData
ORE
Gross
FO
uct
(8)
Yea
r
As
Pub.
(1)
Reweighted
GPO
VP
(2)
(3)
Cost
VP
Mat
.V
A(4
)(5
)(6
)
VA
Plus
Excise
(7)
1947
1948
1949
56.8
58.9
55.2
57.1
57.6
59.6
60.5
55.3
56.2
66.3
75.3
59.3
60.0
68.2
53.5
59.3
53.3
56.0
57.6
52.4
.8 1.3
2.8
—.8
—8.
7—
1.6
—1.
0—
3.8
7.0
.0
6.5
.2
3.3 .9
1950
1951
1952
1953
1954
75.7
76.1
87.0
101.
091
.7
71.4
73.5
75.9
77.1
89.2
89.8
101.
310
2.1
91.3
91.8
78.8
89.0
70.8
86.4
92.2
81.9
96.7
101.
193
.3109.4
119.
510
1.6
94.8
102.
988
.4
70.6
82.1
93.1
101.
688
.2
65.9
75.5
88.8
97.3
86.9
9.8 .6
—1.
83.
74.8
2.2
—5.
3—1.0
—9.
3—2.8
—6.
9—
1.1
—7.
3—.1
—3.
0
8.0
.24.
5—.2
3.4
.2
7.8
.06.
4.2
4.7
6.6
4.3
4.3
1.3
1955
1956
1957
1958
1959
104.
111
4.8
112.
310
0.0
120.
9
104.
510
5.3
115.
211
5.4
112.
311
2.3
100.
0 10
0.0
120.
912
0.8
105.
611
1.4
101.
111
1.0
114.
310
8.4
107.
410
8.5
106.
510
0.0
100.
010
0.0
118.
811
8.4
119.
2
101.
310
8.3
106.
410
0.0
119.
1
93.9
101.
610
4.5
100.
011
8.6
10.2
13.2
7.8 .0
2.3
—1.
2—
.3
—.6
4.4
.0
4.9
.0
.0.1
2.0
4.5
—.2
2.6
.1.9
.1
.0.0
—.4
.1
7.4
6.7
1.9 .0 .5
1960
1961
1962
1963
1964
126.
212
8.6
142.8
147.0
156.2
125.
212
4.5
126.
8126.0
141.2
140.2
145.4
144.5
154.6
153.8
125.
712
2.8
128.
013
1.9
128.0
135.2
151.9
143.7
158.7
157.9
146.3
167.5
166.7
150.6
179.9
127.
513
4.6
157.8
166.8
179.1
124.
713
1.3
150.1
158.0
167.1
1.5
—2.
7—7.3
—11.0
—10.9
1.7
—1.
22.
6—5.9
2.6
—11.7
2.5
—13.4
2.4
—12.9
—2.
3.5
—3.3
.6
—6.8
.9
—9.6
.7
—13.2
.8
2.8
3.3
7.7
8.8
12.0
Note: VA
= v
alue
added;VP
value of production. For other abbreviations see note at thebeginning of Appendix C.
acol
9co
l. 1
—co
l.8;
col
. 10
col.
1 —
col.
3; col. 11
co1. 3 —
col.
4; col. 12
col. 4 —
col.
6; col. 13
col. 6 —
col.
7;co
l. 14
=co
l. 7
—co
l.8.

Lti
TA
BL
E C
-19
Sele
cted
Mea
sure
s of
Man
ufac
turi
ng A
ctiv
ity, 1
947—
64: T
rans
port
atio
n E
quip
men
t and
Ord
nanc
e,E
xcep
t Mot
or V
ehic
les,
sic
37+
19—
371
Inde
xes
(195
310
0)Po
int D
iffe
renc
es I
n In
dexe
sa
Tot
al(F
RB
Min
usO
BE
)
FRB
(Net
Min
usG
ross
Wtd
.)
Tot
alO
utpu
t(Q
uant
ityM
inus
Def
ltd.)
Tot
alM
inus
Net
Out
put
Exc
ise
Tax
Net
Out
put
(Cen
sus
Min
usO
BE
)
FRB
Def
late
d C
ensu
sD
ata
OB
EG
ross
Prod
uct
As
Rew
ei h
ted
gC
ost
VP
Mat
.V
A
VA
Plus
Exc
ise
Pub.
GPO
VP
Yea
r(1
)(2
)(3
)(4
)(5
)(6
)(7
)(8
)(9
)(1
0)(1
1)(12)
(13)
(14)
1947
23.5
25.3
28.1
33.8
33.7
34.0
34.0
30.2
—6.
7—
4.6
—5.
7—
.2.0
3.8
1948
26.0
26.7
30.1
36.6
—10
.6—
4.1
1949
25.2
27.0
30.1
34.5
37.3
32.0
32.0
35.8
—10
.6—
4.9
—4.
42.
5.0
—3.
8
1950
26.7
27.9
30.2
37.5
38.4
36.7
36.7
37.8
—11
.1—
3.5
—7.
3.8
.01.
119
5153
.960
.863
.660
.158
.861
.361
.355
.6—
1.7
—9.
73.
5—
1.2
.05.
719
5281
.287
.288
.810
1.8
107.
896
.396
.386
.4—
5.2
—7.
6—
13.0
5.5
.09.
919
5310
1.9
110.
011
1.4
126.
0 13
9.4
113.
911
3.9
104.
0—
2.1
—9.
5—
14.6
12.1
.09.
91954
88.3
91.8
91.9
109.9
116.5
104.0
104.0
99.7
—11.4
—3.6
—18.0
5.9
.0
4.3
1955
90.0
93.2
93.9
101.
410
5.5
97.6
97.6
95.9
—5.
9—
3.9
—7.
53.
8.0
1.7
1956
98.7
99.7
100.
910
2.9
105.
510
0.6
100.
696
.62.
1—
2.2
—2.
02.
3.0
4.0
1957
109.
210
9.1
110.
311
4.1
120.
410
8.4
108.
410
6.0
3.2
—1.
1—
3.8
5.7
.02.
419
5310
0.0
100.
010
0.0
100.
010
0.0
100.
010
0.0
100.
0.0
.0.0
.0.0
.019
5910
6.5
107.
710
8.1
102.
810
4.9
100.
710
0.7
99.6
6.9
—1.
65.
32.
1.0
1.1
1960
102.
210
4.2
104.
897
.698
.496
.996
.997
.15.
1—
2.6
7.2
.7.0
—.2
1961
105.
210
8.2
108.
096
.499
.094
.094
.010
1.0
4.2
—2.
811
.62.
4.0
—7.
019
6211
4.7
118.
011
8.3
103.
010
1.0
104.
810
4.8
115.
4—
.7—
3.6
15.3
—1.
8.0
—10
.619
6312
0.5
123.
812
4.2
108.
110
0.7
115.
011
5.0
121.
3—
.8—
3.7
16.1
—6.
9.0
—6.
319
6412
4.4
124.
612
5.7
108.
610
1.7
115.
211
5.2
123.
8.6
—1.
317
.1—
6.6
.0—
8.6
Not
e: V
Ava
lue
adde
d, V
Pva
lue
of p
rodu
ctio
n. F
or o
ther
abb
revi
atio
ns s
ee n
ote
at th
e be
ginn
ing
of A
ppen
dix
C.
—co
t.3;
cot
. 11=
col.
3 —
cot.
4; c
ol. 1
2=co
t. 4
—co
l.6;
cot
. 13c
o1. 6
—co
l.7;
ac01
9co
l. 1
—co
t.8;
col
. 10
col.
1co
l. 14
col.7
—co
l.8.
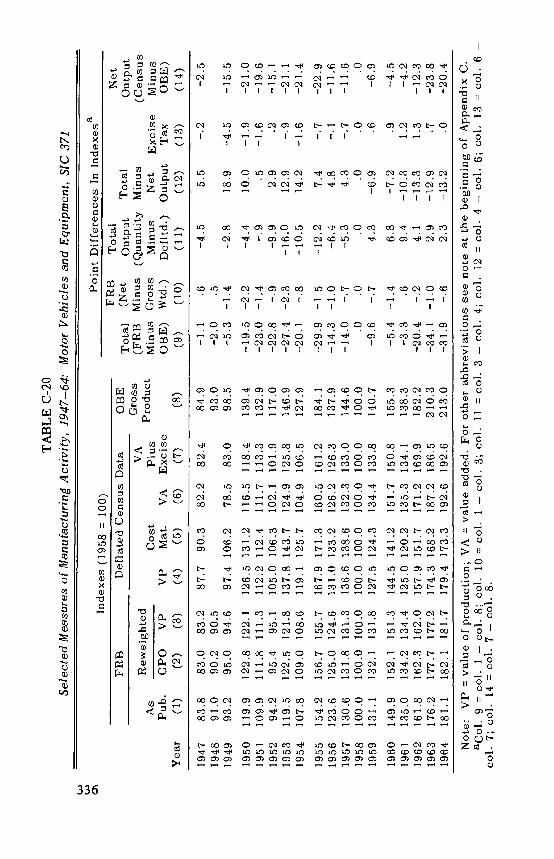
TA
BL
E C
-20
Not
e: V
P =
valu
eof
prod
uctio
n;ac
ol9
col.
I —
col.
8; c
ol. 1
0 =
col
col.
7; c
ol. 1
4 =
col.
7 —
Co1
.8.
0\
Sele
cted
Mea
sure
s of
Man
ufac
turi
ng A
ctiv
ity,
1947
—64
:M
otor
Veh
icle
s an
d E
quip
men
t, SI
C 3
71
Inde
xes
(195
8 =
100)
Poin
t Dif
fere
nces
In
Inde
xesa
Tot
al(F
RB
Min
us
(Net
Out
put
Tot
alM
inus
(Qua
ntity
Min
usG
ross
Min
usN
etE
xcis
e
Out
put
(Cen
sus
Min
us
FRB
Def
late
d C
ensu
s D
ata
OB
EG
ross
Prod
uct
As
Rew
eigh
ted
VA
Cos
tPl
usPu
b.G
POV
PV
PM
at.
VA
Exc
ise
OB
E)
Wtd
.)D
efltd
.)O
utpu
tT
axO
BE
)Y
ear
(1)
(2)
(3)
(4)
(5)
(6)
(7)
(8)
(9)
(10)
(11)
(12)
(13)
(14)
1947
83.8
83.0
83.2
87.7
90.3
82.2
82.4
84.9
—1.
1.6
—4.
55.
5—
.2—
2.5
1948
91.0
90.2
90.5
93.0
—2.
0.5
1949
93.2
95.0
94.6
97.4
106
.278
.583
.098
.5—
5.3
—1.
4—
2.8
18.9
—4.
5—
15.5
1950
119.
912
2.8
122.
112
6.5
131.
211
6.5
118.
413
9.4
—19
.5—
2.2
—4.
410
.0—
1.9
—21
.019
5110
9.9
111.
811
1.3
112.
2 11
2.4
111.
711
3.3
132.
9—
23.0
—1.
4—
.9.5
—1.
8—
19.6
1952
94.2
95.4
95.1
105.
0 10
6.3
102.
110
1.9
117.
0—
22.8
—.9
—9.
92.
9.2
—15
.119
5311
9.5
122.
512
1.8
137.
8 14
3.7
124.
912
5.8
146.
9—
27.4
—2.
3—
16.0
12.9
—.9
—21
.119
5410
7.8
109.
010
8.6
119.
1 12
5.7
104.
910
6.5
127.
9—
20.1
—.8
—10
.514
.2—
1.6
—21
.4
1955
154.
215
6.7
155.
716
7.9
171.
316
0.5
161.
218
4.1
—29
.9—
1.5
—12
.27.
4—
.7—
22.9
1956
123.
612
5.0
124.
613
1.0
133.
212
6.2
126.
313
7.9
—14
.3—
1.0
—6.
44.
8—
.1—
11.6
1957
130.
613
1.8
131.
313
6.6
138.
613
2.3
133.
014
4.8
—14
.0—
.7—
5.3
4.3
—.7
—11
.619
5810
0.0
100.
010
0.0
100.
0 10
0.0
100.
010
0.0
100.
0.0
.0.0
.0.0
.019
5913
1.1
132.
113
1.8
127.
5 12
4.3
134.
413
3.8
140.
7—
9.6
—.7
4.3
—6.
9.6
—6.
9
1960
149.
915
2.1
151.
314
4.5
141.
215
1.7
150.
815
5.3
—5.
4—
1.4
6.8
—7.
2.9
—4.
519
6113
5.0
134.
213
4.4
125.
0 12
0.2
135.
313
4.1
138.
3—
3.3
.69.
4—
10.3
1.2
—4.
219
6216
1.8
162.
316
2.0
157.
9 15
1.7
171.
216
9.9
182.
2—
20.4
—.2
4.1
—13
.31.
3—
12.3
1963
176.
217
7.7
177.
217
4.3
168.
218
7.2
186.
521
0.3
—34
.1—
1.0
2.9
—12
.9.7
—23
.819
6418
1.1
182.
118
1.7
179.
4 17
3.3
192.
619
2.6
213.
0—
31.9
—.6
2.3
—13
.2.0
—20
.4
VA
valu
e ad
ded.
For
oth
er a
bbre
viat
ions
see
not
e at
the
begi
nnin
g of
App
endi
x C
.1
—co
l.3;
col
. 11
=co
l.3
—co
l.4;
Co1
. 12
=co
l.4
—co
l.6;
col
. 13
=co
l.6
—
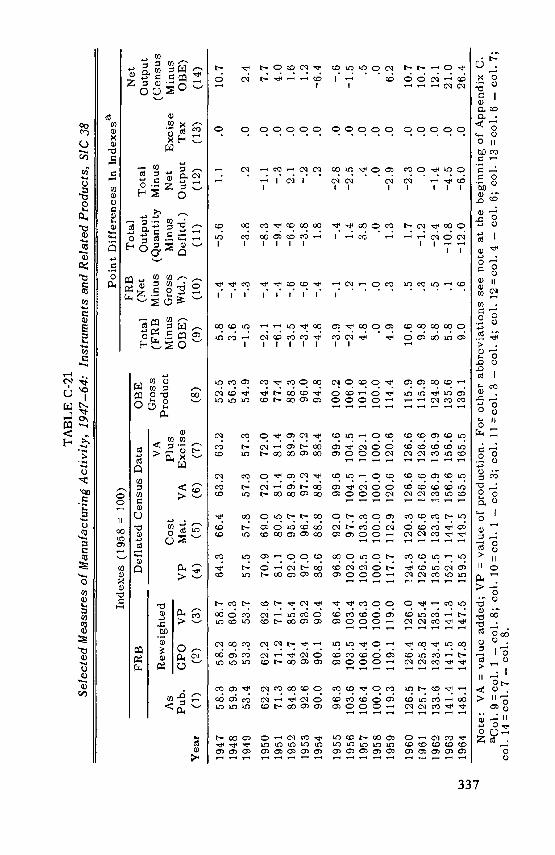
TA
BL
E C
-21
Sele
cted
Mea
sure
s of
Man
ufac
turi
ng A
ctiv
ity, 1
947—
64:
Inst
rum
ents
and
Rel
ated
Pro
duct
s, S
IC 3
8
exes (1958
100)
Pojo
t Dif
fere
nce
s In
Ind
exes
am
d
Tot
al(F
RB
Min
usO
BE
)(9
)
FRB
(Net
Min
usG
ross
Wtd
.)(1
0)
Tot
alO
utpu
t(Q
uant
ityM
inus
Def
ltd.)
(11)
Tot
alM
inus
Net
Exc
ise
Out
put
Tax
(12)
(13)
Net
Out
put
(Cen
sus
Min
usO
BE
)(1
4)
FRB
Def
late
d C
ensu
s D
ata
OB
EG
ross
Prod
uct
(8)
Yea
r
As
Pub.
(1)
Rew
ei h
ted
g
GPO
VP
(2)
(3)
VA
Coa
tPl
usV
PM
at.
VA
Exc
ise
(4)
(5)
(6)
(7)
1947
1948
1949
58.3
59.9
53.4
58.2
58.7
59.8
60.3
53.3
53.7
64.3
66.4
63.2
63.2
57.5
57.8
57.3
57.3
52.5
56.3
54.9
5.8
3.6
—1.
5
—.4
—.4
—.3
—5.
6
—3.
8
1.1
.0
.2.0
10.7
2.4
1950
1951
1952
1953
1954
62.2
71.3
84.8
92.6
90.0
62.2
62.6
71.2
71.7
84.7
85.4
92.4
93.2
90.1
90.4
70.9
69.0
72.0
72.0
81.1
80.5
81.4
81.4
92.0
95.7
89.9
89.9
97.0
96.7
97.2
97.2
88.6
88.8
88.4
88.4
64.3
77.4
88.3
96.0
94.8
—2.
1—
6.1
—3.
5—
3.4
—4.
8
—.4
—.4
—.6
—.6
—.4
—8.
3—
9.4
—6.
6—
3.8
1.8
—1.
1.0
—.3
.02.
1.0
—.2
.0.2
.0
7.7
4.0
1.6
1.2
—6.
4
1955
1956
1957
1958
1959
96.3
103.
610
6.4
100.
011
9.3
96.5
96.4
103.
510
3.4
106.
410
6.3
100.
010
0.0
119.
111
9.0
96.8
92.0
99.6
99.6
102.
097
.710
4.5
104.
510
2.5
103.
310
2.1
102.
110
0.0
100.
010
0.0
100.
011
7.7
112.
912
0.6
120.
6
100.
210
6.0
101.
610
0.0
114.
4
—3.
9—
2.4
4.8 .0
4.9
—.1 .2 .1 .0 .3
—.4
1.4
3.8 .0 1.3
—2.
8.0
—2.
5.0
.4.0
.0.0
—2.
9.0
—.6
—1.
5 .5 .06.
2
1960
1961
1962
1963
1964
126.
512
5.7
133.
614
1.4
148.
1
126.
412
6.0
125.
812
5.4
133.
413
3.1
141.
514
1.3
147.
814
7.5
124.
312
0.3
126.
612
6.6
126.
612
6.6
126.
612
6.6
135.
513
3.3
136.
913
6.9
152.
114
4.7
156.
615
6.6
159.
514
9.5
165.
516
5.5
115.
911
5.9
124.
813
5.6
139.
1
10.6 9.8
8.8
5.8
9.0
.5 .3 .5 .1 .6
1.7
—1.
2—
2.4
—10
.8—
12.0
—2.
3.0
.0.0
—1.
4.0
—4.
5.0
—6.
0.0
10.7
10.7
12.1
21.0
26.4
Not
e: V
A=
val
uead
ded;
VP
=va
lue
of p
rodu
ctio
n. F
or
othe
r ab
bre
viat
ions
see
note
at t
hebe
ginn
ing
of A
ppen
dix
C.
acol
9co
I. 1
—co
l.8;
col
. 10
=co
l.I
—co
l.3;
col
. 11
3 —
col.
4; c
ol. 1
2co
I. 4
—co
l.6;
col
. 13
col.
6 —
col.
7;co
l. 14
=co
l.7
—co
l.8.
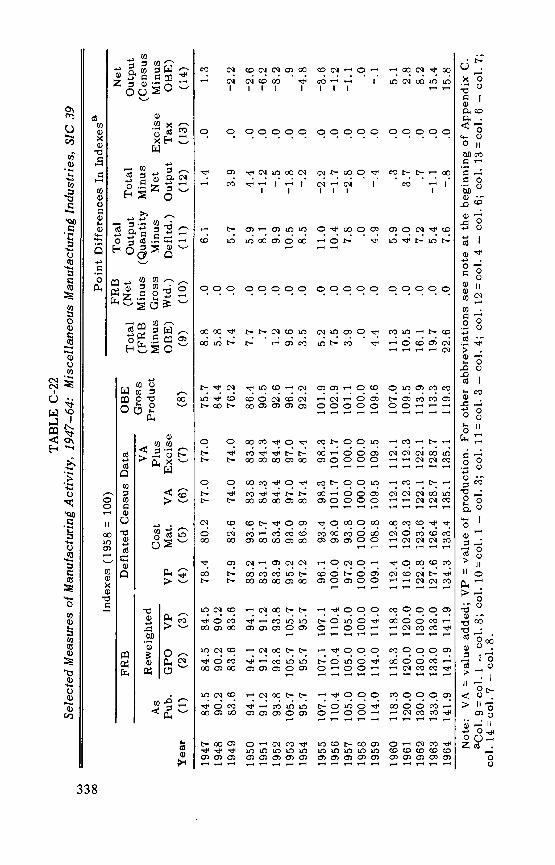
TA
BL
E C
-22
Sele
cted
Mea
sure
s of
Man
ufac
turi
ng A
ctiv
ity, 1
947—
64: M
isce
llane
ous
Man
ufac
turi
ng in
dust
ries
, SIC
39
Inde
xes
(195
8 =
100)
Poin
t Dif
fere
nces
In
Inde
xesa
Tot
al(F
RB
Min
usO
BE
)
FRB
(Net
Min
usG
ross
Wtd
.)
Tot
alO
utpu
t(Q
uant
ityM
inus
Def
ltd.)
Tot
alM
inus
Net
Out
put
Exc
ise
Tax
Net
Out
put
(Cen
sus
Min
usO
BE
)
FRB
Def
late
d C
ensu
sD
ata
OB
EG
ross
Prod
uct
As
Rew
eigh
ted
Cos
tV
PM
at.
VA
VA
Plus
Exc
ise
Pub.
GPO
VP
Yea
r(1
)(2
)(3
)(4
)(5
)(6
)(7
)(8
)(9
)(1
0)(1
1)(1
2)(1
3)(1
4)
1947
84.5
84.5
84.5
78.4
80.2
77.0
77.0
75.7
8.8
.06.
11.
4.0
1.3
1948
90.2
90.2
90.2
84.4
5.8
.019
4983
.683
.683
.677
.982
.674
.074
.076
.27.
4.0
5.7
3.9
.0—
2.2
1950
94.1
94.1
94.1
88.2
93.6
83.8
83.8
86.4
7.7
.05.
94.
4.0
—2.
619
5191
.291
.291
.283
.181
.784
.384
.390
.5.7
.08.
1—
1.2
.0—
6.2
1952
93.8
93.8
93.8
83.9
83.4
84.4
84.4
92.6
1.2
.09.
9—
.5.0
—8.
219
5310
5.7
105.
710
5.7
95.2
93.0
97.0
97.0
96.1
9.6
.010
.5—
1.8
.0.9
1954
95.7
95.7
95.7
87.2
86.9
87.4
87.4
92.2
3.5
.08.
5—
.2.0
—4.
8
1955
107.
110
7.1
107.
196
.193
.498
.398
.310
1.9
5.2
.011
.0—
2.2
.0—
3.6
1956
110.
411
0.4
110.
410
0.0
98.0
101.
710
1.7
102.
97.
5.0
10.4
—1.
7.0
—1.
219
5710
5.0
105.
010
5.0
97.2
93.8
100.
010
0.0
101.
13.
9.0
7.8
—2.
8.0
—1.
119
5810
0.0
100.
010
0.0
100.
010
0.0
100.
010
0.0
100.
0.0
.0.0
.0.0
.019
5911
4.0
114.
011
4.0
109.
110
8.8
109.
510
9.5
109.
64.
4.0
4.9
—.4
.0—
.1
1960
118.
311
8.3
118.
311
2.4
112.
811
2.1
112.
110
7.0
11.3
.05.
9.3
.05.
119
6112
0.0
120.
012
0.0
116.
012
0.3
112.
311
2.3
109.
510
.5.0
4.0
3.7
.02.
819
6213
0.0
130.
013
0.0
122.
812
3.6
122.
112
2.1
113.
916
.1.0
7.2
.7.0
8.2
1963
133.
013
3.0
133.
012
7.6
126.
412
8.7
128.
711
3.3
19.7
.05.
4—
1.1
.015
.419
6414
1.9
141.
914
1.9
134.
313
3.4
135.
113
5.1
119.
322
.6.0
7.6
—.8
.015
.8
Not
e: V
Ava
lue
adde
d; V
Pva
lue
of p
rodu
ctio
n. F
or o
ther
abb
revi
atio
ns s
ee n
ote
at th
e be
ginn
ing
of A
ppen
dix
C.
—ao
l.3;
col
. 11
col.
3 —
col.
4; a
ol. 1
2=co
l. 4
—co
l.6;
col
. 13
col.
6 —
col.
7;
00
ac01
9=
col.
I —
col.
8; c
ol. 1
0co
l. 1
cot.
l4co
l.7 —
col.8
.
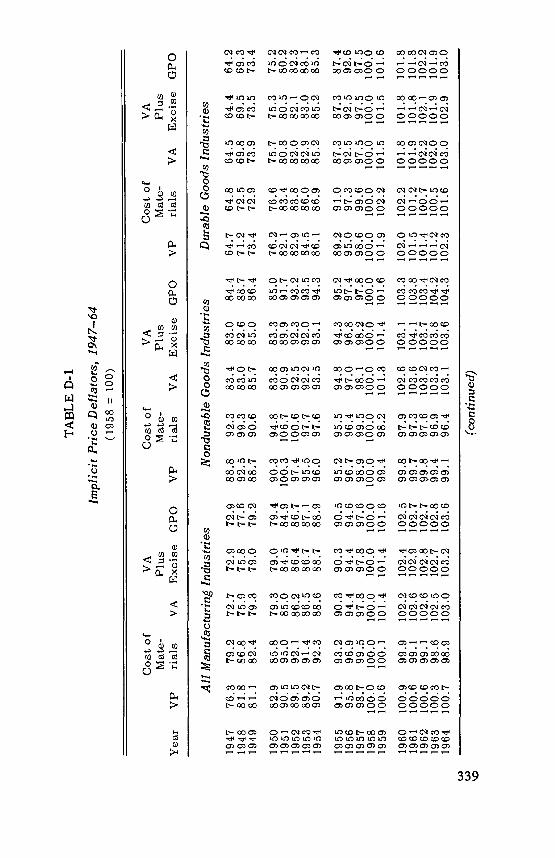
TA
BL
E D
-1
impl
icit
Pric
e D
efla
tors
, 194
7—64
(195
8 =
100)
Yea
rV
P
Cos
t of
Mat
e-ri
als
VA
VA
Plus
Exc
ise
GPO
Cos
t of
Mat
e-V
Pri
als
VA
VA
Plus
Exc
ise
GPO
Cos
t of
VA
Mat
e-Pl
usV
Pri
als
VA
Exc
ise
GPO
All
Man
ufac
turi
ngin
dust
ries
Non
dura
ble
Goo
dsin
dust
ries
Dur
able
Goo
ds in
dust
ries
1947
1948
1949
76.3
81.8
81.1
79.2
72.7
86.8
75.9
82.4
79.3
72.9
72.9
75.8
77.6
79.0
79.2
88.8
92.3
92.5
99.3
88.7
90.6
83.4
83.0
85.7
83.0
84.4
82.6
88.7
85.0
86.4
64.7
64.8
64.5
64.4
71.2
72.5
69.8
69.5
73.4
72.9
73.9
73.5
64.2
69.3
73.4
1950
1951
1952
1953
1954
82.9
90.5
89.5
89.2
90.7
85.8
79.3
95.0
85.0
92.1
86.2
91.4
86.5
92.3
88.6
79.0
79.4
84.5
84.9
86.4
86.7
86.7
87.1
88.7
88.9
90.3
94.8
100.
.310
6.7
97.4
100.
695
.597
.796
.097
.6
83.8
90.9
92.5
92.2
93.5
83.3
85.0
89.9
91.7
92.3
93.2
92.0
93.5
93.1
94.3
76.2
76.6
75.7
75.3
82.1
83.4
80.8
80.5
82.9
83.8
82.0
82.1
84.5
86.0
82.9
83.0
86.1
86.9
85.2
85.2
75.2
80.2
82.3
83.1
85.3
1955
1956
1957
1958
1959
91.9
95.8
98.7
100.
010
0.6
93.2
90.3
96.9
94.4
99.5
97.8
100.
010
0.0
100.
110
1.4
90.3
90.5
94.4
94.6
97.8
97.6
100.
010
0.0
101.
410
1.6
95.2
95.5
96.7
98.9
99.5
100.
010
0.0
99.4
98.2
94.8
97.0
98.1
100.
010
1.3
94.3
95.2
96.8
97.4
98.2
97.8
100.
010
0.0
101.
410
1.6
89.2
91.0
87.3
87.3
95.0
97.3
92.5
92.5
98.6
99.6
97.5
97.5
100.
010
0.0
100.
010
0.0
101.
910
2.2
101.
510
1.5
87.4
92.6
97.5
100.
010
1.6
1960
1961
1962
1963
1964
100.
910
0.6
100.
610
0.3
100.
7
99.9
102.
299
.110
2.6
99.1
102.
698
.610
2.5
98.9
103.
0
102.
410
2.5
102.
910
2.7
102.
810
2.7
102.
710
2.8
103.
210
3.6
99.8
97.9
99.7
97.3
99.8
97.6
99..4
96.9
99.1
96.4
102.
610
3.6
103.
210
3.3
103.
1
103.
110
3.3
104.
110
3.8
103.
710
3.4
103.
810
4.2
103.
610
4.3
102.
010
2.2
101.
810
1.8
101.
510
1.2
101.
910
1.8
101.
410
0.7
102.
210
2.1
101.
210
0.5
102.
010
1.9
102.
310
1.6
103.
010
2.9
101.
810
1.8
102.
210
1.9
103.
0
(con
tinue
d)

TA
BL
E D
-1 (
cont
inue
d)
Yea
rC
ost o
fV
A P
lus
VP
Mat
eria
lsV
AE
xcis
e(G
PO)
VP
Cos
t of
VA
Plu
sM
ater
ials
VA
Exc
ise
GPO
VP
Cos
t of
VA
Plu
sM
ater
ials
VA
Exc
ise
(GPO
)
Food
and
Kin
dred
Pro
duct
s,SI
C 2
0T
obac
co M
anuf
actu
res,
sic
21T
extil
e M
ill P
rodu
cts,
SIC
22
1947
1948
1949
93.2
98.0
82.0
82.8
99.3
105.
285
.785
.991
.592
.090
.289
.7
74.2
76.0
77.8
77.8
65.3
78.5
79.4
67.3
79.6
82.7
67.3
78.7
81.2
81.4
80.7
110.
511
6.5
105.
4
99.4
126.
112
6.1
107.
312
8.2
128.
210
1.1
111.
311
1.3
1950
1951
1952
1953
1954
92.8
96.0
85.6
85.8
103.
010
9.4
88.7
88.7
101.
610
5.6
92.3
93.5
96.2
99.3
89.6
91.0
98.3
100.
293
.994
.8
81.2
83.5
83.8
92.3
96.2
83.4
75.9
82.8
90.9
68.8
80.6
89.9
71.0
87.7
89.2
100.
310
0.1
91.3
109.
310
3.4
84.1
83.3
90.1
100.
110
2.8
112.
912
7.6
112.
110
8.4
103.
7
110.
611
5.9
115.
912
7.1
128.
512
8.5
110.
811
4.3
114.
310
5.5
112.
911
2.9
104.
110
3.2
103.
2
1955
1956
1957
1958
1959
94.2
93.1
96.7
97.2
93.4
93.0
94.3
95.0
95.8
97.0
93.4
94.2
100.
010
0.0
100.
010
0.0
97.7
94.3
106.
510
5.6
93.6
94.2
97.3
100.
010
1.6
91.0
99.3
99.7
94.1
94.3
97.5
96.8
98.2
99.2
100.
010
0.0
100.
010
3.6
98.3
99.3
99.8
98.1
99.4
100.
099
.4
103.
910
3.6
103.
110
0.0
101.
8
103.
610
4.3
104.
310
2.6
105.
110
5.1
103.
410
2.7
102.
710
0.0
100.
010
0.0
100.
710
3.5
103.
5
1960
1961
1962
1963
1964
97.7
94.1
106.
510
5.7
99.2
94.4
111.
811
0.2
99.7
95.2
111.
410
9.9
99.2
94.9
110.
110
8.8
99.2
94.1
111.
811
0.3
101.
210
3.0
103.
410
3.0
103.
4
102.
199
.799
.910
6.9
96.5
98.4
108.
595
.597
.910
1.8
105.
210
2.2
101.
110
7.4
103.
3
99.9
98.7
98.3
101.
910
2.7
102.
699
.510
0.4
99.6
99.9
99.3
107.
710
7.7
97.5
102.
510
2.5
98.6
103.
110
3.1
98.9
100.
910
0.9
98.1
102.
810
2.8

TA
BL
E D
-1 (
cont
inue
d)
Cos
t of
VA
Plu
sC
ost o
fV
A P
lus
Cos
t of
VA
Plu
sY
ear
VP
Mat
eria
lsV
AE
xcis
eV
PM
ater
ials
VA
Exc
ise
VP
Mat
eria
lsV
AE
xcis
e(G
PO)
(GPO
)(G
PO)
App
arel
and
Rel
ated
Pro
duct
s,L
umbe
r an
d W
ood
Prod
ucts
,Fu
rnitu
re a
nd F
ixtu
res,
SIC
23
Exc
ept F
urni
ture
, SiC
24
SiC
25
1947
103.
410
8.6
97.1
97.1
79.6
78.5
80.7
80.7
74.0
77.5
71.1
71.1
1948
105.
111
4.6
94.6
94.6
91.2
89.7
92.5
92.5
79.0
84.4
74.7
74.7
1949
98.8
103.
991
.891
.885
.084
.086
.086
.079
.281
.177
.777
.7
1950
99.2
110.
086
.586
.597
.094
.999
.299
.281
.787
.876
.776
.719
5110
6.0
122.
489
.589
.510
6.2
103.
010
9.7
109.
792
.095
.888
.788
.719
5210
1.0
108.
492
.192
.110
3.5
100.
910
6.4
106.
488
.992
.585
.985
.919
5399
.510
5.9
92.8
92.8
103.
710
0.4
107.
510
7.5
89.9
93.5
86.7
86.7
1954
99.2
102.
894
.894
.810
2.1
99.0
106.
010
6.0
90.1
93.1
87.4
87.4
1955
99.1
103.
493
.893
.810
5.5
103.
810
7.7
107.
791
.396
.087
.287
.219
5610
0.7
102.
798
.298
.210
7.4
105.
810
9.3
109.
395
.699
.192
.592
.519
5710
0.5
102.
298
.398
.310
2.1
101.
510
2.9
102.
998
.599
.997
.297
.219
5810
0.0
100.
010
0.0
100.
010
0.0
100.
010
0.0
100.
010
0.0
100.
010
0.0
100.
019
5910
0.9
101.
899
.799
.710
6.5
106.
410
6.7
106.
710
1.0
101.
910
0.1
100.
1
1960
102.
010
3.6
100.
010
0.0
102.
810
2.3
103.
510
3.5
102.
110
1.1
103.
010
3.0
1961
101.
710
0.5
103.
210
3.2
98.6
98.0
99.4
99.4
102.
699
.410
6.0
106.
019
6210
2.4
100.
710
4.6
104.
699
.099
.498
.598
.510
3.7
107.
910
7.9
1963
102.
910
0.2
106.
310
6.3
101.
210
1.3
101.
010
1.1
104.
610
0.2
109.
010
9.0
1964
103.
910
0.9
107.
810
7.8
103.
010
2.4
103.
810
3.8
105.
110
0.3
110.
411
0.4
(con
tinue
d)

TA
BL
E D
-1 (
cont
inue
d)
Yea
rC
ost o
fV
A P
lus
VP
Mat
eria
lsV
AE
xcis
e(G
PO)
Cos
t of
VP
Mat
eria
lsV
A P
lus
VA
Exc
ise
(GPO
)
Cos
t of
VA
Plu
sV
PM
ater
ials
VA
Exc
ise
(GPO
)
Pape
r an
d A
llied
Pro
duct
s,Pr
intin
g an
dPu
blis
hing
,C
hem
ical
s an
d A
llied
Pro
duct
s,SI
C 2
6SI
C27
SIC
28
1947
73.2
77.2
68.9
68.9
69.8
69.2
70.1
70.1
90.4
90.3
90.5
90.5
1948
'77
.275
.978
.778
.774
.976
.374
.374
.393
.295
.091
.491
.419
4974
.575
.173
.873
.877
.278
.076
.876
.889
.086
.192
.092
.0
1950
76.3
81.5
70.5
70.5
78.3
79.1
77.8
77.8
89.0
87.6
90.2
90.2
1951
90.4
97.1
83.1
83.1
83.4
86.8
81.6
81.6
100.
199
.710
0.6
100.
619
5288
.890
.187
.187
.188
.090
.486
.886
.896
.795
.098
.498
.419
5387
.891
.084
.184
.189
.691
.288
.788
.796
.995
.598
.398
.319
5488
.590
.785
.985
.988
.790
.987
.587
.597
.795
.999
.499
.4
1955
90.6
94.0
86.6
86.6
91.1
93.1
90.1
90.1
97.8
96.2
99.2
99.2
1956
97.0
98.9
94.8
94.8
94.2
97.5
92.5
92.5
98.1
98.5
97.7
97.7
1957
99.4
99.3
99.4
99.4
98.2
100.
896
.996
.999
.510
0.5
98.7
98.7
1958
100.
010
0.0
100.
010
0.0
100.
010
0.0
100.
010
0.0
100.
010
0.0
100.
010
0.0
1959
100.
210
1.5
98.6
98.6
101.
210
0.6
101.
610
1.6
98.8
98.9
98.6
98.6
1960
101.
510
0.7
102.
510
2.5
104.
110
2.0
105.
310
5.3
99.0
100.
098
.198
.119
6198
.697
.410
0.0
100.
010
5.1
101.
910
7.0
107.
097
.899
.196
.896
.819
6299
.198
.310
0.1
100.
110
6.8
102.
710
9.2
109.
296
.296
.496
.196
.119
6398
.398
.398
.298
.210
9.4
103.
511
2.9
112.
9•9
5.6
94.8
96.3
96.3
1964
98.5
99.1
97.8
97.8
109.
610
4.7
112.
611
2.6
95.4
94.2
96.3
96.3
(con
tinue
d)

TA
BL
E D
-1 (
cont
inue
d)
Cos
tof
VA
Plus
Cos
t.of
VA
Plu
sC
ost
ofV
A P
lus
Yea
rV
PM
ater
ials
VA
Exc
ise
GPO
VP
Mat
eria
lsV
AE
xcis
eV
PM
ater
ials
VA
Exc
ise
(GPO
)(G
PO)
Petr
oleu
m a
nd R
elat
ed in
dust
ries
,R
ubbe
r an
d M
isc.
Pla
stic
Lea
ther
and
Lea
ther
Pro
duct
s,SI
C 2
9Pr
oduc
ts, S
iC 3
0SI
C 3
1
1947
74.6
71.6
86.5
75.5
90.9
69.6
86.9
56.8
57.4
92.8
122.
269
.669
.619
4871
.289
.345
.347
.110
8.7
72.3
89.0
59.7
60.0
95.2
120.
274
.374
.319
4982
.384
.374
.266
.985
.271
.284
.460
.961
.091
.311
0.3
73.5
73.5
1950
79.9
83.8
65.9
62.0
87.2
78.0
104.
062
.162
.296
.812
2.6
74.8
74.8
1951
89.3
87.4
97.5
83.1
106.
691
.412
8.0
68.1
67.7
111.
414
2.5
83.8
83.8
1952
89.6
87.2
101.
288
.910
2.1
88.0
110.
471
.270
.696
.210
1.0
91.0
91.0
1953
91.5
90.5
96.2
86.2
111.
386
.210
0.8
74.9
74.0
96.3
104.
688
.588
.519
5492
.991
.410
0.7
87.6
107.
486
.510
1.0
75.6
74.7
94.1
94.9
93.2
93.2
1955
93.8
92.0
101.
989
.110
2.7
92.9
109.
380
.479
.193
.895
.392
.192
.119
5698
.393
.812
0.1
106.
311
5.7
97.3
104.
291
.490
.698
.810
0.0
97.6
97.6
1957
105.
010
2.0
119.
111
1.9
104.
798
.610
2.1
95.5
95.9
99.3
98.3
100.
310
0.3
1958
100.
010
0.0
100.
010
0.0
100.
010
0.0
100.
010
0.0
100.
010
0.0
100.
010
0.0
100.
019
5999
.397
.510
8.5
108.
311
3.0
96.8
103.
490
.891
.410
9.8
125.
697
.297
.2
1960
99.5
•97.
410
9.6
117.
912
2.0
95.2
103.
088
.289
.010
8.9
110.
510
7.2
107.
219
6110
0.1
97.5
112.
011
9.3
118.
693
.296
.989
.891
.210
9.3
112.
710
6.0
106.
019
6298
.897
.910
2.7
113.
011
0.2
92.1
95.6
88.9
91.2
110.
911
4.3
107.
610
7.6
1963
97.4
97.5
96.9
108.
611
5.5
92.5
94.1
91.1
93.2
109.
210
5.3
113.
611
3.6
1964
93.4
96.6
82.8
97.7
109.
391
.993
.390
.792
.710
9.3
106.
211
2.5
112.
5
(con
tinue
d)
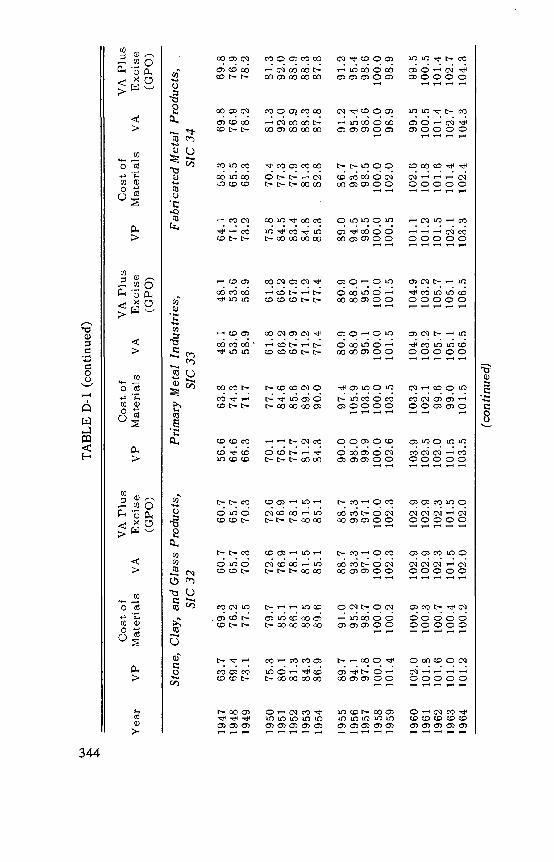
tinue
d)
t,)T
AB
LE
D-1
(co
ntin
ued)
Cos
tof
VA
Plu
sC
ost
ofV
A P
lus
Cos
tof
VA
Plu
sY
ear
VP
Mat
eria
lsV
AE
xcis
eV
PM
ater
ials
VA
Exc
ise
VP
Mat
eria
lsV
AE
xcis
e(G
PO)
(GPO
)(G
PO)
Ston
e,C
lay,
and
Gla
ssPr
oduc
ts,
Prim
ary
Met
alIn
dust
ries
,Fa
bric
ated
Met
al P
rodu
cts,
SIC
32SI
C33
Sf C
34
1947
63.7
69.3
60.7
60.7
56.6
63.8
48.1
48.1
64.1
58.3
69.8
69.8
1948
69.4
76.2
65.7
65.7
64.6
74.3
53.6
53.6
71.3
65.5
76.9
76.9
1949
73.1
77.5
70.3
70.3
66.3
71.7
58.9
58.9
73.2
68.3
78.2
78.2
1950
75.3
79.7
72.6
72.6
70.1
77.7
61.8
61.8
75.8
70.4
81.3
81.3
1951
80.1
85.1
76.9
76.9
76.1
84.6
66.2
66.2
84.5
77.3
92.0
92.0
1952
81.3
86.1
78.1
78.1
77.7
85.6
67.9
67.9
83.4
77.9
88.9
88.9
1953
84.3
88.5
81.5
81.5
81.2
89.2
71.2
71.2
84.8
81.3
88.3
88.3
1954
86.9
89.6
85.1
85.1
84.3
90.0
77.4
77.4
85.3
.82
.887
.887
.8
1955
89.7
91.0
88.7
88.7
90.0
97.4
80.9
80.9
89.0
86.7
91.2
91.2
1956
94.1
95.2
93.3
93.3
98.0
105.
988
.088
.094
.593
.795
.495
.419
5797
.898
.797
.197
.199
.910
3.5
95.1
95.1
98.5
98.5
98.6
98.6
1958
100.
010
0.0
100.
010
0.0
100.
010
0.0
100.
010
0.0
100.
010
0.0
100.
010
0.0
1959
101.
410
0.2
102.
310
2.3
102.
610
3.5
101.
510
1.5
100.
510
2.0
98.9
98.9
1960
102.
010
0.9
102.
910
2.9
103.
910
3.2
104.
910
4.9
101.
110
2.6
99.5
99.5
1961
101.
810
0.3
102.
910
2.9
102.
510
2.1
103.
210
3.2
101.
210
1.8
100.
510
0.5
1962
101.
610
0.7
102.
310
2.3
102.
099
.610
5.7
105.
710
1.5
101.
610
1.4
101.
419
6310
1.0
100.
410
1.5
101.
510
1.5
99.0
105.
110
5.1
102.
110
1.4
102.
710
2.7
1964
101.
210
0.2
102.
010
2.0
103.
510
1.5
106.
510
6.5
103.
310
2.4
104.
310
4.3

TA
BL
E D
-1 (
cont
inue
d)
Cos
tof
VA
Plu
sC
ost
ofV
A P
lus
Cos
tof
VA
Plu
sY
ear
VP
Mat
eria
lsV
AE
xcis
eV
PM
ater
ials
VA
Exc
ise
VP
Mat
eria
lsV
AE
xcis
e(G
PO)
(GPO
)(G
PO)
Mac
hine
ry, E
xcep
t Ele
ctri
cal,
Ele
ctri
cal M
achi
nery
,M
otor
Veh
icle
s an
d E
quip
men
t,SI
C 3
5SI
C 3
6SI
C 3
71
1947
61.0
60.5
61.3
61.3
73.5
68.9
78.0
79.6
65.4
63.3
70.3
65.8
1948
66.3
66.8
66.0
66.0
77.2
74.2
80.1
82.1
71.7
70.1
75.5
69.8
1949
69.6
68.9
70.2
70.2
77.6
72.3
83.0
84.7
77.5
73.8
88.4
80.7
1950
72.1
71.3
72.7
72.7
80.2
76.6
83.7
85.5
76.9
75.2
81.2
75.9
1951
78.9
78.5
79.2
79.2
86.7
85.3
87.9
89.4
80.6
81.0
79.9
75.6
1952
79.5
78.4
80.3
80.3
85.6
84.9
86.2
87.5
86.0
83.3
92.1
90.4
1953
81.4
81.0
81.7
81.7
87.0
86.4
87.5
88.9
85.6
84.4
88.6
87.5
1954
83.0
82.5
83.4
83.4
88.2
86.8
89.4
90.0
85.9
85.1
88.0
87.2
1955
85.5
85.7
85.4
85.4
88.5
88.9
88.2
88.5
88.9
88.1
90.8
90.0
1956
92.1
92.5
91.9
91.9
93.3
96.0
91.1
91.3
93.5
93.3
94.1
93.7
1957
98.1
98.0
98.3
98.3
98.4
99.2
97.8
97.8
97.4
97.6
96.9
96.9
1958
100.
010
0.0
100.
010
0.0
100.
010
0.0
100.
010
0.0
100.
010
0.0
100.
010
0.0
1959
101.
910
1.8
102.
010
2.0
101.
310
1.7
100.
910
0.9
102.
110
1.8
102.
710
2.6
1960
102.
810
2.7
103.
010
3.0
100.
210
2.0
98.9
98.9
100.
710
1.2
.99.
699
.719
6110
3.1
102.
110
3.9
103.
999
.110
0.2
98.2
98.1
100.
410
0.9
99.3
99.5
1962
103.
710
2.2
104.
910
4.9
96.9
99.8
94.7
94.7
101.
010
0.6
101.
810
1.5
1963
104.
110
2.6
105.
310
5.3
95.4
99.7
92.3
92.3
100.
210
0.0
100.
710
0.4
1964
105.
610
3.7
107.
110
7.1
94.2
100.
090
.290
.210
1.4
100.
510
3.1
102.
5
(con
tinue
d)

TA
BL
E D
-1 (
conc
lude
d)
'I I-
Cos
t of
VA
Cos
t of
VA
Cos
t of
VA
Mat
e-Pl
usM
ate-
Plus
Mat
e-Pl
usY
ear
VP
rial
sV
AE
xcis
e(G
PO)
VP
rial
sV
AE
xcis
e(G
PO)
VP
rial
sV
AE
xcis
e(G
PO)
Tra
ns. E
q. a
nd O
rd.,
Exc
ept M
ot.
Inst
rum
ents
and
Rel
ated
Pro
duct
s,M
isce
llane
ous
Man
ufac
turi
ngV
ehic
les,
SIC
37+
19-3
71SI
C 3
8m
d., S
IC 3
9
0\ '-4.
1947
1948
1949
61.6
66.7
69.3
60.1
66.2
69.1
62.9
67.1
69.6
62.9
67.1
69.6
69.3
73.2
74.2
74.4
80.0
79.4
66.2
69.1
71.3
66.2
69.1
71.3
84.6
86.9
86.2
80.8
86.4
83.2
87.9
87.3
88.9
87.9
87.3
88.9
1950
1951
1952
1953
1954
71.3
79.9
80.2
81.6
83.0
71.7
79.5
80.5
83.2
84.9
71.0
80.3
79.8
80.0
81.1
71.0
80.3
79.8
80.0
81.1
75.5
82.5
82.3
84.4
85.4
80.6
87.8
86.7
89.6
88.7
72.7
79.5
79.6
81.4
83.4
72.7
79.5
79.6
81.4
83.4
88 .1
94.1
92.3
93.5
94.3
86.2
98.3
94.5
94.7
94.8
89.9
90.8
90.5
92.6
93.9
89.9
90.8
90.5
92.6
93.9
1955
1956
1957
1958
1959
86.0
93.0
98.1
100.
010
1.4
88.8
94.4
98 .6
100.
010
1.1
83.2
91.7
97.6
100.
010
1.7
83.2
91.7
97.6
100.
010
1.7
87.0
92.3
97.6
100.
010
2.4
91.5
96.1
98.8
100.
010
2.3
84.6
90.2
96.9
100.
010
2.5
84.6
90.2
96.9
100.
010
2.5
94.7
98.0
99.4
100.
010
0.1
97.4
99.5
100.
010
0.0
101.
8
92.6
96.7
98.9
100.
098
.7
92.6
96.7
98.9
100.
098
.7
1960
1961
1962
1963
1964
102.
510
2.7
103.
010
3.1
104.
9
102.
110
2.0
101.
910
1.3
102.
5
102.
910
3.4
103.
910
4.7
106.
9
102.
910
3.4
103.
910
4.7
106.
9
104.
010
5.2
106.
610
6.2
106.
9
103.
210
2.8
103.
510
3.1
103.
5
104.
510
6.6
108.
410
8.0
108.
8
104.
510
6.6
108.
410
8.0
108.
8
101.
010
1.5
101.
710
2.0
102.
5
101.
899
.710
0.6
100.
610
1.8
100.
410
3.1
102.
710
3.2
103.
2
100.
410
3.1
102.
710
3.2
103.
2
Not
e: V
A =
valu
ead
ded;
VP
=va
lue
of p
rodu
ctio
n. F
or o
ther
abb
revi
atio
ns s
ee n
ote
at th
e be
ginn
ing
ofA
ppen
dix
D.
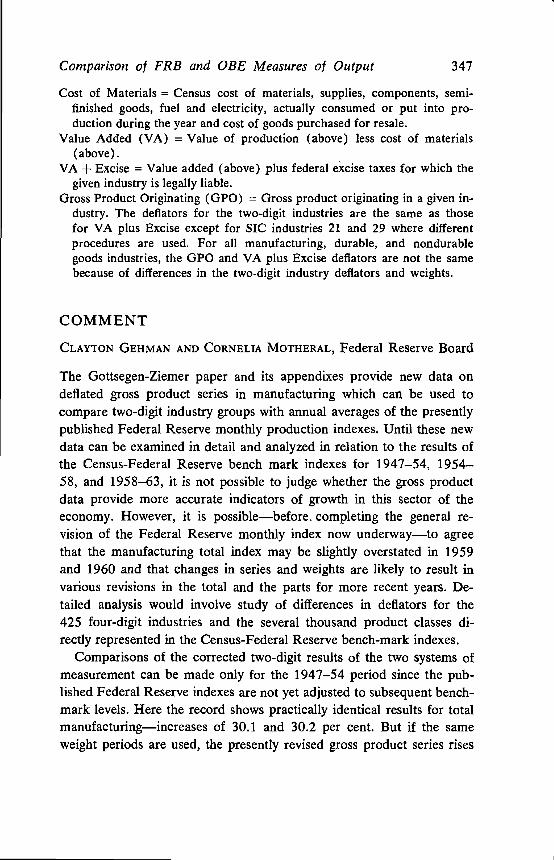
Comparison of FRB and OBE Measures of Output 347
Cost of Materials = Census cost of materials, supplies, components, semi-finished goods, fuel and electricity, actually consumed or put into pro-duction during the year and cost of goods purchased for resale.
Value Added (VA) = Value of production (above) less cost of materials(above).
VA + Excise = Value added (above) plus federal excise taxes for which thegiven industry is legally liable.
Gross Product Originating (GPO) = Gross product originating in a given in-dustry. The deflators for the two-digit industries are the same as thosefor VA plus Excise except for SIC industries 21 and 29 where differentprocedures are used. For all manufacturing, durable, and nondurablegoods industries, the GPO and VA plus Excise deflators are not the samebecause of differences in the two-digit industry deflators and weights.
COMMENT
CLAYTON GEHMAN AND CORNELIA MOTHERAL, Federal Reserve Board
The Gottsegen-Ziemer paper and its appendixes provide new data ondeflated gross product series in manufacturing which can be used tocompare two-digit industry groups with annual averages of the presentlypublished Federal Reserve monthly production indexes. Until these newdata can be examined in detail and analyzed in relation to the results ofthe Census-Federal Reserve bench mark indexes for 1947—54, 1954—58, and 1958—63, it is not possible to judge whether the gross productdata provide more accurate indicators of growth in this sector of theeconomy. However, it is possible—before. completing the general re-vision of the Federal Reserve monthly index now underway—to agreethat the manufacturing total index may be slightly overstated in 1959and 1960 and that changes in series and weights are likely to result invarious revisions in the total and the parts for more recent years. De-tailed analysis would involve study of differences in deflators for the425 four-digit industries and the several thousand product classes di-rectly represented in the Census-Federal Reserve bench-mark indexes.
Comparisons of the corrected two-digit results of the two systems ofmeasurement can be made only for the 1947—54 period since the pub-lished Federal Reserve indexes are not yet adjusted to subsequent bench-mark levels. Here the record shows practically identical results for totalmanufacturing—increases of 30.1 and 30.2 per cent. But if the sameweight periods are used, the presently revised gross product series rises
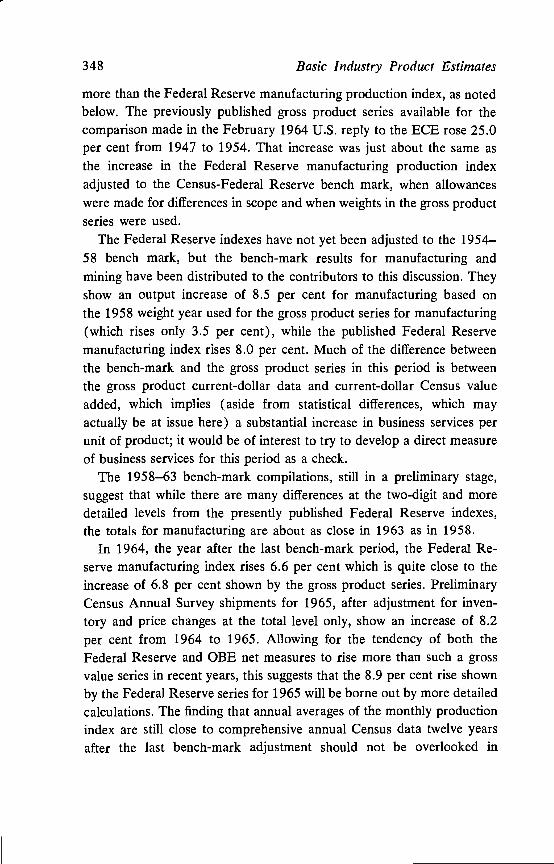
348 Basic Industry Product Estimates
more than the Federal Reserve manufacturing production index, as notedbelow. The previously published gross product series available for thecomparison made in the February 1964 U.S. reply to the ECE rose 25.0per cent from 1947 to 1954. That increase was just about the same asthe increase in the Federal Reserve manufacturing production indexadjusted to the Census-Federal Reserve bench mark, when allowanceswere made for differences in scope and when weights in the gross productseries were used.
The Federal Reserve indexes have not yet been adjusted to the 1954—58 bench mark, but the bench-mark results for manufacturing andmining have been distributed to the contributors to this discussion. Theyshow an output increase of 8.5 per cent for manufacturing based onthe 1958 weight year used for the gross product series for manufacturing(which rises only 3.5 per cent), while the published Federal Reservemanufacturing index rises 8.0 per cent. Much of the difference betweenthe bench-mark and the gross product series in this period is betweenthe gross product current-dollar data and current-dollar Census valueadded, which implies (aside from statistical differences, which mayactually be at issue here) a substantial increase in business services perunit of product; it would be of interest to try to develop a direct measureof business services for this period as a check.
The 1958—63 bench-mark compilations, still in a preliminary stage,suggest that while there are many differences at the two-digit and moredetailed levels from the presently published Federal Reserve indexes,the totals for manufacturing are about as close in 1963 as in 1958.
In 1964, the year after the last bench-mark period, the Federal Re-serve manufacturing index rises 6.6 per cent which is quite close to theincrease of 6.8 per cent shown by the gross product series. PreliminaryCensus Annual Survey shipments for 1965, after adjustment for inven-tory and price changes at the total level only, show an increase of 8.2per cent from 1964 to 1965. Allowing for the tendency of both theFederal Reserve and OBE net measures to rise more than such a grossvalue series in recent years, this suggests that the 8.9 per cent rise shownby the Federal Reserve series for 1965 will be borne out by more detailedcalculations. The finding that annual averages of the monthly productionindex are still close to comprehensive annual Census data twelve yearsafter the last bench-mark adjustment should not be overlooked in

Comparison of FRB and OBE Measures of Output 349
appraising the adequacy of the Federal Reserve monthly productionindex results.
We see little basis for the indication in the Gottsegen-Ziemer papeiand the Moss commentary of any persistent divergence in the two setsof numbers and the emphasis that "an essential difference" is the largergrowth rate of the presently published Federal Reserve series than ofthe revised gross product series. Over the seventeen-year interval ofchanges shown, a major portion of the divergence for the total comeswithin several annual periods which might be largely isolated by a moredetailed comparison of gross product data with the bench-mark results.The Federal Reserve index is higher at the end of the seventeen-yearinterval and the differences are even greater at the extremes reached in1951 and 1961, but the evidence of persistent differences is not clearfrom the presently available data. We do hold the view that a net industrymeasure would probably rise more in certain periods than the presentlypublished Federal Reserve index (see the comparisons for total industrialproduction presented in a paper on "Estimating Aggregate Output" inthe 1964 Proceedings of the American Statistical Association).
The accompanying table shows that for the bench-mark interval from1947 to 1954, the gross product series rises 2 per cent more than theFederal Reserve series, as reweighted by the OBE. Although the widestmargin was 3 per cent in 1951, it was still plus 0.5 in 1955. After down-ward shifts in the 1954—58 bench-mark period and from 1958 to 1960,the gross product series again rises more than the Federal Reserve seriesto 1964.
Gross Product Series Relative to theManufacturing Production Index, 1947 = 100
1947 100.0 1956 98.61948 101.3 1957 98.71949 102.1 1958 98.51950 101.3 1959 96.91951 103.0 1960 95.61952 102.6 1961 95.11953 101.4 1962 96.91954 102.0 1963 96.51955 100.5 1964 96.6
NOTE: Calculated from reweighted Federal Reserve indexes shown in the paperin this volume, "Comparison of Federal Reserve and OBE Measures of Real Man-ufacturing Output, 1947—64."

350 Basic Industry Product Estimates
As the Gottsegen-Ziemer paper and Moss's comments indicate, differ-ences in results shown stem not only from changes in input—outputrelationships but also from differences in the measurement of gross out-put. We expect that a more detailed examination of the gross productand bench-mark industry gross output defiators could lead to moresimilarity of results between the two approaches.
The Gottsegen-Ziemer paper apparently finds little evidence of anover-all bias in the man-hour portion of the index in the unbench-marked interval since 1954. Moss uses the two-digit furniture group,which accounts for 1.8 per cent of total manufacturing, as an illustra-tion of the hazards of projecting adjusted man-hour data. His compari-son was only for the change from 1958 to 1964 and it was not notedthat the increase for the presently published furniture index from 1954to 1958 was about the same as the Census-Federal Reserve benchmark (that was 11 per cent, while the gross product series increasedonly 2 per cent) and that the published annual changes since 1959—60are close to deflated Census value results. The Federal Reservepublished furniture group is doubtless too high for the 1959—60 period.The gross product series for furniture shows an irregular downtrendover this period. By 1962 it is only 2 per cent higher than seven yearsearlier and thus implies little change in labor productivity for most ofthe period, which seems unlikely. Moss correctly notes the problems ofmeasuring price changes for these products but another basic questionis whether an adequate monthly sample of the value of factory sales orshipments of furniture can be maintained—various attempts to do so inthe past have not been successful.
As was stated in our paper, it is planned to exclude estimated pur-chases of business services from the value-added weights in the forth-coming revision of the Federal Reserve monthly index and to use 1958price relationships for recent periods. We do not think it would beappropriate to take the other three steps which would be necessary tomake the weights of the two series completely comparable: (1) using1958 price relationships for earlier periods; (2) adding excise taxes toweights which are intended to approximate factor costs; and (3) shiftingfrom the Census weighting universe to the gross product weighting uni-verse.
We have reservations about series whose year-to-year movements areaffected by various company-establishment and inventory valuation ad-

Comparison of FRB and OBE Measures of Output 351
justments. Admittedly the annual movements of Census value of outputdata may also be affected by inventory valuation and sampling andcoverage problems; in these cases we prefer to rely as much as possibleon appropriate quantity indicators for annual indexes which are used toadjust the levels of the monthly indexes.
Assuming that there were no differences in weights or in deflation ofgross output, the question has been raised whether it would be desirableto adjust the Federal Reserve monthly series to reflect changes in input—output relationships that have apparently occurred in some industriessuch as primary metals, autos, petroleum refining, and (to go outsidemanufacturing) electric utilities. Some adjustments might be accom-plished by increased use of value added weights below the industry level.If an increase in output per unit of input in the auto industry is due tomore fabrication of components within the industry, such an increasecould be imputed to the original equipment auto parts series. Changesdue to more efficient use of materials (as in electric utilities) or to use ofmore highly processed materials (as in primary metals) could be allowedfor by adjusting an industry group total index rather than the componentproduct series, so that the components could still be aggregated withgross weights for analyzing commodity flows in the over-all economy,as outlined in our paper.
We would like to underscore, however, the comments made in theGottsegen-Ziemer paper on the sensitivity to error of double deflationmeasures and to note that they did not accept the resulting calculationsfor the petroleum refining industry, although in that industry input andprice data can be more exactly determined than in other larger andmore heterogeneous industry groups. For a further example, in thecourse of our bench-mark work two experimental double deflations weremade of the auto industry for 1954—58, one using wholesale price indexcomponents and another using unit values derived from quantity indexes.The difference between the input deflators was negligible; the differencebetween the output deflators was 4 per cent, or 1 per cent per year, andthe resulting difference between the residual net output indexes was 14 percent, nearly 3.5 per cent per year.
We chose in our paper to develop the analytical value of using themonthly production measures as links to final demand and prices and toraise some questions concerning the data currently available for analyzingoutput and inventory changes in the goods sector of the economy. The
352 Basic Industry Product Estimates
OBE elected to contribute additional statistical comparisons and pointsof possible reconciliation of the two sets of series for the manufacturingsector. Without the new, more detailed gross product data which becameavailable at this Conference, it was not possible for us to go muchbeyond the analysis for manufacturing which we presented two yearsago in the reply to the ECE. That analysis compared the Federal Re-serve indexes with the then published gross product series of the BLSas well as the OBE; also, the net versus gross comparisons were presentedin an ASA paper cited above.
More direct comparisons are now possible within the Census frame-work; we plan to be working further on such comparisons, particularlywith regard to gross output deflators. We hope that the efforts of othersat OBE and Census will include consideration of such matters as com-parison of Census current-dollar values with gross product data anddirect measurement of at least the current-dollar value of businessservices.
CORNELIA MOTHERAL
The following comments represent scattered further observations onthe Gottsegen-Ziemer paper.
Mr. Gottsegen has indicated that some differences between the OBEmeasures, on the one hand, and OBE's deflated Census value-addedmeasures and the Federal Reserve measures, on the other, stem fromthe inventory valuation adjustment to the former, particularly in year-to-year movements for 1950—51. With Census data it is only necessary toadjust for changes in valuation of finished and in-process inventoriesand sometimes not even those, since in many industries where changesin such inventories are important, value of production or value of workdone rather than value of shipments is reported to the Census. Theindustries in which the differences stemming from IVA occur, accordingto Gottsegen, are tobacco, textiles, furniture, chemicals, rubber, andleather. Many of the Federal Reserve monthly series in these groups,and more of the annual series, are based on quantity of production data,so that no adjustment for inventory change is necessary, with or with-out IVA. Some of the monthly and somewhat more of the annual datause shipments as a proxy for production; these will be in error by the

Comparison of FRB and OBE Measures of Output 353
amount of real inventory change, not by the amount of IVA. I haveinspected two of the series where man-hours—a production proxy notneeding inventory adjustment of any kind—are used monthly, and theannual indexes are based on deflated value of shipments. It does notseem likely that adjustment for inventory change, with or without IVA,would change the direction of the plastics products component of therubber and plastics products index for the 1950—51 period. The otherrubber series are based on quantities of production or rubber consump-tion. I conclude that the IVA is more likely to be at fault than the pro-duction indexes in this area. Another area where deflated value of ship-ments is used annually is furniture. Here I inspected the 1953—54 differ-ence, where the Federal Reserve series goes up while the OBE seriesgoes down. Adjustment for inventory change, with or without IVA,would have little effect on the movement of the Federal Reserve series;however, the Federal Reserve household furniture series is based onwherever-made product shipments—industry shipments decline from1953 to 1954, and should have been used.
Doing the IVA in three- and four-digit detail is often more work thanit's worth. We have done it in the 1947—54 and 1954—58 bench marks,and of course it is necessary and makes a difference in certain years suchas 1947 and 1950. For 1954 and 1958 it was hardly worth the effort.We are now setting up a system in which our annual indexes will bebased on deflated Census data to a greater extent, and the possibilitythat we will have to apply an IVA for some years and some industrieswill have to be borne in mind.
In our attempt to monitor current index levels, it would be a help ifBLS published monthly wholesale price indexes classified to correspondto the industry groupings used in the Census Bureau's monthly manu-facturers' shipments survey. Such indexes would be useful for deflatingshipments and finished and in-process inventories.
Gottsegen ascribes the differences between the OBE and FederalReserve series for Group 30, rubber and plastics products, to the Fed-eral Reserve use of unrepresentative quantity or man-hour indicators.But the greatest trend divergence for this industry occurs in the 1947—57period when the Federal Reserve series are adjusted to bench-mark andannual levels; in the period for 1957 to date when we are dependent ontire quantity series and man-hours with estimated productivity adjust-

354 Basic Industry Product Estimates
ments, the trends are not dissimilar. I think that the difference in theearlier period is caused partly by our use of 1947 weights through 1952,not only in combining the series but also internally in the detailed bench-mark indexes to which the series are adjusted; and partly by ourbench-mark and annual measures for plastics products, which representa Census value deflated with a deflator derived from Tariff Commissionquantity and value data for plastics materials. We realize that it is oftennot appropriate to deflate a product value with a materials deflator, butwe believe that the Tariff data provided better coverage of this fieldthan available wholesale price index components, and think that in thisarea we were probably more nearly correct than the OBE measure.
The differences that arise from weighting are associated more withchoice of weight year than with choice of weight concept. The basicquestion involved is whether it is really appropriate to measure the out-put of the late 1940's and early 1950's with the price relationships of1958.
We are surprised at many of the differences shown because as Spencerindicated, the Federal Reserve manufacturing index is very close to the1954—58 bench mark and a preliminary 1958—63 bench mark; it is alsovery close in 1962 and 1964, relative to 1963, to Annual Survey datadeflated in some detail with BLS wholesale price indexes, and in 1965to deflated totals from the very recently available 1965 Annual Survey.
We recognize that legitimate and plausible differences can arise be-cause of changes in materials input per unit of output, as in primarymetals. In primary metals these changes arise from use of more highlyprocessed ores, yet this increase is not reflected in the OBE miningmeasures iince they use the Federal Reserve mining series based onusable ore, which are considerably understated as measures of mininggross product.
We are also surprised, however, to see that the two "gross" measuresfor primary metals—Federal Reserve indexes gross weighted versusdeflated Census gross output—show such differences for the 1958—64period. Primary metals has usually been our best index, requiring littlebench-mark revision. If both of the two gross measures are correct—that is, if we are measuring the quantities correctly and the deflatorsapplied to the Census data measure the prices correctly—they seem tome to imply a decline in quality of primary metals. Or, if we assume

Comparison of FRB and OBE Measures of Output 355
that such difficult aspects of quality as strength and durability are equallybadly measured by the production and price indexes, then the differencebetween the two measures suggest that in this period there was a move-ment toward the cheaper grades within the types of metal and metalproduct measured by the Federal Reserve indexes for primary metals.The only other possibility I can think of is some peculiarity in the detailedproduct weights, which in the steel industry are open to question.
On the other hand, as Spencer has, suggested from study of Censusunit value and BLS price indications at the five-digit product class level,there may be an upward bias in the BLS price indexes for these products.Of course, to the extent that these products become inputs to othermanufacturing industries, the errors will cancel at the total manufacturinglevel, although the gross product series for primary metals would beunderstated, and those for metal fabricating would be overstated.
VIVIAN E. SPENCER, Bureau of the Census
The first comment on this extremely valuable paper, which maintainsthe high quality of work to be expected from these authors, must be onits excellence.
The second comment must be on the really striking similarity, con-sidering the differences in methods and concepts used in their construc-tion, of the FRB and OBE series as presented in the paper. In thedeflated Census value-added series plotted on the charts attached to thispaper, the latter. series usually fall between the OBE and FRB series—but closer to the OBE figures. In one sense, the differences between theseseries furnish a measure of their reliability. Where the differences aresignificant, one would like to analyze them as indicators of the effect ofdifferences in the basic concepts and methods. Some such discussion isincluded in the paper. However, time has not permitted me to expandupon them.
One desirable study would be comparing the behavior of the 1954-.58 and 1958—63 relationships with that of the new Census bench-markindexes based on data for the approximately 7,000 commodities onwhich information is collected in the Census of Manufactures. Theseindexes use value-added weights at the five-digit commodity level andare also available with employment, man-hour, current-capital-input,and value of shipment weights, and at the four-digit level with energy-

356 Basic Industry Product Estimates
input weights. Such a study could not as yet be made: Although thewherever-made commodity indexes for most areas were published inthe final 1963 publications of the censuses of Manufactures and MineralIndustries, and the 1954—58 industry indexes have had limited distri-bution, nevertheless, work on the 1958—63 industry indexes is not yetentirely complete.
In the course of the index work, one bit of analysis which we didmay have some bearing on the relations between series in this paper.In the total series and many of the two-digit group comparisons, it isnotable that the FRB series rises throughout most of the period morerapidly than the OBE series. The 1947—54 Census bench-mark indexwas found to be five points higher than the FRB. It appears that thefinal Census bench marks for 1954—58 and 1958—63 will also beslightly higher than the FRB, but in each case only by one or two points.
The OBE series depends entirely for deflation on the especiallyconstructed BLS price indexes. The FRB depends to a much lesserextent on BLS price series. Although the final Census indexes in-corporate many BLS price series for areas where inadequate or noquantity data are available, they do so to a still lesser extent. In ourworking analysis of the relation between BLS indexes and the rawCensus four-digit implied unit value indexes constructed with maximiumuse of Census quantity and value data, scatter diagrams were constructedcomparing the two-price measures. A tendency was noted for the BLSindexes to show higher increases in price than the Census series. Thisseemed particularly clear in both periods for areas like Major Groups2.8—chemicals and 33—primary metals where this pattern of morerapid increase of FRB than OBE is notable. If the BLS price indexesdo tend to overstate price increases, this might be a significant factorin the lower rate of increase in the OBE series than in the FRB series,and again would contribute to the FRB index falling somewhat belowthe Census bench marks.
The divergence of the FRB and OBE series for Group 29 in 1964and certain other years, and the even greater divergence when theyare compared with the deflated value-added series, point to the needfor a further restudy of the special methods used for construction ofthese series and of alternative methods possible. There are, of course,significant problems in arriving at good petroleum refining measures.

/Comparison of FRB and OBE Measures of Output 357
MILTON Moss, Bureau of the Budget
It is probably fair to say that the figures in the national accounts whichare used most intensively here and abroad are those in constant prices.The past decade has witnessed a considerable advance in the measure-ment and publication of estimates in constant prices in the UnitedStates, partly reflecting the strong interest in the analysis of economicgrowth.
Such advances include the following: (1) United States gross nationalproduct by major type of purchaser which, formerly available only an-nually, was put on a quarterly basis early in the decade; (2) GNP bymajor type of product for durable and nondurable goods, services, andstructures, with a breakdown for goods as between final sales and changein business inventories on a quarterly basis; (3) industrial productionindexes, published more promptly and in greater detail than beforeand developed along market categories to provide comparisons withfinal sales and between materials and finished products; (4) real grossproduct originating by industry on an annual basis, building on earlierestimates by Alterman and Jacobs, and which opens the door toanalysis of productivity change in industry detail within a consistentaccounting framework; (5) coincident with the preceding, the re-grouping and reweighting of prices along industry lines to provide theframework for developing industry or so-called sector price indexes;(6) integration of the input—output table with the income and productaccounts, making .)possible a consistent accounting of changes in theindustrial distribution of final demand.
Partly in consequence of this work, we are faced with an embarass-ment of riches exposing various differences in the existing bodies ofinformation.
The period ahead, with its continued pressure to increase thetimeliness and detail of data in constant prices, will necessarily involvedecisions about the extent to which differences between measures suchas the Index of Industrial Production and GNP by industry can beadequately resolved.
NOTE: I should like to take this occasion to acknowledge my association withGary G. Schiarbaum, who worked with me as a summer intern at the BudgetBureau in 1966 and who made intensive study of problems involved in reconcilingthe Index of Industrial Production with real gross product by industry.
358 Basic Industry Product Estimates
What have the papers in this section contributed to our understandingof differences and what have they contributed to resolving them?
It is clear from both Gottsegen-Ziemer and Gehman-Motheralpapers that there are significant differences between the movementsof the Index of Industrial Production and of the gross product figures—over the long term, from year to year, and for quarterly changes—whether industry or commodity comparisons are made. In a broadsense, of course, the two measures show similar results and the errormargins implied by the differences in movement would not trouble manyother countries where the data base is far poorer than ours.
But, for the uses to which the data are put, the fact that the FRBmeasure for manufactures rises 4.2 per cent per year and OBE'scorresponding measure rises 3.8 per cent over the whole postwar period,and the fact that for durable manufactures one rose (FRB) and theother fell (OBE) from 1955—56 pose serious questions for analysisof growth and fluctuations.
The Gottsegen-Ziemer paper, which I have been asked to discuss,should be highly commended for making available a wealth of materialfor indicating some of the possible factors making for differencesbetween the two measures. Much work will need to be done, however,to resolve the difficulties, and I hope this conference will provide thepush necessary to get this work done.
I would like to illustrate (Table 1) what the difficulties are andwhat we might conclude about the directions ahead. My remarkswill be similar in many respects to those of Jack Gottsegen, but myemphasis will be different and I would like to suggest some remedies.The figures in the table are adapted from appendix material mostlysupplied with the Gottsegen-Ziemer paper and which shows indexesfor manufacturing for the year 1964 with the year 1958 = 100.
Analyzing the difference between the Federal Reserve and OBEmeasures based only on the span of two years, which I have donein the table, has severe limitations, particularly since the size andnature of the differences between the indexes will depend on theparticular pair of years chosen. Moreover, the fact that 1958 was arecession year and 1964 a prosperous one tends to exaggerate differencesfor a number of groups—although at the total level the differencebetween the two series is very small. Also, at this level of aggregation,the operation of the various influences cannot be separated. For example,

TA
BL
E 1
Inde
xes
of M
arw
fact
urin
g A
ctiv
ity: 1
964
(in
cons
tant
pri
ces,
195
810
0)
Fede
ral R
eser
veC
ensu
s —
OB
EO
BE
Val
ue-A
dded
Gro
ssG
ross
Val
ueV
alue
-Add
edPr
oduc
tW
eigh
tsW
eigh
tsO
utpu
tIn
put
Add
edPl
us E
xcis
e O
rigi
natin
gM
anuf
actu
ring
Ind
ustr
y(1
)(2
)(3
)(4
)(5
)(6
)(7
)
Tot
al14
2.8
141.
813
6.6
134.
014
0.1
139.
614
0.4
Non
dura
bles
137.
013
4.2
130.
912
8.2
135.
113
3.6
132.
0D
urab
les
147.
814
9.9
142.
414
0.8
144.
114
4.9
146.
9
Food
121.
712
1.6
121.
312
3.1
116.
911
7.3
117.
1T
obac
co12
0.4
115.
211
6.3
116.
311
6.3
115.
011
9.0
Tex
tiles
130.
313
0.1
142.
713
2.6
132.
613
0.1
App
arel
140.
714
3.1
129.
412
8.3
130.
813
0.8
128.
1L
umbe
r11
7.8
120.
512
6.1
123.
113
0.1
130.
112
8.9
Furn
iture
154.
715
5.6
128.
613
4.1
123.
112
3.1
128.
7Pa
per
137.
213
8.9
135.
413
1.9
139.
913
9.9
140.
0Pr
intin
g12
7.7
124.
212
8.0
121.
912
1.9
125.
7C
hem
ical
s16
6.6
167.
315
5.3
149.
016
0.8
160.
815
2.0
Petr
oleu
m12
4.2
122.
912
6.4
116.
617
4.7
152.
514
4.3
Rub
ber
169.
517
4.0
159.
815
4.3
165.
416
2.8
163.
4L
eath
er10
6.9
106.
910
2.7
105.
910
5.9
108.
9St
one,
cla
y, a
nd g
lass
135.
213
6.3
132.
113
2.2
132.
113
2.1
131.
2Pr
imar
y m
etal
s14
7.5
148.
714
0.2
144.
913
3.7
133.
713
0.2
Fabr
icat
ed m
etal
s14
2.8
140.
712
6.5
126.
212
6.8
126.
813
5.2
Non
elec
tric
al m
achi
nery
161.
715
9.3
145.
414
5.6
145.
214
5.2
153.
3E
lect
rica
l mac
hine
ry15
6.2
155.
916
6.7
150.
617
9.9
179.
116
7.3
Mot
or v
ehic
les
181.
118
6.1
179.
417
3.3
192.
619
2.6
213.
0T
rans
port
atio
n eq
uipm
ent,
ordn
ance
,ex
cept
mot
or v
ehic
les
122.
212
5.5
108.
610
1.7
115.
211
5.2
123.
8In
stru
men
ts14
8.1
153.
415
9.5
149.
516
5.5
165.
513
9.6
Mis
cella
neou
s m
anuf
actu
ring
141.
914
2.8
134.
313
3.4
135.
113
5.1
119.
3
Sour
ce: D
ata
are
base
d on
fig
ures
fro
m p
aper
by
J. J
. Got
tseg
en a
nd R
. C. Z
iem
er, e
xcep
t for
col
umn
2 w
hich
is b
ased
on
unpu
blis
hed
Fede
ral R
eser
ve B
oard
dat
a.

360 Basic Industry Product Estimates
differences between aggregate input and output indexes could resultfrom differences in output movements of individual industries withdifferent ratios of input to output, even though input—output relationsin individual industries might not have changed—the familiar productmix problem. Still another problem—a perennial one—is that 1964is not a bench-mark year and we are dealing with preliminary figuresin both systems. Whatever the difficulties, however, the table doesprovide a convenient framework for illustrating the main factorsaccounting for differences between the measures
At the risk of being too obvious, let me quickly describe the figuresin each column. The first column of figures represents the FederalReserve indexes as published, but on a 1958 rather than 1957—59base. These indexes are based on series that are gross of material inputsbut combined with value-added weights. The second column representsthe same series combined with gross value weights. Aside from somegenerally minor problems of aggregation, columns 1 and 2 differ merelybecause of differences between value-added and gross value weights.The underlying series are identical.
Column 3 represents deflated gross value of output of individualindustries combined with gross value weights using Census data. Atthe individual industry level these indexes should be identical in theorywith indexes in columns 1 and 2, except in those few cases whereFRB has developed value-added weights for individual products. Theydiffer from column 1 at aggregate levels because of the use of grossvalue weights, but they should be identical with those in column 2at the levels of aggregation shown. That they do in fact differ andthat they ought to conform will be emphasized at later points in mydiscussion.
Columns 4 and 5 are also based on Census data giving indexes ofconstant-dollar input and value added. These figures, including column3, are based on values from the Census of Manufactures and theAnnual Survey of Manufactures deflated by OBE with BLS wholesaleprice series. While the data do not necessarily represent bench marks,they provide, by and large, a consistent set of information for analyzingchanges in the movement of material inputs and outputs in constantprices as measured by OBE and hence provide one basis for inferringwhether differences between the FRB and OBE measures reflectdifferences between gross output and value added.

Comparison of FRB and OBE Measures of Output 361
The last two columns, shown here as OBE data, represent incolumn 6 indexes of value added in constant prices but inclusive ofexcise taxes, and the last column, gross product originating in constantprices. These two columns show different results only because theyuse different current-dollar figures for measuring value added. Thedeflators are the same. The first and last columns provide us with thecomparison between the two measures under consideration in thissession. The columns in between help interpret those differences.
For total manufacturing, we note that in the change from 1958 to1964 the FRB index rises 42.8 per cent (col. 1) and O]3E 40.4per cent (col. 7)—a rather similar increase. It is instructive to try tointerpret even this small difference, using the indexes in the othercolumns to seek clues. Is the difference shown a result of the factthat the FRB index is gross, i.e., does not allow for differencesbetween gross output of products and input of materials while theOBE measure is net in this respect? The table suggests otherwise.Comparison of columns 3 and 4 shows that gross output rose relativeto input, and therefore value added has risen relative to gross output.
It the Federal Reserve index were regarded as simply a gross outputindex, on that account it should have risen less than OBE but in factit has risen more. So whatever differences exist between the twomeasures at the total level it has apparently not arisen as a result ofdifferences between input and output. However, when we look at someof the underlying two-digit groups shown in the table, a fuller apprecia-tion of the role played by the various factors is more clearly revealed.
In the food group, for example, the lower OBE index (117.1)compared with the Federal Reserve (121.7) appears to result froma difference between value added and gross output as indicated incolumns 4 and 5. The deflated Census data indicate that input hasincreased faster than output and consequently value added has increasedless than gross output. This would seem to explain, at least statistically,why product originating showed an increase of only 17 per cent whilethe Federal Reserve showed an increase of 22 per cent, or closer tothe gross output figure in column 3. To determine whether this is theunderlying reason in fact, however, would require more detail. Thatis, additional detail would be needed to determine, for example, whetherthe difference arose because the FRB index included in its food indexthe increase in packaging materials; or in other words, was or was notduplicating some of the output of the paper industry.

362 Basic Industry Product Estimates
It is instructive to compare columns 2 and 3. Since the figures inthe two columns are broadly similar as to weights, and assuming theydeal with the same value data, the differences result from the fact thatquantity-type data are used in one case (FRB) and BLS price datafor deflation are used in the other. Conceptually the figures in thesetwo columns should be identical, as I indicated earlier; that is, withideal quantity and price data the use of quantity indexes with base-period price weights should provide the same results as indexes basedon deflation of value data with detailed price indexes with current-yearquantity weights. In fact, the results are quite different. Differences aresizeable in some groups and go in different directions. At bench-markintervals when both measures rely heavily on identical Census valuedata such differences ought to be fully explained. Is it because detailedquantity data are inferior or superior to price data or is it because FRBand Census are in fact "deflating" different value aggregates becauseof classification or other reasons?
The indexes in columns 6 and 7 use identical deflators but differentcurrent-dollar data. Here, too, differences in a number of groups arequite sizeable and in my conclusion later I wish to emphasize the needto reconcile these figures.
I should like now to illustrate two problems which are thorns ofcriticism in the series under review. I refer to the problem of relianceon man-hours in the FRB measure and the difficulty with doubledeflation in the OBE measure.
First, the man-hour problem. I can illustrate this with the indexshown in the table for the furniture industry. Note that this index at154.7 (col. 1) compares with an OBE measure of 128.7.
Monthly changes in the FRB index for the furniture industry areequal to percentage changes in man-hours for this industry multipliedby assumed changes in output per man-hour. These monthly changesare interpolated between and extrapolated beyond bench marks, atwhich time levels of output and of output per man-hour are calculatedusing Census production and BLS employment. Generally value datadeflated by wholesale price indexes rather than quantity-type data areused to estimate output for this industry because a sample of pricedata for major items is more readily available than is a detailed listingfor the great heterogeneity of physical quantities of furniture.
Assuming that selected price data are broadly representative of price

Comparison of FRB and OBE Measures of Output 363
changes for all furniture items and that they allow for quality change(heroic assumptions of course), the deflated value data constitute abasic approach to measurement of physical volume for this type ofindustry. But the published index has not been adjusted regularly toCensus bench marks or Annual Survey of Manufactures data for sometime. It may well be that a detailed study of this industry will exposeweaknesses in the price data for deflating the Census value data, inwhich case price data should be improved. But I see no betteralternative for such an industry.
The problem then for resolving difficulties of the type exemplifiedby the furniture industry is for the FRB to have more frequent benchmarks using the Census Annual Survey of Manufactures. A sizeablefraction of the total Index of Industrial Production (approximatelyhalf) requires the bench-mark study of adjusted man-hour series. Whilethese series are monitored by FRB in the aggregate by comparisonswith product-type indexes and other data such as electric power andfreight transport, their detailed adjustment at approximately annualintervals is highly desirable.
I know how difficult it is to carry out bench-mark studies frequently—it is one of the most thankless and exacting jobs. But it must bedone and whatever can be done to make this task less slavish, moreexpeditious, and even more interesting, if possible, should be done.
To illustrate the problem with double deflation in the OBE measure,attention is now directed to the indexes in the table for petroleumrefining. The table shows, for example, that gross output of petroleumrose 26.4 per cent (col. 3) and input rose 16.6 per cent (col. 4).Value added, as a consequence, rose 75 per cent (col. 5). Thisenormous difference between value added and gross output raisesserious questions. The level of input is large relative to output in thisindustry and small errors in both can be magnified in the value-addedresidual, as is well known. But as a matter of fact, have refined products,for example, increased relative to inputs or is this a result of theoddities of double deflation? I ask this question because this happensto be an industry with especially good physical volume information onoutputs, as Gottsegen and Ziemer recognize. But we also know a greatdeal about inputs of crude oil, electric power, additives, fuel, etc.,which they do not recognize as well.
Gottsegen and Ziemer have apparently done a good deal of work

364 Basic Industry Product Estimates
on this industry, which at first I had not fully appreciated. But theirony of this example consists in this simple fact—despite an unusuallyrich amount of information of both inputs and outputs, double deflationprocedures have been found seriously wanting. I suspect that refinedproducts have not risen relative to crude oil, fuels, electric power,additives, etc., by the differences suggested in columns 3, 4, and 5.The index finally accepted by OBE (144.3 in column 7) is still con-siderably higher than the gross output measure, 126.4 in column 3 andthan the FRB measure, 124.2 in column 1.
What Do We Do?
The following recommendations spell out in slightly more detail whathas been already said on eliminating unnecessary differences betweenthe FRB and OBE figures.
1. The figures in column 2 and column 3 should be made as identicalas possible at bench-mark intervals. The figures in these two columnstheoretically are deflating the same value base in the individual in-dustries. As mentioned earlier, they differ only because quantity-typeinformation with base-year price weights are used in the FederalReserve, and BLS price data with quantity weights are used by OBE.
2. The basic data from which columns 6 and 7 are derived shouldbe made as identical as possible. Differences arise because the current-dollar data on value added come from different sources, one fromCensus, and the other from IRS and other sources. The Census datainclude business services, while the OBE data require difficult problemsof allocation of company-based data to an establishment order. In orderthat the figures in columns 6 and 7 be made as identical as possible,two things need to be done; one involves a strengthening of theEnterprise Statistics Program at Census to improve our links betweencompany and establishment data and classifications, the other is thatCensus value-added data should be made less duplicative to excludepurchased business services.
3. The detail in GPO by industry should be made available foranalysis. Not only should two-digit and lower orders of aggregationbe made available on net output but the data for analyzing thesignificance of the net output measures, namely, relations between grossoutput and input, should also be made available. In other words, at

Comparison of FRB and OBE Measures of Output 365
least at bench-mark intervals, the figures on gross output, input, andnet output, in current dollars, constant dollars, and implied deflatorsshould be made available—if not for publication, for special analysis.These data were made available to this conference and I hope thispractice will continue.
4. The price indexes need to be strengthened, both in those areaswhere these indexes are apparently less accurate than quantity-typeinformation, but more importantly in those areas where they arepresently woefully incomplete. The latter include particularly the areaof producers durable equipment. Where the price data are clearly moreaccurate than quantity-type information they should be used in theFRB index. At bench-mark intervals these judgments can be made.
5. A problem remains if we put all emphasis on net output measures.For one thing, information for commodities tends to disappear in theframework of GNP originating so long as indexes are shown only fornet output. It is true that on a bench-mark basis we can show indexesof dollar values for outputs, inputs, and net outputs. Such detail wouldbe extremely useful as indicated above. But quarterly or monthly dataon this detailed basis is not likely to be developed for a long, long time.
The detailed commodity flows that can be shown monthly formaterials and finished products in the Index of Industrial Production,from producing through distributing channels, should be encouraged.
As pointed out in the Gehman-Motheral paper, these detailedcommodity flows can help in understanding the bases for inventoryand price change and can provide the basis for a more detailed under-standing of short-run fluctuations.
One possibility is to have value-added type measures at bench-markintervals supplemented by gross output series for monthly movementsand for special groupings. The value-added type measures of FRBand OBE should be reconciled and the gross output type measures inFRB should be reconciled with those which OBE calculates as an earlystep in its procedures. If this is done at bench-mark intervals (annualas much as possible), differences could be resolved, say at two-digitlevels, and a major element of confusion would thereby be eliminated.
6. At more frequent intervals (monthly and quarterly), I recommendthat we look to the wider use of the Monthly Industry Survey ofShipments, Inventories, and Orders for use in those series in whichthe Board relies heavily on man-hours for current changes. While

366 Basic Industry Product Estimates
man-hour data provide very useful indicators in many industries wherethe production process is long, the need for current measures ofproductivity change requires that these man-hour measures be supple-mented as much as possible by production-type data on a monthlybasis. This will require further strengthening of the Monthly IndustrySurvey, including a strengthening of its sample, the more frequentbench-mark extrapolation of these monthly data to annual surveylevels (last bench mark was for 1962), and a closer tie with employmentinformation so that analysis of output in relation to employment on acurrent basis may be strengthened.
7. More detailed input—output studies (which will require continualimprovement in data on material and service inputs) will help inreconciling many problems of data and analysis of intermediate andfinal output.
Conclusion
AU, or nearly all, the people needed to bring a little more peacefulcoexistence between IP and GPO are in attendance at this conference.It seems to me that there is an opportunity ahead for these people todevelop an imaginative solution to the problems posed by the differencesbetween the Index of Industrial Production and GNP. The differentapproaches in the two measures challenge us to reap the benefits ofboth without' necessarily attempting an ironclad solution that wouldend up with only one type of measure. The advantages of a detailedindustry analysis of productivity changes within a consistent accountingframework are clear, and we should direct the statistics program tostrengthen this work to make it more detailed and more timely. Theadvantages of a commodity-flow type of analysis for both short-runand long-term analysis, but particularly for the short-run, should bemade more widely understood. The flexibility that the Index of In-dustrial Production provides for this type of commodity-flow analysissuggests that this work should be encouraged.
While we of course look for a lessening of unnecessary tensions inthis area of disparate statistics—I would like to end my discussion witha request for a constructive variety in our approach to the study ofoutput and demand developments.
"In My Father's house are many mansions."
0
Comparison of FRB and OBE Measures of Output 367
FRANK R. GARFIELD
In my view the Gottsegen-Ziemer paper marks the beginning of anew phase in the discussion of measuring manufacturing productionin the United States. This developing discussion may well have asignificant bearing on production measurement problems in other areasand on policy problems relating to productivity, unit labor costs, growth,and the like. These policy problems are of great practical importanceand measurement issues affecting them call for the most careful study.
The two-digit data made available with this paper and the analysisby two-digit groups, which is begun here and to be extended in laterpapers, will provide students in this area with important basic materialessential for appraising certain alternative methods of measurement andconsidering what methods may be appropriate in different types ofsituations. For example, this new material will offer an opportunity forstudy at the two-digit level of differences between indexes of deflatedvalue of product, deflated value of input and deflated value-added, asderived here from Census data in current-value terms through deflationby regrouped Bureau of Labor Statistics price data.
The new material will also make possible, for years of comprehensivecensuses, comparisons between the results of this double deflation workand of the work embodied in the Census-Federal Reserve bench-markindexes. Such comparisons could be made now for 1947—54 and1954—58, and comparison for 1958—63 will be possible in the nearfuture when the Census-Federal Reserve indexes become available.
In the Gottsegen-Ziemer analysis emphasis is on other comparisonsand especially on those relating to recent years. For recent years, asthe authors point out, the comparisons between the GPO measuresof the Office of Business Economics and the Federal Reserve Boardmeasures must be regarded as preliminary because some of the two-digitindexes in the Federal Reserve index will probably be revised appreci-ably when the new bench marks become available, even though, asreported in the Gehman-Motheral paper, the total for manufacturingis not expected to be altered much. The present showing is one ofsignificant similarities but also of significant differences.
In commenting on measurement problems, Gottsegen and Ziemernote a number of issues associated with representation of real valueadded (or gross product originating) by physical output series and by

368 Basic Industry Product Estimates
such proxies as adjusted man-hours. They also note various differentproblems associated with measurement of gross product originatingby the double deflation approach in which price deflators obtained bydeflating Census value of output and of input are used to transformcurrent-dollar gross product originating into real terms. The authors takethe view that this approach can be accepted for all two-digit groups inmanufacturing, with the single of petroleum refining. There,a constant-dollar output series derived from physical volume measuresis substituted for deflated dollar figures. This substitution is probablydesirable and I think it likely that for some other groups also constant-dollar series might better be derived by means other than deflatingdollar figures; and beyond questions concerning particular series liebroader questions concerning the best general (or selective) approach.
As the authors suggest, production measurement problems are many.Comment on a single issue must, therefore, leave much unsaid. ButI think the nature of the double deflation approach particularly needsto be explored further, especially with respect to one aspect noted bythe authors. They say: "The GPO implicit deflator has the quality thatsmall differences in the level of output or input prices yield largerdifferences in the GPO deflator since the latter is derived as a residual—that is, the output price index has a positive weight but the input priceindex has a negative weight." And again, in discussing the petroleumrefining problem they say: "Since value added is a residual, smalldifferences in price levels of output and input and small inconsistenciesin the measures of output and input may yield large differences in theprice movements for value added. This was the experience when thedouble deflation method was used for SIC 29."
In citing this reason as one of several for making a substitution here,but not elsewhere, the authors point out that the ratio of cost ofmaterials to value of shipments in that industry is unusually high,ranging from 80 to 84 per cent in the 1950—58 period. Another wayof stating the situation for 1958 in petroleum refining is to say thatvalue added (the residual to be approximated) was 16 per cent of valueof output and a little less than 9 per cent of value of output plus valueof input, the values deflated to arrive at a price deflator for value added.Considering the proportions shown for petroleum refining and theproblems involved in matching prices in price series and prices in
Comparison of FRB and OBE Measures of Output 369
value series, it hardly seems surprising that the results shown for thisindustry were found to be unsatisfactory. When errors occur in deflatinginputs or outputs they may, of course, be offsetting—or they may not.In this connection, it may be noted that equal percentage errors ininput and output measures will not exactly offset each other.
In 1958, the 16 per cent for petroleum refining was the extremelow for the two-digit industry ratios of value added to value of output.But in the food industry, value added was only 29 per cent of valueof product—and 17 per cent of the sum of value of product and valueof input. The behavior of the food processing series shown in theirchart and the behavior of corresponding real output and input seriesshown in the tables raise questions: Did real GPO (or value added)actually show little net change from 1957 to 1960 or 1961? Littlechange for real value added implies a decline in real value added inrelation to real value of output in that period of 9 per cent or more.This sharp decline was preceded and followed by increases in the ratioof real value added to real value of output. Independent evidenceseems to me essential to corroborate this finding before it can beaccepted. The 9 per cent decline in the ratio, from 31.4 to 28.6 percent, reflected the difference between a 9 per cent rise in real outputand a 13 per cent rise in real input (comparing 1957 and 1960). Isthis perhaps a case where rather small errors in price measurement andmatching could have accounted for much or all of the temporarylevelling off in real value added? Would either input or output perhapshave provided a better representation of real value added?
At the other extreme from petroleum refining and food processingin 1958 were printing and publishing and instruments and alliedproducts, with value added to value of product ratios of 63 and 62per cent. But even for printing and publishing the deflation process isapplied to a total of 100 (for output) plus 37 (for input) or 137 alto-gether in obtaining a residual for 63 (i.e., 100 minus 37). Thus, at best,with respect to this aspect of the problem, the risks of important effectsfrom small errors seem to me considerable over the whole range ofindustries.
The analysis in the Gottsegen-Ziemer paper is largely in terms ofchanges over long periods; while year-to-year percentage changes shownin the tables provide a ready reference for those interested, the discussionof year-to-year changes by industry, for the most part, will come later.
370 Basic Industry Product Estimates
I expect this to be a very significant part of the whole analyticalproject.
The problems of current monthly or even quarterly figures are ratherdifferent from those of annual figures—in many respects they are moredifficult—and the answers as to the most appropriate approaches maynot be the same as those arrived at for annual figures. But it is ofgreat importance that the issues relating to annual figures be discussedfurther in quite some detail to improve our understanding both of whathas been happening from year to year and of what can be learned byvarious approaches to annual production measurement.