Embed Size (px)
Citation preview
This paper is published as part of Faraday Discussions
volume 141: Water – From Interfaces to the
Bulk
Introductory Lecture
Spiers Memorial Lecture
Ions at aqueous interfaces
Pavel Jungwirth, Faraday Discuss., 2009
DOI: 10.1039/b816684f
Papers
The surface of neat water is basic
James K. Beattie, Alex M. Djerdjev and Gregory G.
Warr, Faraday Discuss., 2009
DOI: 10.1039/b805266b
Negative charges at the air/water interface and
their consequences for aqueous wetting films
containing surfactants
Katarzyna Hänni-Ciunel, Natascha Schelero and
Regine von Klitzing, Faraday Discuss., 2009
DOI: 10.1039/b809149h
Water-mediated ordering of nanoparticles in an
electric field
Dusan Bratko, Christopher D. Daub and Alenka Luzar,
Faraday Discuss., 2009
DOI: 10.1039/b809135h
Ultrafast phase transitions in metastable water
near liquid interfaces
Oliver Link, Esteban Vöhringer-Martinez, Eugen
Lugovoj, Yaxing Liu, Katrin Siefermann, Manfred
Faubel, Helmut Grubmüller, R. Benny Gerber, Yifat
Miller and Bernd Abel, Faraday Discuss., 2009
DOI: 10.1039/b811659h
Discussion
General discussion Faraday Discuss., 2009 DOI: 10.1039/b818382c
Papers
Hydration dynamics of purple membranes
Douglas J. Tobias, Neelanjana Sengupta and Mounir
Tarek, Faraday Discuss., 2009
DOI: 10.1039/b809371g
From shell to cell: neutron scattering studies of
biological water dynamics and coupling to activity
A. Frölich, F. Gabel, M. Jasnin, U. Lehnert, D.
Oesterhelt, A. M. Stadler, M. Tehei, M. Weik, K. Wood
and G. Zaccai, Faraday Discuss., 2009
DOI: 10.1039/b805506h
Time scales of water dynamics at biological
interfaces: peptides, proteins and cells
Johan Qvist, Erik Persson, Carlos Mattea and Bertil
Halle, Faraday Discuss., 2009
DOI: 10.1039/b806194g
Structure and dynamics of interfacial water in
model lung surfactants
Avishek Ghosh, R. Kramer Campen, Maria Sovago
and Mischa Bonn, Faraday Discuss., 2009
DOI: 10.1039/b805858j
The terahertz dance of water with the proteins: the
effect of protein flexibility on the dynamical
hydration shell of ubiquitin
Benjamin Born, Seung Joong Kim, Simon Ebbinghaus,
Martin Gruebele and Martina Havenith, Faraday
Discuss., 2009
DOI: 10.1039/b804734k
Discussion
General discussion Faraday Discuss., 2009 DOI: 10.1039/b818384h

Papers
Coarse-grained modeling of the interface between
water and heterogeneous surfaces
Adam P. Willard and David Chandler, Faraday
Discuss., 2009
DOI: 10.1039/b805786a
Water growth on metals and oxides: binding,
dissociation and role of hydroxyl groups
M. Salmeron, H. Bluhm, M. Tatarkhanov, G. Ketteler,
T. K. Shimizu, A. Mugarza, Xingyi Deng, T. Herranz, S.
Yamamoto and A. Nilsson, Faraday Discuss., 2009
DOI: 10.1039/b806516k
Order and disorder in the wetting layer on Ru(0001)
Mark Gallagher, Ahmed Omer, George R. Darling and
Andrew Hodgson, Faraday Discuss., 2009
DOI: 10.1039/b807809b
What ice can teach us about water interactions: a
critical comparison of the performance of different
water models
C. Vega, J. L. F. Abascal, M. M. Conde and J. L.
Aragones, Faraday Discuss., 2009
DOI: 10.1039/b805531a
On thin ice: surface order and disorder during pre-
melting
C. L. Bishop, D. Pan, L. M. Liu, G. A. Tribello, A.
Michaelides, E. G. Wang and B. Slater, Faraday
Discuss., 2009
DOI: 10.1039/b807377p
Reactivity of water–electron complexes on
crystalline ice surfaces
Mathieu Bertin, Michael Meyer, Julia Stähler, Cornelius
Gahl, Martin Wolf and Uwe Bovensiepen, Faraday
Discuss., 2009
DOI: 10.1039/b805198d
Discussion
General discussion Faraday Discuss., 2009 DOI: 10.1039/b818385f
Papers
Similarities between confined and supercooled
water
Maria Antonietta Ricci, Fabio Bruni and Alessia
Giuliani, Faraday Discuss., 2009
DOI: 10.1039/b805706k
Structural and mechanical properties of glassy
water in nanoscale confinement
Thomas G. Lombardo, Nicolás Giovambattista and
Pablo G. Debenedetti, Faraday Discuss., 2009
DOI: 10.1039/b805361h
Water nanodroplets confined in zeolite pores
François-Xavier Coudert, Fabien Cailliez, Rodolphe
Vuilleumier, Alain H. Fuchs and Anne Boutin, Faraday
Discuss., 2009
DOI: 10.1039/b804992k
Dynamic properties of confined hydration layers
Susan Perkin, Ronit Goldberg, Liraz Chai, Nir Kampf
and Jacob Klein, Faraday Discuss., 2009
DOI: 10.1039/b805244a
Study of a nanoscale water cluster by atomic force
microscopy
Manhee Lee, Baekman Sung, N. Hashemi and Wonho
Jhe, Faraday Discuss., 2009
DOI: 10.1039/b807740c
Water at an electrochemical interface—a simulation study Adam P. Willard, Stewart K. Reed, Paul A. Madden and David Chandler, Faraday Discuss., 2009 DOI: 10.1039/b805544k
Discussion
General discussion Faraday Discuss., 2009 DOI: 10.1039/b818386b
Concluding remarks
Concluding remarks Peter J. Feibelman, Faraday Discuss., 2009 DOI: 10.1039/b817311g

PAPER www.rsc.org/faraday_d | Faraday Discussions
On thin ice: surface order and disorder duringpre-melting
C. L. Bishop,ab D. Pan,c L. M. Liu,bd G. A. Tribello,†abe
A. Michaelides,abd E. G. Wangc and B. Slater*abe
Received 30th April 2008, Accepted 24th June 2008
First published as an Advance Article on the web 9th October 2008
DOI: 10.1039/b807377p
The effect of temperature on the structure of the ice Ih (0001) surface is
considered through a series of molecular dynamics simulations on an ice slab. At
relatively low temperatures (200 K) a small fraction of surface self-interstitials
(i.e. admolecules) appear that are formed exclusively from molecules leaving the
outermost bilayer. At higher temperatures (ca. 250 K), vacancies start to appear
in the inner part of the outermost bilayer exposing the underlying bilayer and
providing sites with a high concentration of dangling hydrogen bonds. Around
250–260 K aggregates of molecules formed on top of the outermost bilayer from
self-interstitials become more mobile and have diffusivities approaching that of
liquid water. At �270–280 K the inner bilayer of one surface noticeably de-
structures and it appears that at above 285 K both surfaces are melting. The
observed disparity in the onset of melting between the two sides of the slab is
rationalised by considering the relationship between surface energy and the
spatial distribution of protons at the surface; thermodynamic stability is
conferred on the surface by maximising separations between dangling protons at
the crystal exterior. Local hotspots associated with a high dangling proton
density are suggested to be susceptible to pre-melting and may be more efficient
at trapping species at the external surface than regions with low concentrations of
protons thus potentially helping ice particles to catalyse reactions. A preliminary
conclusion of this work is that only about 10–20 K below the melting temperature
of the particular water potential employed is major disruption of the crystalline
lattice noted which could be interpreted as being ‘‘liquid’’, the thickness of this
film being about a nanometre.
Introduction and background
Despite the importance of ice in regulating the earth’s temperature via albedo andwithin atmospheric chemistry (where it serves as a catalyst for many trace gas reac-tions1), a key unknown in these two roles is the physicochemical nature of the icesurface as a function of temperature. Faraday2 first mooted the idea that the surface
aDepartment of Chemistry, Christopher Ingold Building, University College London, 20 GordonStreet, London, UK WC1H 0AJ. E-mail: [email protected] Simulation Laboratory, University College London, London, UK WC1H 0AJcInstitute of Physics, Chinese Academy of Sciences, Box 603, Beijing, 100080, ChinadLondon Centre for Nanotechnology, University College London, London, UK WC1H 0AJeDavy Faraday Research Laboratory, Kathleen Lonsdale Building, University College London,Gower Street, London, UK WC1E 6BT
† Present address: Computational Science, Department of Chemistry and Applied Biosciences,ETH, Zurich, USI-Campus, Via Giuseppe Buffi 13, C-6900, Lugano, Switzerland
This journal is ª The Royal Society of Chemistry 2009 Faraday Discuss., 2009, 141, 277–292 | 277

of ice could have liquid-like properties, a quasi-liquid-layer (QLL), but the nature ofthis layer, in particular its thickness approaching the melting temperature, isdisputed—where more than an order of magnitude separates the estimates of thick-ness obtained using proton channelling and ellipsometry.3 A review of experimentaland computer simulation studies pertinent to the pre-melting phenomenon hasrecently been compiled, which provides a useful introduction to this topic.4
Computer modelling approaches could potentially play a role in resolving thecrystallinity of the surface as a function of temperature, and the atomic-scale mech-anisms together with the role of defects in the pre-melting phenomenon in ice. Natu-rally, the verity of any such model and approach hinges upon accurately describingthe relationship between free energy and temperature. In this work we examine oneparticular model, the six-site model due to Nada and van der Eerden (NvdE)5 whichwas developed specifically to reproduce the melting temperature of ice Ih. In analy-sing the surface structure we focus upon (i) the evolution of the surface structure inthe temperature regime above 200K, (ii) the identification of defects at the surfaceand (iii) the spatial distribution of protons on the external surface of ice and howthis influences pre-melting and stability.
Methods
Here we use a combination of first-principles calculations adjunct to empiricalpotential simulations to probe the detailed nature of structures evolving fromlong-timescale pre-melting studies. Despite the incredible versatility of the TIP4P6
model, indicated by its ability to describe large portions of the water–ice phasediagram, a shortcoming is its ability to predict the melting temperature of water(not withstanding recent reparameterisation of this potential due to Abascal, Vegaand co-workers7–10). In previous simulation work due to Kroes11 and others, themelting of an ice slab with the TIP4P potential was considered in the temperaturerange of 190–250 K. Although melting was observed, the bulk melting temperaturefor TIP4P has been found to range from around 190–230 K (the most recentestimate being 232 K12) and hence the liquefaction mechanism at the superheatedtemperatures of >230 K could be distinct from pre-melting. More recently, Ikeda-Fukazawa13 and others have addressed pre-melting using the Kawamura potentialwhich has a reported melting temperature of 290 K. In their work, an ice slab washeated to 270 K for 60 ps and the mean-square displacement of water moleculesin the outermost bilayer was noted to be very strongly enhanced in the c axis, perpen-dicular to the crystal surface rather than the a or b axis parallel to the crystal surface.At this temperature, only a very slight loss of structure is noted at the externalsurface evidenced by a broadening of the density at the outermost layer. A very rele-vant study is that of Carignano et al.14 who looked at ice growth up to 275 K usingthe same potential used here. Their study monitored the liquid-like layer on eitherside of a slab of ice, which was in contact with both vacuum and water; comparisonsbetween our studies are drawn later. Bolton and Pettersson15 have also studied pre-melting and their work highlighted rapid transport of water between outer bilayersat temperatures in the region 180–210 K (TIP4P model), which was associated withpre-melting. However, in this paper, we present the first preliminary account of ourongoing study that attempts to shed further light on the pre-melting phenomenon,by monitoring systematic changes in surface structure up to the melting temperature.
In this work, we use the potential due to NvdE, which is a rigid-body, six-sitemodel. In the original paper of NvdE the melting temperature was estimated tobe 271 � 9 K but we note the most recent study16 with this potential puts the meltingtemperature at 289 K. In addition to the oxygen and hydrogen sites, two sites repre-sent the lone pairs, whilst a further site sits along the bisector of the two hydrogenatoms and attempts to mimic the concentration of electron density close to the centreof mass of the water molecule. We have used the 6 � 3 � 3 cell due to Hayward andReimers,17 containing 768 molecules and 8 bilayers (96 molecules per bilayer).
278 | Faraday Discuss., 2009, 141, 277–292 This journal is ª The Royal Society of Chemistry 2009

Hayward and Reimers developed ice cell geometries in which the protons are maxi-mally disordered and the cell has no net dipole or quadrupole. The latter character-istics are an important pre-requisite for surface simulation; in this work we usea periodic slab approach and any significant dipole across the slab can potentiallyinteract through the vacuum with its periodic image, which would lead to spuriousartefacts. The bulk cell was initially geometry optimised at 0.1 K using NPT molec-ular dynamics‡ (employing the DL_POLY18 code, version 2.18) to give cell param-eters of a ¼ 26.92, b ¼ 31.08, c ¼ 29.30 A, which compare favourably with theexperimental geometry of a ¼ 26.98, b ¼ 31.48, c ¼ 29.28 A taken from Rottgeret al.19 at 10 K (note that these parameters relate to an ice sample which containssome fraction of ice XI. Ice XI displays small negative thermal expansion below�70 K, hence the maximum error of 1.3% in b is an upper bound. At 85 K, abovethe Ih / XI transition temperature, the maximum error in b reduces to 1.2%). Avacuum gap of 30 A was introduced along the Cartesian z axis to create two(0001) surfaces and the slab was geometry-optimised. We determined that thesurface energy was converged at 6 bilayers but use 8 bilayers in this work to screeninteractions across the slab arising from melting at the external surface. In a contig-uous series of MD runs, using a 1 fs timestep and starting at 200 K, the slab wasequilibrated for 5 ps and then production runs of between 0.5 and 5 ns wereconducted for 210, 220, 230, 240, 250, 255, 260, 265, 270, 273, 275, 280, 285 and290 K. Trajectory samples were taken at 0.5 ps intervals and analysis was performedover all the configurations sampled and over sections of the longer MD runs.Conservation of kinetic energy was reasonable: at 285K the RMS fluctuation inthe temperature over a 1 ns run was 2.4 K. Due care was exercised in ensuring thestatistical samples taken over MD runs of unequal length were not directlycompared. However, it is noteworthy that for the 285 K run, the coordinationnumbers extracted from 0–0.25 ns and 0.75–1.0 ns are essentially indistinguishablefrom one another. Additionally, the gradient of the MSD at this temperature isconverged within <5 ps of the production phase.
The DFT calculations have been performed with the CP2K/Quickstep program,20
which employs a hybrid Gaussian and plane-wave basis set. The Perdew, Burke andErnzerhof (PBE)21 exchange–correlation functional has been used throughout andthe core electrons are described with norm-conserving Goedecker, Teter and Hutter(GTH) pseudopotentials.22,23 The valence electrons are expanded in terms ofGaussian functions with a triple-z doubly polarised basis set (TZV2P) and for theauxiliary basis set of plane waves a 340 Ry cutoff is used. Due to the larger compu-tational demands of the DFT calculations compared to the empirical potentials,a considerably smaller (but still moderately large) unit cell with 48 water moleculesper bilayer was employed. Calculations on slabs of between 2 and 6 bilayers thick-ness were performed and during the DFT geometry optimizations all atoms werefully relaxed. A vacuum gap of 20 A was used throughout.
Results
In the following sections, we address the response of the thin ice slab to increasingtemperature in the range 200 to 290 K. At all temperatures up to about 285 K the ener-gies throughout the course of the MD simulations are well conserved. This can be seenfor three high temperatures (275, 280 and 285 K) from Fig. 1. However at 290 K itcan be seen that the total energy is no longer conserved and the crystal appears tobe in a non-equilibrium melting state. Towards the later part of the simulation
‡ A timestep of 1 fs was used throughout, integration was performed using the velocity Verletalgorithm. The van der Waals cutoff used was 10.0 A, as used by NvdE, and the Berendsenthermostat/barostat was used to control the temperature and pressure (1 atm.). Thefrequency of scaling was 0.005 ps which was necessary in order to minimise fluctuations inthe temperature. The NVT ensemble was used for the surface simulation runs.
This journal is ª The Royal Society of Chemistry 2009 Faraday Discuss., 2009, 141, 277–292 | 279

Fig. 1 Evolution of the total energy over the duration of the simulation. Total energy at 275 Kdenoted in black, 280 K data is displayed in red, 285 K in green and 290 K in blue.
at 290 K, it appears that the energy is reducing and this may indicate a very longtimescale restructuring process. However, we crudely infer from this that themelting temperature for the entire slab with this potential is at around 285–290 K.This is consistent with Abascal and Vega’s estimate and hence the temperaturesreported here should be reduced by �15 K to be comparable to experiment.
Firstly we examine the density across the slab to monitor the crystallinity of eachbilayer in a qualitative way and then address the degree of order in each layer. Wethen comment on the incidence and type of defects formed and then attempt to ratio-nalise the disparity in melting rates that are observed for the two surfaces.
(i) Density profile as a function of temperature
Fig. 2 shows a composite of the density profile, generated with 0.1 A bins, for four-coordinated oxygen atoms across the slab taken for two temperatures, 200 and285 K. The coordination number of each molecule was evaluated within a cutoffradius of 2.27 A, around 0.5 A larger than the equilibrium hydrogen-bond lengths.The number density peaks are unequal for the sub-surface slabs which is caused bythe vibration and relaxation of the bilayers which leads to a broadening of the peaksthat is most pronounced at the surface. The surfaces of the slab are the extrema ofthe coordinates plotted along the x axis. At 200 K, the outermost part of the surfacebilayer is well crystalline but shows slight broadening in comparison to the inner partof the bilayer. The peak heights of the outermost peaks are noticeably smaller thanthe corresponding peaks of the inner bilayer because a fraction of the water mole-cules (the water molecules in the upper bilayer) are three-coordinated. There isevidence of surface relaxation, principally manifested in the reduced peak heightsof the outer layers compared to the inner layers, which reflects a tendency to deviatefrom the ideal lattice position. At 200 K, the combined width of the outermostbilayer peaks are 3.00 and 2.90 A for the lower and upper surfaces respectively,which compares to 2.40 and 2.50 A for the central bilayers. The central bilayersare 2.70 A apart whilst the surface layer to second bilayer distance (measuredfrom the inner bilayer surface peak to the outer peak of the second bilayer) is2.80 A. For comparison, at 285 K, the central bilayers have peak widths of 2.90and 3.0 A. A final point upon which we comment on in more detail later is thatthe profile at 200 K already contains defects in the outermost layers. However,
280 | Faraday Discuss., 2009, 141, 277–292 This journal is ª The Royal Society of Chemistry 2009

Fig. 2 Number density of four-coordinated oxygen atoms at 200K (depicted with the dottedline) and at 285K (displayed with a continuous line) as a function of the slab height. Note theasymmetry between the two outer surfaces, where the lower surface is more disordered in theregion between the first and second bilayers.
the lifetime and incidence of these defects is extremely small and therefore thedensity plot is essentially unchanged from the defect-free state.
Upon increasing the temperature, the peak heights and widths for the first bilayersreduce and increase respectively. For the sake of clarity, only the 285 K plot is super-imposed upon the 200 K data. Upon close inspection of Fig. 2, it can be seen that allthe peaks have broadened but most noticeably at the surface. More significantly, thetwo surfaces on either side of the slab have disordered to different extents, the lowersurface (smaller values of x) showing less structure than the upper surface. In thelower surface, there is a build-up of density between the first two bilayers indicatingpre-melting or melting which is less pronounced for the upper surface. The inner partof the bilayer for the upper surface is noticeably more well-ordered than the analo-gous peak for the lower surface and the lower surface shows significant loss of orderin the second bilayer whilst the corresponding peak in the upper part of the slab isrelatively well ordered. The new overlayer on top of the original external surface hasa depth of approximately 5 A at 285 K for both the upper and lower layer.
Since the density profiles reflect the averaged position of species, the spatial rela-tionship of species and crystallinity of each layer is open to question. Fig. 3a and 3bshow a snapshot taken from the end of the dynamics run for the oxygen sub-latticein the first three bilayers of the lower surface. In Fig. 3a, the surface is shown at250 K and shows a vacancy in the outermost bilayer (blue), which exposes thesecond bilayer, but otherwise the hexagonal oxygen sub-lattice is intact. The situa-tion at 285 K shown in Fig. 3b contrasts strongly with that at lower temperatures;all characteristic hexagonal ordering in the oxygen sub-lattice of the outer bilayerhas been lost, the second layer is noticeably disordered exposing the third bilayerbut the third layer is still strongly crystalline. The inferences made about orderingfrom the density of four-coordinated oxygen atoms in Fig. 2 appear to be supportedby the visualisation of the slab. From viewing the evolution of the sub-latticenetworks at 285 K, it is evident that the outermost layer depicted in blue undergoesvery rapid rearrangement and from frame to frame (0.5 ps) the structure changes.Molecules furthest away (the highest molecules) from the outer bilayer are particu-larly mobile as they are typically one- or two-coordinated and these contributestrongly to the apparent height of the surface in the density profile as they fleetingly
This journal is ª The Royal Society of Chemistry 2009 Faraday Discuss., 2009, 141, 277–292 | 281

Fig. 3 Three bilayers of water ice viewed from the [001] direction, where the oxygen sub-latticeis depicted by creating bonds between oxygen atoms within 3.0 A of one another. The externalbilayer is in blue, the second bilayer is shown in red and the third bilayer towards the centre ofthe crystal slab is shown in green. (a) This snapshot was taken at 250 K. Only the outermostbilayer is interrupted whilst the sub-surface bilayers display a fully connected hexagonal sub-lattice. (b) This snapshot was taken at 285 K. Obvious hexagonal structure has been lost inthe outermost layer and the second bilayer has also lost significant order.
leave the surface. Underlying layers have a more rigid sub-lattice although thesecond layer shows significant fluctuation in the 2D structure in comparison tothe third layer. The external surface layer is rather rough at this temperature,from the maximum height of the external surface to the lowest exposed point inthe topography of the ice surface is some �10 A.x From the perspective of catalysis,it is readily conceivable that these crevasses may trap or even encapsulate specieswhich could then participate in reactions. The walls and base of the crevasse arelined with dangling hydrogen bonds which could presumably strongly bind foreignor natant water species.
(ii) Ordering and disordering in the external surface layer
We now turn to consideration of the density of under-coordinated water ice mole-cules, in particular the three-coordinated water molecules, to understand more ofthe nature of the quasi-liquid layer and its intrinsic order. In ice, each molecule issurrounded by four neighbouring molecules except at the surface where onedangling hydrogen bond is exposed. In water, using this potential model approxi-mately half of the water molecules are three-coordinated and half are four-coordinated. Hence the proportion of four- to three-coordinate H2O moleculescould be used to monitor how liquid-like such a layer is. In Fig. 4a and 4b, thenumber of three-coordinated species on the lower and upper surfaces, respectively,are shown for selected temperatures. There is some anisotropy between the twoplots. In particular, there is a qualitative change in between 230 and 260 K whenthree-coordinate species appear in the inner-part of the bilayer. For the uppersurface inner bilayer, under-coordination is less pronounced than for the lowersurface upon heating from 260 to 273 K. The number of 3-coordinate species above
x The estimate of QLL thickness made here is slightly larger than the value of �0.6 nm fromCarignano et al.14 which was obtained at a lower temperature of 275 K.
282 | Faraday Discuss., 2009, 141, 277–292 This journal is ª The Royal Society of Chemistry 2009

Fig. 4 Number density of three-coordinated oxygen atoms at selected temperatures for twobilayers on (a) the lower and (b) the upper part of the slab. (a) The peak at around 16 A indi-cates the outer bilayer of the lower surface. (b) The peak around 43 A indicates the upper partof the bilayer i.e. the external surface.
the external surface remains constant for both surfaces, potentially suggesting thatthese structures are in (dynamic) equilibrium. Notionally one can compare thenumber densities of four- and three-coordinate species and in the outer bilayers,the ratio of four- to three-coordinated species is approximately 1, suggesting thisregion is liquid-like. However, the structure is far from homogenous as Fig. 3 attestsand hence such a measure of liquid-like nature is possibly misleading. We note thatthe number of one- and two-coordinated molecules increases with temperature andcomprises the majority of the new overlayer. At 285 K the relative proportions ofcoordination are: 1-coordinate (0.1%), 2-coordinate (4.9%), 3-coordinate (12.8%),4-coordinate (80.7%) and 5-coordinate (0.6%).
This journal is ª The Royal Society of Chemistry 2009 Faraday Discuss., 2009, 141, 277–292 | 283

Fig. 5 Against a backdrop of the total density of hydrogen atoms in the slab as function ofslab depth, the density of hydrogen atoms that have exchanged which oxygen they werehydrogen bonded to is displayed, for selected temperatures.
Another guide to the transience of the hydrogen-bond network that one attributesto water-like behaviour is exchange of hydrogen bonds. Fig. 5 shows the density ofhydrogen atoms that have exchanged which oxygen they are bonded to. Again theasymmetry in the pre-melting of the ice slab is visible with slightly more exchangein the first and second bilayer for the lower surface than the upper surface. The uppersurface is somewhat more resistant to the effects of increasing temperature. For bothsurfaces, there is evidence that both the first and second bilayer contain fractions ofH2O molecules that are freely exchanging hydrogen bonds in a way that is charac-teristic of liquid-like water rather than crystalline water. In the outermost bilayerapproximately 40% of H2O molecules are 3-coordinated compared to 25% in theideal surface and around 5% are two-coordinated. One interesting feature is thatat the lower temperatures (250–260 K) the upper surface has a higher concentrationof waters that have changed their hydrogen-bonding neighbours than the lowersurface but at much higher temperatures of circa 280 K the lower surface hasa more mobile network. This observation may be explained by the upper surfacesomehow auto-passivating or reconstructing itself. In passing we note that providedthe external water-like layer is thick enough, a radial distribution function could begenerated to help establish whether it possesses long-range order and the degree ofshort-range order, although for the run described here we suspect the statistics arenot plentiful enough for such an analysis to be unequivocal.
Interestingly, even at 280 K as displayed in Fig. 6, the ratio of H2O moleculeswhich exchange over the final 0.25 ns of a run is relatively small (9.5%) in compar-ison to the total number of molecules. The ratio of waters with a rigid hydrogen-bond network versus a flexible hydrogen-bond network peaks between the firstand second bilayers over the lifetime of the run, with the largest ratio beingfound just inside the surface. This observation suggests that a proportion of thesub-surface H2O molecules are more mobile than those above them, a situationanalogous to a frozen lake with liquid water underneath. A potentially importantobservation in the context of distinguishing between melting and pre-melting isthat the density and exchange plots averaged over the first 0.25 ns and final0.25 ns (for 260–280 K) were essentially unchanged and suggest the crystal is inequilibrium i.e. not melting.
284 | Faraday Discuss., 2009, 141, 277–292 This journal is ª The Royal Society of Chemistry 2009

Fig. 6 The dashed line represents total hydrogen density at 280 K averaged over the final0.25 ns of a MD run. The solid line represents the density of hydrogen atoms that exchangehydrogen bonds with other molecules. The ratio of exchangeable hydrogen bonds is maximalat the external surfaces, decreases at the inner bilayer and increases again below this layerbefore becoming negligible at the bulk interior.
Although not reported here, we have analysed the mean-square displacement(MSD) profile of H2O molecules throughout the slab. What is particularly note-worthy is that the MSD monotonically increases with temperature and by 285 Kthe measured diffusion coefficient is 2.37 � 10�9 m2 s�1 for the outer layers(0.23 � 10�9 m2 s�1 averaged over the entire slab) which is considerably largerthan the experimental values of 0.7 � 10�9 m2 s�1 at 263.7 K24 (the approximatetemperature this corresponds to in real terms) but close to the experimental valueof 2.23 � 10�9 m2 s�1 at 298 K. Carignano’s data14 suggest that the NvdE potentialoverestimates the true diffusion of water below 298 K but not to the degree notedhere. However, if the MSDs are deconvolved to show their individual diffusivities,it is clear that a small fraction of surface bound species have extraordinary diffu-sivity that is more than one order of magnitude faster than the QLL. The presenceof these highly mobile molecules skews the apparent diffusivity considerably andhighlights that collective diffusivity is not a reliable gauge of the liquid-like natureof the surface.
Analysis of structural changes during pre-melting
To aid interpretation of the structural changes occurring during pre-melting, thetrajectories have been analysed visually to try and untangle the local events thatoccur which trigger the collective loss of structural order in a layer associatedwith melting. Three distinct temperature regimes are discussed here.
(i) 200–230 K
According to experiments on dislocation loops in ice crystals,3 evidence has beenpresented that interstitial defects are the dominant defect in ice. Previous simulationwork by Itoh et al.25 using the TIP4P potential produced reasonable pathways forself-interstitial migration in the crystal bulk, but the underlying energetics weredeemed to be qualitative at best by the authors. More recently de Koning et al.26
have used generalised gradient approximation (GGA) DFT approaches to examine
This journal is ª The Royal Society of Chemistry 2009 Faraday Discuss., 2009, 141, 277–292 | 285
interstitial defect formation in the crystal bulk and arrived at a value of �0.7 eV,which is considerably greater than the experimental estimate of 0.4 eV.3 The signif-icance of the defect energies is that concentration of defects is used to rationalise theproton conductivity as well as other properties. The evidence from de Koning’sstudies on these defects and other more complex defects suggests that interstitialsmay be less populous relative to other defects than previously thought. In the lightof these insights, it is of interest to monitor the type and frequency of defect forma-tion at the surface since the energy of formation of these species remain unknown atthis time (though we note work is underway within our groups to establish surfacedefect energies from DFT calculations).
At 200 K self-interstitials form relatively rarely—to the extent that just one surfaceinterstitial is seen over the duration of a 0.25 ns MD run. The mobility of the inter-stitials is low and migration was only noted within a radius equivalent to the nextnearest neighbour at this temperature. Recent DFT calculations due to Thierfelderet al.27 showed four distinct positions for surface molecular adsorption of water onthe ice (0001) face, with energies ranging between 0.55 and 0.58 eV (computed usinga periodic slab, plane-wave approach and the PW91 functional). Essentially Thier-felder notes two adsorption modes, one where a water molecule binds towards thecentre of the hexamer ring which is the most stable site (0.58 eV), and a second wherethe sorbed water sits atop an ideal lattice site (�0.55 eV) corresponding to the innerpart of the outermost bilayer. In our simulations from above 200 K the interstitialsare readily identified and it is heartening that despite the fact that a rigid dipole isused to describe the water in these pair-potential calculations, the centre site modeof adsorption is observed with increased frequency to the atop mode. Within thistemperature range, the interstitials still undergo relatively slow diffusion acrossthe surface such that probability of two interstitials being proximate is rare enoughthat no dimerisation of the interstitials is seen. A final observation is that in thistemperature regime, only the outermost, undercoordinated molecules of the externalbilayer form self-interstitials and there is no visual evidence that the lower part of theoutermost bilayer is disrupted.
(ii) 230–250 K
Above 230 K, there is a marked increase in the number of self-interstitials formedand consequently the number of vacancies in the outermost bilayer. The interstitialsbegin to aggregate from around 230 K onwards, initially forming dimer pairs. Wenote that Thierfelder also found that dimers formed readily with an adsorptionenergy which is fractionally more favourable (0.576 eV per molecule) than formingtwo isolated interstitials (0.575 eV per molecule). However, whether DFT with thePW91 exchange–correlation functional is reliable enough to accurately comparethe stability of adsorbed monomers and dimers remains open to question.28,29 Themajority of the dimer pairs formed in our MD simulations remain as a complexwhich is either static or which diffuses very slowly across the surface. From around240 to 250 K there is a qualitative change in the surface topography where moleculesdiffuse from the lower part of the outermost bilayer to either the outer part of thebilayer, occupying vacant lattice sites or directly above the surface as an interstitial.At around 240 K temporary holes appear in the outermost bilayers that provideaccess to the sub-surface bilayer but these have very short lifetimes of just a fewps and are quickly repaired by interstitial molecules and molecules from the outerpart of the bilayer. Approaching 250 K, the holes become more permanent andhave lifetimes of >50 ps. Over the temperature range 230–250 K, dimer clusterson the external surface begin to aggregate with one another and lone interstitialsto form islands of quasi-crystalline water atop the original external surface. Inthis temperature regime, particularly at around 250 K the surface becomes consid-erably rougher as a consequence of forming vacancies in the outer bilayer anda new but incomplete quasi-crystalline layer.
286 | Faraday Discuss., 2009, 141, 277–292 This journal is ª The Royal Society of Chemistry 2009

(iii) Above 250 K
At temperatures above approximately 250 K, it becomes more difficult to distinguishdistinct events occurring on the external surface. Analysis of the oxygen sub-latticeat $250 K shows that the characteristic regular hexagonal structure is interrupted bydefects and dynamically evolves, presumably in response to melting events on thesurface and complex surface structural rearrangements. A qualitative ring analysisshows that the surface consists of largely 6-membered rings, with smaller strained4- and 5-membered rings compensated by 7- and 8-membered rings at 260 K.However, evidently the network still retains both 2D and 3D structure and thereforeappreciable long-range order is still present. At around 270 K, hexagonal order ismore difficult to detect and from the disruption observed in the top two bilayersof each surface at 275–280 K the lower and upper surfaces have lost any semblanceof hexagonal order. Raising the temperature to 290 K noticeably accelerates theloss of order and which is accompanied by a drift in the total energy, suggestingthat over the lifetime of 1 ns the (melting) ice slab has not equilibrated.
Before leaving this qualitative assessment of structural changes we highlight twoother observations, which will possibly influence the mechanism and the rate ofmelting at ice surfaces.
Proton disordering events
The commonly accepted mechanism of proton conduction was put forward byBjerrum (see ref. 3 for a more complete explanation), who highlighted the role oforientational defects in proton conduction. The two so-called Bjerrum defectsviolate the ice rules: (i) an L-defect is formed when a molecule rotates aroundfrom a water to which it donates a hydrogen bond, leaving no proton betweentwo oxygen sites; (ii) a D-defect is created when a water rotates resulting in twoprotons between two oxygen atoms. Taking the instance of the D-defect, the twoprotons are in an unfavourable interaction and in the Bjerrum model, one of thewaters rotates away forming a new D-defect and the process continues until a seriesof molecules change orientation and in effect a proton has migrated. Detailed anal-ysis of the 230 K dynamics run revealed two distinct events which impact on theproton disordering and proton conduction behaviour of ice which are distinctfrom the Bjerrum orientational defect. We call the two mechanisms (i) relay and(ii) exchange or dosey-do. In the relay mechanism shown in Fig. 7a, water moleculesrotate about their centre of mass in a process reminiscent of the Grotthus mechanismof proton transport. By contrast, in the exchange mechanism (Fig. 7b), the watermolecules physically pass one another in a concerted movement. The exchangemechanism is slightly more complex than the Figure implies in that the participatingmolecules do not lie in the same plane during the transition. One molecule goessub-surface whilst the other migrates via a supra-surface pathway.{ The two mech-anisms also contrast in that in the relay mechanism the dangling proton is passedfrom one molecule to its next nearest neighbour via a water in the inner part of thebilayer. In the dosey-do mechanism the dangling proton is passed to its nearestneighbour from the outer bilayer to the inner bilayer. The duration of bothprocesses differ considerably; the relay mechanism involving just concerted flippingof the water occurred over �2.5 � 0.5 ps whilst the dosey-do takes considerablylonger (�17.5 � 0.5 ps) suggesting approximately an order of magnitude differencein the proton conduction rates However, both mechanisms occurred just twice ina 0.5 ns 230 K run and hence more extensive sampling is needed to validate therelative rates of these processes.
{ Both the processes referred to were only ever seen at the crystal surface though there is noobvious reason why such events could not happen in the crystal bulk; however, we presumethe barrier is much higher for steric and electrostatic reasons.
This journal is ª The Royal Society of Chemistry 2009 Faraday Discuss., 2009, 141, 277–292 | 287

Fig. 7 The dashed lines represent protons below the plane of the paper, whilst the emboldenedlines indicate protons above the plane of the paper. (a) Proton relay mechanism by orienta-tional reordering. In this example, the net effect is for one proton to be ‘‘passed’’ from theleft to the right in the plane of the paper. In the simulations, we only observed a mechanismin which the central molecule is within the inner bilayer whilst the other two molecules arein the outer bilayer. (b) The exchange or dosey-do mechanism in which two water moleculesexchange position within the lattice in a concerted event which is only observed to occurbetween a nearest neighbour inner bilayer and outer bilayer water molecule. The moleculesavoid steric clashes by one water following a trajectory sub-surface whilst the other moleculegoes supra-surface. An important distinction is that these mechanisms allow for a change inpolarisation but are not proton conduction mechanisms in and of themselves.
General discussion
An interesting result of this paper is the observation of slightly different disorderingbehaviour and onset of melting for the two sides of the slab. Since each surface ofour slab is representative of the (0001) surface of ice Ih being, as we mentioned,obtained with the procedure of Hayward and Reimers, it is somewhat surprisingto observe two slightly different melting temperatures. However, at the outseteach surfaces does not have identical proton distributions and so we looked in tothis issue in detail to see if we could understand if a relation between the onset ofmelting and surface order existed. We sought to consider precisely how the stabilityof a variety of defect-free (0001) ice surfaces differs with respect to the arrangementof the surface protons. Conscious that surfaces which differ only in the spatialarrangement of the protons are likely to have very similar energies, these calculationswere performed with DFT. However, the general conclusion that we reach fromthe DFT calculations is not altered if we use the classical water potential describedhere (with an additional term to better reproduce proton ordering energetics).
The intrinsic stability of the various surfaces at zero Kelvin was comparedby computing their total surface energies, g, which is defined here per watermolecule as:
g ¼ Eslabtot ðnÞ � nEbulk
tot
m(1)
where Eslabtot is the total energy of the ice slab obtained from our first principles DFT
calculations, n is the number of bilayers in the slabs, and m is the number of water
molecules on the two surfaces of the slab. The bulk reference per molecular bilayer,
Ebulktot , is extracted from calculations on ice slabs from the relation:
Ebulktot ¼ Eslab
tot (n) � Eslabtot (n � 1) (2)
where, as before, n is the number of bilayers in the slab. The surface energy wascomputed for more than 20 perfect (0001) ice Ih surfaces that were identical exceptfor the spatial arrangement of the protons in the slab. For each slab a different valueof the surface energy was obtained. The fact that we do not get a unique value for ice
288 | Faraday Discuss., 2009, 141, 277–292 This journal is ª The Royal Society of Chemistry 2009
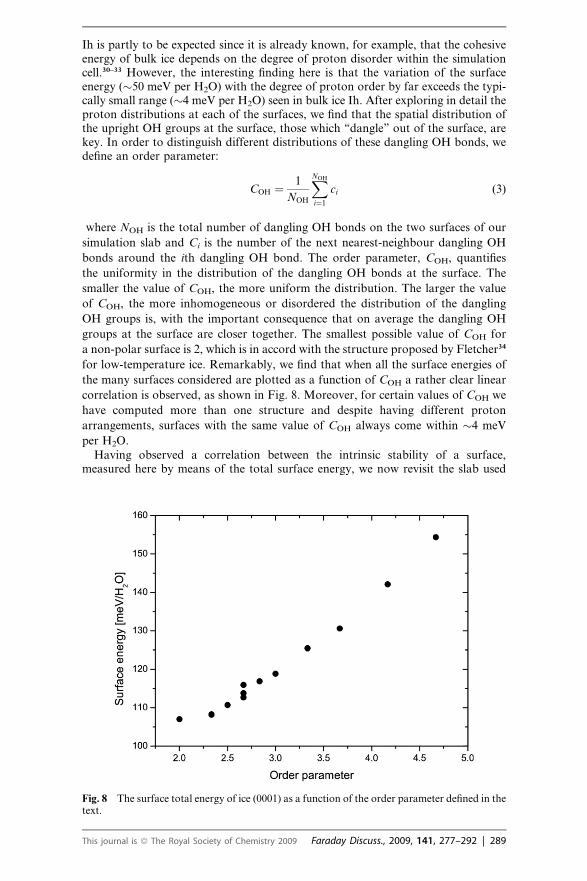
Ih is partly to be expected since it is already known, for example, that the cohesiveenergy of bulk ice depends on the degree of proton disorder within the simulationcell.30–33 However, the interesting finding here is that the variation of the surfaceenergy (�50 meV per H2O) with the degree of proton order by far exceeds the typi-cally small range (�4 meV per H2O) seen in bulk ice Ih. After exploring in detail theproton distributions at each of the surfaces, we find that the spatial distribution ofthe upright OH groups at the surface, those which ‘‘dangle’’ out of the surface, arekey. In order to distinguish different distributions of these dangling OH bonds, wedefine an order parameter:
COH ¼ 1
NOH
XNOH
i¼1
ci (3)
where NOH is the total number of dangling OH bonds on the two surfaces of our
simulation slab and Ci is the number of the next nearest-neighbour dangling OH
bonds around the ith dangling OH bond. The order parameter, COH, quantifies
the uniformity in the distribution of the dangling OH bonds at the surface. The
smaller the value of COH, the more uniform the distribution. The larger the value
of COH, the more inhomogeneous or disordered the distribution of the dangling
OH groups is, with the important consequence that on average the dangling OH
groups at the surface are closer together. The smallest possible value of COH for
a non-polar surface is 2, which is in accord with the structure proposed by Fletcher34
for low-temperature ice. Remarkably, we find that when all the surface energies of
the many surfaces considered are plotted as a function of COH a rather clear linear
correlation is observed, as shown in Fig. 8. Moreover, for certain values of COH we
have computed more than one structure and despite having different proton
arrangements, surfaces with the same value of COH always come within �4 meV
per H2O.Having observed a correlation between the intrinsic stability of a surface,
measured here by means of the total surface energy, we now revisit the slab used
Fig. 8 The surface total energy of ice (0001) as a function of the order parameter defined in thetext.
This journal is ª The Royal Society of Chemistry 2009 Faraday Discuss., 2009, 141, 277–292 | 289

in the molecular dynamics simulations, in a way anticipating that this might explainthe different melting behaviour on the two sides of the slab. However, employing theorder parameter defined in eqn (3) we find that the two surfaces of the slab haveprecisely the same value: 2.92. Thus, although we have observed a correlationbetween surface order and surface energy, it appears that even surfaces with thesame average extent of surface order may start to melt at different temperatures.This leads us then to examine proton ordering in more detail and consider whetherlocal, as opposed to global, proton arrangements have an impact on the suscepti-bility of a surface to pre-melting. Indeed from the relation displayed in Fig. 8 weget an indication that molecules will likely be unstable, or ‘‘hot’’ when three ormore protons surround them. It turns out that the lower surface has sixteen mole-cules with highly unfavourable sites with clusters of three or more adjacent danglingprotons whilst the upper surface has only twelve. Thus we suggest that the greaterproportion of the local hot spots with high local concentrations of dangling OHsmay be responsible for the slightly lower onset of melting on the lower surface ofthe slab. We can imagine figuratively speaking that at the hot-spots on the real icesurface associated with clusters of protons, these regions are prone to pre-meltingand form ‘puddles’, which may also act as traps for trace gases in atmospheric reac-tions. The previous discussion is somewhat speculative at this stage and it could bethat the slightly different melting behaviour at the two surfaces is an artefact ofhaving reasonably small surface areas with a relatively low variance in the localCOH. In future work, a systematic study of the melting temperature of various icesurfaces as a function of average and local COH is planned. An additional point incritique of the results presented here which also acts as a word of caution for allsimulations of ice-surface pre-melting relates to the rather long timescales required.Indeed, despite the structures observed at the external surface appearing to be inequilibrium at around #285 K, there is still the possibility that the surface hasnot always attained its equilibrium structure. In Carignano et al.,14 the QLL wasfound to equilibrate in just 200 ps at 275 K and this concurs with our observations.However, in particular, by monitoring the structure visually, it can be seen that theoutermost water molecules very slowly organise themselves to form chains after 1 nsat temperatures above 275 K. Possibly, more extensive simulations are required toestablish whether more ordered structures develop on a very long timescale.
The final issue worthy of note is the melting temperature; our results indicate thatthe surface, despite being manifestly disordered at the surface for two bilayers at thecrystal surface, does not melt until 285–290 K, in agreement with the estimate ofAbascal et al.16 However, it is somewhat surprising that given the surface was incontact with free vacuum, the surface does not melt at a lower temperature. Ourmodel of the surface does not contain any ionic defects which are known to bepresent in real ice samples and perhaps this prevents us from observing disorderingat relatively low temperatures (observed at just above 200 K by Wei et al.35). Wemight expect ionic defects and extrinsic impurities to surface segregate which maywell affect the response of the surface to temperature and perhaps the thickness ofthe QLL reported by experiment.
Conclusions
In collating the conclusions, in this section we subtract 15K from the temperatures atwhich we observe phenomena in order to make contact with experiment. We findthat:� The ionic defect-free pure ice (0001) surface shows anisotropy in its melting
which we attribute in part to the spatial arrangement of protons on the surface.� The outer surface is liquid-like at temperatures above �250 K but this lies in
a crust of interrupted ice immediately below which the sub-surface H2O is rathermobile (and can diffuse to the outer surface).
290 | Faraday Discuss., 2009, 141, 277–292 This journal is ª The Royal Society of Chemistry 2009

� Surface interstitials (ad-molecules) are seen at 200 K. These interstitials are notevidence of melting or pre-melting since they occur at temperatures well below theformation of the QLL. At temperatures of around 240–250 K, these single intersti-tials are extremely mobile, diffusing faster than liquid water, hence the collectivediffusion coefficient should not be used to gauge the extent of water-like structuresat the surface or the identification of water at the surface. When single interstitialsdimerise their diffusion is markedly slower.� Large holes of width �0.5–1.0 nm appear in the outermost bilayer at tempera-
tures below 250 K. These ‘crevasses’ are at least 1.0 nm deep at temperatures around10 K below the melting temperature and have the capability of trapping foreignspecies. The roughness of the surface is considerably larger than expected, suggestingeven at temperatures typical of arctic and antarctic lower and upper atmospheres,the sticking probability of species to the surface will deviate significantly from theclassic picture of the Kossel crystal ideal surface.
In current work, we are extending the timescales of the MD runs described hereand we are exploring in detail how proton arrangement influences the melting ofthe ice surface. We are also investigating more quantitative schemes for discrimi-nating between liquid and crystalline water, such as that of Carignano et al.14
Acknowledgements
The work of L. M. L. and A. M. is supported by the EURYI scheme (see http://www.esf.org/euryi) and the EPSRC. D. P. and E. G. W. are supported by theNSFC. Partial computational support from the London Centre for Nanotechnologyis warmly acknowledged.
References
1 M. J. Molina, Angew. Chem., Int. Ed. Engl., 1996, 35, 1778–1785.2 M. Faraday, The Athenaeum, 1850, 1181, 640–641.3 V. F. Petrenko and R. W. Whitworth, Physics of Ice, Oxford University Press, USA, 2002.4 Y. Li and G. A. Somorjai, J. Phys. Chem. C, 2007, 111, 9631–9637.5 H. Nada and J. P. van der Eerden, J. Chem. Phys., 2003, 118, 7401–7413.6 W. L. Jorgensen, J. Chandraeskhar, J. D. Madura, R. W. Impey and M. L. Klein, J. Chem.Phys., 1983, 79, 926–935.
7 E. Sanz, C. Vega, J. L. F. Abascal and L. G. McDowell, J. Chem. Phys., 2004, 121, 1165–1166.
8 E. Sanz, C. Vega, J. L. F. Abascal and L. G. McDowell, Phys. Rev. Lett., 2004, 92, 255701.9 C. Vega, J. L. F. Abascal, E. Sanz, L. G. McDowell and C. McBride, J. Phys.: Condens.Matter, 2005, 17, S3283–S3288.
10 J. L. F. Abascal and C. Vega, J. Chem. Phys., 2005, 123, 234505.11 G. J. Kroes, Surf. Sci., 1992, 275, 365–382.12 J. F. Abascal and C. Vega, Phys. Chem. Chem. Phys., 2007, 9, 2775–2778.13 T. Ikeda-Fukazawa, J. Chem. Phys., 2004, 120, 1395–1401.14 M. A. Carignano, P. B. Shepson and I. Szleiefer, Mol. Phys., 2005, 103, 2957–2967.15 K. Bolton and J. B. C. Petterson, J. Phys. Chem. B, 2000, 104, 1590–1595.16 J. F. Abascal, R. G. Fernandez, C. Vega and M. A. Carignano, J. Chem. Phys., 2006, 125,
16601.17 J. A. Hayward and J. R. Reimers, J. Chem. Phys., 1997, 106, 1518–1529.18 W. Smith and T. R. Forester, J. Mol. Graphics, 1996, 14, 136–141.19 K. Rottger, A. Endriss, J. Ihringer, S. Doyle and W. F. Kuhs, Acta Crystallogr., Sect. B,
1994, 50, 644–648.20 J. VandeVondele, M. Krack, F. Mohamed, M. Parrinello, T. Chassaing and J. Hutter,
J. Comput. Phys. Commun., 2005, 167, 103.21 J. P. Perdew, K. Burke and M. Ernzerhof, Phys. Rev. Lett., 1996, 77, 3865; J. P. Perdew,
K. Burke and M. Ernzerhof, Phys. Rev. Lett., 1997, 78, 1396.22 S. Goedecker, M. Teter and J. Hutter, Phys. Rev. B, 1996, 58, 3641.23 M. Krack, Theor. Chem. Acc., 2005, 114, 145.24 K. T. Gillen, D. C. Douglass and M. J. R. Hoch, J. Chem. Phys., 1972, 57, 5117.25 H. Itoh, K. Kawamura, T. Hondoh and S. Mae, J. Chem. Phys., 1996, 105, 2408–2413.
This journal is ª The Royal Society of Chemistry 2009 Faraday Discuss., 2009, 141, 277–292 | 291

26 M. de Koning, A. Antonelli, A. J. R. de Silva and A. Fazzio, Phys. Rev. Lett., 2006, 97,155501.
27 C. Thierfelder, A. Hermann, P. Schwerdtfeger and W. G. Schmidt, Phys. Rev. B, 2006, 74,045422.
28 B. Santra, A. Michaelides and M. Scheffler, J. Chem. Phys., 2007, 127, 184104.29 X. L. Hu and A. Michaelides, Surf. Sci., 2008, 602, 960–974.30 G. A. Tribello and B. Slater, Chem. Phys. Lett., 2005, 425, 246–250.31 T. K. Hirsch and L. Ojamae, J. Phys. Chem. B, 2004, 108(40), 15856–15864.32 J.-L. Kuo, Phys. Chem. Chem. Phys., 2005, 7, 3733–3737.33 S. J. Singer, J.-L. Kuo, T. K. Hirsch, C. Knight, L. Ojamae and M. L. Klein, Phys. Rev.
Lett., 2004, 94, 135701.34 N. H. Fletcher, Philos. Mag., 1992, B36, 109–115.35 X. Wei, P. B. Miranda, C. Zhang and Y. R. Shen, Phys. Rev. B, 2002, 66, 085401.
292 | Faraday Discuss., 2009, 141, 277–292 This journal is ª The Royal Society of Chemistry 2009