Embed Size (px)
Citation preview

econstorMake Your Publications Visible.
A Service of
zbwLeibniz-InformationszentrumWirtschaftLeibniz Information Centrefor Economics
Arezki, Rabah; Brückner, Markus
Working Paper
Commodity windfalls, polarization, and net foreignassets: Panel data evidence on the voracity effect
CESifo Working Paper, No. 3656
Provided in Cooperation with:Ifo Institute – Leibniz Institute for Economic Research at the University of Munich
Suggested Citation: Arezki, Rabah; Brückner, Markus (2011) : Commodity windfalls,polarization, and net foreign assets: Panel data evidence on the voracity effect, CESifo WorkingPaper, No. 3656, Center for Economic Studies and ifo Institute (CESifo), Munich
This Version is available at:http://hdl.handle.net/10419/53130
Standard-Nutzungsbedingungen:
Die Dokumente auf EconStor dürfen zu eigenen wissenschaftlichenZwecken und zum Privatgebrauch gespeichert und kopiert werden.
Sie dürfen die Dokumente nicht für öffentliche oder kommerzielleZwecke vervielfältigen, öffentlich ausstellen, öffentlich zugänglichmachen, vertreiben oder anderweitig nutzen.
Sofern die Verfasser die Dokumente unter Open-Content-Lizenzen(insbesondere CC-Lizenzen) zur Verfügung gestellt haben sollten,gelten abweichend von diesen Nutzungsbedingungen die in der dortgenannten Lizenz gewährten Nutzungsrechte.
Terms of use:
Documents in EconStor may be saved and copied for yourpersonal and scholarly purposes.
You are not to copy documents for public or commercialpurposes, to exhibit the documents publicly, to make thempublicly available on the internet, or to distribute or otherwiseuse the documents in public.
If the documents have been made available under an OpenContent Licence (especially Creative Commons Licences), youmay exercise further usage rights as specified in the indicatedlicence.
www.econstor.eu

Commodity Windfalls, Polarization, and Net Foreign Assets: Panel Data Evidence
on the Voracity Effect
Rabah Arezki Markus Brückner
CESIFO WORKING PAPER NO. 3656 CATEGORY 7: MONETARY POLICY AND INTERNATIONAL FINANCE
NOVEMBER 2011
An electronic version of the paper may be downloaded • from the SSRN website: www.SSRN.com • from the RePEc website: www.RePEc.org
• from the CESifo website: Twww.CESifo-group.org/wp T
CESifo Working Paper No. 3656
Commodity Windfalls, Polarization, and Net Foreign Assets: Panel Data Evidence
on the Voracity Effect
Abstract This paper examines the effects that windfalls from international commodity price booms have on net foreign assets in a panel of 145 countries during the period 1970-2007. The main finding is that windfalls from international commodity price booms lead to a significant increase in net foreign assets, but only in countries that are ethnically homogeneous. In highly ethnically polarized countries, net foreign assets significantly decreased. To explain this asymmetry, the paper shows that in ethnically polarized countries commodity windfalls lead to large increases in government consumption expenditures and political corruption. The paper's findings are consistent with theoretical models of the current account that have a built-in voracity effect.
JEL-Code: F320, Q330, Z100.
Keywords: commodity windfalls, net foreign assets, polarization.
Rabah Arezki International Monetary Fund
Washington / USA [email protected]
Markus Brückner University of Adelaide Adelaide / Australia
May 2011 The authors thank two anonymous referees and the editor Eric van Wincoop for useful comments and suggestions. Bruckner gratefully acknowledges the financial support of the Spanish Ministry of Science and Technology provided by CICYTECO2008-04997. The views in this paper are those of the author(s) alone and do not necessarily represent those of the IMF or IMF policy.

2
1. Introduction
Basic intertemporal theory of the current account predicts that countries which experience
temporary revenue windfalls from international commodity price booms should experience an
increase in their net foreign assets (e.g. Obstfeld and Rogoff, 1995).1 Because a large share of these
revenue windfalls often accrues to the government, this key prediction may not hold however in the
data -- there is the common pool problem that counteracts the standard consumption smoothing
effect. Lane and Tornell (1998a) show in a non-representative agent model that when there are
multiple powerful groups that seek redistribution from the public budget a revenue windfall will
lead to large increases in government spending, and thus, depending on the degree of polarization of
the fiscal claimants, induce a current account deterioration.2 An important implication of the model
of Lane and Tornell is that the relationship between wealth shocks and the current account is
nonlinear. In particular, it may be negative in highly polarized countries.
This paper uses panel data for 145 countries during the period 1970-2007 to rigorously
examine the relationship between wealth shocks from international commodity price booms and
changes in countries' net foreign assets. A key advantage of the paper's panel data approach is that it
allows to examine the relationship between commodity windfalls and changes in net foreign assets
based on exclusively the within-country variation of the data. The within-country approach not only
makes the results more readily comparable to macro models, which are naturally about a within-
country time-series relationship. The within-country approach also allows to circumvent a
potentially important cross-sectional omitted variables bias. A further important feature of the
paper's empirical analysis is that, because the commodity export price index is constructed by
interacting the fixed (i.e. time-invariant) country-specific export shares with the international
1 Under certain preference parameters more advanced models of the current account which are based on the
intertemporal representative agent theory can generate a decrease in net foreign assets following positive transitory
wealth shocks. We show in this paper that the mechanism set out by these models is however in contrast with what
we find in the data regarding the responses of GDP per capita, investment, and, in particular, government
consumption expenditures and political corruption.
2 See also Lane and Tornell (1996, 1998b) and Tornell and Lane (1998) for further models on the voracity effect.

3
commodity prices, the time-series variation in the export price index constitutes for most countries a
plausibly exogenous source of wealth shocks.
The paper's first main finding is that the average marginal effect of commodity price
windfalls on net foreign assets is positive but statistically insignificant. This is true for the impact
effect as well as for lagged effects, and holds regardless of whether a static or dynamic panel data
model is estimated. Moreover, there is also no significant average effect on changes in net foreign
assets when distinguishing between price changes of minerals and hydrocarbon resources, which
tend to be more persistent, and price changes of agricultural commodities, which tend to be more
transitory. The paper's first main finding therefore stands in contrast with traditional intertemporal
models of the current account. It is however consistent with the well-known Feldstein-Horioka
(1980) puzzle that changes in savings do not feed one-to-one into the current account.
The paper's second main finding is that the marginal effect of revenue windfalls from
commodity price booms on net foreign assets is significantly smaller in countries that are
characterized by high levels of ethnic polarization. This cross-country heterogeneity in the
relationship is so strong that in countries with very high levels of ethnic polarization commodity
windfalls lead to a decrease in net foreign assets. On the other hand, in countries with low levels of
ethnic polarization commodity windfalls lead to a significant increase in net foreign assets. While
the increase in net foreign assets in the ethnically homogenous countries can be well explained by
standard intertemporal models of the current account, the acyclical average response, and, in
particular, the negative response in the highly ethnically polarized countries cannot.
What makes it particularly difficult for standard models of the current account to explain the
negative effect of commodity price booms on the net foreign asset position in the ethnically
polarized countries is that in these countries investment significantly decreased. Clearly, standard
intertemporal models can generate a decrease in the net foreign asset position following a

4
commodity price boom if the boom is of permanent nature.3 But, in that case there should be also
no decrease in investment. The fact that in ethnically polarized countries investment significantly
decreased following a commodity price boom is a first indication that the voracity model developed
by Lane and Tornell is consistent with the paper's empirical results.
As a further intermediate channel on the voracity effect of commodity price windfalls in
ethnically polarized countries, the paper documents that increases in the international prices of
exported commodity goods lead to large and statistically significant increases in government
consumption expenditures. These increases in government consumption expenditures were
associated with significant increases in political corruption in the ethnically polarized countries.
Also GDP per capita growth did not increase significantly following the commodity price windfall
in these countries – despite the significant increase in government consumption expenditures. On
the other hand, in the ethnically homogeneous countries, where the commodity price windfall led to
a significant improvement of the current account, GDP per capita growth significantly increased
following the commodity price boom.
In terms of measuring the power concentration of groups, an important feature of the paper's
empirical analysis is the use of an ethnic polarization index. In contrast to a fractionalization index
which is strictly increasing in the number of groups, the polarization index is largest when there are
two groups which are of equal size. The polarization index therefore captures that power struggles
are maximized when there are two equally powerful groups that lobby (or fight) for resources.4 As
the number of groups increase, the polarization index decreases. This is an important characteristic
of the polarization index because a key result of the Lane and Tornell voracity model is that the
3 Depending on other factors, such as for example the anticipation of the revenue windfall, the elasticity of
substitution between tradables and nontradables, or the degree of precautionary saving a transitory revenue windfall
from a commodity price boom can also generate a decrease in net foreign assets in the standard intertemporal model.
See for example Svensson and Razzin (1983), Persson and Svensson (1985), Backus et al. (1994), Mendoza (1995),
or Carroll and Jeanne (2009). But, investment and output usually increases in these models following a positive
terms of trade shock. Empirical papers that have examined the relationship between the terms of trade and the
current account include among others Milesi-Ferretti and Razin (1998), Loayza et al. (2000), Calderon et al. (2002),
or Cashin and McDermott (2002). These papers focus on the average effect and do not investigate the role of ethnic
polarization in determining the relationship.
4 See for example Esteban and Ray (1994, 1999) or Montalvo and Reynal-Querol (2005a,b).

5
voracity effect is largest when there are two powerful groups, and diminishes as the number of
groups increase.
The remainder of our paper is organized as follows. In Section 2 we describe and contrast the
intertemporal representative agent mechanism of the current account with the political economy
voracity mechanism. In Section 3 we describe our data and in Section 4 we explain our estimation
strategy. In Section 5 we present our main empirical results. And in Section 6 we conclude.
2. Intertemporal Representative Agent vs. Voracity Political Economy Mechanism
We begin this section by briefly reviewing the mechanism through which a commodity windfall
affects the current account in the standard intertemporal representative agent model. We then
contrast this mechanism to the political economy voracity mechanism that is contained in the model
of Lane and Tornell (1998a).
To lay grounds, it is useful to recall from the basic income accounting identity that the
current account is equal to the difference between domestic savings and private investment:
In the basic intertemporal representative agent model (see for example Obstfeld and Rogoff, 1995,
Section 3.1.1) the key mechanism through which a transitory wealth shock affects the current
account is the intertemporal smoothing of consumption of the representative agent. Without
frictions in the financial markets, the intertemporal theory predicts perfect consumption smoothing
over the life-cycle. Thus, in the presence of a temporary wealth shock current consumption of the
representative agent reacts little and the representative agent has to decide how to allocate the
additional savings between domestic capital and foreign assets. If there are diminishing returns to
domestic capital, then domestic investment will not respond because the transitory wealth shock
does not affect the productivity of domestic capital. The additional savings will therefore be
invested in foreign assets, leading to a current account increase.
An important extension of the basic intertemporal model in relation to our empirical study of
IGCYISCA

6
the effects that wealth shocks from international commodity price booms have on the current
account is the presence of nontradeable goods.5 When the international prices of tradeable goods
change the intertemporal consumption decision of the representative agent is affected much in the
same way as changes in the interest rate affect the intertemporal decision to consume. However,
while the size of the percentage change in the consumption response to changes in the interest rate
depends exclusively on the intertemporal elasticity of substitution, the size – and the sign – of the
consumption response to changes in the international prices of tradeables depends on both the
intertemporal elasticity of substitution and the intratemporal elasticity of substitution between
tradeables and non-tradeables.6 Intuitively, this is because when the international prices of
tradeables are temporarily high the representative household faces a tradeoff between foregoing
current consumption and reaping the benefits of the temporarily higher prices in the international
commodity market; or increasing current consumption and reaping the benefits of the temporarily
cheaper (relative) domestic prices of nontradeables. Hence, in the presence of a temporary
commodity windfall that increases income and the relative price of tradeables current consumption,
and thus the current account, can either increase or decrease – depending on the constellation of
preference parameters.
The underlying mechanism of the voracity model that explains potential cross-country
differences in the response of the current account is very different. Rather than predicting a
heterogeneous response of the current account to transitory wealth shocks as a function of cross-
country differences in preference parameters, the non-representative agent voracity model predicts
that the response of the current account to a transitory wealth shock crucially depends on the
5 See for example Section 3.1.4 of Obstfeld and Rogoff (1995); and also the empirical studies of Bergin and Sheffrin
(2000) and Iscan (2000). We are grateful to an anonymous referee for motivating us to discuss this extension.
6 Formally, under a CES utility function the Euler equation is ΔlnCt+1=σln(1+rt+1)+(σ-ρ)(ΔlnPt+1T-ΔlnPt+1
NT), where
ΔlnCt+1 is the change of the log of consumption between between period t and t+1; rt+1 is the interest rate; ΔlnPt+1T
is
the change of the log of the price of tradeables between period t and t+1; ΔlnPt+1NT
is the change of the log of the
price of nontradeables between period t and t+1; σ is the intertemporal elasticity of substitution; and ρ is the
intratemporal elasticity of substitution between tradeables and non-tradeables. See for example Obstfeld and Rogoff
(1995) Section 3.1.4.

7
structure of fiscal claimants. The main idea is that when there are several powerful groups that seek
to appropriate revenues from the government budget (which represents a common pool problem) a
voracity effect can occur where a temporary wealth shock that increases government tax revenues
leads to a disproportional increase in government spending. Lane and Tornell (1998a) show that this
voracity effect is strongest when there are two powerful groups. In this case, a temporary wealth
shock leads to a very large increase in government expenditures that drives down the current
account, while at the same time leading to a decrease in investment.
In sum, there are two main differences between the approach of the political economy
voracity model and the representative agent intertemporal model. First, the focus on the fiscal sector
as a main driving force for changes in the current account. Second, and perhaps more importantly
for explaining cross-country differences in the response of the current account to commodity
windfalls, the focus on the polarization of groups that seek to obtain revenues from the government
budget. This second focus on differences in polarization provides the basis for testing empirically in
a world-wide sample of countries how the current account responds to revenue windfalls from
international commodity price booms as a function of cross-country differences in polarization.
As discussed in the second paragraph of this section, the intertemporal model can also
generate cross-country differences in the response of the current account as a function of differences
in preference parameters. These differences in preference parameters are certainly difficult to
estimate consistently with real data in a world-wide sample of countries. One would have to argue
therefore on a theoretical basis, that cross-country differences in polarization go hand-in-hand with
cross-country differences in preference parameters regarding the intertemporal and intra-temporal
elasticity of substitution. We believe that this debate goes beyond the realm of this paper. However,
it is useful to note that in the voracity model there is a clear prediction that the difference in the
current account response should be due to a difference in government expenditures, and this is
something that we can test with data. Also, the voracity model predicts that these government

8
expenditures are socially sub-optimal, an element that is not contained in the standard intertemporal
approach of the current account. Hence, it will be natural to examine whether there is an adverse
response of GDP per capita growth, private investment, and corruption in the polarized countries. If
this is indeed the case, then the alternative possibility that these differences in the current account
are driven by differences in preference parameters related to the inter- and intra-temporal elasticity
of substitution becomes unlikely. We now explain in detail our data and estimation strategy and
then follow with a discussion of our main empirical results.
3. Data
Commodity Windfalls. To capture revenue windfalls from international commodity price booms,
we construct a country-specific international commodity export price index:
where ComPricec,t is the international price of commodity c in year t, and θi,c is the average (time-
invariant) value of exports of commodity c in the GDP of country i. The data on annual
international commodity prices are for the 1970-2007 period from UNCTAD Commodity Statistics.
Data on the value of commodity exports are from the NBER-United Nations Trade Database. The
commodities included in the commodity export price index are aluminum, beef, coffee, cocoa,
copper, cotton, gold, iron, maize, oil, rice, rubber, sugar, tea, tobacco, wheat, and wood. In case
there were multiple prices listed for the same commodity a simple average of all the relevant prices
is used.
Polarization. Data on ethnic polarization are from Montalvo and Reynal-Querol (2005a,b). The
Montalvo and Reynal-Querol polarization index is constructed as:
where πir is the proportion of people who belong in country i to group r. Formally, this polarization
N
r rk
ikiriPol1
24
Cc
tcticiComPriceComPI ,
,,

9
index measures the normalized distance of a particular distribution of groups from a bimodal
distribution. The index is maximized when there are two groups which are of equal size. The index
emphasizes therefore that conflict tensions are greatest when there are two equally powerful groups.
Note that the polarization index differs from the well-known fractionalization index. The
fractionalization index is defined as:
A key property of the fractionalization index is that, in contrast to the polarization index, it is
strictly increasing in the number of groups. Intuitively, the fractionalization index measures the
probability that two randomly selected individuals in a country will not belong to the same group.
For further discussion on fractionalization vs. polarization with an application to conflict, see
Montalvo and Reynal-Querol (2005a,b).
We furthermore note that for purposes of examining empirically whether there is a voracity
effect, the polarization index is much better suited than the index of fractionalization. This is
because the voracity model of Lane and Tornell predicts that the voracity effect is strongest when
there are two equally powerful groups; that there is no voracity effect when the number of groups is
equal to one; and that the voracity effect decreases as the number of groups increases beyond two.
This is precisely what the polarization index captures. The fractionalization index, on the other
hand, is linearly increasing in the number of groups. Therefore, it does not capture the non-linearity
predicted by the Lane and Tornell model. In the empirical exercise we therefore concentrate on the
polarization index and show as a robustness check results that use the index of fractionalization.
Net Foreign Assets and Other Data. Our annual data on net foreign assets are from Lane and
Milessi-Ferretti (2007). These data are standard and do not require further description here as a
detailed description can be found in the paper of Lane and Milessi-Ferretti (2007). Real GDP per
capita, total investment, and government consumption expenditures data are from the Penn World
N
r
iriFrac1
21

10
Table, version 6.3 (Heston et al., 2009). The data on the net barter terms of trade are from WDI
(2010). The data on political corruption and the risk of expropriation are from Political Risk Service
(2010) and Kaufmann et al. (2009). Tables 1 and 2 report some summary statistics of these
variables.
4. Estimation Strategy
To examine the effects that commodity price windfalls have on net foreign assets and other key
variables of interest we estimate the following econometric model:
where αi are country fixed effects that capture time-invariant country-specific unobservables and βt
are year fixed effects that capture common year shocks. ui,t is an error term that is clustered at the
country level. NFAit is the share of net foreign assets in GDP and ΔComPIit is the change of the log
of the international commodity export price index.
As a baseline regression, we estimate the average marginal effect that commodity windfalls
have on net foreign assets in a world sample. We then examine how cross-country differences in
ethnic polarization affect the relationship between commodity windfalls and net foreign assets by
splitting the sample into different groups based on countries' ethnic polarization. As a robustness
check on whether the heterogeneity is driven by other factors we also present estimates of an
interaction model where the international commodity export price index is interacted with other
variables that could possibly induce cross-country differences in the relationship between
commodity windfalls and net foreign assets.
5. Main Results
Table 3 presents our estimates of the average marginal effect that commodity price windfalls have
on net foreign assets. Column (1) shows pooled least-squares estimates that are based on cross-
titititi uComPINFA ,,, )(

11
sectional as well as within-country data variation. In column (2) country fixed effects are included
to capture cross-country unobservable differences that are driving both the size of the commodity
windfall and the change in the country's net foreign assets. Column (3) adds year fixed effects to
control for global shocks such as for example the world business cycle or political events such as
the end of the Cold War that could affect both the overall yearly change in net foreign assets and the
change in international commodity prices.7 The main result is that windfalls from international
commodity price booms have a positive but statistically insignificant effect on the net foreign asset
position. And, there continues to be a positive but insignificant effect when adding further lags and
leads of the commodity price index (columns (4) and (5)), or when controlling for lagged changes
in net foreign assets (columns (6) and (7)).
A possible reason for the insignificant response of the net foreign asset position is that the
time-series dynamics of many of the international commodity prices are quite persistent (see the
Data Appendix Table 2). Table 4, columns (1) and (2) show however that there continues to be an
insignificant effect of commodity price windfalls on the net foreign asset position when
distinguishing between mineral and hydrocarbon commodity prices (which tend to be very
persistent) and agricultural commodity prices (which tend to be more transitory).
Our identifying assumption is that variations in the international commodity prices are a
plausibly exogenous source of variation in revenue windfalls. This assumption is reasonable for the
majority of countries in our sample as these countries are price takers on the international
commodity market. Hence, variations in the international commodity prices are exogenous to
within-country changes in politico-economic conditions, and hence to changes in net foreign assets.
There might however be a few countries where the price-taker assumption is less applicable. To
demonstrate that our results are not driven by these observations, we report in column (3) of Table 4
results where we exclude large commodity exporting countries. As column (3) shows, there is no
7 Both the country and year fixed effects are jointly significant with a p-value of 0.000.
12
significant average effect of commodity price windfalls on countries' net foreign assets positions
when we exclude potentially large commodity exporting countries.8
The results change substantially when grouping countries according to their levels of ethnic
polarization. Column (1) of Table 5 shows that there is a highly significant positive average effect
of revenue windfalls on the net foreign asset position in countries that are in the bottom 25th
percentile of the cross-country ethnic polarization distribution. Column (2) shows that the effect of
commodity windfalls on the net foreign asset position is also positive in the group of countries that
are in the bottom 50th percentile. But the coefficient is quantitatively smaller and statistically only
significant at the 10% level. Moving to the top 50th percentile (column (3)) the effect of commodity
windfalls on the net foreign asset position is statistically insignificant and quantitatively only about
60% of the size of the estimated average marginal effect of the bottom 25th percentile. Moving to
the top 25th percentile (column (4)) the average marginal effect is also statistically insignificant and
only about one-tenth of the estimated average marginal effect of the bottom 25th percentile.9
What explains this asymmetry in the relationship? Table 6 shows that commodity price
revenue windfalls had a significant positive effect on the terms of trade in the group of countries
with high and low degrees of ethnic polarization. Therefore, it is not the case that changes in the
international commodity prices had no significant effect on the terms of trade in the ethnically
polarized countries. In fact, Panel A of Appendix Table 2 shows that through their effects on the
8 The rule for excluding countries is that they produce for a given commodity good more than 3% of the world
commodity supply. The excluded countries are Algeria, Australia, Brazil, Canada, China, Colombia, Cuba, Denmark, Dominican Republic, Egypt, Finland, France, Indonesia, India, Iraq, Iran, Kenya, Kuwait, Liberia, Libya, Malaysia, Mauritius, Mexico, New Zealand, Nigeria, Norway, Pakistan, Philippines, Russia, Saudi Arabia, Sweden, Singapore, South Africa, Sudan, Thailand, Turkey, Uganda, United States, United Kingdom, United Arab Emirates, and Venezuela.
9 We note that the time-series properties of the majority of the commodity prices in our commodity price index
indicates, that what our regressions are capturing is the response of the current account to transitory revenue
windfalls. We also made an attempt to isolate those shocks that were on average very persistent, by focusing on the
three most persistent commodity prices (iron, oil, and copper) where the AR(1) coefficient on these prices is almost
unity (1.03, 0.97, and 0.95 respectively). Hence, variations in these prices represent a shock that is very persistent.
Appendix Table 1 shows that if we use these very persistent commodity price shocks, then results are similar: the
current account improves due to a positive commodity price windfall in the countries where polarization is low
while in the countries where polarization is high the current account response is negative, albeit statistically
insignificant. Thus, even if we use only these commodity prices that are very persistent the main finding that the
response of the current account to windfalls varies significantly as a function of cross-country differences in
polarization continues to hold.

13
terms of trade commodity windfalls had a significant positive effect on the net foreign asset position
in the group of countries with low ethnic polarization and an insignificant effect in the group of
countries with high polarization. Panel B of Appendix Table 2 also shows that similar results are
obtained when directly regressing the change in net foreign assets on the change in the terms of
trade.10
Table 7 provides a first explanation for the difference in the relationship between
commodity windfalls and net foreign assets. The table shows that while in the ethnically polarized
countries investment significantly decreased following the commodity windfall, in the group of
countries with very low ethnic polarization investment significantly increased.11
Standard models of
the current account readily predict the significant increase in investment following the commodity
boom (e.g. Obstfeld and Rogoff, 1995). But, they do not readily predict the significant decrease in
the ethnically polarized countries. On the other hand, the voracity model of Lane and Tornell does
predict a significant decrease in investment in ethnically polarized countries.
To explore further the voracity channel, Table 8 reports estimates of the effect that
commodity price windfalls have on GDP growth, government consumption expenditures,
corruption, and the risk of expropriation for the above and below median sample ethnic polarization
group. Column (1) of Panel A shows that, consistent with the investment response documented in
Table 7, there is a negative albeit insignificant effect of commodity price windfalls on GDP per
10 Using directly the net barter terms of trade in the least squares estimation may be problematic because within-
country changes in the net barter terms of trade are driven also by within-country changes in the quantities of the
commodities produced as well as changes in the commodity exporting country's trade policies (e.g. changes in
import and export taxes, quotas, etc.). Therefore, within-country changes in the net barter terms-of-trade are much
less exogenous to changes in countries' politico-economic conditions, and thus to changes in the current account,
than changes in our international commodity export price index. We also note that in the model of Lane and Tornell
(1998a), what is crucial for the voracity effect to occur is that the wealth shock affects tax revenues that accrue to
the government budget. In principal, a change in the quantity of exports can induce a change in government tax
revenues just like a change in the international price of the exported commodity good does in the case of an ad-
valorem tax on commodity exports. However, this abstracts from the possibility that a significant part of production
could occur in the shadow economy. If the increase of the quantity of the exported commodity good occurs in the
shadow economy, then the additional production of the exported commodity good will be out of reach from
government taxes. In this case, government tax revenues are unlikely to be affected much by the increase in the
production of the commodity good. Hence, one additional advantage of using variations in an international export
price index is that these variations in the international commodity prices should feed more directly into changes of
tax revenues in the commodity exporting countries.
11 The investment series includes both public and private investment.

14
capita growth in the high ethnic polarization sample. Panel B shows on the other hand that in the
low ethnic polarization sample commodity price windfalls had a significant positive effect on GDP
per capita growth. Also consistent with the voracity model, column (2) shows that there is a
significant increase in government consumption expenditures in the above median ethnic
polarization group while in the below median ethnic polarization group the response of government
consumption expenditures to commodity windfalls is insignificant. Furthermore, columns (3) and
(4) of Panel A show that in the above median ethnic polarization group corruption and the risk of
expropriation significantly increased, while Panel B shows that in the below median ethnic
polarization sample corruption and the risk of expropriation did not increase significantly.
An important robustness check that goes beyond these intermediate channels is whether the
heterogeneity in the effect that commodity price windfalls have on net foreign assets survives when
controlling for other alternative factors that can drive the cross-country parameter heterogeneity.
One obvious control variable that can possibly drive cross-country parameter heterogeneity is ethnic
fractionalization. As discussed in Section 2, the ethnic fractionalization index is strictly increasing
in the number of ethnic groups while the ethnic polarization index is maximized when there are two
groups which are of equal size.
Column (1) of Table 9 shows that the marginal effect of commodity price windfalls on net
foreign assets significantly decreases in ethnic polarization when controlling for a possible
interaction effect between commodity windfalls and ethnic fractionalization. The interaction
estimate in column (1) implies that in the most ethnically polarized countries a commodity windfall
had a significant negative effect on the net foreign asset position. Consistent also with the Lane and
Tornell voracity model, column (1) shows that the ethnic fractionalization interaction term is
significantly positive. This means that commodity windfalls had a stronger positive effect on the net
foreign asset position in countries where there are many different ethnic groups.
Column (2) of Table 9 shows that the nonlinearity in the relationship between commodity

15
windfalls and net foreign assets is not due to the polarization and fractionalization index possibly
picking up a diminishing or increasing returns to scale effect of commodity windfalls on net foreign
assets. In addition, column (3) documents that there continues to be a significant negative
interaction effect between commodity price windfalls and polarization when controlling for
differences in the relationship that are due to countries being debtor or credit countries.12
In order to allow for a possible difference in the relationship between commodity windfalls
and net foreign assets in rich and poor countries, column (4) of Table 9 adds to the regression an
additional interaction term between commodity price windfalls and cross-country differences in
average per capita GDP. The main result is that the ethnic polarization interaction continues to be
negative and statistically significant at the conventional confidence level.
Only when controlling in column (5) for an interaction effect between commodity windfalls
and cross-country differences in political corruption does the interaction effect between commodity
windfalls and ethnic polarization turn insignificant. Political corruption entails excessive fiscal
resource appropriation by powerful groups and so this is precisely the channel through which net
foreign assets decrease in the voracity model. Hence, the result in column (5) that beyond its effect
on political corruption the role of ethnic polarization is insignificant in shaping the net foreign asset
response to commodity windfalls is consistent with the mechanism of fiscal resource appropriation
laid out in the voracity model of Lane and Tornell.
As a robustness check on our main and preferred measure of polarization, Panel A of Table
10 presents results when using instead of the ethnic polarization measure a measure of countries'
religious polarization.13
The main finding is that more religious polarization significantly reduces
the effect that wealth shocks from commodity windfalls have on countries' net foreign asset
position. Column (1) of Table 10 shows that there is a highly significant positive average effect of
12 Kraay and Ventura (2000) derive a theoretical model that shows that the relationship between terms of trade shocks
and net foreign assets should be different in debtor and creditor countries.
13 Data on religious polarization are from Montalvo and Reynal-Querol (2005b). The unconditional sample correlation
between religious and ethnic polarization is 0.29.

16
commodity windfalls on the net foreign asset position in countries that are in the bottom 25th
percentile of the cross-country religious polarization distribution. Column (2) shows that the effect
of commodity windfalls on the net foreign asset position is also positive in the group of countries
that are in the bottom 50th percentile. But the coefficient is quantitatively smaller and statistically
only significant at the 5% significance level. Moving to the top 50th percentile (column (3)) and
25th percentile (column (4)) shows that the effect of commodity windfalls on the net foreign asset
position is statistically insignificant and quantitatively much smaller in absolute size. Panel B shows
that similar results are obtained when using as a measure of polarization the interaction between
ethnic and religious polarization. In sum, these results echo our main finding that the effects of
wealth shocks from commodity windfalls on net foreign assets are significantly smaller in countries
where groups are highly polarized.
6. Conclusion
This paper showed that the positive effect of windfalls from international commodity price booms
on countries' net foreign asset positions is significantly decreasing in cross-country differences in
polarization. Standard intertemporal models of the current account have difficulties in explaining
this result, in particular, because in the highly polarized countries the commodity windfall led to a
significant decrease in investment. On the other hand, the non-representative agent model
developed in Lane and Tornell (1998a) that generates a voracity effect is consistent with the paper's
finding of a negative response in both the current account and investment in the highly polarized
countries. The paper showed that consistent with the voracity model the commodity windfall led to
a large increase in government consumption expenditures and corruption in polarized countries,
while in the ethnically homogeneous countries government consumption expenditures and
corruption did not increase significantly.

17
References
Backus, D., P. Kehoe, and F. Kydland (1994). "Dynamics of the Trade Balance and the Terms of
Trade: The J-Curve?" American Economic Review 84: 84-103.
Bergin, P. and S. Sheffrin (2000). "Interest Rates, Exchange Rates, and Present Value Models of the
Current Account." Economic Journal 110: 535-558.
Calderon, C., A. Chong, and N. Loayza (2002). "Determinants of Current Account Deficits in
Developing Countries." B.E. Journal of Macroeconomics 2 (1).
Carroll, C. and O. Jeanne (2009). "A Tractable Model of Precautionary Reserves, Net Foreign
Assets, or Sovereign Wealth Funds." NBER Working Papers 15228, National Bureau of
Economic Research, Inc.
Cashin, P. and C. McDermott (2002). "Terms of Trade Shocks and the Current Account: Evidence
from Five Industrial Countries." Open Economies Review 13: 219-235.
Esteban, J., and D. Ray (1994). “On the Measurement of Polarization.” Econometrica 62: 819– 851.
Esteban, J. and D. Ray (1999). “Conflict and Distribution.” Journal of Economic Theory 87: 379-
415.
Feldstein, M. and C. Horioka (1980). "Domestic Savings and International Capital Flows."
Economic Journal 40: 314-329.
Heston, A., R. Summers and B. Aten (2009). "Penn World Table Version 6.3", Center for
International Comparisons of Production, Income and Prices at the University of
Pennsylvania, August 2009.
Iscan, T. (2000). "The Terms of Trade, Productivity Growth, and the Current Account." Journal of
Monetary Economics 45: 587-611.

18
Kaufmann, D., A. Kraay, and M. Mastruzzi (2009). "Governance Matters VIII: Aggregate and
Individual Governance Indicators, 1996-2008. World Bank Policy Research Working Paper
No. 4978.
Kraay, A. and J. Ventura (2000). "Current Accounts in Debtor and Creditor Countries." Quarterly
Journal of Economics 115: 1137-1166.
Loayza, N., K. Schmidt-Hebbel, and L. Serven (2000). "What Determines Private Saving Around
the World?" Review of Economics and Statistics 82: 165-181.
Lane, P. and A. Tornell (1996). Power, Growth, and the Voracity Effect." Journal of Economic
Growth 1: 213-241.
Lane, P. and A. Tornell (1998a). "Are Windfalls a Curse? A non-representative agent model of the
Current Account." Journal of International Economics 43: 83-112.
Lane, P. and A. Tornell (1998b). "Why Aren't Savings Rates Procyclical in Latin America?"
Journal of Development Economics 57: 185-1999.
Lane, P. and G. Milesi-Ferretti (2007). "The External Wealth of Nations Mark II. Revised and
Extended Estimates of Foreign Assets and Liabilities." Journal of International Economics
73: 223-250.
Milesi-Ferretti, G. and A. Razin (1998). "Sharp Reductions in Current Account Deficits: Empirical
Regularities." European Economic Review 42: 897-908.
Mendoza, E. (1995). "The Terms of Trade, the Real Exchange Rate, and Economic Fluctuations."
International Economic Review 36: 101-137.
Montalvo, J. and M. Reynal-Querol (2005a). "Ethnic Diversity and Economic Development."
Journal of Development Economics 76: 293-323.
Montalvo, J. and M. Reynal-Querol (2005b). "Ethnic Polarization, Potential Conflict and Civil
War." American Economic Review 95: 796-816.

19
Obstfeld, M. and K. Rogoff (1995). "The Intertemporal Approach to the Current Account." In
Handbook of International Economics, vol. 3, G. Grossman and K. Rogoff (eds.).
Amsterdam: Elsevier.
Political Risk Service Group (2010). International Country Risk Guide. Online Database.
Persson, T. and L. Svensson (1985). "Current Account Dynamics and the Terms of Trade:
Harberger-Laursen-Metzler Two Generations Later." Journal of Political Economy 93: 43-
65.
Svensson, L. and A. Razzin (1983). "The Terms of Trade and the Current Account: The Harberger-
Laursen-Metzler Effect. Journal of Political Economy 91: 97-125.
Tornell, A. and P. Lane (1999). "The Voracity Effect." American Economic Review 89: 22-46.
Wooldridge, J. (2002). Econometric Analysis of Cross Section and Panel Data. Cambridge, Mass.:
MIT Press.
World Bank (2010). World Development Indicators (Washington D.C., World Bank).
20
Table 1. Summary Statistics
Mean Std. Dev. Min Max Obs.
ΔComPI 0.003 0.021 -0.092 0.439 4616
ΔNFA -0.004 0.565 -19.931 21.967 4616
ΔGDP 0.035 0.074 -1.107 0.985 4616
ΔGov 0.017 0.131 -2.135 1.719 4616
ΔTOT 0.089 0.189 -2.010 1.463 3494
ΔCorr -0.031 0.452 -3 3 2042
ΔExprop 0.075 1.195 -8 10 2042
Ethpol 0.502 0.246 0.017 0.982 3828
Ethfrac 0.459 0.291 0.009 0.958 3828
21
Table 2. Correlation Matrix
ΔComPI ΔNFA ΔTOT ΔGDP ΔGov ΔCorr ΔExprop Ethpol Ethfrac
ΔComPI 1
ΔNFA 0.040 1
ΔTOT 0.327 0.090 1
ΔGDP 0.027 0.055 0.371 1
ΔGov 0.073 -0.025 0.057 0.237 1
ΔCorr 0.018 0.014 0.072 0.023 0.026 1
ΔExprop 0.022 0.023 0.097 0.083 -0.059 0.037 1
Ethpol 0.045 0.001 -0.049 0.011 0.011 -0.011 0.042 1
Ethfrac 0.053 0.015 -0.016 0.053 0.053 0.000 0.027 0.615 1
22
Table 3. Commodity Windfalls and Net Foreign Assets
ΔNFA
(1) (2) (3) (4) (5) (6) (7)
LS LS LS LS LS LS SYS-GMM
ΔComPI 0.237
(0.58)
0.181
(0.39)
0.088
(0.17)
0.112
(0.22)
0.093
(0.19)
0.054
(0.10)
0.052
(0.08)
L.ΔComPI 0.492
(1.51)
0.457
(1.44)
L2.ΔComPI 0.117
(0.45)
0.034
(0.16)
F.ΔComPI -0.371
(-1.52)
L.ΔNFA -0.174
(-0.64)
-0.192
(-0.70)
Country FE No Yes Yes Yes Yes Yes Yes
Year FE No No Yes Yes Yes Yes Yes
Observations 4614 4614 4614 4518 4373 4469 4469
Countries 145 145 145 145 145 145 145
Note: The dependent variable is the change in the net foreign assets to GDP ratio. The method of estimation in columns (1)-(6) is least squares; column (7) system-GMM (Blundell and Bond, 1998). The t-values shown in parentheses below the point estimates are based on Huber robust standard errors that are clustered at the country level. *Significantly different from zero at 90 percent confidence, ** 95 percent confidence, *** 99 percent confidence.

23
Table 4. Commodity Windfalls and Net Foreign Assets
ΔNFA
Mineral and Oil
Commodities Only
Agricultural
Commodities Only
Excluding Large
Commodity Exporters
(1) (2) (3)
LS LS LS
ΔComPI 0.174
(0.31)
-0.856
(-0.26)
0.328
(0.39)
Country FE Yes Yes Yes
Year FE Yes Yes Yes
Observations 4614 4614 3214
Countries 145 145 106
Note: The dependent variable is the change in the net foreign assets to GDP ratio. The method of estimation is least squares; t-values (shown in parentheses) below the point estimates are based on Huber robust standard errors that are clustered at the country level. The commodities used in column (1) for the international commodity export price index are aluminium, copper, gold, iron, and oil. The commodities used in column (2) for the international commodity export price index are beef, coffee, cocoa, cotton, maize, rice, rubber, sugar, tea, tobacco, wheat, and wood. Column (3) uses all commodities but excludes Algeria, Australia, Brazil, Canada, China, Colombia, Cuba, Denmark, Dominican Republic, Egypt, Finland, France, Indonesia, India, Iraq, Iran, Kenya, Kuwait, Liberia, Libya, Malaysia, Mauritius, Mexico, New Zealand, Nigeria, Norway, Pakistan, Philippines, Russia, Saudi Arabia, Sweden, Singapore, South Africa, Sudan, Thailand, Turkey, Uganda, United States, United Kingdom, United Arab Emirates, and Venezuela. *Significantly different from zero at 90 percent confidence, ** 95 percent confidence, *** 99 percent confidence.

24
Table 5. Commodity Windfalls, Polarization, and Net Foreign Assets
ΔNFA
Ethpol <0.25 Ethpol <0.56 Ethpol >0.56 Ethpol >0.70
(1) (2) (3) (4)
LS LS LS LS
ΔComPI 0.781***
(4.59)
0.600*
(1.94)
0.481
(0.61)
0.081
(0.07)
Country FE Yes Yes Yes Yes
Year FE Yes Yes Yes Yes
Observations 737 1916 1912 729
Countries 21 54 53 20
Note: The dependent variable is the change in the net foreign assets to GDP ratio. ΔComPI is the change of the log of the international export price index. The method of estimation is least squares; t-values (shown in parentheses) below the point estimates are based on Huber robust standard errors that are clustered at the country level. *Significantly different from zero at 90 percent confidence, ** 95 percent confidence, *** 99 percent confidenc

25
Table 6. Commodity Windfalls, Polarization, and the Terms of Trade
ΔTOT
Ethpol <0.25 Ethpol <0.56 Ethpol >0.56 Ethpol >0.70
(1) (2) (3) (4)
LS LS LS LS
ΔComPI 1.985***
(11.18)
2.783***
(6.66)
1.976***
(8.42)
1.568***
(4.26)
Country FE Yes Yes Yes Yes
Year FE Yes Yes Yes Yes
Observations 644 1787 1707 722
Countries 18 51 53 21
Note: The dependent variable is the log-change in the terms of trade. ΔComPI is the change of the log of the international export price index. The method of estimation is least squares; t-values (shown in parentheses) below the point estimates are based on Huber robust standard errors that are clustered at the country level. *Significantly different from zero at 90 percent confidence, ** 95 percent confidence, *** 99 percent confidence.

26
Table 7. Commodity Windfalls, Polarization, and Investment
Ethpol <0.25 Ethpol <0.56 Ethpol >0.56 Ethpol >0.70
(1) (2) (3) (4)
LS LS LS LS
ΔComPI 1.856***
(3.46)
0.877
(1.04)
-0.441
(-1.17)
-0.773***
(-1.96)
Country Fe Yes Yes Yes Yes
Year Fe Yes Yes Yes Yes
Observations 778 2070 1912 729
Countries 21 55 58 23
Note: The dependent variable is the log of investment per capita. The method of estimation is least squares; t-values (shown in parentheses) below the point estimates are based on Huber robust standard errors that are clustered at the country level. *Significantly different from zero at 90 percent confidence, ** 95 percent confidence, *** 99 percent confidence.

27
Table 8. Commodity Windfalls, Growth, Government Spending, and Corruption
(Further Intermediate Channels)
ΔGDP ΔGov. Expenditure ΔCorruption ΔExpropriation
Panel A: High Ethnic Polarization
(1) (2) (3) (4)
ΔComPI -0.040
(-0.14)
0.240**
(1.96)
1.965***
(3.45)
8.791*
(1.73)
Country FE Yes Yes Yes Yes
Year FE Yes Yes Yes Yes
Observations 1911 1911 1009 1009
Countries 53 53 46 46
Panel B: Low Ethnic Polarization
(1) (2) (3) (4)
ΔComPI 0.277***
(4.13)
0.469
(1.58)
-1.709*
(-1.82)
-2.858
(-0.64)
Country FE Yes Yes Yes Yes
Year FE Yes Yes Yes Yes
Observations 1916 1916 1033 1033
Countries 54 54 48 48
Note: The dependent variable in column (1) is the change of the log of real per capita GDP; column (2) the change of the log of real per capita government expenditures; column (3) the change of the political corruption score (re-scaled so that higher values denote more corruption); column (4) the change of the risk of expropriation score (re-scaled so that higher values denote a higher risk of expropriation). The method of estimation is least squares; t-values (shown in parentheses) below the point estimates are based on Huber robust standard errors that are clustered at the country level. Panel A reports regressions for the sample of countries with above median ethnic polarization (ethpol>0.56). Panel B reports regressions for the sample of countries with below median ethnic polarization (ethpol<0.56). *Significantly different from zero at 90 percent confidence, ** 95 percent confidence, *** 99 percent confidence.

28
Table 9. Commodity Windfalls, Polarization, and the Current Account
(Additional Interactions)
Δ NFA
(1) (2) (3) (4) (5)
LS LS LS LS LS
ΔComPI 0.714*
(1.85)
0.780
(0.74)
-0.056
(-0.05)
-0.321
(-0.26)
-0.306
(-0.26)
ΔComPI*Ethpol -3.682**
(-2.18)
-3.686**
(-2.21)
-3.040**
(-2.13)
-2.673*
(-1.84)
-0.200
(-0.13)
ΔComPI*Ethfrac 4.534**
(2.32)
4.489**
(2.07)
2.581
(1.32)
2.764
(1.46)
-0.514
(-0.25)
ΔComPI2 -0.294
(-0.07)
0.925
(0.22)
1.563
(0.37)
2.212
(0.53)
ΔComPI*Debtor
Country
1.603**
(2.09)
1.897**
(2.42)
1.596**
(2.27)
ΔComPI*GDP p.c. 0.210
(1.12)
0.178
(1.06)
ΔComPI*Corruption -1.497***
(-3.64)
Country Fe Yes Yes Yes Yes Yes
Year Fe Yes Yes Yes Yes Yes
Observations 3828 3828 3828 3828 3828
Countries 107 107 107 107 107
Note: The dependent variable is the change in the net foreign assets to GDP ratio. ΔComPI is the change of the log of the international export price index. The method of estimation is least squares; t-values (shown in parentheses) below the point estimates are based on Huber robust standard errors that are clustered at the country level. *Significantly different from zero at 90 percent confidence, ** 95 percent confidence, *** 99 percent confidence.

29
Table 10. Commodity Windfalls, Polarization, and Net Foreign Assets
(Alternative Polarization Measures)
ΔNFA
Panel A: Measure is Religious Polarization
Relpol <0.13 Relpol <0.54 Relpol >0.54 Relpol >0.83
(1) (2) (3) (4)
LS LS LS LS
ΔComPI 1.073***
(4.68)
0.934**
(2.29)
0.153
(0.23)
0.187
(0.24)
Country FE Yes Yes Yes Yes
Year FE Yes Yes Yes Yes
Observations 1014 1933 1895 987
Countries 28 53 54 29
Panel B: Measure is Interaction Between Ethnic and Religious Polarization
Ethpol*Relpol <0.03 Ethpol*Relpol<0.22 Ethpol*Relpol >0.22 Ethpol*Relpol >0.51
(1) (2) (3) (4)
LS LS LS LS
ΔComPI 0.976***
(5.40)
0.931**
(2.26)
0.207
(0.35)
-0.046
(-0.07)
Country FE Yes Yes Yes Yes
Year FE Yes Yes Yes Yes
Observations 1014 1933 1895 987
Countries 28 53 54 29
Note: The dependent variable is the change in the net foreign assets to GDP ratio. ΔComPI is the change of the log of the international export price index. The method of estimation is least squares; t-values (shown in parentheses) below the point estimates are based on Huber robust standard errors that are clustered at the country level. *Significantly different from zero at 90 percent confidence, ** 95 percent confidence, *** 99 percent confidence.

30
Appendix Table 1. Persistent Commodity Windfalls, Polarization, and Net Foreign Assets
ΔNFA
Ethpol <0.25 Ethpol <0.56 Ethpol >0.56 Ethpol >0.70
(1) (2) (3) (4)
LS LS LS LS
ΔComPI [Iron, Oil,
and Copper only]
0.839***
(6.31)
1.244*
(1.87)
-0.025
(-0.04)
-0.819
(-0.76)
Country Fe Yes Yes Yes Yes
Year Fe Yes Yes Yes Yes
Observations 720 1751 1660 729
Countries 21 54 53 20
Note: The dependent variable is the change in the net foreign assets to GDP ratio. ΔComPI [Iron, Oil, and Copper only] refers to the change of the log of the international export price index that contains only prices of iron, oil and copper. The method of estimation is least squares; t-values (shown in parentheses) below the point estimates are based on Huber robust standard errors that are clustered at the country level. *Significantly different from zero at 90 percent confidence, ** 95 percent confidence, *** 99 percent confidence.

31
Appendix Table 2. The Terms of Trade, Polarization, and Net Foreign Assets
ΔNFA
Ethpol <0.25 Ethpol <0.56 Ethpol >0.56 Ethpol >0.70
(1) (2) (3) (4)
Panel A: Two-Stage Least-Squares
(IV is ΔComPI)
ΔTOT 0.417***
(7.68)
0.259***
(2.43)
0.157
(0.42)
-0.024
(-0.04)
First-Stage F-stat 124 44 65 32
Country Fe Yes Yes Yes Yes
Year Fe Yes Yes Yes Yes
Observations 639 1715 1610 651
Countries 18 50 47 19
Panel B: Least Squares
ΔTOT 0.173***
(2.76)
0.285***
(3.93)
0.308
(1.05)
-0.165
(-0.52)
Country Fe Yes Yes Yes Yes
Year Fe Yes Yes Yes Yes
Observations 639 1715 1610 651
Countries 18 50 47 19
Note: The dependent variable is the change in the net foreign assets to GDP ratio. The method of estimation in Panel A is two-stage least squares; Panel B least-squares. The instrumental variable in Panel A is the log-change of the international export price index. *Significantly different from zero at 90 percent confidence, ** 95 percent confidence, *** 99 percent confidence.

32
Data Appendix Table 1. List of Countries
33
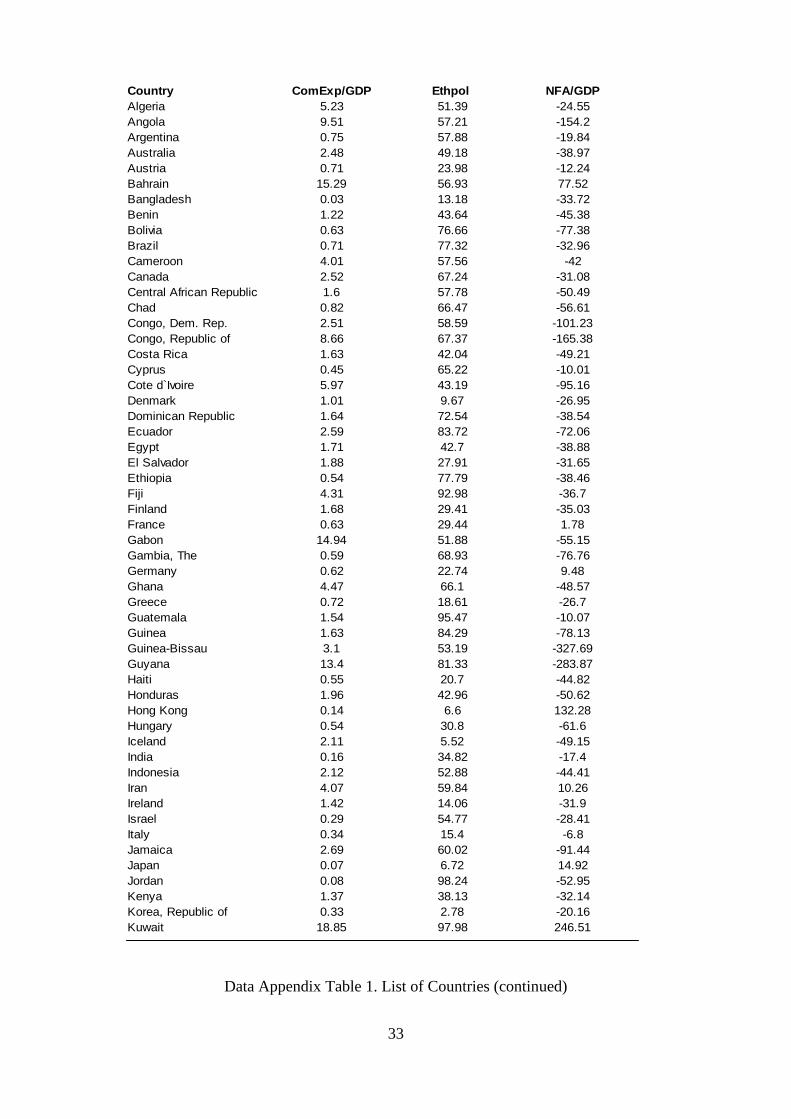
Data Appendix Table 1. List of Countries (continued)
Country ComExp/GDP Ethpol NFA/GDP
Algeria 5.23 51.39 -24.55
Angola 9.51 57.21 -154.2
Argentina 0.75 57.88 -19.84
Australia 2.48 49.18 -38.97
Austria 0.71 23.98 -12.24
Bahrain 15.29 56.93 77.52
Bangladesh 0.03 13.18 -33.72
Benin 1.22 43.64 -45.38
Bolivia 0.63 76.66 -77.38
Brazil 0.71 77.32 -32.96
Cameroon 4.01 57.56 -42
Canada 2.52 67.24 -31.08
Central African Republic 1.6 57.78 -50.49
Chad 0.82 66.47 -56.61
Congo, Dem. Rep. 2.51 58.59 -101.23
Congo, Republic of 8.66 67.37 -165.38
Costa Rica 1.63 42.04 -49.21
Cyprus 0.45 65.22 -10.01
Cote d`Ivoire 5.97 43.19 -95.16
Denmark 1.01 9.67 -26.95
Dominican Republic 1.64 72.54 -38.54
Ecuador 2.59 83.72 -72.06
Egypt 1.71 42.7 -38.88
El Salvador 1.88 27.91 -31.65
Ethiopia 0.54 77.79 -38.46
Fiji 4.31 92.98 -36.7
Finland 1.68 29.41 -35.03
France 0.63 29.44 1.78
Gabon 14.94 51.88 -55.15
Gambia, The 0.59 68.93 -76.76
Germany 0.62 22.74 9.48
Ghana 4.47 66.1 -48.57
Greece 0.72 18.61 -26.7
Guatemala 1.54 95.47 -10.07
Guinea 1.63 84.29 -78.13
Guinea-Bissau 3.1 53.19 -327.69
Guyana 13.4 81.33 -283.87
Haiti 0.55 20.7 -44.82
Honduras 1.96 42.96 -50.62
Hong Kong 0.14 6.6 132.28
Hungary 0.54 30.8 -61.6
Iceland 2.11 5.52 -49.15
India 0.16 34.82 -17.4
Indonesia 2.12 52.88 -44.41
Iran 4.07 59.84 10.26
Ireland 1.42 14.06 -31.9
Israel 0.29 54.77 -28.41
Italy 0.34 15.4 -6.8
Jamaica 2.69 60.02 -91.44
Japan 0.07 6.72 14.92
Jordan 0.08 98.24 -52.95
Kenya 1.37 38.13 -32.14
Korea, Republic of 0.33 2.78 -20.16
Kuwait 18.85 97.98 246.51

34

35
Note: The table lists countries' average commodity export to GDP ratio, their
average net foreign asset to GDP ratio, and their ethnic polarization index. All
numbers have been multiplied by 100.
Country ComExp/GDP Ethpol NFA/GDP
Liberia 18.56 39.04 -782.1
Madagascar 1.29 1.67 -62.9
Malawi 2.77 73.59 -82.91
Malaysia 5.55 76.16 -30.81
Mali 1.12 41.99 -70.9
Malta 0.83 16.71 28.28
Mauritania 5.88 53.61 -146.83
Mauritius 2.9 80.31 -10.06
Mexico 0.95 65.36 -35.63
Morocco 0.11 89.74 -42.19
Mozambique 0.79 49.86 -119.29
Nepal 0.08 65.18 -11.41
Netherlands 3.04 21.37 5.32
New Zealand 1.88 36.58 -62.28
Nicaragua 2.72 68.09 -243.17
Niger 0.4 69.77 -54.25
Nigeria 7.52 40.36 -63.85
Norway 5.98 9.02 -3.66
Oman 13.87 40.78 7.44
Pakistan 0.29 69.76 -38.05
Panama 1.09 58.62 -106.04
Papua New Guinea 10.81 66.87 -77.14
Paraguay 1.33 30.96 -12.85
Peru 1.26 81.7 -50.66
Philippines 0.68 49.65 -49.26
Poland 0.3 9.92 -40.58
Portugal 0.32 1.99 -35.58
Rwanda 0.96 40.13 -22.9
Samoa 0.71 38.78 -37.29
Saudi Arabia 13.53 11.39 75.96
Senegal 0.27 55.96 -57.45
Seychelles 2.68 60.02 -65.56
Sierra Leone 0.64 66.63 -90.85
South Africa 0.66 71.78 -24.36
Spain 0.27 69.33 -19.48
Sri Lanka 1.25 74.93 -39.76
Sudan 1.06 69.94 -152.6
Sweden 1.81 33.68 -18.63
Tanzania 1.73 27.1 -71.14
Thailand 1.16 58.23 -32.1
Togo 2.01 67.33 -82.43
Trinidad &Tobago 9.04 84.17 -61.11
Tunisia 1.08 16.73 -89.46
Turkey 0.42 34.24 -23.2
Uganda 2.35 27.86 -34.67
United Arab Emirates 17.41 64 197.02
United Kingdom 1.01 57.06 -0.21
United States 0.34 69.13 -4.06
Uruguay 1.35 42.64 -22.17
Venezuela 5.41 75.79 -3.29
Yemen 11.85 6.35 -15.58
Zambia 7.77 60.63 -157.55
Zimbabwe 1.21 69.78 -41.61
Average 3.17 49.96 -50.38

36
Data Appendix Table 2. List of Commodities
Commodity AR(1) Coefficient
(Standard Error)
Commodity AR(1) Coefficient
(Standard Error)
Commodity AR(1) Coefficient
(Standard Error)
Aluminium 0.62
(0.12)
Cotton 0.48
(0.15)
Rubber 0.84
(0.13)
Banana 0.53
(0.17)
Gold 0.89
(0.15)
Sugar 0.40
(0.09)
Beef 0.76
(0.07)
Iron 1.03
(0.08)
Tea 0.77
(0.07)
Cocoa 0.78
(0.07)
Maize 0.59
(0.30)
Tobacco 0.51
(0.19)
Copper 0.95
(0.12)
Oil
0.97
(0.06)
Wheat 0.67
(0.10)
Coffee 0.69
(0.12)
Rice 0.56
(0.17)
Wood 0.66
(0.06)