Embed Size (px)
Citation preview
econstor www.econstor.eu
Der Open-Access-Publikationsserver der ZBW – Leibniz-Informationszentrum WirtschaftThe Open Access Publication Server of the ZBW – Leibniz Information Centre for Economics
Standard-Nutzungsbedingungen:
Die Dokumente auf EconStor dürfen zu eigenen wissenschaftlichenZwecken und zum Privatgebrauch gespeichert und kopiert werden.
Sie dürfen die Dokumente nicht für öffentliche oder kommerzielleZwecke vervielfältigen, öffentlich ausstellen, öffentlich zugänglichmachen, vertreiben oder anderweitig nutzen.
Sofern die Verfasser die Dokumente unter Open-Content-Lizenzen(insbesondere CC-Lizenzen) zur Verfügung gestellt haben sollten,gelten abweichend von diesen Nutzungsbedingungen die in der dortgenannten Lizenz gewährten Nutzungsrechte.
Terms of use:
Documents in EconStor may be saved and copied for yourpersonal and scholarly purposes.
You are not to copy documents for public or commercialpurposes, to exhibit the documents publicly, to make thempublicly available on the internet, or to distribute or otherwiseuse the documents in public.
If the documents have been made available under an OpenContent Licence (especially Creative Commons Licences), youmay exercise further usage rights as specified in the indicatedlicence.
zbw Leibniz-Informationszentrum WirtschaftLeibniz Information Centre for Economics
Jamilov, Rustam; Egert, Balazs
Working Paper
Interest rate pass-through and monetary policyasymmetry: A journey into the Caucasian black box
CESifo Working Paper: Monetary Policy and International Finance, No. 4131
Provided in Cooperation with:Ifo Institute – Leibniz Institute for Economic Research at the University ofMunich
Suggested Citation: Jamilov, Rustam; Egert, Balazs (2013) : Interest rate pass-through andmonetary policy asymmetry: A journey into the Caucasian black box, CESifo Working Paper:Monetary Policy and International Finance, No. 4131
This Version is available at:http://hdl.handle.net/10419/70261
Interest Rate Pass-Through and Monetary Policy Asymmetry:
A Journey into the Caucasian Black Box
Rustam Jamilov Balázs Égert
CESIFO WORKING PAPER NO. 4131 CATEGORY 7: MONETARY POLICY AND INTERNATIONAL FINANCE
FEBRUARY 2013
An electronic version of the paper may be downloaded • from the SSRN website: www.SSRN.com • from the RePEc website: www.RePEc.org
• from the CESifo website: Twww.CESifo-group.org/wp T
CESifo Working Paper No. 4131
Interest Rate Pass-Through and Monetary Policy Asymmetry:
A Journey into the Caucasian Black Box
Abstract This paper analyses the interest rate pass-through for five economies of the Caucasus – Armenia, Azerbaijan, Georgia, Kazakhstan, and Russia. Employing an autoregressive distributed lag (ARDL) specification to monthly data, we find that the interest rate pass-through is systematically incomplete and sluggish, probably due to macroeconomic instability and low banking sector competition. It is not clear whether pass-through has improved over time and asymmetric adjustment is found to characterize the pass-through only occasionally. Overall, our results show a considerable degree of cross-country heterogeneity in the size and speed of the pass-through.
JEL-Code: E430, E520, N250.
Keywords: interest rate pass-through, asymmetric adjustment, Caucasus.
Rustam Jamilov Central Bank of Azerbaijan
Research Department, Azerbaijan State Economics University
[email protected] [email protected]
Balázs Égert OECD Economics Department
Paris / France [email protected]
Ideas expressed in this paper are those of the authors and do not reflect the viewpoint of the Central Bank of Azerbaijan, the OECD or any other institutions the authors are affiliated with.
1. Introduction An informal yet a universally accepted professional conventional wisdom has been reached: monetary policy can impact on the real economy, but we cannot always explain how exactly (Mishkin, 2001). But considerable progress has been made in better understanding the monetary transmission mechanism. The main channels through which monetary policy innovations are transmitted to the real economy are i.) the change in the long-term real interest rate, which influences private households’ consumption and saving decisions and through the cost of capital investment decisions through substition, income and wealth effects, ii) the credit channel, which either through bank lending or market financing affects access to external financing of private businesses, and iii) the exchange rate channel, which by altering relative prices influences inflation and, through balance sheet effects, investment and consumption decisions. Bank lending and long-term market interest rates have an important role to play in these three channels. Whether and to what extent monetary policy will be able to convey its impact through these transmission channels will depend crucially on the impact of monetary policy rate innovation on bank lending and market interest rates. Obviously, a weak pass-through from the policy rate to market rates will weaken the influence of monetary policy on the real economy through these three channels. Empirical research suggests that the interest-rate pass-through is sluggish and exhibits strong asymmetries in advanced economies (deBondt, 2005 and Sander and Kleimeier, 2004a).
There is a large body of literature focusing on advanced countries and the empirical literature on former communist countries has been also expanding over the past years. This literature suggests that i.) the pass-through in economies of the former soviet bloc grew stronger over time, even though its size has remained incomplete especially for bank lending and deposit rates, ii.) there are strong asymmetric effects and iii.) the characteristics of the interest rate pass-though varies to a large extent across countries.1 There are good reasons to think that the interest-rate pass through is far to be complete in developing economies, because of shallow and illiquid security markets and an underdeveloped banking sector. But many developing and transition economies carried out financial market reforms, which, through a fast developing banking sector and capital markets, may have resulted in an improved transmission from the policy rate to banking and market interest rates. Indeed, Gigineishvili (2011) showed on a large sample of countries that heterogeneity regarding the size and speed of interest-rate pass-through may be explained to a considerable extent by differences in macroeconomic conditions and financial market development.
In this paper, we contribute to the ever growing literature on the interest-rate pass-through by evaluating its empirical importance for the Caucasus region, namely Armenia, Azerbaijan, Georgia, Kazakhstan, and Russia, placing a particular emphasis on the size of the pass-through in the long run, its short-term speed of adjustment and possible asymmetric responses. To our knowledge, this is the first attempt to model interest rate pass-through for so many countries in the Caucasus in a coherent manner. 2 It is indeed useful to bunch these countries together because they have a number of common features. In the aftermath of the disintegration of the Soviet Union in the early 1990s, weak rule of law, ineffective financial sector regulation, underdeveloped capital markets, little competition in the banking sectors, large informal sectors, dollarization, high levels of structural inflation, capital controls and fixed exchange rate regimes are all the vices that have plagued the Caucasian states for the past two decades. When analyzing interest rate pass-through in those countries, we might expect an incomplete yet functioning pass-through because of the progress made in many areas over the last two decades.
1Examples are Horváth et al. (2004) for Hungary; Opiela (1999), Chmielewski (2003) and Wróbel and Pawlowska (2002) for Poland; Égert et al. (2006), Sander and Kleimeier (2004a) and Tieman (2004) for a number of CEE countries, and Petrevski and Bogoev (2012) for South-Eastern European countries. 2 For instance, Deger (2012) analyses interest rate pass-through for Armenia, Jamilov (2012) studies lending rate pass-through and bank heterogeneity in Azerbaijan, and Samkharadze (2008) looks at the case of Georgia.
2
The remaining of this paper is structured as follows: Section 2 presents briefly the different stages of the interest rate pass-through and sets out our main research questions. Section 3 discusses estimation issues. Section 4 describes our dataset. Section 5 reports and discusses the estimation results. Section 6 finally provides some concluding remarks.
2. The interest rate pass-through The interest rate pass-through can be decomposed into two stages. The first stage measures how changes in the monetary policy rate are transmitted to short- and long-term market rates. The stability of the first stage depends to a large extent on the stability of the yield curve: If the term structure (whether negative or positive sloping), does not change over time, the pass-through from policy rates to market rates will remain unchanged, all things being equal. The second stage describes how changes in the market rates, through the costs of banks’ funding, influence bank deposit and lending rates. For bank lending rates, if banks refinance themselves in the money markets, money market rates will have an impact of short-term loan rates. Similarly, to the extent that government bond yields are considered as opportunity costs for banks, they will serve as a useful benchmark for loan rates of longer maturity. For bank deposit rates, the connection between market rates and deposit rates is warranted by the possibility that households and non-financial businesses can hold their financial assets in government securities, rather than in bank deposits of comparable maturity. Positing a stable yield curve helps link monetary policy rates directly to retail (deposit and loan) rates.
In this paper, we test the first stage of the pass-through (the link between the policy rate and short- and long-term market rates) and the overarching pass-through (the relation between the policy rate and bank deposit and lending rates). By doing so, we assume a stable yield curve in the Caucasian countries. It should be noted that it is difficult to study the link between the policy rate and short-term money market rates for all countries because money markets practically do not exist in Armenia, Azerbaijan, Georgia, and for a lesser extent Kazakhstan: banks mainly refinance themselves from the central bank rather than from the interbank money market.
There are indeed a number of reasons why the interest pass-through may not be perfect. First, macroeconomic conditions usually influence the degree of the pass-through in the longer run (Egert, Crespo-Cuaresma and Reininger, 2006). During periods of high economic growth, banks are quicker to adjust lending and deposit rates in response to changes in monetary policy rates. On the other hand, macroeconomic instability and high interest rate volatility weaken the pass-through, as banks may want to wait longer before adjusting their retail rates. Second, if monetary policy is not credible enough, and if the central bank has a history of regular interventions in the market, one-time shifts in interest rates may not be able to convince economic agents that the change of the policy stance is permanent and not simply temporary. Banks will thus respond sluggishly to policy rate innovations, expecting the central bank to shift yet to a new position in the near future. In addition, which is particularly true for the case of Caucasus, large clients of commercial banks usually include other large banks themselves (cross-depositing between systemic banks is very common in this region).3 The same method is observed in state institutes or state-connected institutes and wealthy individuals. In short, large and important clients are protected from abrupt changes in main retail interest rates, as banks attempt to smooth the effect of transition from the old interest rate regime onto the new one.
3 For general reference, this is not the same as the interbank money market. In fact, this is cross-depositing; no flow of credit or general financial activity. Certain banks may diffuse capital holdings by placing portions of the wealth portfolio in several locations, while providing deposit storage for other banks to do the same. If, for example, the two banks actually belong to the same set of owners, which is a common situation, the financial complication is really just an illusion; there is no interbank market, just cross-interconnection in order to diffuse real owners of the underlying capital and avoid over-concentration.
3
The response of retail interest rates may also overshoot the policy rate innovation, i.e. the pass-through is higher than unity. This could happen if banks decide to charge higher interest rates to offset risks associated from asymmetric information (DeBondt, 2005). Also, smaller banks may be constrained by access to quality capital, and would thus demand higher risk premium on lending rates, thus compensating for their exclusion from external sources of funding. Banks may be also expecting the central bank to follow a trend in its cyclical policy stance of either expansion or contraction, given a macroeconomic condition. If the economy is on a rising trend, then banks can reasonably expect the central bank to raise benchmark interest rates in order to prevent overheating, so banks can adjust rates in anticipation of further rounds of interest rate hikes. In fact, interest rate overshooting happens because banks price in the expectations of a continuing monetary policy trend of either expansion or contraction.
The major questions asked in this paper can be summarized as follows:
(1) Is the long-run interest rate pass-through complete in the Caucasus?
(2) How fast do interest rates adjust to their long-run equilibrium?
(3) Is there evidence of asymmetric adjustment for any interest rate pairs in any of the countries under study?
(4) Is the pass-through different for different rates for a given country?
(5) Is the pass-through different for different maturities and for rates on assets denominated in domestic currency and the US dollar?
(6) Do the size and speed of adjustment of the pass-through change significantly over time, and if yes, do the empirically identified structural breaks help explain this?
(7) Can we observe any signs of regional convergence in the interest rate pass-through?
3. Estimation Issues We check the presence of structural breaks in our series, which could seriously influence the results of unit root tests (Kleimeier and Sander, 2000). We employ the Quandt-Andrews test for structural break detection, which is based on an F-test that determines the exact timing of the structural break (Quandt, 1960; Andrews, 1993; Diebold and Chen, 1996; Hansen, 1992). For all interest rates we perform the Augmented Dickey Fuller test (ADF) in order to test for the presence of a unit root, for the full sample period and for the pre-break and the post-break periods. This helps understand whether our series are non-stationary in either of the two sub-periods and how stationarity has evolved over time. The structural breaks are also used for measuring the interest rate pass-through: estimations are carried out for the full sample and the subsamples separated by structural breaks.
As the series turn out to have a stochastic trend, cointegration is used to test for long-term relationships between policy and market/retail rates. For this purpose, we use the bounds testing approach developed by Pesaran et al. (2001). We estimate the following autoregressive distributed lag (ARDL(p,q)) model:
𝑖𝑡𝑟 = 𝛼0 + ∑ 𝛼𝑗𝑖𝑡−𝑗𝑟𝑝𝑗=1 + ∑ 𝛽𝑘𝑖𝑡−𝑘
𝑝𝑞𝑘=0 + 𝜀𝑡 (1)
where 𝑖𝑡𝑟 is the market or retail rate (interbank rate, government bill/bond rate, bank deposit or lending rate) and 𝑖𝑡
𝑝 is the policy rate (repo rate or the refinancing rate, depending the country).
The test of cointegration is based on F-statistic, which tests the null hypothesis of no cointegration 𝐻0:𝜃 = 𝛾 against the alternative hypothesis of 𝐻1:𝜃 ≠ 𝛾. For every significance level there are two sets of critical values. If the F-statistic exceeds the upper-bound critical value, then the null hypothesis is rejected. If the F-statistic is below the lower-bound, the null hypothesis cannot be rejected, implying no long-term relation linking the interest series. Finally, if the F-statistic is
4
between the two bounds, the test has no conclusive result. An alternative way to check for cointegration is to look at the sign and the size of the error correction term from the error correction model (𝛾). A statistically significant and negative error correction term implies that the variables are linked via a long-run relation (Kremers et al., 1992).
The question of asymmetric adjustment has been a focal point of the literature for the past several years.4 We therefore also test for the presence of several types of asymmetries. Asymmetric effects can arise in response to decreasing or increase policy rates in the following parameters: a) the speed of adjustment (error correction term) to the long-run relationship, and b) the short-term dynamics of the first-differenced lagged market/retail rates. Equation (2) can be extended along these lines as follows:
∆𝑖𝑡𝑟 = 𝐼�∆𝑖𝑡−1𝑝 < 0� �𝛿1 + 𝛾1�𝑖𝑡−1𝑟 − 𝜃𝑖𝑡−1
𝑝 � + �𝛼1𝑗∆𝑖𝑡−𝑗𝑟
𝑝
𝑗=1
+ �𝛽1𝑖∆𝑖𝑡−𝑖𝑝
𝑞
𝑖=0
� +
+�1 − 𝐼�∆𝑖𝑡−1𝑝 < 0�� �𝛿2 + 𝛾2�𝑖𝑡−1𝑟 − 𝜃𝑖𝑡−1
𝑝 � + �𝛼2𝑗∆𝑖𝑡−𝑗𝑟
𝑝
𝑗=1
+ �𝛽2𝑖∆𝑖𝑡−𝑖𝑝
𝑞
𝑖=0
� + 𝜀𝑡 (2)
where I(·) is a Heavyside function which takes on the value of one if the argument is true and zero otherwise. Specification (3) allows for asymmetric short-run adjustment to the long-run equilibrium, represented by coefficients 𝛾1 and 𝛾2. and for asymmetries in the short-run dynamics 𝛼1 and 𝛽1 for decreasing policy rates and 𝛼2 and 𝛽2 for rising policy rates. Having estimated equation (3), an F-test can be used to see whether the different coefficients estimated in the two regimes are statistically significant. A rejection of the null hypothesis (𝛾1 = 𝛾2, 𝛼1 = 𝛽1, 𝛼2 = 𝛽2) indicates that there is asymmetry in the speed of adjustment and/or in short-term dynamics depending on the direction of the change in the policy rate. We test both separately and jointly for the adjustment and short-run dynamics asymmetries.
Finally, the cumulative sum (CUSUM) and the cumulative sum of squares (CUSUMSQ) tests are used on the recursive regression residuals. Stability of the regression coefficients is proven if the plot of the statistics falls within the 5% significance bounds. These tests are relevant to our case due to the peculiar nature of Caucasian economies. All countries in our sample are still in transition characterized by a highly volatile macroeconomic environment. It is therefore crucial to study parameter stability.
4. Data Issues
Empirical research on the interest rate pass-through can be split into two broad categories depending on the type of data used. The first category uses country-level data either in a time or country panel context.5 The second category employs bank-specific data series to measure the interest rate pass-through to bank deposit and retail rates.6 In this paper, we use country-level interest rate series. All data series used are in monthly frequency. They were collected from the websites of the central banks of the respective countries. Time spans vary considerably across countries, since some central banks still do not publish interest rate data for early 2000s in electronic formats. We have used the
4 The pioneering studies of Hannan and Berger (1991) and Neumark and Sharpe (1992) were followed by the seminal contribution from Scholnic (1996). More recent contributions include Egert, Crespo-Cuaresma, and Reininger (2006), Sander and Kleimeier (2004b), and Tieman (2004). Little, if any, evidence has been provided for the CIS or countries in the Caucasus. 5Examples include Cotarelli and Kourelis (1994), Borio and Fritz (1995), Mojon (2000), Bredin, Fitzpatrick and O’Reilly (2001), Sander and Kleimeier (2006), Mizen and Hoffman (2002), Ozdemir (2009). 6 See e.g. De Graeve et al. (2007), Sorensen and Werner (2006), and Horváth et al. (2004)
5
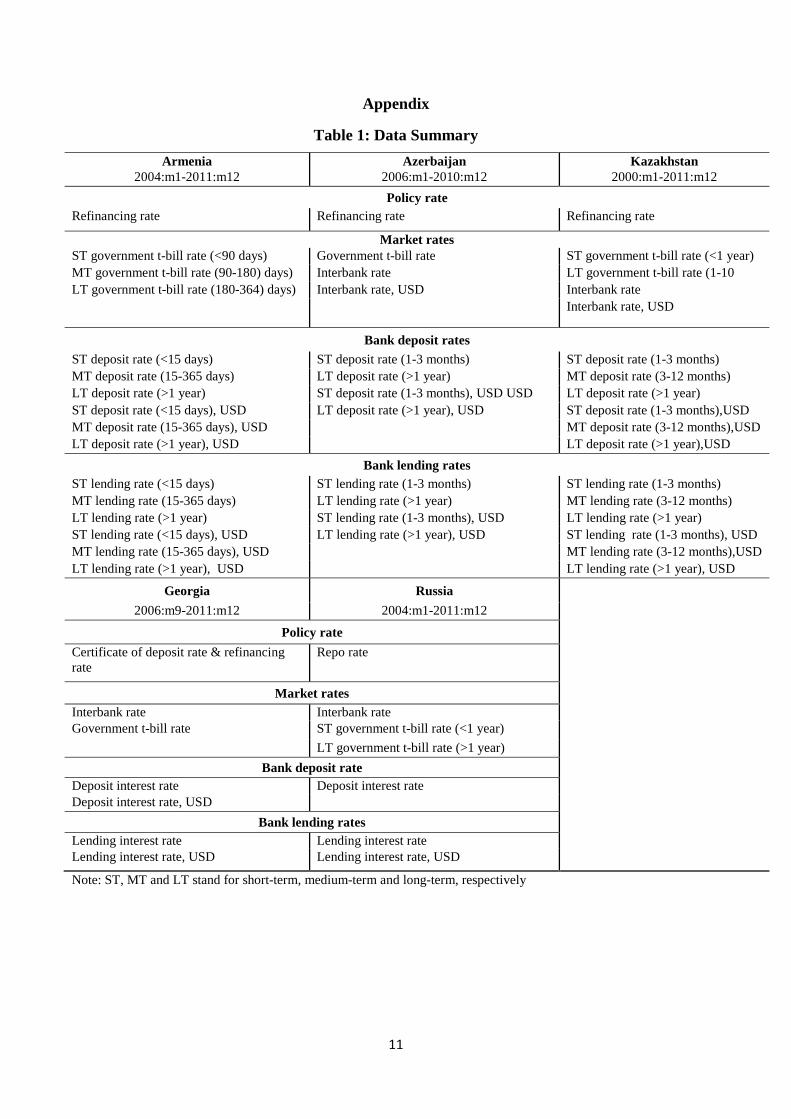
official policy rate of the respective central banks as the independent variable and market and bank retail rates as the dependent variable. The coverage of market and retail rates varies for different countries. For some countries, interest rates are also available for both home currency and dollar denominated deposit and lending instruments. The time span of the data also differs across countries. Table 1 summarizes the data and time coverage of our dataset.
Two observations merit further attention. The first one is the stability of the yield curve. Subject to data availability, we measure curve stability by the ratio of long-term rates to short-term rates. We compute the ratio for every month, and then calculate the standard deviation for the respective instrument’s time-span. We repeat the same procedure for the full sample and the pre- and post-break periods. If standard deviation is reasonably time-invariant, i.e. is not affected by the structural break, we conclude that the curve is stable. Table 2 illustrates that yield curves are reasonably stable in Russia and Kazakhstan, while they are unstable in Armenia and Azerbaijan. Remarkably, yield curves of dollar denominated credit (lending_for) instruments are uniformally stable across countries.
The second preliminary observation relates to the difference between rates on domestic and foreign-currency (US dollar) denominated assets (Table 3). In almost all cases, assets denominated in home-country currency have systematically higher interest rates than those in US dollar. This is a natural observation because of the still present dollarization and domination of the dollar in the region’s financial and trade activities, shaky trust in the local currencies. In addition, there exists a special risk premium that economic agents assign to any assets denominated in the domestic currency due to illiquidity, high and volatile inflation rates and the inability to forecast domestic interest rates with great certainty (forward-looking myopia).
5. Estimation Results
5.1. Structural Break, Unit Root, and Cointegration Test Results
The results of the Quandt-Andrews test for structural breaks, reported in Table 4, show that while many series, particularly in the case of Kazakhstan, break in as early as 2001, a large majority of the breaks occur after the outbreak of the financial crisis in late 2007. Nevertheless, the break dates do not fully overlap, since the specific month of individual country structural breaks are quite spread out from 2007:12 to 2009:12. There is also quite noticeable within-country heterogeneity in structural break dates for different domestic currency denominated rates. Table 4 also reports the ADF unit root test results for the full sample and for the pre- and post-structural break periods. Most of the series follow the I(1) process7. It is not clear whether the structural break has had any substantial effect on the stationarity of the series, as no apparent pattern can be identified across all countries.
Table 5 reports the results of our cointegration analysis. The interest rate pairs including the policy rate on the one hand and the market/deposit/lending rates on the other hand appear to be linked via a long-term cointegrating vector: the F-statistics of the bounds testing approach comfortably reject the null hypothesis of no cointegrataion and the error correction terms are negative and statistically significant at conventional significance levels of significance. Overall, it is fair to conclude that almost all pairs of series are cointegrated. In addition, the absolute values of the error correction terms are often considerably lower than unity, implying a slow speed of adjustment to the cointegration vector8. In other words, the pass-through (regardless of whether it is complete or not)
7The peculiarity of the ARDL methodology allows for estimation of regressions where not all covariates are non-stationary (Narayan, 2005). 8 We have also calculated cointegration half-lives which are defined as ln(0.5)/ln(1+α), where α is the speed of adjustment derived from the error correction model, and show the time period required to achieve a 50 per cent
6
approaches its long-run equilibrating state in a sluggish manner. This is true for all countries and instrument types in the sample.
5.2. Interest Rate Pass-Through Estimates
Let us now take a look at the interest rate pass-through (IRPT) estimates, summarized in Table 6, for the full sample as well as the pre- and post-break periods. For Armenia, the size of the long-run interest rate pass-through varies from unity to as low as 0.29. Pass-through to deposit interest rates seems to be the strongest. Interest rates on government assets tend to overshoot in response to a monetary policy innovation. Pass-through has more or less improved over time, i.e. after the break. Pass-through for interest rates denominated in the local currency is higher than for those in USD. The maturity does not affect the size of the pass-through. For Azerbaijan, while the estimates differ a lot, they point to a generally incomplete pass-through9. It is difficult to say whether pass-through has improved or changed at all over time. Short-term rates tend to react stronger to monetary policy rate movements than longer rates. The currency denomination does not seem to alter the size of the IRPT. Interbank and government t-bill interest rates display a marginally higher pass-through. T-bill rates overshoot monetary innovations after the structural break of April 2008.
For Georgia, the government t-bill rate overshoots the monetary policy rate for the full sample. Apart from T-bill rates, the estimated size of the long-run pass-through varies from 0.31 to 0.92. The structural break has improved pass-through, although estimates are rarely consistently significant in statistical terms. Interbank rates react almost fully to monetary impulses. Deposit rate pass-through is noticeably better than for lending rates. In Kazakhstan, government T-bill rates, apart from some rare cases for other rates, substantially overshoot in response to changes in the key monetary policy rate. Interest rates denominated in domestic currency exhibit greater pass-through than those in the US dollar. Pass-through does not vary with maturity and it has also surprisingly weakened after the structural break. Overall, the IRPT is stronger in Kazakhstan than in Armenia, Azerbaijan or Georgia. Finally, there is very little heterogeneity in the pass-through estimates across domestic rates in Russia. Pass-through is remarkably complete, and is in fact higher than unity. All series, and in particular government T-bill rates, tend to overshoot the monetary policy rate considerably. The structural break seems to have had no systematic effect on the size of the pass-through.
To summarize, pass-through estimates exhibit higher variability and less completeness in Armenia, Azerbaijan, Georgia than in Kazakhstan or Russia. It is not clear whether the pass-through improved after the structural break, i.e. over time. The generally incomplete pass-through (except for Russia) is a clear signal of macroeconomic instability, general interest rate volatility, and a low level of competition in the bank sectors. Indeed, a systematically incomplete interest rate pass-through for all types of interest rates could signal weak banking competition.10
The most substantial recurring observation is that instruments of various maturities, across different countries, and of both domestic and foreign currency of denomination, tend to overshoot considerably policy rate innovations. Overshooting, which is particularly strong for government T-bill rates, could point to the presence of information asymmetries in Caucasian financial markets (Stiglitz and Weiss, 1981; DeBondt, 2005) and could also show poor access to capital markets by
adjustment to shocks. For full-sample data of Armenia, Azerbaijan, Georgia, Kazakhstan, and Russia the average half-lives are 4.2, 2.3, 5.9, 6, and 6.6 months, respectively. Full set of results is available upon request. 9 This is very much in line with Jamilov (2012) who, on an industry-specific sample of Azerbaijan’s commercial banks, shows that pass-through to lending rates is incomplete and sluggish. 10 In order to check our results for robustness, we have performed the CUSUM and CUSUMSQ tests for parameter stability. All pass-through estimates appear to be stable according to at least one of the test outcomes. Stability test results are omitted for brevity but are available from the authors upon request.
7
small institutions. Smaller financial institutions in the region may be facing barriers to access quality capital. This in turn could force them to charge higher interest rates to compensate for the lack of financing options. There is also a possibility that markets believe in monetary policy inertia, i.e. that any given intervention in the policy rate market would initiate a new trend in the monetary policy stance and would increase the likelihood of future policy interventions of the same direction. In other words, a one-time increase in the policy rate raises the odds that the rate will be increased again in the future as part of the new monetary policy stance. Commercial banks thus price in the expectations of future policy changes by purposefully overshooting today’s interest rates.
The considerable cross-country heterogeneity of the estimates suggests that there really is a limited set of common factors that unite Caucasian countries regarding the interest rate pass-through. While the Caucasus region does exhibit a common structural break after 2007, it is difficult to say that this is overwhelming evidence in support of regional convergence. There is indeed much more evidence that the region is not integrating, at least not in terms of the interest rate pass-through. It is also true that another homogeneous factor across the Caucasus is the presence of overshooting and its related underlying causes. It’s tough to argue though that crippling information asymmetry is the kind of element that Caucasian policy makers would wish to have as a common factor.
5.3. Asymmetric Responses to Monetary Policy Changes
Table 7 reports estimates of asymmetries of market rates to positive and negative monetary policy rate innovations along three dimensions: asymmetry in the speed of adjustment, short-run dynamics, and the joint asymmetry of the two components. First, all estimates of short-term adjustment are considerably smaller than unity implying a sluggish pass-through (in addition to the incomplete long-term pass-through discussed above). Systematically sluggish adjustment can be thought of reflecting high switching costs and, in the case of bank deposit rates, the unwillingness of banks to lose customers due to frequent retail rate adjustments.
For Armenia, Azerbaijan, and Russia, there is practically no difference in the response of market rates to monetary expansions or contractions 11. For Kazakhstan, market rates are slightly more sluggish in response to contractionary policy stance, and rates are more sluggish moving upwards in Georgia. The tests for asymmetry suggest that asymmetric effects are there but their size is not significant. Azerbaijan and Russia have just one statistically significant case of asymmetry. For the series that do exhibit asymmetric behavior, in either of the three parameters, asymmetry is stronger in the instruments of long-term maturity, regardless of the currency denomination or the instrument type.
These estimations results can provide us some insights regarding the consumer reaction hypothesis and/or the collusive pricing theory. The former refers to the occasion when deposit rates are sluggish going downwards reflecting the desire of banks to smooth negative deposit rate shocks. Collusive pricing theory assumes market collusion among banks, which would collectively refuse to lower lending rates despite a decrease in the policy rate. Such a behavior would imply downward lending rate rigidity. Our results provide no convincing evidence in favor of either of the two theories.
6. Concluding Remarks
Drawing on a standard analytical framework and empirical strategies, we analyzed the interest rate pass-through for Armenia, Azerbaijan, Georgia, Kazakhstan, and Russia. Our results can be summarized using the research questions we asked at the beginning of this paper. First, the pass-through is found to be incomplete. Incomplete pass-through may be a result of macroeconomic
11 Deger (2012) also finds complete symmetry in the Armenian pass-through estimates.
8
instability in the region, interest rate and inflation volatility, and the lack of competition in the banking sector. Second, adjustment to the long-term equilibrium seems sluggish, indicating high menu switching costs. Third, Asymmetric adjustment is not very important and barely present in some countries such as Armenia, Azerbaijan and Russia. Our results lend no support to the consumer reaction hypothesis or collusive pricing agreements in the banking sector. Fourth, the size of the pass-through differs for different rates within specific countries. Fifth, the size of the long-run pass-through and the short-run adjustment vary quite significantly across maturity and currency denomination for the same country. Sixth, there is no clear empirical evidence that the size and speed of adjustment of the pass-through change significantly over time. Finally, while the 2008 Financial Crisis seems to have been the common cause of structural breaks in most countries’ interest rate series, there is not enough evidence in favor of regional convergence in the Caucasus. Interest rate pass-through is driven much more by domestic factors than by regional integrating forces.
References
Andrews, D.W.K., (1993), “Tests for parameter instability and structural change with an unknown change point,” Econometrica 61, 821-856.
Borio, C. E. V., & Fritz, W. (1995), “The Response of Short-Term Bank Lending Rates to Policy Rates: A Cross-Country Perspective,” Bank for International Settlements working paper No. 27.
Bredin, D., T. Fitzpatrick and G. O’Reilly (2001), ‘Retail Interest Rate Pass-Through: The Irish Experience’, Central Bank of Ireland Technical Paper No. 6, November.
Cotarelli, C. and A. Kourelis (1994) “Financial Structure, Bank Lending Rates and the Transmission of Monetary Policy”, IMF Staff Papers, 41 (4):587-623.
Chmielewski, T. (2003), "Interest rate pass-through in the Polish banking sector and bank-specific financial disturbances," MPRA Paper 5133, University Library of Munich
DeBondt, G. (2005), Interest Rate Pass-Through: Empirical Results for the Euro Area, German Economic Review 6. 37–78.
De Graeve, F., O. De Jonghe and R. V. Vennet (2007) “Competition, transmission and bank pricing policies: evidence from Belgian loan and deposit markets”, Journal of Banking and Finance,31:259-278.
Deger, O. (2012), “A comparative study of nonlinear structure of the interest rate pass-through,” Master dissertation, The Graduate school of social sciences of the Middle East Technical University.
Diebold, F.S. and C. Chen, 1996, Testing structural stability with endogenous breakpoint – A size comparison of analytic and bootstrap procedures, Journal of Econometrics 70, 221-241.
Egert, B., J. Crespo-Cuaresma and T. Reininger (2006), “Interest rate pass-through in central and Eastern Europe: Reborn from ashes merely to pass away?” Journal of Policy Modeling, 29:209-225.
Gigineishvili, N. (2011), Determinants of interest rate pass-through: do macroeconomic conditions and financial market structure matter? IMF working paper WP/11/176.
Hannan, Timothy H & Berger, Allen N, 1991. "The Rigidity of Prices: Evidence from the Banking Industry," American Economic Review, 81(4): 938-45.
Hansen, B.E., (1992), Tests for parameter instability in regressions with I(1) processes, Journal of Business & Economic Statistics 10, 321-341.
Horváth, Cs., J. Krekó and A. Naszódi. (2004) “Interest Rate Pass-Through: The Case of Hungary,” National Bank of Hungary Working Paper 8.
Jamilov, R. (2012), “Lending Rate Pass-Through, Sectoral Analysis, Asymmetric Stickiness, and Bank Heterogeneity in a Small Transition Economy,” Available at SSRN: http://ssrn.com/abstract=2185308
Kleimeier, S., Sander, H. (2000), "Regionalisation versus globalisation in European financial market integration: Evidence from co-integration analyses," Journal of Banking & Finance, 24(6):1005-1043,
Kremers, J.J. M., Ericsson, N. R., Dolado, J.J. (1992), “The Power of Cointegration Tests”, Oxford Bulletin of Economics and Statistics, 54(3):325-348.
Mishkin, F. (2001), “The Transmission Mechanism and the Role of Asset Prices in Monetary Policy,” National Bureau of Economic Research Working Paper: 8617, December.
Mizen, P., Hofmann, B. (2002), "Base rate pass-through: evidence from banks' and building societies' retail rates," Bank of England Working Paper No. 170, Bank of England.
Mojon, B. (2000), ‘Financial Structure and the Interest Rate Channel of ECB Monetary Policy’, ECB Working Paper No. 40, November
9
Narayan, P.K. (2005), “The saving and investment nexus for China: evidence from cointegration tests,” Applied Economics 37, 1979-1990.
Neumark, D. and Sharpe S.A. (1992), “Market Structure and the Nature of Price Rigidity” The Quarterly Journal of Economics, May 1992
Opiela, T. P. (1999), “The Responsiveness of Loan Rates to Monetary Policy in Poland: The Effects of Bank Structure,” National Bank of Poland Materials and Studies 12.
Ozdemir, B. K. (2009), “Retail bank interest rate pass-through: The Turkish experience,” International Research Journal of Finance and Economics, 28, 7–15.
Pesaran, M.H., Shin, Y., Smith, R. J. (2001), “Bounds Testing Approaches to the Analysis of Level Relationships,” Journal of Applied Econometrics 16(3): 289–326.
Quandt, R. (1960), “Tests of the hypothesis that a linear regression system obeys two separate regimes,” Journal of the American Statistical Association 55, 324-330.
Petrevski, G., Bogoev, J. (2012), “Interest rate pass-through in South East Europe: An empirical analysis,” Economic Systems, Online First: http://dx.doi.org/10.1016/j.bbr.2011.03.031
Samkharadze, B. (2008), “Monetary transmission mechanism in Georgia: analyzing pass-through of different channels,” mimeo.
Sander, H., Kleimeier, S. (2004a), “Convergence in Eurozone retail banking? What interest rate pass-through tells us about monetary policy transmission, competition and integration,” Journal of International Money and Finance, 23:461-492.
Sander, H., Kleimeier, S. (2004b). “Interest Rate Pass-Through in an Enlarged Europe: The Role of Banking Market Structure for Monetary Policy Transmission in Transition Economies,” University of Maastricht METEOR Research Memoranda 045.
Sander, H., Kleimeier, S. (2006), “Convergence of interest rate pass-through in a wider Euro zone?” Economic Systems, 30:406-423.
Scholnick, B. (1996), “Asymmetric adjustment of commercial bank interest rates: evidence from Malaysia and Singapore,” Journal of International Money and Finance 15, 485–496.
Sorensen, C. K., Werner, T. (2006), "Bank interest rate pass-through in the euro area: a cross country comparison," Working Paper Series 580, European Central Bank.
Stiglitz, J. E., & Weiss, A. (1981). “Credit rationing in markets with imperfect information,” American Economic Review, 71(3), 917–926.
Tieman, A. (2004), “Interest Rate Pass-Through in Romania and Other Central European Economies,” IMF Working Paper 211.
Wrobel, E., Pawlowska, M. (2002), "Monetary transmission in Poland: some evidence on interest rate and credit channels," National Bank of Poland Working Papers 24
10
Appendix
Table 1: Data Summary Armenia Azerbaijan Kazakhstan
2004:m1-2011:m12 2006:m1-2010:m12 2000:m1-2011:m12 Policy rate
Refinancing rate Refinancing rate Refinancing rate
Market rates ST government t-bill rate (<90 days) Government t-bill rate ST government t-bill rate (<1 year) MT government t-bill rate (90-180) days) Interbank rate LT government t-bill rate (1-10
LT government t-bill rate (180-364) days) Interbank rate, USD Interbank rate Interbank rate, USD
Bank deposit rates ST deposit rate (<15 days) ST deposit rate (1-3 months) ST deposit rate (1-3 months) MT deposit rate (15-365 days) LT deposit rate (>1 year) MT deposit rate (3-12 months) LT deposit rate (>1 year) ST deposit rate (1-3 months), USD USD LT deposit rate (>1 year) ST deposit rate (<15 days), USD LT deposit rate (>1 year), USD ST deposit rate (1-3 months),USD MT deposit rate (15-365 days), USD MT deposit rate (3-12 months),USD LT deposit rate (>1 year), USD LT deposit rate (>1 year),USD
Bank lending rates ST lending rate (<15 days) ST lending rate (1-3 months) ST lending rate (1-3 months) MT lending rate (15-365 days) LT lending rate (>1 year) MT lending rate (3-12 months) LT lending rate (>1 year) ST lending rate (1-3 months), USD LT lending rate (>1 year) ST lending rate (<15 days), USD LT lending rate (>1 year), USD ST lending rate (1-3 months), USD MT lending rate (15-365 days), USD MT lending rate (3-12 months),USD LT lending rate (>1 year), USD LT lending rate (>1 year), USD
Georgia Russia
2006:m9-2011:m12 2004:m1-2011:m12
Policy rate
Certificate of deposit rate & refinancing rate
Repo rate
Market rates
Interbank rate Interbank rate Government t-bill rate ST government t-bill rate (<1 year) LT government t-bill rate (>1 year)
Bank deposit rate Deposit interest rate Deposit interest rate Deposit interest rate, USD
Bank lending rates Lending interest rate Lending interest rate Lending interest rate, USD Lending interest rate, USD
Note: ST, MT and LT stand for short-term, medium-term and long-term, respectively
11
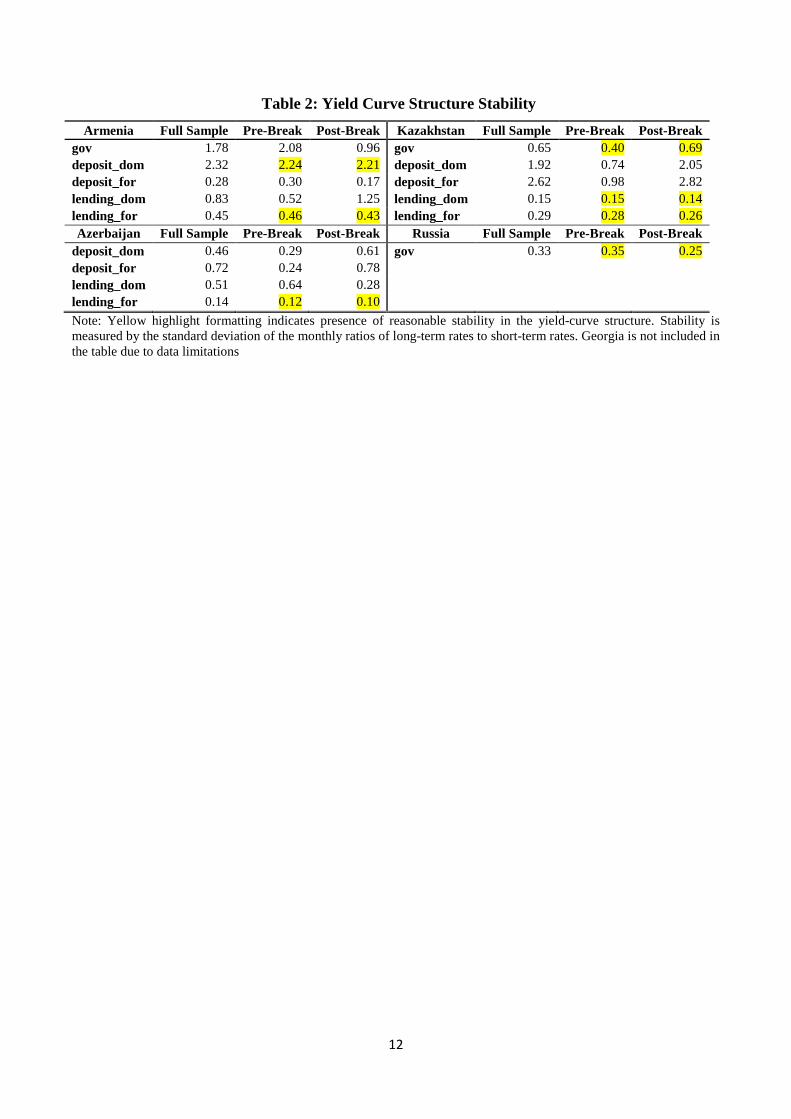
Table 2: Yield Curve Structure Stability Armenia Full Sample Pre-Break Post-Break Kazakhstan Full Sample Pre-Break Post-Break
gov 1.78 2.08 0.96 gov 0.65 0.40 0.69 deposit_dom 2.32 2.24 2.21 deposit_dom 1.92 0.74 2.05 deposit_for 0.28 0.30 0.17 deposit_for 2.62 0.98 2.82 lending_dom 0.83 0.52 1.25 lending_dom 0.15 0.15 0.14 lending_for 0.45 0.46 0.43 lending_for 0.29 0.28 0.26 Azerbaijan Full Sample Pre-Break Post-Break Russia Full Sample Pre-Break Post-Break
deposit_dom 0.46 0.29 0.61 gov 0.33 0.35 0.25 deposit_for 0.72 0.24 0.78 lending_dom 0.51 0.64 0.28 lending_for 0.14 0.12 0.10 Note: Yellow highlight formatting indicates presence of reasonable stability in the yield-curve structure. Stability is measured by the standard deviation of the monthly ratios of long-term rates to short-term rates. Georgia is not included in the table due to data limitations
12
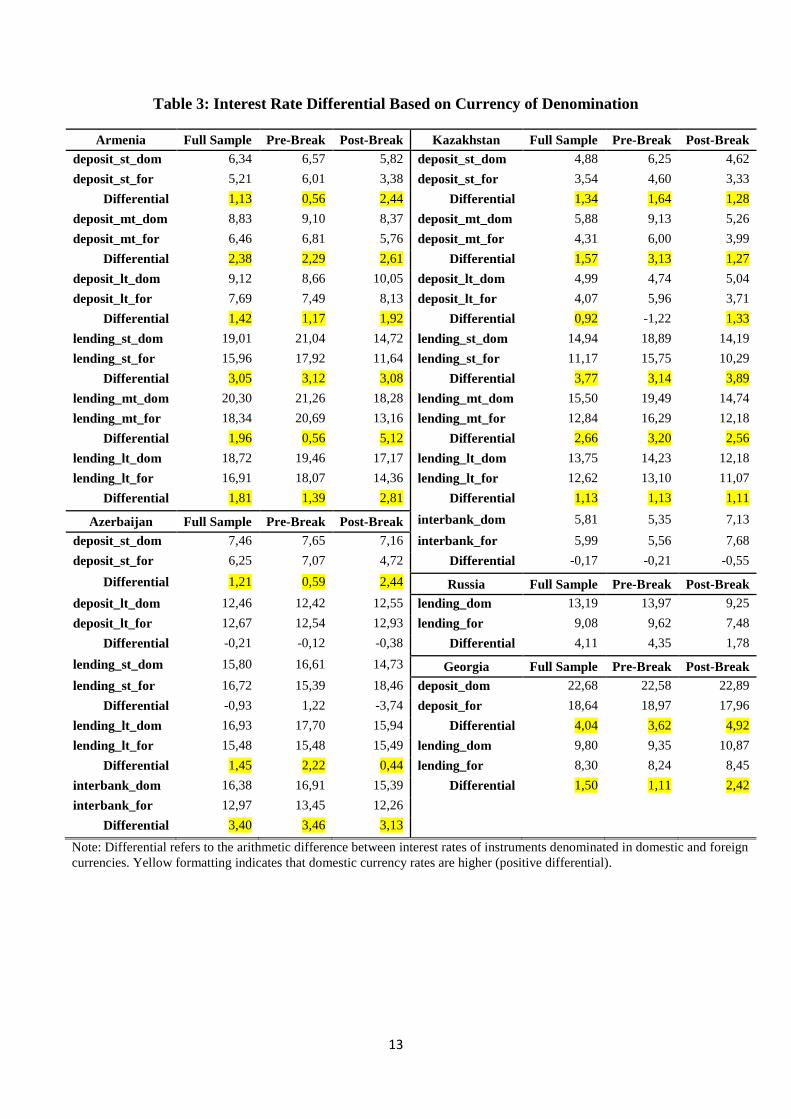
Table 3: Interest Rate Differential Based on Currency of Denomination
Armenia Full Sample Pre-Break Post-Break Kazakhstan Full Sample Pre-Break Post-Break deposit_st_dom 6,34 6,57 5,82 deposit_st_dom 4,88 6,25 4,62 deposit_st_for 5,21 6,01 3,38 deposit_st_for 3,54 4,60 3,33
Differential 1,13 0,56 2,44 Differential 1,34 1,64 1,28 deposit_mt_dom 8,83 9,10 8,37 deposit_mt_dom 5,88 9,13 5,26 deposit_mt_for 6,46 6,81 5,76 deposit_mt_for 4,31 6,00 3,99
Differential 2,38 2,29 2,61 Differential 1,57 3,13 1,27 deposit_lt_dom 9,12 8,66 10,05 deposit_lt_dom 4,99 4,74 5,04 deposit_lt_for 7,69 7,49 8,13 deposit_lt_for 4,07 5,96 3,71
Differential 1,42 1,17 1,92 Differential 0,92 -1,22 1,33 lending_st_dom 19,01 21,04 14,72 lending_st_dom 14,94 18,89 14,19 lending_st_for 15,96 17,92 11,64 lending_st_for 11,17 15,75 10,29
Differential 3,05 3,12 3,08 Differential 3,77 3,14 3,89 lending_mt_dom 20,30 21,26 18,28 lending_mt_dom 15,50 19,49 14,74 lending_mt_for 18,34 20,69 13,16 lending_mt_for 12,84 16,29 12,18
Differential 1,96 0,56 5,12 Differential 2,66 3,20 2,56 lending_lt_dom 18,72 19,46 17,17 lending_lt_dom 13,75 14,23 12,18 lending_lt_for 16,91 18,07 14,36 lending_lt_for 12,62 13,10 11,07
Differential 1,81 1,39 2,81 Differential 1,13 1,13 1,11
Azerbaijan Full Sample Pre-Break Post-Break interbank_dom 5,81 5,35 7,13 deposit_st_dom 7,46 7,65 7,16 interbank_for 5,99 5,56 7,68 deposit_st_for 6,25 7,07 4,72 Differential -0,17 -0,21 -0,55
Differential 1,21 0,59 2,44 Russia Full Sample Pre-Break Post-Break deposit_lt_dom 12,46 12,42 12,55 lending_dom 13,19 13,97 9,25 deposit_lt_for 12,67 12,54 12,93 lending_for 9,08 9,62 7,48
Differential -0,21 -0,12 -0,38 Differential 4,11 4,35 1,78 lending_st_dom 15,80 16,61 14,73 Georgia Full Sample Pre-Break Post-Break lending_st_for 16,72 15,39 18,46 deposit_dom 22,68 22,58 22,89
Differential -0,93 1,22 -3,74 deposit_for 18,64 18,97 17,96 lending_lt_dom 16,93 17,70 15,94 Differential 4,04 3,62 4,92 lending_lt_for 15,48 15,48 15,49 lending_dom 9,80 9,35 10,87
Differential 1,45 2,22 0,44 lending_for 8,30 8,24 8,45 interbank_dom 16,38 16,91 15,39 Differential 1,50 1,11 2,42 interbank_for 12,97 13,45 12,26
Differential 3,40 3,46 3,13
Note: Differential refers to the arithmetic difference between interest rates of instruments denominated in domestic and foreign currencies. Yellow formatting indicates that domestic currency rates are higher (positive differential).
13
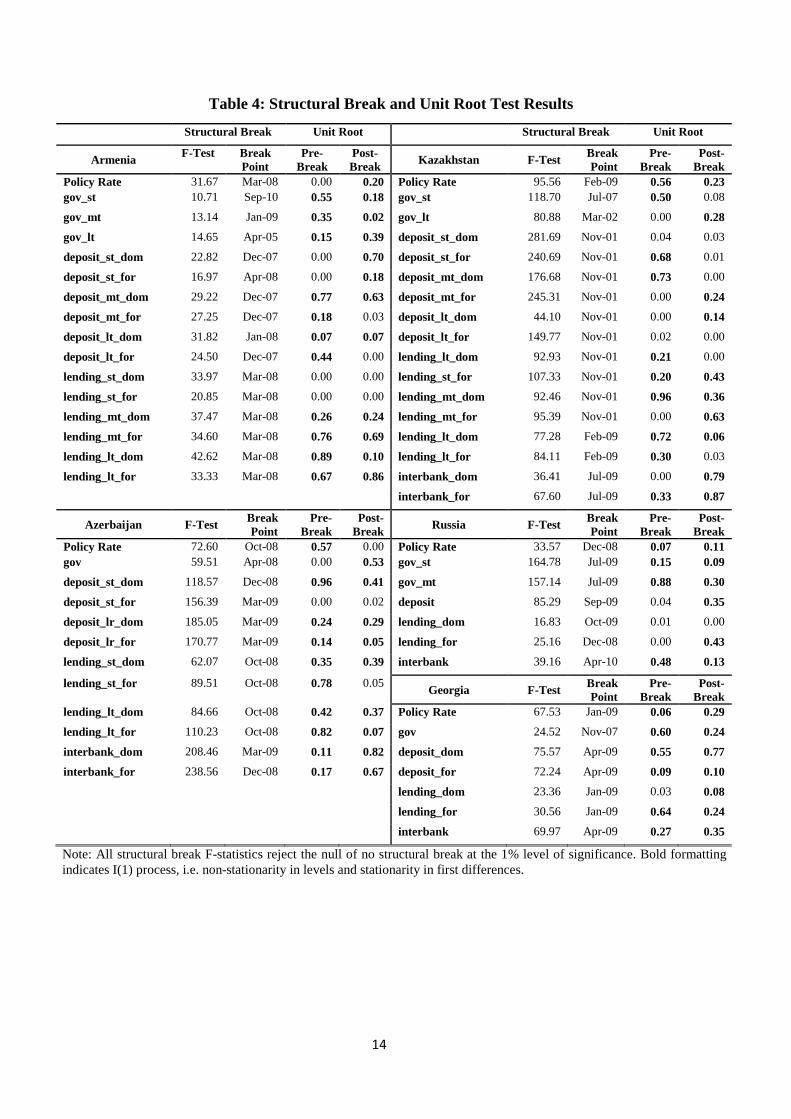
Table 4: Structural Break and Unit Root Test Results
Structural Break Unit Root Structural Break Unit Root
Armenia F-Test Break Point
Pre-Break
Post-Break Kazakhstan F-Test Break
Point Pre-
Break Post-
Break Policy Rate 31.67 Mar-08 0.00 0.20 Policy Rate 95.56 Feb-09 0.56 0.23 gov_st 10.71 Sep-10 0.55 0.18 gov_st 118.70 Jul-07 0.50 0.08
gov_mt 13.14 Jan-09 0.35 0.02 gov_lt 80.88 Mar-02 0.00 0.28
gov_lt 14.65 Apr-05 0.15 0.39 deposit_st_dom 281.69 Nov-01 0.04 0.03
deposit_st_dom 22.82 Dec-07 0.00 0.70 deposit_st_for 240.69 Nov-01 0.68 0.01
deposit_st_for 16.97 Apr-08 0.00 0.18 deposit_mt_dom 176.68 Nov-01 0.73 0.00
deposit_mt_dom 29.22 Dec-07 0.77 0.63 deposit_mt_for 245.31 Nov-01 0.00 0.24
deposit_mt_for 27.25 Dec-07 0.18 0.03 deposit_lt_dom 44.10 Nov-01 0.00 0.14
deposit_lt_dom 31.82 Jan-08 0.07 0.07 deposit_lt_for 149.77 Nov-01 0.02 0.00
deposit_lt_for 24.50 Dec-07 0.44 0.00 lending_lt_dom 92.93 Nov-01 0.21 0.00
lending_st_dom 33.97 Mar-08 0.00 0.00 lending_st_for 107.33 Nov-01 0.20 0.43
lending_st_for 20.85 Mar-08 0.00 0.00 lending_mt_dom 92.46 Nov-01 0.96 0.36
lending_mt_dom 37.47 Mar-08 0.26 0.24 lending_mt_for 95.39 Nov-01 0.00 0.63
lending_mt_for 34.60 Mar-08 0.76 0.69 lending_lt_dom 77.28 Feb-09 0.72 0.06
lending_lt_dom 42.62 Mar-08 0.89 0.10 lending_lt_for 84.11 Feb-09 0.30 0.03
lending_lt_for 33.33 Mar-08 0.67 0.86 interbank_dom 36.41 Jul-09 0.00 0.79
interbank_for 67.60 Jul-09 0.33 0.87
Azerbaijan F-Test Break Point
Pre-Break
Post-Break Russia F-Test Break
Point Pre-
Break Post-
Break Policy Rate 72.60 Oct-08 0.57 0.00 Policy Rate 33.57 Dec-08 0.07 0.11 gov 59.51 Apr-08 0.00 0.53 gov_st 164.78 Jul-09 0.15 0.09
deposit_st_dom 118.57 Dec-08 0.96 0.41 gov_mt 157.14 Jul-09 0.88 0.30
deposit_st_for 156.39 Mar-09 0.00 0.02 deposit 85.29 Sep-09 0.04 0.35
deposit_lr_dom 185.05 Mar-09 0.24 0.29 lending_dom 16.83 Oct-09 0.01 0.00
deposit_lr_for 170.77 Mar-09 0.14 0.05 lending_for 25.16 Dec-08 0.00 0.43
lending_st_dom 62.07 Oct-08 0.35 0.39 interbank 39.16 Apr-10 0.48 0.13
lending_st_for 89.51 Oct-08 0.78 0.05 Georgia F-Test Break Point
Pre-Break
Post-Break
lending_lt_dom 84.66 Oct-08 0.42 0.37 Policy Rate 67.53 Jan-09 0.06 0.29
lending_lt_for 110.23 Oct-08 0.82 0.07 gov 24.52 Nov-07 0.60 0.24
interbank_dom 208.46 Mar-09 0.11 0.82 deposit_dom 75.57 Apr-09 0.55 0.77
interbank_for 238.56 Dec-08 0.17 0.67 deposit_for 72.24 Apr-09 0.09 0.10
lending_dom 23.36 Jan-09 0.03 0.08
lending_for 30.56 Jan-09 0.64 0.24
interbank 69.97 Apr-09 0.27 0.35
Note: All structural break F-statistics reject the null of no structural break at the 1% level of significance. Bold formatting indicates I(1) process, i.e. non-stationarity in levels and stationarity in first differences.
14
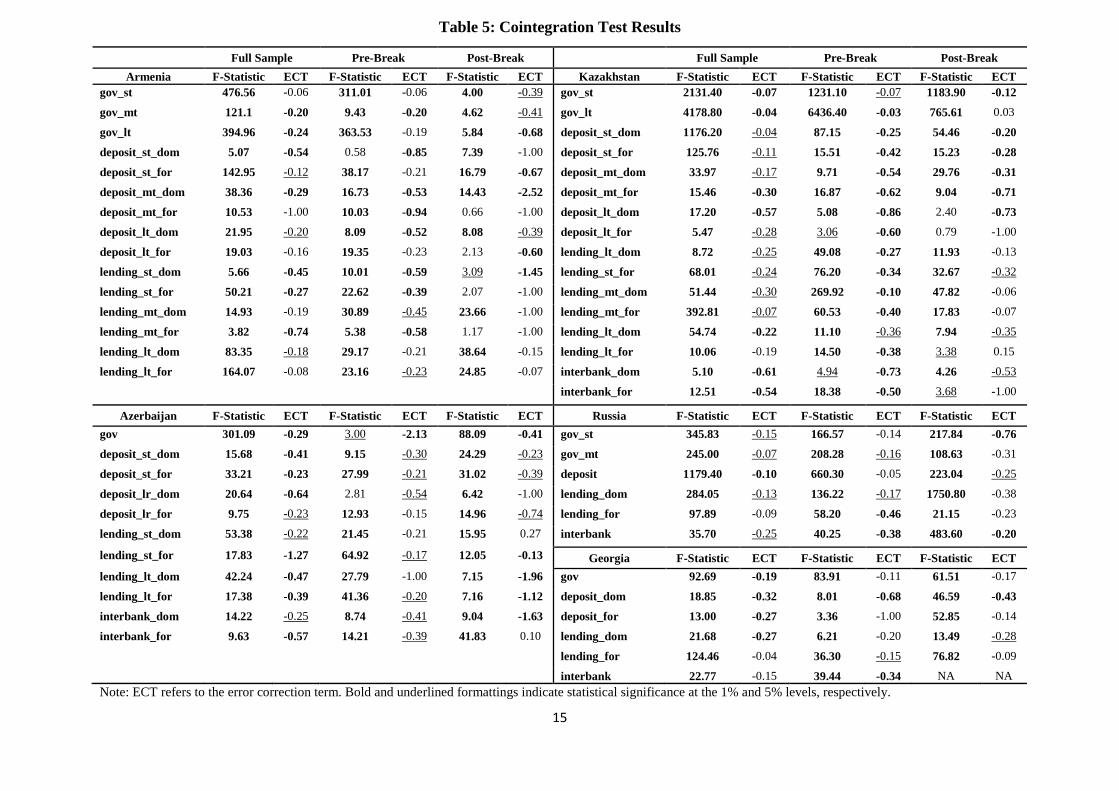
Table 5: Cointegration Test Results
Full Sample Pre-Break Post-Break Full Sample Pre-Break Post-Break Armenia F-Statistic ECT F-Statistic ECT F-Statistic ECT Kazakhstan F-Statistic ECT F-Statistic ECT F-Statistic ECT
gov_st 476.56 -0.06 311.01 -0.06 4.00 -0.39 gov_st 2131.40 -0.07 1231.10 -0.07 1183.90 -0.12
gov_mt 121.1 -0.20 9.43 -0.20 4.62 -0.41 gov_lt 4178.80 -0.04 6436.40 -0.03 765.61 0.03
gov_lt 394.96 -0.24 363.53 -0.19 5.84 -0.68 deposit_st_dom 1176.20 -0.04 87.15 -0.25 54.46 -0.20
deposit_st_dom 5.07 -0.54 0.58 -0.85 7.39 -1.00 deposit_st_for 125.76 -0.11 15.51 -0.42 15.23 -0.28
deposit_st_for 142.95 -0.12 38.17 -0.21 16.79 -0.67 deposit_mt_dom 33.97 -0.17 9.71 -0.54 29.76 -0.31
deposit_mt_dom 38.36 -0.29 16.73 -0.53 14.43 -2.52 deposit_mt_for 15.46 -0.30 16.87 -0.62 9.04 -0.71
deposit_mt_for 10.53 -1.00 10.03 -0.94 0.66 -1.00 deposit_lt_dom 17.20 -0.57 5.08 -0.86 2.40 -0.73
deposit_lt_dom 21.95 -0.20 8.09 -0.52 8.08 -0.39 deposit_lt_for 5.47 -0.28 3.06 -0.60 0.79 -1.00
deposit_lt_for 19.03 -0.16 19.35 -0.23 2.13 -0.60 lending_lt_dom 8.72 -0.25 49.08 -0.27 11.93 -0.13
lending_st_dom 5.66 -0.45 10.01 -0.59 3.09 -1.45 lending_st_for 68.01 -0.24 76.20 -0.34 32.67 -0.32
lending_st_for 50.21 -0.27 22.62 -0.39 2.07 -1.00 lending_mt_dom 51.44 -0.30 269.92 -0.10 47.82 -0.06
lending_mt_dom 14.93 -0.19 30.89 -0.45 23.66 -1.00 lending_mt_for 392.81 -0.07 60.53 -0.40 17.83 -0.07
lending_mt_for 3.82 -0.74 5.38 -0.58 1.17 -1.00 lending_lt_dom 54.74 -0.22 11.10 -0.36 7.94 -0.35
lending_lt_dom 83.35 -0.18 29.17 -0.21 38.64 -0.15 lending_lt_for 10.06 -0.19 14.50 -0.38 3.38 0.15
lending_lt_for 164.07 -0.08 23.16 -0.23 24.85 -0.07 interbank_dom 5.10 -0.61 4.94 -0.73 4.26 -0.53
interbank_for 12.51 -0.54 18.38 -0.50 3.68 -1.00
Azerbaijan F-Statistic ECT F-Statistic ECT F-Statistic ECT Russia F-Statistic ECT F-Statistic ECT F-Statistic ECT gov 301.09 -0.29 3.00 -2.13 88.09 -0.41 gov_st 345.83 -0.15 166.57 -0.14 217.84 -0.76
deposit_st_dom 15.68 -0.41 9.15 -0.30 24.29 -0.23 gov_mt 245.00 -0.07 208.28 -0.16 108.63 -0.31
deposit_st_for 33.21 -0.23 27.99 -0.21 31.02 -0.39 deposit 1179.40 -0.10 660.30 -0.05 223.04 -0.25
deposit_lr_dom 20.64 -0.64 2.81 -0.54 6.42 -1.00 lending_dom 284.05 -0.13 136.22 -0.17 1750.80 -0.38
deposit_lr_for 9.75 -0.23 12.93 -0.15 14.96 -0.74 lending_for 97.89 -0.09 58.20 -0.46 21.15 -0.23
lending_st_dom 53.38 -0.22 21.45 -0.21 15.95 0.27 interbank 35.70 -0.25 40.25 -0.38 483.60 -0.20
lending_st_for 17.83 -1.27 64.92 -0.17 12.05 -0.13 Georgia F-Statistic ECT F-Statistic ECT F-Statistic ECT lending_lt_dom 42.24 -0.47 27.79 -1.00 7.15 -1.96 gov 92.69 -0.19 83.91 -0.11 61.51 -0.17
lending_lt_for 17.38 -0.39 41.36 -0.20 7.16 -1.12 deposit_dom 18.85 -0.32 8.01 -0.68 46.59 -0.43
interbank_dom 14.22 -0.25 8.74 -0.41 9.04 -1.63 deposit_for 13.00 -0.27 3.36 -1.00 52.85 -0.14
interbank_for 9.63 -0.57 14.21 -0.39 41.83 0.10 lending_dom 21.68 -0.27 6.21 -0.20 13.49 -0.28
lending_for 124.46 -0.04 36.30 -0.15 76.82 -0.09
interbank 22.77 -0.15 39.44 -0.34 NA NA Note: ECT refers to the error correction term. Bold and underlined formattings indicate statistical significance at the 1% and 5% levels, respectively.
15
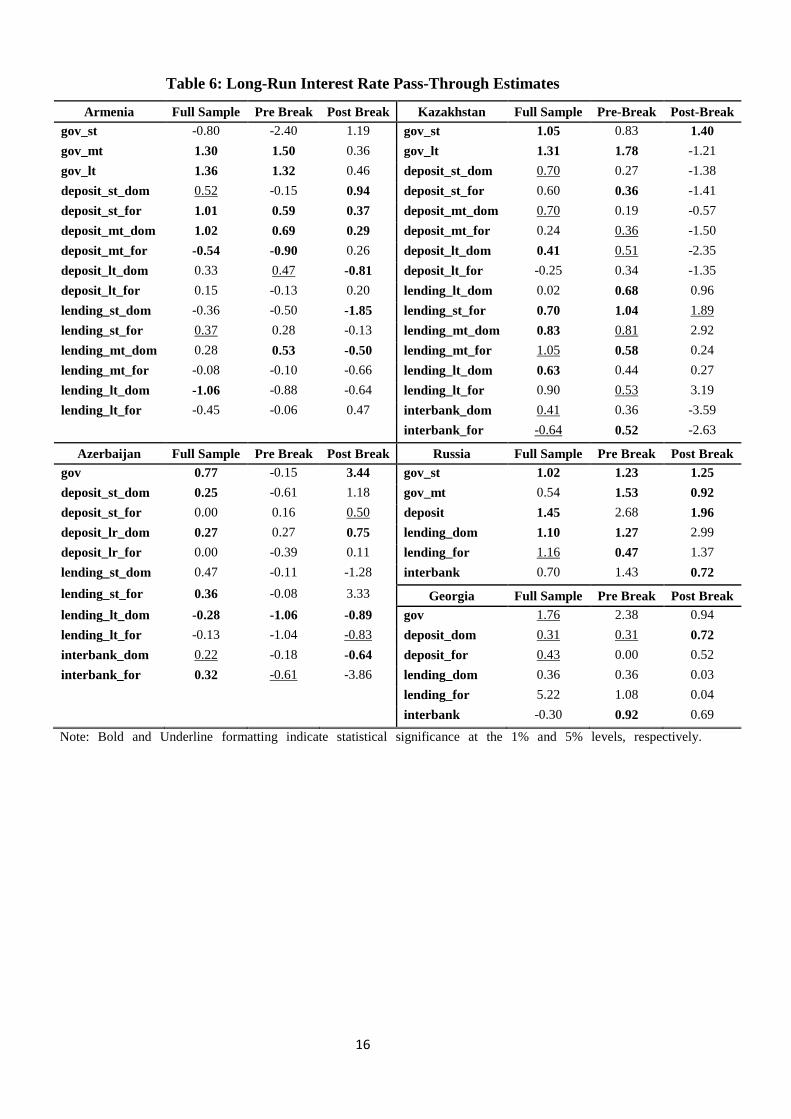
Table 6: Long-Run Interest Rate Pass-Through Estimates
Armenia Full Sample Pre Break Post Break Kazakhstan Full Sample Pre-Break Post-Break gov_st -0.80 -2.40 1.19 gov_st 1.05 0.83 1.40 gov_mt 1.30 1.50 0.36 gov_lt 1.31 1.78 -1.21 gov_lt 1.36 1.32 0.46 deposit_st_dom 0.70 0.27 -1.38 deposit_st_dom 0.52 -0.15 0.94 deposit_st_for 0.60 0.36 -1.41 deposit_st_for 1.01 0.59 0.37 deposit_mt_dom 0.70 0.19 -0.57 deposit_mt_dom 1.02 0.69 0.29 deposit_mt_for 0.24 0.36 -1.50 deposit_mt_for -0.54 -0.90 0.26 deposit_lt_dom 0.41 0.51 -2.35 deposit_lt_dom 0.33 0.47 -0.81 deposit_lt_for -0.25 0.34 -1.35 deposit_lt_for 0.15 -0.13 0.20 lending_lt_dom 0.02 0.68 0.96 lending_st_dom -0.36 -0.50 -1.85 lending_st_for 0.70 1.04 1.89 lending_st_for 0.37 0.28 -0.13 lending_mt_dom 0.83 0.81 2.92 lending_mt_dom 0.28 0.53 -0.50 lending_mt_for 1.05 0.58 0.24 lending_mt_for -0.08 -0.10 -0.66 lending_lt_dom 0.63 0.44 0.27 lending_lt_dom -1.06 -0.88 -0.64 lending_lt_for 0.90 0.53 3.19 lending_lt_for -0.45 -0.06 0.47 interbank_dom 0.41 0.36 -3.59
interbank_for -0.64 0.52 -2.63
Azerbaijan Full Sample Pre Break Post Break Russia Full Sample Pre Break Post Break gov 0.77 -0.15 3.44 gov_st 1.02 1.23 1.25 deposit_st_dom 0.25 -0.61 1.18 gov_mt 0.54 1.53 0.92 deposit_st_for 0.00 0.16 0.50 deposit 1.45 2.68 1.96 deposit_lr_dom 0.27 0.27 0.75 lending_dom 1.10 1.27 2.99 deposit_lr_for 0.00 -0.39 0.11 lending_for 1.16 0.47 1.37 lending_st_dom 0.47 -0.11 -1.28 interbank 0.70 1.43 0.72 lending_st_for 0.36 -0.08 3.33 Georgia Full Sample Pre Break Post Break lending_lt_dom -0.28 -1.06 -0.89 gov 1.76 2.38 0.94 lending_lt_for -0.13 -1.04 -0.83 deposit_dom 0.31 0.31 0.72 interbank_dom 0.22 -0.18 -0.64 deposit_for 0.43 0.00 0.52 interbank_for 0.32 -0.61 -3.86 lending_dom 0.36 0.36 0.03 lending_for 5.22 1.08 0.04 interbank -0.30 0.92 0.69
Note: Bold and Underline formatting indicate statistical significance at the 1% and 5% levels, respectively.
16
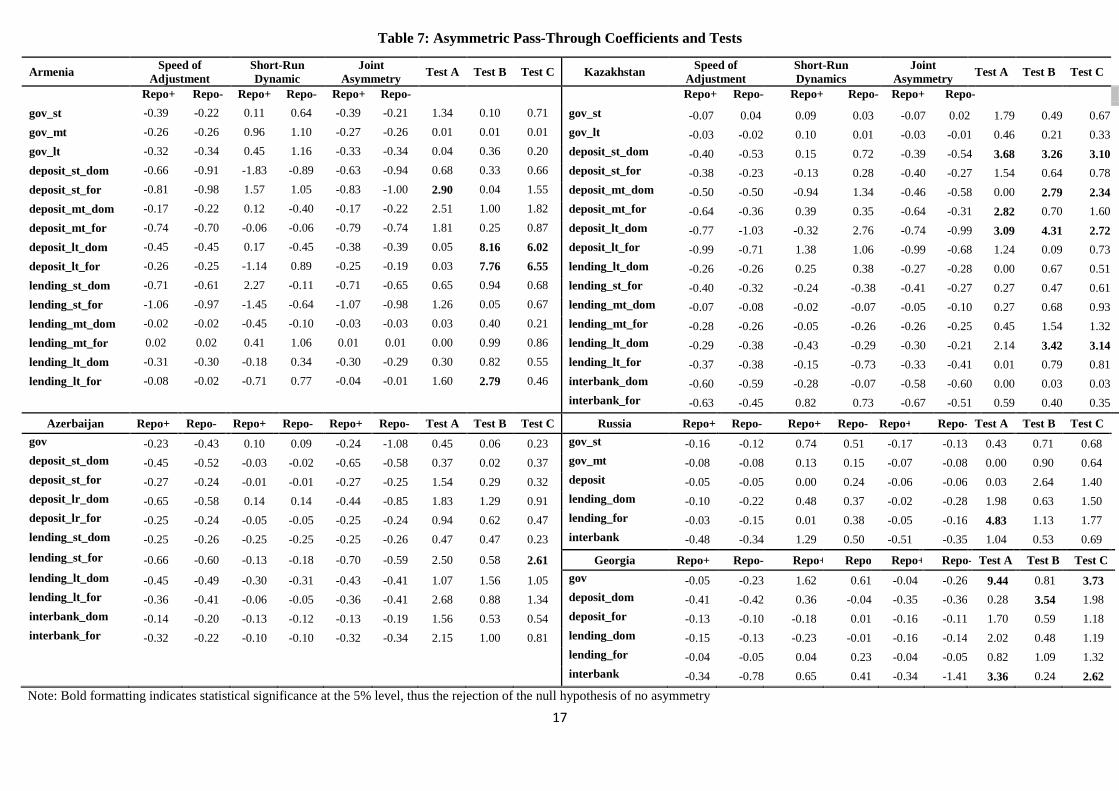
Table 7: Asymmetric Pass-Through Coefficients and Tests
Armenia Speed of Adjustment
Short-Run Dynamic
Joint Asymmetry Test A Test B Test C Kazakhstan Speed of
Adjustment Short-Run Dynamics
Joint Asymmetry Test A Test B Test C
Repo+ Repo- Repo+ Repo- Repo+ Repo- Repo+ Repo- Repo+ Repo- Repo+ Repo-
gov_st -0.39 -0.22 0.11 0.64 -0.39 -0.21 1.34 0.10 0.71 gov_st -0.07 0.04 0.09 0.03 -0.07 0.02 1.79 0.49 0.67 gov_mt -0.26 -0.26 0.96 1.10 -0.27 -0.26 0.01 0.01 0.01 gov_lt -0.03 -0.02 0.10 0.01 -0.03 -0.01 0.46 0.21 0.33 gov_lt -0.32 -0.34 0.45 1.16 -0.33 -0.34 0.04 0.36 0.20 deposit_st_dom -0.40 -0.53 0.15 0.72 -0.39 -0.54 3.68 3.26 3.10 deposit_st_dom -0.66 -0.91 -1.83 -0.89 -0.63 -0.94 0.68 0.33 0.66 deposit_st_for -0.38 -0.23 -0.13 0.28 -0.40 -0.27 1.54 0.64 0.78 deposit_st_for -0.81 -0.98 1.57 1.05 -0.83 -1.00 2.90 0.04 1.55 deposit_mt_dom -0.50 -0.50 -0.94 1.34 -0.46 -0.58 0.00 2.79 2.34 deposit_mt_dom -0.17 -0.22 0.12 -0.40 -0.17 -0.22 2.51 1.00 1.82 deposit_mt_for -0.64 -0.36 0.39 0.35 -0.64 -0.31 2.82 0.70 1.60 deposit_mt_for -0.74 -0.70 -0.06 -0.06 -0.79 -0.74 1.81 0.25 0.87 deposit_lt_dom -0.77 -1.03 -0.32 2.76 -0.74 -0.99 3.09 4.31 2.72 deposit_lt_dom -0.45 -0.45 0.17 -0.45 -0.38 -0.39 0.05 8.16 6.02 deposit_lt_for -0.99 -0.71 1.38 1.06 -0.99 -0.68 1.24 0.09 0.73 deposit_lt_for -0.26 -0.25 -1.14 0.89 -0.25 -0.19 0.03 7.76 6.55 lending_lt_dom -0.26 -0.26 0.25 0.38 -0.27 -0.28 0.00 0.67 0.51 lending_st_dom -0.71 -0.61 2.27 -0.11 -0.71 -0.65 0.65 0.94 0.68 lending_st_for -0.40 -0.32 -0.24 -0.38 -0.41 -0.27 0.27 0.47 0.61 lending_st_for -1.06 -0.97 -1.45 -0.64 -1.07 -0.98 1.26 0.05 0.67 lending_mt_dom -0.07 -0.08 -0.02 -0.07 -0.05 -0.10 0.27 0.68 0.93 lending_mt_dom -0.02 -0.02 -0.45 -0.10 -0.03 -0.03 0.03 0.40 0.21 lending_mt_for -0.28 -0.26 -0.05 -0.26 -0.26 -0.25 0.45 1.54 1.32 lending_mt_for 0.02 0.02 0.41 1.06 0.01 0.01 0.00 0.99 0.86 lending_lt_dom -0.29 -0.38 -0.43 -0.29 -0.30 -0.21 2.14 3.42 3.14 lending_lt_dom -0.31 -0.30 -0.18 0.34 -0.30 -0.29 0.30 0.82 0.55 lending_lt_for -0.37 -0.38 -0.15 -0.73 -0.33 -0.41 0.01 0.79 0.81 lending_lt_for -0.08 -0.02 -0.71 0.77 -0.04 -0.01 1.60 2.79 0.46 interbank_dom -0.60 -0.59 -0.28 -0.07 -0.58 -0.60 0.00 0.03 0.03 interbank_for -0.63 -0.45 0.82 0.73 -0.67 -0.51 0.59 0.40 0.35
Azerbaijan Repo+ Repo- Repo+ Repo- Repo+ Repo- Test A Test B Test C Russia Repo+ Repo- Repo+ Repo- Repo+ Repo- Test A Test B Test C gov -0.23 -0.43 0.10 0.09 -0.24 -1.08 0.45 0.06 0.23 gov_st -0.16 -0.12 0.74 0.51 -0.17 -0.13 0.43 0.71 0.68 deposit_st_dom -0.45 -0.52 -0.03 -0.02 -0.65 -0.58 0.37 0.02 0.37 gov_mt -0.08 -0.08 0.13 0.15 -0.07 -0.08 0.00 0.90 0.64 deposit_st_for -0.27 -0.24 -0.01 -0.01 -0.27 -0.25 1.54 0.29 0.32 deposit -0.05 -0.05 0.00 0.24 -0.06 -0.06 0.03 2.64 1.40 deposit_lr_dom -0.65 -0.58 0.14 0.14 -0.44 -0.85 1.83 1.29 0.91 lending_dom -0.10 -0.22 0.48 0.37 -0.02 -0.28 1.98 0.63 1.50 deposit_lr_for -0.25 -0.24 -0.05 -0.05 -0.25 -0.24 0.94 0.62 0.47 lending_for -0.03 -0.15 0.01 0.38 -0.05 -0.16 4.83 1.13 1.77 lending_st_dom -0.25 -0.26 -0.25 -0.25 -0.25 -0.26 0.47 0.47 0.23 interbank -0.48 -0.34 1.29 0.50 -0.51 -0.35 1.04 0.53 0.69 lending_st_for -0.66 -0.60 -0.13 -0.18 -0.70 -0.59 2.50 0.58 2.61 Georgia Repo+ Repo- Repo+ Repo- Repo+ Repo- Test A Test B Test C lending_lt_dom -0.45 -0.49 -0.30 -0.31 -0.43 -0.41 1.07 1.56 1.05 gov -0.05 -0.23 1.62 0.61 -0.04 -0.26 9.44 0.81 3.73 lending_lt_for -0.36 -0.41 -0.06 -0.05 -0.36 -0.41 2.68 0.88 1.34 deposit_dom -0.41 -0.42 0.36 -0.04 -0.35 -0.36 0.28 3.54 1.98 interbank_dom -0.14 -0.20 -0.13 -0.12 -0.13 -0.19 1.56 0.53 0.54 deposit_for -0.13 -0.10 -0.18 0.01 -0.16 -0.11 1.70 0.59 1.18 interbank_for -0.32 -0.22 -0.10 -0.10 -0.32 -0.34 2.15 1.00 0.81 lending_dom -0.15 -0.13 -0.23 -0.01 -0.16 -0.14 2.02 0.48 1.19 lending_for -0.04 -0.05 0.04 0.23 -0.04 -0.05 0.82 1.09 1.32 interbank -0.34 -0.78 0.65 0.41 -0.34 -1.41 3.36 0.24 2.62 Note: Bold formatting indicates statistical significance at the 5% level, thus the rejection of the null hypothesis of no asymmetry
17