Embed Size (px)
Citation preview
New Response Evaluation Criteria in Solid Tumors:
REVISED RECIST GUIDELINE (Version 1.1)
E.A. Eisenhauer, P. Therasse, J. Bogaerts, L. H. Schwartz, D. Sargent, R. Ford, J. Dancey, S. Arbuck, S.
Gwyther, M. Mooney, L. Rubinstein, L. Shankar, L. Dodd, R. Kaplan, D. Lacombe, J. Verweij
EORTC-NCI-AACR
October 22, 2008

Response Evaluation Criteria in Solid
Tumors (RECIST) Therasse et al JNCI 2000
• Intended for use in clinical trials with primary endpoint of objective response
• Measurable lesion >= 20 mm (10 if spiral CT)
• Unidimensional assessment: Tumor burden assessed by summing longest diameters of all measurable lesions up to 10 (5 per organ)
• Four categories of response: CR*, PR*, SD, PD
• RECIST widely adopted by cooperative groups, industry, academia
* Required confirmation

Issues since 2000
• RECIST Working Group committed to revisiting/updating criteria
• Several issues identified:
– 10 lesions needed?
– Confirmation needed?
– Use in randomized trials with progression endpoint: how to assess PD in patients with non-measurable disease?
– Lymph node assessment?
– Functional instead of anatomical imaging?
Is there still a role for anatomical-based imaging in clinical trials?
• Yes:
– PFS and RFS key endpoints in many randomized trials: these endpoints are anatomically based
– Response or variants (e.g. waterfall plot) remain important tools to screen new agents in phase II, and are based on assessment of change in anatomical tumor burden

Process
• RECIST working group:
– International in membership
– Clinical researchers, industry, imaging experts, NCI, NCRN UK, EORTC, NCIC CTG
• Evidence based approach to questions:
– Literature
– Data analysis

Process (2)
• Data driven:
– Data warehouse:
• Prospectively collected tumor measurement data from clinical trials: Cooperative Groups and Pharma
• >6500 patients, >18,000 lesions in one database
• Used to investigate various options for changes and their impact on patient and overall outcomes
– Simulation studies:
• Used to investigate the impact of measurement error on various options for changes
Process (3)
• Proposed changes to guideline widely distributed for comment (academia, research organizations, industry, regulatory authorities) and guideline updated based on feedback
• Revised RECIST 1.1 to be published in special issue European Journal of Cancer January 2009 simultaneously with papers supporting changes

RECIST 1.1

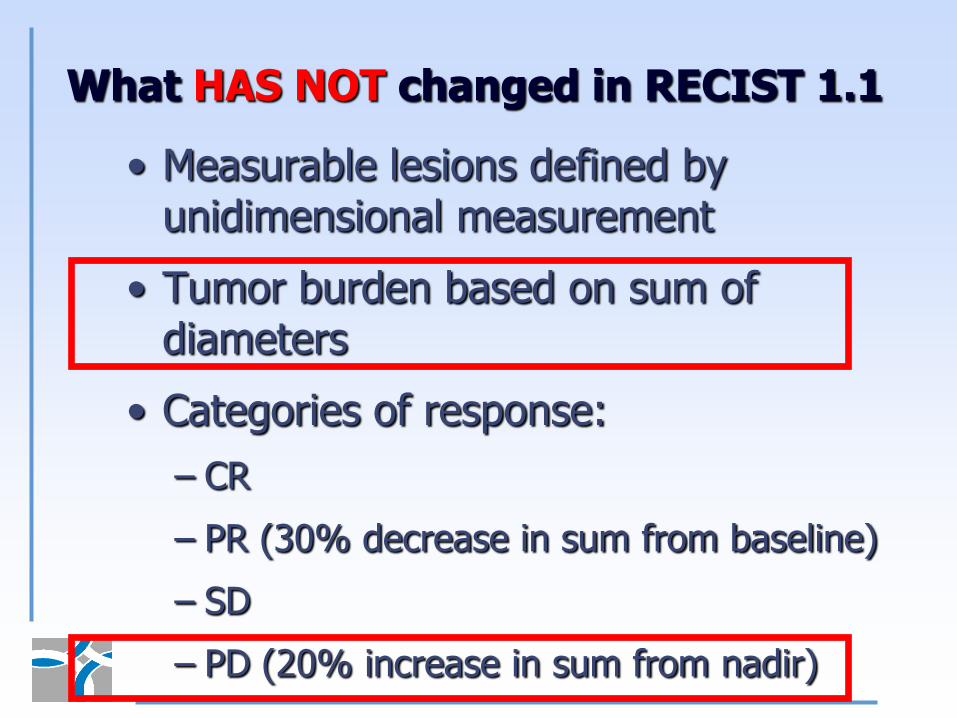
What HAS NOT changed in RECIST 1.1
• Measurable lesions defined by unidimensional measurement
• Tumor burden based on sum of diameters
• Categories of response:
– CR
– PR (30% decrease in sum from baseline)
– SD
– PD (20% increase in sum from nadir)

For example: Response classification same…
Time point Response: Patients with Target (+/- non-target) Disease:
Target lesions
Non-Target lesions New Lesions Overall response
CR CR No CR
CR Non-CR/Non-PD No PR
CR Not evaluated No PR
PR Non-PD or not all evaluated No PR
SD Non-PD or not all evaluated No SD
Not all evaluated
Non-PD No NE
PD Any Any PD
Any PD Any PD
Any Any Yes PD
What HAS NOT changed in RECIST 1.1
• Measurable lesions defined by unidimensional measurement
• Tumor burden based on sum of diameters
• Categories of response:
– CR
– PR (30% decrease in sum from baseline)
– SD
– PD (20% increase in sum from nadir)

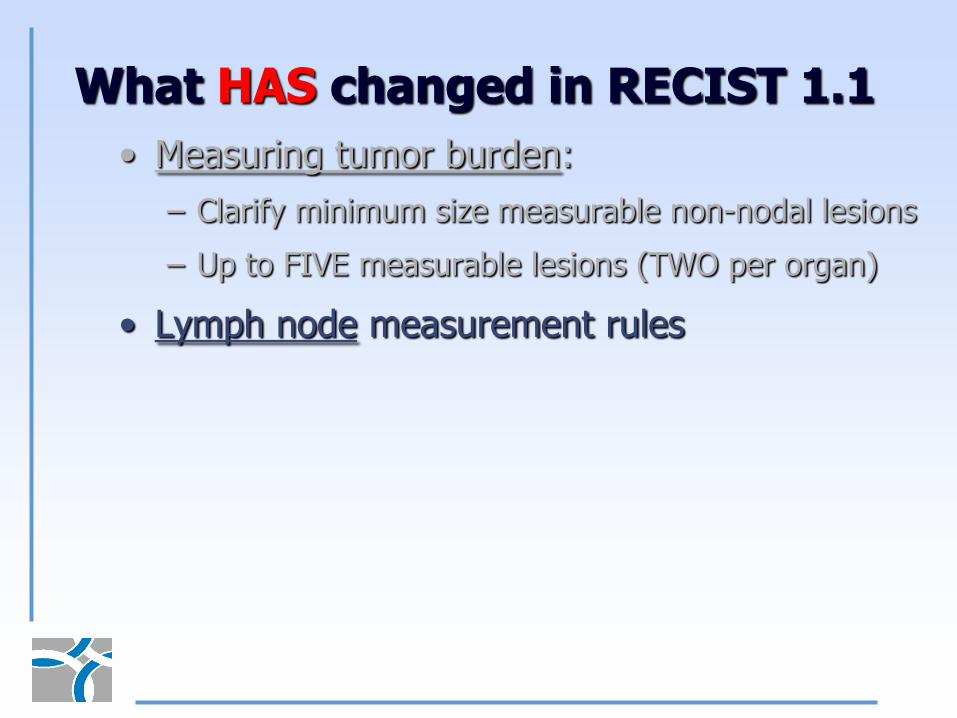
What HAS changed in RECIST 1.1
• Measuring tumor burden:
– Clarify minimum size measurable non-nodal lesions
– Up to FIVE measurable lesions (TWO per organ)
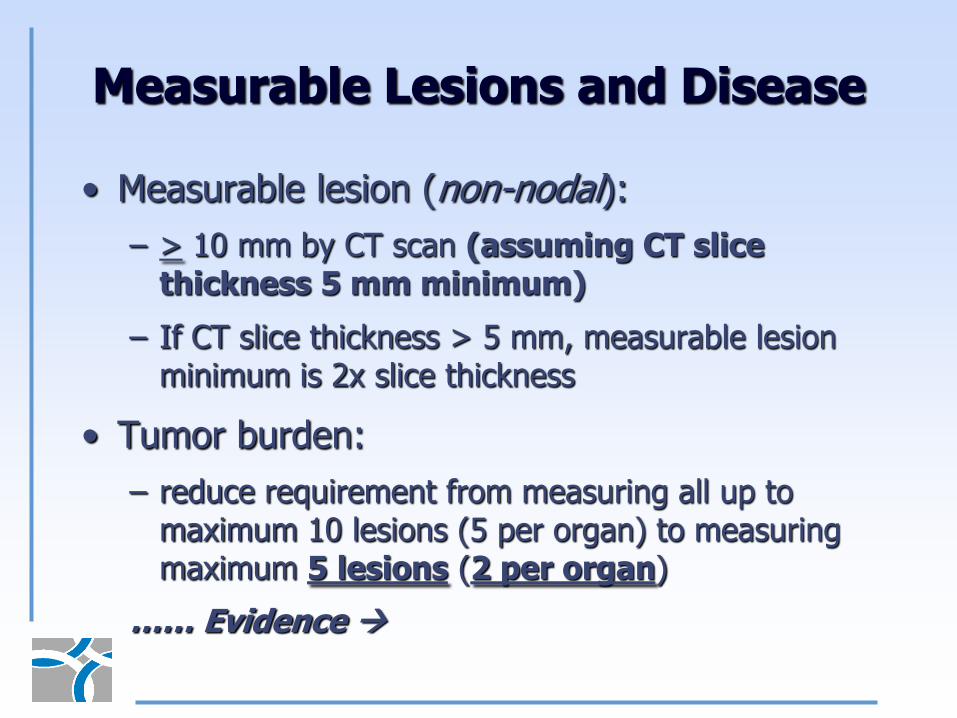
Measurable Lesions and Disease
• Measurable lesion (non-nodal):
– > 10 mm by CT scan (assuming CT slice thickness 5 mm minimum)
– If CT slice thickness > 5 mm, measurable lesion minimum is 2x slice thickness
• Tumor burden:
– reduce requirement from measuring all up to maximum 10 lesions (5 per organ) to measuring maximum 5 lesions (2 per organ)
…… Evidence
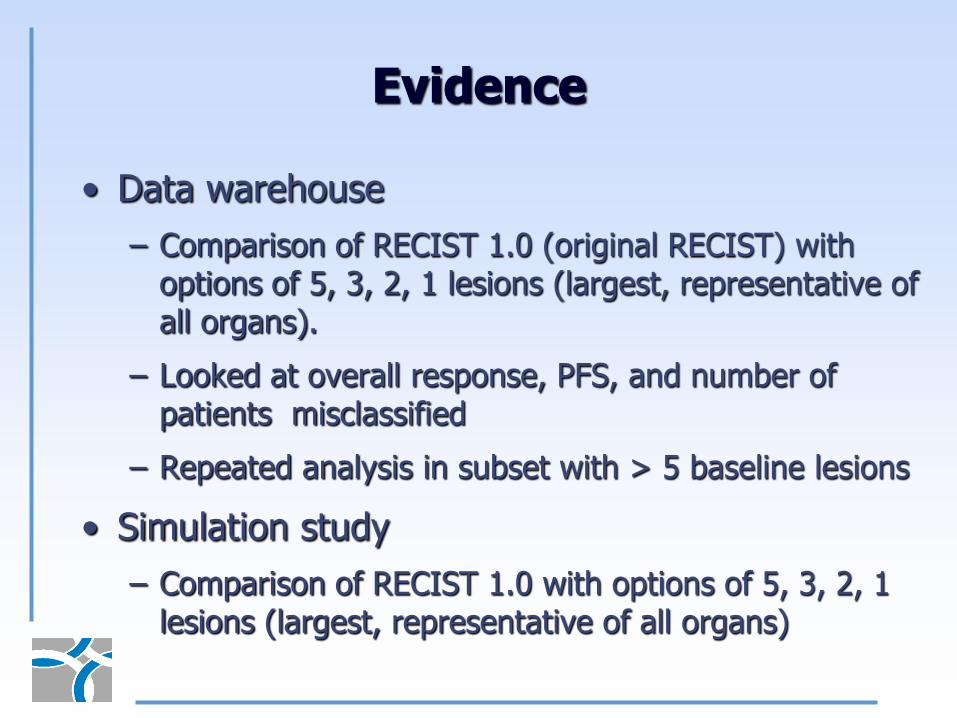
Evidence
• Data warehouse
– Comparison of RECIST 1.0 (original RECIST) with options of 5, 3, 2, 1 lesions (largest, representative of all organs).
– Looked at overall response, PFS, and number of patients misclassified
– Repeated analysis in subset with > 5 baseline lesions
• Simulation study
– Comparison of RECIST 1.0 with options of 5, 3, 2, 1 lesions (largest, representative of all organs)

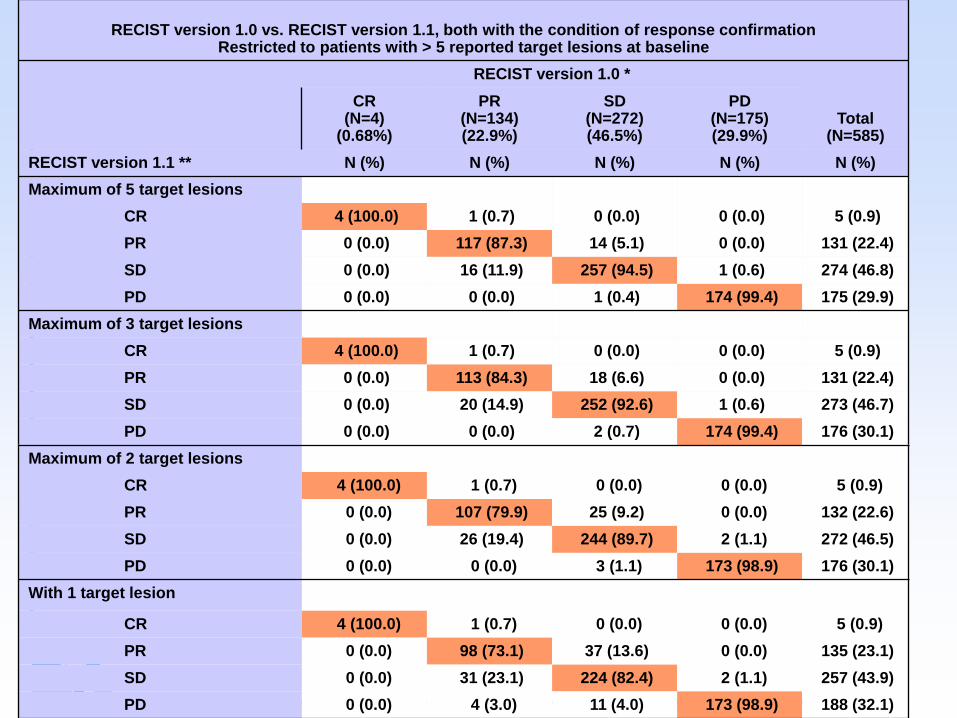
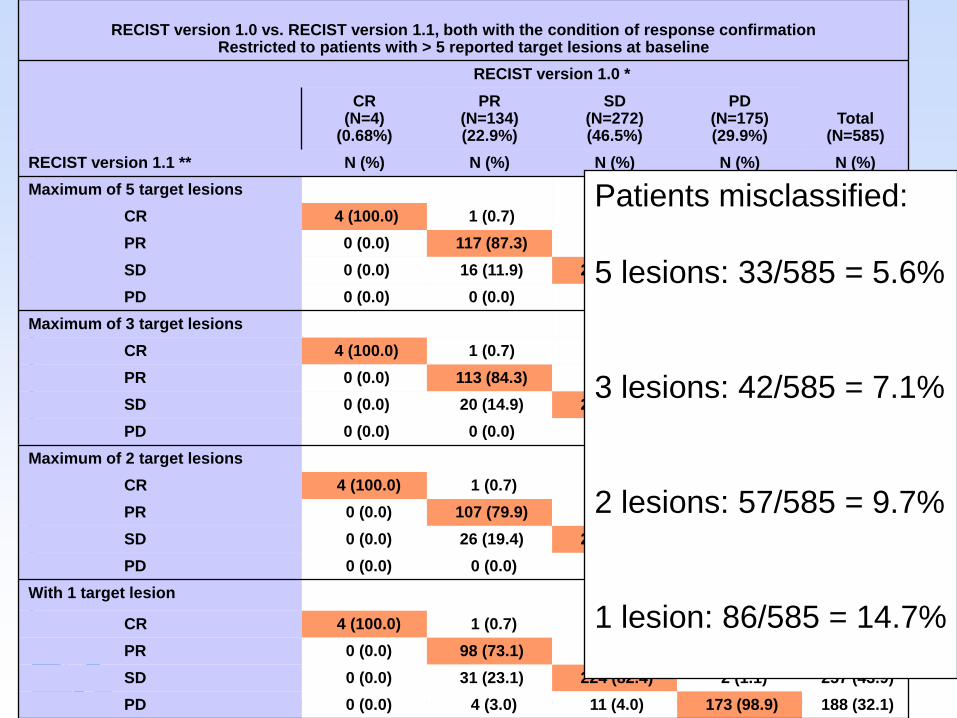
RECIST version 1.0 vs. RECIST version 1.1, both with the condition of response confirmation
Restricted to patients with > 5 reported target lesions at baseline
RECIST version 1.0 *
Total(N=585)
CR(N=4)
(0.68%)
PR(N=134)(22.9%)
SD(N=272)(46.5%)
PD(N=175)(29.9%)
RECIST version 1.1 ** N (%) N (%) N (%) N (%) N (%)
Maximum of 5 target lesions
CR 4 (100.0) 1 (0.7) 0 (0.0) 0 (0.0) 5 (0.9)
PR 0 (0.0) 117 (87.3) 14 (5.1) 0 (0.0) 131 (22.4)
SD 0 (0.0) 16 (11.9) 257 (94.5) 1 (0.6) 274 (46.8)
PD 0 (0.0) 0 (0.0) 1 (0.4) 174 (99.4) 175 (29.9)
Maximum of 3 target lesions
CR 4 (100.0) 1 (0.7) 0 (0.0) 0 (0.0) 5 (0.9)
PR 0 (0.0) 113 (84.3) 18 (6.6) 0 (0.0) 131 (22.4)
SD 0 (0.0) 20 (14.9) 252 (92.6) 1 (0.6) 273 (46.7)
PD 0 (0.0) 0 (0.0) 2 (0.7) 174 (99.4) 176 (30.1)
Maximum of 2 target lesions
CR 4 (100.0) 1 (0.7) 0 (0.0) 0 (0.0) 5 (0.9)
PR 0 (0.0) 107 (79.9) 25 (9.2) 0 (0.0) 132 (22.6)
SD 0 (0.0) 26 (19.4) 244 (89.7) 2 (1.1) 272 (46.5)
PD 0 (0.0) 0 (0.0) 3 (1.1) 173 (98.9) 176 (30.1)
With 1 target lesion
CR 4 (100.0) 1 (0.7) 0 (0.0) 0 (0.0) 5 (0.9)
PR 0 (0.0) 98 (73.1) 37 (13.6) 0 (0.0) 135 (23.1)
SD 0 (0.0) 31 (23.1) 224 (82.4) 2 (1.1) 257 (43.9)
PD 0 (0.0) 4 (3.0) 11 (4.0) 173 (98.9) 188 (32.1)
RECIST version 1.0 vs. RECIST version 1.1, both with the condition of response confirmation Restricted to patients with > 5 reported target lesions at baseline
RECIST version 1.0 *
Total(N=585)
CR(N=4)
(0.68%)
PR(N=134)(22.9%)
SD(N=272)(46.5%)
PD(N=175)(29.9%)
RECIST version 1.1 ** N (%) N (%) N (%) N (%) N (%)
Maximum of 5 target lesions
CR 4 (100.0) 1 (0.7) 0 (0.0) 0 (0.0) 5 (0.9)
PR 0 (0.0) 117 (87.3) 14 (5.1) 0 (0.0) 131 (22.4)
SD 0 (0.0) 16 (11.9) 257 (94.5) 1 (0.6) 274 (46.8)
PD 0 (0.0) 0 (0.0) 1 (0.4) 174 (99.4) 175 (29.9)
Maximum of 3 target lesions
CR 4 (100.0) 1 (0.7) 0 (0.0) 0 (0.0) 5 (0.9)
PR 0 (0.0) 113 (84.3) 18 (6.6) 0 (0.0) 131 (22.4)
SD 0 (0.0) 20 (14.9) 252 (92.6) 1 (0.6) 273 (46.7)
PD 0 (0.0) 0 (0.0) 2 (0.7) 174 (99.4) 176 (30.1)
Maximum of 2 target lesions
CR 4 (100.0) 1 (0.7) 0 (0.0) 0 (0.0) 5 (0.9)
PR 0 (0.0) 107 (79.9) 25 (9.2) 0 (0.0) 132 (22.6)
SD 0 (0.0) 26 (19.4) 244 (89.7) 2 (1.1) 272 (46.5)
PD 0 (0.0) 0 (0.0) 3 (1.1) 173 (98.9) 176 (30.1)
With 1 target lesion
CR 4 (100.0) 1 (0.7) 0 (0.0) 0 (0.0) 5 (0.9)
PR 0 (0.0) 98 (73.1) 37 (13.6) 0 (0.0) 135 (23.1)
SD 0 (0.0) 31 (23.1) 224 (82.4) 2 (1.1) 257 (43.9)
PD 0 (0.0) 4 (3.0) 11 (4.0) 173 (98.9) 188 (32.1)
Patients misclassified:
5 lesions: 33/585 = 5.6%
3 lesions: 42/585 = 7.1%
2 lesions: 57/585 = 9.7%
1 lesion: 86/585 = 14.7%

Impact on PFS: Using 3 or 5 lesions vs. RECIST 1.0
Patients with more than 5 target lesions at baseline
RECIST versionPatients Observed
Events
Median (95% CI)
(Months)
% at 6 months
(95% CI)
Version 1.1
3 targets585 409
5.22
(4.34, 5.55)
42.89
(38.46, 47.24)
Version 1.1
5 targets585 409
5.22
(4.47, 5.68)
43.67
(39.24, 48.01)
Version 1.0 585 4095.26
(4.70, 5.65)
43.02
(38.59, 47.38)
All patients
RECIST versionPatients Observed
Events
Median (95% CI)
(Months)
% at 0.5 Year(s)
(95% CI)
Version 1.1
3 targets6512 4501
6.31
(6.21, 6.44)
53.75
(52.44, 55.04)
Version 1.1
5 targets6512 4502
6.31
(6.21, 6.44)
53.78
(52.47, 55.07)
Version 1.0 6512 45316.31
(6.21, 6.44)
53.62
(52.31, 54.91)

Effect of Measurement error:The Simulation Process

Response classification in trials with a high response rate: proportion of patients classified
discordantly into responders and non-responders
Number of lesions being
compared
Trial Size: N=25 Trial Size: N=50 Trial Size: N=100
Radiologist 1 Radiologist 2 Radiologist 1 Radiologist 2 Radiologist 1 Radiologist 2
10 vs 5 0.01 0.01 0.01 0.01 0.01 0.0110 vs 3 0.03 0.03 0.03 0.03 0.03 0.0310 vs 2 0.06 0.05 0.05 0.05 0.05 0.0510 vs 1 0.12 0.11 0.12 0.12 0.12 0.12
5 vs 3 0.02 0.02 0.02 0.02 0.02 0.025 vs 2 0.05 0.05 0.05 0.05 0.05 0.055 vs1 0.11 0.11 0.11 0.12 0.11 0.11
3 vs 2 0.04 0.03 0.04 0.04 0.04 0.043 vs 1 0.10 0.10 0.11 0.11 0.11 0.11
2 vs 1 0.09 0.09 0.09 0.09 0.09 0.09

Trial with low response rate: average response rates across 1000 simulated trials
N Number of lesions
measured
Response rate (%)Radiologist
Overall proportion of
agreement1 2
25 10 8% 8% 1.005 8% 8% 0.993 10% 10% 0.962 13% 13% 0.901 22% 22% 0.76
50 10 10% 10% 1.005 10% 10% 1.003 12% 12% 0.962 16% 15% 0.901 24% 24% 0.76
100 10 10% 10% 1.005 10% 10% 0.993 12% 12% 0.962 15% 15% 0.901 24% 24% 0.76
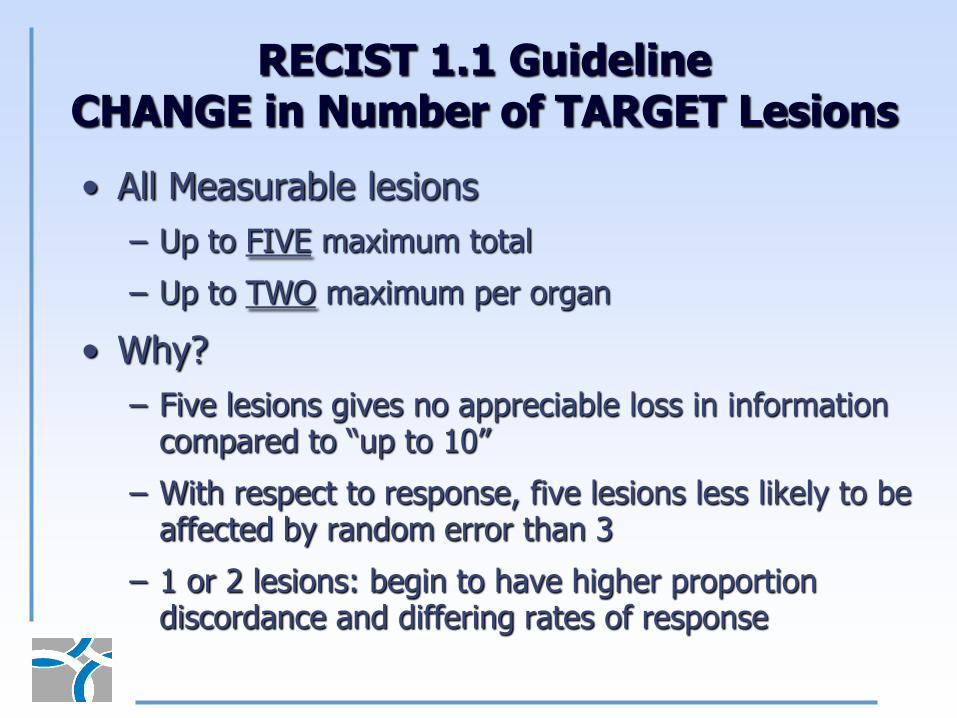
RECIST 1.1 Guideline CHANGE in Number of TARGET Lesions
• All Measurable lesions
– Up to FIVE maximum total
– Up to TWO maximum per organ
• Why?
– Five lesions gives no appreciable loss in information compared to ―up to 10‖
– With respect to response, five lesions less likely to be affected by random error than 3
– 1 or 2 lesions: begin to have higher proportion discordance and differing rates of response

Concern Regarding Number of Lesions
Baseline Follow Up
Stable
PD
Lesion 1
Lesion 2

Concern Regarding Number of Lesions
Baseline Follow Up
Stable
PD
Lesion 1
Lesion 2
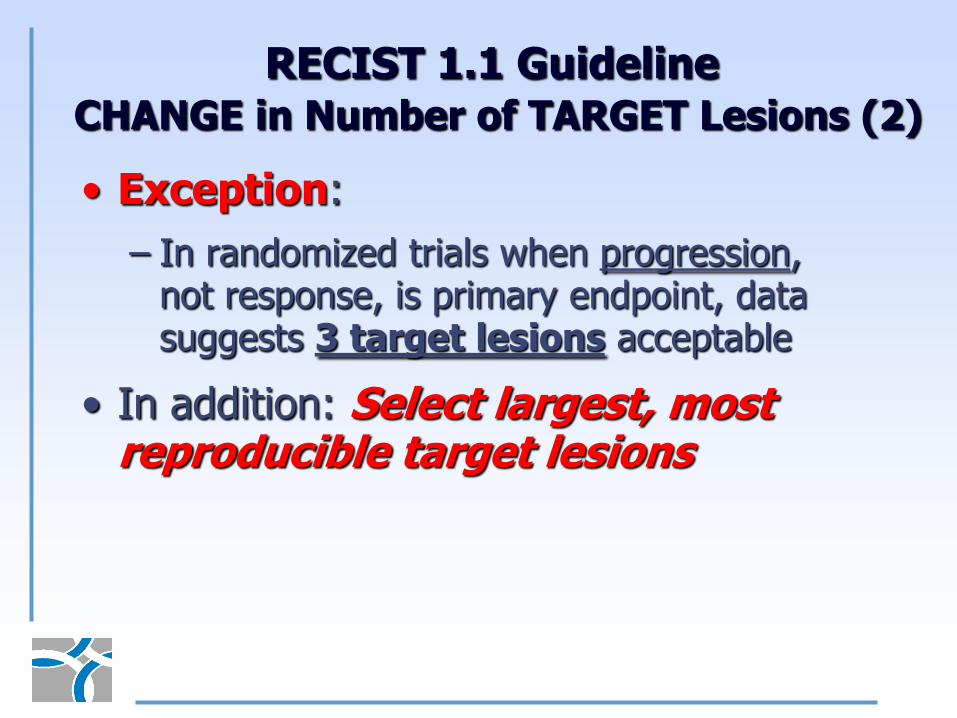
RECIST 1.1 Guideline CHANGE in Number of TARGET Lesions (2)
• Exception:
– In randomized trials when progression, not response, is primary endpoint, data suggests 3 target lesions acceptable
• In addition: Select largest, most reproducible target lesions
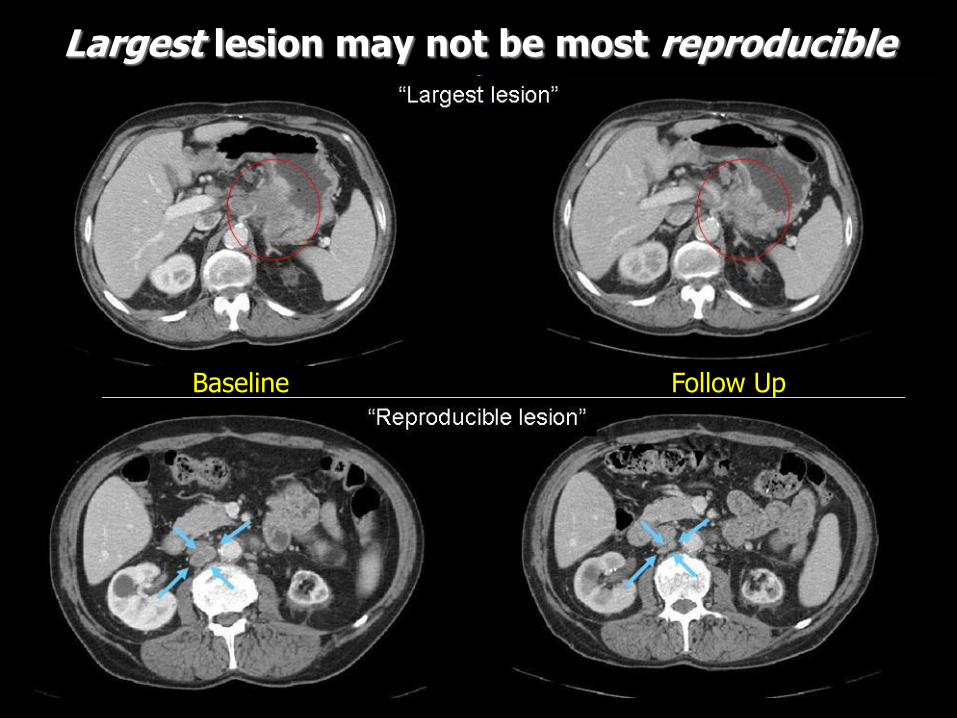
Largest lesion may not be most reproducible
Baseline Follow Up
What HAS changed in RECIST 1.1
• Measuring tumor burden:
– Clarify minimum size measurable non-nodal lesions
– Up to FIVE measurable lesions (TWO per organ)
• Lymph node measurement rules

Lymph Node assessment• Measure SHORT axis
– Target lesion if short axis > 15 mm
– Non-target if short axis 10 to < 15 mm
– Normal if short axis < 10 mm
• Add ACTUAL short axis measurement to sum of longest diameters of non-nodal lesions
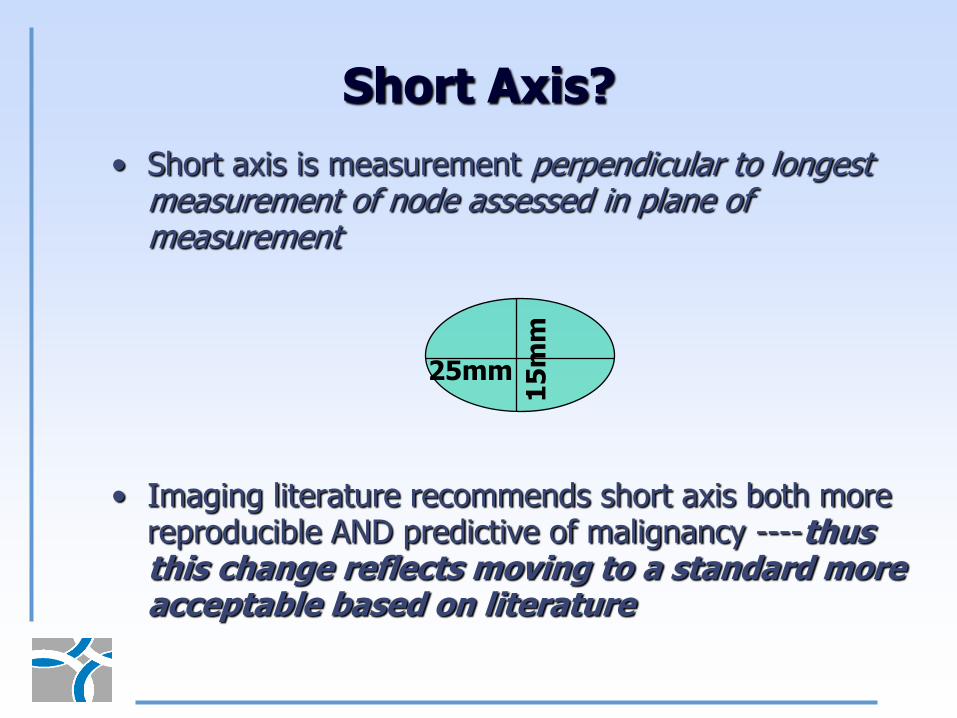
Short Axis?
• Short axis is measurement perpendicular to longest measurement of node assessed in plane of measurement
• Imaging literature recommends short axis both more reproducible AND predictive of malignancy ----thus this change reflects moving to a standard more acceptable based on literature
25mm
15
mm
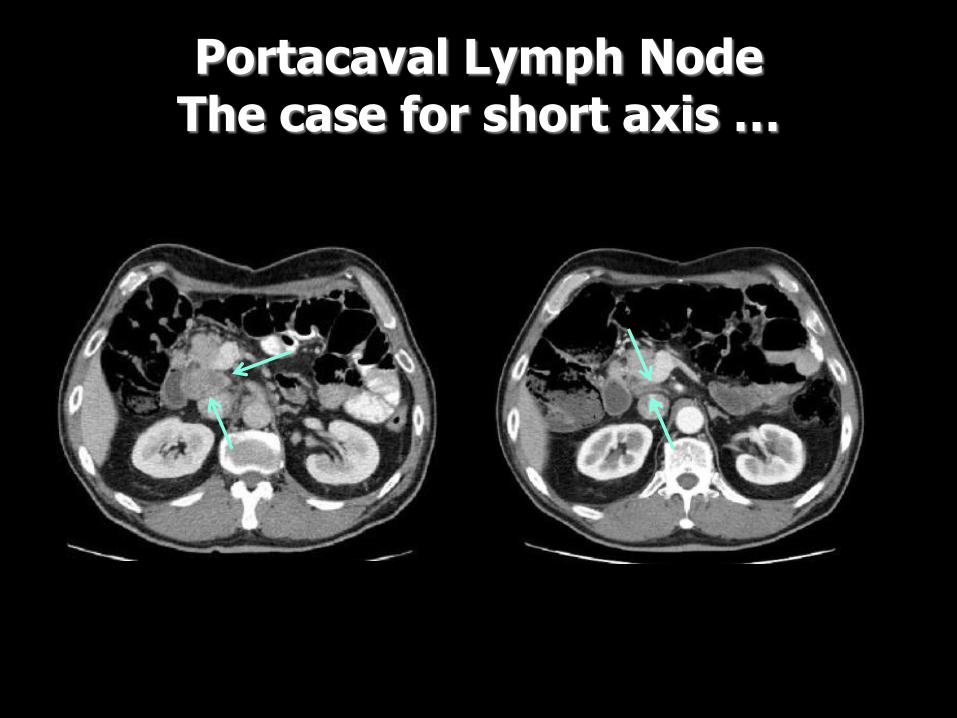
Portacaval Lymph NodeThe case for short axis …
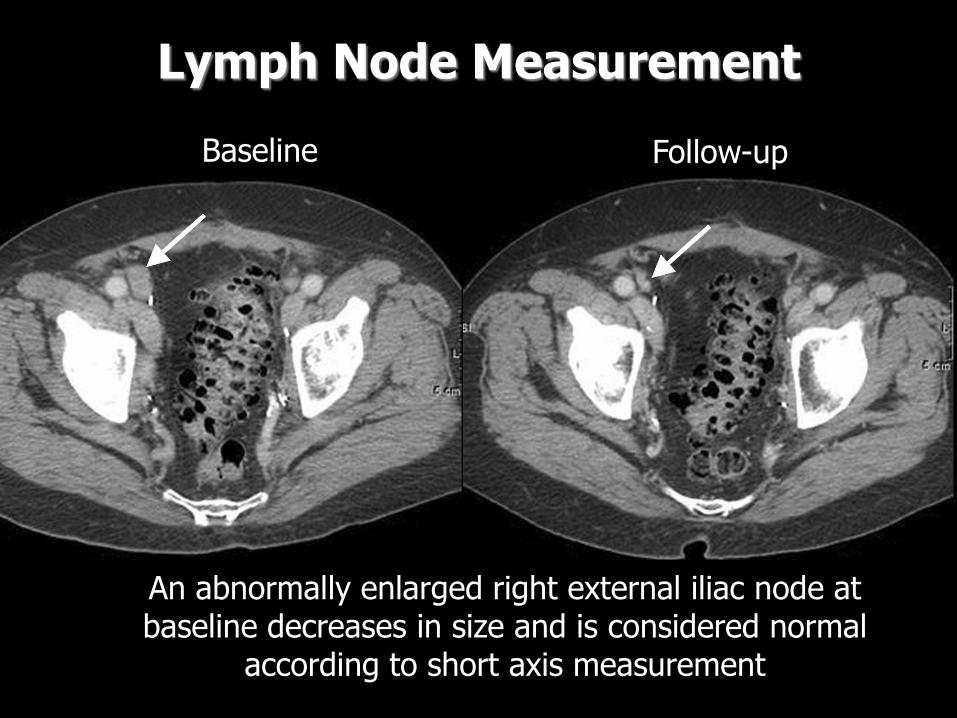
Lymph Node Measurement
An abnormally enlarged right external iliac node at baseline decreases in size and is considered normal
according to short axis measurement
Baseline Follow-up
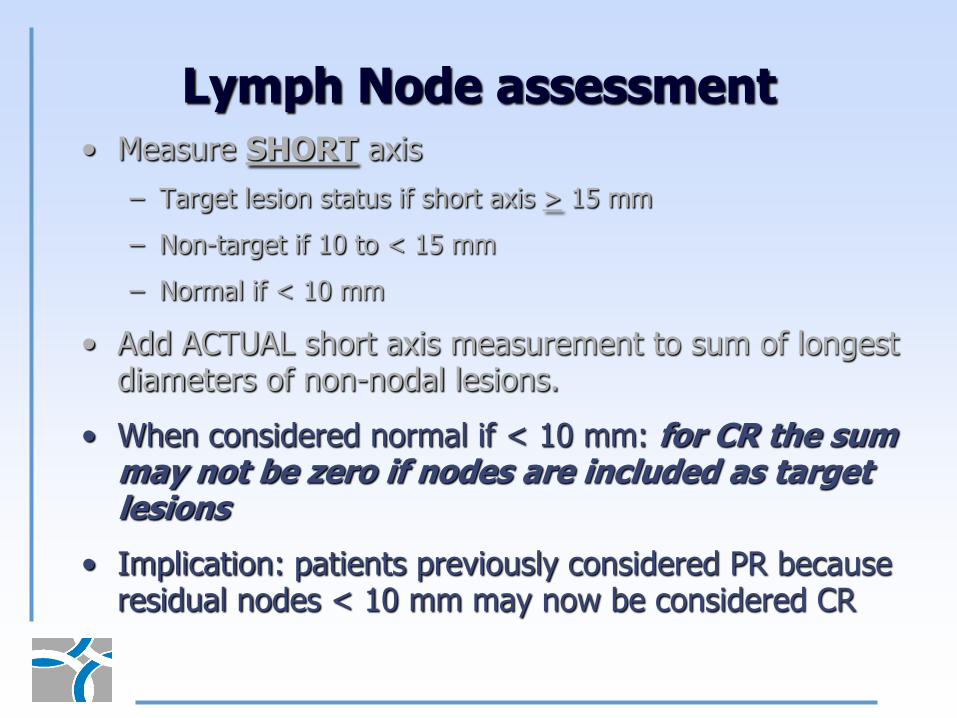
Lymph Node assessment• Measure SHORT axis
– Target lesion status if short axis > 15 mm
– Non-target if 10 to < 15 mm
– Normal if < 10 mm
• Add ACTUAL short axis measurement to sum of longest diameters of non-nodal lesions.
• When considered normal if < 10 mm: for CR the sum may not be zero if nodes are included as target lesions
• Implication: patients previously considered PR because residual nodes < 10 mm may now be considered CR

Impact of “new” Lymph node rule:Data warehouse analyses
Response Assessment using only Lymph Node information
RECIST 1.0
Total
(N=1235)
CR
(N=233)
PR
(N=365)
SD
(N=505)
PD
(N=77)
NA
(N=55)
N (%) N (%) N (%) N (%) N (%) N (%)
RECIST 1.1
CR 230 (98.7) 82 (22.5) 3 (0.6) 0 (0.0) 0 (0.0) 315 (25.5)
PR 0 (0.0) 245 (67.1) 74 (14.7) 1 (1.3) 1 (1.8) 321 (26.0)
SD 2 (0.9) 36 (9.9) 408 (80.8) 33 (42.9) 0 (0.0) 479 (38.8)
PD 1 (0.4) 2 (0.5) 20 (4.0) 36 (46.8) 4 (7.3) 63 (5.1)
NA 0 (0.0) 0 (0.0) 0 (0.0) 7 (9.1) 50 (90.9) 57 (4.6)
As predicted, this has changed best response assessment, but the overall impact is less than noted here since this analysis includes
ONLY lymph node targets --- not all targets. Further, this is closer to “truth” than old RECIST

What HAS changed in RECIST 1.1
• Measuring tumor burden:
– Clarify minimum size measurable non-nodal lesions
– Up to FIVE measurable lesions (TWO per organ)
• Lymph node measurement rules
• Progressive disease:
– Requires not only 20% increase but absolute increase
– Definition for non-measurable disease expanded

Progressive Disease
• Minimum increase for Sum of Targets:
– Problem noted: when sum becomes verysmall then increases of 2-3 mm may mean ―PD‖ since that represents 20% increase—in fact this may be measurement error
– Therefore revised guideline recommends PD in target disease requires BOTH:
• 20% increase over lowest sum AND
• Minimum 5 mm increase over lowest sum
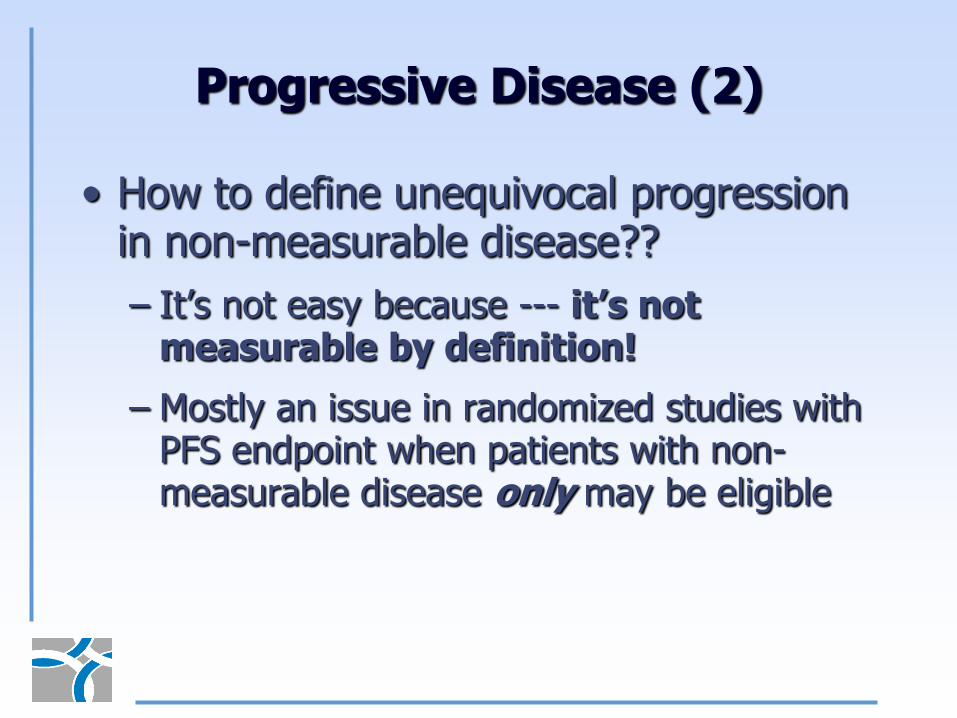
Progressive Disease (2)
• How to define unequivocal progression in non-measurable disease??
– It’s not easy because --- it’s not measurable by definition!
– Mostly an issue in randomized studies with PFS endpoint when patients with non-measurable disease only may be eligible
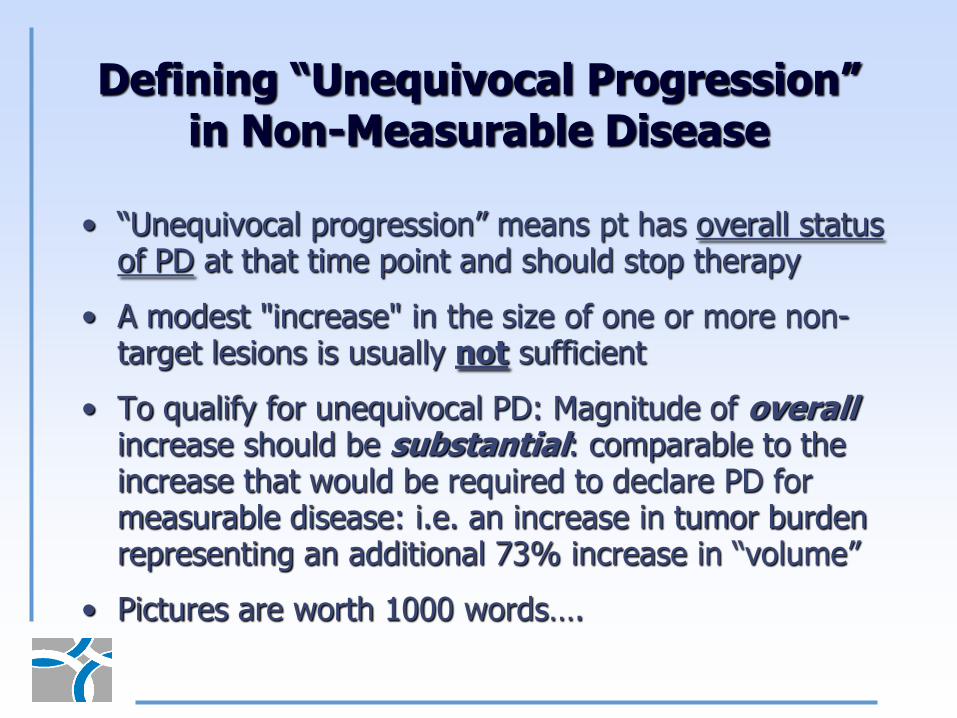
Defining “Unequivocal Progression” in Non-Measurable Disease
• ―Unequivocal progression‖ means pt has overall status of PD at that time point and should stop therapy
• A modest "increase" in the size of one or more non-target lesions is usually not sufficient
• To qualify for unequivocal PD: Magnitude of overallincrease should be substantial: comparable to the increase that would be required to declare PD for measurable disease: i.e. an increase in tumor burden representing an additional 73% increase in ―volume‖
• Pictures are worth 1000 words….
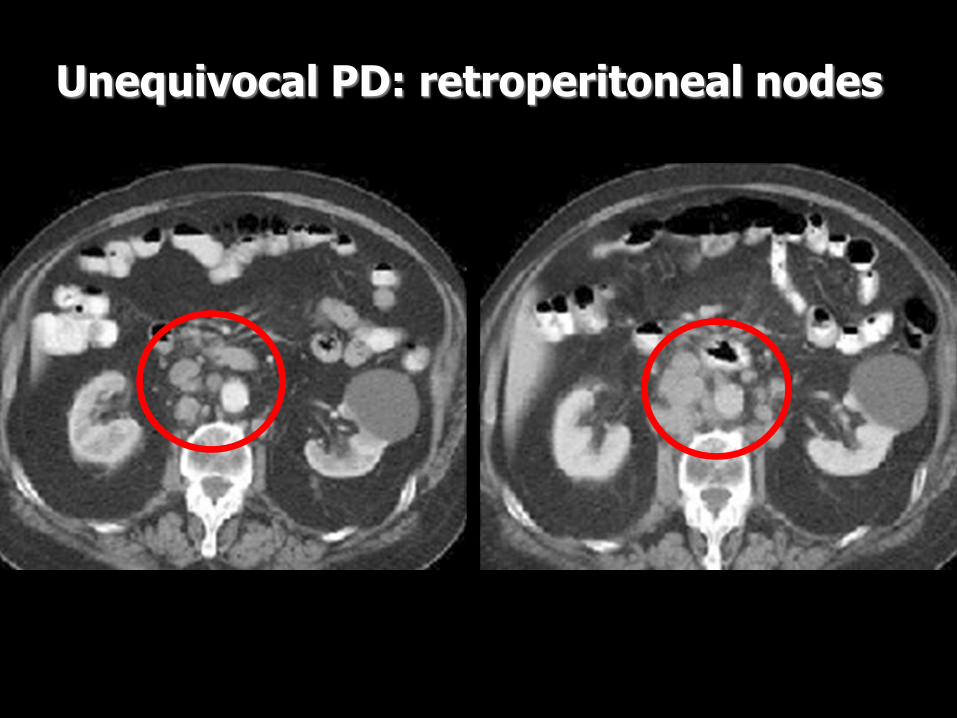
Unequivocal PD: retroperitoneal nodes
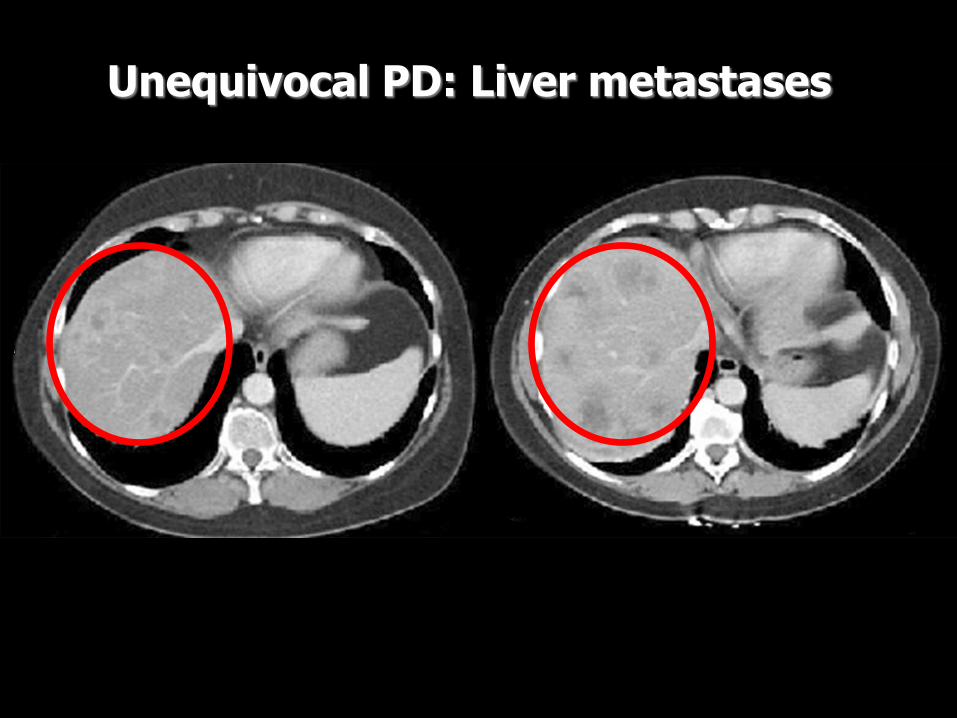
Unequivocal PD: Liver metastases

What HAS changed in RECIST 1.1
• Measuring tumor burden: – Clarify minimum size measurable non-nodal lesions
– Up to FIVE measurable lesions (TWO per organ)
• Lymph node measurement rules
• Progressive disease:
– Requires not only 20% increase but absolute increase
– Definition for non-measurable disease expanded
• Confirmation needed?

Confirmation of Response
• What is the impact on overall response rate if confirmation NOT required?
• Data warehouse used to address this

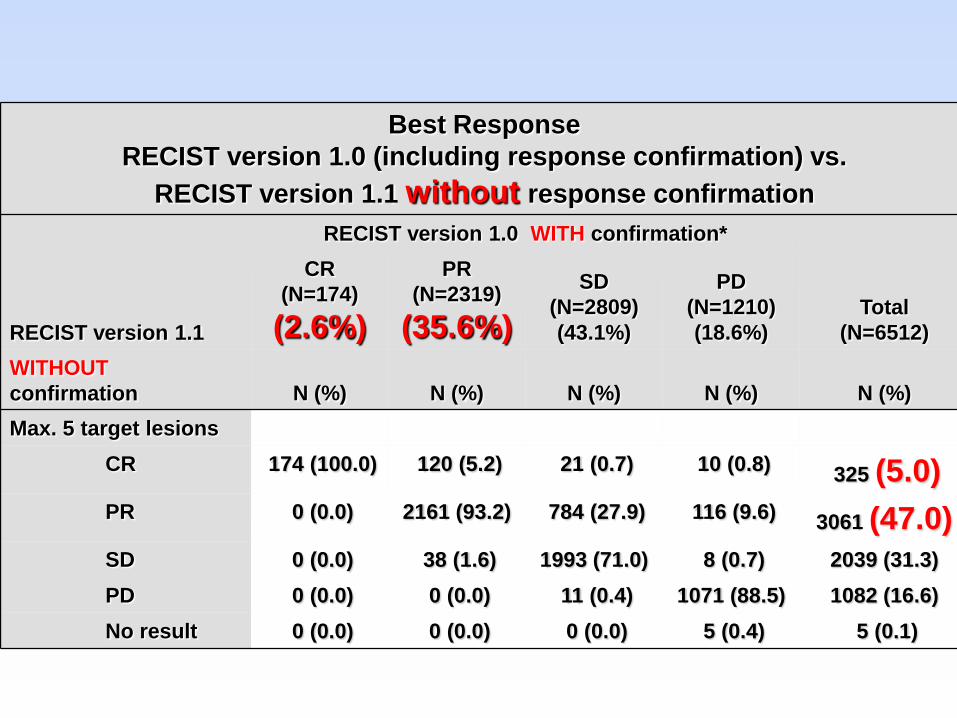
Best Response
RECIST version 1.0 (including response confirmation) vs.
RECIST version 1.1 without response confirmation
RECIST version 1.1
RECIST version 1.0 WITH confirmation*
Total
(N=6512)
CR
(N=174)
(2.6%)
PR
(N=2319)
(35.6%)
SD
(N=2809)
(43.1%)
PD
(N=1210)
(18.6%)
WITHOUT
confirmation N (%) N (%) N (%) N (%) N (%)
Max. 5 target lesions
CR 174 (100.0) 120 (5.2) 21 (0.7) 10 (0.8) 325 (5.0)
PR 0 (0.0) 2161 (93.2) 784 (27.9) 116 (9.6) 3061 (47.0)
SD 0 (0.0) 38 (1.6) 1993 (71.0) 8 (0.7) 2039 (31.3)
PD 0 (0.0) 0 (0.0) 11 (0.4) 1071 (88.5) 1082 (16.6)
No result 0 (0.0) 0 (0.0) 0 (0.0) 5 (0.4) 5 (0.1)

Conclusions on Confirmation
• When response primary endpoint (e.g. phase II single agent trial): confirmation is required
• When response secondary endpoint (e.g. RCT with PFS or OS endpoint): confirmation not required
– Control arm provides ability to interpret results
– Response rates will seem to be higher than single agent results simply because no confirmation however

What HAS changed in RECIST 1.1
• Measuring tumor burden: – Clarify minimum size measurable non-nodal lesions
– Up to FIVE measurable lesions (TWO per organ)
• Lymph node measurement rules
• Progressive disease:
– Requires not only 20% increase but absolute increase
– Definition for non-measurable disease expanded
• Confirmation needed only when response is primary endpoint
• New lesions: greater clarity including FDG-PET use in assessment
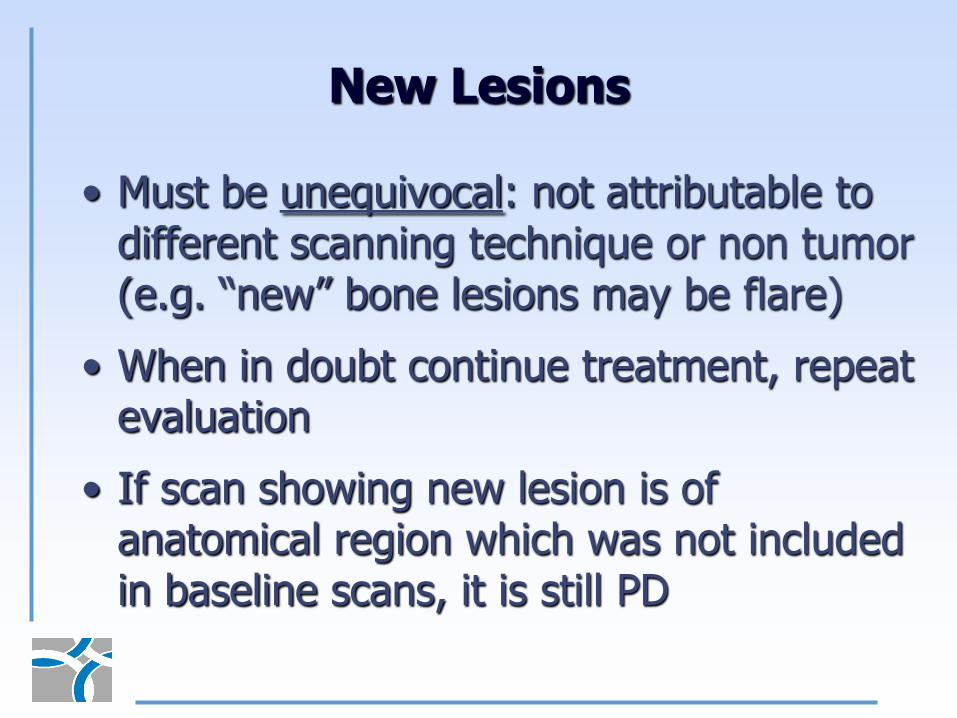
New Lesions
• Must be unequivocal: not attributable to different scanning technique or non tumor (e.g. ―new‖ bone lesions may be flare)
• When in doubt continue treatment, repeat evaluation
• If scan showing new lesion is of anatomical region which was not included in baseline scans, it is still PD

New Lesions (2)
• FDG-PET: sometimes used by investigators to complement CT. If so:
– Negative FDG-PET at baseline and a positive FDG-PET at follow-up means PD
– No FDG-PET at baseline and a positive FDG-PET at follow up:
• It is PD if it corresponds to a new site of disease on CT
• It is equivocal if no new site of disease on CT. Repeat CT to see if new site apparent next scan: if so, PD date will be that of the initial abnormal FDG-PET scan
• It is not PD if corresponds to a pre-existing site of disease on CT that is not progressing on the anatomic images
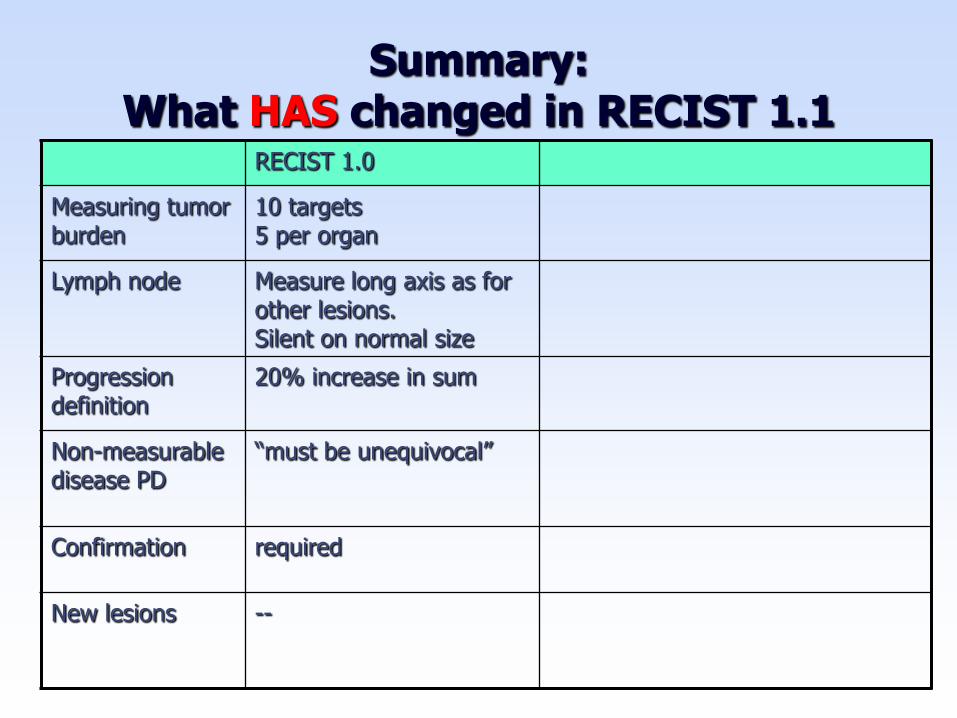
Summary:What HAS changed in RECIST 1.1
RECIST 1.0
Measuring tumor burden
10 targets5 per organ
Lymph node Measure long axis as for other lesions. Silent on normal size
Progression definition
20% increase in sum
Non-measurable disease PD
―must be unequivocal‖
Confirmation required
New lesions --

Summary:What HAS changed in RECIST 1.1
RECIST 1.0 RECIST 1.1
Measuring tumor burden
10 targets5 per organ
For response: 5 targets(2 per organ)
Lymph node Measure long axis as for other lesions. Silent on normal size
Measure short axis. Define normal size.
Progression definition
20% increase in sum 20% increase and at least 5 mm absolute increase
Non-measurable disease PD
―must be unequivocal‖ Expanded definition to convey impact on overall burden of disease. Examples.
Confirmation required Required when response primary endpoint—but not PFS
New lesions -- New section which includes comment on FDG PET interpretation

Other Additions to RECIST 1.1
• Extended illustrated imaging appendix
• Guidance on :
– Handling measures for target lesions that become ―too small to measure‖
– Reporting lesions that coalesce---or split
– Reporting outcomes in phase II and III trials
– Handling missing assessments or measurements

January 2009 Special Issue EJC
Topic First Author
Cancer trial outcomes: the role of assessment of tumour response Jaap Verweij
RECIST 1.1: revised Guideline Elizabeth Eisenhauer
Simulation study of effects of lesion number on outcomes of response and progression
Chaya Moskowitz
Individual Patient Data Analysis to assess modifications to the RECIST criteria
Jan Bogaerts
Evaluation of Lymph Nodes with RECIST 1.1 Larry Schwartz
Lessons Learned From Independent Central Review Robert Ford
Optimizing the design of phase II oncology trials: the importance of randomization
Mark Ratain
Recommendations for the Assessment of Progression in Randomized Cancer Treatment Trials
Janet Dancey
Validation of Novel Imaging Methodologies for use as Cancer Clinical Trial Endpoints
Dan Sargent

Future
• RECIST working group will continue to follow emerging evidence/data re: new imaging approaches
• We hope that by next iteration of guideline there will be clarity regarding in which circumstances and tumor types new imaging techniques may supplement (or replace) anatomical monitoring of tumor size.
• Paper by Sargent et al. outlines type of development/validation needed and already much is underway.

Acknowledgements:RECIST Working Group:
• Elizabeth A. Eisenhauer• Patrick Therasse*• Jan Bogaerts• Larry H. Schwartz• Dan Sargent• Robert Ford• Janet Dancey• Susan Arbuck
• Steve Gwyther• Meg Mooney• Larry Rubinstein• Lalitha Shankar• Lori Dodd• Rick Kaplan• Denis Lacombe• Jaap Verweij*
*= chair at various times during period of RECIST 1.1 development

Acknowledgements (2)Supplied trial databases for data warehouse :
• Amgen
• AstraZeneca
• Breast Cancer International Research Group (BCIRG)
• Bristol-Myers Squibb
• European Organization for Research and Treatment of Cancer (EORTC) Breast Cancer Group and Gastrointestinal Group,
• Erasmus University Medical Center, Rotterdam, Netherlands,
• Genentech
• Pfizer
• RadPharm
• Roche
• Sanofi Aventis

Acknowledgements (3)Provided Comments on Draft RECIST 1.1
Ohad Amit, Phil Murphy, Teri Crofts and Janet Begun, Glaxo SmithKline USA; Laurence H. Baker, Southwest Oncology Group, USA; Karla Ballman, Mayo Clinic, USA; Charles Baum, Darrel Cohen, and Mary Ashford Collier, Pfizer, USA; Gary J. Becker, American Board of Radiology, Tucson, USA; Jean-Yves Blay, University Claude Pertrand, Lyon France; Renzo Canetta, Bristol Myers Squibb, USA; David Chang, Amgen Inc., USA; Sandra Chica, Perceptive Informations, Inc (PAREXEL), USA; Martin Edelman, University of Maryland Greenbaum Cancer Center, USA; Gwendolyn Fyfe, Genentech, USA; Bruce Giantonio, Eastern Cooperative Oncology Group, USA; Gary Gordon, Abbott Pharmaceuticals, USA; Ronald Gottlieb, Roswell Park Cancer Institute, USA; Simon Kao, University of Iowa College of Medicine, USA; Wasaburo Koizumi, Kitasato University, Japan; Alessandro Riva, Novartis Pharmaceuticals, USA; Wayne Rackhoff , Ortho Biotech Oncology Research and Development, USA; Nagahiro Saijo, President Japanese Society of Medical Oncology, Japan; Mitchell Schnall American College of Radiology Imaging Network, USA; Yoshik Shimamura, PAREXEL International Inc, Japan; Rajeshwari Sridhara, Center for Drug Evaluation and Research, Food and Drug Administration, USA; Andrew Stone, Alan Barge, AstraZeneca, United Kingdom; Orhan Suleiman, Center for Drug Evaluation and Research, Food and Drug Administration, USA; Daniel C. Sullivan, Duke University Medical Centre, USA; Masakazu Toi, Kyoto University, Japan; Cindy Welsh, Center for Drug Evaluation and Research, Food and Drug Administration, USA.

THANK YOU

Validation of Novel Imaging Methodologies for use as Cancer Clinical Trial Endpoints
• Prerequisites
– Technology stable
– Widespread availability
– Image acquisition parameters specified –scanning frequency, timing relative to contrast, pulse sequence parameters, etc.
– Standardized interpretation protocol
– Documented reproducibility
– Normal/abnormal ranges defined

Early and Late Stage Endpoint Validation
Attribute Early Phase Development Late Phase Validation
Goal Individual patient level outcome prediction
Trial level outcome prediction
Setting Single randomized trials or uniformly treated patients from non-randomized trials
Meta-analysis of randomized clinical trials
Methods Correlation analyses between endpoints within patients
Correlation analyses between trial level effects on both endpoints

![H=Ã?ü@-A7´Aå Æ c U FKµ ]H.e Ç · 2020. 9. 25. · H=Ã?ü@-A7´Aå Æ c U FKµ ]H.e Ç 7´Aå Ý6×´ 0700 .HK µ 31M Û 8 2020.9.23 c A÷n.J0¬G n ù?ø&ï Aî9' OÌ c0 ¶ÝP](https://img.pdfslide.us/doc/110x75/60ba8752ffc6832a186e0a3d/hf-a7a-c-u-fk-he-2020-9-25-hf-a7a-c-u-fk.jpg)


![p¢wq| - Miyota · Ê Õè O\f Ü æ y ] _ S>0tS dXi^M{ Ê Õ Ú è Ñ ¿«µçï ð yÝ ç ÅèµçNPUFLJ Z!UPXO NJZPUB OBHBOP KQ p¢wq| Û -H ñ±] ¬ Aŧ Ü ¬ Aŧ ·ï» Ó](https://img.pdfslide.us/doc/110x75/5fbc754c303e6e053c7c9a2f/pwq-miyota-of-oe-y-s0ts-dxim-.jpg)