Embed Size (px)
Citation preview


This page was intentionally left blank

City of San Diego—Fire-Rescue Standards of Response Cover Review
Volume 1—Executive Summary
Table of Contents page i
TABLE OF CONTENTS
Section Page
VOLUME 1 of 3 – Executive Summary (this volume)
1.1 Policy Choices Framework ................................................................................................. 1
1.2 Citygate’s Overall Opinions on the State of the City’s Fire Services................................. 2
1.3 Standards of Cover Assessment Technical Summary ........................................................ 3
1.4 Overall Deployment Evaluation ......................................................................................... 7
1.5 Risk Assessment Summary ................................................................................................. 8
1.6 Findings and Recommendations ......................................................................................... 9
1.6.1 Findings................................................................................................................... 9
1.6.2 Recommendations ................................................................................................. 12
1.7 The Path Ahead ................................................................................................................. 12
1.7.1 Short-Term Steps .................................................................................................. 13
1.7.2 Long-Term Steps .................................................................................................. 13
Appendix A—Status of Fire Station Areas Identified in the 2010 and 2017 Studies....................17
Table of Tables
Table 1—Fire Dispatch Receipt to Arrival Time Analysis (90% Baseline Performance in RY
15/16) .............................................................................................................................................. 4
Table 2—Travel Time Analysis (90% Baseline Performance in RY 15/16).................................. 5
Table 3—Travel Time Comparison from 2010 to 2017 ................................................................. 6
VOLUME 2 of 3 – Technical Report (separately bound)
VOLUME 3 of 3 – Map Atlas (separately bound)

This page was intentionally left blank

City of San Diego—Fire-Rescue Standards of Response Cover Review
Volume 1—Executive Summary
Volume 1—Executive Summary page 1
VOLUME 1—EXECUTIVE SUMMARY
The City of San Diego (City) retained Citygate Associates, LLC to perform a Standards of
Response Coverage (deployment) review for the Fire-Rescue Department (Fire-Rescue). This
study included reviewing the adequacy of the current fire station resource deployment system,
the risks to be protected, and the emergency incident outcomes desired by the community. This
report is presented in three volumes, including this Executive Summary (Volume 1)
summarizing our findings and recommendations, a Technical Report (Volume 2) that includes a
Standards of Coverage (deployment) assessment and community risk assessment, and a
geographic map atlas (Volume 3) that displays fire unit travel time coverage. Throughout the
technical volumes of this study, Citygate makes key findings, and, where appropriate, specific
action item recommendations. Overall, there are 26 key findings and 3 specific action item
recommendations.
1.1 POLICY CHOICES FRAMEWORK
First, as the Mayor, City Council, and Fire-Rescue Executive Management understand, there are
no mandatory federal or state regulations directing the level of fire service response times and
outcomes delivered by the City. The level of service and resultant costs are a local community
choice in the United States. The body of regulations on the fire service provides that if fire
services are provided, they must be done so with the safety of the firefighters and citizens in
mind. There is a constructive tension between a desired level of fire services and the level that
can actually be funded. Thus, many communities do not have the level of fire services they may
desire.

City of San Diego—Fire-Rescue Standards of Response Cover Review
Volume 1—Executive Summary
Volume 1—Executive Summary page 2
In growing urban areas like San Diego, it is an even harder challenge to keep fire service levels
consummate with growth along with all the other competing needs as General Fund revenues
grow over the years. Since the recession ended, San Diego has started to significantly reinvest in
its fire services.
This study will identify that, in the near term, additional investment in fire services is still
necessary as San Diego continues to evolve and consider the service level choices for its fire
services. The fundamental policy choices are derived from two key questions:
1. What outcome is desired for an emergency? Is the desire to keep a building fire to
the room, building, or block of origin? Is it also to provide paramedic care in time
to lessen the possibility of preventable death and severe disability?
2. Should equitable response time coverage be provided to all similar risk
neighborhoods? Once the outcomes are stated, the fire and emergency medical
services deployment system can be designed to cover the geography in the time
necessary to meet the stated outcome goals.
1.2 CITYGATE’S OVERALL OPINIONS ON THE STATE OF THE CITY’S FIRE SERVICES
The City’s fire and emergency medical services have not kept pace with growth, partially due to
the long recession, and are unable still to meet best practice outcome response times to all
neighborhoods. To its credit, the City has staffed the fire crews at the best practice level of four
personnel, but does not have enough crews to cover a city the size of San Diego. Many emerging
western state cities allow non-contiguous neighborhoods to develop somewhat quickly over a
few years. Stated this way, new urbanizing communities do not tend to grow outward from a
solid core, with a grid or “right angle” classic street system. Communities build in clusters and
connect meandering subdivision streets to each other with longer main boulevards. For quality of
life and land owners, this can be a beneficial pattern. For fire services agencies trying to maintain
response times from the most efficient (fewest) number of fire stations, it is not a cost-effective
community design plan as most urban communities want best outcome response times to keep
small fires small, and to save people with potentially fatal medical emergencies.
If best outcome response times to all similar risk and population density neighborhoods are
desired, then in the near term, San Diego should bring on line at least 10 more infill gap fire
stations plus what is needed for entirely new growth areas.
Traffic congestion is also an increasing problem that further strains Fire-Rescue’s response time
coverage at morning and evening commute times. The City’s growing employment base and
regional, post-recession economic jobs recovery is yielding intense traffic congestion at rush
hours. The geographic information system (GIS) travel time analysis in this study, and the prior

City of San Diego—Fire-Rescue Standards of Response Cover Review
Volume 1—Executive Summary
Volume 1—Executive Summary page 3
incident travel time data for Fire-Rescue’s responses, clearly show the substantial hindrance this
causes to emergency response travel in the City.
1.3 STANDARDS OF COVER ASSESSMENT TECHNICAL SUMMARY
Fire department resource deployment, simply stated, is about the speed and weight of the attack.
Speed calls for first-due, all-risk intervention units (engines, ladder trucks, ambulances, and/or
specialty units) strategically located across a department service area. These units are tasked with
controlling moderate emergencies, preventing the incident from escalating to second alarm or
greater size, which unnecessarily depletes department resources as multiple requests for service
occur. Weight is about multiple-unit response for serious emergencies, such as a room and
contents structure fire, a multiple-patient incident, a vehicle accident with extrication required, or
a heavy rescue incident. In these situations, enough firefighters must be assembled within a
reasonable time frame to safely control the emergency, thereby keeping it from escalating to
greater alarms.
In Part One of Volume 2 of this study, Standards of Cover Assessment, Citygate’s analysis of
prior response statistics and use of geographic mapping tools reveals that the City does not have
an adequate number of fire stations to serve its diverse topography and population densities. The
maps provided in Volume 3 and the corresponding text explanation beginning in Volume 2
describe Fire-Rescue’s current performance in detail.
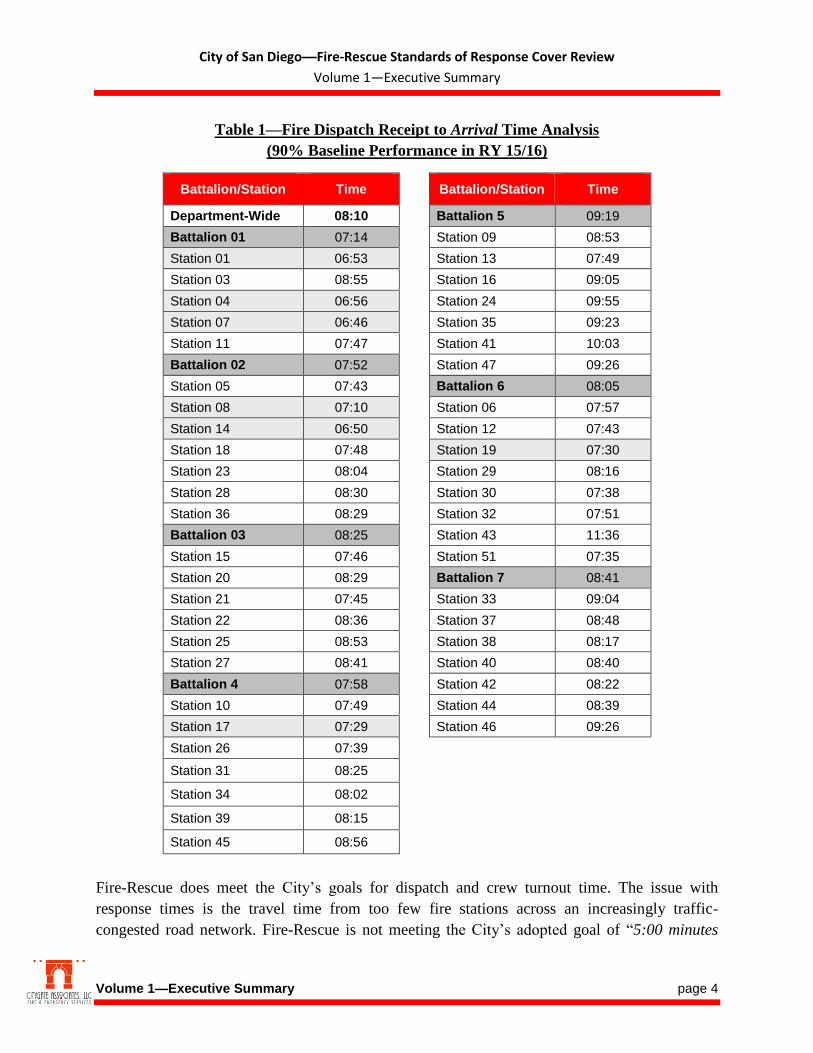
For effective outcomes on serious medical emergencies and to keep serious, but still emerging,
fires small, the City’s adopted Fire-Rescue response time policy is that the first-due fire unit
should arrive within 7:30 minutes/seconds of fire dispatch receiving the 9-1-1 call, 90% of the
time. Fire-Rescue’s actual performance from fire dispatch call receipt to first crew on scene is
8:10 minutes/seconds to 90% of fire and emergency medical services (EMS) incidents. As can be
seen in light grey shading in Table 1, only seven station areas meet a 90% best practice goal of
7:30 minutes/seconds from fire dispatch receipt to first unit on scene:
City of San Diego—Fire-Rescue Standards of Response Cover Review
Volume 1—Executive Summary
Volume 1—Executive Summary page 4
Table 1—Fire Dispatch Receipt to Arrival Time Analysis
(90% Baseline Performance in RY 15/16)
Battalion/Station Time Battalion/Station Time
Department-Wide 08:10 Battalion 5 09:19
Battalion 01 07:14 Station 09 08:53
Station 01 06:53 Station 13 07:49
Station 03 08:55 Station 16 09:05
Station 04 06:56 Station 24 09:55
Station 07 06:46 Station 35 09:23
Station 11 07:47 Station 41 10:03
Battalion 02 07:52 Station 47 09:26
Station 05 07:43 Battalion 6 08:05
Station 08 07:10 Station 06 07:57
Station 14 06:50 Station 12 07:43
Station 18 07:48 Station 19 07:30
Station 23 08:04 Station 29 08:16
Station 28 08:30 Station 30 07:38
Station 36 08:29 Station 32 07:51
Battalion 03 08:25 Station 43 11:36
Station 15 07:46 Station 51 07:35
Station 20 08:29 Battalion 7 08:41
Station 21 07:45 Station 33 09:04
Station 22 08:36 Station 37 08:48
Station 25 08:53 Station 38 08:17
Station 27 08:41 Station 40 08:40
Battalion 4 07:58 Station 42 08:22
Station 10 07:49 Station 44 08:39
Station 17 07:29 Station 46 09:26
Station 26 07:39
Station 31 08:25
Station 34 08:02
Station 39 08:15
Station 45 08:56
Fire-Rescue does meet the City’s goals for dispatch and crew turnout time. The issue with
response times is the travel time from too few fire stations across an increasingly traffic-
congested road network. Fire-Rescue is not meeting the City’s adopted goal of “5:00 minutes

City of San Diego—Fire-Rescue Standards of Response Cover Review
Volume 1—Executive Summary
Volume 1—Executive Summary page 5
travel time” for the first arriving unit. The reality is, as shown in the next table, instead of a 5:00-
minute response time from crew notification, the Citywide actual performance is 06:09 minutes,
or 1:09 longer. Only four fire station areas meet the 5:00-minute travel time goal, as shown in
light grey:
Table 2—Travel Time Analysis (90% Baseline Performance in RY 15/16)
Battalion/Station Time Battalion/Station Time
Department-Wide 06:09 Battalion 5 07:18
Battalion 01 05:06 Station 09 06:51
Station 01 04:43 Station 13 05:41
Station 03 06:34 Station 16 07:28
Station 04 04:45 Station 24 07:50
Station 07 04:44 Station 35 07:14
Station 11 05:42 Station 41 08:00
Battalion 02 05:58 Station 47 06:59
Station 05 05:42 Battalion 6 06:03
Station 08 05:15 Station 06 06:04
Station 14 04:59 Station 12 05:41
Station 18 05:55 Station 19 05:32
Station 23 06:09 Station 29 06:15
Station 28 06:31 Station 30 05:33
Station 36 06:35 Station 32 05:55
Battalion 03 06:26 Station 43 09:19
Station 15 05:47 Station 51 05:35
Station 20 06:26 Battalion 7 06:41
Station 21 05:48 Station 33 06:57
Station 22 06:21 Station 37 06:56
Station 25 06:59 Station 38 06:22
Station 27 06:54 Station 40 06:38
Battalion 4 06:00 Station 42 06:31
Station 10 05:52 Station 44 06:36
Station 17 05:33 Station 46 07:07
Station 26 05:36
Station 31 06:25 Station 34 05:59 Station 39 06:35 Station 45 07:01

City of San Diego—Fire-Rescue Standards of Response Cover Review
Volume 1—Executive Summary
Volume 1—Executive Summary page 6
These results are reflective of the large size of some station areas, simultaneous calls for service,
road network design, and traffic congestion issues. Fire-Rescue is staffed for several serious
building fires at a time, and multiple medical calls for service at a time. The regional automatic
and mutual aid response system delivers greater alarm and multiple-incident support, when
needed, although with longer response times.
It is valuable to compare the travel time Citywide from the 2010 study to this 2017 update:
Table 3—Travel Time Comparison from 2010 to 2017
Year Travel Time % at 5 Minutes Minutes/Seconds @ 90%
2010 74.5% 6:20
2017 77.1% 6:15
While travel time performance is slightly better, even with post-recession traffic congestion, the
City has not to date added enough resources to reduce Citywide travel to 5 minutes to 90% of the
incidents. Short of adding additional fire stations given the City’s road network and traffic
congestion, there is no way to appreciably lower emergency fire unit travel times.
Population drives service demand and development brings population, which increases traffic
congestion. Traffic congestion now has measurable, negative effects on fire unit travel times
during rush hours. The geographic mapping analysis in this study found that only 74% of the
City’s public streets are within 5 minutes travel time of an active fire station. Of the current fire
stations, travel coverage at commute hours is negatively impacted down to 51% of the road
miles. More importantly, the multiple-unit Fire-Rescue coverage at commute hours is much more
severely impacted down to 6%, as several units must travel across large sections of the City. The
maps in this study show where this normal and reduced coverage occurs.
In the current Capital Improvements Program (CIP) budget, work is underway to add six fire
stations. Of these, two are not part of the identified 2010 study gaps. One is downtown, west of
the rail tracks. Another station is part of a developer agreement in a new growth area. There are
many steps to add a fire station, and the current six stations being planned do not all yet include
funding for site, design, and construction.
When the six stations in the current CIP budget work plan are on line, the first-due coverage
improves by only 71 road miles or 1% of the Citywide total. These six stations also improve First
Alarm multiple-unit coverage by a more significant 403 road miles, or 3% of the Citywide total.
These measures illustrate why it is so expensive to increase station coverage and “catch up” for
the years or even decades of growth creating station coverage gaps, and why at least more than
the six currently being planned stations are necessary.

City of San Diego—Fire-Rescue Standards of Response Cover Review
Volume 1—Executive Summary
Volume 1—Executive Summary page 7
If, however, at least another six large gap infill stations are added to the current six new growth
and infill gap stations already in the CIP development budget, a total of 12 added fire stations
will add another almost 5% to 5-minute coverage, which raises the percent of coverage for the
existing road miles up to 80.6%. This would be very good coverage given the challenging
topography of San Diego.
Determining the timing of adding additional fire stations is complicated with issues other than
the population, incidents, and 5-minute covered miles measured by Citygate in this study. The
other issues to consider in siting a station are new growth proposed nearby, land cost,
availability, zoning, environmental, and traffic safety to mention a few. The timing of all infill
sites will be determined by City staff as they address the siting issues and forward CIP budget
requests to the City Council as part of the normal budget cycle. In addition, Fire-Rescue is also
expending significant funding to tear down and rebuild or renovate existing stations as the
facilities age. Doing so competes for funding for additional gap infill stations.
Please see Appendix A for a complete list of all the fire station areas identified in the 2010 and
2017 studies and their current status in the planning process.
1.4 OVERALL DEPLOYMENT EVALUATION
San Diego Fire-Rescue serves a very diverse land use pattern with a geographically challenging
and limited road network in some areas. While the state-mandated Fire Code has required fire
sprinklers in many commercial buildings and even in dwellings, it will be many more decades
before enough buildings are replaced or remodeled using automatic fire sprinklers. For the
foreseeable future, the City will need both a first-due firefighting unit and Effective Response
Force (First Alarm) coverage in all parts of the City, consistent with current best practices, if the
risk of the fire is to be limited to only part of the inside of the affected building.
As described, Fire-Rescue is not meeting the City’s goal of “5:00 minutes travel time.” The
reality is instead of a 5:00 minute response time from crew notification, the actual Citywide
performance is 06:09 minutes (or 1:09) longer. Citygate submits there are three principal reasons
for this situation: (1) too few stations; (2) traffic congestion; and (3) high workload rates on
many key engine companies.
As the 2010 study identified, over several decades as the City grew outward from its historic
core neighborhoods, it did not add enough fire stations to equitably cover all areas with best-
practices-based response times. The only way to materially improve response times is to add the
fire stations identified in this study.
Fire-Rescue is to be commended; it is meeting its goals for dispatch and crew turnout time, so
these times cannot be materially lowered.

City of San Diego—Fire-Rescue Standards of Response Cover Review
Volume 1—Executive Summary
Volume 1—Executive Summary page 8
Citygate’s 2010 study identified 10 priority infill gaps fire stations. At present, four are in
process of being sited and funded. Others are in preliminary research and development. If an
additional six gap fire stations identified in the 2010 and 2017 update study were to be funded,
then there would be 10 infill fire stations deployed in the identified 5-minute travel gaps on the
existing road network. This quantity of 10 infill stations needed is the same count as in the 2010
study. Stated this way, San Diego is programming at present four of the 10 largest needed infill
fire stations.
1.5 RISK ASSESSMENT SUMMARY
Citygate conducted an in-depth community risk assessment, found in Part Two of Volume 2 of
this study. The following list briefly summarizes Citygate’s evaluation of the values at risk and
hazards likely to impact the City of San Diego:
The City has a very diverse population, with densities ranging from less than
1,000 per square mile to more than 56,000 per square mile.
The City’s population is projected to grow by 24% over the next 18 years to 2035,
with similar projected growth in residential housing units, non-residential
development, and employment.
Approximately 23.35% of the City’s population is under 10 years of age or over
65 years of age, which are considered at-risk populations for most emergencies.
Nearly 16% of the City’s population is below the federal poverty level for the
previous 12 months, an increase of 1.7% since 2000.
The City has 705 designated critical facilities/infrastructures to protect.
The City has significant economic values at risk as identified in this assessment.
A significant percentage of the City lies within a Very High Wildland Fire Hazard
Severity Zone as identified by the California Department of Forestry and Fire
Protection.
Fire-Rescue has developed and implemented multiple mitigation measures to
effectively reduce wildland fire impact severity within the City.
The City’s overall risk for seven hazards related to emergency services provided
by Fire-Rescue ranges from LOW to MAXIMUM.

City of San Diego—Fire-Rescue Standards of Response Cover Review
Volume 1—Executive Summary
Volume 1—Executive Summary page 9
1.6 FINDINGS AND RECOMMENDATIONS
Shown below are all findings and recommendations from Volume 2—Technical Report.
1.6.1 Findings
Standards of Cover Assessment Findings
Finding #1: The City Council has adopted a complete and best-practices-based deployment
measure for fire and emergency medical services incidents. Adopting a similar
set of specialty response measures would meet the best practice
recommendations of the Commission on Fire Accreditation International.
Finding #2: Fire-Rescue follows best practices by using a standard response dispatching
plan that considers the risk of different types of emergencies and pre-plans the
response. Each type of call for service receives the combination of engine
companies, truck companies, ambulances, specialty units, and command
officers customarily needed to handle each type of incident based on
experience.
Finding #3: Minimum apparatus staffing per unit on engine and ladder truck companies at
four is a recognized best practice for the City’s size and risks.
Finding #4: Using the current 47 fire station locations, only the most-developed population
density areas are within 5 minutes travel time of a fire engine. Traffic
congestion has a marked negative impact on unit travel times in many fire
station service areas.
Finding #5: Only some of City’s core areas are within 8 minutes travel time of an Effective
Response Force assignment of four engines, one ladder truck, one ambulance,
and two Battalion Chiefs, with no traffic congestion. During traffic congestion
this coverage only occurs in sections of downtown and Mission Valley.
Finding #6: Even having grown over the years from five to seven Battalions, the northern
and southern City station areas are not within 8 minutes travel time. It will take
at least the addition of three more Battalion Supervisors per day to more
completely cover the City. Adding these Battalion Supervisors also will increase
the two-chief coverage on First Alarms.
Finding #7: The single ladder truck coverage is adequate for the current needs of the City
but the coverage will have to be re-evaluated as new growth areas are added
beyond the identified infill gap fire stations.

City of San Diego—Fire-Rescue Standards of Response Cover Review
Volume 1—Executive Summary
Volume 1—Executive Summary page 10
Finding #8: Completing the six station sites currently being programmed in the near term
Capital Improvement Program will add significant new coverage at peak hours
of the day.
Finding #9: If six of the largest gaps identified in the 2017 Citygate study were filled over
time with a fire station and at least one fully-staffed engine, as funds allow, the
total population receiving improved coverage would amount to 80,036 residents
at current population levels. In the last year, these gaps experienced a total
incident demand of 1,641.
Finding #10: If the currently programmed four infill gap fire stations plus the six largest gaps
identified in the 2017 Citygate study (totaling ten) were added to the fire station
system, Citywide 5-minute travel time coverage would improve from 74.7% to
80.6%.
Finding #11: If the City public road miles remain static, then Citygate would not recommend
adding more than 10 infill gap fire stations to the present system. The remaining
gaps are too small and, if necessary, could be covered with the use of Fast
Response Squads or peak activity engine companies during daylight hours. Of
course, any completely new growth areas could also be large enough to justify
added fire stations in addition to the 10 infill gap stations identified.
Finding #12: The highest volume hours for incidents span from 9 am through 9 pm, and even
later on Friday and Saturday. Given this, where additional units are needed for
high workload volumes, they could be peak-hour units for 12 hours per day, 7
days per week.
Finding #13: National best practices as recommended by National Fire Protection Association
Standard 1221 are for call processing to be 90 seconds, 90% of the time, and
120 seconds, 99% of the time. Fire-Rescue is substantially meeting this goal.
Finding #14: Fire-Rescue’s realistic goal for turnout time is 90 seconds to 90% of the
emergent incidents. San Diego is just under this goal and is to be commended
for its performance meeting a best-practices-based goal.
Finding #15: In the Report Year 15/16 measurement period, Fire-Rescue had a 90% travel
time Citywide of 6:09 minutes/seconds. This travel time is 1:09 minutes longer
than the City’s goal of 5:00 minutes. This travel time is fairly consistent across
urbanized areas of the City, as only four station areas in San Diego were under a
5-minute travel time goal. To substantially reduce travel time, more fire stations
are necessary.

City of San Diego—Fire-Rescue Standards of Response Cover Review
Volume 1—Executive Summary
Volume 1—Executive Summary page 11
Finding #16: Due to longer travel times, with the current quantity of fire stations, Fire-Rescue
only has seven station areas performing better than the City’s adopted
Emergency Command and Data Center 9-1-1 call receipt to arrival time of 7:30
minutes/seconds. The station areas with the longer travel times also have the
longest call receipt to arrival times.
Finding #17: While some engines reach mid-20% Unit-Hour Utilization workloads, no
engines approach a Citygate-recommended threshold of 30% hour after hour. At
peak hours of the day, while many engines are busy responding to EMS events,
adding flexibly deployed engines into gap areas would provide the greatest
possible reduction to response times to neighborhoods the farthest from fire
stations.
Finding #18: The busiest ladder trucks only approach 10% Unit-Hour Utilization workloads
and at this time, relief or added ladder trucks are not necessary where there is
already adequate ladder truck coverage.
Risk Assessment Findings
Finding #19: A significant percentage of the City lies within a Very High Wildland Fire
Hazard Severity Zone as identified by the California Department of Forestry
and Fire Protection (CAL FIRE).
Finding #20: The Draft 2015 San Diego County Multi-Jurisdictional Hazard Mitigation Plan
identifies four actions to address wildland fire risk in the City of San Diego.
Finding #21: Fire-Rescue inspects more than 49,000 parcels within the City’s Very High
Wildland Fire Hazard Severity Zones and Wildland Urban Interface areas to
ensure that required defensible space is appropriately established and
maintained.
Finding #22: Fire-Rescue has developed standardized Wildland Urban Interface pre-fire plans
addressing management of wildland fires within targeted high-risk areas of the
City.
Finding #23: Fire-Rescue is currently developing a Citywide Community Risk Assessment
emphasizing “Sharing the Responsibility.” The program is aimed at enhancing
wildland fire risk awareness in the City’s Wildland Urban Interface (WUI) by
providing information on wildfire preparedness, “Ready, Set, Go”, defensible
space, and structure hardening that can assist homeowners in reducing the
impacts of a wildland fire.

City of San Diego—Fire-Rescue Standards of Response Cover Review
Volume 1—Executive Summary
Volume 1—Executive Summary page 12
Finding #24: The City has established appropriate emergency evacuation protocols,
procedures, and resources in its Citywide Emergency Operations Plan, Police
Department Procedures, and Fire-Rescue Procedures.
Finding #25: The City has established multiple effective concurrent methods to communicate
emergency evacuation information to the public in a timely manner.
Finding #26: The City regularly utilizes, validates, and evaluates its emergency evacuation
protocols, procedures, and resources to ensure ongoing emergency evacuation
readiness and effectiveness.
1.6.2 Recommendations
Standards of Cover Assessment Recommendations
Recommendation #1: Address Service Gaps by Adding Fire Stations and Resources:
1.1 Identify the funding and timing to complete the current six
fire stations in the City’s Capital Improvement Program
budget.
1.2 Identify the sites for six infill fire stations to lower the
Citywide travel time performance closer to 5 minutes in the
most urbanized areas per the City’s adopted policy.
Recommendation #2: Add Battalions: In addition to the added fire stations, the City should
eventually add at least three more geographic area Battalions.
Recommendation #3: Add Peak-Hour Units: Fire-Rescue needs to continue to add peak-
hour, flexibly-deployed units, squads, and/or engines to support the
busiest areas at peak hours of the day and to allow full-time crews to
go off-line for training in rotation.
1.7 THE PATH AHEAD
If the City wants to provide the following three outcomes, the City will have to increase its
deployment of fire crews by adding at least 10 key missing fire stations. The three outcomes are:
Provide equitable response times to all similar risk neighborhoods.
Provide for depth of response when multiple incidents occur.
Provide for a concentration of response forces in the core for high-risk venues.
City of San Diego—Fire-Rescue Standards of Response Cover Review
Volume 1—Executive Summary
Volume 1—Executive Summary page 13
If the City chooses not to continue these three policy goals for fire services delivery, then it
should adopt a travel time goal that it can afford, understanding that longer response times will
mean the most time-sensitive emergencies could experience worse than desired outcomes.
In addition to the added fire stations, the City will eventually need to add at least three more
geographic area Battalions.
Last, to maintain response times and training schedules during peak incident demand hours of
the day, Fire-Rescue should increase the use of peak-hour activity units, using squads and/or full
engine companies.
Since the recession, the City has started to address adding fire stations to both infill gaps and new
growth areas. The goals identified in Recommendation #1 will continue to expand this program.
Measurement and planning as the City continues to evolve over time will be necessary for the
City to meet these goals. Citygate recommends that the City’s next steps be to work through the
issues identified in this study over the following time lines:
1.7.1 Short-Term Steps
Absorb the policy recommendations of this fire services study.
Direct staff to commence work to site, procure, and program funding for the
needed infill gap fire stations.
Develop the costs and a timeline for the balance of the stations not already having
City-owned sites and/or committed construction funding.
1.7.2 Long-Term Steps
Add at least three more geographic area Battalions to increase the two-chief
coverage on First Alarms.
Monitor the effect of growth and traffic congestion on incident demand volume at
peak hours of the day.
If traffic congestion continues to decay response times, even with additional fire
crews, then more peak-hour squads and/or engines will become necessary to
maintain response times to critical events.
Once the added station construction schedule is better determined, build a staffing
impacts model to allow Fire-Rescue to budget ahead of time for the hiring and
promotional testing necessary to bring more fire crews on line.

This page was intentionally left blank

City of San Diego—Fire-Rescue Standards of Response Cover Review
Volume 1—Executive Summary
page 15
APPENDIX A
Status of Fire Station Areas
Identified in the 2010 and
2017 Studies

This page was intentionally left blank

City of San Diego—Fire-Rescue Standards of Response Cover Review
Volume 1—Executive Summary
Appendix A—Status of Fire Station Areas Identified in the 2010 and 2017 Studies page 17
APPENDIX A—STATUS OF FIRE STATION AREAS IDENTIFIED IN THE 2010 AND 2017 STUDIES
2010 GAP 2017 GAP*
2010 ID Council District
Fire Station Community Planning Area 2017 ID
Council District Community Planning Area Current Status
1 4/9 Mid-City: City Heights Capital Improvement Program (CIP) created; pursuing land purchase at 47th and Fairmount Avenue
2 4 FS54 Skyline-Paradise Hills Gap 4 N 4 Southwestern Skyline-Paradise Hills No land identified; CIP created; no funding
3 9
College Area CIP created; no funding
4 4 FS51 Skyline-Paradise Hills Station in-service (temporary facility); CIP created; no funding
5 4 SQ55 Encanto Gap 4 S 4 Northeastern Encanto Squad in-service; 61st and Imperial Avenue; no CIP
6 1 SQ56 University Gap 2 1 Southern University Squad in-service; Governor Drive and Dunant Street; no CIP
7 2 Pacific Beach Gap 1 2 Pacific Beach No CIP or activity
8 1 University UCSD Fire Station project; in negotiations
9 2
Peninsula No CIP or activity
10 1 FS50 University Nobel and Shoreline; CIP created; land secured; station in design
11 1 Torrey Hills Gap 3 1 Torrey Hills/South Carmel Valley No CIP or activity
12 6/7
Serra Mesa No CIP or activity
13 6
Mira Mesa No CIP; possibility future development will build station
14 8
Otay Mesa No CIP or activity; see “FS49 – Otay Mesa” in bottom row of this table
15 5
Scripps Miramar Ranch No CIP or activity
16 5 SQ57 San Pasqual Squad in-service
17 7
Linda Vista No CIP or activity

City of San Diego—Fire-Rescue Standards of Response Cover Review
Volume 1—Executive Summary
Appendix A—Status of Fire Station Areas Identified in the 2010 and 2017 Studies page 18
2010 GAP 2017 GAP*
2010 ID Council District
Fire Station Community Planning Area 2017 ID
Council District Community Planning Area Current Status
18 1 FS48 Black Mountain Ranch
Carmel Valley Road and Winecreek Road; land secured; in negotiations with developer for construction; potential reimbursement agreement; partial Facility Benefit Assessment (FBA) funding to date
19 2 Mission Valley No CIP or activity
Gap 5 5 Northeastern Rancho Bernardo Newly identified
Gap 6 5 Southern Sabre Springs Newly identified
Sites Identified by Fire-Rescue After 2010 Study
3 FS02 Downtown Pacific Highway and Cedar; CIP created; fully funded, station under construction ("Bayside")
3
Downtown No CIP or activity; north of Broadway between 13th and 14th Street ("East Village")
8 FS49 Otay Mesa Named FS49; Ocean View Hills area; CIP created; developer built; FBA funding; no current activity; station is west of 2010 Gap #14
* No priority weight is given to 2017 gaps.
Underway in planning, either with service established or active work being performed. Council Districts 1, 3, 4, 5, and 9 are represented.
There are three gaps that carry over from 2010 to 2017 that have had no activity.


![[PAGE INTENTIONALLY LEFT BLANK]€¦ · inogen, inc. fiscal 2015 annual report. [page intentionally left blank]](https://img.pdfslide.us/doc/110x75/603dd78a05f41851485839e0/page-intentionally-left-blank-inogen-inc-fiscal-2015-annual-report-page-intentionally.jpg)