Embed Size (px)
Citation preview

This Must Be the Place: The Abundance and Distribution of Microbes using Maximum Entropy
Will Shoemaker
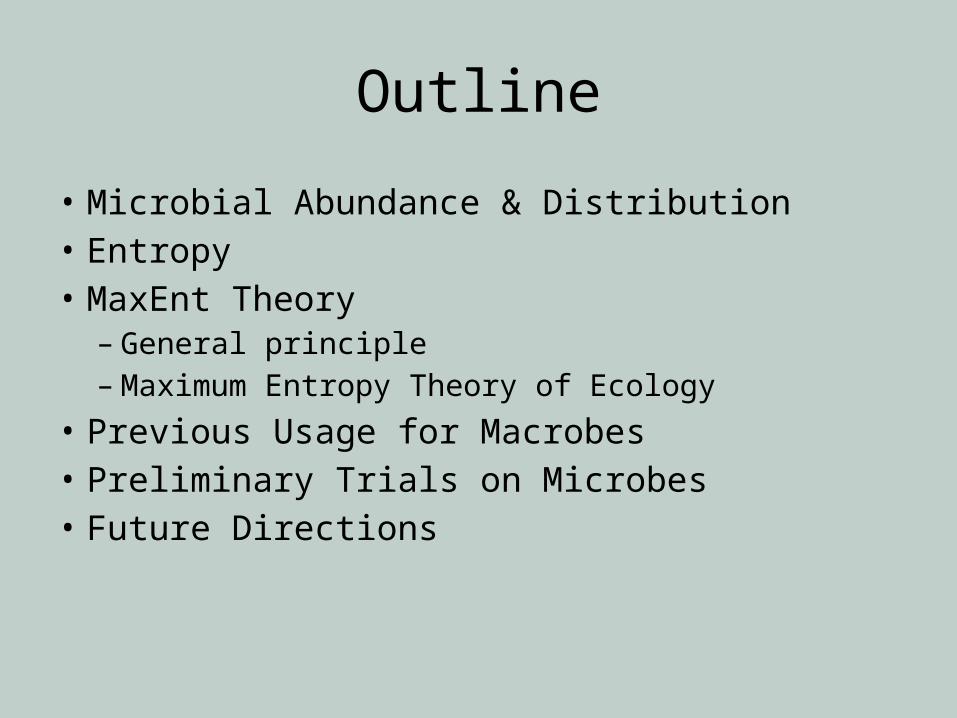
Outline
• Microbial Abundance & Distribution• Entropy• MaxEnt Theory– General principle– Maximum Entropy Theory of Ecology
• Previous Usage for Macrobes• Preliminary Trials on Microbes• Future Directions
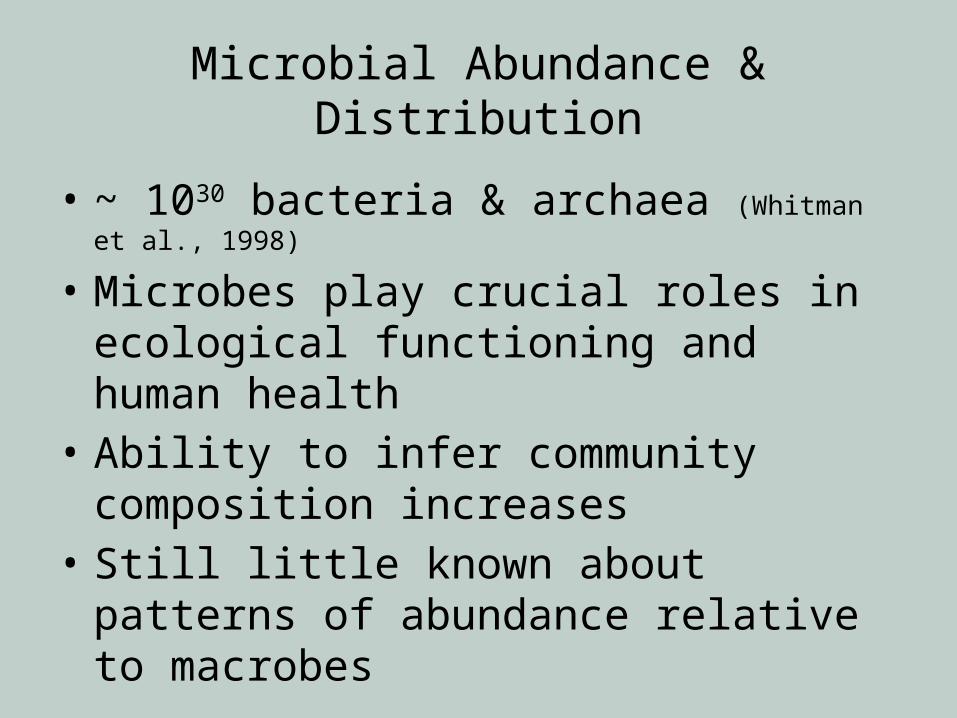
Microbial Abundance & Distribution
• ~ 1030 bacteria & archaea (Whitman et al., 1998)
• Microbes play crucial roles in ecological functioning and human health
• Ability to infer community composition increases
• Still little known about patterns of abundance relative to macrobes

Current Studies
• Conditionally Rare Taxa (CRT) contribute to microbial diversity – Low abundance – Presence temporally variable – Most difficult taxa to detect
• Emphasizes importance of having a null model for abundance data
(Shade & Gilbert, 2015)

Some Issues with Models
• Models can make assumptions– ex. trade-offs, life-history traits, etc.
• Models can allow for parameter manipulation– ex. UNTB
• What about looking at patterns in a model based off of what we know?

What Do We know?• Good idea to start from the data– How does the data constrain our inference?
• Large amounts of open-access microbial sequence data– ex. JGI, MG-RAST, NCBI – Metadata often poor quality
• Some constraints are easily inferred – N = Number of individuals– S = Number of species
• Basis for calculating our uncertainty in a distribution– i.e. our entropy

What is Entropy?
• Let’s reframe. Q: what is information?– A: Reduction in uncertainty– i.e. a reduction in entropy– Entropy = uncertainty
• But how is entropy calculated?
• Quantifying information content relies on the frequency of events in a distribution
Jaynes, 1982
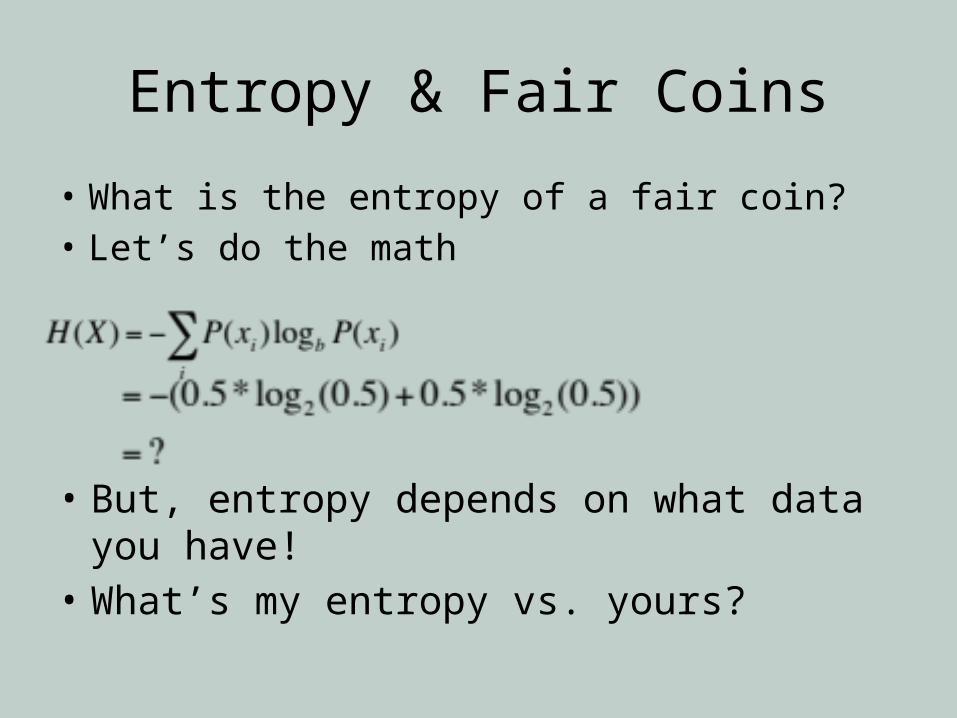
Entropy & Fair Coins
• What is the entropy of a fair coin?• Let’s do the math
• But, entropy depends on what data you have!• What’s my entropy vs. yours?
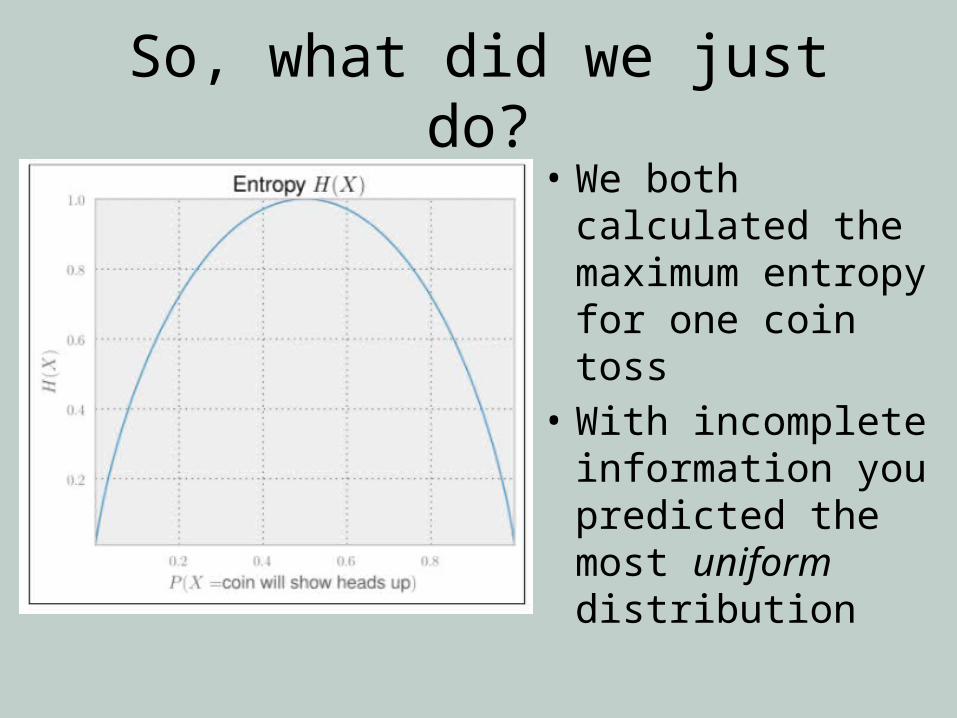
So, what did we just do?• We both calculated
the maximum entropy for one coin toss
• With incomplete information you predicted the most uniform distribution

Why maximum entropy (MaxEnt) ?
• We just learned that information is useful• Maximize entropy = minimize commitment • Model all you know and nothing more– What you’re modeling is a set of constraints that
must hold• Then choose the most uniform distribution– i.e. maximum entropy

MaxEnt Example

http://spectorjosh.com/wp-content/uploads/2013/01/Last-Bookstore-shelves.jpg

https://c2.staticflickr.com/8/7037/6964196083_c724f18e97.jpg

What MaxEnt is not• It’s not “creating uncertainty”– The uncertainty is already in the data
• The results are not “arbitrary”– It’s constrained by the data
• It’s not about reducing biology– “MaxEnt is most useful …where the
observed frequencies do not agree with the maximum entropy predictions”
- E. T. Jaynes (Jaynes, 2003)

Maximum Entropy Theory of Ecology (METE) & the Species Abundance Distribution (SAD)
• One soft constraint:– Average abundance (N0/S0)
• Based on Shannon’s information entropy• Uses two LaGrangian multipliers to solve for
the maximum entropy solution to a SAD• Fisher’s log-series distribution

Predicted Abundance
Obs
erve
d Ab
unda
nce
Mammal Community Database (MCDB), R2 = 0.83
North American Butterfly Count (NABC), R2 = 0.93
Breeding Bird Survey (BBS), R2 = 0.91 Christmas Bird Count (CBC), R2 = 0.90
White et al., 2012

Limitations
• Current METE can’t handle very large N0
N0 > ~1xE6
• A rapidly changing system may not be well-described by state variables
• Likely to fail in systems with heterogeneous habitats over large spatial scales

Preliminary Trials• Can METE explain OTU abundance?– i.e. not using metadata to infer distribution
• One well-maintained dataset– Human Microbiome Project (Barbara et al., 2012)
– 16s regions V3-V5• GI tract & skin microbiomes
• Compare to another MaxEnt distribution – Geometric series – Hard constrained for N0 & S0
http://www.hmpdacc.org/resources/data_browser.php

Work Environment / Methods
• METE package from Weecology Lab https://github.com/weecology/METE– Used for METE distribution & geometric series code– Estimated fit using custom
• IPython notebooks– Markdown documentation & visualization in line
with Python code– Store in GitHub repo– Will make public once analysis complete
(Xiao et al., 2013)

• Raw data:• r2 = 0.260• Log-
transformed:• r2 = 0.588
• Abundant taxa skewing the fit
SAD- GI Tract METE
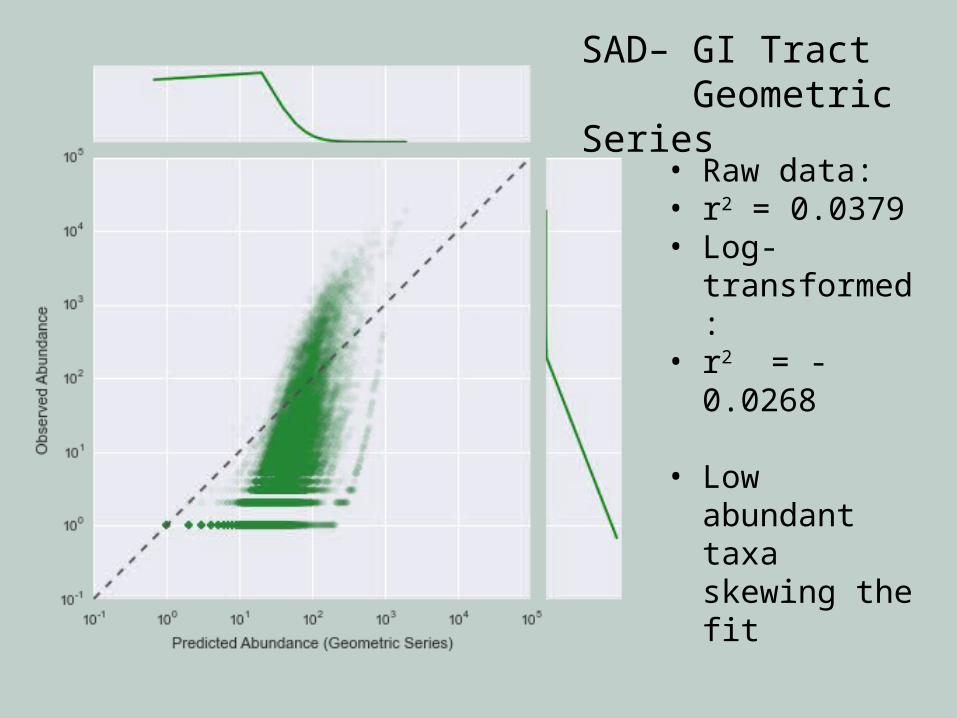
SAD– GI Tract Geometric Series
• Raw data:• r2 = 0.0379• Log-
transformed:• r2 = -0.0268
• Low abundant taxa skewing the fit
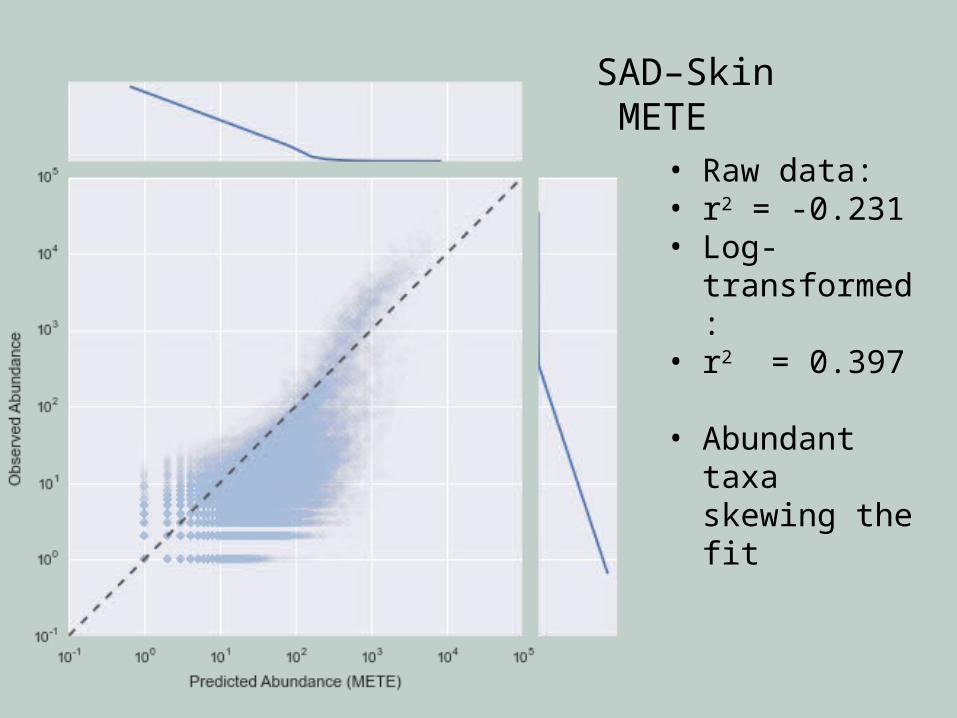
SAD–Skin METE
• Raw data:• r2 = -0.231• Log-
transformed:• r2 = 0.397
• Abundant taxa skewing the fit
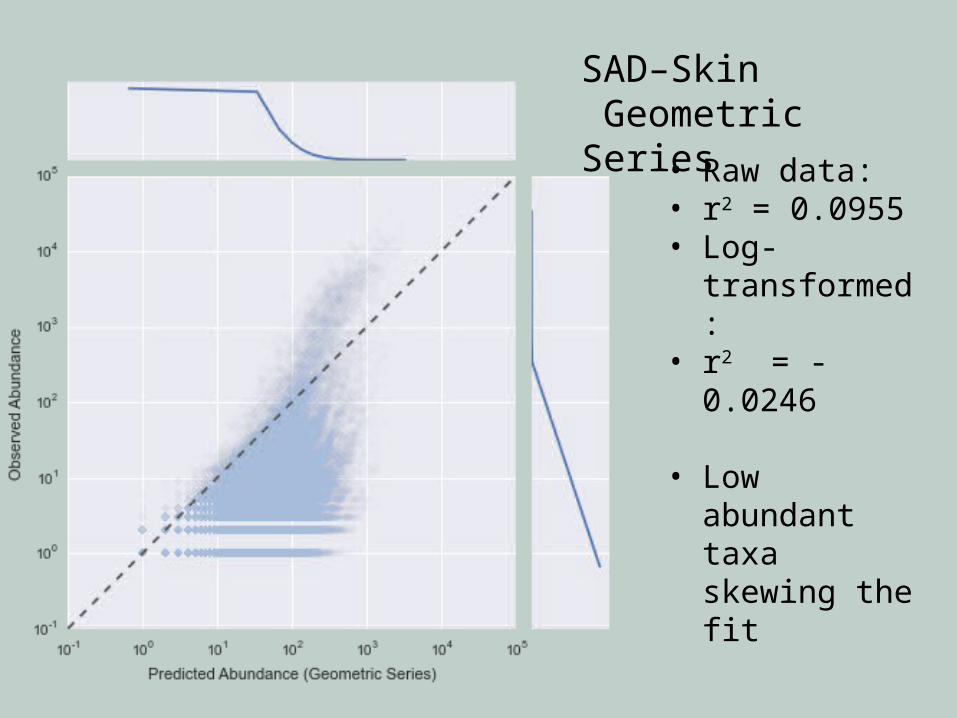
SAD–Skin Geometric Series
• Raw data:• r2 = 0.0955• Log-
transformed:• r2 = -0.0246
• Low abundant taxa skewing the fit

Summary
• METE & the geometric series both fail to predict the SAD– Surprising giving METE’s prior success with
Macrobes• Over predicted for the most taxa across sites• Geometric series under predicted the few
abundant taxa.

What Use is METE to Microbial Ecology?
• Plenty of use as a null model• N0/ S0 might constrain abundance at a higher
or lower scales• Potential use to compare OTU clustering
methods– Large scale microbiome / microbial comm.
sequencing efforts– The most widely used algorithm is most sensitive
to any change in parameters: UCLUST Schmidt et al., 2014

Future Direction• Apply towards traits and effect of S0
– Microbial trait-based modeling using METE• KEGG annotated Global Ocean Sampling Expedition
metagenomes (~80)
– Examine microbial patterns using sub-OTU clustering • Minimum Entropy Decomposition
• Work on research with the evolutionary ecology of quorum sensing in Janthinobacterium

Questions?
Works Cited• The Human Microbiome Project Consortium, Barbara A.; Nelson, Karen E.; Pop, Mihai; Creasy,
Heather H.; Giglio, Michelle G.; Huttenhower, Curtis; Gevers, Dirk; Petrosino, Joseph F. et al. (2012). "A framework for human microbiome research". Nature 486 (7402): 215–221.
• Gilbert JA, Steele JA, Caporaso JG, et al. Defining seasonal marine microbial community dynamics. The ISME Journal 2012;6(2):298-308.
• Harte, P. H. et al. Maximum Entropy and Ecology. • Schmidt, T. S. B., Matias Rodrigues, J. F. & von Mering, C. Limits to Robustness and
Reproducibility in the Demarcation of Operational Taxonomic Units. Environ. Microbiol. (2014).
• Shade, A. & Gilbert, J. a. Temporal patterns of rarity provide a more complete view of microbial diversity. Trends Microbiol. 1–6 (2015).
• Whitman, W. B., Coleman, D. C. & Wiebe, W. J. Prokaryotes: the unseen majority. Proc. Natl. Acad. Sci. U. S. A. 95, 6578–6583 (1998).
• Characterizing species abundance distributions across taxa and ecosystems using a simple maximum entropy model. Ecology. 93, 1772–1778 (2012).
• Xiao, X., McGlinn, D. J. & White, E. P. A strong test of the Maximum Entropy Theory of Ecology. arXiv Prepr. arXiv1308.0731 25 (2013).

• Given data with any constraint on the problem, the probability distribution which maximized the entropy is identical with the frequency distribution which can be realized the greatest number of ways
• MaxEnt tells us which predictions are most likely given our information

• Discuss strong test of MaxEnt?
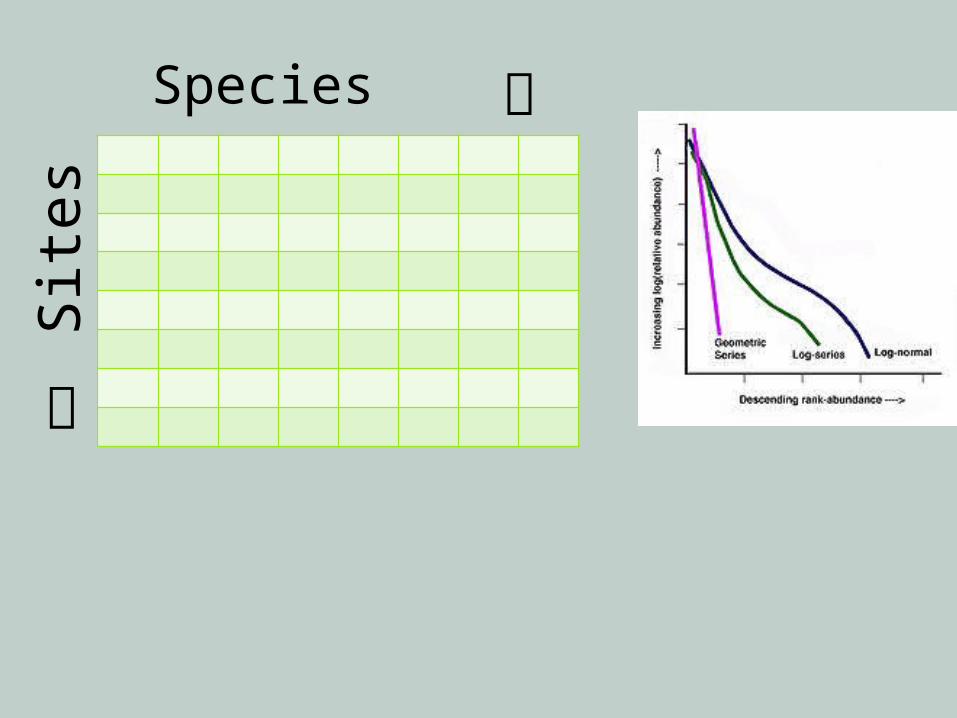
SpeciesSi
tes

How Does METE Calculate Abundance?
1. Calculate β based off of N0 and S0 1. Done for the range of 1 to S0
2. Calculate

Fairly Good Fit
Harte, P. H. et al. Maximum Entropy and Ecology.

Fairly Poor Fit
Harte, P. H. et al. Maximum Entropy and Ecology.


![Bioactive Powerpoint Microbes fighting microbes [Read-Only]](https://img.pdfslide.us/doc/110x75/625e85126147534db333a997/bioactive-powerpoint-microbes-fighting-microbes-read-only.jpg)