Embed Size (px)
Citation preview
Copyright © ASAHI GROUP HOLDINGS. All rights reserved.
Financial Results Digest for Q1 2017
May
2017
※ This material includes the comments and the reference data based on FY2017 Q1 Financial Results.

Copyright © ASAHI GROUP HOLDINGS. All rights reserved.
1
◆ All Businesses achieved YoY growth in revenue and core operating profit (excluding one-off cost for the acquisition of Central and Eastern Europe business) and decent starts above the targets.
・Alcohol Beverages : Results following targets due to achieving the continuous favorable results of New Genre and RTD low-alcohol beverages and streamlining the entire costs.
・Soft Drinks : Results above targets driven by sales increases of core brands, sales channel and product mix improvements and efficient advertising and promotion cost uses.
・Food : Results above targets driven by continuous favorable sales of core brands and reduction of advertising and promotion costs and manufacturing costs.
・Overseas : Results following targets due to firm results of Western Europe and Oceania businesses, mitigating shortfall of Southeast Asia business. (excluding negative JPY 2.2 billion related to the acquisition cost of Central and Eastern Europe business)
◆ Aiming at exceeding the interim and year-end targets by achieving the results above targets in existing businesses and adding a Central and Eastern Europe business result, which was consolidated in the end of March.
Financial Results Highlights for Q1 2017
(JPY billion)
Q1 (3month ended March 31) H1 forecast (announced on February 15)
Inc./Dec. YoY Inc./Dec. YoY
Alcohol Beverages Business 190.4 1.4 0.7% 446.1 2.5 0.6%
Soft Drinks Business 75.2 4.6 6.6% 170.5 1.2 0.7%
Food Business 27.0 1.6 6.2% 52.3 - 0.8 - 1.5%
Overseas Business 84.2 25.8 44.1% 171.8 62.0 56.5%
Other Business/Adjustment 2.5 - 0.1 - 3.4% 2.3 - 0.7 - 24.4%
Revenue 379.2 33.2 9.6% 843.0 64.1 8.2%
Alcohol Beverages Business 15.2 0.3 1.8% 46.2 0.0 0.0%
Soft Drinks Business 3.2 2.9 787.2% 12.7 0.4 3.3%
Food Business 3.1 1.3 76.8% 4.9 0.1 1.8%
Overseas Business * 2.3 - 0.6 - 20.8% 11.4 5.9 106.8%
Other Business/Adjustment - 8.9 - 1.4 - - 17.1 - 2.9 -
Core operating profit 15.0 2.5 20.0% 58.1 3.5 6.5%
*
Summary of Statement of Profit or Loss
Core operating profit in Overseas Business includes one-off costs of Western Europe business (JPY 0.4 billion) and acquisiton
related costs of Central and Eastern Europe business (JPY 2.2 billion)
Alcohol Beverages Business (Sales Volume of Beer-type)
Copyright © ASAHI GROUP HOLDINGS. All rights reserved.
2
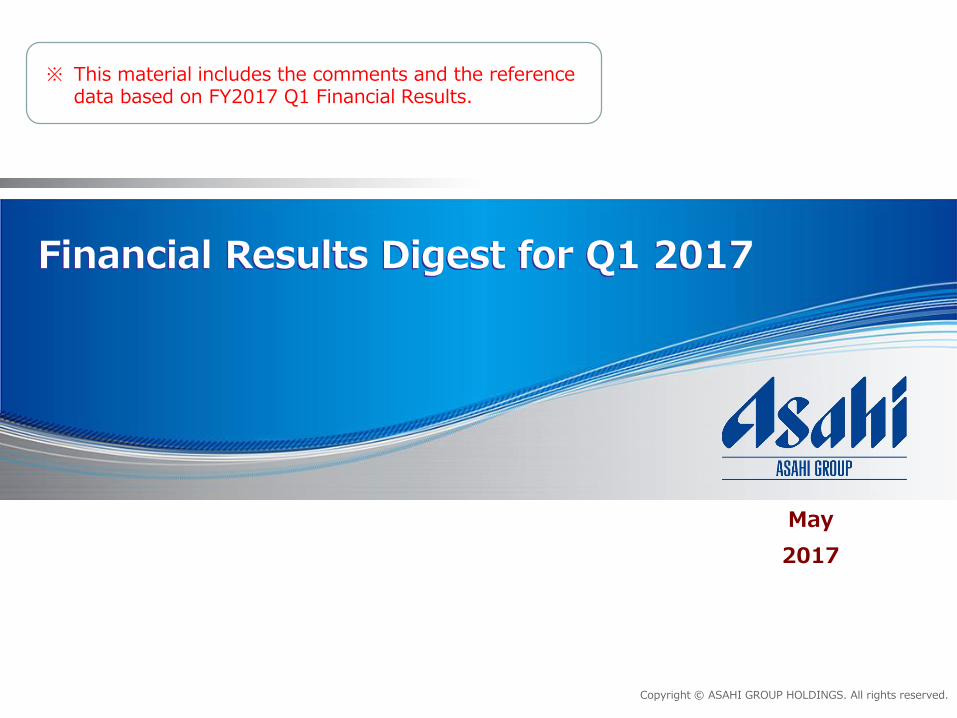
【Market Total】・YoY decline from 0 to 1% in total volume due to the structural factors of beer industry, despite reinforced marketing activities centered on core brands and extension products by each company.
【 Sales Volume of Asahi Breweries 】・The total volume unchanged from the previous year and results following target achieved due to strong performance from New Genre products, despite a year-on-year volume decrease for Beer.
<Beer> -2% decline in total volume due to downturn in reaction to The Dream launched last year, despite YoY growth of Asahi Super Dry driven by marketing activities related to 30th anniversary.
<Happoshu> The total volume unchanged from the previous year due to favorable results of Style Free (+1.5% YoY growth).
<New Genre> +6% growth in total volume driven by favorable results of Clear Asahi brand (+7.3% YoY growth) due to new launch of Zeitaku Zero and renewed Clear Asahi and Prime Rich.
<Sales Volume> (Millions of cases) <Market Total>
Q1 (3month ended March 31) H1 forecast (announced on February 15) Jan. - Mar.
Inc./Dec. YoY Inc./Dec. YoY YoY
Beer - - - 2% 46.00 0.37 0.8% -1~2%
Happoshu - - 0% 6.50 - 0.66 - 9.2% -0~1%
New Genre - - 6% 21.00 0.82 4.1% +0~1%
Beer-type beverages Total - - 0% 73.50 0.54 0.7% -0~1%
<Sales Volume by Brand> (Millions of cases) <Container Type>
Q1 (3month ended March 31) Jan. - Mar.
Inc./Dec. YoY YoY
Super Dry Total 18.08 0.22 1.2% Bottle - 6%
Style Free Total 2.76 0.04 1.5% Can - 1%
Clear Asahi Total 7.63 0.52 7.3% Keg - 2%
Alcohol Beverages Business (Revenue)
Copyright © ASAHI GROUP HOLDINGS. All rights reserved.
3
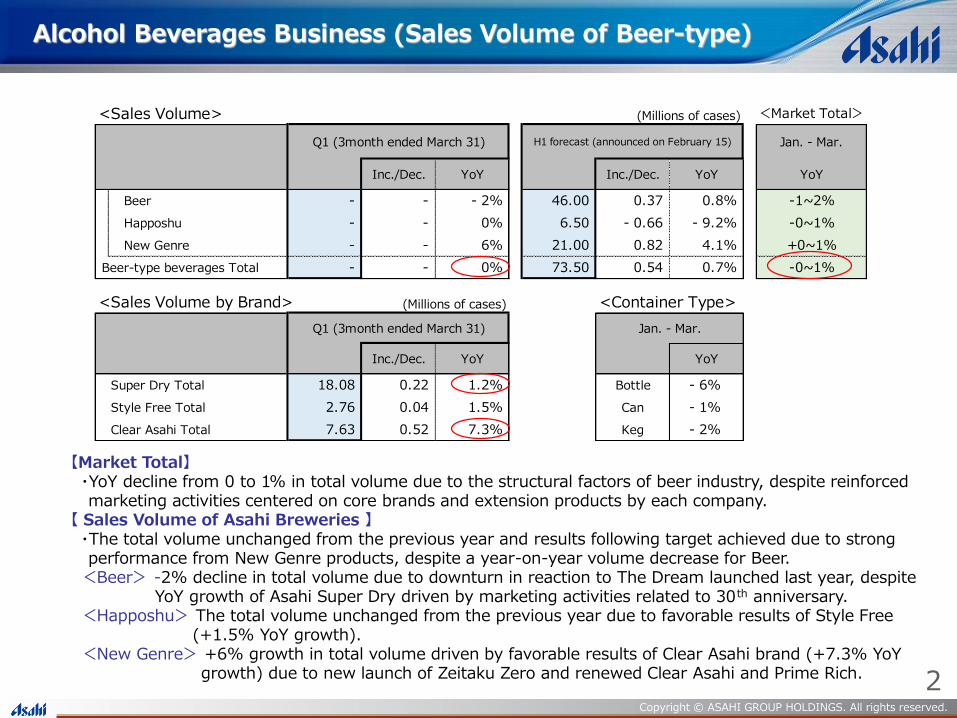
【 Revenue of Other Alcohol Beverages 】・+5.8% YoY growth in total, with substantial increase in sales of RTD (favorable results of Mogitate) and robust results of whiskey due to enhancement of the sales of Black Nikka brand.
・+2.0% YoY growth in revenue of Non-alcohol beverages mainly driven by aggressive advertising of renewed Dry Zero.
・Total results above target achieved due to favorable results of RTD and whiskey, despite wine finished below target.
<Revenue> (JPY billion)
Q1 (3month ended March 31) H1 forecast (announced on February 15)
2016 Inc./Dec. YoY 2016 Inc./Dec. YoY
Beer 100.3 - 2.0 - 1.9% 249.5 2.7 1.1%
Happoshu 12.1 - 0.1 - 0.8% 25.1 - 2.6 - 9.4%
New Genre 30.2 1.8 6.2% 69.6 2.7 4.1%
Beer-type beverages total 142.6 - 0.3 - 0.2% 344.2 2.8 0.8%
Whiskey and spirits 12.3 0.3 2.8% 24.7 - 1.2 - 4.8%
Wine 9.0 - 0.1 - 1.0% 19.3 0.7 3.8%
RTD low-alcohol beverages 7.9 1.7 27.5% 17.3 1.2 7.8%
Shochu 6.2 0.0 0.1% 13.5 0.3 2.6%
Other 0.0 - 0.0 - 15.5% 0.0 0.0 86.3%
Other alcohol beverages total 35.5 2.0 5.8% 74.8 1.1 1.5%
Non-alcohol beverages 5.7 0.1 2.0% 13.6 0.0 0.2%
Other, contracted manufacture, etc. 5.6 0.6 12.6% 11.3 - 0.5 - 4.3%
Asahi Breweries Revenue 189.3 2.4 1.3% 443.9 3.4 0.8%
Other / elimination in segment 8.8 0.3 4.1% 17.9 - 0.4 - 2.1%
Corporate adjustment (IFRS adjustment) - 7.6 - 1.4 - - 15.7 - 0.5 -
Revenue total 190.4 1.4 0.7% 446.1 2.5 0.6%

Alcohol Beverages Business (Core Operating Profit)
Copyright © ASAHI GROUP HOLDINGS. All rights reserved.
4
【Factors Contributing to Growth / Decline】 (JPY billion)・+1.8% YoY growth in total due to revenue increase of other than beer-type beverages and cost reduction, mitigating increase in other expenses due to increase in personnel expenses.
・ Total results following target with revenue increase of other than beer-type beverages and cost reduction, despite the sales volume of beer-type below the target
< Break down of main factors >Beer-type increase in sales volume ±0 (Beer –0.8, Happoshu ±0, New Genre +0.8)Other than beer-type beverages increase in sales volume +0.9Cost reduction in manufacturing +1.1 (Raw materials +0.6, Utilities +0.2, Mix improvement of other than beer-type +0.2, and others)Cost increase in manufacturing -0.2 (Raw materials -0.1, and others)Increase in sales promotion expenses -0.2 (Advertisement +0.1, Promotion expenses -0.3)(Beer-type +0.2, others -0.4)
<Core Operating Profit> (JPY billion)
Q1 (3month ended March 31) H1 forecast (announced on February 15)
Inc./Dec. YoY Inc./Dec. YoY
Beer-type - Increase in sales volume - 0.0 - 1.0
Change in Beer-type - 0.1 - 0.2
Other than beer-type beverages - increase in sales volume - 0.9 - 0.3
Cost reduction in manufacturing - 1.1 - 1.2
Cost increase in manufacturing - - 0.2 - - 0.3
Increase in sales promotion expenses 23.1 - 0.2 51.4 0.2
Increase in other expenses - - 1.4 - - 2.5
(Increase in personnel expenses) - - 0.3 - - 0.8
(Decrease in depreciation) - 0.1 - 0.2
(Increase in sales equipment expenses) - - 0.3 - - 0.5
(Others) - - 0.9 - - 1.4
Asahi Breweries 15.1 0.2 1.4% 45.9 0.1 0.3%
Other / elimination in segment 0.1 0.1 77.2% 0.3 - 0.1 - 25.4%
Core Operating Profit 15.2 0.3 1.8% 46.2 0.0 0.0%
Soft Drinks Business (Sales Volume)
Copyright © ASAHI GROUP HOLDINGS. All rights reserved.
5
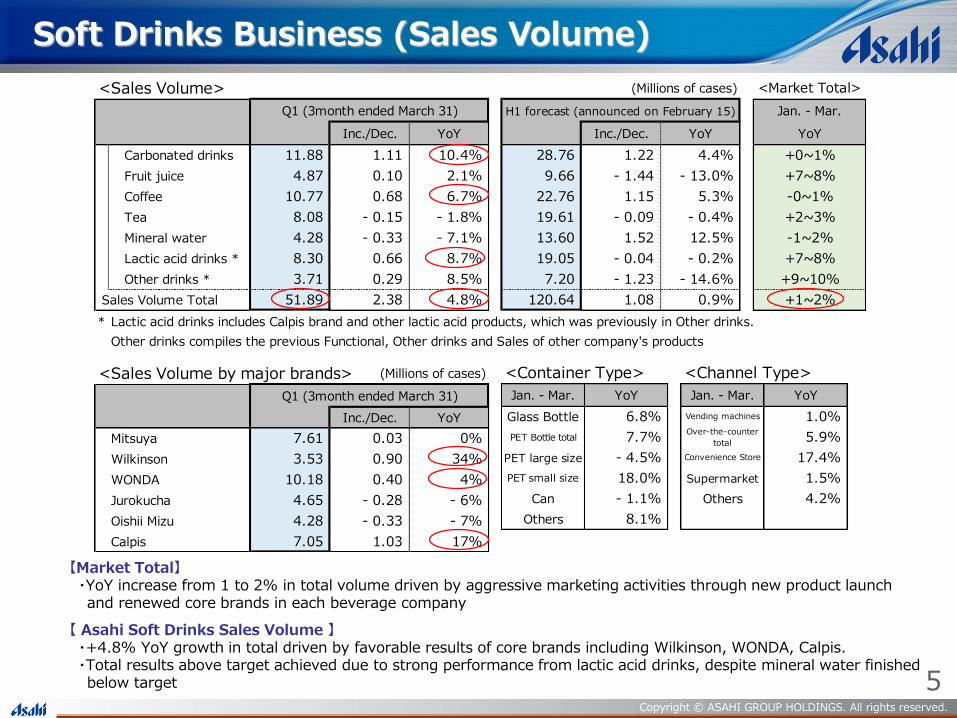
【Market Total】・YoY increase from 1 to 2% in total volume driven by aggressive marketing activities through new product launch and renewed core brands in each beverage company
【 Asahi Soft Drinks Sales Volume 】・+4.8% YoY growth in total driven by favorable results of core brands including Wilkinson, WONDA, Calpis.・Total results above target achieved due to strong performance from lactic acid drinks, despite mineral water finished below target
<Sales Volume> (Millions of cases) <Market Total>
Q1 (3month ended March 31) H1 forecast (announced on February 15) Jan. - Mar.
Inc./Dec. YoY Inc./Dec. YoY YoY
Carbonated drinks 11.88 1.11 10.4% 28.76 1.22 4.4% +0~1%
Fruit juice 4.87 0.10 2.1% 9.66 - 1.44 - 13.0% +7~8%
Coffee 10.77 0.68 6.7% 22.76 1.15 5.3% -0~1%
Tea 8.08 - 0.15 - 1.8% 19.61 - 0.09 - 0.4% +2~3%
Mineral water 4.28 - 0.33 - 7.1% 13.60 1.52 12.5% -1~2%
Lactic acid drinks * 8.30 0.66 8.7% 19.05 - 0.04 - 0.2% +7~8%
Other drinks * 3.71 0.29 8.5% 7.20 - 1.23 - 14.6% +9~10%
Sales Volume Total 51.89 2.38 4.8% 120.64 1.08 0.9% +1~2%
* Calpis includes the figures of Calpis brand (Calpis and Calpis water) and Other drinks includes the figures of other brandsLactic acid drinks includes Calpis brand and other lactic acid products, which was previously in Other drinks.
in the previous Calpis segment.Other drinks compiles the previous Functional, Other drinks and Sales of other company's products
<Sales Volume by major brands> (Millions of cases)
Q1 (3month ended March 31)
Inc./Dec. YoY
Mitsuya 7.61 0.03 0%
Wilkinson 3.53 0.90 34%
WONDA 10.18 0.40 4%
Jurokucha 4.65 - 0.28 - 6%
Oishii Mizu 4.28 - 0.33 - 7%
Calpis 7.05 1.03 17%
<Container Type> <Channel Type>
Jan. - Mar. YoY Jan. - Mar. YoY
Glass Bottle 6.8% Vending machines 1.0%
PET Bottle total 7.7% Over-the-counter
total5.9%
PET large size - 4.5% Convenience Store 17.4%
PET small size 18.0% Supermarket 1.5%
Can - 1.1% Others 4.2%
Others 8.1%

Soft Drinks Business (Core Operating Profit)
Copyright © ASAHI GROUP HOLDINGS. All rights reserved.
6
【Factors Contributing to Growth / Decline of Asahi Soft Drinks】 (JPY billion)・Substantial YoY increase by JPY 2.9 billion due to efficient operation of advertising and promotion expenses, in addition to sales volume increase and product mix improvement
・Results above target achieved due to sales volume increase and reduction of advertising and sales promotion expenses
< Break down of main factors >Increase in sales volume +1.5, Change in production composition, etc. +0.5,Cost reduction +0.7 (Raw materials +0.3, Packages +0.2, Increase of rate of operation / in-house production +0.2)Cost increase -0.1 (Raw materials -0.0, Packages -0.0), Increase in sales promotion expenses +0.5(Advertisement +0.1, Promotion expenses +0.4)
【LB】・-3.2% YoY decrease in revenue due to factors including the revenue decline in convenience stores.・Results in core operating profit following target due to manufacturing cost reduction and product mix improvement.
<Core Operating Profit> (JPY billion / Millions of cases)
Q1 (3month ended March 31) H1 forecast (announced on February 15)
Inc./Dec. YoY Inc./Dec. YoY
Sales Volume Total 51.89 2.38 4.8% 120.64 1.08 0.9%
Revenue Total 75.2 4.6 6.6% 170.5 1.2 0.7%
Increase in sales volume - 1.5 - 0.5
Change in production composition, etc. - 0.5 - 0.2
Cost reduction - 0.7 - 1.2
Cost increase - - 0.1 - - 0.2
Decrease in sales promotion expenses - 0.5 - - 0.4
Other expenses - - 0.2 - - 0.8
Asahi Soft Drinks 3.1 2.9 - 12.3 0.4 3.7%
LB 0.0 - 0.0 - 89.9% 0.2 - 0.0 - 14.0%
Other / elimination in segment 0.1 0.0 40.7% 0.2 0.0 5.8%
Core Operating Profit 3.2 2.9 787.2% 12.7 0.4 3.3%
Food Business (Revenue / Core Operating Profit)
Copyright © ASAHI GROUP HOLDINGS. All rights reserved.
7
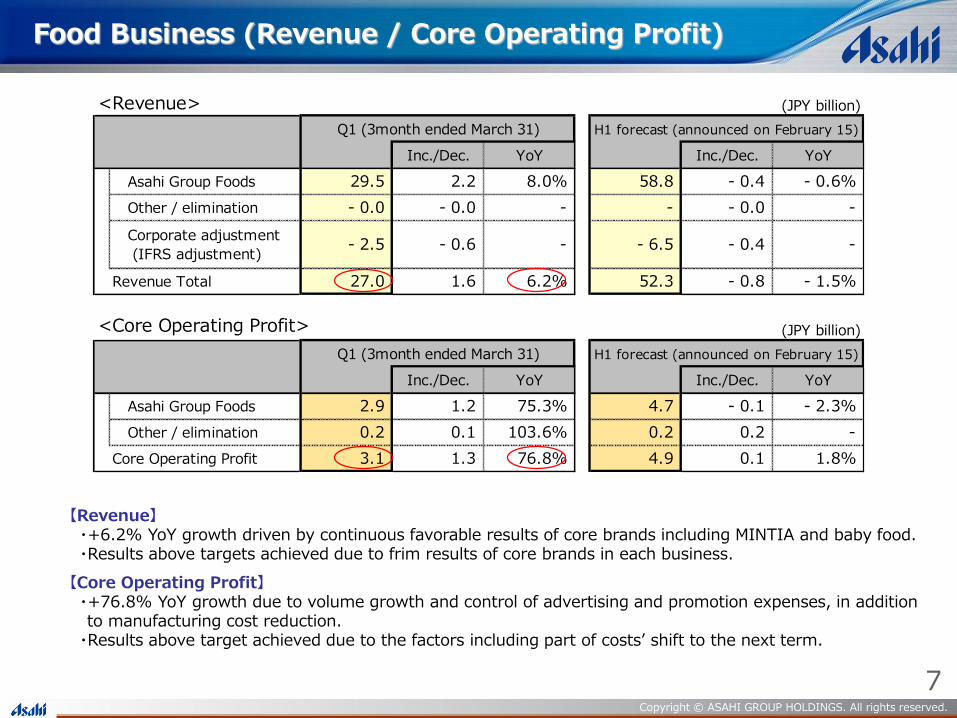
【Revenue】・+6.2% YoY growth driven by continuous favorable results of core brands including MINTIA and baby food.・Results above targets achieved due to frim results of core brands in each business.
【Core Operating Profit】・+76.8% YoY growth due to volume growth and control of advertising and promotion expenses, in addition to manufacturing cost reduction.
・Results above target achieved due to the factors including part of costs’ shift to the next term.
<Revenue> (JPY billion)
Q1 (3month ended March 31) H1 forecast (announced on February 15)
Inc./Dec. YoY Inc./Dec. YoY
Asahi Group Foods 29.5 2.2 8.0% 58.8 - 0.4 - 0.6%
Other / elimination - 0.0 - 0.0 - - - 0.0 -
Corporate adjustment
(IFRS adjustment)- 2.5 - 0.6 - - 6.5 - 0.4 -
Revenue Total 27.0 1.6 6.2% 52.3 - 0.8 - 1.5%
<Core Operating Profit> (JPY billion)
Q1 (3month ended March 31) H1 forecast (announced on February 15)
Inc./Dec. YoY Inc./Dec. YoY
Asahi Group Foods 2.9 1.2 75.3% 4.7 - 0.1 - 2.3%
Other / elimination 0.2 0.1 103.6% 0.2 0.2 -
Core Operating Profit 3.1 1.3 76.8% 4.9 0.1 1.8%

Overseas Business (Revenue)
【Revenue】・+44.1% YoY growth in total driven by new addition of Europe business and increase in Oceania business.(positive forex impact of JPY 0.4 billion)
【Revenue (excluding forex impacts associated with conversion of local currencies into JPY)】・Europe: Results slightly above target by achieving JPY 24.5 billion・Oceania: +6.4% YoY growth driven by enhancing the sales of growing categories including mineral water and
imported premium beer. (Non-alcohol beverages +8%, Alcohol beverages +5%)・Southeast Asia: -6.6% YoY decrease due to decline of Malaysia and Myanmar, despite increase of Indonesia.・China: -4.6% YoY decrease due to impact of review of manufacturing process for export, despite favorable sales
results of Asahi Super Dry in China.・Results following target due to excess achievement in Europe and Oceania, despite shortfall in Southeast Asia.
Copyright © ASAHI GROUP HOLDINGS. All rights reserved.
8
<Revenue> (JPY billion)
Q1 (3month ended March 31) H1 forecast (announced on February 15)
Inc./Dec. YoY Inc./Dec. YoY
Europe business 24.5 24.5 - 56.9 56.9 -
Oceania business 41.5 3.8 10.1% 73.6 4.8 7.0%
Southeast Asia business 13.0 - 1.8 - 12.1% 30.8 2.0 6.9%
China business 4.2 - 0.5 - 10.2% 8.0 - 1.4 - 15.3%
Other / elimination in segment 1.1 - 0.3 - 18.1% 2.5 - 0.2 - 9.0%
Corporate adjustment (IFRS adjustment) - - - - - -
Revenue 84.2 25.8 44.1% 171.8 62.0 56.5%
<Revenue (excluding foreign exchange impacts associated with conversion of local currencies into JPY)>
Q1 (3month ended March 31) H1 forecast (announced on February 15)
Inc./Dec. YoY Inc./Dec. YoY
Europe business 24.5 24.5 - 56.9 56.9 -
Oceania business 40.1 2.4 6.4% 72.6 3.8 5.5%
Southeast Asia business 13.8 △ 1.0 - 6.6% 33.5 4.6 16.1%
China business 4.4 △ 0.2 - 4.6% 9.1 - 0.3 - 3.7%
Other / elimination in segment 1.1 △ 0.3 - 19.1% 2.7 - 0.0 - 0.2%
Corporate adjustment (IFRS adjustment) - - - - - -
Revenue 83.8 25.4 43.5% 174.8 65.0 59.2%

Overseas Business (Core Operating Profit)
Copyright © ASAHI GROUP HOLDINGS. All rights reserved.
9
【Core Operating Profit】・-20.8% YoY decrease in total due to factors including costs related to acquisition of Central and Eastern Europe business and decrease in Southeast Asia. (positive forex impact of JPY 0.1 billion)
【Core Operating Profit (excluding forex impacts associated with conversion of local currencies into JPY)】・Europe: Results above target due to addition by JPY 1.9 billion excluding one-off cost and acquisition
related cost・Oceania: +65.3% YoY growth driven by increase of Alcohol beverages and improvement of product mix,
in addition to creation of integration synergies.・Southeast Asia: -91.5% YoY decrease mainly due to deterioration in Malaysia where soft drinks market
was stagnant.・China: -48.0% YoY decrease due to manufacturing volume decline in Beijing Brewery and product mix
deterioration in Yantai Beer.・Results excluding the cost related to acquisition of Central and Eastern Europe business following target due to firm results in Western Europe and Oceania, mitigating shortfall in Southeast Asia.
<Breakdown of Europe>
◎Q1 results (JPY billion)
Western Europe +1.4
Core OP +1.9One-off cost -0.4
Central and Eastern Europe -2.2
FA fee -2.2
◎Interim Target (JPY billion)
Western Europe +5.5
Core OP +6.4One-off cost -0.9
<Core Operating Profit> (JPY billion)
Q1 (3month ended March 31) H1 forecast (announced on February 15)
Inc./Dec. YoY Inc./Dec. YoY
Europe business - 0.8 - 0.8 - 5.5 5.5 -
Oceania business 2.7 1.1 71.0% 3.5 0.5 15.8%
Southeast Asia business 0.1 - 0.8 - 93.1% 1.8 0.1 7.0%
China business 0.2 - 0.2 - 51.1% 0.7 - 0.2 - 26.1%
Other / elimination in segment 0.1 0.1 - - 0.1 - 0.0 -
Core Operating Profit 2.3 - 0.6 - 20.8% 11.4 5.9 106.8%
<Core Operating Profit (excluding foreign exchange impacts associated with conversion of local currencies into JPY)>
Q1 (3month ended March 31) H1 forecast (announced on February 15)
Inc./Dec. YoY Inc./Dec. YoY
Europe business - 0.8 - 0.8 - 5.5 5.5 -
Oceania business 2.6 1.0 65.3% 3.4 0.4 14.2%
Southeast Asia business 0.1 - 0.8 - 91.5% 1.9 0.3 16.8%
China business 0.2 - 0.2 - 48.0% 0.8 - 0.1 - 16.0%
Other / elimination in segment 0.0 0.1 - - 0.1 - 0.0 -
Core Operating Proft 2.3 - 0.7 - 23.3% 11.6 6.1 110.5%

Operating ProfitProfit attributable to owners of parent
Copyright © ASAHI GROUP HOLDINGS. All rights reserved.
10
【Operating Profit】・+5.7% YoY growth through contraction of core OP increase mainly due to downturn in reaction to gain on sales of subsidiaries’ non-current assets last year and loss from restructuring.
【Profit attributable to owners of parent】・+29.8% YoY growth due to contraction of share of loss of entities accounted for using equity method associated with decrease of Tingyi-Asahi Beverages equity ratio.
・Results following target despite slightly shortfall of share of loss of entities accounted for using equity method.
(JPY billion)
Q1 (3month ended March 31) H1 forecast (announced on February 15)
Inc./Dec. YoY Inc./Dec. YoY
Revenue 379.2 33.2 9.6% 843.0 64.1 8.2%
Core operating profit 15.0 2.5 20.0% 58.1 3.5 6.5%
Adjustment item - 1.4 - 1.8 - 5.3 - 3.5
0.1 - 1.1 - 2.3 - 2.9
Business integration expeses - 0.5 0.0 - 1.4
Others - 1.0 - 0.7 - 3.0 - 2.0
Operating profit 13.6 0.7 5.7% 52.8 0.0 0.1%
Financing income or loss - 0.7 - 0.2 - 0.5 - 0.7
- 5.5 0.8 - 3.3 0.7
Others - 1.6 - 0.5 - 1.3
Profit before tax 5.9 0.9 17.4% 49.0 1.3 2.8%
Income tax expense - 3.2 - 0.2 - 12.9 4.4
Profit 2.7 0.7 36.1 5.8
Profit attributable to owners of parent 2.8 0.6 29.8% 36.0 5.3 17.1%
Profit attributable to non-controlling interests - 0.1 0.0 0.1 0.5
Summary of Statement of Profit of Loss
Gain (loss) on sales and retirement of non current
assets
Share of profit (loss) of entities accounted for
using equity method

Information in this material is not intended to solicit sale or purchase of shares in Asahi Group Holdings.
The views, estimates and other information expressed in this document are based on the company's judgment at the time of
publication, and no guarantees are provided regarding the accuracy of such information. This information is subject to change
without notice.
The company and its officers and representatives accept no responsibility or liability for any damage or inconvenience that may
be caused by or in conjunction with any part of these materials.


![[XLS]REVmc Pre-Ballot Comments - IEEE Standards · Web viewREVmc Working Group Ballot Comments After May TGmc session Part way through July TGmc session Includes all July resolutions](https://img.pdfslide.us/doc/110x75/5ab68fd37f8b9ab47e8df035/xlsrevmc-pre-ballot-comments-ieee-standards-viewrevmc-working-group-ballot.jpg)