Embed Size (px)
Citation preview
This lesson was created in partnership with the Teacher-Ranger-Teacher program through the National Park Service.
This lesson was created in partnership with the Teacher-Ranger-Teacher program through the National Park Service.
Table of Contents
Unit Overview ..................................................................................................................................................... 3-5
Lessons by Day ....................................................................................................................................................... 6
Day 1: Climate Change ........................................................................................................................................ 7-8
Day 2: Weather vs. Climate ............................................................................................................................... 9-10
Day 3: Snowpack and Snow Water Equivalent ................................................................................................ 11-12
Day 4: Snow Course Field Trip ......................................................................................................................... 13-14
Day 5: Watershed ........................................................................................................................................... 15-16
Day 6: Stream Flow Tools and Data ................................................................................................................ 17-19
Day 7: Climate Connections ............................................................................................................................ 20-21
Day 8: Research Projects ................................................................................................................................. 22-24
Teacher Resources ............................................................................................................................................... 25
Pre/Post-Assessment ......................................................................................................................................... 26-27
Worksheet 1.1—Introduction to Climate Change ................................................................................................... 28
Worksheet 2.1—Weather and Climate ................................................................................................................... 29
Worksheet 2.2—Weather and Climate ................................................................................................................... 30
Worksheet 2.3—Weather and Climate .................................................................................................................. 21
Worksheet 3.1—Vocabulary ................................................................................................................................... 32
Procedure 4.1—Snow Pit ................................................................................................................................... 33-34
Worksheet 4.1—Snow Science Field Day ................................................................................................................ 35
Procedure 5.1—The Power of Water ...................................................................................................................... 36
Procedure 5.2—Watershed ................................................................................................................................ 37-38
Worksheet 5.1—Watershed .................................................................................................................................... 39
Procedure 6.1—Sequoia-Kings Canyon Stream Flow Data ................................................................................ 40-42
Procedure 6.2—Yosemite Stream Flow Data ..................................................................................................... 43-45
Procedure 7.1—Virtual Field Trip ....................................................................................................................... 46-47
Procedure 8.1—Web Resources.............................................................................................................................. 48
Worksheet 8.1—Project Rubric ............................................................................................................................... 49
Worksheet 8.2—Climate Science Projects ......................................................................................................... 50-52
Worksheet 8.3—Research Project ..................................................................................................................... 53-55
Fake Money ........................................................................................................................................................ 56-57
Vocabulary .......................................................................................................................................................... 58-59
Student Evaluation .................................................................................................................................................. 60
Teacher Evaluation ............................................................................................................................................. 61-62
This lesson was created in partnership with the Teacher-Ranger-Teacher program through the National Park Service.
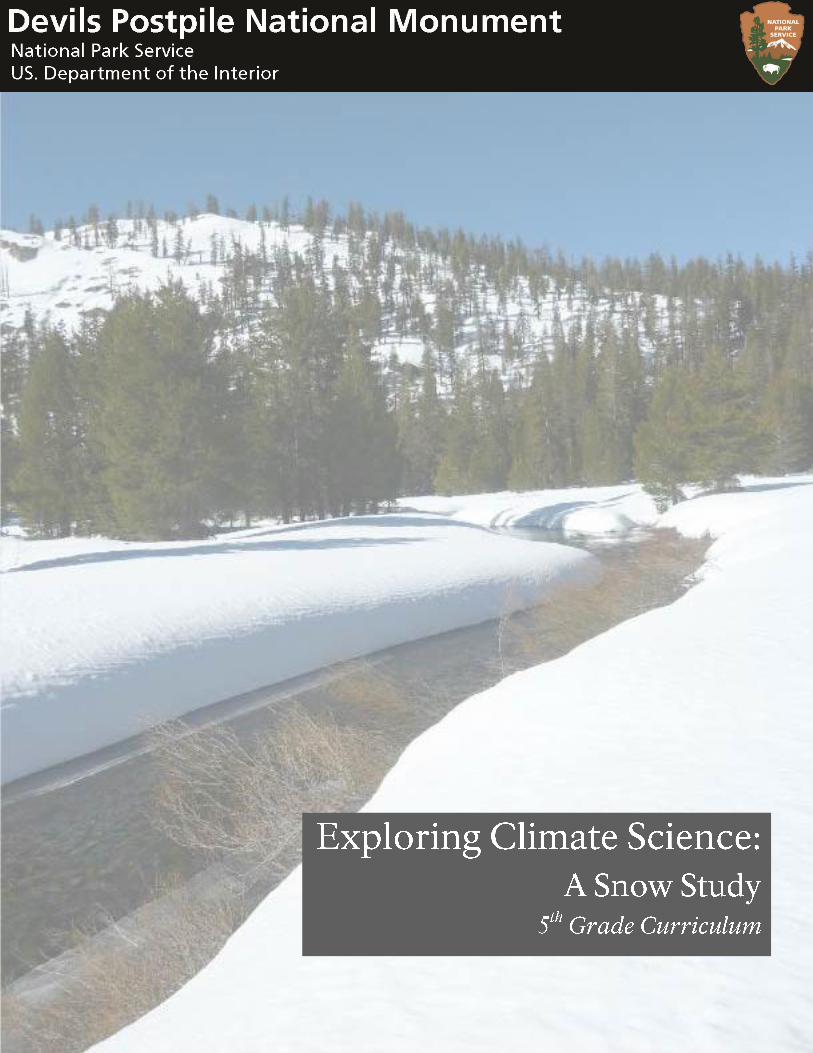
5th
Grade Earth Science
Unit Overview
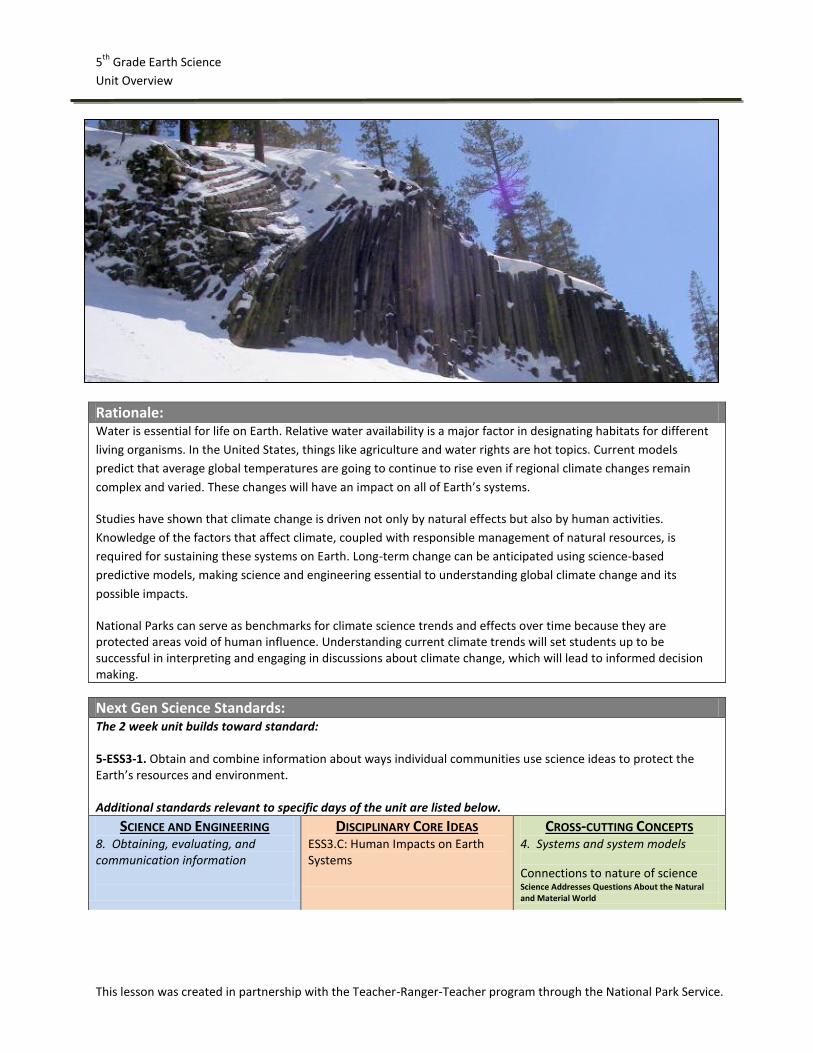
Rationale: Water is essential for life on Earth. Relative water availability is a major factor in designating habitats for different
living organisms. In the United States, things like agriculture and water rights are hot topics. Current models
predict that average global temperatures are going to continue to rise even if regional climate changes remain
complex and varied. These changes will have an impact on all of Earth’s systems.
Studies have shown that climate change is driven not only by natural effects but also by human activities.
Knowledge of the factors that affect climate, coupled with responsible management of natural resources, is
required for sustaining these systems on Earth. Long-term change can be anticipated using science-based
predictive models, making science and engineering essential to understanding global climate change and its
possible impacts.
National Parks can serve as benchmarks for climate science trends and effects over time because they are protected areas void of human influence. Understanding current climate trends will set students up to be successful in interpreting and engaging in discussions about climate change, which will lead to informed decision making.
Next Gen Science Standards: The 2 week unit builds toward standard: 5-ESS3-1. Obtain and combine information about ways individual communities use science ideas to protect the Earth’s resources and environment. Additional standards relevant to specific days of the unit are listed below.
SCIENCE AND ENGINEERING
8. Obtaining, evaluating, and communication information
DISCIPLINARY CORE IDEAS ESS3.C: Human Impacts on Earth Systems
CROSS-CUTTING CONCEPTS 4. Systems and system models
Connections to nature of science Science Addresses Questions About the Natural and Material World
This lesson was created in partnership with the Teacher-Ranger-Teacher program through the National Park Service.
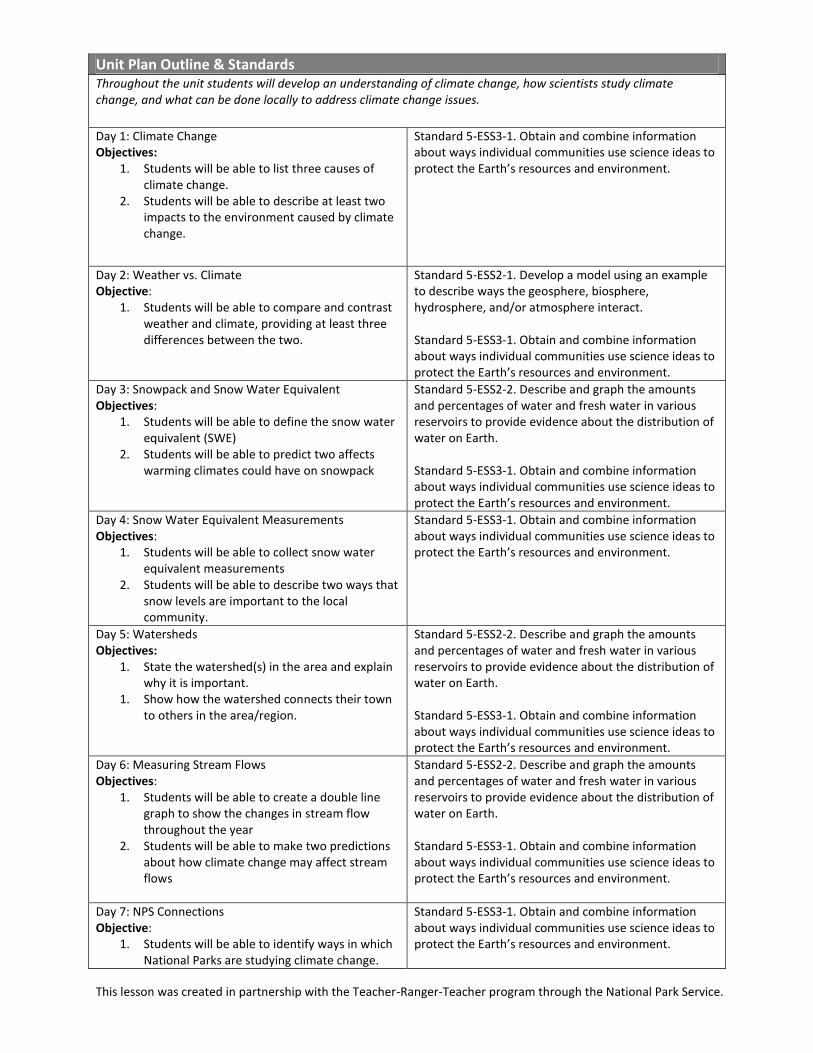
Unit Plan Outline & Standards Throughout the unit students will develop an understanding of climate change, how scientists study climate change, and what can be done locally to address climate change issues.
Day 1: Climate Change Objectives:
1. Students will be able to list three causes of climate change.
2. Students will be able to describe at least two impacts to the environment caused by climate change.
Standard 5-ESS3-1. Obtain and combine information about ways individual communities use science ideas to protect the Earth’s resources and environment.
Day 2: Weather vs. Climate Objective:
1. Students will be able to compare and contrast weather and climate, providing at least three differences between the two.
Standard 5-ESS2-1. Develop a model using an example to describe ways the geosphere, biosphere, hydrosphere, and/or atmosphere interact. Standard 5-ESS3-1. Obtain and combine information about ways individual communities use science ideas to protect the Earth’s resources and environment.
Day 3: Snowpack and Snow Water Equivalent Objectives:
1. Students will be able to define the snow water equivalent (SWE)
2. Students will be able to predict two affects warming climates could have on snowpack
Standard 5-ESS2-2. Describe and graph the amounts and percentages of water and fresh water in various reservoirs to provide evidence about the distribution of water on Earth. Standard 5-ESS3-1. Obtain and combine information about ways individual communities use science ideas to protect the Earth’s resources and environment.
Day 4: Snow Water Equivalent Measurements Objectives:
1. Students will be able to collect snow water equivalent measurements
2. Students will be able to describe two ways that snow levels are important to the local community.
Standard 5-ESS3-1. Obtain and combine information about ways individual communities use science ideas to protect the Earth’s resources and environment.
Day 5: Watersheds Objectives:
1. State the watershed(s) in the area and explain why it is important.
1. Show how the watershed connects their town to others in the area/region.
Standard 5-ESS2-2. Describe and graph the amounts and percentages of water and fresh water in various reservoirs to provide evidence about the distribution of water on Earth. Standard 5-ESS3-1. Obtain and combine information about ways individual communities use science ideas to protect the Earth’s resources and environment.
Day 6: Measuring Stream Flows Objectives:
1. Students will be able to create a double line graph to show the changes in stream flow throughout the year
2. Students will be able to make two predictions about how climate change may affect stream flows
Standard 5-ESS2-2. Describe and graph the amounts and percentages of water and fresh water in various reservoirs to provide evidence about the distribution of water on Earth. Standard 5-ESS3-1. Obtain and combine information about ways individual communities use science ideas to protect the Earth’s resources and environment.
Day 7: NPS Connections Objective:
1. Students will be able to identify ways in which National Parks are studying climate change.
Standard 5-ESS3-1. Obtain and combine information about ways individual communities use science ideas to protect the Earth’s resources and environment.
This lesson was created in partnership with the Teacher-Ranger-Teacher program through the National Park Service.
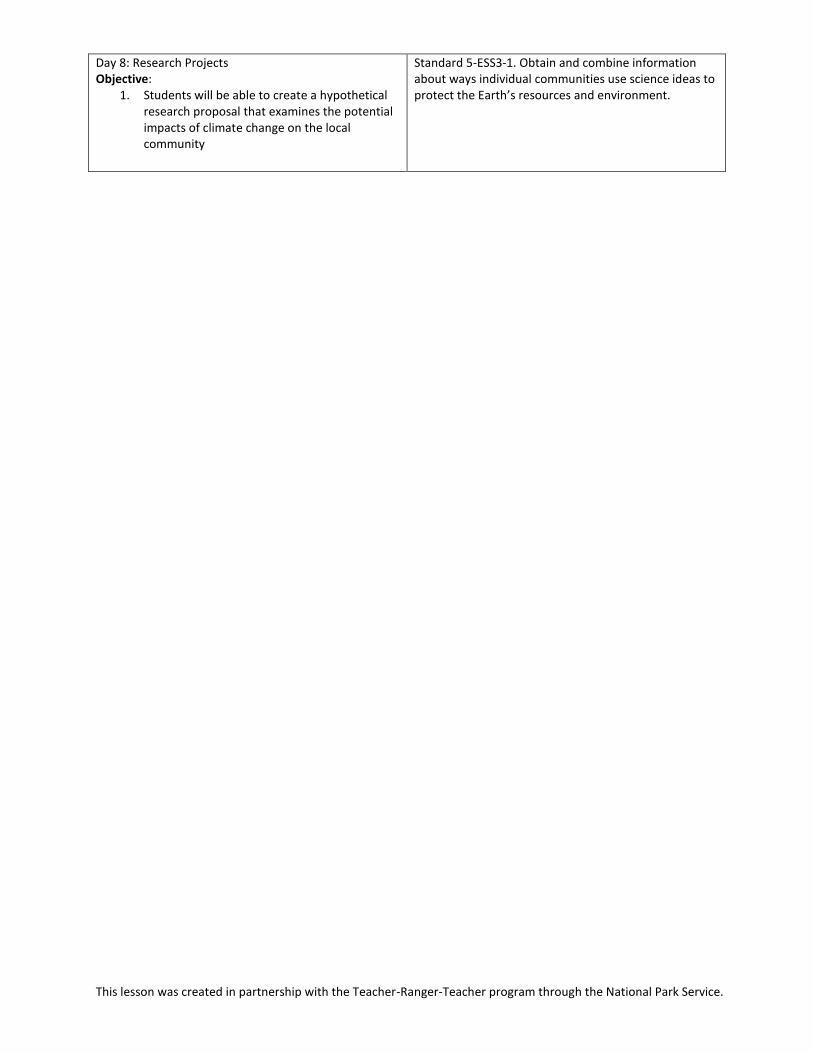
Day 8: Research Projects Objective:
1. Students will be able to create a hypothetical research proposal that examines the potential impacts of climate change on the local community
Standard 5-ESS3-1. Obtain and combine information about ways individual communities use science ideas to protect the Earth’s resources and environment.
This lesson was created in partnership with the Teacher-Ranger-Teacher program through the National Park Service.
LESSONS BY DAY
Day 1: Climate Change Date:
Earth Science Grade(s):
This lesson was created in partnership with the Teacher-Ranger-Teacher program through the National Park Service.
Instructional Objective(s): Students will be able to:
1. List three causes of climate change.
2. Describe at least two impacts to the environment caused by climate change.
Prerequisite Concepts and Skills: Vocabulary Pollution, climate change, global warming, greenhouse effect (these words to be taught in context during the lesson)
Materials and Resources Model of earth and sun (NPS provided) White strips of paper, 1 per student, (teacher created) 5 yellow strips of paper (teacher created) Reading materials: (NPS provided master copies) http://www.timeforkids.com/news/going-extremes/41921 http://www.timeforkids.com/news/polar-bears-peril/86701 http://www.timeforkids.com/news/president%E2%80%99s-climate-plan/97006 http://www.epa.gov/climatestudents/basics/today/index.html http://www.epa.gov/climatestudents/impacts/effects/index.html Sufficient copies of reading materials for student work groups Worksheet 1.1 (NPS provided master copy)
Lesson Activities: 40 min
Teacher Activities Student Activities Time: Introduction: 1. Explain to students that they will be spending the next two weeks learning about climate change and what scientists are doing to address climate change. Brainstorm – have students share what they already know about climate change.
1. Listen, participate, and discuss. 5 min
Day 1: Climate Change Date:
Earth Science Grade(s):
This lesson was created in partnership with the Teacher-Ranger-Teacher program through the National Park Service.
New Content: 1. Pass out white strips of paper to students. Ask students to write one type of air pollution on their strip of paper. Collect the strips and tape them together in a circle. 2. Have student volunteers hold up the model of the earth and the sun. Use the yellow strips of paper to demonstrate how the sun’s rays reach the earth and then bounce back away from the earth. Have another volunteer hold up the circle of “pollution” around earth. Again demonstrate the yellow rays hitting the earth, but then show how they are trapped by the pollution, thus warming the earth. 3. Have students divide into pairs, read the text passages, and record their learning in worksheet 1.1. 4. Have each pair summarize and share two to three facts they learned about climate change from their reading. 5. Talk about how scientists respond to climate change by conducting scientific research (monitoring) and then taking action based on that research. Lessons will focus on this over the next two weeks.
1. Students write one type of pollution on their strip of paper. Use a student volunteer to collect the white strips and tape them together as students finish. 2. Three student volunteers, remaining students are listening 3. Students read text with their partner, fill in worksheet 1.1, and plan what they will share with the class. 4. Students present the most important facts from their articles to the class. Other students use the information presented to finish filling out worksheet 1.1. 5. Students share examples of when research or learning has led students to take action in their personal life.
3 min 5 min 10 min 10 min 2 min
Wrap Up: 1. Ask students how they think climate change or global warming is impacting the local community. 2. Exit ticket question: “How is climate change caused and what are some of its impacts?”
1. Discuss and share. 2. Quick write.
5 min
Organizational and/or Behavioral Management Strategies:
Assessment and Evaluation:
Extensions:
Adaptations:
Teacher Reflections:
Day 2: Weather vs. Climate Date:
Earth Science Grade(s):
This lesson was created in partnership with the Teacher-Ranger-Teacher program through the National Park Service.
Instructional Objective(s): Students will be able to:
1. Compare and contrast weather and climate, providing at least three differences between the two. 2. Use an anemometer and thermometer to collect local weather data.
Prerequisite Concepts and Skills: Vocabulary Weather, climate, adaptation, habitat (these words to be taught in context during the lesson) Prerequisite Concept Venn Diagram
Materials and Resources: Video Earth: Climate and Weather http://video.nationalgeographic.com/video/science/earth-sci/climateweather-sci/ Worksheet 2.1 (NPS provided master copy) Anemometers and thermometers (NPS provided) Worksheet 2.2 (NPS provided master copy) Worksheet 2.3 (NPS provided master copy)
Lesson Activities: 40 min
Teacher Activities Student Activities Time: Introduction: 1. Display video Earth: Climate and Weather. Have students fill out worksheet 2.1 while watching the video.
1. Watch the video. List similarities and differences between weather and climate using the Venn Diagram (worksheet 2.1).
5 min
New Content: 1. Take students outside to an open area and demonstrate how to use the anemometers and thermometers. Split students into small groups to take a reading recording their data on worksheet 2.2
1. Use wind meters and thermometers to make observations about the current weather. 2. Provide data collected from gauges. 3. Participate in discussion. 4. Complete worksheet 2.3.
5 min 5 min 8 min 12 min
Day 2: Weather vs. Climate Date:
Earth Science Grade(s):
This lesson was created in partnership with the Teacher-Ranger-Teacher program through the National Park Service.
2. Bring the group back together for a
discussion about local weather.
Emphasize how the weather today
could look very different from the
weather tomorrow.
3. Discuss how the data they collected
today was for the local weather.
Climate would be the readings taken
over a much longer period of time
(decades etc). Facilitate brainstorm
about how climate change can
influence climate.
4. Explain how climate is connected to
ecosystems—a hot climate is a desert
while a cold snowy climate would be
the arctic. Animals and plants have
specific climates that they live in.
Facilitate worksheet 2.3 having
students describe the climate in
different pictures and match the
animals to the ecosystem.
Wrap-up: 1. Exit ticket question: Write at least three sentences about the day’s weather versus the local climate.
1. Quick write. 5 min
Organizational and/or Behavioral Management Strategies:
Assessment and Evaluation:
Extensions: Continue to have students collect local weather data each day. Use this data in a variety of ways: use data to
practice graphing skills, compare weather data to past weather data to evaluate changes in the climate, compare
weather data to past weather data to come to a consensus about the local climate, etc.
Adaptations:
Teacher Reflections:
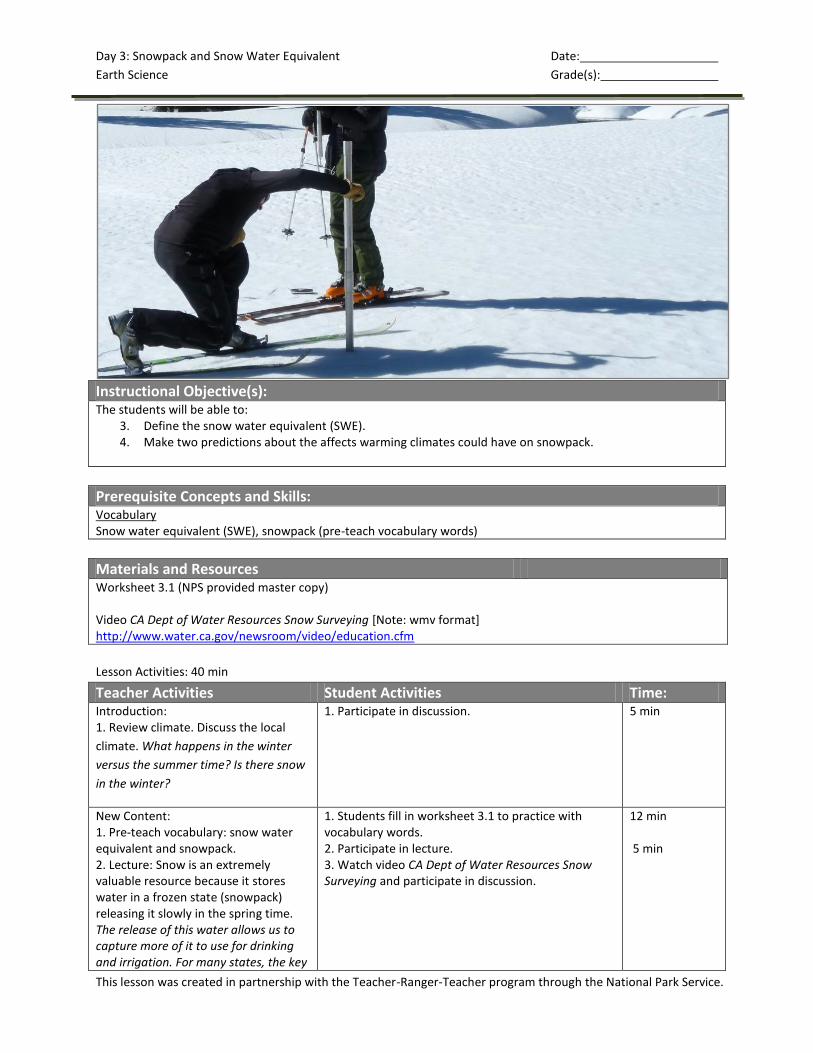
Day 3: Snowpack and Snow Water Equivalent Date:
Earth Science Grade(s):
This lesson was created in partnership with the Teacher-Ranger-Teacher program through the National Park Service.
Instructional Objective(s): The students will be able to:
3. Define the snow water equivalent (SWE). 4. Make two predictions about the affects warming climates could have on snowpack.
Prerequisite Concepts and Skills: Vocabulary Snow water equivalent (SWE), snowpack (pre-teach vocabulary words)
Materials and Resources Worksheet 3.1 (NPS provided master copy) Video CA Dept of Water Resources Snow Surveying [Note: wmv format] http://www.water.ca.gov/newsroom/video/education.cfm
Lesson Activities: 40 min
Teacher Activities Student Activities Time: Introduction: 1. Review climate. Discuss the local
climate. What happens in the winter
versus the summer time? Is there snow
in the winter?
1. Participate in discussion. 5 min
New Content: 1. Pre-teach vocabulary: snow water equivalent and snowpack. 2. Lecture: Snow is an extremely valuable resource because it stores water in a frozen state (snowpack) releasing it slowly in the spring time. The release of this water allows us to capture more of it to use for drinking and irrigation. For many states, the key
1. Students fill in worksheet 3.1 to practice with vocabulary words. 2. Participate in lecture. 3. Watch video CA Dept of Water Resources Snow Surveying and participate in discussion.
12 min 5 min
Day 3: Snowpack and Snow Water Equivalent Date:
Earth Science Grade(s):
This lesson was created in partnership with the Teacher-Ranger-Teacher program through the National Park Service.
water reservoir is snowpack. The important thing to study with snowpack is the water content. Sometimes snow that falls can have very little water (light fluffy snow) and other times it can have a high water content (heavy thick snow). It is important to scientists to measure the amount of water in snow (snow water equivalent) because that’s how we know how much water will be released in the springtime. If the snow water equivalent and snowpack is low, cities may have to enforce stricter water conservation regulations for that year. How do scientists measure snow water equivalent? 3. Display CA Dept of Water Resources Snow Survey video and discuss what students learned from the video.
Wrap-up: 1. How can climate change influence snowpack? If more precipitation falls as rain instead of snow, what will happen to animals like the weasel that go through a morphological change in the winter to have a white coat instead of brown? Show students example summer and winter pelts of weasel. 2. Exit ticket question: What is snow
water equivalent? How can climate
change affect snowpack?
1. Participate in discussion. 2. Quick write.
5 min 5 min
Organizational and/or Behavioral Management Strategies:
Assessment and Evaluation:
Extensions:
Adaptations:
Teacher Reflections:
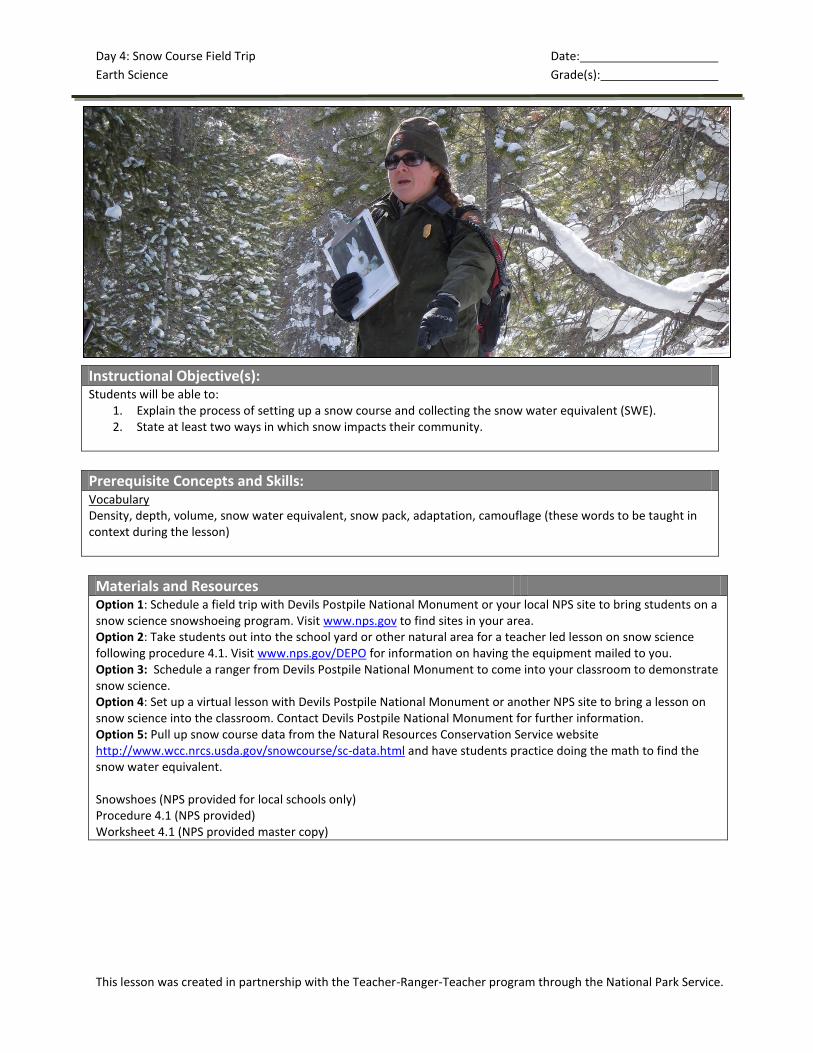
Day 4: Snow Course Field Trip Date:
Earth Science Grade(s):
This lesson was created in partnership with the Teacher-Ranger-Teacher program through the National Park Service.
Instructional Objective(s): Students will be able to:
1. Explain the process of setting up a snow course and collecting the snow water equivalent (SWE). 2. State at least two ways in which snow impacts their community.
Prerequisite Concepts and Skills: Vocabulary Density, depth, volume, snow water equivalent, snow pack, adaptation, camouflage (these words to be taught in context during the lesson)
Materials and Resources Option 1: Schedule a field trip with Devils Postpile National Monument or your local NPS site to bring students on a snow science snowshoeing program. Visit www.nps.gov to find sites in your area. Option 2: Take students out into the school yard or other natural area for a teacher led lesson on snow science following procedure 4.1. Visit www.nps.gov/DEPO for information on having the equipment mailed to you. Option 3: Schedule a ranger from Devils Postpile National Monument to come into your classroom to demonstrate snow science. Option 4: Set up a virtual lesson with Devils Postpile National Monument or another NPS site to bring a lesson on snow science into the classroom. Contact Devils Postpile National Monument for further information. Option 5: Pull up snow course data from the Natural Resources Conservation Service website http://www.wcc.nrcs.usda.gov/snowcourse/sc-data.html and have students practice doing the math to find the snow water equivalent. Snowshoes (NPS provided for local schools only) Procedure 4.1 (NPS provided) Worksheet 4.1 (NPS provided master copy)
Day 4: Snow Course Field Trip Date:
Earth Science Grade(s):
This lesson was created in partnership with the Teacher-Ranger-Teacher program through the National Park Service.
Materials and Resources:
Option 2: Lesson Activities: 40 min
Teacher Activities Student Activities Time: Introduction: 1. Review: In order for scientists and communities to make recommendations about how to help the environment, they must do the research and collect data. Today the students are going to be scientists helping to collect snow water equivalent data. The data that they collect will go to their local NPS site to provide additional information on the current state of the snowpack.
1. Listen. 3 min
New Content: 1. Using snowshoes or winter boots, take students out into an open area with a lot of snow. Use procedure 4.1. 2. Set up a snow pit following
procedure on 4.1 to collect the data
and perform the calculations on
worksheet 4.1. Assist students with
collecting the data and doing the
calculations.
3. Brainstorm reasons why snow is so
important to animals and humans.
1. Observe and participate. 2. Collect data.
3. Participate & record ideas.
10 min 20 min *Allow additional time, if available 2 min
Wrap-Up: 1. Exit ticket question: Describe at least two reasons why snow is important to your town and two reasons why it’s important to the region/state.
1. Quick write. 5 min
Organizational and/or Behavioral Management Strategies:
Assessment and Evaluation:
Extensions:
Adaptations:
Teacher Reflections:
Day 5: Watershed Date:
Earth Science Grade(s):
This lesson was created in partnership with the Teacher-Ranger-Teacher program through the National Park Service.
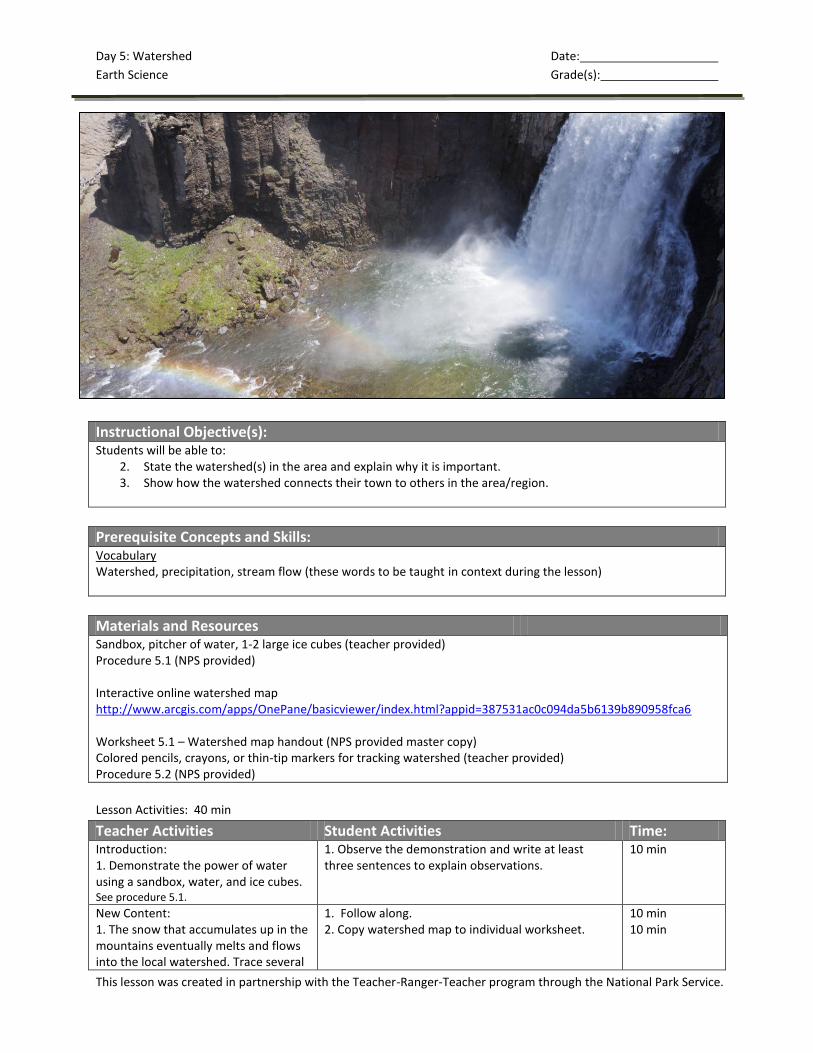
Instructional Objective(s): Students will be able to:
2. State the watershed(s) in the area and explain why it is important. 3. Show how the watershed connects their town to others in the area/region.
Prerequisite Concepts and Skills: Vocabulary Watershed, precipitation, stream flow (these words to be taught in context during the lesson)
Materials and Resources Sandbox, pitcher of water, 1-2 large ice cubes (teacher provided) Procedure 5.1 (NPS provided) Interactive online watershed map http://www.arcgis.com/apps/OnePane/basicviewer/index.html?appid=387531ac0c094da5b6139b890958fca6 Worksheet 5.1 – Watershed map handout (NPS provided master copy) Colored pencils, crayons, or thin-tip markers for tracking watershed (teacher provided) Procedure 5.2 (NPS provided)
Lesson Activities: 40 min
Teacher Activities Student Activities Time: Introduction: 1. Demonstrate the power of water using a sandbox, water, and ice cubes. See procedure 5.1.
1. Observe the demonstration and write at least three sentences to explain observations.
10 min
New Content: 1. The snow that accumulates up in the mountains eventually melts and flows into the local watershed. Trace several
1. Follow along. 2. Copy watershed map to individual worksheet.
10 min 10 min
Day 5: Watershed Date:
Earth Science Grade(s):
This lesson was created in partnership with the Teacher-Ranger-Teacher program through the National Park Service.
local watersheds on interactive online map to show students where water ends up (see materials and resources section for the link). What would happen if the precipitation that normally falls as snow was rain instead? Snow is a natural water reservoir. As long as temperatures remain cold, the snow will stay and release slowly over time. The slow release does more for the steam flow and than a large runoff event happening all at once. 2. Trace watershed from Thousand
Island Lake and Owens River using
worksheet 5.1. Have students follow
along marking on their own maps. See
procedure 5.2 for a model of how
students should mark the maps.
Wrap-up: 1. Exit ticket question: Describe the ways in which snow can impact the watershed.
1. Quick write.
5 min
Organizational and/or Behavioral Management Strategies:
Assessment and Evaluation:
Extensions:
Adaptations:
Teacher Reflections:
Day 6: Stream Flow Tools and Data Date:
Earth Science Grade(s):
This lesson was created in partnership with the Teacher-Ranger-Teacher program through the National Park Service.
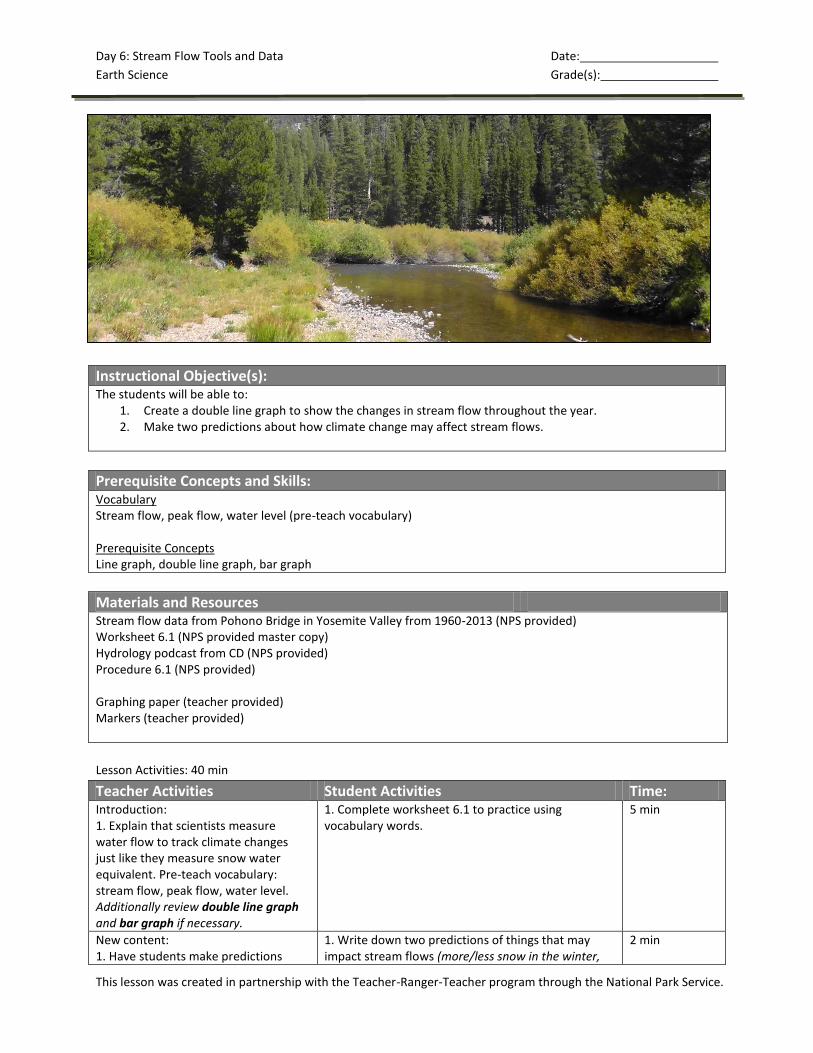
Instructional Objective(s): The students will be able to:
1. Create a double line graph to show the changes in stream flow throughout the year. 2. Make two predictions about how climate change may affect stream flows.
Prerequisite Concepts and Skills: Vocabulary Stream flow, peak flow, water level (pre-teach vocabulary) Prerequisite Concepts Line graph, double line graph, bar graph
Materials and Resources Stream flow data from Pohono Bridge in Yosemite Valley from 1960-2013 (NPS provided) Worksheet 6.1 (NPS provided master copy) Hydrology podcast from CD (NPS provided) Procedure 6.1 (NPS provided) Graphing paper (teacher provided) Markers (teacher provided)
Lesson Activities: 40 min
Teacher Activities Student Activities Time: Introduction: 1. Explain that scientists measure water flow to track climate changes just like they measure snow water equivalent. Pre-teach vocabulary: stream flow, peak flow, water level. Additionally review double line graph and bar graph if necessary.
1. Complete worksheet 6.1 to practice using vocabulary words.
5 min
New content: 1. Have students make predictions
1. Write down two predictions of things that may impact stream flows (more/less snow in the winter,
2 min
Day 6: Stream Flow Tools and Data Date:
Earth Science Grade(s):
This lesson was created in partnership with the Teacher-Ranger-Teacher program through the National Park Service.
about what impacts stream flow. 2. Show hydrology podcast from CD so students can observe how scientists measure stream flow. 3. Explain to students that they will be graphing the stream flow from Pohono Bridge in Yosemite Valley. Model creating a double line graph using data from 2009 & 2010 (see procedure 6.1). Then, facilitate a discussion of the graph. When is peak flow? How are water levels different for 2009 & 2010? Why is the most water released in May and June? 4. Have students create a double line graph using data from 2011 & 2012, then record two things they notice about their graphs in relation to stream flow (on sticky notes or on the graph itself). Share observations. 5. Talk about how stream flow can give us information about climate change. Measuring stream flow can give scientists a good idea of how much the snowpack is melting on a specific day or month. Due to climate change the peak stream flow could begin to occur sooner in the year. This could have the potential to throw many natural systems off and could negatively impact the water availability for human use. 6. Tell students that scientists began measuring stream flows from this stream in 1960. Ask: how do you think stream flow has changed over time? If necessary direct student thinking…peak stream flow might occur earlier because snow melts earlier due to warmer temperatures, etc. 7. Show students the graph of decade averages from 1960 – 2010 (procedure 6.1). Talk about what the graph shows. Emphasize the importance of continuing to record information so scientists can see changes over time.
more/less rain in the summer, the speed of snowmelt, etc.) 2. Students review vocabulary with worksheet 6.1. 3. Students create a double line graph along with teacher on a blank piece of paper or in notes. Students circle and label the peak flow for both 2009 & 2010. Participate in a discussion about other questions or do a quick write about one of the questions. 4. Students work independently or in pairs to complete their own double line graph. Record two observations about the graph when finished. 5. Listen. 6. Record predictions about how stream flow has changed over time. Share thoughts. 7. Record and share observations about bar graph.
3 min 8 min 12 min 2 min 2 min 8 min
Wrap-up: 1. Exit ticket question: Why is monitoring stream flow important? Think about what stream flow might tell us about peak flows, water levels, climate change, etc.
1. Quick write. 3 min
Day 6: Stream Flow Tools and Data Date:
Earth Science Grade(s):
This lesson was created in partnership with the Teacher-Ranger-Teacher program through the National Park Service.
Organizational and/or Behavioral Management Strategies:
Assessment and Evaluation:
Extensions:
Adaptations:
Teacher Reflections:
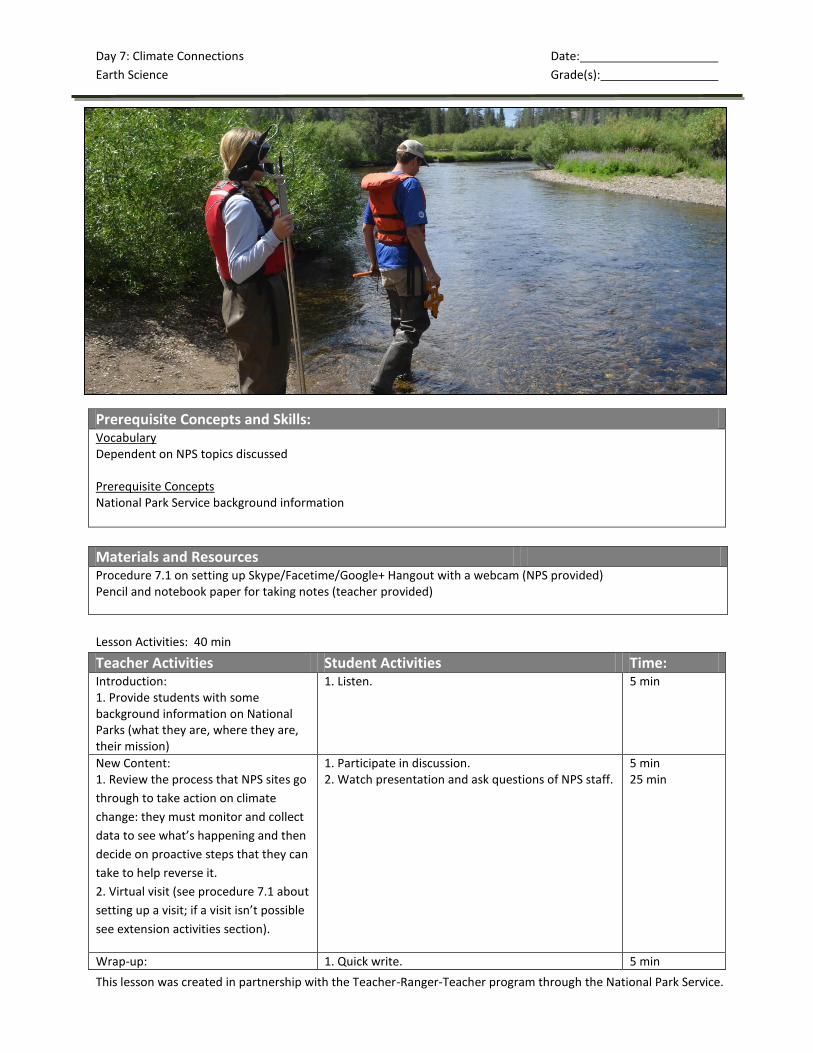
Day 7: Climate Connections Date:
Earth Science Grade(s):
This lesson was created in partnership with the Teacher-Ranger-Teacher program through the National Park Service.
Instructional Objective(s):
Prerequisite Concepts and Skills: Vocabulary Dependent on NPS topics discussed Prerequisite Concepts National Park Service background information
Materials and Resources Procedure 7.1 on setting up Skype/Facetime/Google+ Hangout with a webcam (NPS provided) Pencil and notebook paper for taking notes (teacher provided)
Lesson Activities: 40 min
Teacher Activities Student Activities Time: Introduction: 1. Provide students with some background information on National Parks (what they are, where they are, their mission)
1. Listen. 5 min
New Content: 1. Review the process that NPS sites go
through to take action on climate
change: they must monitor and collect
data to see what’s happening and then
decide on proactive steps that they can
take to help reverse it.
2. Virtual visit (see procedure 7.1 about
setting up a visit; if a visit isn’t possible
see extension activities section).
1. Participate in discussion. 2. Watch presentation and ask questions of NPS staff.
5 min 25 min
Wrap-up: 1. Quick write. 5 min
Day 7: Climate Connections Date:
Earth Science Grade(s):
This lesson was created in partnership with the Teacher-Ranger-Teacher program through the National Park Service.
1. Exit ticket question: Write at least three sentences about how National Parks are studying climate change.
Organizational and/or Behavioral Management Strategies:
Assessment and Evaluation:
Extensions: If you aren’t able to schedule a virtual field trip, play students an NPS podcast or video on climate change instead.
Watch a presentation from a National Park to show students how NPS sites are studying climate change:
Podcast- Devil’s Postpile National Monument: Cold Air Pooling
http://www.nps.gov/depo/photosmultimedia/videos.htm
Video- Rocky Mountain National Park: Pika research
http://news.nationalgeographic.com/news/2009/09/090904-pika-in-peril-missions-video-wc.html
Video – Great Smokey Mountains National Park: Phenology and Citizen Science
http://nature.nps.gov/multimedia/CCRP_Phenology1/index.cfm
Adaptations:
Teacher Reflections:
Day 8: Research Projects Date:
Earth Science Grade(s):
This lesson was created in partnership with the Teacher-Ranger-Teacher program through the National Park Service.
Instructional Objective(s): Students will be able to:
1. Create a hypothetical research proposal that examines the potential impacts of climate change on the local community.
Prerequisite Concepts and Skills: Apply knowledge learned throughout the two-week unit plan.
Materials and Resources Fake money (NPS provided template) Worksheet 8.1 - Copy of rubric for each student (NPS provided master copy) Worksheet 8.2 – Copy of the model grant proposal (NPS provided master copy) Worksheet 8.3 – Copy of the grant proposal worksheet or lined paper if preferred (NPS provided master copy) Procedure 8.1 – Website list to share with students who need to complete additional research (NPS provided)
Lesson Activities: 45 min *Depending on how deeply you would like to explore the activities of the lesson, this
lesson could take anywhere between one and three 40 minute lessons. For example on day one, you could explain
the project and students could begin work. On day two, students could continue preparing their work and then
begin working on their presentations, and on day three students could finish their presentations and share with the
class. Conversely, you could do a quick introduction, give students 30 minutes to prepare their grant proposals and
then have a quick whip around, share-out, thereby concluding the lesson in a day. The times below are based on
one 45 minute lesson.
Teacher Activities Student Activities Time: Introduction: 1. Explain to students that they will be thinking like a climate scientist today and using what they have learned the past two weeks to create their own climate monitoring project. Explain that in the real world it costs money to conduct research. To get money, scientists apply for grants. Grants are
1. Listen. 2 minutes
Day 8: Research Projects Date:
Earth Science Grade(s):
This lesson was created in partnership with the Teacher-Ranger-Teacher program through the National Park Service.
free money that organizations give to scientists to study and protect the planet. Place fake money on table. There is only enough grant money for two groups to do their project. The two best grant proposals will be awarded the funding and will be able to make a difference in the world.
New Content: 1. Pass out worksheets 8.1, 8.2, and 8.3. Read through the papers explaining sections if necessary. Be sure to discuss rubric. Explain that grant proposals will be scored using the rubric. Have students score worksheet 8.2 (the model) and discuss the scores given. 2. Ask: what could you research? Brainstorm research ideas as a class. 3. Student work time (Students can work in groups, pairs, or individually according to teacher preference). It may be helpful to have computer time available in case students need more background knowledge about a topic. See procedure 6.1 for website ideas.
1.) Read through the worksheets. Discuss and listen. Use rubric to score worksheet 8.2. 2.) Participate in brainstorm of research ideas. 3.) Students work on grant proposals (worksheet 6.3) and conduct research. Time permitting, they should self-score their final project before turning it in.
5 min 3 min 30 min
Wrap Up: 1. Have students share their ideas. Depending on time, some options include: -Doing a quick discussion -Putting proposals on tables and doing a gallery walk of proposals -Student presentations to the class -Creating a poster for a mini science fair, etc.
1. Students not presenting should listen. You could have students vote on the grant proposal that they think should receive the grant funding.
5 min
Organizational and/or Behavioral Management Strategies:
Assessment and Evaluation:
Extensions:
Adaptations:
Day 8: Research Projects Date:
Earth Science Grade(s):
This lesson was created in partnership with the Teacher-Ranger-Teacher program through the National Park Service.
Teacher Reflections:
This lesson was created in partnership with the Teacher-Ranger-Teacher program through the National Park Service.
TEACHER RESOURCES
Earth Science Name___________________ Date_____________ Pre-Assessment
This lesson was created in partnership with the Teacher-Ranger-Teacher program through the National Park Service.
PRE/POST SITE EVALUATION
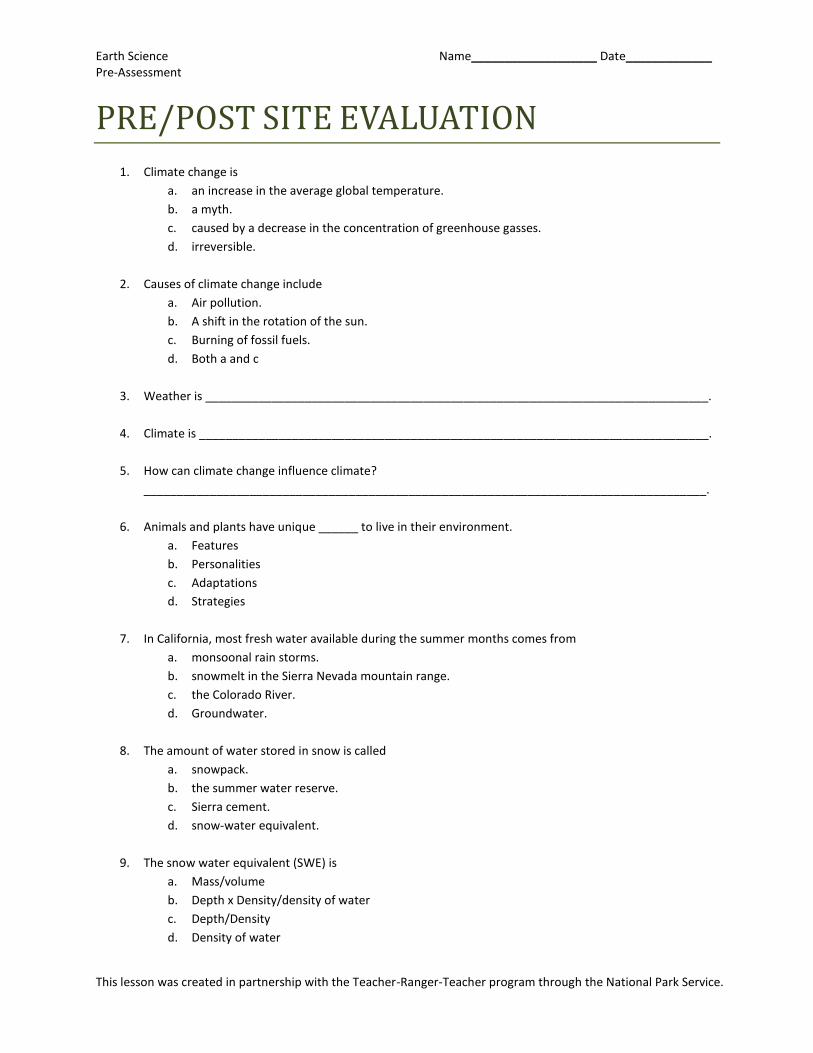
1. Climate change is
a. an increase in the average global temperature.
b. a myth.
c. caused by a decrease in the concentration of greenhouse gasses.
d. irreversible.
2. Causes of climate change include
a. Air pollution.
b. A shift in the rotation of the sun.
c. Burning of fossil fuels.
d. Both a and c
3. Weather is ____________________________________________________________________________.
4. Climate is _____________________________________________________________________________.
5. How can climate change influence climate?
_____________________________________________________________________________________.
6. Animals and plants have unique ______ to live in their environment.
a. Features
b. Personalities
c. Adaptations
d. Strategies
7. In California, most fresh water available during the summer months comes from
a. monsoonal rain storms.
b. snowmelt in the Sierra Nevada mountain range.
c. the Colorado River.
d. Groundwater.
8. The amount of water stored in snow is called
a. snowpack.
b. the summer water reserve.
c. Sierra cement.
d. snow-water equivalent.
9. The snow water equivalent (SWE) is
a. Mass/volume
b. Depth x Density/density of water
c. Depth/Density
d. Density of water
Earth Science Name___________________ Date_____________ Pre-Assessment
This lesson was created in partnership with the Teacher-Ranger-Teacher program through the National Park Service.
10. Stream flow measures
a. the volume of water that passes a given point in one second.
b. how many species of fish can be found in a given area of a stream.
c. the amount of trash that flows into the watershed.
d. how fast water is moving at a given point in a stream.
11. What is peak flow and how is it measured?
______________________________________________________________________________________
_____________________________________________________________________________________.
12. Snow that falls at Thousand Island Lake will flow into the
a. Owens Watershed.
b. Merced Watershed.
c. San Joaquin Watershed.
d. LA aqueduct.
13. One possible effect of climate change on animals is
a. Loss of habitat
b. An increase in food
c. Extended lifespan
d. Easier migration.
14. National Parks belong to
a. Everyone
b. Park rangers
c. The government
d. No one
15. Why is it important for scientists who study climate change to collect data?
______________________________________________________________________________________
_____________________________________________________________________________________.
Earth Science Name___________________ Date_____________ Worksheet 1.1—Introduction to Climate Change
This lesson was created in partnership with the Teacher-Ranger-Teacher program through the National Park Service.
Climate Change Note-Taking Guide
As you read your article record any important facts in the appropriate section. You will share the most important
facts that you have learned with the class and record additional notes from your classmates presentations.
List some causes of global warming. Be specific!
1. ______________________________________________________________________________
2. ______________________________________________________________________________
3. ______________________________________________________________________________
4. ______________________________________________________________________________
5. ______________________________________________________________________________
What are some effects or consequences of global warming?
1. ______________________________________________________________________________
2. ______________________________________________________________________________
3. ______________________________________________________________________________
4. ______________________________________________________________________________
5. ______________________________________________________________________________
What are some actions that have been proposed to address global warming?
1. ______________________________________________________________________________
2. ______________________________________________________________________________
3. ______________________________________________________________________________
4. ______________________________________________________________________________
5. ______________________________________________________________________________
What specifically do you plan to share with the class?
Earth Science Name____________________ Date_________ Worksheet 2.1–Weather and Climate
This lesson was created in partnership with the Teacher-Ranger-Teacher program through the National Park Service.
Weather Climate
Weather
and climate
Earth Science Name Date Worksheet 2.2–Weather and Climate
This lesson was created in partnership with the Teacher-Ranger-Teacher program through the National Park Service.
Date:_________
Air Temperature Wind Speed
Earth Science Name Date
Worksheet 2.1 – Weather and Climate
Date:_________
Air Temperature Wind Speed
Earth Science Name Date
Worksheet 2.1 – Weather and Climate
Date:_________
Air Temperature Wind Speed
F
MPH
F
MPH
F
MPH
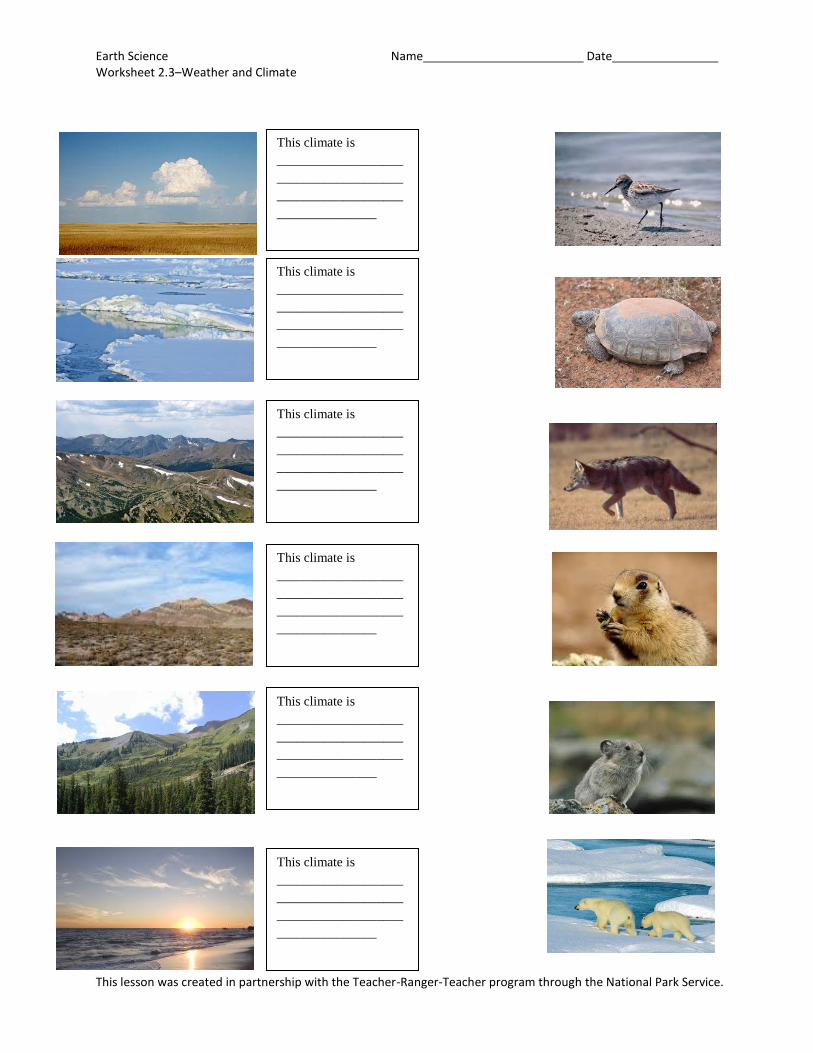
Earth Science Name Date Worksheet 2.3–Weather and Climate
This lesson was created in partnership with the Teacher-Ranger-Teacher program through the National Park Service.
This climate is
___________________
___________________
___________________
_______________
This climate is
___________________
___________________
___________________
_______________
This climate is
___________________
___________________
___________________
_______________
This climate is
___________________
___________________
___________________
_______________
This climate is
___________________
___________________
___________________
_______________
This climate is
___________________
___________________
___________________
_______________
This lesson was created in partnership with the Teacher-Ranger-Teacher program through the National Park Service.
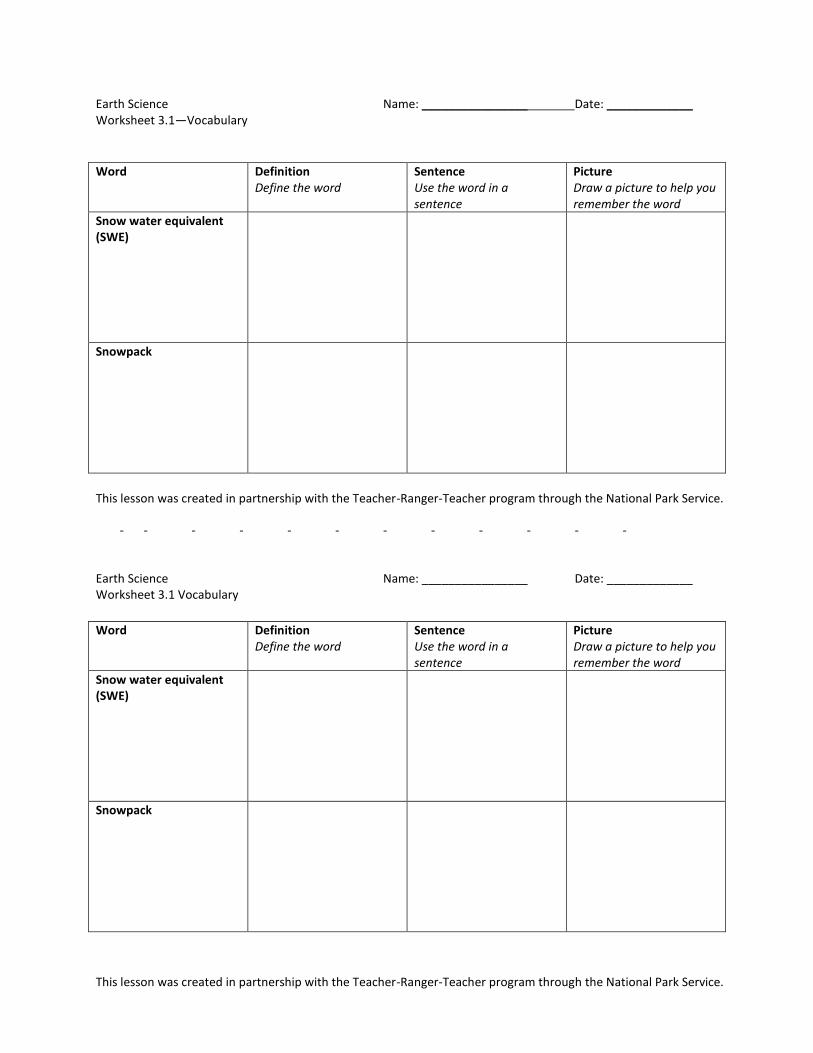
Earth Science Name: ________________ Date: _____________ Worksheet 3.1—Vocabulary
Word Definition Define the word
Sentence Use the word in a sentence
Picture Draw a picture to help you remember the word
Snow water equivalent (SWE)
Snowpack
This lesson was created in partnership with the Teacher-Ranger-Teacher program through the National Park Service.
- - - - - - - - - - - -
Earth Science Name: ________________ Date: _____________ Worksheet 3.1 Vocabulary
Word Definition Define the word
Sentence Use the word in a sentence
Picture Draw a picture to help you remember the word
Snow water equivalent (SWE)
Snowpack
Earth Science Procedure 4.1—Snow Pit
This lesson was created in partnership with the Teacher-Ranger-Teacher program through the National Park Service.
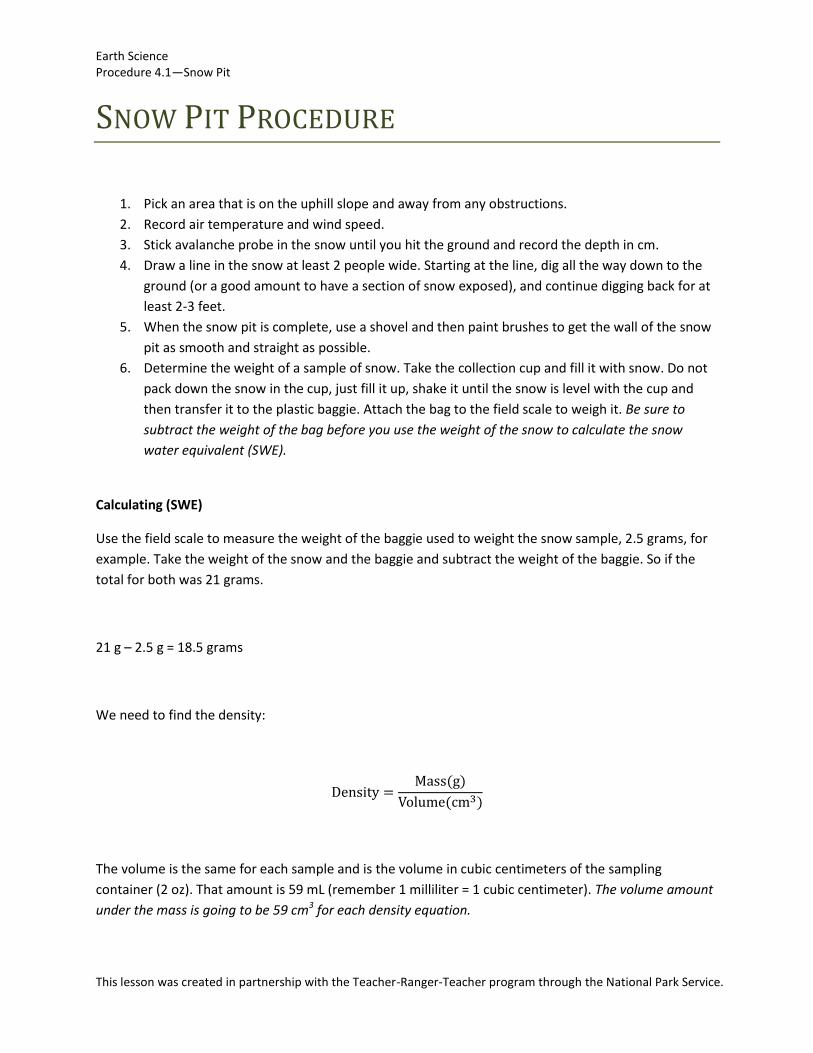
SNOW PIT PROCEDURE
1. Pick an area that is on the uphill slope and away from any obstructions.
2. Record air temperature and wind speed.
3. Stick avalanche probe in the snow until you hit the ground and record the depth in cm.
4. Draw a line in the snow at least 2 people wide. Starting at the line, dig all the way down to the
ground (or a good amount to have a section of snow exposed), and continue digging back for at
least 2-3 feet.
5. When the snow pit is complete, use a shovel and then paint brushes to get the wall of the snow
pit as smooth and straight as possible.
6. Determine the weight of a sample of snow. Take the collection cup and fill it with snow. Do not
pack down the snow in the cup, just fill it up, shake it until the snow is level with the cup and
then transfer it to the plastic baggie. Attach the bag to the field scale to weigh it. Be sure to
subtract the weight of the bag before you use the weight of the snow to calculate the snow
water equivalent (SWE).
Calculating (SWE)
Use the field scale to measure the weight of the baggie used to weight the snow sample, 2.5 grams, for
example. Take the weight of the snow and the baggie and subtract the weight of the baggie. So if the
total for both was 21 grams.
21 g – 2.5 g = 18.5 grams
We need to find the density:
The volume is the same for each sample and is the volume in cubic centimeters of the sampling
container (2 oz). That amount is 59 mL (remember 1 milliliter = 1 cubic centimeter). The volume amount
under the mass is going to be 59 cm3 for each density equation.
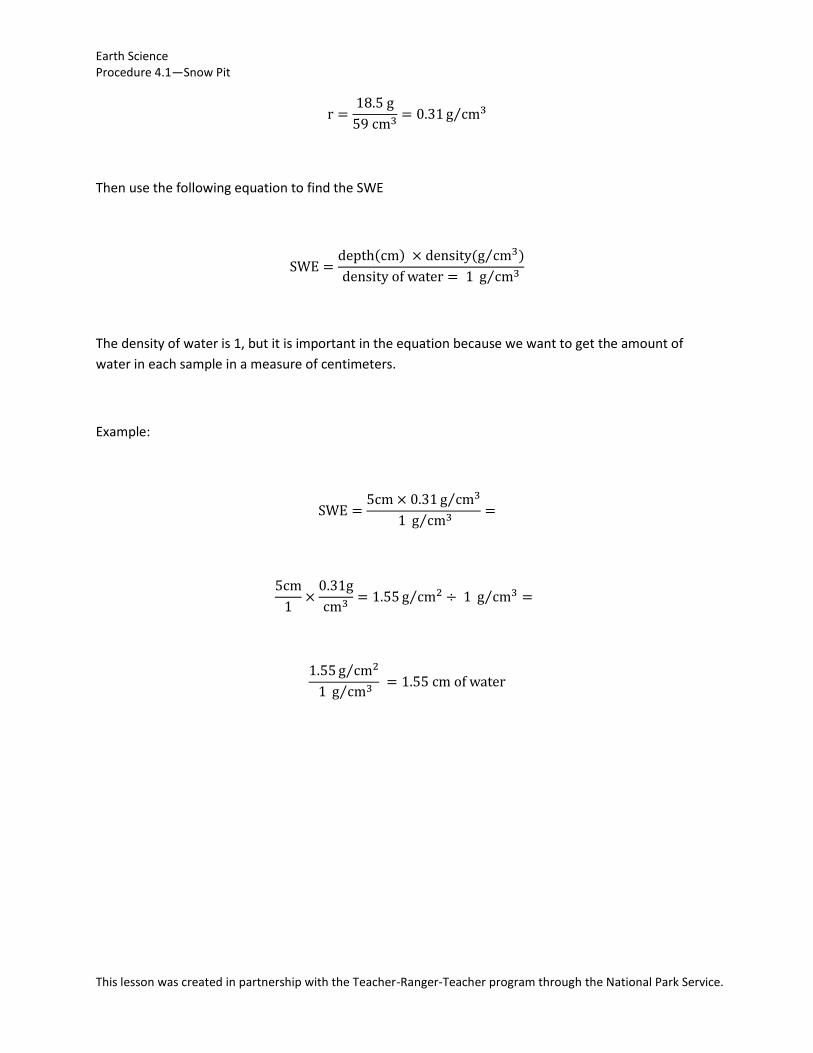
Earth Science Procedure 4.1—Snow Pit
This lesson was created in partnership with the Teacher-Ranger-Teacher program through the National Park Service.
Then use the following equation to find the SWE
The density of water is 1, but it is important in the equation because we want to get the amount of
water in each sample in a measure of centimeters.
Example:
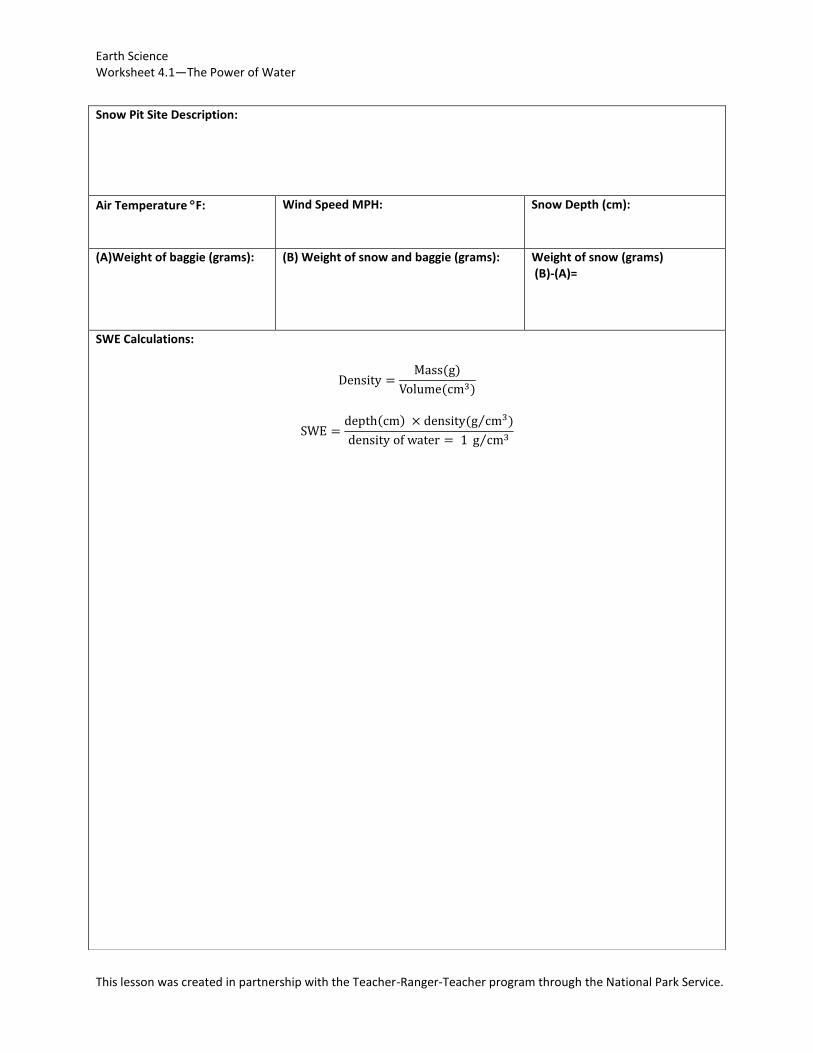
Earth Science Worksheet 4.1—The Power of Water
This lesson was created in partnership with the Teacher-Ranger-Teacher program through the National Park Service.
Snow Pit Site Description:
Air Temperature F:
Wind Speed MPH: Snow Depth (cm):
(A)Weight of baggie (grams): (B) Weight of snow and baggie (grams):
Weight of snow (grams) (B)-(A)=
SWE Calculations:
Earth Science Procedure 5.1—The Power of Water
This lesson was created in partnership with the Teacher-Ranger-Teacher program through the National Park Service.
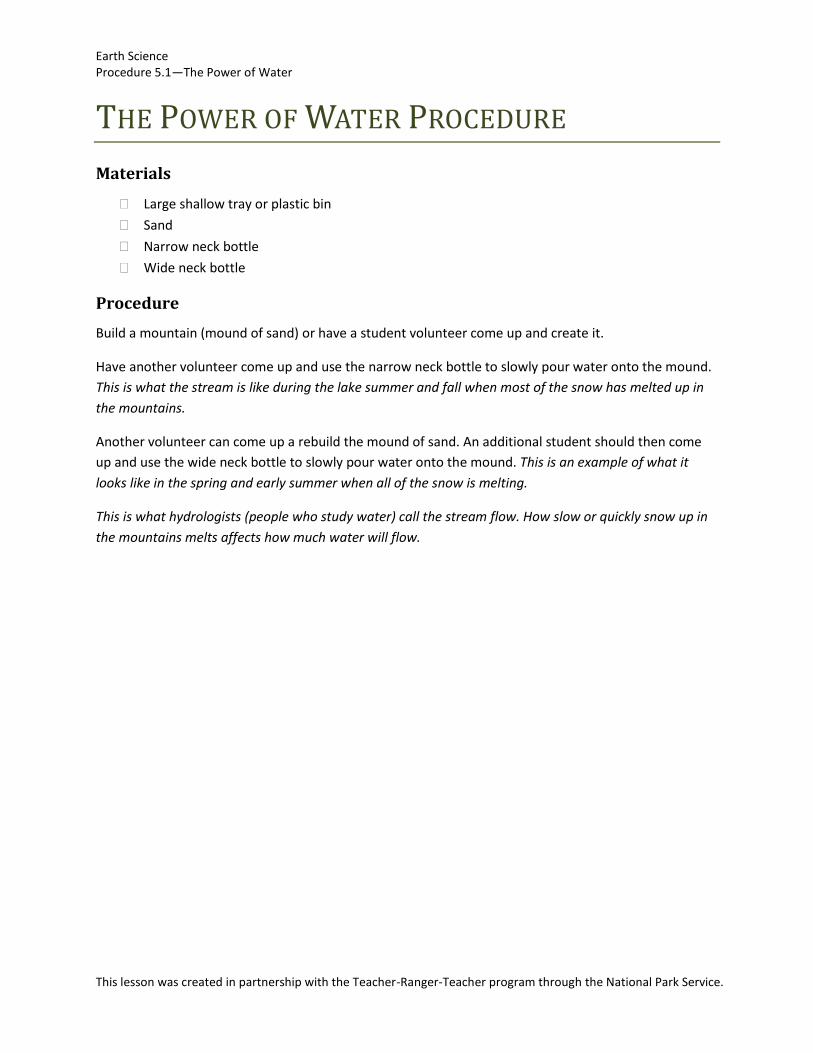
THE POWER OF WATER PROCEDURE
Materials
Large shallow tray or plastic bin
Sand
Narrow neck bottle
Wide neck bottle
Procedure
Build a mountain (mound of sand) or have a student volunteer come up and create it.
Have another volunteer come up and use the narrow neck bottle to slowly pour water onto the mound.
This is what the stream is like during the lake summer and fall when most of the snow has melted up in
the mountains.
Another volunteer can come up a rebuild the mound of sand. An additional student should then come
up and use the wide neck bottle to slowly pour water onto the mound. This is an example of what it
looks like in the spring and early summer when all of the snow is melting.
This is what hydrologists (people who study water) call the stream flow. How slow or quickly snow up in
the mountains melts affects how much water will flow.
Earth Science Procedure 5.2—Watershed Activity
This lesson was created in partnership with the Teacher-Ranger-Teacher program through the National Park Service.
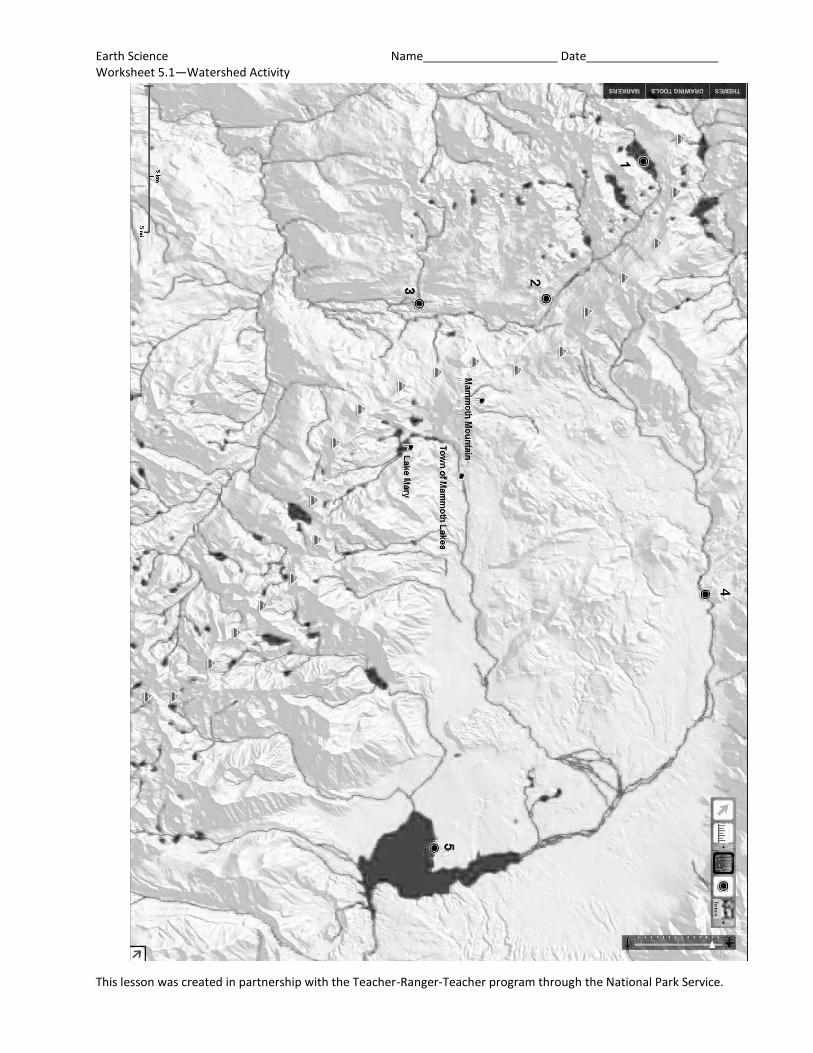
WATERSHED ACTIVITY PROCEDURE
Background Information The areas in and around Mammoth Lakes have a unique hydrologic story. Due to the topography of the
Eastern Sierra Mountains, water either ends up traveling west towards the San Francisco Bay or east to
Los Angeles. The hydrologic divide, which can be seen at the Minaret Vista, is the imaginary line that
separates the two flows. Water that falls in the town of Mammoth Lakes goes east while water that falls
in Devils Postpile National Monument heads west.
The middle fork of the San Joaquin River (SJR) starts at Thousand Island Lake and continues south where
it passes through Devils Postpile National Monument. Later the middle fork converges with the north
and south forks continuing roughly northwest to the Central Valley. Most of the surface water in the
upper (SJR) is stored and diverted at Millerton Lakes’ Friant Dam, near Fresno. From Friant Dam, water is
pumped north through the Madera Canal and south through the Friant-Kern canal to irrigation districts
and other water retailers, which then delivers the water to end users in the southern portion of the
watershed. Water flowing in the (SJR) rarely ends up all the way to the San Francisco Bay because there
is such a need in the Central Valley, specifically for crop irrigation. The 400-mile-long Central Valley
supplies fully one-quarter of the food that America eats.
Water that falls into the Owens River draining into Crowley Lake flows through Owens Valley, the arid
basin between the eastern slope of the Sierra Nevada and the Inyo and White Mountains. The Owens
Valley watershed consists of several sub-watersheds (Mono Basin, Upper Owens, Owens Gorge, Middle
Owens, Lower Owens, and Owens Lake). The river, until recently, terminated at Owens Lake due to the
diversion of the LA aqueduct to Los Angeles to help provide essential drinking water to southern
California residences. The first LA aqueduct was completed in 1913 and the second in 1970. In winter
2006, the Los Angeles Department of Water and Power restored 5% of the pre-aqueduct flow to the
river, by court order, allowing the Owens River Gorge, the river bed in the valley, and Owens Lake to
contain a small amount of water.
Both watersheds are essential not only to the residences of Mammoth Lakes or to California as a whole,
but to the entire United States because of its agricultural purpose. Both watersheds are also examples of
things that can go wrong when all or most of the water is depleted. Devastation especially to fish and
amphibian populations are two of the many side effects that can be observed from water diversion.
Wetlands provide many natural services from a rest spot for migratory birds to acting as a sponge,
cleaning river water as it flows by. Humans should strive to find a balance between meeting the needs of
the people and of the habitat so that neither one suffers.
Earth Science Procedure 5.2—Watershed Activity
This lesson was created in partnership with the Teacher-Ranger-Teacher program through the National Park Service.
Procedure
Have students follow along with you as you label all of the points. Spend some time on each one giving
them some background information. By connecting the pictures of mountains together, they create the
hydrologic divide. Have them highlight this line using a marker or highlighter.
Point Labels:
1. Thousand Island Lake
2. Devils Postpile National Monument
3. Middle Fork of the San Joaquin River
4. Owens River
5. Crowley Lake
After labeling all points and tracing the hydrologic divide, students will be able to see the two
watersheds in this area and understand where each one flows to.
Earth Science Name Date Worksheet 5.1—Watershed Activity
This lesson was created in partnership with the Teacher-Ranger-Teacher program through the National Park Service.
Earth Science Procedure 6.1—Sequoia-Kings Canyon Stream Flow Data
This lesson was created in partnership with the Teacher-Ranger-Teacher program through the National Park Service.
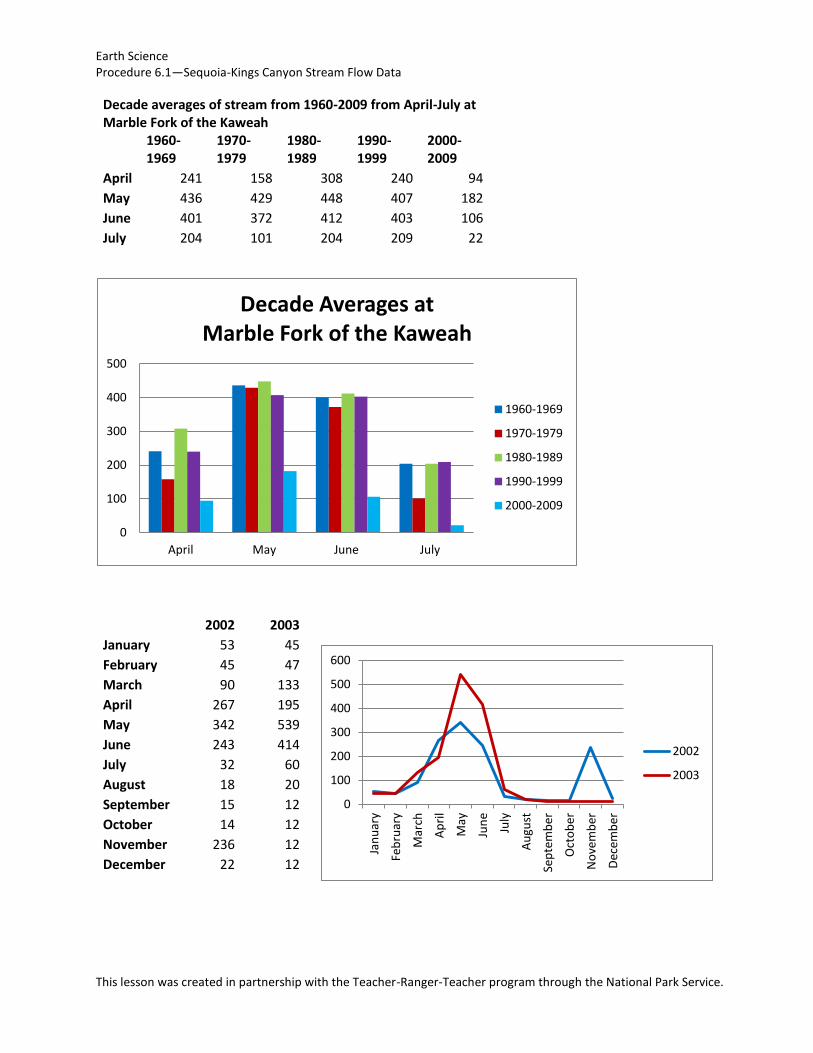
Decade averages of stream from 1960-2009 from April-July at Marble Fork of the Kaweah
1960-1969
1970-1979
1980-1989
1990-1999
2000-2009
April 241 158 308 240 94
May 436 429 448 407 182
June 401 372 412 403 106
July 204 101 204 209 22
0
100
200
300
400
500
April May June July
Decade Averages at Marble Fork of the Kaweah
1960-1969
1970-1979
1980-1989
1990-1999
2000-2009
0
100
200
300
400
500
600
Jan
uar
y
Feb
ruar
y
Mar
ch
Ap
ril
May
Jun
e
July
Au
gust
Sep
tem
ber
Oct
ob
er
No
vem
ber
Dec
emb
er
2002
2003
2002 2003
January 53 45
February 45 47
March 90 133
April 267 195
May 342 539
June 243 414
July 32 60
August 18 20
September 15 12
October 14 12
November 236 12
December 22 12
Earth Science Procedure 6.1—Sequoia-Kings Canyon Stream Flow Data
This lesson was created in partnership with the Teacher-Ranger-Teacher program through the National Park Service.
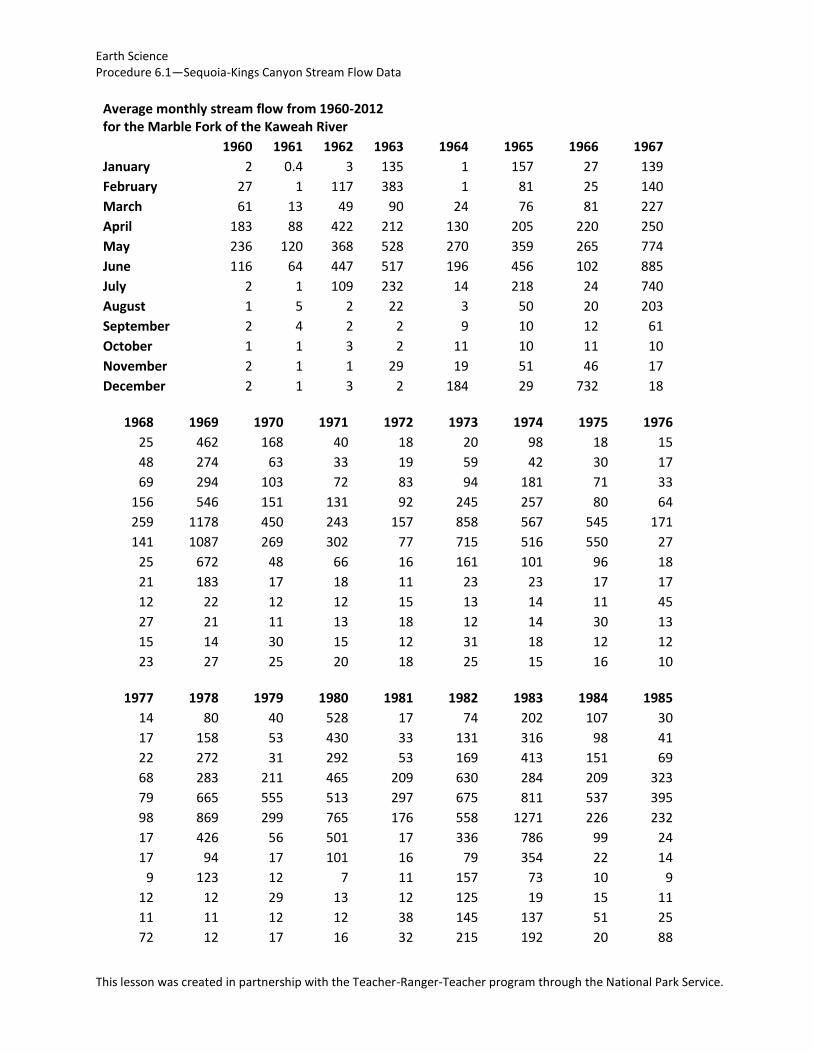
Average monthly stream flow from 1960-2012 for the Marble Fork of the Kaweah River
1960 1961 1962 1963 1964 1965 1966 1967
January 2 0.4 3 135 1 157 27 139
February 27 1 117 383 1 81 25 140
March 61 13 49 90 24 76 81 227
April 183 88 422 212 130 205 220 250
May 236 120 368 528 270 359 265 774
June 116 64 447 517 196 456 102 885
July 2 1 109 232 14 218 24 740
August 1 5 2 22 3 50 20 203
September 2 4 2 2 9 10 12 61
October 1 1 3 2 11 10 11 10
November 2 1 1 29 19 51 46 17
December 2 1 3 2 184 29 732 18
1968 1969 1970 1971 1972 1973 1974 1975 1976
25 462 168 40 18 20 98 18 15
48 274 63 33 19 59 42 30 17
69 294 103 72 83 94 181 71 33
156 546 151 131 92 245 257 80 64
259 1178 450 243 157 858 567 545 171
141 1087 269 302 77 715 516 550 27
25 672 48 66 16 161 101 96 18
21 183 17 18 11 23 23 17 17
12 22 12 12 15 13 14 11 45
27 21 11 13 18 12 14 30 13
15 14 30 15 12 31 18 12 12
23 27 25 20 18 25 15 16 10
1977 1978 1979 1980 1981 1982 1983 1984 1985
14 80 40 528 17 74 202 107 30
17 158 53 430 33 131 316 98 41
22 272 31 292 53 169 413 151 69
68 283 211 465 209 630 284 209 323
79 665 555 513 297 675 811 537 395
98 869 299 765 176 558 1271 226 232
17 426 56 501 17 336 786 99 24
17 94 17 101 16 79 354 22 14
9 123 12 7 11 157 73 10 9
12 12 29 13 12 125 19 15 11
11 11 12 12 38 145 137 51 25
72 12 17 16 32 215 192 20 88
Earth Science Procedure 6.1—Sequoia-Kings Canyon Stream Flow Data
This lesson was created in partnership with the Teacher-Ranger-Teacher program through the National Park Service.
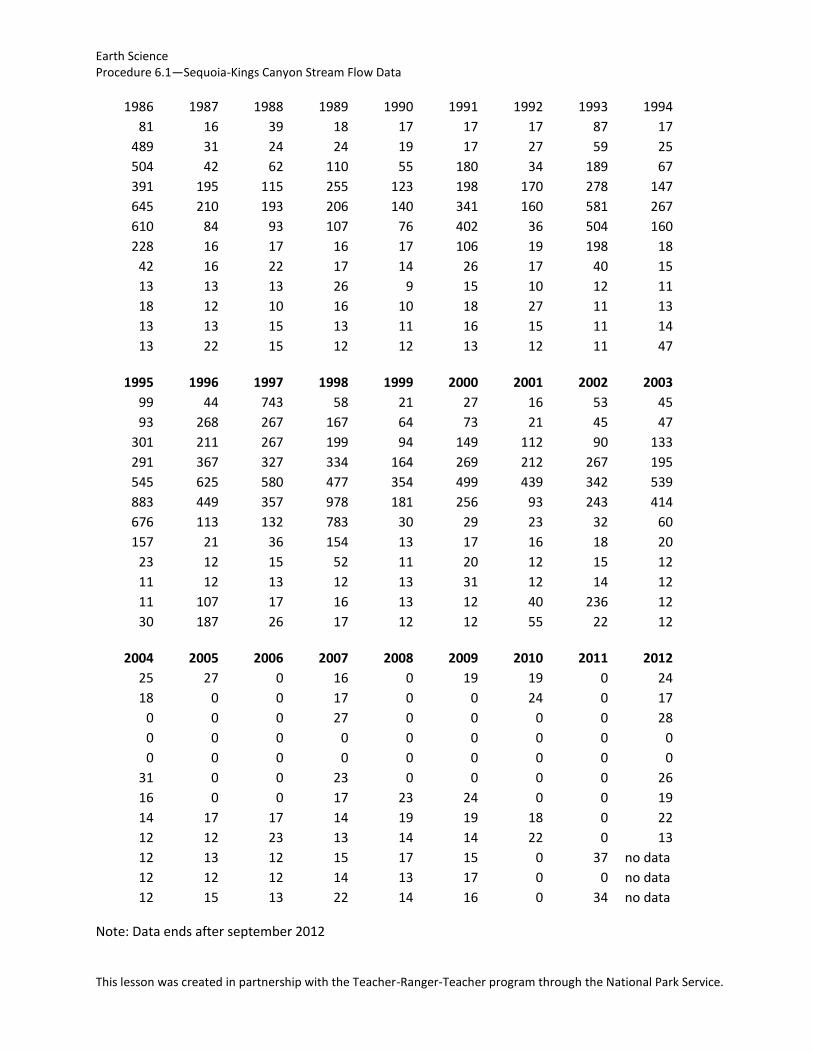
1986 1987 1988 1989 1990 1991 1992 1993 1994
81 16 39 18 17 17 17 87 17
489 31 24 24 19 17 27 59 25
504 42 62 110 55 180 34 189 67
391 195 115 255 123 198 170 278 147
645 210 193 206 140 341 160 581 267
610 84 93 107 76 402 36 504 160
228 16 17 16 17 106 19 198 18
42 16 22 17 14 26 17 40 15
13 13 13 26 9 15 10 12 11
18 12 10 16 10 18 27 11 13
13 13 15 13 11 16 15 11 14
13 22 15 12 12 13 12 11 47
1995 1996 1997 1998 1999 2000 2001 2002 2003
99 44 743 58 21 27 16 53 45
93 268 267 167 64 73 21 45 47
301 211 267 199 94 149 112 90 133
291 367 327 334 164 269 212 267 195
545 625 580 477 354 499 439 342 539
883 449 357 978 181 256 93 243 414
676 113 132 783 30 29 23 32 60
157 21 36 154 13 17 16 18 20
23 12 15 52 11 20 12 15 12
11 12 13 12 13 31 12 14 12
11 107 17 16 13 12 40 236 12
30 187 26 17 12 12 55 22 12
2004 2005 2006 2007 2008 2009 2010 2011 2012
25 27 0 16 0 19 19 0 24
18 0 0 17 0 0 24 0 17
0 0 0 27 0 0 0 0 28
0 0 0 0 0 0 0 0 0
0 0 0 0 0 0 0 0 0
31 0 0 23 0 0 0 0 26
16 0 0 17 23 24 0 0 19
14 17 17 14 19 19 18 0 22
12 12 23 13 14 14 22 0 13
12 13 12 15 17 15 0 37 no data
12 12 12 14 13 17 0 0 no data
12 15 13 22 14 16 0 34 no data
Note: Data ends after september 2012
Earth Science Procedure 6.2—Yosemite Stream Flow Data
This lesson was created in partnership with the Teacher-Ranger-Teacher program through the National Park Service.
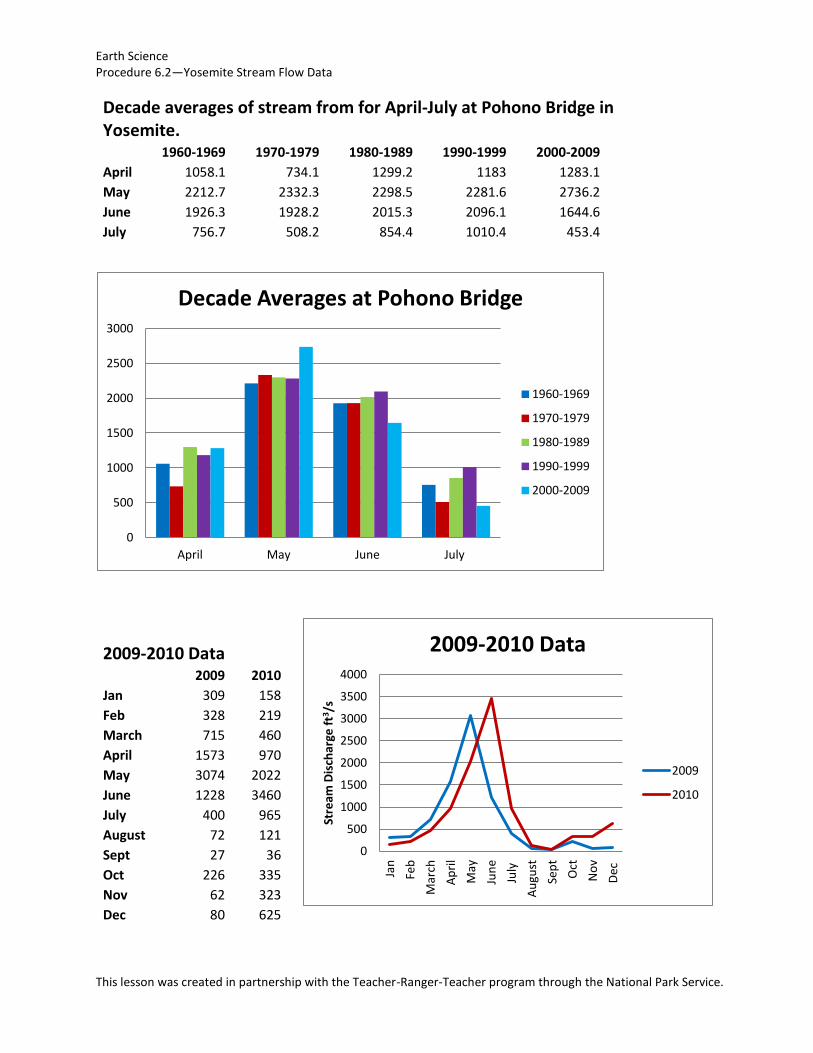
Decade averages of stream from for April-July at Pohono Bridge in Yosemite.
1960-1969 1970-1979 1980-1989 1990-1999 2000-2009
April 1058.1 734.1 1299.2 1183 1283.1 May 2212.7 2332.3 2298.5 2281.6 2736.2 June 1926.3 1928.2 2015.3 2096.1 1644.6 July 756.7 508.2 854.4 1010.4 453.4
0
500
1000
1500
2000
2500
3000
April May June July
Decade Averages at Pohono Bridge
1960-1969
1970-1979
1980-1989
1990-1999
2000-2009
0
500
1000
1500
2000
2500
3000
3500
4000
Jan
Feb
Mar
ch
Ap
ril
May
Jun
e
July
Au
gust
Sep
t
Oct
No
v
Dec
Stre
am D
isch
arge
ft3 /
s
2009-2010 Data
2009
2010
2009-2010 Data
2009 2010
Jan 309 158
Feb 328 219
March 715 460
April 1573 970
May 3074 2022
June 1228 3460
July 400 965
August 72 121
Sept 27 36
Oct 226 335
Nov 62 323
Dec 80 625
Earth Science Procedure 6.2—Yosemite Stream Flow Data
This lesson was created in partnership with the Teacher-Ranger-Teacher program through the National Park Service.
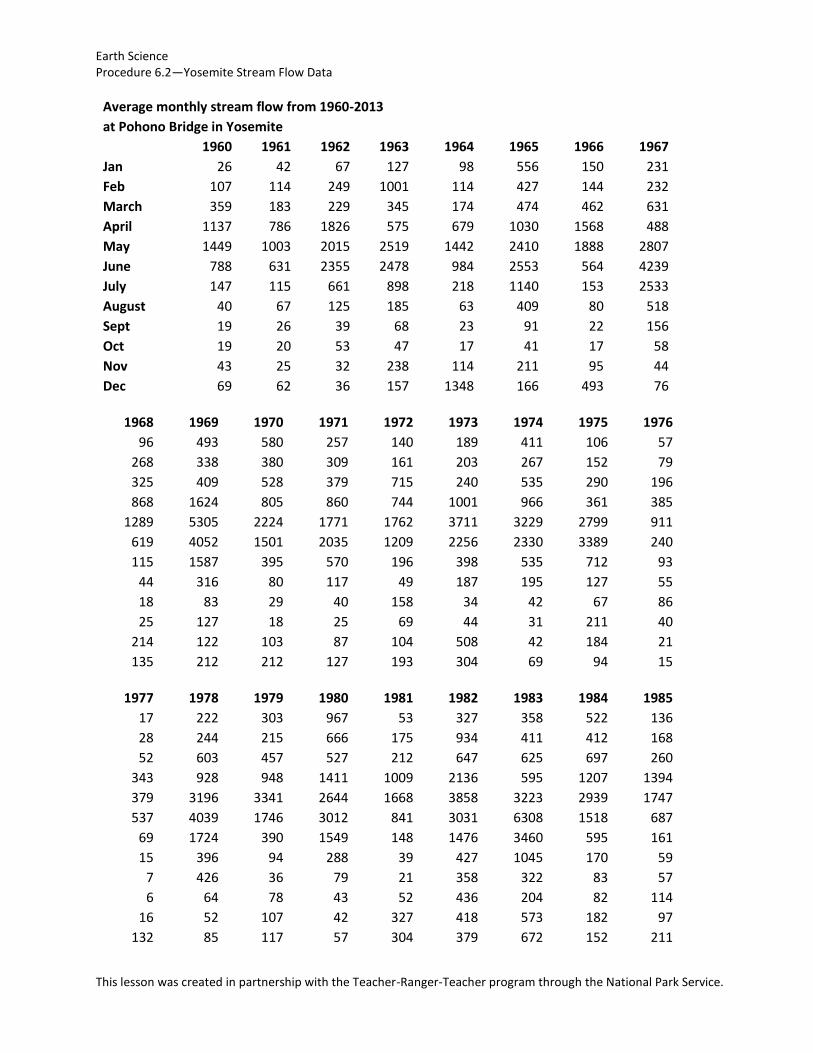
Average monthly stream flow from 1960-2013 at Pohono Bridge in Yosemite
1960 1961 1962 1963 1964 1965 1966 1967
Jan 26 42 67 127 98 556 150 231
Feb 107 114 249 1001 114 427 144 232
March 359 183 229 345 174 474 462 631
April 1137 786 1826 575 679 1030 1568 488
May 1449 1003 2015 2519 1442 2410 1888 2807
June 788 631 2355 2478 984 2553 564 4239
July 147 115 661 898 218 1140 153 2533
August 40 67 125 185 63 409 80 518
Sept 19 26 39 68 23 91 22 156
Oct 19 20 53 47 17 41 17 58
Nov 43 25 32 238 114 211 95 44
Dec 69 62 36 157 1348 166 493 76
1968 1969 1970 1971 1972 1973 1974 1975 1976
96 493 580 257 140 189 411 106 57
268 338 380 309 161 203 267 152 79
325 409 528 379 715 240 535 290 196
868 1624 805 860 744 1001 966 361 385
1289 5305 2224 1771 1762 3711 3229 2799 911
619 4052 1501 2035 1209 2256 2330 3389 240
115 1587 395 570 196 398 535 712 93
44 316 80 117 49 187 195 127 55
18 83 29 40 158 34 42 67 86
25 127 18 25 69 44 31 211 40
214 122 103 87 104 508 42 184 21
135 212 212 127 193 304 69 94 15
1977 1978 1979 1980 1981 1982 1983 1984 1985
17 222 303 967 53 327 358 522 136
28 244 215 666 175 934 411 412 168
52 603 457 527 212 647 625 697 260
343 928 948 1411 1009 2136 595 1207 1394
379 3196 3341 2644 1668 3858 3223 2939 1747
537 4039 1746 3012 841 3031 6308 1518 687
69 1724 390 1549 148 1476 3460 595 161
15 396 94 288 39 427 1045 170 59
7 426 36 79 21 358 322 83 57
6 64 78 43 52 436 204 82 114
16 52 107 42 327 418 573 182 97
132 85 117 57 304 379 672 152 211
Earth Science Procedure 6.2—Yosemite Stream Flow Data
This lesson was created in partnership with the Teacher-Ranger-Teacher program through the National Park Service.
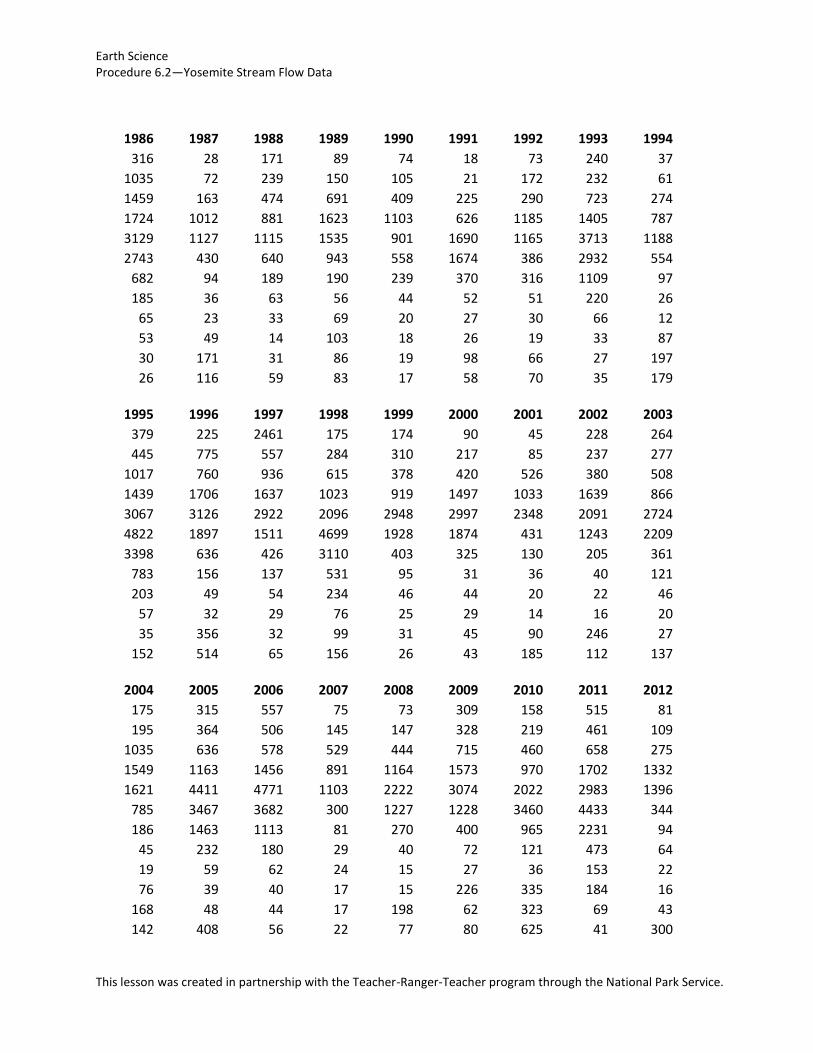
1986 1987 1988 1989 1990 1991 1992 1993 1994
316 28 171 89 74 18 73 240 37
1035 72 239 150 105 21 172 232 61
1459 163 474 691 409 225 290 723 274
1724 1012 881 1623 1103 626 1185 1405 787
3129 1127 1115 1535 901 1690 1165 3713 1188
2743 430 640 943 558 1674 386 2932 554
682 94 189 190 239 370 316 1109 97
185 36 63 56 44 52 51 220 26
65 23 33 69 20 27 30 66 12
53 49 14 103 18 26 19 33 87
30 171 31 86 19 98 66 27 197
26 116 59 83 17 58 70 35 179
1995 1996 1997 1998 1999 2000 2001 2002 2003
379 225 2461 175 174 90 45 228 264
445 775 557 284 310 217 85 237 277
1017 760 936 615 378 420 526 380 508
1439 1706 1637 1023 919 1497 1033 1639 866
3067 3126 2922 2096 2948 2997 2348 2091 2724
4822 1897 1511 4699 1928 1874 431 1243 2209
3398 636 426 3110 403 325 130 205 361
783 156 137 531 95 31 36 40 121
203 49 54 234 46 44 20 22 46
57 32 29 76 25 29 14 16 20
35 356 32 99 31 45 90 246 27
152 514 65 156 26 43 185 112 137
2004 2005 2006 2007 2008 2009 2010 2011 2012
175 315 557 75 73 309 158 515 81
195 364 506 145 147 328 219 461 109
1035 636 578 529 444 715 460 658 275
1549 1163 1456 891 1164 1573 970 1702 1332
1621 4411 4771 1103 2222 3074 2022 2983 1396
785 3467 3682 300 1227 1228 3460 4433 344
186 1463 1113 81 270 400 965 2231 94
45 232 180 29 40 72 121 473 64
19 59 62 24 15 27 36 153 22
76 39 40 17 15 226 335 184 16
168 48 44 17 198 62 323 69 43
142 408 56 22 77 80 625 41 300
Earth Science Procedure 7.1—Virtual Field Trip
This lesson was created in partnership with the Teacher-Ranger-Teacher program through the National Park Service.
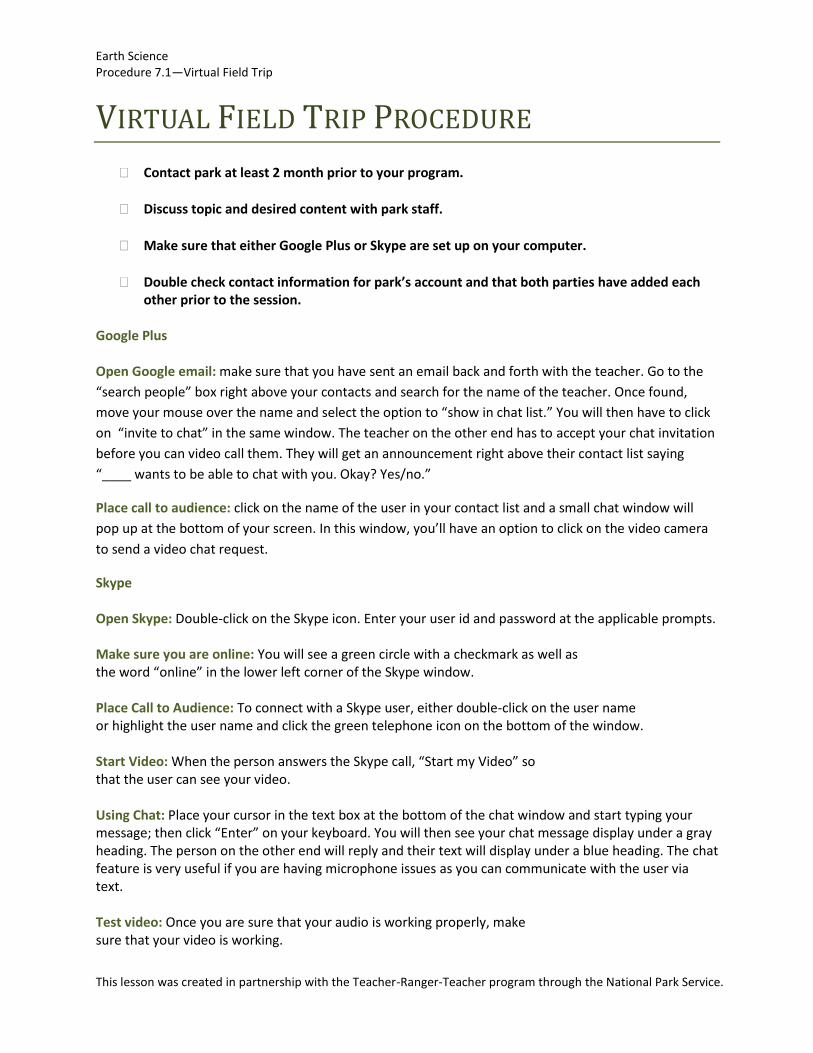
VIRTUAL FIELD TRIP PROCEDURE
Contact park at least 2 month prior to your program.
Discuss topic and desired content with park staff.
Make sure that either Google Plus or Skype are set up on your computer.
Double check contact information for park’s account and that both parties have added each other prior to the session.
Google Plus Open Google email: make sure that you have sent an email back and forth with the teacher. Go to the
“search people” box right above your contacts and search for the name of the teacher. Once found,
move your mouse over the name and select the option to “show in chat list.” You will then have to click
on “invite to chat” in the same window. The teacher on the other end has to accept your chat invitation
before you can video call them. They will get an announcement right above their contact list saying
“____ wants to be able to chat with you. Okay? Yes/no.”
Place call to audience: click on the name of the user in your contact list and a small chat window will
pop up at the bottom of your screen. In this window, you’ll have an option to click on the video camera
to send a video chat request.
Skype Open Skype: Double-click on the Skype icon. Enter your user id and password at the applicable prompts. Make sure you are online: You will see a green circle with a checkmark as well as the word “online” in the lower left corner of the Skype window. Place Call to Audience: To connect with a Skype user, either double-click on the user name or highlight the user name and click the green telephone icon on the bottom of the window. Start Video: When the person answers the Skype call, “Start my Video” so that the user can see your video. Using Chat: Place your cursor in the text box at the bottom of the chat window and start typing your message; then click “Enter” on your keyboard. You will then see your chat message display under a gray heading. The person on the other end will reply and their text will display under a blue heading. The chat feature is very useful if you are having microphone issues as you can communicate with the user via text. Test video: Once you are sure that your audio is working properly, make sure that your video is working.
Earth Science Procedure 7.1—Virtual Field Trip
This lesson was created in partnership with the Teacher-Ranger-Teacher program through the National Park Service.
Select Tools -> Options -> Video Settings and you should see your video on the right side of the window. Test your audio: Once you are online, ensure that your headset/microphone is working properly. Double click on the “Skype Test Call” and follow the automated operator’s instructions. You can then adjust volume and re-test (if necessary). If your audio is not working, open the Tools->Options->Audio Settings in the Skype window. Ensure that the microphone is the “Windows Default Device”; then, click “Save”. If your audio is still not working, reboot your computer. Upon rebooting, you may see a screen that requires you to select “microphone” and then click on “Okay.” You can now re-test your audio.
Earth Science Procedure 8.1—Web Resources
This lesson was created in partnership with the Teacher-Ranger-Teacher program through the National Park Service.
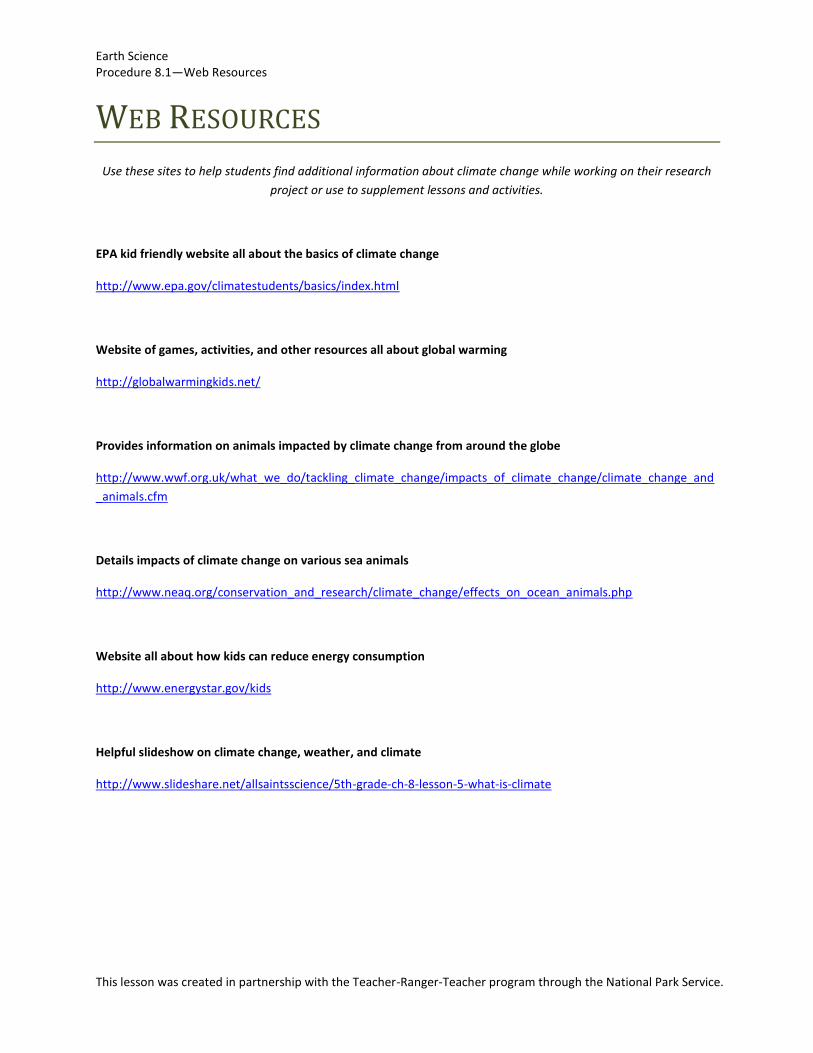
WEB RESOURCES
Use these sites to help students find additional information about climate change while working on their research
project or use to supplement lessons and activities.
EPA kid friendly website all about the basics of climate change
http://www.epa.gov/climatestudents/basics/index.html
Website of games, activities, and other resources all about global warming
http://globalwarmingkids.net/
Provides information on animals impacted by climate change from around the globe
http://www.wwf.org.uk/what_we_do/tackling_climate_change/impacts_of_climate_change/climate_change_and
_animals.cfm
Details impacts of climate change on various sea animals
http://www.neaq.org/conservation_and_research/climate_change/effects_on_ocean_animals.php
Website all about how kids can reduce energy consumption
http://www.energystar.gov/kids
Helpful slideshow on climate change, weather, and climate
http://www.slideshare.net/allsaintsscience/5th-grade-ch-8-lesson-5-what-is-climate
Earth Science Worksheet 8.1—Grant Proposal Rubric
This lesson was created in partnership with the Teacher-Ranger-Teacher program through the National Park Service.
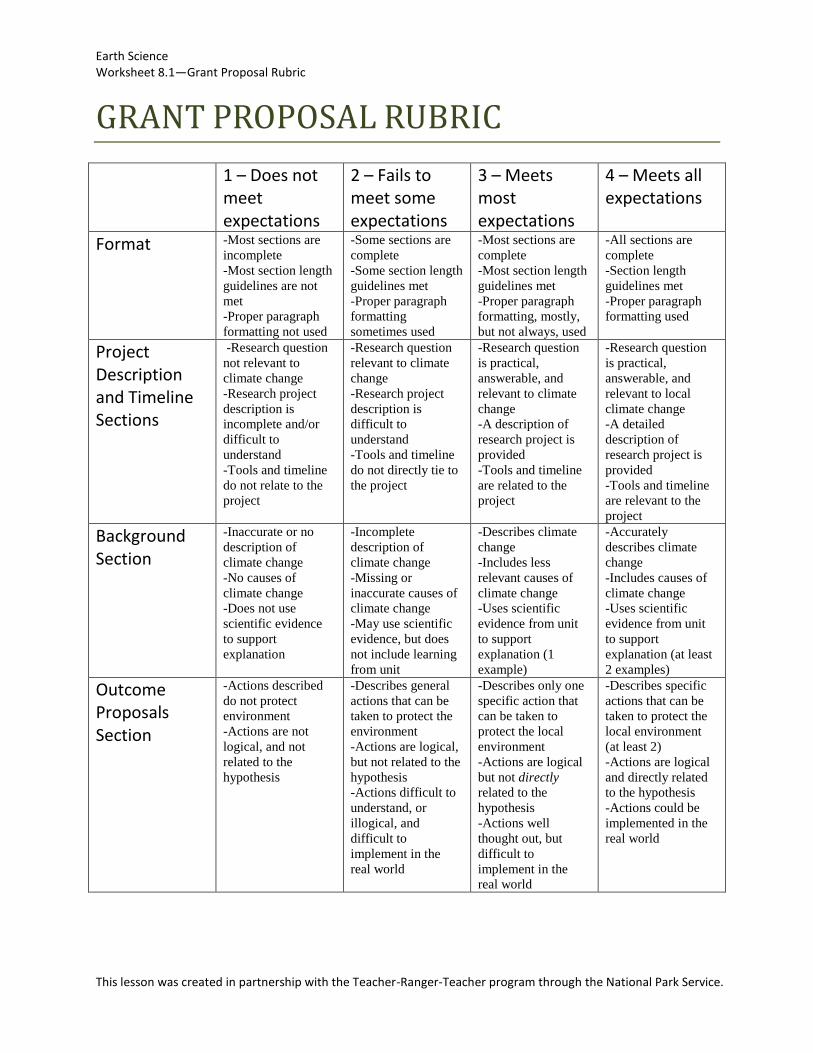
GRANT PROPOSAL RUBRIC
1 – Does not meet expectations
2 – Fails to meet some expectations
3 – Meets most expectations
4 – Meets all expectations
Format -Most sections are
incomplete
-Most section length
guidelines are not
met
-Proper paragraph
formatting not used
-Some sections are
complete
-Some section length
guidelines met
-Proper paragraph
formatting
sometimes used
-Most sections are
complete
-Most section length
guidelines met
-Proper paragraph
formatting, mostly,
but not always, used
-All sections are
complete
-Section length
guidelines met
-Proper paragraph
formatting used
Project Description and Timeline Sections
-Research question
not relevant to
climate change
-Research project
description is
incomplete and/or
difficult to
understand
-Tools and timeline
do not relate to the
project
-Research question
relevant to climate
change
-Research project
description is
difficult to
understand
-Tools and timeline
do not directly tie to
the project
-Research question
is practical,
answerable, and
relevant to climate
change
-A description of
research project is
provided
-Tools and timeline
are related to the
project
-Research question
is practical,
answerable, and
relevant to local
climate change
-A detailed
description of
research project is
provided
-Tools and timeline
are relevant to the
project
Background Section
-Inaccurate or no
description of
climate change
-No causes of
climate change
-Does not use
scientific evidence
to support
explanation
-Incomplete
description of
climate change
-Missing or
inaccurate causes of
climate change
-May use scientific
evidence, but does
not include learning
from unit
-Describes climate
change
-Includes less
relevant causes of
climate change
-Uses scientific
evidence from unit
to support
explanation (1
example)
-Accurately
describes climate
change
-Includes causes of
climate change
-Uses scientific
evidence from unit
to support
explanation (at least
2 examples)
Outcome Proposals Section
-Actions described
do not protect
environment
-Actions are not
logical, and not
related to the
hypothesis
-Describes general
actions that can be
taken to protect the
environment
-Actions are logical,
but not related to the
hypothesis
-Actions difficult to
understand, or
illogical, and
difficult to
implement in the
real world
-Describes only one
specific action that
can be taken to
protect the local
environment
-Actions are logical
but not directly
related to the
hypothesis
-Actions well
thought out, but
difficult to
implement in the
real world
-Describes specific
actions that can be
taken to protect the
local environment
(at least 2)
-Actions are logical
and directly related
to the hypothesis
-Actions could be
implemented in the
real world
Earth Science Worksheet 8.2—Climate Science Projects
This lesson was created in partnership with the Teacher-Ranger-Teacher program through the National Park Service.
Name: EXAMPLE
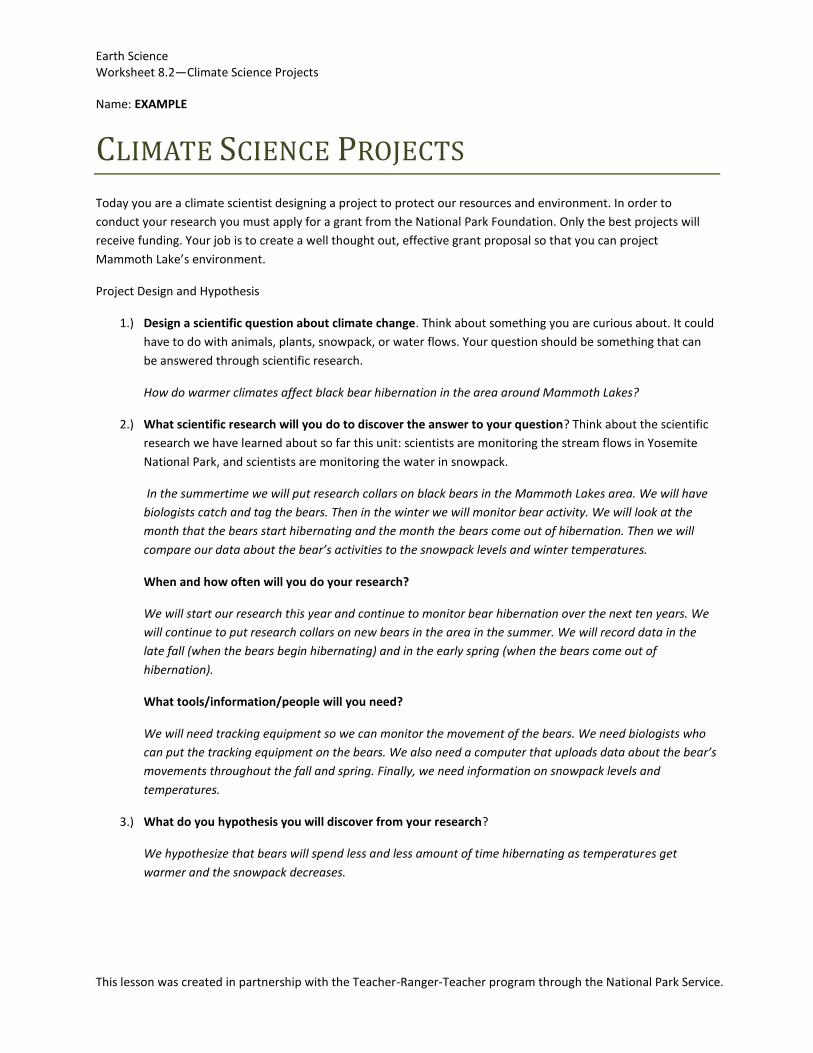
CLIMATE SCIENCE PROJECTS
Today you are a climate scientist designing a project to protect our resources and environment. In order to
conduct your research you must apply for a grant from the National Park Foundation. Only the best projects will
receive funding. Your job is to create a well thought out, effective grant proposal so that you can project
Mammoth Lake’s environment.
Project Design and Hypothesis
1.) Design a scientific question about climate change. Think about something you are curious about. It could
have to do with animals, plants, snowpack, or water flows. Your question should be something that can
be answered through scientific research.
How do warmer climates affect black bear hibernation in the area around Mammoth Lakes?
2.) What scientific research will you do to discover the answer to your question? Think about the scientific
research we have learned about so far this unit: scientists are monitoring the stream flows in Yosemite
National Park, and scientists are monitoring the water in snowpack.
In the summertime we will put research collars on black bears in the Mammoth Lakes area. We will have
biologists catch and tag the bears. Then in the winter we will monitor bear activity. We will look at the
month that the bears start hibernating and the month the bears come out of hibernation. Then we will
compare our data about the bear’s activities to the snowpack levels and winter temperatures.
When and how often will you do your research?
We will start our research this year and continue to monitor bear hibernation over the next ten years. We
will continue to put research collars on new bears in the area in the summer. We will record data in the
late fall (when the bears begin hibernating) and in the early spring (when the bears come out of
hibernation).
What tools/information/people will you need?
We will need tracking equipment so we can monitor the movement of the bears. We need biologists who
can put the tracking equipment on the bears. We also need a computer that uploads data about the bear’s
movements throughout the fall and spring. Finally, we need information on snowpack levels and
temperatures.
3.) What do you hypothesis you will discover from your research?
We hypothesize that bears will spend less and less amount of time hibernating as temperatures get
warmer and the snowpack decreases.
Earth Science Worksheet 8.2—Climate Science Projects
This lesson was created in partnership with the Teacher-Ranger-Teacher program through the National Park Service.
National Park Foundation Grant Application
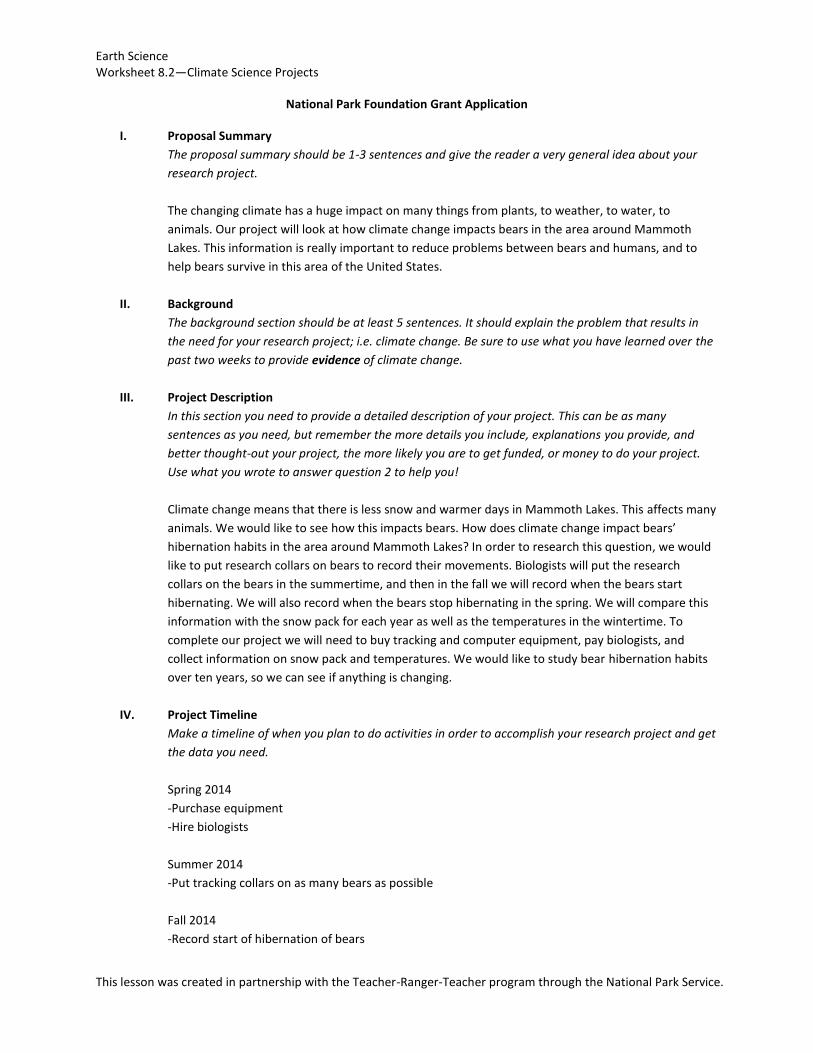
I. Proposal Summary
The proposal summary should be 1-3 sentences and give the reader a very general idea about your
research project.
The changing climate has a huge impact on many things from plants, to weather, to water, to
animals. Our project will look at how climate change impacts bears in the area around Mammoth
Lakes. This information is really important to reduce problems between bears and humans, and to
help bears survive in this area of the United States.
II. Background
The background section should be at least 5 sentences. It should explain the problem that results in
the need for your research project; i.e. climate change. Be sure to use what you have learned over the
past two weeks to provide evidence of climate change.
III. Project Description
In this section you need to provide a detailed description of your project. This can be as many
sentences as you need, but remember the more details you include, explanations you provide, and
better thought-out your project, the more likely you are to get funded, or money to do your project.
Use what you wrote to answer question 2 to help you!
Climate change means that there is less snow and warmer days in Mammoth Lakes. This affects many
animals. We would like to see how this impacts bears. How does climate change impact bears’
hibernation habits in the area around Mammoth Lakes? In order to research this question, we would
like to put research collars on bears to record their movements. Biologists will put the research
collars on the bears in the summertime, and then in the fall we will record when the bears start
hibernating. We will also record when the bears stop hibernating in the spring. We will compare this
information with the snow pack for each year as well as the temperatures in the wintertime. To
complete our project we will need to buy tracking and computer equipment, pay biologists, and
collect information on snow pack and temperatures. We would like to study bear hibernation habits
over ten years, so we can see if anything is changing.
IV. Project Timeline
Make a timeline of when you plan to do activities in order to accomplish your research project and get
the data you need.
Spring 2014
-Purchase equipment
-Hire biologists
Summer 2014
-Put tracking collars on as many bears as possible
Fall 2014
-Record start of hibernation of bears
Earth Science Worksheet 8.2—Climate Science Projects
This lesson was created in partnership with the Teacher-Ranger-Teacher program through the National Park Service.
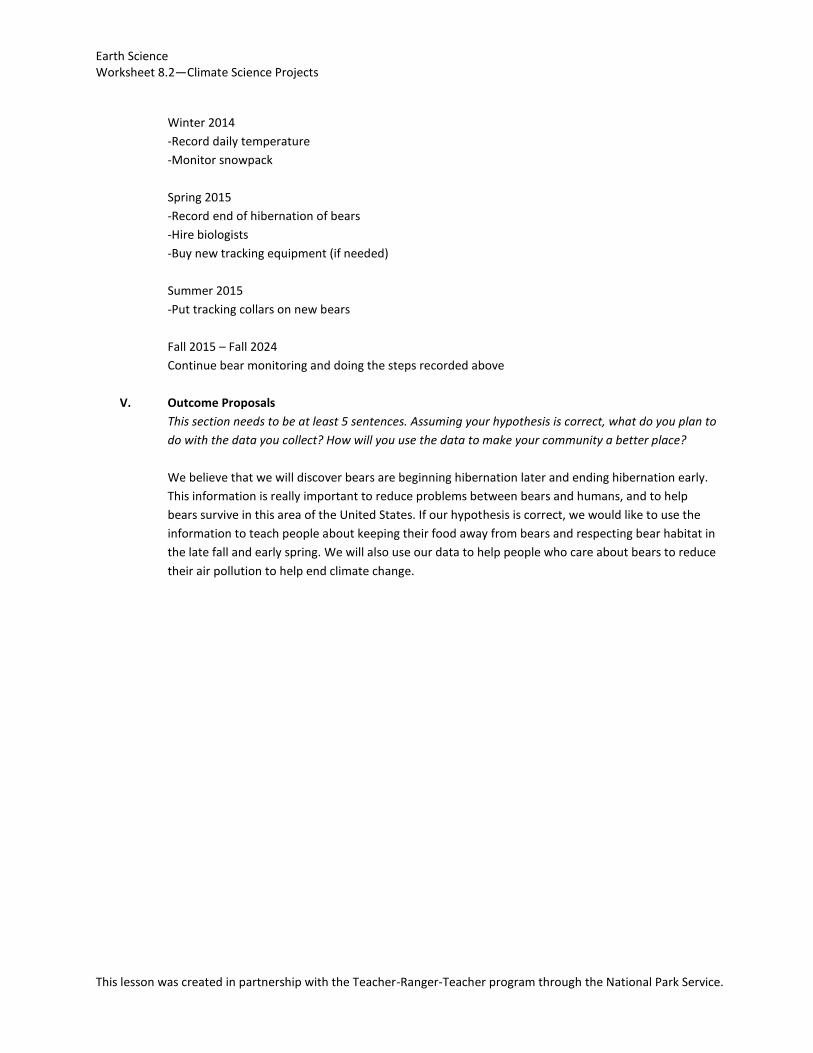
Winter 2014
-Record daily temperature
-Monitor snowpack
Spring 2015
-Record end of hibernation of bears
-Hire biologists
-Buy new tracking equipment (if needed)
Summer 2015
-Put tracking collars on new bears
Fall 2015 – Fall 2024
Continue bear monitoring and doing the steps recorded above
V. Outcome Proposals
This section needs to be at least 5 sentences. Assuming your hypothesis is correct, what do you plan to
do with the data you collect? How will you use the data to make your community a better place?
We believe that we will discover bears are beginning hibernation later and ending hibernation early.
This information is really important to reduce problems between bears and humans, and to help
bears survive in this area of the United States. If our hypothesis is correct, we would like to use the
information to teach people about keeping their food away from bears and respecting bear habitat in
the late fall and early spring. We will also use our data to help people who care about bears to reduce
their air pollution to help end climate change.
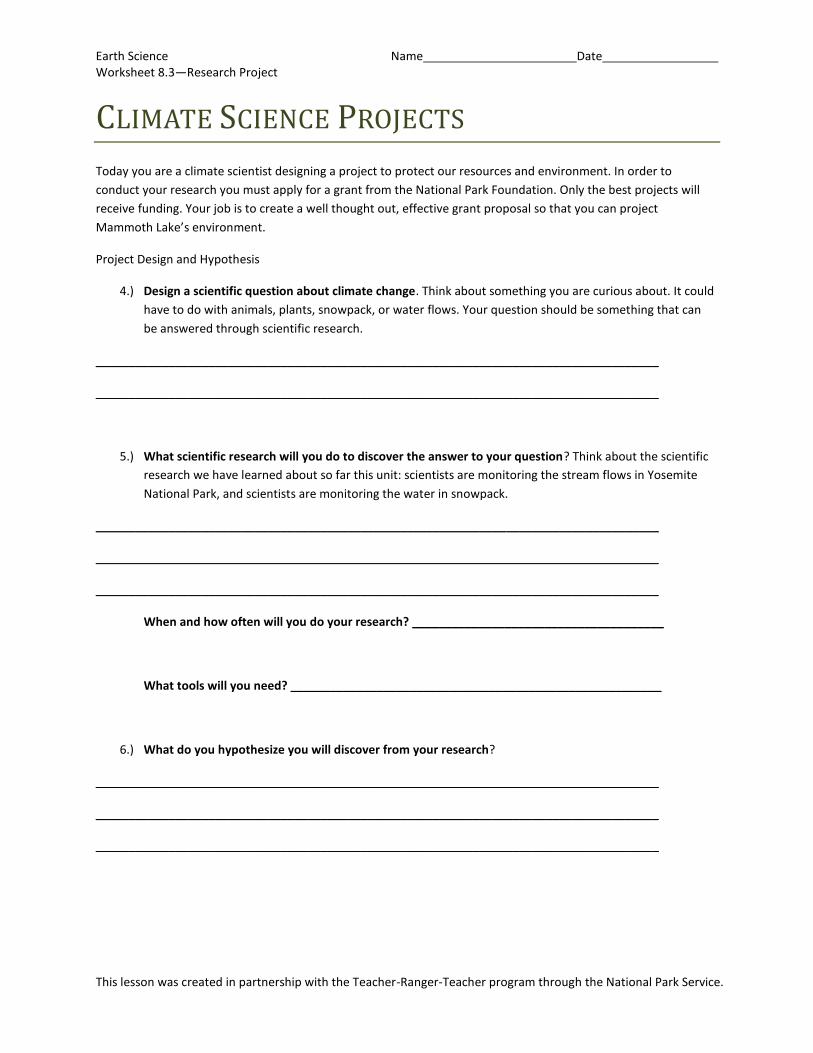
Earth Science Name Date Worksheet 8.3—Research Project
This lesson was created in partnership with the Teacher-Ranger-Teacher program through the National Park Service.
CLIMATE SCIENCE PROJECTS
Today you are a climate scientist designing a project to protect our resources and environment. In order to
conduct your research you must apply for a grant from the National Park Foundation. Only the best projects will
receive funding. Your job is to create a well thought out, effective grant proposal so that you can project
Mammoth Lake’s environment.
Project Design and Hypothesis
4.) Design a scientific question about climate change. Think about something you are curious about. It could
have to do with animals, plants, snowpack, or water flows. Your question should be something that can
be answered through scientific research.
_____________________________________________________________________________________
_____________________________________________________________________________________
5.) What scientific research will you do to discover the answer to your question? Think about the scientific
research we have learned about so far this unit: scientists are monitoring the stream flows in Yosemite
National Park, and scientists are monitoring the water in snowpack.
_____________________________________________________________________________________
_____________________________________________________________________________________
_____________________________________________________________________________________
When and how often will you do your research? ______________________________________
What tools will you need? ________________________________________________________
6.) What do you hypothesize you will discover from your research?
_____________________________________________________________________________________
_____________________________________________________________________________________
_____________________________________________________________________________________
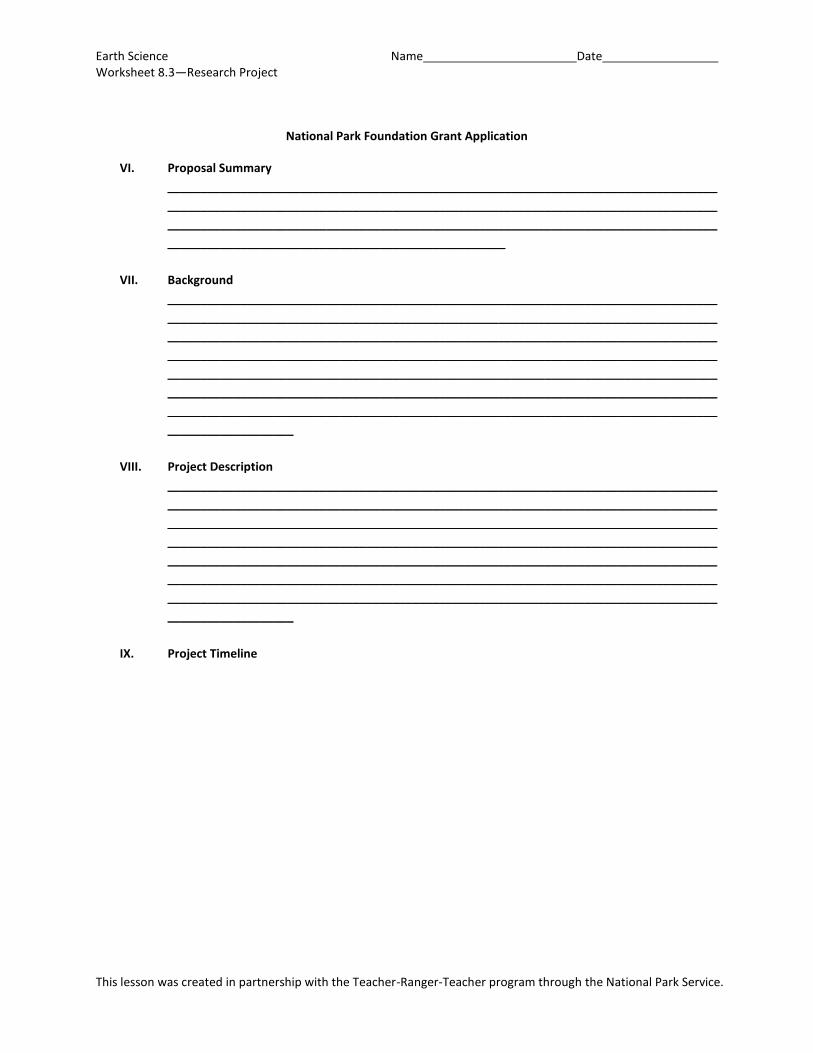
Earth Science Name Date Worksheet 8.3—Research Project
This lesson was created in partnership with the Teacher-Ranger-Teacher program through the National Park Service.
National Park Foundation Grant Application
VI. Proposal Summary
___________________________________________________________________________________
___________________________________________________________________________________
___________________________________________________________________________________
___________________________________________________
VII. Background
___________________________________________________________________________________
___________________________________________________________________________________
___________________________________________________________________________________
___________________________________________________________________________________
___________________________________________________________________________________
___________________________________________________________________________________
___________________________________________________________________________________
___________________
VIII. Project Description
___________________________________________________________________________________
___________________________________________________________________________________
___________________________________________________________________________________
___________________________________________________________________________________
___________________________________________________________________________________
___________________________________________________________________________________
___________________________________________________________________________________
___________________
IX. Project Timeline
Earth Science Name Date Worksheet 8.3—Research Project
This lesson was created in partnership with the Teacher-Ranger-Teacher program through the National Park Service.
X. Outcome Proposals
___________________________________________________________________________________
___________________________________________________________________________________
___________________________________________________________________________________
___________________________________________________________________________________
___________________________________________________________________________________
___________________________________________________________________________________
___________________________________________________________________________________
___________________

Earth Science Fake money
This lesson was created in partnership with the Teacher-Ranger-Teacher program through the National Park Service.

Earth Science Fake money
This lesson was created in partnership with the Teacher-Ranger-Teacher program through the National Park Service.
Earth Science Vocabulary
This lesson was created in partnership with the Teacher-Ranger-Teacher program through the National Park Service.
Day 1
Climate change – any significant change in the climate lasting for decades or longer.
Global warming— the rise in the average temperature of Earth's atmosphere and oceans since the late
19th century and its projected continuation.
Greenhouse effect – a process by which thermal radiation from a planetary surface is absorbed by
atmospheric greenhouse gases, and is re-radiated in all directions.
Pollution— the introduction of contaminants into the natural environment that cause adverse change.
Day 2
Adaptation – the ability of a species to survive in a particular ecological niche, especially because of
alterations of form or behavior brought about through natural selection.
Habitat—an ecological area that is inhabited by a particular species.
Climate – the average course or condition of the weather at a place usually over a period of years as
exhibited by temperature, wind velocity, and precipitation.
Weather – the state of the atmosphere with respect to heat or cold, wetness or dryness, calm or storm,
clearness or cloudiness.
Day 3 Snowpack – forms from layers of snow that accumulate in geographic regions and high altitudes where
the climate includes cold weather for extended periods of time throughout the year.
Snow-water equivalent – the amount of water contained within the snowpack.
Day 4 Camouflage— the ability of an animal to blend in to its environment. Density—the mass per unit volume of an object. Depth— the perpendicular measurement downward from a surface. Volume— the quantity of three-dimensional space enclosed by some closed boundary. Day 5 Precipitation—any product of condensation of atmospheric water vapor that falls under gravity.
Earth Science Vocabulary
This lesson was created in partnership with the Teacher-Ranger-Teacher program through the National Park Service.
Stream flow—the flow of water in streams and rivers often from snowpack runoff. Watershed – an area of land where all of the water that is under it or drains off of it goes into the same
place.
Day 6 Hydrology— the branch of science concerned with the properties of the earth's water, esp. its movement in relation to land. Peak flow—the maximum flow of water in a river or steam in a given year.
Earth Science Student Evaluation
This lesson was created in partnership with the Teacher-Ranger-Teacher program through the National Park Service.
Student Name
_________________
Teacher Name
_________________
I learned new information about climate change.
1 2 3 4
The unit was relevant to my life.
1 2 3 4
My teacher explained necessary vocabulary so I could understand the content.
1 2 3 4
There were enough hands-on activities in this unit.
1 2 3 4
The hands-on activities in this unit were directly related to the content we studied.
1 2 3 4
I have a deeper understanding of climate change and why it’s important
1 2 3 4
The National Park Service is an important agency that is helping to protect wild places and study climate change
1 2 3 4
I can explain to friends and family how National Parks are “science labs” for climate change.
1 2 3 4
This unit has increased my interest in National Parks.
1 2 3 4
I would recommend this unit to be taught to other classes similar to mine.
1 2 3 4
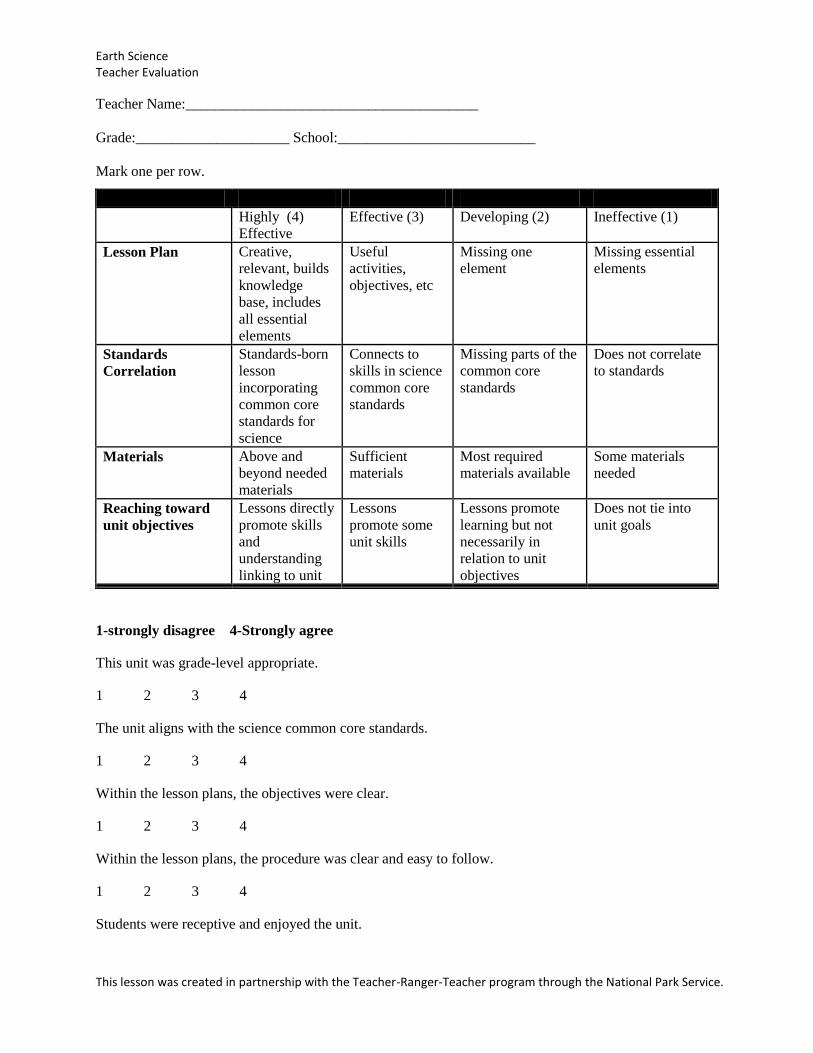
Earth Science Teacher Evaluation
This lesson was created in partnership with the Teacher-Ranger-Teacher program through the National Park Service.
Teacher Name:________________________________________
Grade:_____________________ School:___________________________
Mark one per row.
Highly (4)
Effective
Effective (3) Developing (2) Ineffective (1)
Lesson Plan
Creative,
relevant, builds
knowledge
base, includes
all essential
elements
Useful
activities,
objectives, etc
Missing one
element
Missing essential
elements
Standards
Correlation
Standards-born
lesson
incorporating
common core
standards for
science
Connects to
skills in science
common core
standards
Missing parts of the
common core
standards
Does not correlate
to standards
Materials
Above and
beyond needed
materials
Sufficient
materials
Most required
materials available
Some materials
needed
Reaching toward
unit objectives
Lessons directly
promote skills
and
understanding
linking to unit
Lessons
promote some
unit skills
Lessons promote
learning but not
necessarily in
relation to unit
objectives
Does not tie into
unit goals
1-strongly disagree 4-Strongly agree
This unit was grade-level appropriate.
1 2 3 4
The unit aligns with the science common core standards.
1 2 3 4
Within the lesson plans, the objectives were clear.
1 2 3 4
Within the lesson plans, the procedure was clear and easy to follow.
1 2 3 4
Students were receptive and enjoyed the unit.
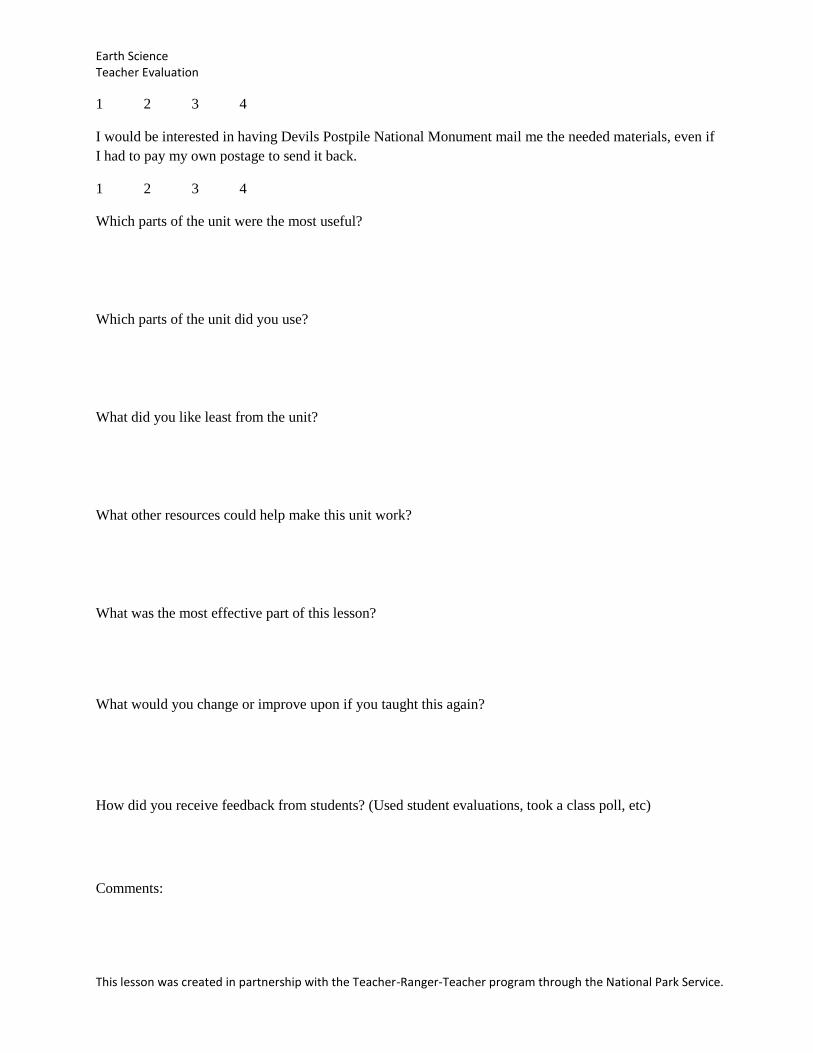
Earth Science Teacher Evaluation
This lesson was created in partnership with the Teacher-Ranger-Teacher program through the National Park Service.
1 2 3 4
I would be interested in having Devils Postpile National Monument mail me the needed materials, even if
I had to pay my own postage to send it back.
1 2 3 4
Which parts of the unit were the most useful?
Which parts of the unit did you use?
What did you like least from the unit?
What other resources could help make this unit work?
What was the most effective part of this lesson?
What would you change or improve upon if you taught this again?
How did you receive feedback from students? (Used student evaluations, took a class poll, etc)
Comments: