Embed Size (px)
Citation preview
AUGUST 27, 2014
This is your brain …on investingManaging investor behavior in modern markets
Rod Greenshields, CFA, Consulting Director
THIS MATERIAL IS FOR FINANCIAL PROFESSIONAL USE ONLY AND NOT FOR DISTRIBUTION TO CURRENT OR POTENTIAL INVESTORS.

Important information and disclosures
Fund objectives, risks, charges and expenses should be carefully considered beforeinvesting. A summary prospectus, if available, or a prospectus containing this and otherimportant information can be obtained by calling 800-787-7354 or by visitingwww.russell.com. Please read a prospectus carefully before investing.Please remember that all investments carry some level of risk, including the potential loss of principal invested. They do not typically growat an even rate of return and may experience negative growth. As with any type of portfolio structuring, attempting to reduce risk andincrease return could, at certain times, unintentionally reduce returns. Diversification and strategic asset allocation do not assure profit orprotect against loss in declining markets.
Model Strategies represent target allocations of Russell funds; these models are not managed and cannot be invested in directly.
Model Strategies are exposed to the specific risks of the funds directly proportionate to their fund allocation. The funds comprising the strategies andthe allocations to those funds have changed over time and may change in the future.
Bond investors should carefully consider risks such as interest rate, credit, repurchase and reverse repurchase transaction risks. Greater risk, suchas increased volatility, limited liquidity, prepayment, non-payment and increased default risk, is inherent in portfolios that invest in high yield ("junk")bonds or mortgage backed securities, especially mortgage backed securities with exposure to sub-prime mortgages. Investment in non-U.S. andemerging market securities is subject to the risk of currency fluctuations and to economic and political risks associated with such foreign countries.
Growth investments focus on stocks of companies whose earnings/profitability are accelerating in the short term or have grown consistently over thelong term. Such investments may provide minimal dividends which could otherwise cushion stock prices in a market decline. Stock value may riseand fall significantly base, in part, on investors' perceptions of the company, rather than on fundamental analysis of the stocks. Investors shouldcarefully consider the additional risks involved in growth investments.
Value investments focus on stocks of income-producing companies whose price is low relative to one or more valuation factors, such as earnings orbook value. Such investments are subject to risks that their intrinsic values may never be realized by the market, or, such stock may turn out not tohave been undervalued. Investors should carefully consider the additional risks involved in value investments.
Russell Investment Group, is a Washington, USA corporation, which operates through subsidiaries worldwide, including Russell Investments and is asubsidiary of The Northwestern Mutual Life Insurance Company
Copyright© Russell Investments 2014. All rights reserved. This material is proprietary and may not be reproduced, transferred, or distributed in anyform without prior written permission from Russell Investments. It is delivered on an “as is” basis without warranty.
Securities products and services offered through Russell Financial Services, Inc., member FINRA, part of Russell Investments.
First Used: July 2012 / Revised: August 2014
RFS-11712
2
NOT FDIC Insured
May Lose Value
No Bank Guarantee
FINANCIAL PROFESSIONAL USE ONLY

How do you manage thebehavior of your clients?
1.Keep doing what’s working
2.Start doing what you know youshould be doing (but aren’t)
3.Try something new
3 FINANCIAL PROFESSIONAL USE ONLY

Russell3000® Index(1)
“Average”Investor(2)
(1) BNY Mellon Analytical Services, Russell 3000® Index annualized return from January 1, 1984 – December 31, 2013.
(2) Russell Investment Group, Strategas & Investment Company Institute (ICI). Return was calculated by deriving the internal rate of return (IRR) based on ICI monthly fund flow data whichwas compared to the rate of return if invested in the Russell 3000® Index and held without alteration from January 1, 1984 to December 31, 2013. This seeks to illustrate how regularlyincreasing or decreasing equity exposure based on the current market trends can sacrifice even market like returns.
Indexes and/or benchmarks are unmanaged and cannot be invested in directly. Returns represent past performance, are not a guarantee of future performance, and are not indicative ofany specific investment.
-2.2%
0%
2%
4%
6%
8%
10%
12%
11.0%
The high cost of investor behavior1984-2013
8.8%
Annualizedcost to retail“chasers”
4 FINANCIAL PROFESSIONAL USE ONLY

Damaging investorhabits show up
5 FINANCIAL PROFESSIONAL USE ONLY

6 FINANCIAL PROFESSIONAL USE ONLY

We are not “Homo economicus”
We are Homo sapiens!7

Humans are wiredto detect patterns
8 FINANCIAL PROFESSIONAL USE ONLY

We aremade fora world oflimited& poorinformation
9 FINANCIAL PROFESSIONAL USE ONLY

The LotteryA tax on the mathematically challenged
Odds of winning PowerBall Lottery?
Odds of dying from flesh eating bacteria?
Odds of being killed by terrorists while traveling abroad?
Odds of being bitten by a dog?
Odds of being struck by lightning?
10
Source: Powerball; PBS Frontline; Mike Orkin. Can You Win? The Real Odds for Casino Gambling, Sports Betting and Lotteries. W.H. Freeman & Co. 1991; EInsure, 10/20/2004
FINANCIAL PROFESSIONAL USE ONLY

The LotteryA tax on the mathematically challenged
Odds of winning PowerBall Lottery?
1 out of 80 million
Odds of dying from flesh eating bacteria?
1 out of 1 million
Odds of being killed by terrorists while traveling abroad?
1 out of 650,000
Odds of being bitten by a dog?
1 out of 147,000
Odds of being struck by lightning?
1 out of 30,000
11
Don’t confuse entertainment with investing in the market
Source: Powerball; PBS Frontline; Mike Orkin. Can You Win? The Real Odds for Casino Gambling, Sports Betting and Lotteries. W.H. Freeman & Co. 1991; EInsure, 10/20/2004
FINANCIAL PROFESSIONAL USE ONLY

12 FINANCIAL PROFESSIONAL USE ONLY
What’s the
animal in the world?

13 FINANCIAL PROFESSIONAL USE ONLY
What’s the
animal in the world?
mosquito

Over short periods of time,
14 FINANCIAL PROFESSIONAL USE ONLY

Evenunderstand this
better than we do15

Rat “logic”› Notice they get a pellet
more often from red leverthan green
› Press red lever all the time
› Chance of getting it right
= 80%
FINANCIAL PROFESSIONAL USE ONLY
Source: The Left Hemisphere's Role in Hypothesis Formation; Wolford, Miller & Gazzaniga. The Journal of Neuroscience, 2000, Vol 20
16

Rat “logic”› Notice they get a pellet
more often from red leverthan green
› Press red lever all the time
› Chance of getting it right
= 80%
FINANCIAL PROFESSIONAL USE ONLY
Human logic› Notice red button lights up most
often, but not always
› Think they see a pattern!
› Press red button mostly (~80%)and green sometimes (~20%)
› Chance of getting it right
= (.80)(.80) + (.20)(.20)
= 68%Source: The Left Hemisphere's Role in Hypothesis Formation; Wolford, Miller & Gazzaniga. The Journal of Neuroscience, 2000, Vol 20
17

Investors looking for patterns in the stock market
$0
$10
$20
$30
$40
$50
$60
$70
$80
$90
$100
$110
$120
$130
$140
$150
$160
-$80
-$60
-$40
-$20
$0
$20
$40
$60
Dec-07 Jun-08 Dec-08 Jun-09 Dec-09 Jun-10 Dec-10 Jun-11 Dec-11 Jun-12 Dec-12 Jun-13 Dec-13 Jun-14
Gro
wth
of
$1
00
Ne
tIn
flo
w($
US
Bill
ion
s)
Monthly mutual fundcash flows
Russell 3000® Index(Growth of $100)
Data shown is historical and not an indicator of future results.Source: Industry flows into equities. www.ici.org/research/stats.Russell 3000® Index: www.russell.com/indexes (“value with dividends”). Data as of June 30, 2014Index performance is not indicative of the performance of any specific investment. Indexes are not managed and may not be invested in directly.
FINANCIAL PROFESSIONAL USE ONLY18
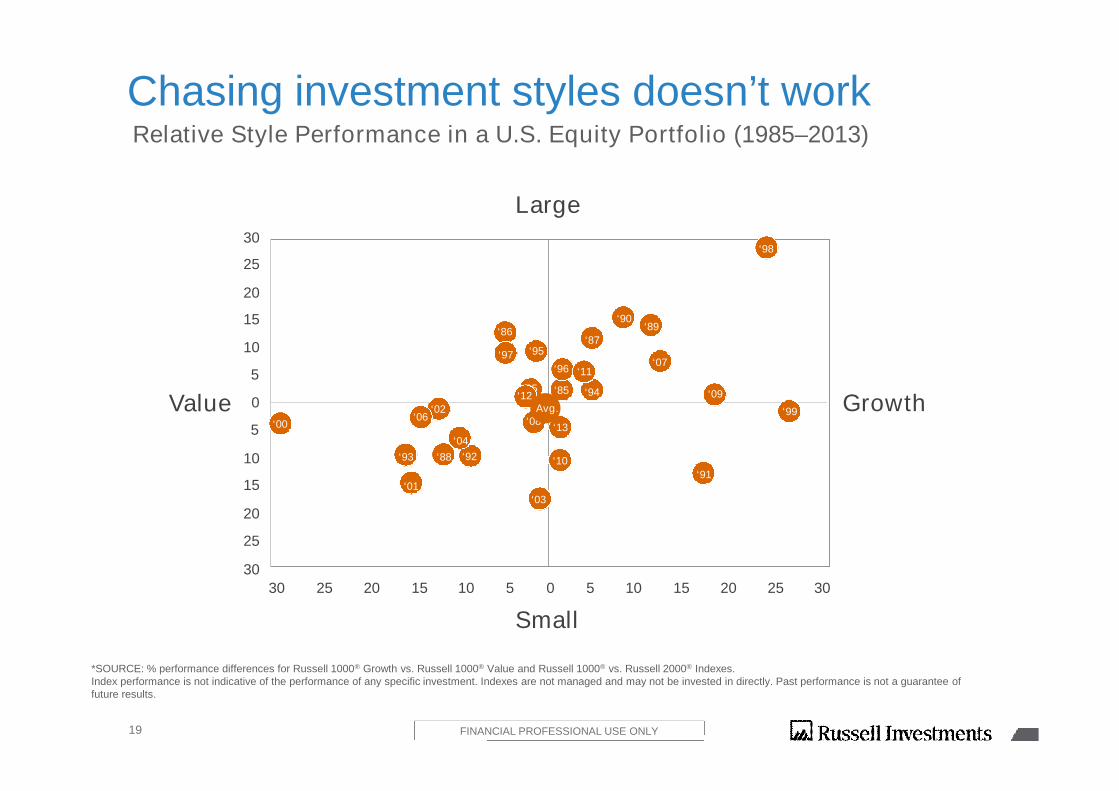
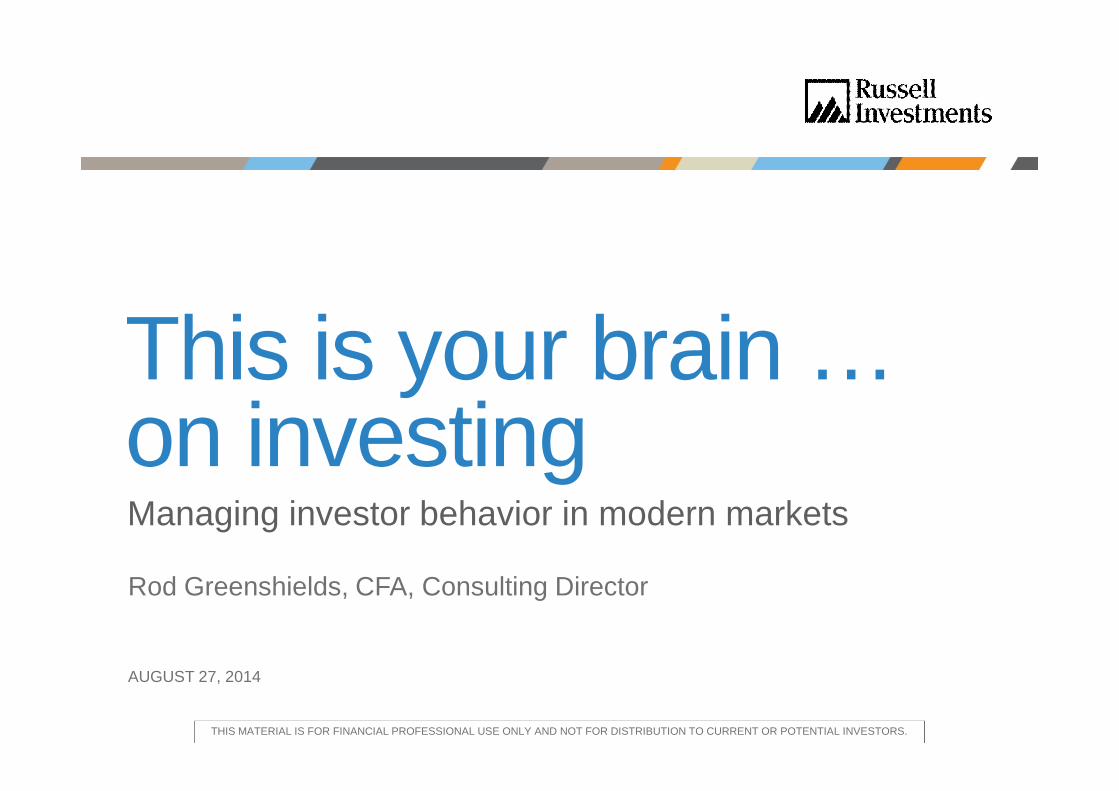
Chasing investment styles doesn’t work
*SOURCE: % performance differences for Russell 1000® Growth vs. Russell 1000® Value and Russell 1000® vs. Russell 2000® Indexes.Index performance is not indicative of the performance of any specific investment. Indexes are not managed and may not be invested in directly. Past performance is not a guarantee offuture results.
Value
Large
Small
Growth
30
25
20
15
10
5
0
5
10
15
20
25
30
30 25 20 15 10 5 0 5 10 15 20 25 30
‘98
‘99
‘09
‘91
‘07
‘89‘90
‘87
‘94‘85
‘96
‘13
‘10
‘03
‘08
‘05
‘95
‘86
‘97
‘00
‘01
‘93
‘06
‘88
‘04
‘02
‘92
‘11
‘12
Relative Style Performance in a U.S. Equity Portfolio (1985–2013)
Avg.
FINANCIAL PROFESSIONAL USE ONLY19

Chasing investment styles doesn’t work
*SOURCE: % performance differences for Russell 1000® Growth vs. Russell 1000® Value and Russell 1000® vs. Russell 2000® Indexes.Index performance is not indicative of the performance of any specific investment. Indexes are not managed and may not be invested in directly. Past performance is not a guarantee offuture results.
Value
Large
Small
Growth
30
25
20
15
10
5
0
5
10
15
20
25
30
30 25 20 15 10 5 0 5 10 15 20 25 30
‘98
‘99
‘09
‘91
‘07
‘89‘90
‘87
‘94‘85
‘96
‘13
‘10
‘03
‘08
‘05
‘95
‘86
‘97
‘00
‘01
‘93
‘06
‘88
‘04
‘02
‘92
‘11
‘12
Relative Style Performance in a U.S. Equity Portfolio (1985–2013)
Avg.
FINANCIAL PROFESSIONAL USE ONLY20

21 FINANCIAL PROFESSIONAL USE ONLY

Definition
Diversification
Discipline
FINANCIAL PROFESSIONAL USE ONLY22

23 FINANCIAL PROFESSIONAL USE ONLY

Successful investingis not the same thing asbeating the market
24 FINANCIAL PROFESSIONAL USE ONLY

What doesmean to an investorpreparing for or living in

Risk isn’t about…
FINANCIAL PROFESSIONAL USE ONLY26

It’s about
running out of moneybefore running out of life.

1Allianz Life Insurance survey cited in Ignites.com article “Boomers Dread Retirement Shortfall: Survey,” June 21, 2010.
of Boomers aremore afraidof running outof moneythan they are of
28 FINANCIAL PROFESSIONAL USE ONLY

The key is to connect
Assets and Goals
FINANCIAL PROFESSIONAL USE ONLY29

A lesson from
and
FINANCIAL PROFESSIONAL USE ONLY30

31

Do you know why your clients are investing?
› Ask open-ended questions—but don’t interrogate
› Example of a highly effective, non-threateningconversation flow:
32 FINANCIAL PROFESSIONAL USE ONLY
What’simportant toyou aboutmoney?
Can youexpand on
that?
Tell me alittle bitmore.

Definition
Diversification
Discipline
33 FINANCIAL PROFESSIONAL USE ONLY

Based on a
investment approach…
34 FINANCIAL PROFESSIONAL USE ONLY

Russell Balanced Model Strategy
1985 2014
Diversified Equity
Equity Income
Special Growth
International Securities
3 Broad Asset Categories5 Russell Funds32 Manager Strategies
3 Broad Asset Categories11 Russell Funds74 Manager Strategies
U.S. Strategic Equity
U.S. Small Cap Equity
International Developed Markets
Global Equity
Emerging Markets
Commodity Strategies
Global Infrastructure
Global Real Estate Securities
Global Opportunistic Credit
Strategic Bond
Diversified Bond
Broad Asset Categories: (outer ring)
U.S. Equity
International Equity
Fixed Income
Russell Funds:
Broad Asset Categories: (outer ring)
Equities
Fixed Income
Alternatives
Russell Funds:
As of 6/3/2014
Investments that are allocated across multiple types of securities may be exposed to a variety of risks based on the asset classes, investment styles, market sectors, and size of companiespreferred by the investment managers. Investors should consider how the combined risks impact their total investment portfolio and understand that different or greater risks can lead tovarying financial consequences, including loss of principal.
Multi-Strategy Alternative
Is diversification dead? (No, but it looks different.)
35 FINANCIAL PROFESSIONAL USE ONLY

Staying the course
as doing nothing
36 FINANCIAL PROFESSIONAL USE ONLY

Disciplined investors weathered the storm
Source: Russell Investments. 60%/40% Index Portfolio is a mix of 35% Russell 3000® Index, 17% MSCI EAFE, 3% MSCI EM, 40% Barclays Agg, and 5% FTSE NAREIT Index; Cash is 100% Citigroup 3mnth T-bill Index;Diversified portfolio moving to cash – 60/40 portfolio until Sept 30, 2008 and then moves to 100% cash through March 30, 2013.
Diversification does not assure profit or protect against loss in declining markets. This hypothetical example is for illustration only and is not intended to reflect the return of any actual investment. Investmentsdo not typically grow at an even rate of return and may experience negative growth. Indexes are unmanaged and cannot be invested in directly. Returns represent past performance, are not a guarantee of futureperformance, and are not indicative of any specific investment.
37 FINANCIAL PROFESSIONAL USE ONLY
$40,000
$50,000
$60,000
$70,000
$80,000
$90,000
$100,000
$110,000
$120,000
$130,000
$140,000P
ort
foli
ovalu
e
Russell 3000 Index
Diversified Index Portfolio moving to cash on Sep 30, 2008
Diversified Index Portfolio (60/40)
Sep '08Lehman Brosbankruptcy
Balanced Index Portfolio Performance(September 2007 - September 2013)
$129,748U.S. EquityMarketRussell 3000®
Index
$127,678Diversified indexportfolio (60/40)
$86,187Diversified indexportfolio movingto cash onSep. 30, 2008

Definition
Diversification
Discipline
38 FINANCIAL PROFESSIONAL USE ONLY

39

Discipline couldlook like this…
40 FINANCIAL PROFESSIONAL USE ONLY

41
…but it probably looks more like this.
This isClocky.
FINANCIAL PROFESSIONAL USE ONLY

42
Clocky isn’talone in hisfight…
FINANCIAL PROFESSIONAL USE ONLY

43 FINANCIAL PROFESSIONAL USE ONLY

44 FINANCIAL PROFESSIONAL USE ONLY
The ultimatemorning motivator?

p.45 FINANCIAL PROFESSIONAL USE ONLY
Consider goaliesand penalty kicks

The key is to follow an
planning process…
46 FINANCIAL PROFESSIONAL USE ONLY

47 FINANCIAL PROFESSIONAL USE ONLY
Step 1Learn
Step 2Plan
Step 3Implement
Step 4Review
Follow afour-stepprocess

48
“The winds and waves are alwayson the side of the ablest navigators.”
Edward Gibbon, Decline and Fall of the Roman Empire
FINANCIAL PROFESSIONAL USE ONLY

Barclays Aggregate Bond Index: An index, with income reinvested, generallyrepresentative of intermediate-term government bonds, investment gradecorporate debt securities, and mortgage-backed securities. (specifically:Barclays Government/Corporate Bond Index, the Asset-Backed SecuritiesIndex, and the Mortgage-Backed Securities Index.)
Citigroup 3-Month Treasury Bills: An index, with income reinvested, generallyrepresentative of the average yield of three-month Treasury-Bills.
FTSE NAREIT: An Index designed to present investors with a comprehensivefamily of REIT performance indexes that span the commercial real estatespace across the U.S. economy, offering exposure to all investment andproperty sectors. In addition, the more narrowly focused property sector andsub-sector indexes provide the facility to concentrate commercial real estateexposure in more selected markets.
MSCI EAFE Index: An index representative of the securities markets of twentydeveloped market countries in Europe, Australasia, and the Far East.
MSCI EM Index: is a free float-adjusted market capitalization index that isdesigned to measure equity market performance in emerging market countryindices.
Russell 1000® Index: measures the performance of the large-cap segment ofthe U.S. equity universe. It is a subset of the Russell 3000® Index andincludes approximately 1000 of the largest securities based on a combinationof their market cap and current index membership. The Russell 1000represents approximately 92% of the U.S. market.
Russell 1000® Growth Index: measures the performance of the large-capgrowth segment of the U.S. equity universe. It includes those Russell 1000Index companies with higher price-to-book ratios and higher forecasted growthvalues.
Russell 1000® Value Index: measures the performance of the large-cap valuesegment of the U.S. equity universe. It includes those Russell 1000 Indexcompanies with lower price-to-book ratios and lower expected growth values.
Russell 2000® Index: measures the performance of the small-cap segment ofthe U.S. equity universe. The Russell 2000 is a subset of the Russell 3000®Index representing approximately 10% of the total market capitalization of thatindex. It includes approximately 2000 of the smallest securities based on acombination of their market cap and current index membership.
Russell 3000® Index: Index measures the performance of the largest 3000U.S. companies representing approximately 98% of the investable U.S. equitymarket.
49
Index definitions
49
FINANCIAL PROFESSIONAL USE ONLY

www.russell.com“Russell,” “Russell Investments,” “Russell 1000,” “Russell 2000,” and “Russell 3000”are registered trademarks of the Frank Russell Company.