Embed Size (px)
Citation preview

Accepted Manuscript
This is the author’s version of the work. It is posted here by permission of the AAAS for personal use, not for
redistribution.
The definitive version was published in Science on 366(6467), 2019.
DOI: http://dx.doi.org/10.1126/science.aay5945
1
Catchment properties and the photosynthetic trait composition of 1
freshwater plant communities 2
Short title: Catchments rule aquatic plant traits 3
One sentence summary: The geographical distribution of bicarbonate use in freshwater plants is 4
controlled by catchment characteristics. 5
6
Author list: 7
Iversen*, L. L.1,2, Winkel*, A.1, Baastrup-Spohr*, L.1, Hinke, A. B.1, Alahuhta, J.3, Baattrup-8
Pedersen, A.4, Birk, S.5, Brodersen, P.1, Chambers, P. A.6, Ecke, F.7, Feldmann, T.8, Gebler, D.9, 9
Heino, J.10, Jespersen, T. S.1, Moe, S. J.11, Riis, T.3, Sass, L.12, Vestergaard, O.13, Maberly#§, S. 10
C.14, Sand-Jensen#§, K.1, Pedersen#§, O.1 11
12
* contributed equally 13
§ contributed equally 14
# Corresponding author (s) 15
16
1 University of Copenhagen; 2 Arizona State University; 3 University of Oulu; 4 Aarhus 17
University; 5 Universität Duisburg Essen; 6 Environment Canada; 7 Swedish University of 18
Agricultural Sciences; 8 Estonian University of Life Sciences; 9 Poznán University of Life 19
Sciences; 10 Finnish Environment Institute; 11 Norwegian Institute for Water Research; 12 20
University of Illinois; 13 United Nations Environmental Program; 14 Centre for Ecology & 21
Hydrology 22
2
ABSTRACT 23
Unlike land plants, photosynthesis in many aquatic plants relies on bicarbonate in addition to 24
CO2 to compensate for the low diffusivity and potential depletion of CO2 in water. 25
Concentrations of bicarbonate and CO2 vary greatly with catchment geology. Here we 26
investigate whether there is a link between these concentrations and the frequency of freshwater 27
plants possessing the bicarbonate use trait. We show, globally, that the frequency of plant species 28
with this trait increases with bicarbonate concentration. Regionally however, the frequency of 29
bicarbonate use is reduced at sites where the CO2 concentration is substantially above air-30
equilibrium consistent with this trait being an adaptation to carbon limitation. Future 31
anthropogenic changes of bicarbonate and CO2 concentration may alter the species composition 32
of freshwater plant communities. 33
34
MAIN TEXT 35
The biogeography of terrestrial plants is influenced by climatic factors; primarily air temperature 36
and precipitation (1). Furthermore, the distribution of biochemical traits such as the two 37
terrestrial CO2 concentrating mechanisms, C4 photosynthesis and Crassulacean Acid 38
Metabolism, are linked to temperature and water availability (2). Although freshwater 39
angiosperms evolved from terrestrial ancestors (3), their growth is controlled by light, nutrients 40
and inorganic carbon (4) rather than water, and therefore the factors influencing their 41
biogeography is likely to be different. Inorganic carbon potentially limits photosynthesis in 42
aquatic systems, because the diffusion of CO2 is 104-fold lower in water than in air. 43
Consequently, the CO2 concentration needed to saturate photosynthesis is up to 12 times the air 44
3
equilibrium concentration (5). Moreover, rapid photosynthesis can reduce CO2 in water 45
substantially below air saturation (4). 46
47
In response to carbon limitation, a few aquatic angiosperms evolved the same CO2 concentrating 48
mechanisms found in their terrestrial ancestors, but the most frequent mechanism, found in about 49
half of studied submerged freshwater plants, is the exploitation of bicarbonate (HCO3-; (4,6)), 50
derived from mineral weathering of soils and rocks in the catchment. Bicarbonate is the 51
dominant form of inorganic carbon in fresh waters when pH is between ~6.3 and ~10.2, and its 52
concentration often exceeds that of CO2 by 10- to 100-fold (6). The ability to use bicarbonate is 53
present in most taxonomic groups and appears to have evolved independently in cyanobacteria, 54
eukaryotic algae and vascular aquatic plants (7). This shows the fundamental importance of 55
bicarbonate use to plant fitness (6); increase of photosynthesis, growth and primary productivity 56
at higher bicarbonate concentrations has been documented (8-10). However, bicarbonate use is 57
not ubiquitous, because it involves costs as well as benefits. Costs include energy since it is an 58
active process (11) and rates of photosynthesis at limiting concentrations of inorganic carbon are 59
greater in CO2 users than in bicarbonate users (5,12). Thus, where CO2 concentrations are 60
substantially above air saturation, as is often the case in streams, the benefit of bicarbonate use 61
will be reduced (13). Furthermore, obligate CO2 users can exploit alternative CO2 sources in the 62
air, lake sediment or in the water overlying the sediment (14), allowing continued photosynthesis 63
without the need to invest in mechanisms required for bicarbonate use. 64
65
We hypothesized that since limitation of photosynthesis by inorganic carbon supply is 66
widespread in freshwater plants, the relative concentration of bicarbonate and CO2 at a particular 67
4
site should determine the proportion of plants that are obligate CO2 users vs bicarbonate users. 68
Since geochemical catchment characteristics determine bicarbonate concentration, there should 69
be broad biogeographical patterns in the proportion of freshwater plants able to use bicarbonate 70
while at a smaller scale, both the CO2 and bicarbonate concentrations in lakes and streams might 71
structure the functional group composition. 72
73
To test these hypotheses, we generated a database of freshwater angiosperms and their ability to 74
use bicarbonate as an inorganic carbon source, based on data found in the literature. These were 75
complemented with new data we gathered on 35 species from mainly tropical regions where few 76
prior data existed (Table S1 and (15)). The resulting 131 species represent approximately 10% 77
of known species with a submerged life stage (16) and of these, 58 (44%) could use bicarbonate. 78
In order to quantify the distribution of bicarbonate users vs CO2 users, we used: i) approximately 79
1 million geo-referenced plant records; ii) global plant ecoregion species lists; and iii) 963 site 80
specific plant compositions from northern hemisphere lakes and streams (Fig. S1). In each of the 81
investigated 963 sites, plant composition was related to measured concentration of CO2 and 82
bicarbonate. The geo-referenced plant records and ecoregion species lists were linked to local 83
bicarbonate concentrations derived from a constructed global map of bicarbonate concentration 84
(Fig. S2 and (15)). 85
86
In the analyzed lake and stream sites, concentrations of both bicarbonate and CO2 affected the 87
occurrence of obligate CO2 users vs bicarbonate users, but differently within and between lakes 88
and streams (Fig. 1, and Fig. S3). The chance of observing a bicarbonate user in lakes and 89
streams correlated directly with concentrations of bicarbonate and CO2 (∆Habitat = -0.82 [-1.64; 90
5
0.01] (mean [95% confidence intervals]; ∆ represents the difference between streams and lakes 91
in parameter estimates at the log(odds) scale, Fig S3)), Fig. 1A). However, with increasing 92
bicarbonate concentrations, the likelihood of observing a bicarbonate user increased in lakes, but 93
not in streams (∆βBicarbonate = -0.82 [-1.10; -0.54] Fig. 1B; see (15) for an explanation of β). 94
Moreover, with an increase in CO2, the chance of observing a bicarbonate user decreased in both 95
habitat types (∆βCO2= -0.04 [-0.22; 0.13], Fig. 1C). The present study shows that the 96
concentration of bicarbonate has a different effect on the proportion of bicarbonate users in lakes 97
vs streams. Unlike in lakes, no relationship between bicarbonate availability and bicarbonate 98
users was found in streams. This upholds our hypothesis that where concentrations of CO2 are 99
high, the competitive advantage of using bicarbonate as a carbon source for photosynthesis will 100
be reduced even if bicarbonate is available. 101
102
Across global plant regions (17), the shifting proportions of bicarbonate users vs obligate CO2 103
users showed distinct spatial patterns (Fig. 2A). Compared to the overall mean, a higher 104
proportion of bicarbonate users was observed in Africa, temperate Asia, and the northern part of 105
North America (Fig. 2A). Globally, species utilizing bicarbonate were found in areas with higher 106
bicarbonate concentrations (bicarbonate users - CO2 users = 0.16 [0.02; 0.30] mM; Fig. 2C; see 107
Fig. 3 for a local example). The proportion of bicarbonate using species increased with 108
bicarbonate concentrations within ecoregions (β = 0.14 [0.05; 0.24], (mean [95% confidence 109
limits]), Fig. 2B). Because catchment geology and geological history shape the distribution of 110
lakes and rivers, as well as the bicarbonate concentrations in freshwater ecosystems (18,19), they 111
are the chief determinants of plant distribution in freshwaters. CO2 concentrations are largely 112
regulated by local CO2 supersaturated inflow (20) and ecosystem metabolism, making modeling 113
6
difficult at large spatial scales (19,21). Thus, future models of freshwater CO2 concentrations 114
may improve the prediction of plant distributions even further. Although global lake and river 115
data exist to some extent as annual means (22), given the temporal variability in CO2 116
concentration, the appropriate concentration would be that during the growing season at the 117
specific site (20). 118
119
Anthropogenic changes as a consequence of deforestation, cultivation of land, application of 120
nitrate fertilizers and reduced atmospheric acid deposition (23) are causing large scale increases 121
in bicarbonate concentrations (24,25). The observed increasing bicarbonate concentrations are 122
expected to cause a severe impact on bicarbonate poor lakes, because higher bicarbonate 123
concentrations will markedly change species composition (26) by allowing tall, fast growing 124
bicarbonate users to colonize and suppress smaller species adapted to the use of CO2 alone in or 125
near the sediment (27). There is evidence for re-establishment of species that are able to use 126
bicarbonate, after bicarbonate has increased because of liming (28) or as a result of reduction in 127
acid deposition (29). Moreover, systematic changes in species composition caused by changes in 128
CO2 concentration has also been demonstrated in a river system where the proportion of CO2 129
users declined as CO2 decreased downstream (13). In contrast, increasing atmospheric CO2 130
concentrations, even if they influence dissolved CO2, will have little effect on the abundance of 131
bicarbonate users, since increases in CO2 will be small relative to bicarbonate concentrations and 132
will have little effect on plant photosynthesis rate (30). 133
134
Our study shows that bicarbonate use by aquatic angiosperms is widespread in fresh waters 135
around the globe, and that the proportion of obligate CO2 users to bicarbonate users is 136
7
significantly related to the bicarbonate concentration. Among terrestrial plants, the evolution of 137
leaf traits and different photosynthetic pathways that enable rapid carbon assimilation and 138
improved water economy (31) has resulted in global biogeographical patterns that are linked to 139
variations in climate (32,33). In contrast, for freshwater plants, we show that biogeographical 140
patterns of bicarbonate use exist and that these are caused by catchment properties that determine 141
the concentration of bicarbonate and CO2. This insight will help evaluate the repercussions of 142
future changes in concentration of bicarbonate and CO2 on the biodiversity and ecosystem 143
function for fresh waters. 144
145
REFERENCES AND NOTES 146 147 1. M. C. Peel, B. L. Finlayson, T. A. McMahon, Updated world map of the Köppen-Geiger 148
climate classification. Hydro. Earth Syst. Sci. Discus. 4, 439-473 (2007). 149 2. C. J. Still, J. A. Berry, G. J. Collatz, R. S. DeFries, Global distribution of C3 and C4 150
vegetation: carbon cycle implications. Global Biogeochem. Cycles 17, 6-1 (2003). 151 3. D. H. Les, N. P. Tippery, In time and with water ... the systematics of alismatid 152
monocotyledons. Early Events Monocot Evol. 83, 118-164 (2013). 153 4. T. V. Madsen, S. C. Maberly, Diurnal variation in light and carbon limitation of 154
photosynthesis by two species of submerged freshwater macrophyte with a differential 155 ability to use bicarbonate. Freshw. Biol. 26, 175-187 (1991). 156
5. S. C. Maberly, T. V. Madsen, Affinity for CO2 in relation to the ability of freshwater 157 macrophytes to use HCO3
-. Func. Ecol. 12, 99-106 (1998). 158 6. S. C. Maberly, B. Gontero, Ecological imperatives for aquatic CO2-concentrating 159
mechanisms. J. Exp. Bot. 68, 3797-3814 (2017). 160 7. M. Giordano, J. Beardall, J. A. Raven, CO2 concentrating mechanisms in algae: 161
mechanisms, environmental modulation, and evolution. Annu. Rev. Plant Biol. 56, 99-162 131 (2005). 163
8. K. Sand-Jensen, H. Frost-Christensen, Photosynthesis of amphibious and obligately 164 submerged plants in CO2-rich lowland streams. Oecologia 117, 31-39 (1998). 165
9. M. R. Andersen, T. Kragh, K. Sand-Jensen, Extreme diel oxygen and carbon cycles in 166 shallow vegetated lakes. Proc. R. Soc. B Biol. Sci. 284, 20171427 (2017). 167
10. T. V. Madsen, K. Sand-Jensen, Photosynthetic capacity, bicarbonate affinity and growth 168 of Elodea canadensis exposed to different concentrations of inorganic carbon. Oikos 50, 169 176-182 (1987). 170
11. J. A. Raven, J. Beardall, M. Giordano, Energy costs of carbon dioxide concentrating 171 mechanisms in aquatic organisms. Photosynth. Res. 121, 111-124 (2014). 172
8
12. T. V. Madsen, S. C. Maberly, High internal resistance to CO2 uptake by submerged 173 macrophytes that use HCO3
-: measurements in air, nitrogen and helium. Photosynth. 174 Res. 77, 183-190 (2003). 175
13. S. C. Maberly, S. A. Berthelot, A. W. Stott, B. Gontero, Adaptation by macrophytes to 176 inorganic carbon down a river with naturally variable concentrations of CO2. J. Plant. 177 Physiol. 172, 120-127 (2015). 178
14. T. V. Madsen, K. Sand-Jensen, Photosynthetic carbon assimilation in aquatic 179 macrophytes. Aquat. Bot. 41, 5-40 (1991). 180
15. See supplementary materials. 181 16. K. Murphy et al., World distribution, diversity and endemism of aquatic macrophytes. 182
Aquat. Bot. 158, 103127 (2019). 183 17. R. K. Brummitt, F. Pando, S. Hollis, N. A. Brummitt, World geographical scheme for 184
recording plant distributions. (International Working Group on Taxonomic Databases for 185 Plant Sciences (TDWG …, 2001). 186
18. R. Lauerwald, J. Hartmann, N. Moosdorf, S. Kempe, P. A. Raymond, What controls the 187 spatial patterns of the riverine carbonate system?—A case study for North America. 188 Chem. Geol. 337, 114-127 (2013). 189
19. R. Marcé et al., Carbonate weathering as a driver of CO2 supersaturation in lakes. Nat. 190 Geosci. 8, 107-111 (2015). 191
20. S. C. Maberly, P. A. Barker, A. W. Stott, M. M. De Ville, Catchment productivity controls 192 CO2 emissions from lakes. Nat. Clim. Change 3, 391 (2013). 193
21. L. J. Tranvik et al., Lakes and reservoirs as regulators of carbon cycling and climate. 194 Limnol. Oceanogr. 54, 2298-2314 (2009). 195
22. P. A. Raymond et al., Global carbon dioxide emissions from inland waters. Nature 503, 196 355 (2013). 197
23. P. A. Raymond, S. K. Hamilton, Anthropogenic influences on riverine fluxes of dissolved 198 inorganic carbon to the oceans. Limnol. Oceanogr. Let. 3, 143-155 (2018). 199
24. P. A. Raymond, N.-H. Oh, R. E. Turner, W. Broussard, Anthropogenically enhanced fluxes 200 of water and carbon from the Mississippi River. Nature 451, 449 (2008). 201
25. J. L. Stoddard et al., Regional trends in aquatic recovery from acidification in North 202 America and Europe. Nature 401, 575 (1999). 203
26. O. Vestergaard, K. Sand-Jensen, Alkalinity and trophic state regulate aquatic plant 204 distribution in Danish lakes. Aquat. Bot. 67, 85-107 (2000). 205
27. K. Sand-Jensen, M. Sondergaard, Phytoplankton and epiphyte development and their 206 shading effect on submerged macrophytes in lakes of different nutrient status. 207 Internationale Revue Der Gesamten Hydrobiologie 66, 529-552 (1981). 208
28. T. E. Brandrud, Effects of liming on aquatic macrophytes, with emphasis on Scandinavia. 209 Aquat. Bot. 73, 395-404 (2002). 210
29. D. T. Monteith et al., Biological responses to the chemical recovery of acidified fresh 211 waters in the UK. Environ. Pollut. 137, 83-101 (2005). 212
30. G. Bowes, Facing the inevitable: plants and increasing atmospheric CO2. Annu. Rev. Plant 213 Biol. 44, 309-332 (1993). 214
31. I. J. Wright et al., The worldwide leaf economics spectrum. Nature 428, 821-827 (2004). 215
9
32. H. Lambers, F. S. Chapin Iii, T. L. Pons, Plant physiological ecology. (Springer Science & 216 Business Media, 2008). 217
33. I. J. Wright et al., Global climatic drivers of leaf size. Science 357, 917-921 (2017). 218 34. R. Smart, J. Barko, Laboratory culture of submersed freshwater macrophytes on natural 219
sediments. Aquat. Bot. 21, 251-263 (1985). 220 35. S. C. Maberly, D. H. N. Spence, Photosynthetic inorganic carbon use by freshwater 221
plants. J. Ecol. 71, 705-724 (1983). 222 36. T. Hengl et al., SoilGrids250m: Global gridded soil information based on machine 223
learning. PLoS one 12, e0169748 (2017). 224 37. R. M. Newton, J. Weintraub, R. April, The relationship between surface water chemistry 225
and geology in the North Branch of the Moose River. Biogeochem. 3, 21-35 (1987). 226 38. A. Zeileis, F. Cribari-Neto, B. Grün, I. Kos-midis, Beta regression in R. J. Stat. Soft. 34, 1-24 227
(2010). 228 39. M. Van Kleunen et al., Global exchange and accumulation of non-native plants. Nature 229
525, 100 (2015). 230 40. J. Alahuhta et al., Global variation in the beta diversity of lake macrophytes is driven by 231
environmental heterogeneity rather than latitude. J. Biogeogr. 44, 1758-1769 (2017). 232 41. L. Baastrup‐Spohr, K. Sand‐Jensen, S. C. H. Olesen, H. H. Bruun, Recovery of lake 233
vegetation following reduced eutrophication and acidification. Freshw. Biol. 62, 1847-234 1857 (2017). 235
42. S. J. Moe, A. Schmidt-Kloiber, B. J. Dudley, D. Hering, The WISER way of organising 236 ecological data from European rivers, lakes, transitional and coastal waters. Hydrobiol. 237 704, 11-28 (2013). 238
43. T. Riis, K. Sand-Jensen, O. Vestergaard, Plant communities in lowland Danish streams: 239 species composition and environmental factors. Aquat. Bot. 66, 255-272 (2000). 240
44. M. T. Furse et al., The ecological status of European rivers: evaluation and 241 intercalibration of assessment methods. (Springer Science & Business Media, 2009), vol. 242 188. 243
45. S. Birk, N. Willby, Towards harmonization of ecological quality classification: establishing 244 common grounds in European macrophyte assessment for rivers. Hydrobiol. 652, 149-245 163 (2010). 246
46. E. Lewis, D. Wallace, L. J. Allison, "Program developed for CO2 system calculations," 247 (Brookhaven National Lab., Dept. of Applied Science, Upton, NY, 1998). 248
47. D. N. Karger et al., Climatologies at high resolution for the earth’s land surface areas. Sci. 249 Data 4, 170122 (2017). 250
48. J. E. Titus, A. M. Pagano, Carbon dioxide and submersed macrophytes in lakes: linking 251 functional ecology to community composition. Ecology 98, 3096-3105 (2017). 252
49. S. N. Wood, Generalized additive models: an introduction with R. (Chapman and 253 Hall/CRC, 2017). 254
50. J. Heino, J. Alahuhta, S. Fattorini, Phylogenetic diversity of regional beetle faunas at high 255 latitudes: patterns, drivers and chance along ecological gradients. Biodivers. Conserv. 24, 256 2751-2767 (2015). 257
51. O. Schweiger, S. Klotz, W. Durka, I. Kühn, A comparative test of phylogenetic diversity 258 indices. Oecologia 157, 485-495 (2008). 259
10
52. K. R. Clarke, R. M. Warwick, A taxonomic distinctness index and its statistical properties. 260 J. Appl. Ecol. 35, 523-531 (1998). 261
53. L. Adamec, Mineral nutrition of carnivorous plants: A review. Bot. Rev. 63, 273-299 262 (1997). 263
54. K. Sand-Jensen, M. F. Pedersen, S. L. Nielsen, Photosynthetic use of inorganic carbon 264 among primary and secondary water plants in streams. Freshw. Biol. 27, 283-293 (1992). 265
55. L. Yin, W. Li, T. V. Madsen, S. C. Maberly, G. Bowes, Photosynthetic inorganic carbon 266 acquisition in 30 freshwater macrophytes. Aquat. Bot. 140, 48-54 (2017). 267
56. E. L. Smith, The influence of light and carbon dioxide on photosynthesis. J. Gen. Phys. 20, 268 807-830 (1937). 269
57. S. C. Maberly, T. V. Madsen, Freshwater angiosperm carbon concentrating mechanisms: 270 processes and patterns. Funct. Plant Biol. 29, 393-405 (2002). 271
58. J. E. Keeley, Photosynthetic pathway diversity in a seasonal pool community. Func. Ecol. 272 13, 106-118 (1999). 273
59. J. R. Newman, J. A. Raven, Photosynthetic carbon assimilation by Crassula helmsii. 274 Oecologia 101, 494-499 (1995). 275
60. S. A. Pierini, S. M. Thomaz, Effects of inorganic carbon source on photosynthetic rates of 276 Egeria najas Planchon and Egeria densa Planchon (Hydrocharitaceae). Aquat. Bot. 78, 277 135-146 (2004). 278
61. J. T. Bain, M. C. F. Proctor, The requirement of aquatic bryophytes for free CO2 as an 279 inorganic carbon source: some experimental evidence. New Phytol. 86, 393-400 (1980). 280
62. D. R. Webb, M. R. Rattray, J. M. A. Brown, A preliminary survey for crassulacean acid 281 metabolism (CAM) in submerged aquatic macrophytes in New Zealand. N. Z. J. Mar. 282 Freshw. Res. 22, 231-235 (1988). 283
63. T. V. Madsen, S. C. Maberly, G. Bowes, Photosynthetic acclimation of submersed 284 angiosperms to CO2 and HCO3
-. Aquat. Bot. 53, 15-30 (1996). 285 64. J. I. Jones, J. Eaton, K. Hardwick, Physiological plasticity in Elodea nuttallii (Planch.) St. 286
John. J. Aquat. Plant Man. 31, 88-88 (1993). 287 65. H. L. Boston, M. S. Adams, T. P. Pienkowski, Utilization of sediment CO2 by selected 288
North American isoetids. Ann. Bot. 60, 485-494 (1987). 289 66. A. M. Farmer, D. H. N. Spence, Studies of diurnal acid fluctuations in British isoetid-type 290
submerged aquatic macrophytes. Ann. Bot. 56, 347-350 (1985). 291 67. J. A. Raven et al., The role of CO2 uptake by roots and CAM in acquiaition of inorganic C 292
by plants of the isoetid life-form - a review, with new data on Eriocaulon decangulare L 293 New Phytol. 108, 125-148 (1988). 294
68. T. K. Van, W. T. Haller, G. Bowes, Comparison of the photosynthetic characteristics of 295 three submersed aquatic plants. Plant Physiol. 58, 761-768 (1976). 296
69. M. E. Salvucci, G. Bowes, Induction of reduced photorespiratory activity in submersed 297 and amphibious aquatic macrophytes. Plant Physiol. 67, 335-340 (1981). 298
70. W. Spencer, G. Bowes, Limnophila and Hygrophila: a review and physiological 299 assessment of their weed potential in Florida. J. Aquat. Plant Man. 23, 7-16 (1985). 300
71. D. H. N. Spence, S. C. Maberly, in Carbon uptake by aquatic photosynthetic organisms, 301 W. J. Lucas, J. L. Berry, Eds. (American Society of Plant Physiologists, Rockville, 1985), pp. 302 125-143. 303
11
72. S. Wium-Andersen, Photosynthetic uptake of free CO2, by the roots of Lobelia 304 dortmanna. Physiol. Plant. 25, 245-248 (1971). 305
73. H. B. A. Prins, J. F. H. Snel, R. J. Helder, P. E. Zanstra, Photosynthetic HCO3− utilization 306
and OH− excretion in aquatic angiosperms: light-induced pH changes at the leaf surface. 307 Plant Physiol. 66, 818-822 (1980). 308
74. B. Hyldgaard, H. Brix, Plasticity in carbon acquisition of the heterophyllous Luronium 309 natans: An endangered freshwater species in Europe. Aquat. Bot. 94, 127-133 (2011). 310
75. P. T. Orr, J. Pokorný, P. Denny, P. J. M. Sale, Photosynthetic response of Myriophyllum 311 salsugineum A.E. Orchard to photon irradiance, temperature and external free CO2. 312 Aquat. Bot. 30, 363-378 (1988). 313
76. J. E. Keeley, D. R. Sandquist, Carbon: freshwater plants. Plant Cell Environ. 15, 1021-1035 314 (1992). 315
77. Y. Zhang et al., Biochemical and biophysical CO2 concentrating mechanisms in two 316 species of freshwater macrophyte within the genus Ottelia (Hydrocharitaceae). 317 Photosynth. Res. 121, 285-297 (2014). 318
78. Y. Kadono, Photosynthetic carbon sources in some Potamogeton species. Bot. Mag. 93, 319 185-194 (1980). 320
79. A. J. M. Smits, M. J. H. De Lyon, G. Van Der Velde, P. L. M. Steentjes, J. G. M. Roelofs, 321 Distribution of three nymphaeid macrophytes (Nymphaea alba L., Nuphar lutea (L.) Sm. 322 and Nymphoides peltata (Gmel.) O. Kuntze) in relation to alkalinity and uptake of 323 inorganic carbon. Aquat. Bot. 32, 45-62 (1988). 324
80. M. Bodner, Inorganic carbon source for photosynthesis in the aquatic macrophytes 325 Potamogeton natans and Ranunculus fluitans. Aquat. Bot. 48, 109-120 (1994). 326
81. E. D. Allen, D. H. N. Spence, The differential ability of aquatic plants to utilize the 327 inorganic carbon supply in fresh waters. New Phytol. 87, 269-283 (1981). 328
82. P. Denny, D. C. Weeks, Effects of light and bicarbonate on membrane potential in 329 Potamogeton schweinfurthii (Benn.). Ann. Bot. 34, 483-496 (1970). 330
83. J. M. Bristow, The effects of carbon dioxide on the growth and development of 331 amphibious plants. Can. J. Bot. 47, 1803-1807 (1969). 332
84. J. A. Raven, A. M. Johnston, J. R. Newman, C. M. Scrimgeour, Inorganic carbon 333 acquisition by aquatic photolithoatrophs of the Dighty Burn, Angus, U.K.: uses and 334 limitations of natural abundance measurements of carbon isotopes. New Phytol. 127, 335 271-286 (1994). 336
85. S. Beer, R. G. Wetzel, Photosynthetic carbon metabolism in the submerged aquatic 337 angiosperm Scirpus subterminalis. Plant Sci. Let. 21, 199-207 (1981). 338
86. H. B. A. Prins, M. B. de Guia, Carbon source of the water soldier, Stratiotes aloides L. 339 Aquat. Bot. 26, 225-234 (1986). 340
87. L. Adamec, Photosynthetic inorganic carbon use by aquatic carnivorous plants. Carn. 341 Plant Newsl., 50-53 (1995). 342
88. R. E. Moeller, Carbon-uptake by the submerged hydrophyte Utricularia purpurea. Aquat. 343 Bot. 5, 209-216 (1978). 344
89. J. E. Titus, W. H. Stone, Photosynthetic response of two submersed macrophytes to 345 dissolved inorganic carbon concentration and pH. Limnol. Oceanogr. 27, 151-160 (1982). 346
12
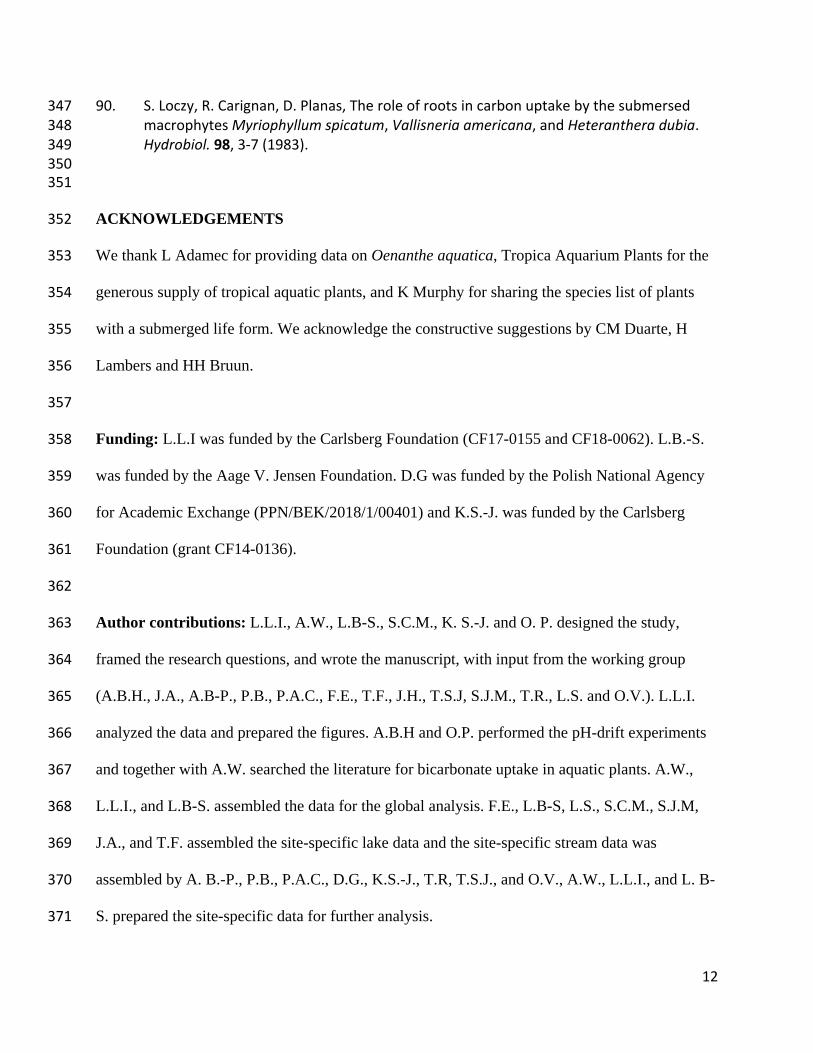
90. S. Loczy, R. Carignan, D. Planas, The role of roots in carbon uptake by the submersed 347 macrophytes Myriophyllum spicatum, Vallisneria americana, and Heteranthera dubia. 348 Hydrobiol. 98, 3-7 (1983). 349
350 351
ACKNOWLEDGEMENTS 352
We thank L Adamec for providing data on Oenanthe aquatica, Tropica Aquarium Plants for the 353
generous supply of tropical aquatic plants, and K Murphy for sharing the species list of plants 354
with a submerged life form. We acknowledge the constructive suggestions by CM Duarte, H 355
Lambers and HH Bruun. 356
357
Funding: L.L.I was funded by the Carlsberg Foundation (CF17-0155 and CF18-0062). L.B.-S. 358
was funded by the Aage V. Jensen Foundation. D.G was funded by the Polish National Agency 359
for Academic Exchange (PPN/BEK/2018/1/00401) and K.S.-J. was funded by the Carlsberg 360
Foundation (grant CF14-0136). 361
362
Author contributions: L.L.I., A.W., L.B-S., S.C.M., K. S.-J. and O. P. designed the study, 363
framed the research questions, and wrote the manuscript, with input from the working group 364
(A.B.H., J.A., A.B-P., P.B., P.A.C., F.E., T.F., J.H., T.S.J, S.J.M., T.R., L.S. and O.V.). L.L.I. 365
analyzed the data and prepared the figures. A.B.H and O.P. performed the pH-drift experiments 366
and together with A.W. searched the literature for bicarbonate uptake in aquatic plants. A.W., 367
L.L.I., and L.B-S. assembled the data for the global analysis. F.E., L.B-S, L.S., S.C.M., S.J.M, 368
J.A., and T.F. assembled the site-specific lake data and the site-specific stream data was 369
assembled by A. B.-P., P.B., P.A.C., D.G., K.S.-J., T.R, T.S.J., and O.V., A.W., L.L.I., and L. B-370
S. prepared the site-specific data for further analysis. 371

13
372
Competing interests: The authors declare no competing interests. 373
374
Data availability: All R scripts and cleaned datasets used for this analysis are available at the 375
Dryad Digital Repository. 376
14
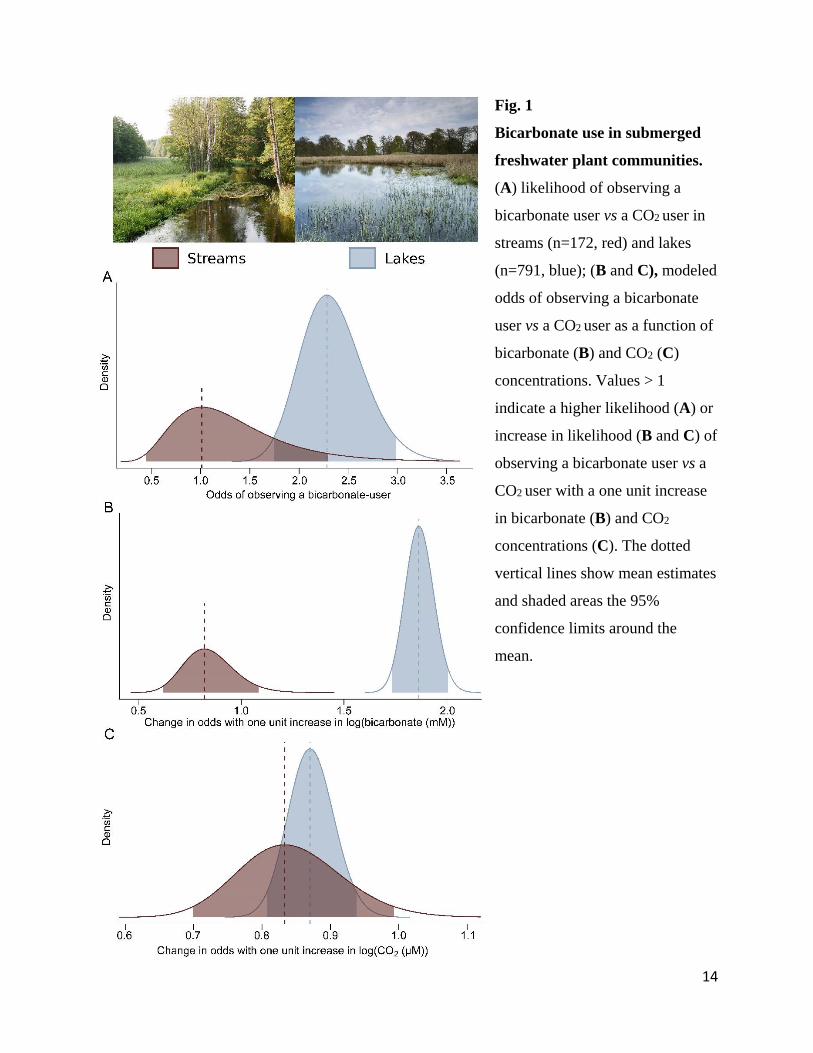
Fig. 1 377
Bicarbonate use in submerged 378
freshwater plant communities. 379
(A) likelihood of observing a 380
bicarbonate user vs a CO2 user in 381
streams (n=172, red) and lakes 382
(n=791, blue); (B and C), modeled 383
odds of observing a bicarbonate 384
user vs a CO2 user as a function of 385
bicarbonate (B) and CO2 (C) 386
concentrations. Values > 1 387
indicate a higher likelihood (A) or 388
increase in likelihood (B and C) of 389
observing a bicarbonate user vs a 390
CO2 user with a one unit increase 391
in bicarbonate (B) and CO2 392
concentrations (C). The dotted 393
vertical lines show mean estimates 394
and shaded areas the 95% 395
confidence limits around the 396
mean. 397
398 399 400 401 402 403 404 405 406 407 408 409 410 411 412
15
413
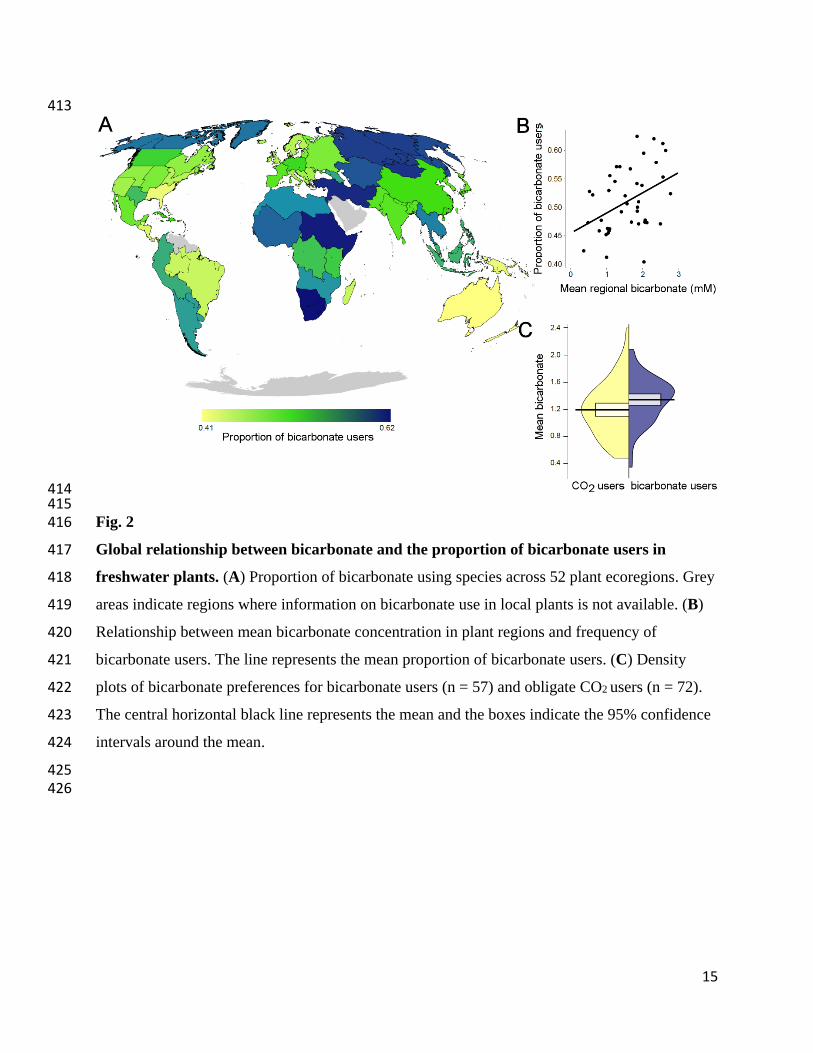
414 415 Fig. 2 416
Global relationship between bicarbonate and the proportion of bicarbonate users in 417
freshwater plants. (A) Proportion of bicarbonate using species across 52 plant ecoregions. Grey 418
areas indicate regions where information on bicarbonate use in local plants is not available. (B) 419
Relationship between mean bicarbonate concentration in plant regions and frequency of 420
bicarbonate users. The line represents the mean proportion of bicarbonate users. (C) Density 421
plots of bicarbonate preferences for bicarbonate users (n = 57) and obligate CO2 users (n = 72). 422
The central horizontal black line represents the mean and the boxes indicate the 95% confidence 423
intervals around the mean. 424
425 426
16
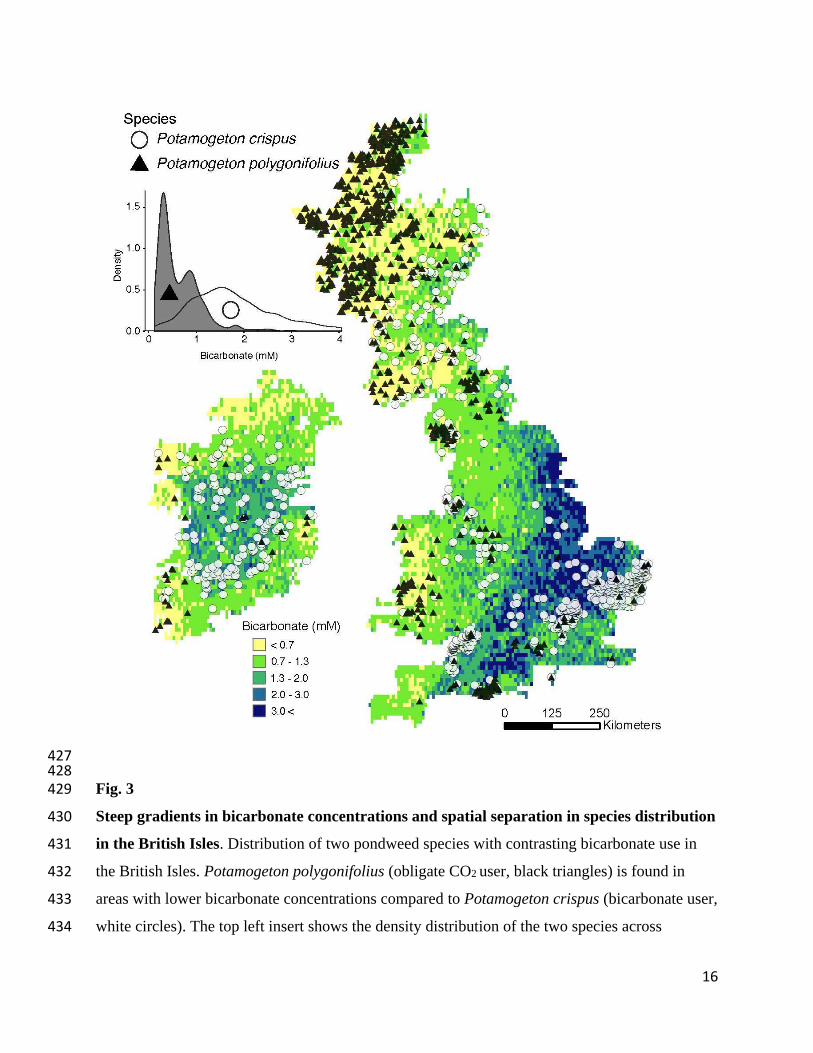
427 428 Fig. 3 429
Steep gradients in bicarbonate concentrations and spatial separation in species distribution 430
in the British Isles. Distribution of two pondweed species with contrasting bicarbonate use in 431
the British Isles. Potamogeton polygonifolius (obligate CO2 user, black triangles) is found in 432
areas with lower bicarbonate concentrations compared to Potamogeton crispus (bicarbonate user, 433
white circles). The top left insert shows the density distribution of the two species across 434
17
bicarbonate concentrations. Bicarbonate concentrations are from the global bicarbonate map 435
(Fig. S2) and species data were extracted from the geo-referenced plant occurrences (15). 436
437
Supplementary Materials 438
Materials and Methods (15). 439
References (34-90). 440
Fig. S1 - Site-specific observations of bicarbonate use. 441
Fig. S2 - Global bicarbonate map. 442
Fig. S3 - The probability of observing bicarbonate use in a species at 963 study sites. 443
Fig. S4 - Overview of in situ lake bicarbonate measurements. 444
Fig. S5 - Variable importance plot of the Random Forest modelling global bicarbonate 445
concentrations. 446
Fig. S6 - Partial dependence plots of the eight variables used to model global bicarbonate 447
concentrations. 448
Fig. S7 - Histogram of taxonomic distinctness for 1000 random subsamples of a fixed number of 449
131 species drawn from a common species pool. 450
Table S1 - List of freshwater angiosperms and their trait of inorganic carbon use. 451
452 453
18
Supplementary Materials for
Catchment properties and the photosynthetic trait composition of freshwater plant communities
P Iversen, L. L., Winkel, A., Baastrup-Spohr, L., Hinke, A. B., Alahuhta, J., Baattrup-Pedersen, A., Birk, S., Brodersen, P., Chambers, P A., Ecke, F., Feldmann, T., Gebler, D., Heino, J., Jespersen, T
S., Moe, S J., Riis, T, Sass, L., Vestergaard, O., Maberly, S C., Sand-Jensen, K., Pedersen, O.
Correspondence to: [email protected], [email protected] or [email protected] This PDF file includes:
Materials and Methods Figs. S1 to S7 Table S1
Other Supplementary Materials for this manuscript include the following:
Data S1 All R scripts and cleaned datasets used for this analysis are available at the Dryad Digital Repository.
19
Materials and Methods
Traits of inorganic carbon use in aquatic plants
Information on species ability to use bicarbonate was collected from the literature and ex-situ pH
drift experiments. A comprehensive scientific literature search was conducted in order to identify
and collect data on inorganic carbon use of aquatic angiosperms, resulting in the identification of
104 species with validated information. Nomenclature follows a sensu plant list:
www.theplantlist.org.
Tropical plant species for experiments were received from an aquatic plant nursery (Tropica
Aquarium plants, Egå, Denmark). To ensure expression of bicarbonate use in species capable of
doing so, plants were acclimated for 14 days in water with a high bicarbonate concentration (2
mM HCO3 ) under air equilibrium of CO2 (~20 µM CO2) in a temperature controlled room (20
°C). To ensure temperature stability, each aquarium was equipped with a heating element and
temperature was increased to 23 °C (± 1). Temperature was logged using a HOBO
temperature/light sensor (HOBO Pendant, Onset Computer, Bourne, USA). The light regime was
12 h-light/12 h-darkness, with an average photon irradiance of 350 µmol photons m-2 s-1 (PAR)
provided by fluorescent tubes (Luminux cool daylight 39 W/865 HO, Osram GmbH, Munich,
Germany). Nine individual plants of each species were divided into three 30 L aquaria (three
plants in each). The medium was a modified Smart & Barko (34) solution with 75% KHCO3 and
25% NaHCO3 to ensure adequate potassium concentration. The medium was changed twice a
week. When possible, plants were kept in the pots with stone wool in which they had been grown
by the producer. When this was not possible, dependent on the plant morphology, plants were
either planted in sand (0.6-1 mm grain size) or weighed down using a ceramic ring. pH drift
experiments were used to identify the ability of plant species to use bicarbonate as a source of
inorganic carbon (35). The pH drift experiment relies on the fact that any carbon taken up by a
plant results in an increase in pH without influencing alkalinity. If pH increases to more than 9.4,
the species is classified as a bicarbonate user as almost no CO2 is available (< 1 µM at 20 °C and
with an alkalinity of 1 meq. L-1) and it is inferred that HCO3- is being used as a source of
inorganic carbon.
Leaf segments weighing 60 mg (± 5 mg) fresh mass were taken from the youngest fully
developed leaf and cleared of any present epiphytes. The incubation medium was the same as
that to which the plants had been acclimated (modified Smart & Barko solution, 2 mM HCO3-).
Oxygen concentration was reduced to 20% of air equilibrium by bubbling with N2 to avoid
photorespiration due to high O2 concentration from photosynthesis. Twenty-five ml glass vials,
containing two glass beads to ensure stirring, were used to incubate leaf tissue. Vials with leaves
were mounted on a vertically rotating wheel in a temperature controlled water bath at 25 °C for
17 hours with an average photon irradiance of 555 µmol photons m-2 s-1 (Phillips Master, TL-D,
18W/840, Phillips, AE Eindhoven, Holland) measured with a 4π sensor (US-SQS/L, Walz
GmbH, Effeltrich, Germany). After incubation, pH was measured with a pH electrode (403-
M8_s7/120. Rfill 9811, Mettler Toledo, Glostrup, Denmark; PHM 92, Radiometer, Brønshøj,
Denmark).
A global bicarbonate map
The global distribution of bicarbonate was estimated from existing global maps of runoff
accumulated freshwater alkalinity (19) and soil pH in water (36) (Fig. S2). This analytical
20
approach was chosen in order to match site-specific plant observations to local bicarbonate
concentrations. Given the heterogeneous distribution of specific habitats for each of our study
species, we expected that local bicarbonate concentration would be the product of downstream
routing of alkalinity through the watershed, and that local deviations from these accumulations
would have been caused by local soil properties (37). Based on one layer of accumulated
alkalinity (19) and seven layers of soil pH in water (cross section of standard depths 0, 5, 15, 30,
60, 100 and 200 cm; (36), we modelled 1806 site-specific measures of bicarbonate (gathered
from a global dataset; see Fig. S4). Given that bicarbonate typically accounts for >95% of
alkalinity in water (6), we used site-specific alkalinity as a proxy for bicarbonate concentration.
The 1806 in situ bicarbonate concentrations were derived from two data sources: The
GEMSTAT database (www.gemstat.org) and the WISE4 database of the European
Environmental Agency (https://www.eea.europa.eu/data-and-maps/data/waterbase-water-
quality). Following a previous study (6), we removed unrealistically high alkalinity values (> 5
meq. L-1) and calculated mean alkalinity per site. The global map of runoff accumulated
freshwater alkalinity (19) slightly underestimates high values of alkalinity, because it did not
account for concentrating mechanisms such as evaporation. To prevent violating the premises of
input data for the new bicarbonate map (Fig. S2), we excluded alkalinity values of more than 5
meq. L-1 from the site-specific data prior to analyses. Finally, we calculated mean values per site
for the subsequent analyses.
We used random forest models to model site-specific bicarbonate concentrations. Random forest
is a nonparametric, machine learning regression tree combining individual decision trees (in this
case, 500 trees) into a single ensemble model capable of fitting complex relationships with high
predictive performance (38). Our random forest model was built using empirical bicarbonate
measures as the response variable (to be modelled) and the corresponding values of the eight
global layers as predicting variables. Each random forest model was run with a fixed set of 500
trees and a flexible number of predictors tried at each node (value set to the number of predictors
divided by three). Consistency in error rates was visually inspected by plotting error rates against
the number of trees in the ensemble. Across all models, the error rate stabilized between 50 and
100 trees. Model performance was evaluated by randomly splitting the 1806 measures into a
training set (75%) and a test set (25%). The training data were used to build the model and the
test data as an “out-of-bag” sample to compare observed and predicted bicarbonate values. From
1000 repetitions, a mean Pearson product moment correlation (ppmc) coefficient between
observed and predicted bicarbonate was calculated for random forest models built on the runoff
accumulated alkalinity layer, the seven pH soil maps, and a combination of all layers. The
random forest model built on all eight layers produced the highest concordance between
observed and predicted bicarbonate values (mean ppmc 0.73, Fig. S2B) supporting the initial
inclusion of both accumulated runoff alkalinity and soil pH in the model. Alkalinity and lower
levels of soil pH had the highest contribution to the model (Fig. S5) increasing with increasing
bicarbonate concentrations (Fig. S6). Using the global coverage of the alkalinity and 7 soil pH
maps, and the random forest model, global measures of bicarbonate were predicted at a 1/16
degree spatial resolution reflecting the highest common resolution of the input data (Fig. S2A).
The global occurrence of bicarbonate users
Following recent global plant trait censuses (39), we used the world geographical scheme for
recording plant distributions (TDWG; 1) to map the occurrence of all 131 study species. For each
21
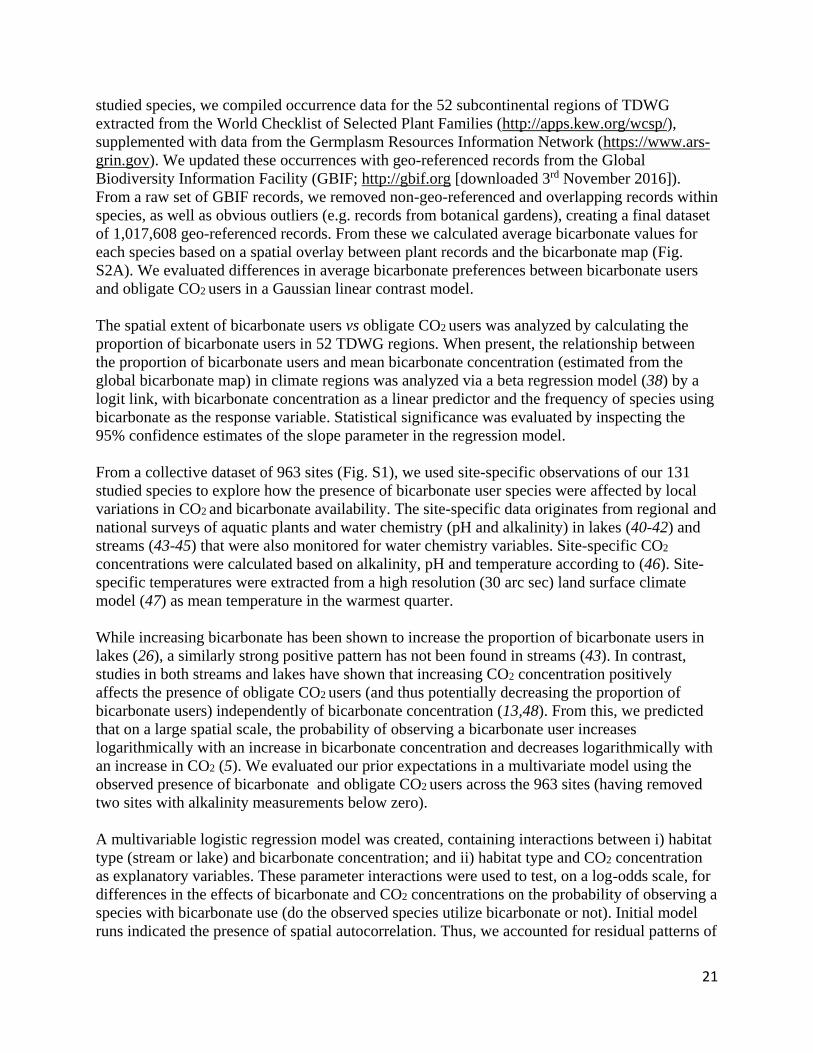
studied species, we compiled occurrence data for the 52 subcontinental regions of TDWG
extracted from the World Checklist of Selected Plant Families (http://apps.kew.org/wcsp/),
supplemented with data from the Germplasm Resources Information Network (https://www.ars-
grin.gov). We updated these occurrences with geo-referenced records from the Global
Biodiversity Information Facility (GBIF; http://gbif.org [downloaded 3rd November 2016]).
From a raw set of GBIF records, we removed non-geo-referenced and overlapping records within
species, as well as obvious outliers (e.g. records from botanical gardens), creating a final dataset
of 1,017,608 geo-referenced records. From these we calculated average bicarbonate values for
each species based on a spatial overlay between plant records and the bicarbonate map (Fig.
S2A). We evaluated differences in average bicarbonate preferences between bicarbonate users
and obligate CO2 users in a Gaussian linear contrast model.
The spatial extent of bicarbonate users vs obligate CO2 users was analyzed by calculating the
proportion of bicarbonate users in 52 TDWG regions. When present, the relationship between
the proportion of bicarbonate users and mean bicarbonate concentration (estimated from the
global bicarbonate map) in climate regions was analyzed via a beta regression model (38) by a
logit link, with bicarbonate concentration as a linear predictor and the frequency of species using
bicarbonate as the response variable. Statistical significance was evaluated by inspecting the
95% confidence estimates of the slope parameter in the regression model.
From a collective dataset of 963 sites (Fig. S1), we used site-specific observations of our 131
studied species to explore how the presence of bicarbonate user species were affected by local
variations in CO2 and bicarbonate availability. The site-specific data originates from regional and
national surveys of aquatic plants and water chemistry (pH and alkalinity) in lakes (40-42) and
streams (43-45) that were also monitored for water chemistry variables. Site-specific CO2
concentrations were calculated based on alkalinity, pH and temperature according to (46). Site-
specific temperatures were extracted from a high resolution (30 arc sec) land surface climate
model (47) as mean temperature in the warmest quarter.
While increasing bicarbonate has been shown to increase the proportion of bicarbonate users in
lakes (26), a similarly strong positive pattern has not been found in streams (43). In contrast,
studies in both streams and lakes have shown that increasing CO2 concentration positively
affects the presence of obligate CO2 users (and thus potentially decreasing the proportion of
bicarbonate users) independently of bicarbonate concentration (13,48). From this, we predicted
that on a large spatial scale, the probability of observing a bicarbonate user increases
logarithmically with an increase in bicarbonate concentration and decreases logarithmically with
an increase in CO2 (5). We evaluated our prior expectations in a multivariate model using the
observed presence of bicarbonate and obligate CO2 users across the 963 sites (having removed
two sites with alkalinity measurements below zero).
A multivariable logistic regression model was created, containing interactions between i) habitat
type (stream or lake) and bicarbonate concentration; and ii) habitat type and CO2 concentration
as explanatory variables. These parameter interactions were used to test, on a log‐odds scale, for
differences in the effects of bicarbonate and CO2 concentrations on the probability of observing a
species with bicarbonate use (do the observed species utilize bicarbonate or not). Initial model
runs indicated the presence of spatial autocorrelation. Thus, we accounted for residual patterns of
22
spatial autocorrelation by adding a two dimensional spherical spline based on geographic
coordinates in the model (49). Based on Moran’s I autocorrelation coefficient of the residual
outputs, the final model did not show any indications of spatial autocorrelation (observed
Moran’s I = -0.0026, Null expectation = -0.0001, P-value = 0.12). Statistical significance in the
final model was evaluated by inspecting the 95% confidence estimates of the slope parameter in
the regression model. Any significant interaction parameters would suggest different response to
CO2 or bicarbonate gradients between lakes and streams (16). Parameter estimates for lakes and
streams (as shown in Fig. 1) were derived from the full model estimates (Fig. S3) and shown as
odds and change in odds (Fig .1).
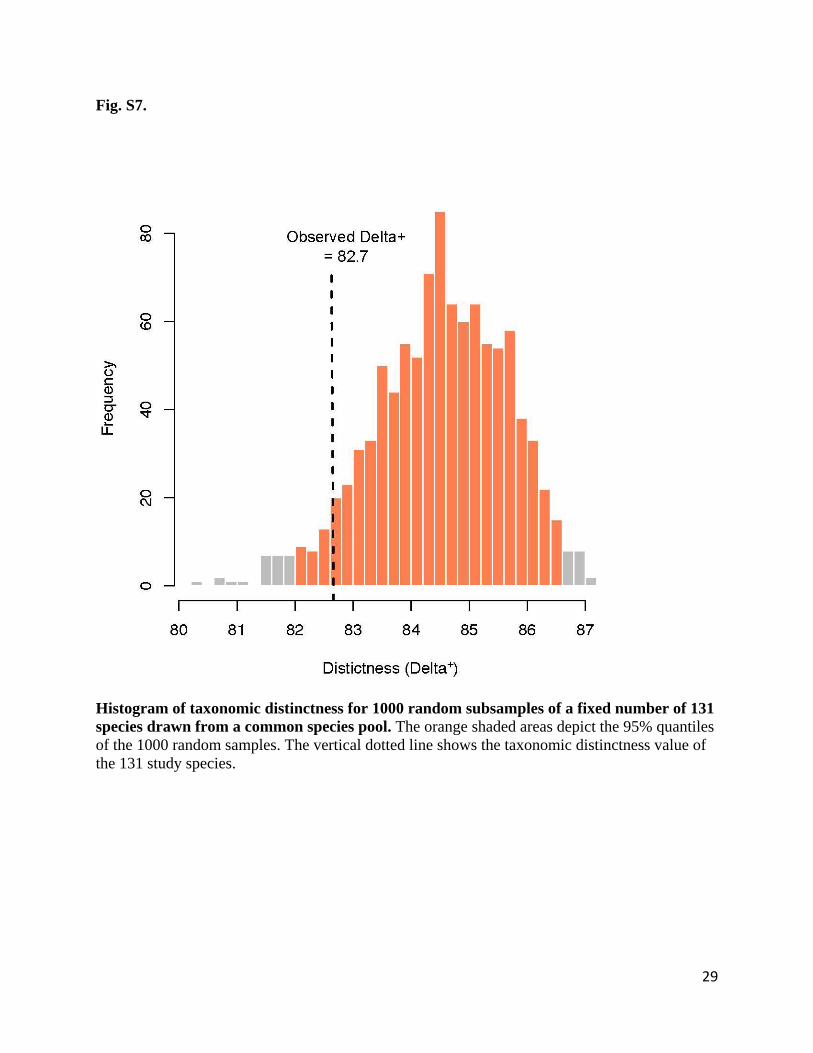
The 131 species with information about their bicarbonate use represent about 10% of the 1297
species known to have a predominantly fully submerged life stage (16), species list provided by
Kevin Murphy. Upscaling the results of this study would require the 131 species to consist of a
random sample from the phylogenetic tree of plants. We tested this assumption by comparing
our sample from the global list of 1297 species. Owing to lack of a true phylogeny of all aquatic
plants of the world, we used taxonomic hierarchies as a proxy for phylogenetic relationships; this
approach has been used in several studies dealing with phylogenetic diversity (e.g., 50,51). We
used Taxonomic Distinctness (TD), measuring the taxonomic distances between species in an
assemblage, as a proxy for phylogenetic diversity (52). We used equal branch lengths and four
taxonomic levels for the calculation of taxonomic distances between species: genus, family,
order, and class for all of the 1297 species. Following Clarke & Warwick (52), we compared the
observed TD with the values expected by randomly sampling 131 species from the entire species
pool of 1297. Accordance between our observed TD and the random estimates indicates that the
species included in our study represent a random taxonomic sample of the entire species pool.
The observed TD of our 131 study species (82.7) did not differ from what would be expected by
randomly selecting 131 species from the species pool (95% quantiles from 1000 simulations =
82.0-86.5, Fig. S7).
23
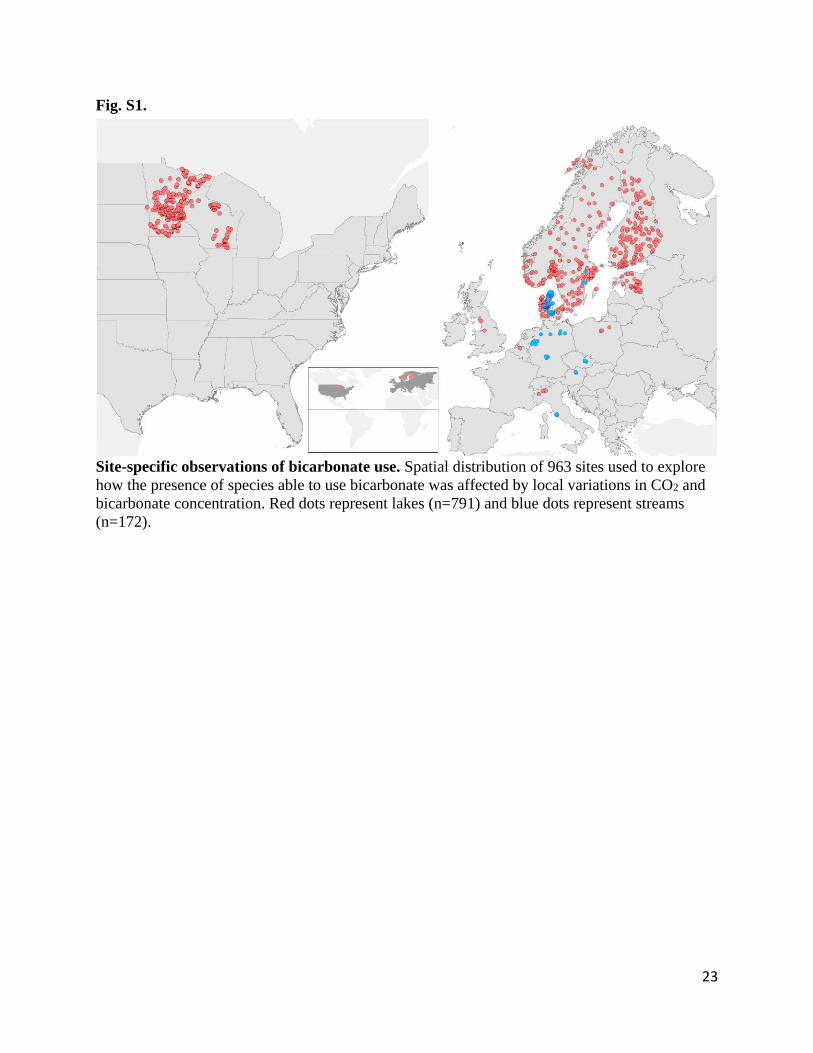
Fig. S1.
Site-specific observations of bicarbonate use. Spatial distribution of 963 sites used to explore
how the presence of species able to use bicarbonate was affected by local variations in CO2 and
bicarbonate concentration. Red dots represent lakes (n=791) and blue dots represent streams
(n=172).
24
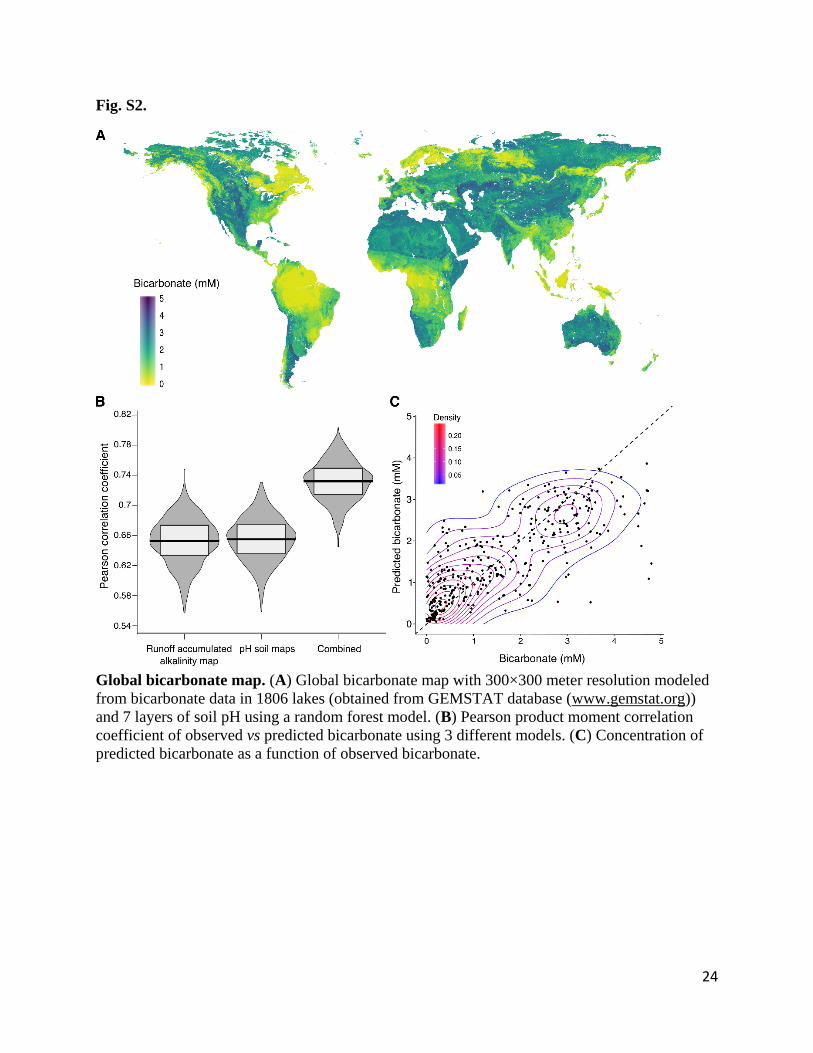
Fig. S2.
Global bicarbonate map. (A) Global bicarbonate map with 300×300 meter resolution modeled
from bicarbonate data in 1806 lakes (obtained from GEMSTAT database (www.gemstat.org))
and 7 layers of soil pH using a random forest model. (B) Pearson product moment correlation
coefficient of observed vs predicted bicarbonate using 3 different models. (C) Concentration of
predicted bicarbonate as a function of observed bicarbonate.
25
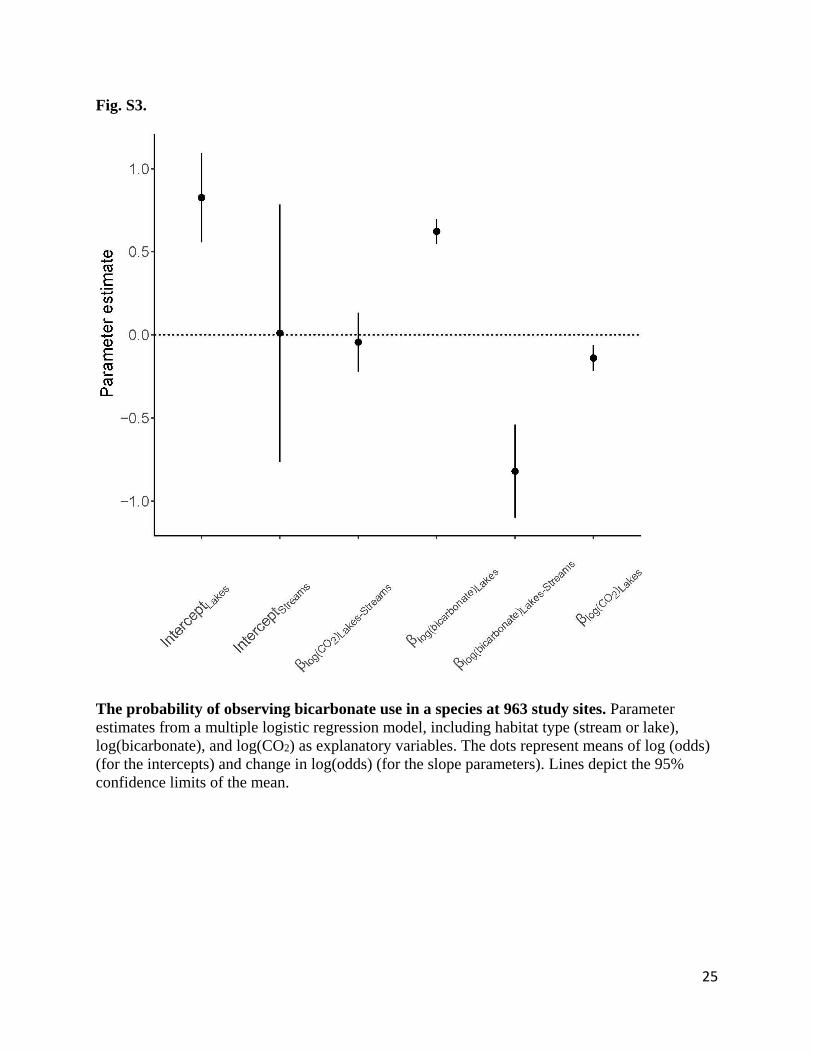
Fig. S3.
The probability of observing bicarbonate use in a species at 963 study sites. Parameter
estimates from a multiple logistic regression model, including habitat type (stream or lake),
log(bicarbonate), and log(CO2) as explanatory variables. The dots represent means of log (odds)
(for the intercepts) and change in log(odds) (for the slope parameters). Lines depict the 95%
confidence limits of the mean.
26
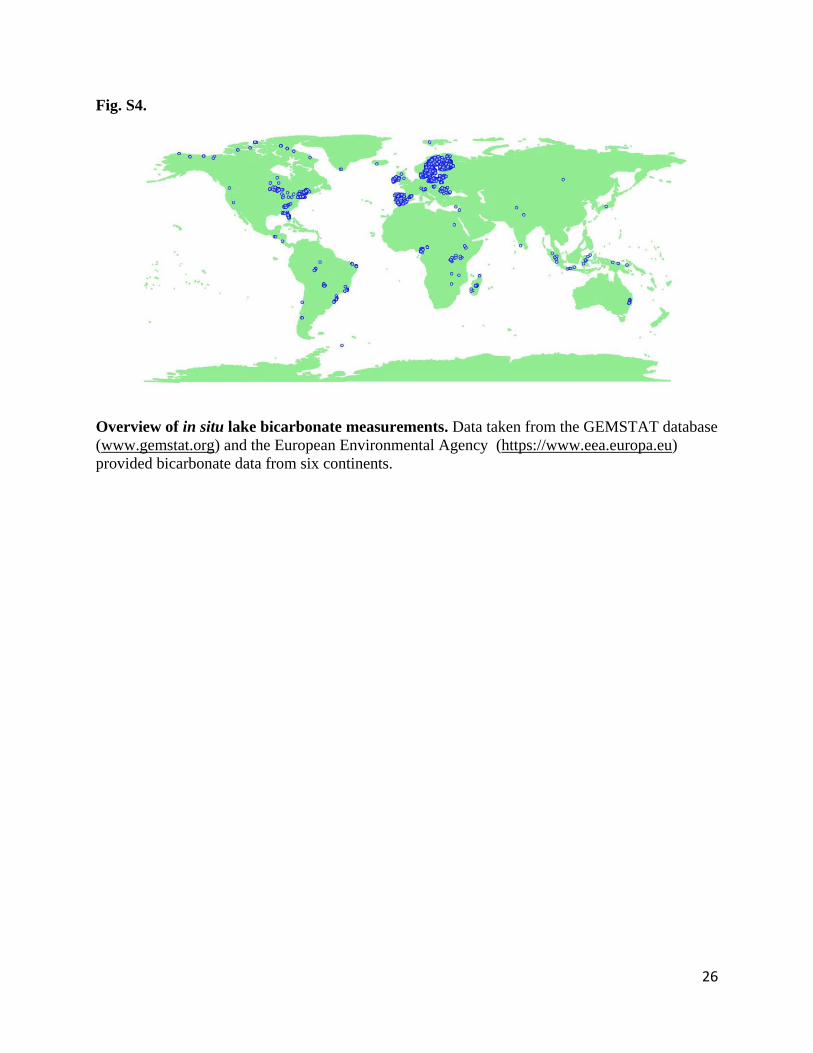
Fig. S4.
Overview of in situ lake bicarbonate measurements. Data taken from the GEMSTAT database
(www.gemstat.org) and the European Environmental Agency (https://www.eea.europa.eu)
provided bicarbonate data from six continents.
27
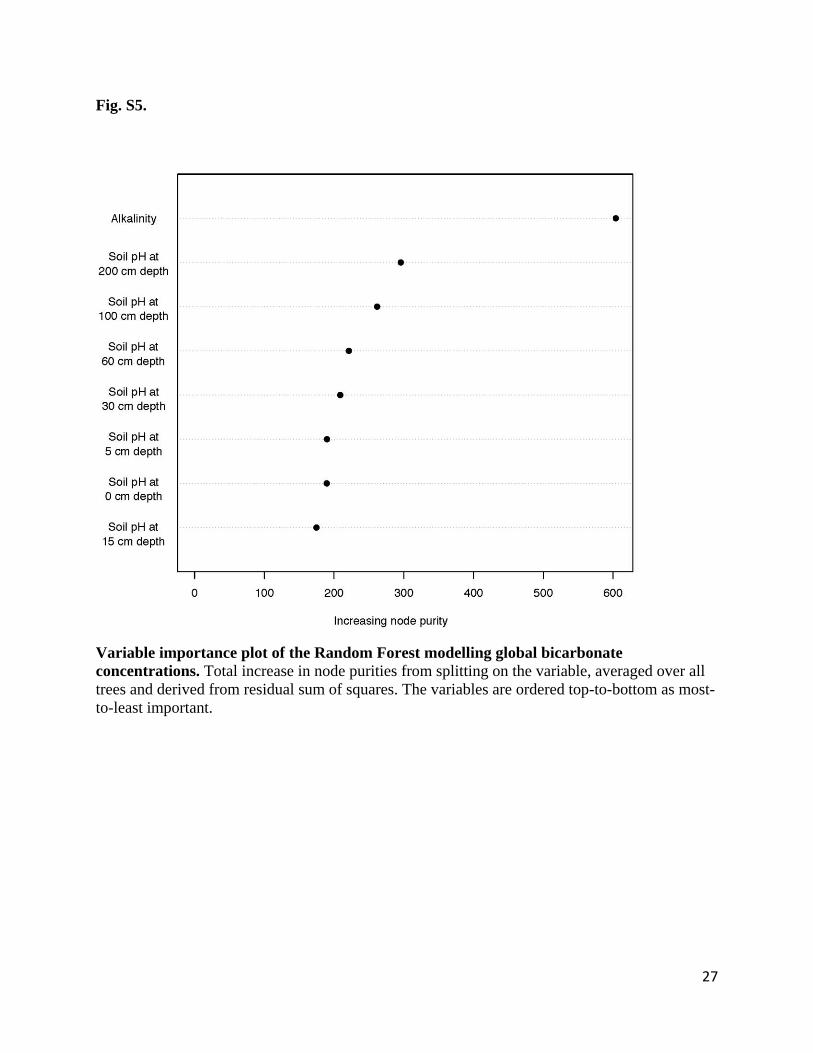
Fig. S5.
Variable importance plot of the Random Forest modelling global bicarbonate
concentrations. Total increase in node purities from splitting on the variable, averaged over all
trees and derived from residual sum of squares. The variables are ordered top-to-bottom as most-
to-least important.
28
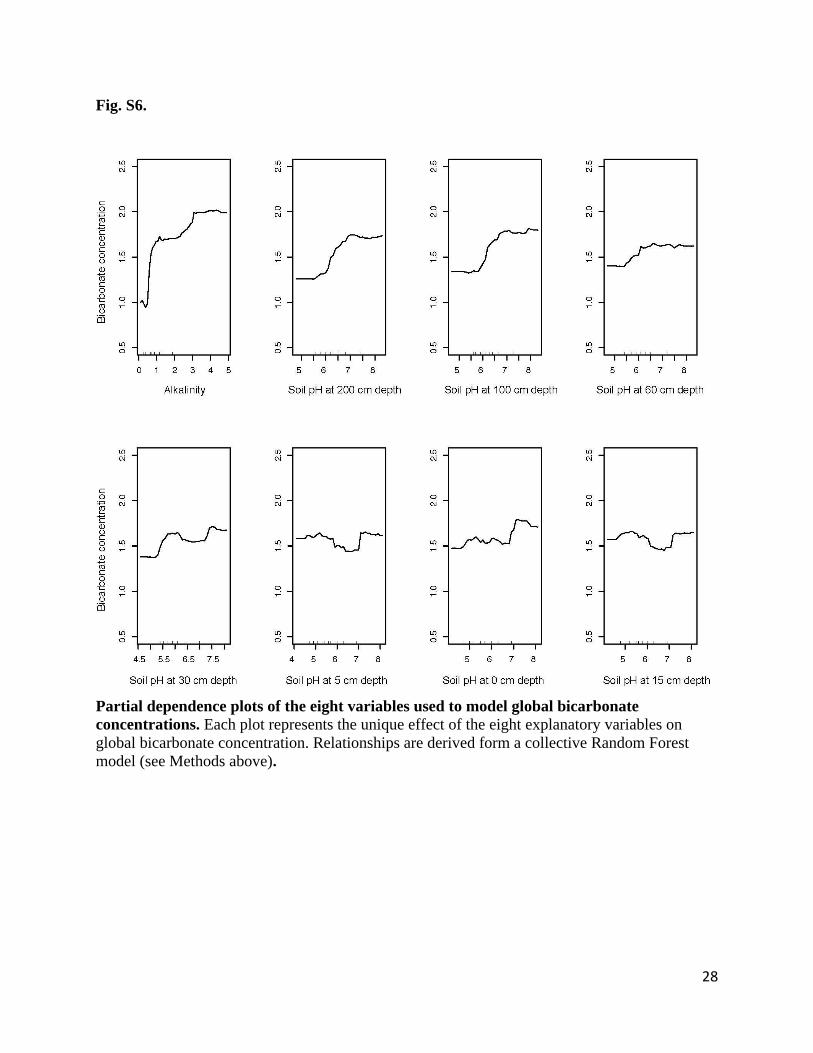
Fig. S6.
Partial dependence plots of the eight variables used to model global bicarbonate
concentrations. Each plot represents the unique effect of the eight explanatory variables on
global bicarbonate concentration. Relationships are derived form a collective Random Forest
model (see Methods above).
29
Fig. S7.
Histogram of taxonomic distinctness for 1000 random subsamples of a fixed number of 131
species drawn from a common species pool. The orange shaded areas depict the 95% quantiles
of the 1000 random samples. The vertical dotted line shows the taxonomic distinctness value of
the 131 study species.
30
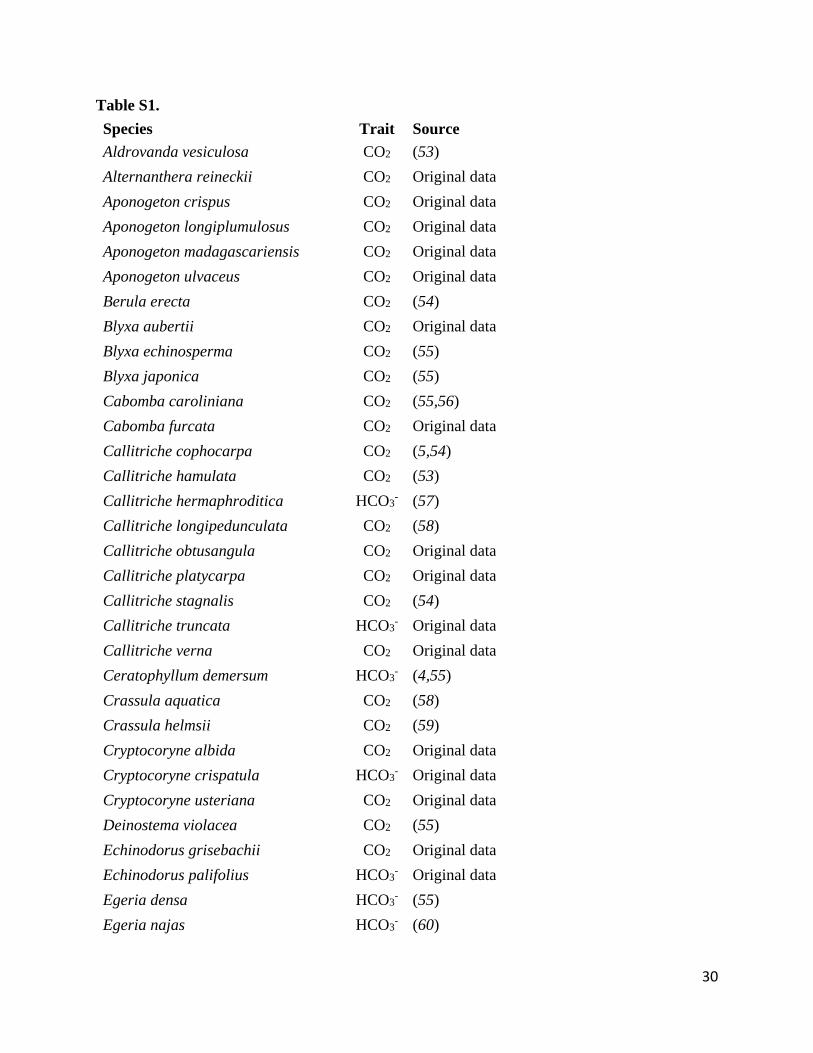
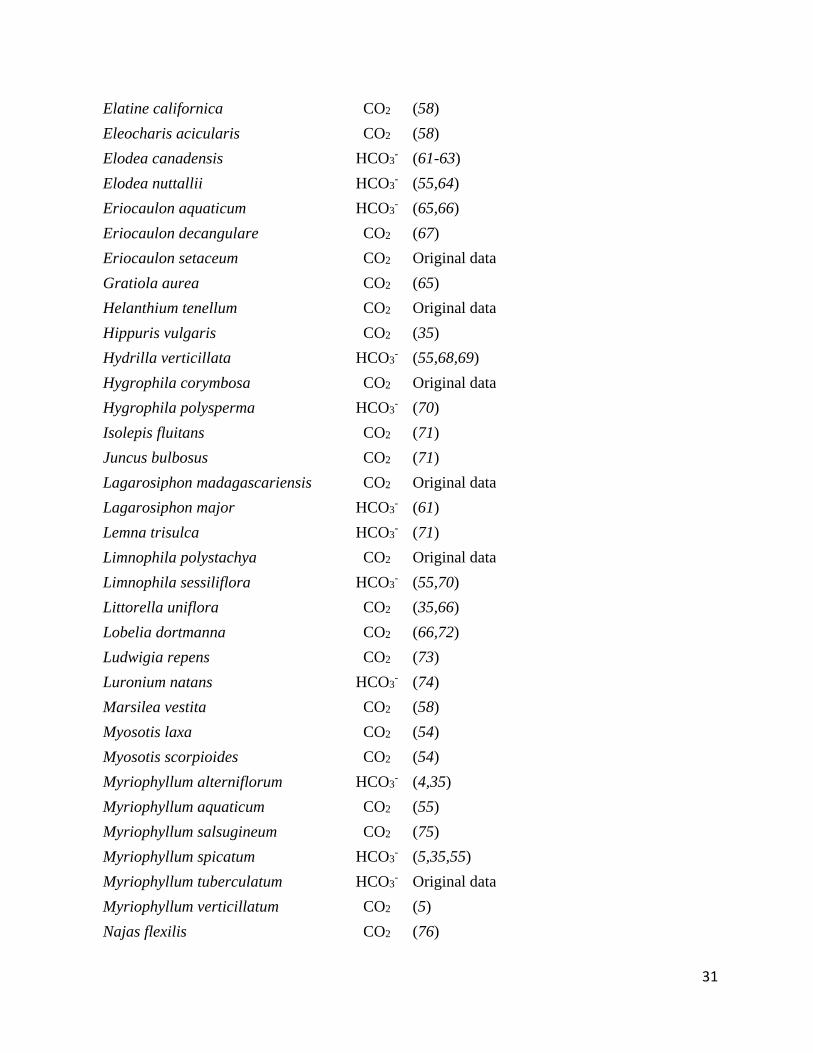
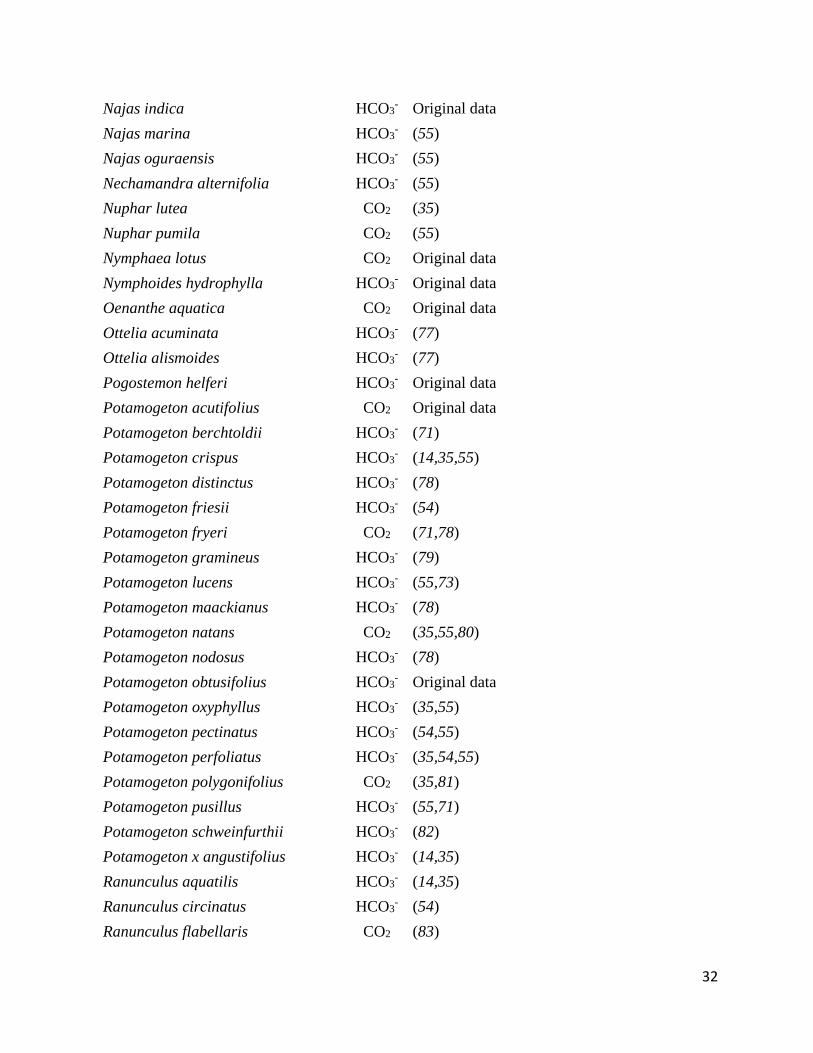
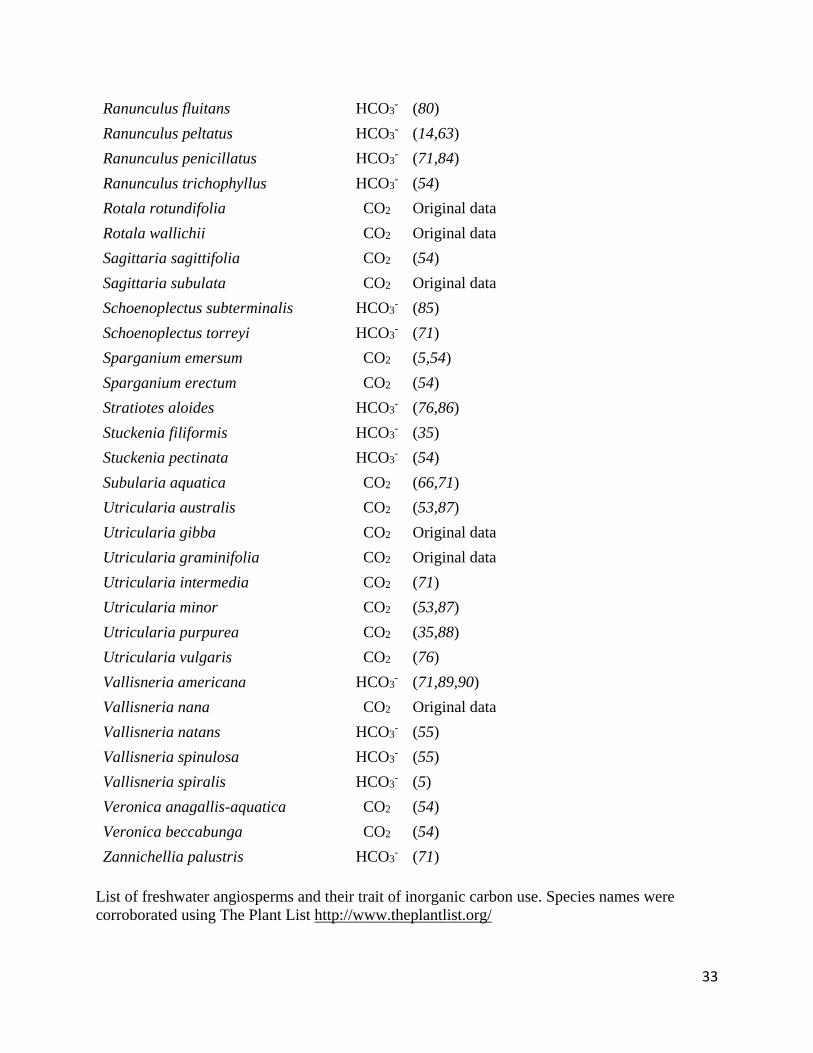
Table S1.
Species Trait Source
Aldrovanda vesiculosa CO2 (53)
Alternanthera reineckii CO2 Original data
Aponogeton crispus CO2 Original data
Aponogeton longiplumulosus CO2 Original data
Aponogeton madagascariensis CO2 Original data
Aponogeton ulvaceus CO2 Original data
Berula erecta CO2 (54)
Blyxa aubertii CO2 Original data
Blyxa echinosperma CO2 (55)
Blyxa japonica CO2 (55)
Cabomba caroliniana CO2 (55,56)
Cabomba furcata CO2 Original data
Callitriche cophocarpa CO2 (5,54)
Callitriche hamulata CO2 (53)
Callitriche hermaphroditica HCO3- (57)
Callitriche longipedunculata CO2 (58)
Callitriche obtusangula CO2 Original data
Callitriche platycarpa CO2 Original data
Callitriche stagnalis CO2 (54)
Callitriche truncata HCO3- Original data
Callitriche verna CO2 Original data
Ceratophyllum demersum HCO3- (4,55)
Crassula aquatica CO2 (58)
Crassula helmsii CO2 (59)
Cryptocoryne albida CO2 Original data
Cryptocoryne crispatula HCO3- Original data
Cryptocoryne usteriana CO2 Original data
Deinostema violacea CO2 (55)
Echinodorus grisebachii CO2 Original data
Echinodorus palifolius HCO3- Original data
Egeria densa HCO3- (55)
Egeria najas HCO3- (60)
31
Elatine californica CO2 (58)
Eleocharis acicularis CO2 (58)
Elodea canadensis HCO3- (61-63)
Elodea nuttallii HCO3- (55,64)
Eriocaulon aquaticum HCO3- (65,66)
Eriocaulon decangulare CO2 (67)
Eriocaulon setaceum CO2 Original data
Gratiola aurea CO2 (65)
Helanthium tenellum CO2 Original data
Hippuris vulgaris CO2 (35)
Hydrilla verticillata HCO3- (55,68,69)
Hygrophila corymbosa CO2 Original data
Hygrophila polysperma HCO3- (70)
Isolepis fluitans CO2 (71)
Juncus bulbosus CO2 (71)
Lagarosiphon madagascariensis CO2 Original data
Lagarosiphon major HCO3- (61)
Lemna trisulca HCO3- (71)
Limnophila polystachya CO2 Original data
Limnophila sessiliflora HCO3- (55,70)
Littorella uniflora CO2 (35,66)
Lobelia dortmanna CO2 (66,72)
Ludwigia repens CO2 (73)
Luronium natans HCO3- (74)
Marsilea vestita CO2 (58)
Myosotis laxa CO2 (54)
Myosotis scorpioides CO2 (54)
Myriophyllum alterniflorum HCO3- (4,35)
Myriophyllum aquaticum CO2 (55)
Myriophyllum salsugineum CO2 (75)
Myriophyllum spicatum HCO3- (5,35,55)
Myriophyllum tuberculatum HCO3- Original data
Myriophyllum verticillatum CO2 (5)
Najas flexilis CO2 (76)
32
Najas indica HCO3- Original data
Najas marina HCO3- (55)
Najas oguraensis HCO3- (55)
Nechamandra alternifolia HCO3- (55)
Nuphar lutea CO2 (35)
Nuphar pumila CO2 (55)
Nymphaea lotus CO2 Original data
Nymphoides hydrophylla HCO3- Original data
Oenanthe aquatica CO2 Original data
Ottelia acuminata HCO3- (77)
Ottelia alismoides HCO3- (77)
Pogostemon helferi HCO3- Original data
Potamogeton acutifolius CO2 Original data
Potamogeton berchtoldii HCO3- (71)
Potamogeton crispus HCO3- (14,35,55)
Potamogeton distinctus HCO3- (78)
Potamogeton friesii HCO3- (54)
Potamogeton fryeri CO2 (71,78)
Potamogeton gramineus HCO3- (79)
Potamogeton lucens HCO3- (55,73)
Potamogeton maackianus HCO3- (78)
Potamogeton natans CO2 (35,55,80)
Potamogeton nodosus HCO3- (78)
Potamogeton obtusifolius HCO3- Original data
Potamogeton oxyphyllus HCO3- (35,55)
Potamogeton pectinatus HCO3- (54,55)
Potamogeton perfoliatus HCO3- (35,54,55)
Potamogeton polygonifolius CO2 (35,81)
Potamogeton pusillus HCO3- (55,71)
Potamogeton schweinfurthii HCO3- (82)
Potamogeton x angustifolius HCO3- (14,35)
Ranunculus aquatilis HCO3- (14,35)
Ranunculus circinatus HCO3- (54)
Ranunculus flabellaris CO2 (83)
33
Ranunculus fluitans HCO3- (80)
Ranunculus peltatus HCO3- (14,63)
Ranunculus penicillatus HCO3- (71,84)
Ranunculus trichophyllus HCO3- (54)
Rotala rotundifolia CO2 Original data
Rotala wallichii CO2 Original data
Sagittaria sagittifolia CO2 (54)
Sagittaria subulata CO2 Original data
Schoenoplectus subterminalis HCO3- (85)
Schoenoplectus torreyi HCO3- (71)
Sparganium emersum CO2 (5,54)
Sparganium erectum CO2 (54)
Stratiotes aloides HCO3- (76,86)
Stuckenia filiformis HCO3- (35)
Stuckenia pectinata HCO3- (54)
Subularia aquatica CO2 (66,71)
Utricularia australis CO2 (53,87)
Utricularia gibba CO2 Original data
Utricularia graminifolia CO2 Original data
Utricularia intermedia CO2 (71)
Utricularia minor CO2 (53,87)
Utricularia purpurea CO2 (35,88)
Utricularia vulgaris CO2 (76)
Vallisneria americana HCO3- (71,89,90)
Vallisneria nana CO2 Original data
Vallisneria natans HCO3- (55)
Vallisneria spinulosa HCO3- (55)
Vallisneria spiralis HCO3- (5)
Veronica anagallis-aquatica CO2 (54)
Veronica beccabunga CO2 (54)
Zannichellia palustris HCO3- (71)
List of freshwater angiosperms and their trait of inorganic carbon use. Species names were
corroborated using The Plant List http://www.theplantlist.org/

34
Data S1. (separate file)
All R scripts and cleaned datasets used for this analysis are available at the Dryad Digital
Repository.