Embed Size (px)
Citation preview
This is an Open Access document downloaded from ORCA, Cardiff University's institutional
repository: http://orca.cf.ac.uk/122805/
This is the author’s version of a work that was submitted to / accepted for publication.
Citation for final published version:
Plotnikov, Denis, Williams, Cathy and Guggenheim, Jeremy A 2019. Association between birth
weight and refractive error in adulthood: a Mendelian randomisation study. British Journal of
Ophthalmology 10.1136/bjophthalmol-2018-313640 file
Publishers page: http://dx.doi.org/10.1136/bjophthalmol-2018-313640
<http://dx.doi.org/10.1136/bjophthalmol-2018-313640>
Please note:
Changes made as a result of publishing processes such as copy-editing, formatting and page
numbers may not be reflected in this version. For the definitive version of this publication, please
refer to the published source. You are advised to consult the publisher’s version if you wish to cite
this paper.
This version is being made available in accordance with publisher policies. See
http://orca.cf.ac.uk/policies.html for usage policies. Copyright and moral rights for publications
made available in ORCA are retained by the copyright holders.
Page 1
Title:
Association between birth weight and refractive error in adulthood: a Mendelian randomization
study.
Authors:
Denis Plotnikov¹, Cathy Williams2, Jeremy A. Guggenheim¹, CREAM Consortium, UK Biobank Eye &
Vision Consortium
Affiliations:
1. School of Optometry and Vision Sciences, Cardiff University, Cardiff, UK.
2. Population Health Sciences, Bristol Medical School, University of Bristol, Bristol, UK.
ORCID id’s: D. Plotnikov 0000-0002-9950-8992
C. Williams 0000-0002-9133-2021
J.A. Guggenheim 0000-0001-5164-340X
Address for correspondence:
Jeremy A. Guggenheim
School of Optometry & Vision Sciences
Cardiff University
Maindy Road, Cardiff, CF24 4HQ, UK
Tel +44 (0) 29 2087 4904
Email. [email protected]
Keywords:
Refractive error; Birth weight; Mendelian randomisation; UK Biobank
Conflict of Interest:
The authors declare that they have no conflict of interest.
Acknowledgements:
This research has been conducted using the UK Biobank Resource (applications #17351 and #17615).
Data analysis was carried out using the RAVEN computing cluster, maintained by the ARCCA group at
Cardiff University ARCCA and the BLUE CRYSTAL3 computing cluster maintained by the HPC group at
the University of Bristol. This research was specifically funded by NIHR Senior Research Fellowship
award SRF-2015-08-005 and the Global Education Program of the Russian Federation government.
UK Biobank was established by the Wellcome Trust; the UK Medical Research Council; the
Department for Health (London, UK); Scottish Government (Edinburgh, UK); and the Northwest
Regional Development Agency (Warrington, UK). It also received funding from the Welsh Assembly
Government (Cardiff, UK); the British Heart Foundation; and Diabetes UK. Collection of eye and
vision data was supported by The Department for Health through an award made by the NIHR to the
Biomedical Research Centre at Moorfields Eye Hospital NHS Foundation Trust, and UCL Institute of
Ophthalmology, London, United Kingdom (grant no. BRC2_009). Additional support was provided by
The Special Trustees of Moorfields Eye Hospital, London, United Kingdom (grant no. ST 12 09).
Page 2
Synopsis
A Mendelian randomisation analysis to estimate the causal effect of birth weight on refractive error
in adulthood suggested that each 1 standard deviation reduction in birth weight caused a -0.28 D
more negative refractive error.
Abstract
Background. Pathological myopia is one of the leading causes of blindness globally. Lower birth
weight (BW) within the normal range has been reported to increase the risk of myopia, although
findings conflict. We sought to estimate the causal effect of BW on refractive error using Mendelian
randomization, under the assumption of a linear relationship.
Methods. Genetic variants associated with BW were identified from meta-analysis of a genome-
wide association study (GWAS) for self-reported BW in 162,039 UK Biobank participants and a
published EGG consortium GWAS (n=26,836). We performed a 1-sample Mendelian randomization
(MR) analysis in 39,658 unrelated, adult UK Biobank participants (independent of the GWAS sample)
using an allele score for BW as instrumental variable. A 2-sample MR sensitivity analysis and
conventional ordinary least squares (OLS) regression analyses were also undertaken.
Results. In OLS analysis, BW showed a small, positive association with refractive error: +0.04D per
standard deviation (SD) increase in BW (95% CI: 0.02 to 0.07; p=0.002). The 1-sample MR-estimated
causal effect of BW on refractive error was higher, at +0.28D per SD increase in BW (95% CI: 0.05 to
0.52, p=0.02). A 2-sample MR analysis provided similar causal effect estimates, with minimal
evidence of directional pleiotropy.
Conclusions. Our study suggests lower birth weight within the normal range is causally associated
with a more myopic refractive error. However, the impact of the causal effect was modest (range
1.00D covering approximately 95% of the population).
Page 3
Introduction
Myopia is a common eye disorder that increases the risk of maculopathy, glaucoma, cataract, and
retinal detachment [1,2]. Despite numerous epidemiologic and genetic studies, the risk factors and
mechanisms underlying myopia development are still not fully understood [3-5].
Myopia is more common in children with extremely low birth weight (BW), either with or without
retinopathy of prematurity [6,7], although an increased prevalence of hyperopia and astigmatism
has also been reported [8,9]. The ocular structure primarily responsible for causing myopia in
individuals with extremely low BW is unclear, since both corneal curvature and axial length have
been reported to differ in preterm vs. full-term-born infants, and there is evidence suggesting some
of these differences may resolve during childhood [10-12]. However, few epidemiological studies
have assessed the relationship between refractive error and BW within the normal range, either for
adult or child samples. In a cohort of infants from Singapore [13] a trend towards a negative
association of BW and refraction was observed, i.e. a more hyperopic refractive error with lower
BW. In contrast, a study of 12-13 year-old children from Northern Ireland [14] reported a positive
association. In both studies, statistical support for the association was weak. No association between
BW and refractive error was found in 12 to 15 year-old adolescent participants in the US National
Health and Nutrition Examination Survey (NHANES), although BW was associated with corneal
curvature [11]. In adult participants from the population-based 1958 British Birth Cohort [15],
myopia was associated with lower BW for gestational age (OR=0.90, P<0.05) and in the population-
based Gutenberg Health Study [16], refractive error was -0.017 D (95% CI -0.011 to -0.023; P<0.001)
more myopic per standard deviation reduction in BW.
Previous investigations of the relationship between BW and refractive error have been restricted to
observational study designs. Observational studies are susceptible to confounding, and therefore
offer very limited potential for drawing causal inferences [17]. The aim of the current study was to
test for a causal relationship between BW within the normal range and refractive error in adulthood.
For this purpose, we used a Mendelian randomization (MR) study design. In MR, genetic variants
associated with an exposure (risk factor) are used as instrumental variables to provide effect
estimates free from bias due to reverse causality and that are less prone to bias from unmeasured
confounders than conventional observation studies [8,18]. The MR approach has been likened to a
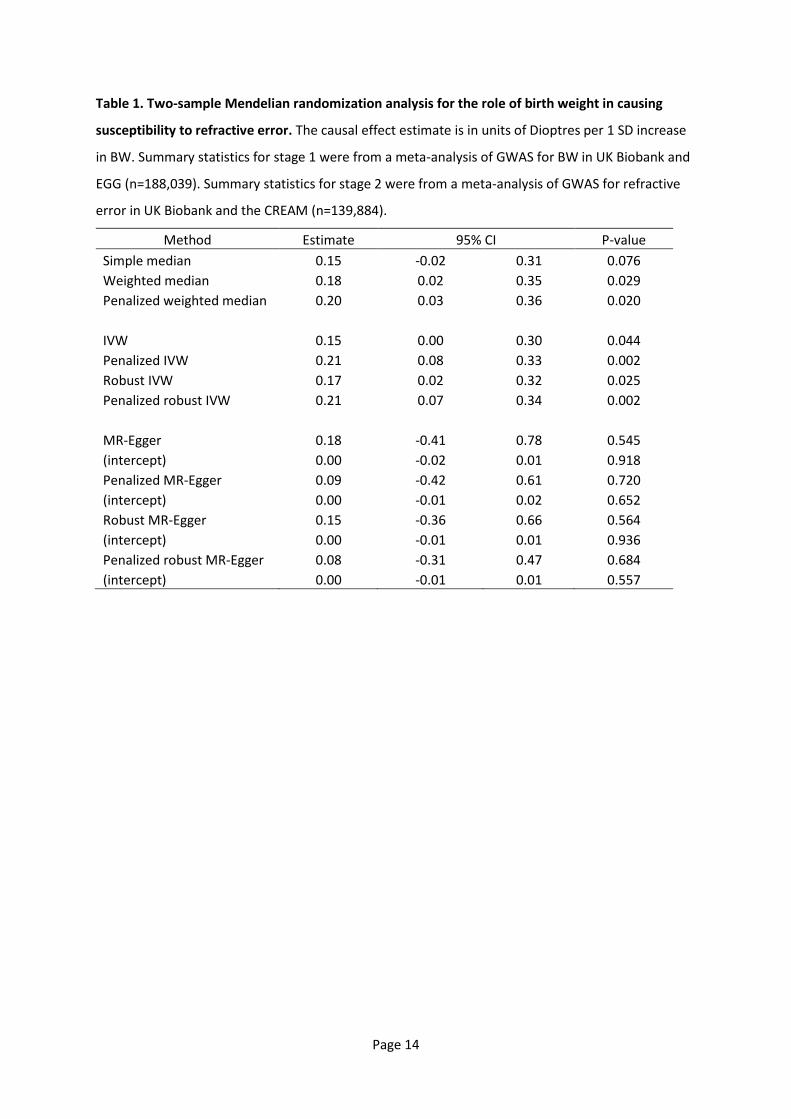
randomized controlled trial [19]. Three assumptions are necessary in order for a specific genetic
variant to be used as an instrumental variable in an MR analysis (Figure 1): i) the genetic variant
must be associated with the level of the exposure variable; ii) the genetic variant must not be
Page 4
associated with any confounders of the exposure-outcome relationship; and, iii) the genetic variant
must be associated with the outcome only via the exposure [20,21]. Newer variations of MR allow
the relaxation of assumptions (ii) and (iii) to some extent [22].
Methods
UK Biobank
UK Biobank is a longitudinal study of approximately 500,000 participants aged 37-73 years, recruited
between 2006 and 2010 [23]. Ethical approval was obtained from the National Health Research
Ethics Service (Ref 11/NW/0382) and all participants provided written informed consent. Genotype
data from the UK Biobank July 2017 full release were available for 488,377 participants. Data for BW
were available for 279, 971 participants, who recalled their BW at the baseline and/or follow-up
assessments. BW data were Z-transformed: (BW value – mean BW)/ standard deviation (SD) of BW.
A flow diagram outlining the selection of UK Biobank participants for the GWAS and MR analyses is
presented in Figure 2. The validity of self-reported BW was previously assessed by Tyrrell et al. [24],
who reported it to be associated with non-singleton pregnancy, female sex, maternal smoking at the
time of pregnancy, earlier year of birth, and socioeconomic status. All of these associations were in
the expected directions.
Approximately 23% of UK Biobank participants underwent an ophthalmic assessment, which
included non-cycloplegic autorefraction/keratometry (Tomey RC5000; Tomey Gmbh Europe,
Germany). Up to 10 repeat measurements were taken. Mean Spherical Equivalent (MSE) refractive
error was calculated over repeat measurements for each eye separately, after excluding readings
flagged as being unreliable: MSE = Sphere + (0.5*Cylinder). The average MSE (avMSE) of the 2 eyes
as used as the parti ipa t s refra ti e error i the statisti al a al ses.
A set of well-imputed genetic variants (with IMPUTE4 [25] INFO metric > 0.9, minor allele frequency
(MAF) > 0.005, missing rate . , a d a rs aria t ID prefi that ere LD-pruned using the --
indep-pairwise 50 5 0.1 command in in PLINK 2.0 [26]) was used to create a genetic relationship
matrix (GRM). From the set of n=409,728 White British ancestry individuals identified by Bycroft et
al. [25] a group of (essentially) unrelated individuals was selected using the PLINK 1.9 [26] --rel-cutoff
0.025 command in conjunction with the GRM. A total of 338,256 unrelated White British ancestry
individuals was identified. For these participants, the mean and SD of the each of the first 20
Principal Components (PCs) of genetic data were calculated (using the PCs obtained by Bycroft et al.
Page 5
[25]). Individuals from the full cohort who were within ±10 SD of the mean for each of the first 20
PCs were retained (n=446,678). We excluded a further 1,821 participants with self-reported non-
white ethnicity and those with autosomal heterozygosity more than 4 SD from the mean. Individuals
with valid autorefraction data, no history of eye surgery and who had not withdrawn consent were
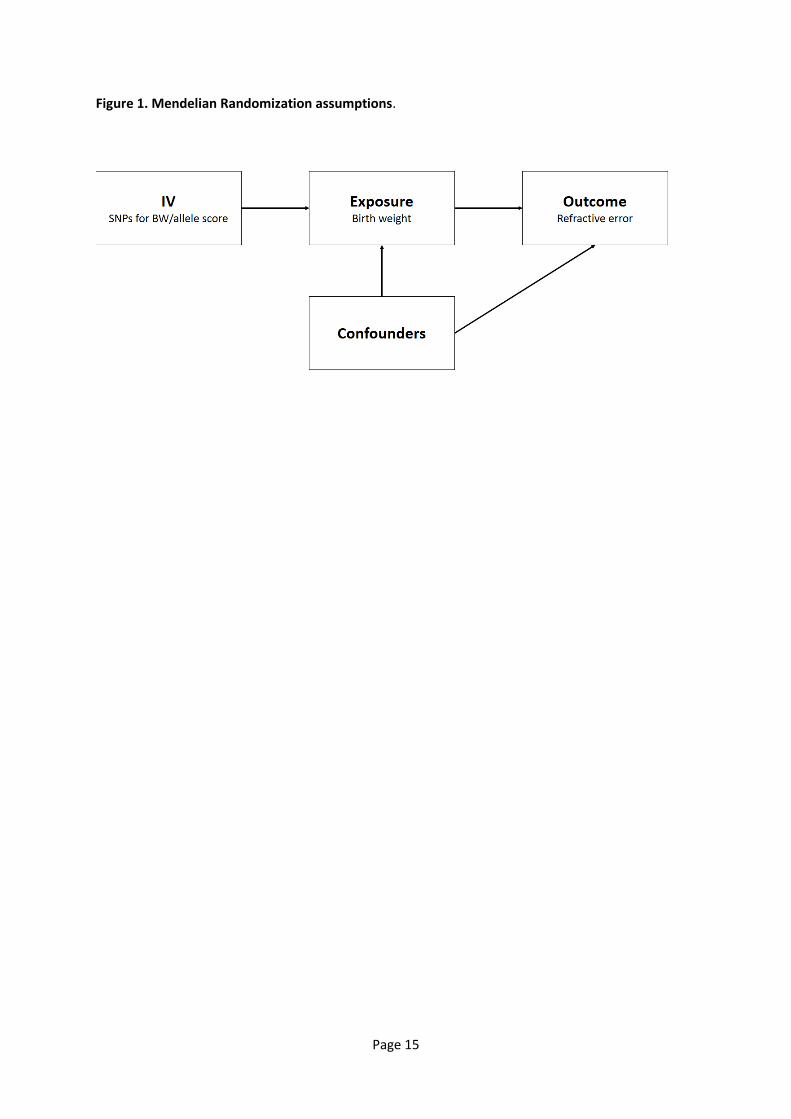
utilized as the sample for a GWAS for refractive error (n=95,504; see below). Following the selection
criteria adopted by Horikoshi et al. [27] from the remaining 347,708 participants we excluded
participants who had withdrawn consent, those with BW outside the range of 2.5-4.5kg, those from
multiple births (e.g. twins) and those who reported a difference in BW > 0.5kg between the baseline
and follow-up assessments. This resulted in a total sample of 162,039 participants for inclusion in a
GWAS for BW (Figure 2).
For the GWAS for refractive error we excluded participants from downstream analyses if they: (i)
self-reported a history of laser refractive surgery, cataract or corneal graft surgery, or any type of
eye surgery within the last 4 weeks before the assessment; (ii) self-reported any eye trauma that led
to sight loss; (iii) self-reported cataract or retinal detachment; (iv) had a hospital record of ocular
surgery. This resulted in 95,692 participants for further analysis.
A subgroup of unrelated UK Biobank participants (n=39,658) with both autorefraction and BW data
available was used for the 1-sample MR analysis and the OLS analysis (Figure 2).
EGG consortium GWAS meta-analysis for birth weight
Summary statistics for a GWAS meta-analysis for BW were downloaded from the Early Growth
Genetics (EGG) consortium website www.egg-consortium.org [28]. The EGG consortium meta-
analysis comprised of 18 European population-based studies (n=26,836).
CREAM consortium GWAS meta-analysis for refractive error
Summary statistics for a GWAS meta-analysis for refractive error were provided by the CREAM
consortium. The CREAM meta-analysis was based on 29 studies of European ancestry (n=44,192 in
total), most of which were population based. Spherical equivalent averaged between the two eyes
was used as the refractive error phenotype. The 29 CREAM studies did not adjust for BW when
performing the GWAS analyses for refractive error.
Ordinary Least Squares (OLS) Regression
Page 6
To examine the observational association between BW and refractive error we performed a linear
regression analysis in the sample of UK Biobank participants with information available for both
refractive error and BW (n=39,658), adjusting for age and sex. BW was coded as a Z-score, i.e. 1 SD
of BW was used as the unit of measurement.
GWAS for birth weight and for refractive error in UK Biobank participants
Single marker association tests for BW (coded as a Z-score) and for refractive error (coded in
Dioptres) were carried out genome-wide in n=162,039 and n=95,504 individuals, respectively, from
UK Biobank, using BOLT-LMM [29]. We included 10.4 million genetic markers present on the HRC
reference panel [25] with MAF 0.05 and IMPUTE4 INFO metric >0.9 and per-marker missing rate
<0.015 and per-individual missing genotype rate <0.025. Age, gender, genotyping array (coded as 0
or 1 for the UK BiLEVE or UK Biobank Axiom, respectively) and the first 10 PCs were included as
covariates. The genetic relationship matrix for the BOLT-LMM analysis was created as described
above. The GWAS summary statistics were filtered to remove markers with a p<0.01 for a test of
Hardy-Weinberg equilibrium.
Meta-analysis of GWAS summary statistics
Two meta-analyses were conducted. Firstly, a meta-analysis of the two sets of BW GWAS summary
statistics (n=162,039 individuals from UK Biobank and n=26,836 individuals from the EGG
Consortium) and secondly a meta-analysis of the two sets of refractive error GWAS summary
statistics (n=95,504 individuals from UK Biobank and n=44,192 individuals from the CREAM
Consortium). We used a fixed effects, inverse variance-weighted meta-analysis model in METAL [30].
An allele score for birth weight
The BW GWAS meta-analysis identified 75 lead SNPs associated with BW at P<5.0e-08 that were
separated by at least 500 kb and that had pairwise linkage disequilibrium (LD) r² < 0.2. Two of these
SNPs were not present in the CREAM refractive error GWAS summary statistics, leaving 73 SNPs for
deriving an allele score. These allele scores were calculated for UK Biobank individuals using the
PLINK .9 --s ore o a d, ith eighti g ased o the eta-coefficient quantifying the degree of
association with BW.
The variance in BW explained by the allele score was assessed in the sample of unrelated UK
Biobank participants with information available for both refractive error and BW (n=39,658; note
that there was no overlap between this sample of 39,658 participants and the UK Biobank sample
Page 7
used for the BW GWAS meta-analysis; see Figure 2). A baseline regression model was fit, with BW (Z-
scores) as the dependent variable and age, sex, genotyping array (UK BiLEVE array or UK Biobank
Axiom array) and the first 10 PCs as predictors. A full model was fit as for the baseline model, with
allele score included as an additional predictor. The variance in BW explained by the allele score was
calculated as the increase in the adjusted R² of the full vs. baseline model.
Mendelian randomization
We performed a 1-sample Mendelian randomization analysis in unrelated UK Biobank participants
using the allele score for BW as the instrumental variable and a Limited Information Maximum
Likelihood (LIML) model (ivmodel R package). F-statistics from the first stage of a two-step least
squares (2SLS) analysis (ivreg function from R package AER) were used to assess the strength of the
instrumental variable [31].
As an allele score-based MR analysis can be biased by unbalanced (directional) pleiotropy, we
performed MR-Egger and weighted-median (2-sample) MR sensitivity analyses [20,21]. The same set
of 73 genetic variants used in the allele score analyses described above were used as instrumental
variables. For the analysis results presented in Table 1, regression coefficients and standard errors
for the association of these 73 genetic variants with refractive error were obtained from a meta-
analysis of GWAS for refractive error in UK Biobank participants and the CREAM Consortium GWAS.
Sample overlap
The EGG and CREAM genetic consortia samples were partially overlapping (e.g. the 1958 British Birth
Cohort, EPIC, ERF and ORCADES studies were common between the two datasets). We estimated
the maximum possible overlap, was 4,813 individuals, i.e. for example, if the number of ORCADES
participants in EGG was X and the number of ORCADES participants in CREAM was Y, then the
maximum overlap would be min(X,Y). It was also possible that some participants in the UK-based
EGG or UK-based CREAM studies were also enrolled in the UK Biobank study. For the MR analysis
using UK Biobank + EGG summary statistics for stage 1 and CREAM + the separate group of UK
Biobank for stage 2, we estimated the maximum possible overlap to be 11,685 individuals, or 8% of
the stage 2 sample. Thus, the potential for weak instrument bias due to this overlap was limited [32].
Results
Page 8
GWAS meta-analysis and allele score for birth weight
The UK Biobank sample selected for the GWAS for self-reported BW was restricted to individuals
with self-reported BW within the range 2.5-4.5 kg. A comparison of participants included vs.
excluded based on this criterion identified that the excluded participants were more often older,
male, and from more socially deprived areas (all p<1.0e-73; Supplementary Tables S1-S3;
Supplementary Figure S1). The excluded participants were also less likely to have undergone the
ophthalmic assessment, and had a more hyperopic refractive error: the median (IQR) refractive error
was +0.09 D (-1.28 to 1.05) vs. +0.23 D (-1.12 to 1.27) for included vs. excluded participants (p=7.3e-
49). The final sample size for the GWAS was 162,309 (Figure 2).
The GWAS identified 63 SNPs independently associated with self-reported BW at genome-wide
significance, p<5.0e-08 (Supplementary Table S4). A meta-analysis of the UK Biobank (n=162,309)
and EGG consortium (n=26,836) BW GWAS summary statistics identified 75 genetic variants
independently associated with BW (Supplementary Table S5). Two of these SNPs (rs1530624 and
rs1058026) were not available in the CREAM meta-analysis for refractive error and hence were
excluded. The remaining 73 genetic variants were used to calculate an allele score for BW. The allele
score explained 1.2% of the variance in BW in an independent sample of 39,658 UK Biobank
participants (p<2.2e-16).
Observational and causal relationship between birth weight and refractive error
The observational association between refractive error and BW was assessed using OLS regression in
39,658 unrelated UK Biobank participants of European ancestry, after adjusting for age and sex. Each
1 SD increase in BW was associated with a +0.04 D increase in refractive error (95% CI 0.02 to 0.07,
p=0.002), suggesting that lower BW was a risk factor for myopia and higher BW a risk factor for
hypermetropia.
In the same sample of 39,658 UK Biobank participants with information available for both BW and
refractive error, a 1-sample Mendelian randomization analysis using the allele score for BW as an
instrumental variable estimated the causal effect of BW on refractive error as +0.28 D per 1 SD
increase in BW (95% CI 0.05 to 0.52, p=0.02). The F-statistic from the first stage regression of a 2SLS
analysis was 496.74, o fir i g that the allele s ore as ot a eak i stru e t [33].
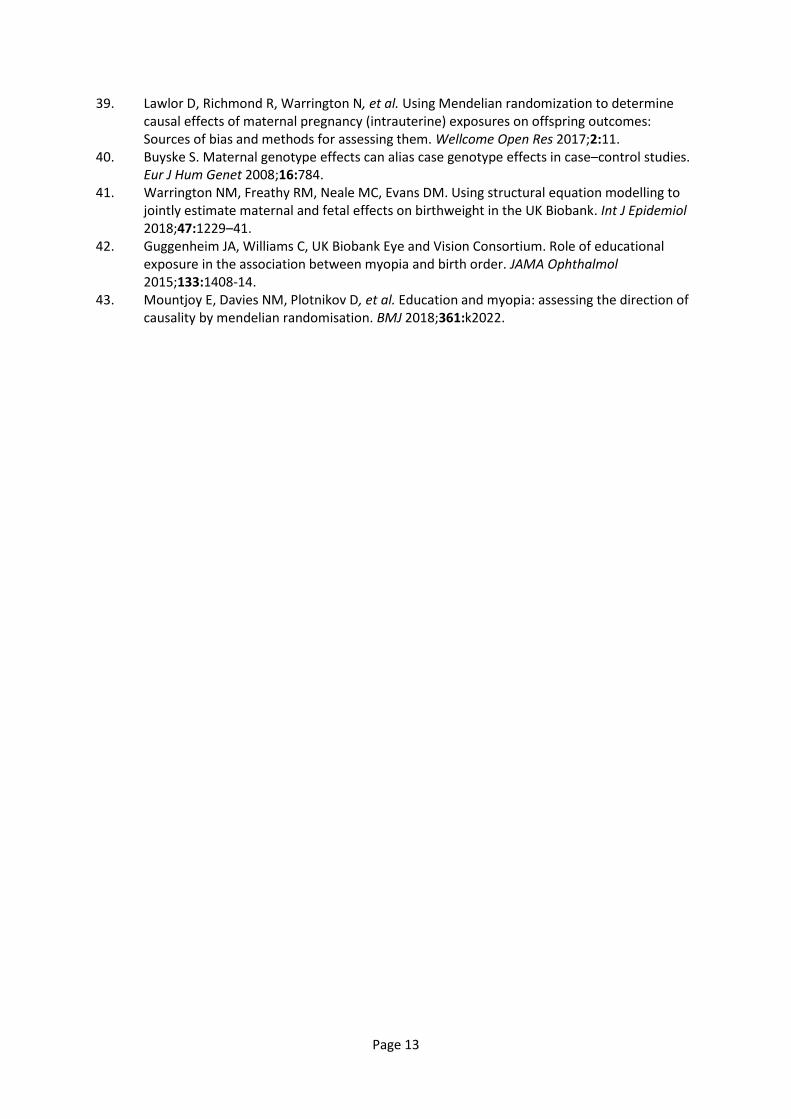
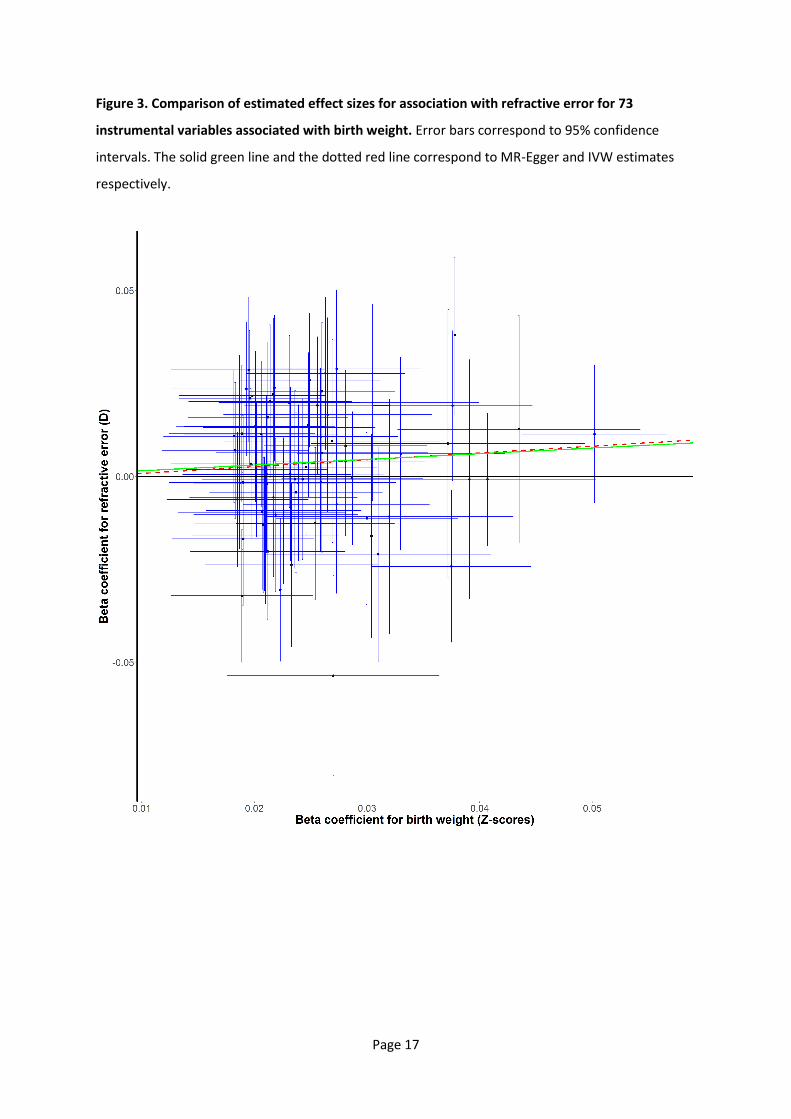
A 2-sample MR sensitivity analysis was carried out using the largest datasets available: meta-
analysed data for BW in 188,039 participants from UK Biobank and the EGG consortium; and meta-
Page 9
analysed data for refractive error in 139,696 participants from UK Biobank and the CREAM
consortium. The 73 SNPs independently associated with BW were used as instrumental variables. An
MR-Egger sensitivity analysis, designed to test for directional pleiotropy, yielded an MR-Egger
intercept estimate of 0.00 D, suggesting an absence of directional pleiotropy (Table 1; Figure 3). A
weighted median-based MR causal effect estimate, which remains valid even a proportion of the
genetic variants do not meet the assumptions necessary for a valid instrumental variable, yielded an
MR effect estimate similar to that from the allele score-based MR analysis (Table 1): +0.18 D per 1
SD increase in BW (95% CI 0.02 to 0.35, p=0.03).
Discussion
In this Mendelian randomization study, we estimated the causal effect of BW within the normal
range on refractive error as approximately +0.28 D per 1 SD increase in BW. The MR-based estimate
of the causal effect of BW was higher than the observational analysis-based estimate (Durbin-Wu-
Hausman endogeneity test p=0.04) suggesting bias in the observational analysis or the presence of
gene-environment interaction.
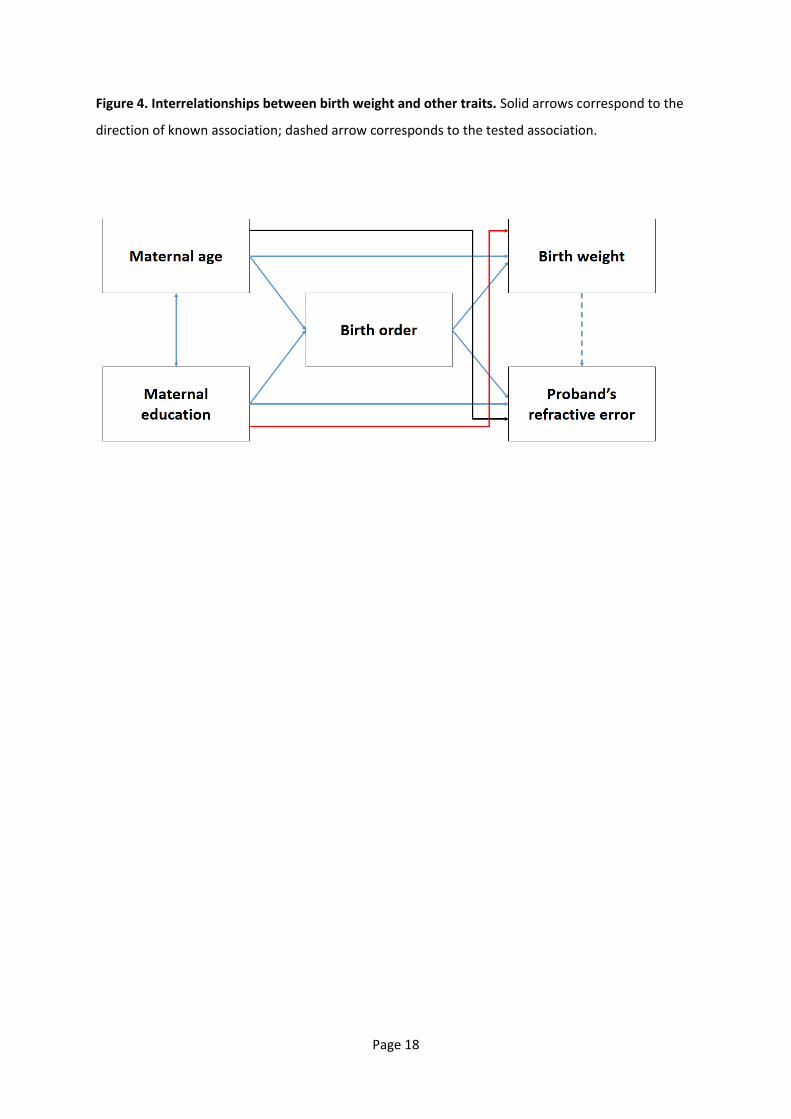
The likely reason for the difference between the causal effect estimate from the MR analysis and
that estimated from the observational estimate is confounding (typically, observational estimates
are more severely affected by confounding bias than are MR estimates). Such confounding may arise
from the complex interrelationships between BW and other traits, both of the mother and the
proband (Figure 4). For example, an inverted U-shaped relationship between maternal age and BW
has been reported [34], and maternal age is negatively correlated with refractive error of the child
[33]. In addition, birth order is associated with BW [35] and refractive error [36] (specifically, first-
born offspring have a higher risk of myopia development than their siblings). Furthermore, higher
maternal education is associated with a reduced risk of low BW in offspring [37]. Similarly, a
correlation between refractive error in childre a d their other s le el of edu atio al attai e t
has been reported [38], and the level of maternal education is related to maternal age.
Strengths of this study were that the allele score used as an instrumental variable in the primary MR
analysis was strongly associated with the exposure (F=496.74), and that sensitivity analyses were
carried out to check the robustness of the findings to departures from the assumptions required in
MR. We integrated GWAS summary statistics from existing large GWAS datasets and UK Biobank,
which provided sufficient statistical power to detect and estimate the causal effect precisely.
Page 10
One limitation of our study is that it was restricted to participants of European ancestry, while the
prevalence of myopia is greater in East and South-East Asian countries compared to Europe.
Furthermore, the UK Biobank cohort is not fully representative of the UK population [23] (a
phenomenon potentially exacerbated by our exclusion of participants with self-reported BW outside
the 2.5 - 4.5 kg range). The causal effect estimate and the observational association between BW
and refractive error may differ across population groups or geographic locations as a result of
genetic or environmental influences. Secondly, despite the evidence against departure from the MR
assumptions, the possibility of pleiotropic effects cannot be ruled out since the biological role of the
vast majority of the genetic variants we used as instrumental variables is unknown. For instance, it is
plausible that a genetic variant identified in a GWAS for BW has a causal pathway that acts via the
other s le el of edu atio al attai e t, i.e. a aria t asso iated ith higher edu atio al
attainment would be expected to show a positive association with BW. Without further knowledge
of either the maternal genotype or maternal phenotype of the participants in an MR study, it is not
possible to account for phenotypic effects mediated by the maternal genotype and environment
separately from those of the alleles inherited by probands [39-41]. Thirdly, a further limitation
related to that already discussed above, is that Mendelian randomisation does not elucidate the
causal pathway linking an exposure to an outcome. Indeed such causal pathways could potentially
be unanticipated and indirect; for example, the relationship between birth order and myopia has
been suggested to be mediated at least in part by greater parental investment in the education of
first-born children, coupled with a causal relationship between education and myopia [42,43].
Fourthly, the data analysed in the GWAS for BW were obtained by self-report, which may be
inaccurate. Moreover, we excluded participants with a self-reported BW outside the normal range
(and the participants excluded based on this criterion were not a random sample of the full UK
Biobank cohort). Together, these sources of error may have led to GWAS variant regression
coefficients being under or over-estimated. These errors in turn may have contributed to the
imprecision in the final causal effect estimate. Fifthly, information about gestational age was not
available for UK Biobank participants, therefore self-reported BW in some individuals may have been
small or large for their gestational age. However, an analysis by Horikoshi et al. [27] found no
evidence for higher-than-expected heterogeneity in GWAS variant regression coefficients estimated
in samples with vs. without the inclusion of gestational age as a covariate. This suggests that lack of
information regarding gestational age did not introduce a systematic bias in the current study.
Conclusion
Page 11
A Mendelian randomization analysis supported the hypothesis that BW within the normal range
plays a causal role in refractive error development. A lower BW caused a modestly increased risk of
myopia. The estimated causal effect of BW on refractive error was greater than that assessed from a
conventional OLS analysis in the same sample, suggesting that confounding factors may buffer
against the causal effect of BW on myopia.
References
1. Flitcroft DI. The complex interactions of retinal, optical and environmental factors in myopia
aetiology. Prog Retin Eye Res 2012;31:622-60.
2. Saw S-M, Gazzard G, Shih-Yen EC, Chua W-H. Myopia and associated pathological
complications. Ophthalmic Physiol Opt 2005;25:381-91.
3. Wojciechowski R. Nature and nurture: the complex genetics of myopia and refractive error.
Clin Genet 2011;79:301-20.
4. Chen Y-P, Hocking PM, Wang L, et al. Selective Breeding for Susceptibility to Myopia Reveals
a Gene–Environment Interaction. Invest Ophthalmol Vis Sci 2011;52:4003-11.
5. Morgan I, Rose K. How genetic is school myopia? Prog Retin Eye Res 2005;24:1-38.
6. Gallo JE, Holmström G, Kugelberg U, Hedquist B, Lennerstrand G. Regressed retinopathy of
prematurity and its sequelae in children aged 5-10 years. Br J Ophthalmol 1991;75:527-31.
7. Quinn GE, Dobson V, Kivlin J, et al. Prevalence of myopia between 3 months and 5 12 years
in preterm infants with and without retinopathy of prematurity. Ophthalmol 1998;105:1292-
300.
8. Chen T-C, Tsai T-H, Shih Y-F, et al. Long-term Evaluation of Refractive Status and Optical
Components in Eyes of Children Born Prematurely. Invest Ophthalmol Vis Sci 2010;51:6140-
8.
9. O'Connor AR, Stephenson TJ, Johnson A, Tobin MJ, Ratib S, Fielder AR. Change of refractive
state and eye size in children of birth weight less than 1701 g. Br J Ophthalmol 2006;90:456-
60.
10. Cook A, White S, Batterbury M, Clark D. Ocular growth and refractive error development in
premature infants with or without retinopathy of prematurity. Invest Ophthalmol Vis Sci
2008;49:5199-207.
11. Fieß A, Schuster AK, Pfeiffer N, Nickels S. Association of birth weight with corneal power in
early adolescence: Results from the National Health and Nutrition Examination Survey
(NHANES) 1999–2008. PLoS ONE 2017;12:e0186723.
12. Fiess A, Kolb-Keerl R, Knuf M, et al. Axial Length and Anterior Segment Alterations in Former
Preterm Infants and Full-Term Neonates Analyzed With Scheimpflug Imaging. Cornea
2017;36:821-7.
13. Chua SYL, Ikram MK, Tan CS, et al. Relative Contribution of Risk Factors for Early-Onset
Myopia in Young Asian Children. Invest Ophthalmol Vis Sci 2015;56:8101-7.
14. O'Donoghue L, Kapetanankis VV, McClelland JF, et al. Risk Factors for Childhood Myopia:
Findings From the NICER StudyChildhood Myopia Risk Factors: NICER Study. Invest
Ophthalmol Vis Sci 2015;56:1524-30.
15. Rahi JS, Cumberland PM, Peckham CS. Myopia Over the Lifecourse: Prevalence and Early Life
Influences in the 1958 British Birth Cohort. Ophthalmol 2011;118:797-804.
Page 12
16. Fieß A, Schuster AK, Nickels S, et al. Association of low birth weight with myopic refractive
error and lower visual acuity in adulthood: results from the population-based Gutenberg
Health Study (GHS). Br J Ophthalmol 2018;103:99-105.
17. Plotnikov D, Guggenheim JA. Mendelian randomisation and the goal of inferring causation
from observational studies in the vision sciences. Ophthalmic Physiol Opt 2019;39:11-25.
18. Sheehan NA, Didelez V, Burton PR, Tobin MD. Mendelian Randomisation and Causal
Inference in Observational Epidemiology. PLoS Med 2008;5:e177.
19. Dave S ith G, E rahi S. Me delia ra do izatio : a ge eti epide iolog o tri ute to understanding environmental determinants of disease?*. Int J Epidemiol 2003;32:1-22.
20. Greenland S. An introduction to instrumental variables for epidemiologists. Int J Epidemiol
2000;29:722-9.
21. Lawlor DA, Harbord RM, Sterne JAC, Timpson N, Davey Smith G. Mendelian randomization:
Using genes as instruments for making causal inferences in epidemiology. Statistics Med
2008;27:1133-63.
22. Burgess S, Davies NM, Thompso SG. Bias due to parti ipa t o erlap i t o‐sa ple Mendelian randomization. Genet Epidemiol 2016;40:597-608.
23. Sudlow C, Gallacher J, Allen N, et al. UK Biobank: An Open Access Resource for Identifying
the Causes of a Wide Range of Complex Diseases of Middle and Old Age. PLoS Med
2015;12:e1001779.
24. Tyrrell JS, Yaghootkar H, Freathy RM, Hattersley AT, Frayling TM. Parental diabetes and
birthweight in 236 030 individuals in the UK Biobank Study. Int J Epidemiol 2013;42:1714-23.
25. Bycroft C, Freeman C, Petkova D, et al. The UK Biobank resource with deep phenotyping and
genomic data. Nature 2018;562:203-9.
26. Chang CC, Chow CC, Tellier LCAM, Vattikuti S, Purcell SM, Lee JJ. Second-generation PLINK:
rising to the challenge of larger and richer datasets. GigaScience 2015;4:7.
27. Horikoshi M, Beaumont RN, Day FR, et al. Genome-wide associations for birth weight and
correlations with adult disease. Nature 2016;538:248-52.
28. Horikoshi M, Yaghootkar H, Mook-Kanamori DO, et al. New loci associated with birth weight
identify genetic links between intrauterine growth and adult height and metabolism. Nat
Genet 2013;45:76-82.
29. Loh P-R, Tucker G, Bulik-Sullivan BK, et al. Efficient Bayesian mixed-model analysis increases
association power in large cohorts. Nat Genet 2015;47:284.
30. Willer CJ, Li Y, Abecasis GR. METAL: fast and efficient meta-analysis of genomewide
association scans. Bioinformatics 2010;26:2190-1.
31. Didelez V, Sheehan N. Mendelian randomization as an instrumental variable approach to
causal inference. Statistical Methods in Medical Research 2007;16:309-30.
32. Burgess S, Thompson SG. Interpreting findings from Mendelian randomization using the MR-
Egger method. Eur J Epidemiol 2017;32:377-89.
33. Sanderson E, Windmeijer F. A weak instrument F-test in linear IV models with multiple
endogenous variables. J Econometrics 2016;190:212-21.
34. Fall CHD, Sachdev HS, Osmond C, et al. Association between maternal age at childbirth and
child and adult outcomes in the offspring: a prospective study in five low-income and
middle-income countries (COHORTS collaboration). Lancet Global Health 2015;3:e341-e422.
35. Hinkle SN, Albert PS, Mendola P, et al. The association between parity and birthweight in a
longitudinal consecutive pregnancy cohort. Paediatr Perinat Epidemiol 2014;28:106-15.
36. Guggenheim JA, McMahon G, Northstone K, et al. Birth order and myopia. Ophthalmic
Epidemiol 2013;20:10.3109/09286586.2013.848457.
37. Silvestrin S, da Silva CH, Hirakata VN, Goldani AAS, Silveira PP, Goldani MZ. Maternal
education level and low birth weight: a meta-analysis. J Pediatr 2013;89:339-45.
38. Williams KM, Hysi PG, Yonova-Doing E, Mahroo OA, Snieder H, Hammond CJ. Phenotypic and
genotypic correlation between myopia and intelligence. Sci Rep 2017;7:45977.
Page 13
39. Lawlor D, Richmond R, Warrington N, et al. Using Mendelian randomization to determine
causal effects of maternal pregnancy (intrauterine) exposures on offspring outcomes:
Sources of bias and methods for assessing them. Wellcome Open Res 2017;2:11.
40. Buyske S. Maternal genotype effects can alias case genotype effects in case–control studies.
Eur J Hum Genet 2008;16:784.
41. Warrington NM, Freathy RM, Neale MC, Evans DM. Using structural equation modelling to
jointly estimate maternal and fetal effects on birthweight in the UK Biobank. Int J Epidemiol
2018;47:1229–41.
42. Guggenheim JA, Williams C, UK Biobank Eye and Vision Consortium. Role of educational
exposure in the association between myopia and birth order. JAMA Ophthalmol
2015;133:1408-14.
43. Mountjoy E, Davies NM, Plotnikov D, et al. Education and myopia: assessing the direction of
causality by mendelian randomisation. BMJ 2018;361:k2022.
Page 14
Table 1. Two-sample Mendelian randomization analysis for the role of birth weight in causing
susceptibility to refractive error. The causal effect estimate is in units of Dioptres per 1 SD increase
in BW. Summary statistics for stage 1 were from a meta-analysis of GWAS for BW in UK Biobank and
EGG (n=188,039). Summary statistics for stage 2 were from a meta-analysis of GWAS for refractive
error in UK Biobank and the CREAM (n=139,884).
Method Estimate 95% CI P-value
Simple median 0.15 -0.02 0.31 0.076
Weighted median 0.18 0.02 0.35 0.029
Penalized weighted median 0.20 0.03 0.36 0.020
IVW 0.15 0.00 0.30 0.044
Penalized IVW 0.21 0.08 0.33 0.002
Robust IVW 0.17 0.02 0.32 0.025
Penalized robust IVW 0.21 0.07 0.34 0.002
MR-Egger 0.18 -0.41 0.78 0.545
(intercept) 0.00 -0.02 0.01 0.918
Penalized MR-Egger 0.09 -0.42 0.61 0.720
(intercept) 0.00 -0.01 0.02 0.652
Robust MR-Egger 0.15 -0.36 0.66 0.564
(intercept) 0.00 -0.01 0.01 0.936
Penalized robust MR-Egger 0.08 -0.31 0.47 0.684
(intercept) 0.00 -0.01 0.01 0.557
Page 15
Figure 1. Mendelian Randomization assumptions.
Page 16
Figure 2. Selection of UK Biobank participants for GWAS for birth weight and for refractive error.
Box outline colour corresponds to: black – GWAS for refractive error sample; red – OLS and MR
sample; green – GWAS for birth weight sample. (Note that none of 95,504 participants in the
refractive error GWAS sample had withdrawn consent to participate).
Page 17
Figure 3. Comparison of estimated effect sizes for association with refractive error for 73
instrumental variables associated with birth weight. Error bars correspond to 95% confidence
intervals. The solid green line and the dotted red line correspond to MR-Egger and IVW estimates
respectively.
Page 18
Figure 4. Interrelationships between birth weight and other traits. Solid arrows correspond to the
direction of known association; dashed arrow corresponds to the tested association.