Embed Size (px)
Citation preview


This document was produced by the Division of Corporate Planning and Research
Research and Statistics Linda Clarke
Cover Design Traci Neary
Divisional Director Charlotte Strong
Government of Newfoundland and Labrador
Department of Education, 2001
ISBN # 1-55146-124-2
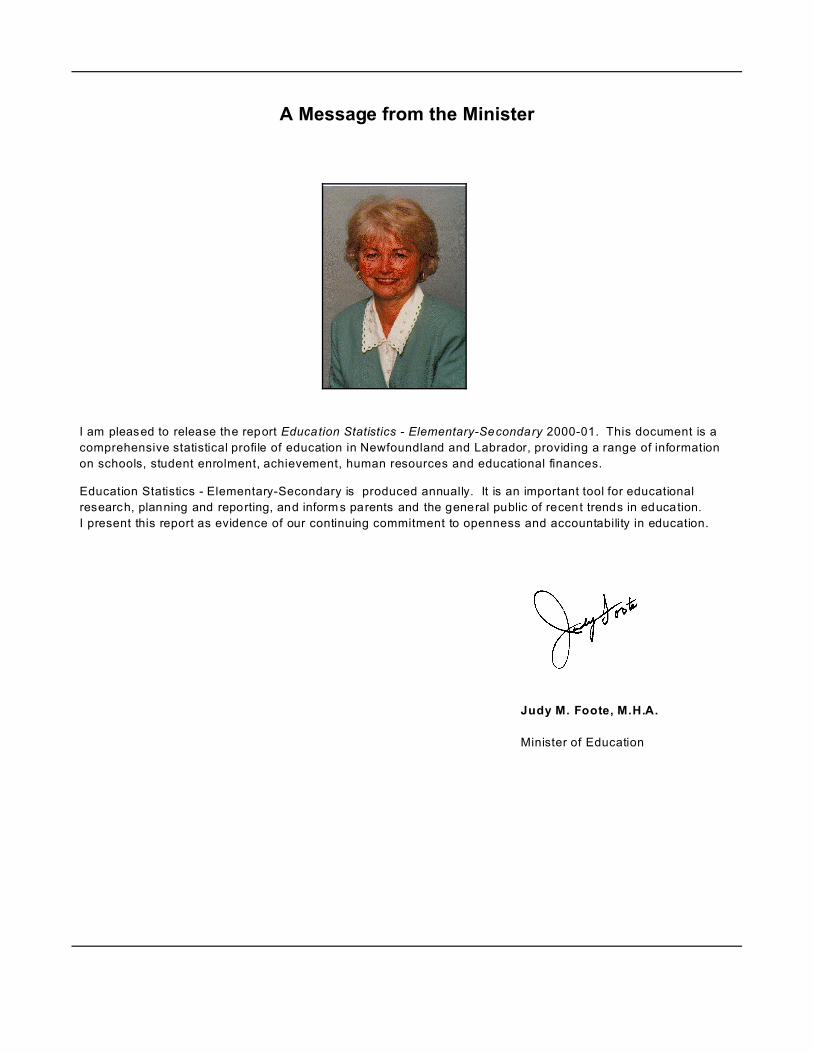
A Message from the Minister
I am pleased to release the report Education Statistics - Elementary-Secondary 2000-01. This document is a
comprehensive statistical profile of education in Newfoundland and Labrador, providing a range of information
on schools, student enrolment, achievement, human resources and educational finances.
Education Statistics - Elementary-Secondary is produced annually. It is an important tool for educational
research, planning and reporting, and inform s parents and the general public of recent trends in education.
I present this report as evidence of our continuing commitment to openness and accountability in education.
Judy M. Foote, M.H.A.
Minister of Education
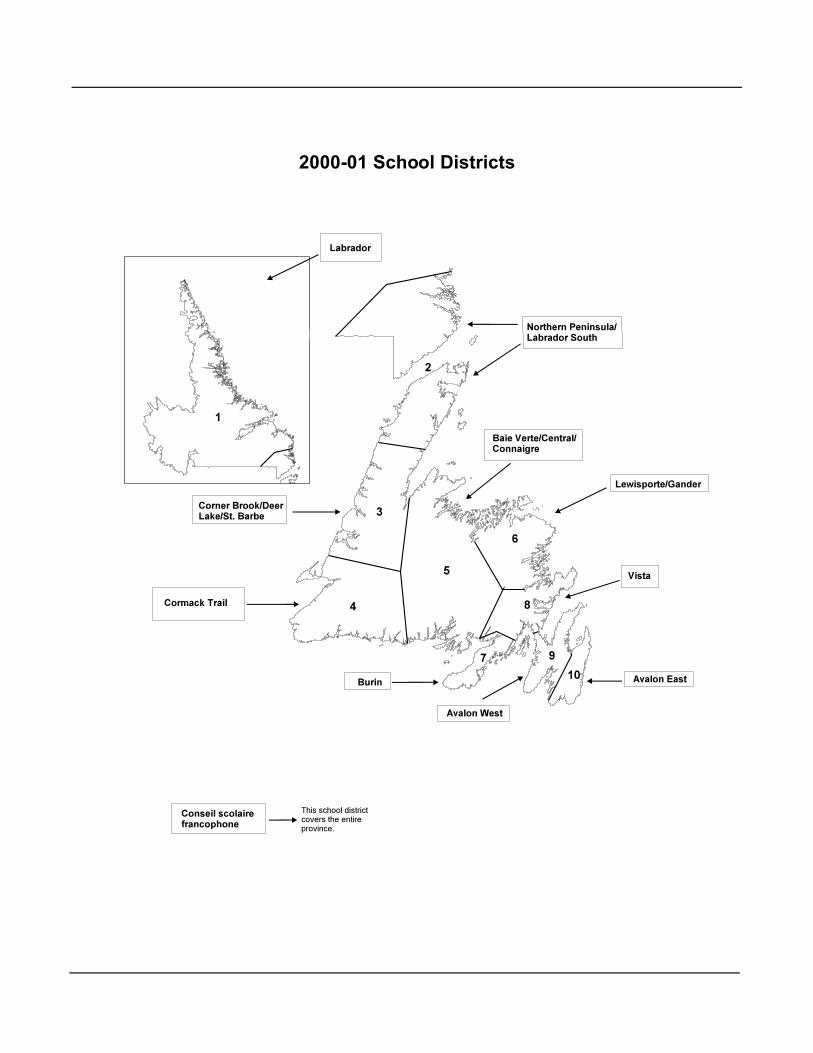
2000-01 School Districts

Education Statistics - Elementary-Secondary, 2000-2001 Table of Contents v
Table of Contents
GENERAL INFORMATION
Figure 1. District Profile, 2000-01 . . . . . . . . . . . . . . . . . . . . . . . . . . . . . . . . . . . . . . . . . . . . . . . . . . . . . . . . . 3
Figure 2. Regional Economic Development Zones . . . . . . . . . . . . . . . . . . . . . . . . . . . . . . . . . . . . . . . . . . . . 4
Table 1. Num ber of Schools, Enrolment and Num ber of Teachers by Regional
Economic Development Zone, 2000-01 . . . . . . . . . . . . . . . . . . . . . . . . . . . . . . . . . . . . . . 5
Table 2. Percentage Change in the Number of Schools, Enrolment and Number of Teachers
by Economic Zone, 1999-00 to 2000-01 . . . . . . . . . . . . . . . . . . . . . . . . . . . . . . . . . . . . . . 5
Table 3. Full-Time Equivalent (FTE) Pupils, Full Time Equivalent Teachers (FTE), Pupil-Teacher
Ratios (PTR), and Teachers per 1000 Students, 1990-91 to 2000-01 . . . . . . . . . . . . . . . 6
Table 4. Full-Time Equivalent (FTE) Pupils, Full-Time Equivalent (FTE) Teachers, Pupil-Teacher
Ratios (PTR), and Teachers per 1000 Students by School District, 2000-01 . . . . . . . . 6
Table 5. Computers in Schools by School District, Processor Type, Internet Access, and
Number of Schools with Computers, 2000-01 . . . . . . . . . . . . . . . . . . . . . . . . . . . . . . . . . 7
Table 6. Ratio of Students to Computers and Students to Computers with Internet Access,
by School District 2000-01 . . . . . . . . . . . . . . . . . . . . . . . . . . . . . . . . . . . . . . . . . . . . . . . . 8
Table 7. Computers Used for Administrative Purposes in Schools by School District, Processor Type,
and Internet Access, 2000-01 . . . . . . . . . . . . . . . . . . . . . . . . . . . . . . . . . . . . . . . . . . . . . . 8
SCHOOL INFORMATION
Table 8. Number of Schools by School District, 1996-97 to 2000-01 . . . . . . . . . . . . . . . . . . . . . . . . . . . . 11
Table 9. Number and Percentage of Schools by School Size and Median School
Size by School District, 2000-01 . . . . . . . . . . . . . . . . . . . . . . . . . . . . . . . . . . . . . . . . . . . 11
Table 10. Urban and Rural Schools by School District, 2000-01 . . . . . . . . . . . . . . . . . . . . . . . . . . . . . . . . . 12
ENROLMENT INFORMATION
Table 11. Enrolment by Grade, 1951-52 to 2000-01 . . . . . . . . . . . . . . . . . . . . . . . . . . . . . . . . . . . . . . . . . . 15
Table 12. Enrolment by Age, 1951-52 to 2000-01 . . . . . . . . . . . . . . . . . . . . . . . . . . . . . . . . . . . . . . . . . . . . 16
Table 13. Enrolment by School District, Showing Actual and Percentage Change from the
Previous Year, 1997-98 to 2000-01 . . . . . . . . . . . . . . . . . . . . . . . . . . . . . . . . . . . . . . . . 17
Table 14. Enrolment by School District and Grade, 2000-01 . . . . . . . . . . . . . . . . . . . . . . . . . . . . . . . . . . . . 17
Table 15. Enrolment by Gender and Grade, 1990-91 to 2000-01 . . . . . . . . . . . . . . . . . . . . . . . . . . . . . . . . 18

vi Table of Contents Education Statistics - Elementary-Secondary, 2000-2001
ENROLMENT INFORMATION (cont’d)
Table 16. Enrolment by School and Grade, 2000-01
District 1 - Labrador . . . . . . . . . . . . . . . . . . . . . . . . . . . . . . . . . . . . . . . . . . . . . . . . . . . . . 19
District 2 - Northern Peninsula/Labrador South . . . . . . . . . . . . . . . . . . . . . . . . . . . . . . . 20
District 3 - Corner Brook/Deer Lake/St. Barbe . . . . . . . . . . . . . . . . . . . . . . . . . . . . . . . . 21
Distr ict 4 - Cormack T rail . . . . . . . . . . . . . . . . . . . . . . . . . . . . . . . . . . . . . . . . . . . . . . . . 22
District 5 - Baie Verte/Central/Connaigre . . . . . . . . . . . . . . . . . . . . . . . . . . . . . . . . . . . . 23
District 6 - Lewisporte/Gander . . . . . . . . . . . . . . . . . . . . . . . . . . . . . . . . . . . . . . . . . . . . . 24
District 7 - Burin . . . . . . . . . . . . . . . . . . . . . . . . . . . . . . . . . . . . . . . . . . . . . . . . . . . . . . . 25
District 8 - Vista . . . . . . . . . . . . . . . . . . . . . . . . . . . . . . . . . . . . . . . . . . . . . . . . . . . . . . . 26
District 9 - Avalon W est . . . . . . . . . . . . . . . . . . . . . . . . . . . . . . . . . . . . . . . . . . . . . . . . . . 27
District 10 - Avalon East . . . . . . . . . . . . . . . . . . . . . . . . . . . . . . . . . . . . . . . . . . . . . . . . . 28
District 11 - Conseil scolaire francophone provincial de Terre-Neuve et du Labrador . . 30
Other Schools . . . . . . . . . . . . . . . . . . . . . . . . . . . . . . . . . . . . . . . . . . . . . . . . . . . . . . . . . 30
Table 17. Enrolment by School District and Gender, 2000-01 . . . . . . . . . . . . . . . . . . . . . . . . . . . . . . . . . . . 31
Table 18. Enrolment by School District and Age, 2000-01 . . . . . . . . . . . . . . . . . . . . . . . . . . . . . . . . . . . . . . 31
Table 19. Enrolment by Subject and Grade, K-6, 2000-01 . . . . . . . . . . . . . . . . . . . . . . . . . . . . . . . . . . . . . 32
Table 20. Enrolment by Subject and Grade, 7-9, 2000-01 . . . . . . . . . . . . . . . . . . . . . . . . . . . . . . . . . . . . . . 32
Table 21. Senior High Course Enrolment by Gender, 1998-99 to 2000-01 . . . . . . . . . . . . . . . . . . . . . . . . . 33
Table 22. Senior H igh Course Enrolment for Courses O ffered Through D istance Education by Gender,
1998-99 to 2000-01 . . . . . . . . . . . . . . . . . . . . . . . . . . . . . . . . . . . . . . . . . . . . . . . . . . . . . 37
Table 23. Enrolment by Grade and Num ber of Schools in Core French (CF), Expanded Core
French (ECF), French Immersion (FI), and French First Language (FFL),
1991-92 to 2000-01 . . . . . . . . . . . . . . . . . . . . . . . . . . . . . . . . . . . . . . . . . . . . . . . . . . . . . 38
Table 24. Core French and Expanded Core French Enrolment by School District and Grade, 2000-01 . . . 39
Table 25. Early and Late French Immersion Enrolment by School District and Grade, 2000-01 . . . . . . . . . 39
Table 26. Number and Percentage of Students Receiving Special Education Services by School District,
2000-01 . . . . . . . . . . . . . . . . . . . . . . . . . . . . . . . . . . . . . . . . . . . . . . . . . . . . . . . . . . . . . . 40
Table 27. Num ber and Percentage of Students Receiving Special Education Services by Gender,
2000-01 . . . . . . . . . . . . . . . . . . . . . . . . . . . . . . . . . . . . . . . . . . . . . . . . . . . . . . . . . . . . . . 40
Table 28. Students Receiving Special Education Services by Category, Gender and Age, 2000-01 . . . . . 41
Table 29. Student Mobility: Reasons for Leaving School by School District, 1999-00 . . . . . . . . . . . . . . . . 42
Table 30. Student Mobility: Totals by Category and School District, 1999-00 . . . . . . . . . . . . . . . . . . . . . . . 42
Table 31. Student Mobility: Reasons For Enrolling in School by School District, 1999-00 . . . . . . . . . . . . . . 43
Table 32. Attendance Rates by District, 1999-00 . . . . . . . . . . . . . . . . . . . . . . . . . . . . . . . . . . . . . . . . . . . . . 43
Table 33. Absentee Rates by School Distr ict, G ender and Reason as a Percentage of the Total Days
Absent with Average Days Absent per Student, 1999-00 . . . . . . . . . . . . . . . . . . . . . . . . 44

Education Statistics - Elementary-Secondary, 2000-2001 Table of Contents vii
ENROLMENT INFORMATION (cont’d)
Table 34. Absentee Rates by Month, Gender and Reason as a Percentage of the Total Days Absent
and the Total Days Absent as a Percent of the Total Possible Days Attendance, 1999-00 . . . . . 45
ACHIEVEMENT INFORMATION
Table 35. French Immersion Language Arts Criter ion Referenced Test Results by School District,
Subtest and Gender, Grade Three, May 2000 (Percent of Students by Level) . . . . . . . . 49
Table 36. Average Final Marks for Selected Level III Courses by Gender, June, 2000 . . . . . . . . . . . . . . . 51
Table 37. Num ber of Students Eligible to Graduate, High School Graduates, and Pass Rate by
School District and Gender, 1999-00 . . . . . . . . . . . . . . . . . . . . . . . . . . . . . . . . . . . . . . . 52
Table 38. Number and Percentage of High School Graduates by School District and
Graduation Status, 1999-00 . . . . . . . . . . . . . . . . . . . . . . . . . . . . . . . . . . . . . . . . . . . . . . 52
Table 39. Num ber and Percentage of High School Graduates by Gender, Term,
Economic Zone, and Graduation Status, 1999-00 . . . . . . . . . . . . . . . . . . . . . . . . . . . . . 53
Table 40. High School Graduates by Age and Gender, and Graduation Rates by Gender,
1989-90 to 1999-00 . . . . . . . . . . . . . . . . . . . . . . . . . . . . . . . . . . . . . . . . . . . . . . . . . . . . . 54
Table 41. High School Leaving Certificates Awarded by Gender and Age, 1989-90 to 1999-00 . . . . . . . . . 55
TEACHER/ADMINISTRATOR INFORMATION
Table 42. Full-Time Equivalent Teachers, 1951-52 to 1999-00 . . . . . . . . . . . . . . . . . . . . . . . . . . . . . . . . . . 59
Table 43. Full-time Equivalent Teachers and Administrators by Position and
Gender, 1989-90 to 2000-01 . . . . . . . . . . . . . . . . . . . . . . . . . . . . . . . . . . . . . . . . . . . . . . 59
Table 44. Average and Median Annual Salary, Age, and Years Teaching Experience
of Full-Time Teachers, 1989-90 to 2000-01 . . . . . . . . . . . . . . . . . . . . . . . . . . . . . . . . . . 60
Table 45. Average and Median Annual Salary, Age, and Years Teaching Experience
of Full-Time District Staff, 1989-90 to 2000-01 . . . . . . . . . . . . . . . . . . . . . . . . . . . . . . . . 60
Table 46. Number and Percentage of Full-time Equivalent Teachers by Salary and Gender, 2000-01 . . . 61
Table 47. Full-Time Equivalent Teachers by Gender with Percentage Change from the Previous Year,
1989-90 to 2000-01 . . . . . . . . . . . . . . . . . . . . . . . . . . . . . . . . . . . . . . . . . . . . . . . . . . . . . 61
Table 48. Full-Time Equivalent Teachers by School District and Years Teaching Experience, 2000-01 . . 62
Table 49. Number of Full-time Equivalent Teachers by Certificate Level and
Point on the Salary Scale, 2000-01 . . . . . . . . . . . . . . . . . . . . . . . . . . . . . . . . . . . . . . . . . 62
viii Table of Contents Education Statistics - Elementary-Secondary, 2000-2001
TEACHER/ADMINISTRATOR INFORMATION (cont’d)
Table 50. Number of Full-time Equivalent Teachers by Age Group, 1990-91 to 2000-01 . . . . . . . . . . . . . . 63
Table 51. Profile of Substitute Teaching, 1989-90 to 1999-00 . . . . . . . . . . . . . . . . . . . . . . . . . . . . . . . . . . . 64
Table 52. Substitute Teachers by Age Group and Gender, 1999-00 . . . . . . . . . . . . . . . . . . . . . . . . . . . . . . 64
Table 53. Substitute Teachers by Years Teaching Experience and Gender, 1999-00 . . . . . . . . . . . . . . . . 64
Table 54. Teachers who Retired in 1999-00 by School District and Gender and
Average Age upon Retirement . . . . . . . . . . . . . . . . . . . . . . . . . . . . . . . . . . . . . . . . . . . . 65
Table 55. Teachers Mobility by Reason and Gender, 2000-01 . . . . . . . . . . . . . . . . . . . . . . . . . . . . . . . . . . 65
Table 56. First-Time Teachers by School Districts and Gender, 1998-99 to 2000-01 . . . . . . . . . . . . . . . . . 66
Table 57. Student Assistants by School District and Gender, 1998-99 to 2000-01 . . . . . . . . . . . . . . . . . . . 66
Table 58. Student Assistants by Gender, 1992-93 to 2000-01 . . . . . . . . . . . . . . . . . . . . . . . . . . . . . . . . . . 66
FINANCIAL INFORMATION
Table 59. School Districts’ Current Expenditures 1999-00 . . . . . . . . . . . . . . . . . . . . . . . . . . . . . . . . . . . . . 69
Table 60. School Districts’ Current Revenues 1999-00 . . . . . . . . . . . . . . . . . . . . . . . . . . . . . . . . . . . . . . . . 69
Table 61. School Districts’ Capital Disbursements 1999-00 . . . . . . . . . . . . . . . . . . . . . . . . . . . . . . . . . . . . 70
Table 62. School Districts’ Capital Receipts 1999-00 . . . . . . . . . . . . . . . . . . . . . . . . . . . . . . . . . . . . . . . . . 70
GLOSSARY OF TERMS . . . . . . . . . . . . . . . . . . . . . . . . . . . . . . . . . . . . . . . . . . . . . . . . . . . . . . . . . . . . . . . . . . . . 73
APPENDIX


Education Statistics - Elementary-Secondary, 2000-01 General Information 3
Figure 1. District Profile, 2000-01

4 General Information Education Statistics - Elementary-Secondary, 2000-01
01 - Nanuk Development Corporation02 - Hyron Regional Economic Development Corporation03 - Central Labrador Economic Development Corporation Inc.04 - Southeastern Aurora Development Corporation05 - Labrador Straits Development Corporation 06 - Nordic Economic Development Corporation07 - Red Ochre Regional Board Inc.08 - Humber Economic Development Board Inc.09 - Long Range Regional Economic Development Board10 - South Western Marine and Mountain Zone Corporation11 - Emerald Zone Corporation12 - Exploits Valley Economic Development Corporation13 - Coast of Bays Corporation14 - Kittiwake Regional Economic Development Corporation15 - Discovery Regional Development Board16 - Schooner Regional Development Corporation17 - Baccalieu Board of Economic Development Corporation18 - Avalon Gateway Regional Economic Development Inc.19 - Capital Coast Development Alliance20 - Irish Loop Regional Economic Development Board
Figure 2. Regional Economic Development Zones
The Province’s Strategic Economic Plan, Change and Challenge (1992), and the report of the Community Economic Development(CED) Task Force, Community Matters: the New Regional Economic Development (1995) introduced the establishment of zones foreconomic planning led by community-based volunteer boards. Table 1 provides the numbers of students, teachers and schools by the20 regional economic development zones. Refer also to Table 43 for information on recent graduates by zone.

Education Statistics - Elementary-Secondary, 2000-01 General Information 5
Table 1. Number of Schools, Enrolment and Number of Teachers by Regional Economic Development Zone, 2000-01
Regional Economic Development Zone 2000-01
01 02 03 04 05 06 07 08 09 10 11 12 13 14 15 16 17 18 19 20 Total
Number ofSchools
6 5 9 10 4 14 13 23 22 10 21 18 9 31 21 19 24 5 66 7 337
Enrolment 1,085 1,782 2,285 556 390 1,755 1,770 6,996 4,408 1,591 2,947 4,495 1,330 8,323 4,650 4,430 7,461 1,558 30,633 1,722 90,167
K 75 130 175 44 19 92 82 432 253 76 192 262 65 440 293 269 418 94 1,974 81 5,466
1 78 118 162 41 29 87 95 441 285 105 175 278 88 517 316 277 460 81 2,037 96 5,766
2 86 112 160 35 29 120 106 474 296 85 199 277 88 507 323 258 435 82 2,030 108 5,810
3 78 117 178 52 29 133 109 535 318 103 181 295 95 526 331 287 503 90 2,217 113 6,290
4 90 124 170 40 29 109 125 505 351 125 192 330 96 595 342 284 472 115 2,285 101 6,480
5 111 141 302 37 29 136 136 565 336 128 225 354 94 659 349 317 534 123 2,395 137 7,108
6 93 120 154 49 29 141 131 550 325 130 251 390 118 636 388 365 507 131 2,326 117 6,951
7 101 143 149 33 22 149 166 541 322 136 229 327 96 632 304 339 590 112 2,336 142 6,869
8 102 116 291 45 36 154 145 577 331 118 236 374 117 642 338 356 649 140 2,484 144 7,395
9 93 142 143 47 41 145 175 543 395 128 250 381 105 732 379 366 631 154 2,533 157 7,540
10 62 164 179 57 29 159 193 602 441 148 284 383 127 831 424 422 729 156 2,488 157 8,035
11 58 183 115 40 37 164 165 596 368 142 234 385 113 779 414 390 803 131 2,626 189 7,932
12 53 152 107 32 32 153 136 580 360 157 263 377 125 743 413 461 650 141 2,424 164 7,523
4th1 5 20 0 4 0 13 6 55 27 10 36 82 3 84 36 39 80 8 478 16 1,002
Teachers 2 94 117 171 61 39 155 144 478 334 122 232 315 114 589 349 330 511 109 1,891 128 6,283
Table 2. Percentage Change in the Number of Schools, Enrolment and Number of Teachers by Economic Zone, 1999-00 to 2000-01
Regional Economic Development Zone
01 02 03 04 05 06 07 08 09 10 11 12 13 14 15 16 17 18 19 20 Total
Schools 0.0 0.0 0.0 0.0 0.0 0.0 0.0 -4.2 4.8 11.1 0.0 0.0 0.0 -3.1 -4.5 5.5 -17.2 0.0 -1.5 0.0 -1.7
Enrolment -2.7 -3.7 -0.6 -3.1 -3.5 -5.7 -5.9 -4.7 -5.6 -4.4 -4.3 -4.2 -7.3 -4.8 -10.5 -5.2 -0.6 -3.5 -2.9 -5.7 -4.0
Teachers -6.9 -3.3 3.6 0.0 8.3 -0.6 -1.4 -3.4 -2.3 -0.8 -0.4 -3.7 -2.6 -2.2 -6.9 -2.1 2.2 0.9 -0.4 -0.8 -1.4
01 - Nanuk Development Corporation02 - Hyron Regional Economic Development Corporation03 - Central Labrador Economic Development Corporation Inc.04 - Southeastern Aurora Development Corporation05 - Labrador Straits Development Corporation 06 - Nordic Economic Development Corporation07 - Red Ochre Regional Board Inc.08 - Humber Economic Development Board Inc.09 - Long Range Regional Economic Development Board10 - South Western Marine and Mountain Zone Corporation
11 - Emerald Zone Corporation12 - Exploits Valley Economic Development Corporation13 - Coast of Bays Corporation14 - Kittiwake Regional Economic Development Corporation15 - Discovery Regional Development Board16 - Schooner Regional Development Corporation17 - Baccalieu Board of Economic Development Corporation18 - Avalon Gateway Regional Economic Development Inc.19 - Capital Coast Development Alliance20 - Irish Loop Regional Economic Development Board
1 Students who previously attended senior high for at least three years.2 Teachers are full-time equivalents rounded to the nearest whole number. Calculations are based on full-time equivalents rounded to the first decimal.

6 General Information Education Statistics - Elementary-Secondary, 2000-01
Table 3. Full-Time Equivalent (FTE) Pupils, Full-Time Equivalent (FTE) Teachers, Pupil-Teacher Ratios (PTR), and Teachers per 1000 Students, 1990-91 to 2000-01
YearFTE Pupils
FTETeachers
PTR1 Teachers per 1000 Students2
a b a/b (1000/a)*b
1990-91 122,812 8,015 15.3 65.3
1991-92 121,136 7,951 15.2 65.6
1992-93 117,957 7,885 15.0 66.8
1993-94 114,558 7,769 14.7 67.8
1994-95 110,227 7,521 14.7 68.2
1995-96 106,728 7,259 14.7 68.0
1996-97 102,794 7,101 14.5 69.1
1997-98 98,379 6,705 14.7 68.2
1998-99 94,493 6,453 14.6 68.3
1999-00 91,053 6,372 14.3 70.0
2000-01 87,438 6,283 13.9 71.9
Percentage Change
1990-91 to 2000-01 (10 years) -28.8% -21.6% -9.2% 10.1%
Table 4 . Full-Time Equivalent (FTE) Pupils, Full-Time Equivalent (FTE) Teachers, Pupil-Teacher Ratios (PTR), and Teachers per 1000 Students by School District, 2000-01
School DistrictFTE Pupils
FTE Teachers
PTR1 Teachers per1000 Students2
a b a/b (1000/a)*b
Labrador 5,080 394 12.9 77.5
Northern Peninsula/Labrador South 3,307 303 10.9 91.6
Corner Brk/Deer Lake/St. Barbe 7,663 555 13.8 72.5
Cormack Trail 5,698 439 13.0 77.0
Baie Verte/Central/Connaigre 8,394 650 12.9 77.5
Lewisporte/Gander 8,237 601 13.7 73.0
Burin 4,296 330 13.0 76.9
Vista 4,302 332 12.9 77.3
Avalon West 10,220 724 14.1 70.9
Avalon East 29,997 1,921 15.6 64.0
Conseil scolaire francophone de Terre-Neuveet du Labrador
247 34 7.4 135.6
Total 3 87,438 6,283 13.9 71.9
1 Ratio of full-time equivalent pupils to teacher.2 Ratio of full-time equivalent teachers to 1000 pupils.3 Full-time equivalents are rounded to the nearest whole number. Calculations are based on full-time equivalents rounded to the first decimal.

Education Statistics - Elementary-Secondary, 2000-01 General Information 7
Table 5 . Computers in Schools by School District, Processor Type, Internet Access, and Number of Schools with Computers, 2000-01
School District Purpose
Processor TypeTotal
Computers
Computerswith Internet
Access 386 Mhzor Lower
486 Mhz Pentium Mac Other
Labrador Classroom-based 27 104 238 0 0 369 300Computer Laboratory 7 3 351 0 0 361 248Library/Learning Resource Centre 0 41 82 2 0 125 116Distance Education 1 1 5 0 1 8 4
Northern Peninsula/Labrador South Classroom-based 62 43 51 0 0 156 43Computer Laboratory 45 91 279 0 7 422 323Library/Learning Resource Centre 13 9 34 0 0 56 31Distance Education 3 3 14 0 0 20 8
Corner Brk/Deer Lake/St. Barbe Classroom-based 46 102 95 1 0 244 108Computer Laboratory 46 255 456 4 3 764 630Library/Learning Resource Centre 14 51 54 0 0 119 81Distance Education 0 1 9 0 0 10 6
Cormack Trail Classroom-based 44 87 92 0 7 230 105Computer Laboratory 134 157 279 0 7 577 356Library/Learning Resource Centre 7 30 35 0 3 75 39Distance Education 1 0 7 0 0 8 7
Baie Verte/Central/Connaigre Classroom-based 115 115 105 55 2 392 110Computer Laboratory 117 204 525 95 20 961 680Library/Learning Resource Centre 18 46 77 11 4 156 98Distance Education 1 2 11 0 1 15 8
Lewisporte/Gander Classroom-based 156 102 121 0 0 379 150Computer Laboratory 39 106 723 0 0 868 806Library/Learning Resource Centre 11 29 80 0 0 120 89Distance Education 1 0 13 0 0 14 13
Burin Classroom-based 14 121 41 1 0 177 41Computer Laboratory 0 34 382 0 15 431 406Library/Learning Resource Centre 6 18 56 0 1 81 62Distance Education 0 0 6 0 0 6 4
Vista Classroom-based 27 43 32 0 0 102 55Computer Laboratory 43 33 391 0 4 471 424Library/Learning Resource Centre 10 4 49 0 0 63 54Distance Education 0 0 13 0 0 13 12
Avalon West Classroom-based 207 229 173 56 5 670 288Computer Laboratory 16 214 838 1 4 1,073 947Library/Learning Resource Centre 7 51 76 8 0 142 89Distance Education 0 0 36 0 0 36 33
Avalon East Classroom-based 135 278 588 35 12 1,048 654Computer Laboratory 55 405 1,306 9 1 1,776 1,616Library/Learning Resource Centre 20 83 332 0 0 435 379Distance Education 0 0 1 0 0 1 1
Conseil scolaire francophone deTerre-Neuve et du Labrador
Classroom-based 2 3 3 0 0 8 4Computer Laboratory 0 2 25 0 10 37 32Library/Learning Resource Centre 0 0 2 0 0 2 1Distance Education 0 0 3 0 0 3 3
Total 1,450 3,100 8,089 278 107 13,024 9,464

8 General Information Education Statistics - Elementary-Secondary, 2000-01
Table 6 . Ratio of Students to Computers1 and Students to Computers with Internet Access by School District, 2000-01
School District Total Computers(486 or higher) 2
Students to ComputerRatio
Computers with InternetAccess
Students to Computers withInternet Access Ratio
Labrador 828 6.4 768 6.9Northern Peninsula/Labrador South 531 6.4 405 8.4Corner Brk/Deer Lake/St. Barbe 1,031 7.7 825 9.6Cormack Trail 704 8.3 507 11.6Baie Verte/Central/Connaigre 1,273 6.8 896 9.7Lewisporte/Gander 1,174 7.2 1,058 8.0Burin 675 6.6 513 8.6Vista 569 7.8 545 8.1Avalon West 1,691 6.2 1,357 7.8Avalon East 3,050 10.2 2,650 11.7Conseil scolaire francophone deTerre-Neuve et du Labrador
48 5.3 40 6.4
Total 11,574 7.8 9,564 9.4
Table 7 . Computers Used for Administrative Purposes in Schools by School District, Processor Type, and Internet Access, 2000-01
School District
Processor Type TotalComputers
Computerswith
InternetAccess
Number ofSchools withComputers 386 or Lower 486 Mhz Pentium Mac Other
Labrador 1 6 55 0 3 65 62 19Northern Peninsula/Labrador South 2 11 29 0 1 43 27 32Corner Brk/Deer Lake/St. Barbe 2 13 89 0 0 104 87 30Cormack Trail 11 17 53 1 1 83 47 30Baie Verte/Central/Connaigre 6 19 96 6 2 129 98 47Lewisporte/Gander 2 12 114 0 1 129 115 33Burin 2 9 42 0 3 56 51 19Vista 1 7 60 0 1 69 65 18Avalon West 0 13 105 0 0 118 113 36Avalon East 5 20 314 0 2 341 314 67Conseil scolaire francophone deTerre-Neuve et du Labrador
0 2 3 0 1 6 4 6
Total 32 129 960 7 15 1,143 983 337
1 Excludes computers used for administrative purposes and with processor types less than 486Mhz.2 Includes Apple and other computers.


Education Statistics - Elementary-Secondary, 2000-01 School Information 11
Table 8. Number of Schools by School District, 1996-97 to 2000-01
School District 1996-1997 1997-1998 1998-1999 1999-2000 2000-01
Labrador 22 20 19 19 19
No rthern Peninsula/La brad or South 41 34 33 32 32
Corner Brook/Deer Lake/St. Barbe 38 36 31 31 30
Co rm ack T rail 39 36 30 28 30
Ba ie Ve rte/Ce ntral/C onn aigre 61 56 48 47 47
Lewisporte/Gander 44 41 34 34 33
Bu rin 23 21 21 18 19
Vista 21 19 18 18 18
Avalon W est 58 46 45 42 36
Avalon East 85 82 80 68 67
Conseil scolaire francophone provincial de
Terre-Neuve et du Labrador 0 0 6 6 6
Total 432 391 365 343 337
Table 9. Number and Percentage of Schools by School Size, and Median School Size, by School District, 2000-01
School District
Sch ools by S choo l Size
Total
Median
School
Size
<50 50-100 100-199 200-299 300-399 400 or Mo re
No. % No. % No. % No. % No. % No. %
Labrador 1 5.3 3 15.8 3 21.0 2 10.5 4 21.1 6 31.6 19 355 .0
No rthern Peninsula/La brad or South 7 21.9 12 37.5 9 28.1 3 9.4 1 3.1 0 0.0 32 81.0
Corner Brook/Deer Lake/St. Barbe 3 10.0 1 3.3 7 22.5 6 20.0 7 23.3 6 20.0 30 279 .0
Co rm ack T rail 6 20.0 4 13.3 8 26.7 5 16.7 3 10.0 4 13.3 30 167 .5
Ba ie Ve rte/Ce ntral/C onn aigre 5 10.6 9 19.1 13 27.6 12 25.5 4 8.5 4 8.5 47 177 .0
Lewisporte/Gander 3 9.1 2 6.1 7 21.2 11 33.3 5 15.2 5 15.2 33 233 .0
Bu rin 5 26.3 0 0.0 5 26.3 3 15.8 3 15.8 3 15.8 19 195 .0
Vista 0 0.0 2 11.1 5 27.8 7 38.9 1 5.6 3 16.7 18 214 .5
Avalon W est 0 0.0 4 11.1 10 27.8 6 16.7 10 27.8 6 16.7 36 244 .5
Avalon East 1 1.5 0 0.0 8 11.9 7 10.4 10 14.9 41 61.2 67 500 .0
Conseil scolaire francophone
provincial de Terre-Neuve et du
Labrador
4 66.7 2 33.3 0 0.0 0 0.0 0 0.0 0 0.0 6 39.0
Total 35 10.4 39 11.6 75 22.3 62 18.4 48 14.2 78 23.1 337 224
12 School Information Education Statistics - Elementary-Secondary, 2000-01
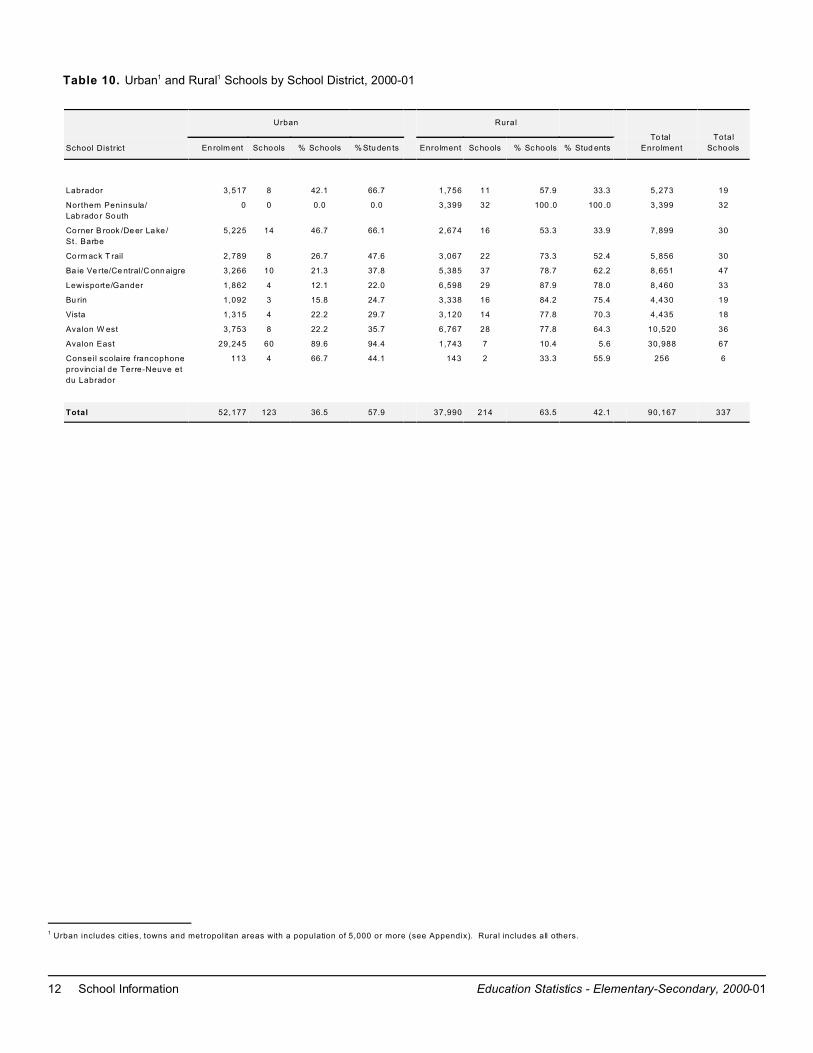
Table 10. Urban1 and Rural1 Schools by School District, 2000-01
School District
Urban Rural
To tal
Enrolment
Total
Sc hoolsEn rolm ent Sc hools % Sc hools % Studen ts Enrolment Sc hools % Sc hools % Stud ents
Labrador 3,517 8 42.1 66.7 1,756 11 57.9 33.3 5,273 19
Northern Peninsula/
Lab rado r South
0 0 0.0 0.0 3,399 32 100 .0 100 .0 3,399 32
Co rner B rook /De er La ke /
St. Barbe
5,225 14 46.7 66.1 2,674 16 53.3 33.9 7,899 30
Co rm ack T rail 2,789 8 26.7 47.6 3,067 22 73.3 52.4 5,856 30
Ba ie Ve rte/Ce ntral/C onn aigre 3,266 10 21.3 37.8 5,385 37 78.7 62.2 8,651 47
Lewisporte/Gander 1,862 4 12.1 22.0 6,598 29 87.9 78.0 8,460 33
Bu rin 1,092 3 15.8 24.7 3,338 16 84.2 75.4 4,430 19
Vista 1,315 4 22.2 29.7 3,120 14 77.8 70.3 4,435 18
Avalon W est 3,753 8 22.2 35.7 6,767 28 77.8 64.3 10,520 36
Avalon East 29,245 60 89.6 94.4 1,743 7 10.4 5.6 30,988 67
Conseil scolaire francophone
provincial de Terre-Neuve et
du Labrador
113 4 66.7 44.1 143 2 33.3 55.9 256 6
Total 52,177 123 36.5 57.9 37,990 214 63.5 42.1 90,167 337
1 Urban includes cit ies, towns and metropolitan areas with a population of 5,000 or more (see Appendix). Rural includes all others.


Education Statistics - Elementary-Secondary, 2000-01 Enrolment Information 15
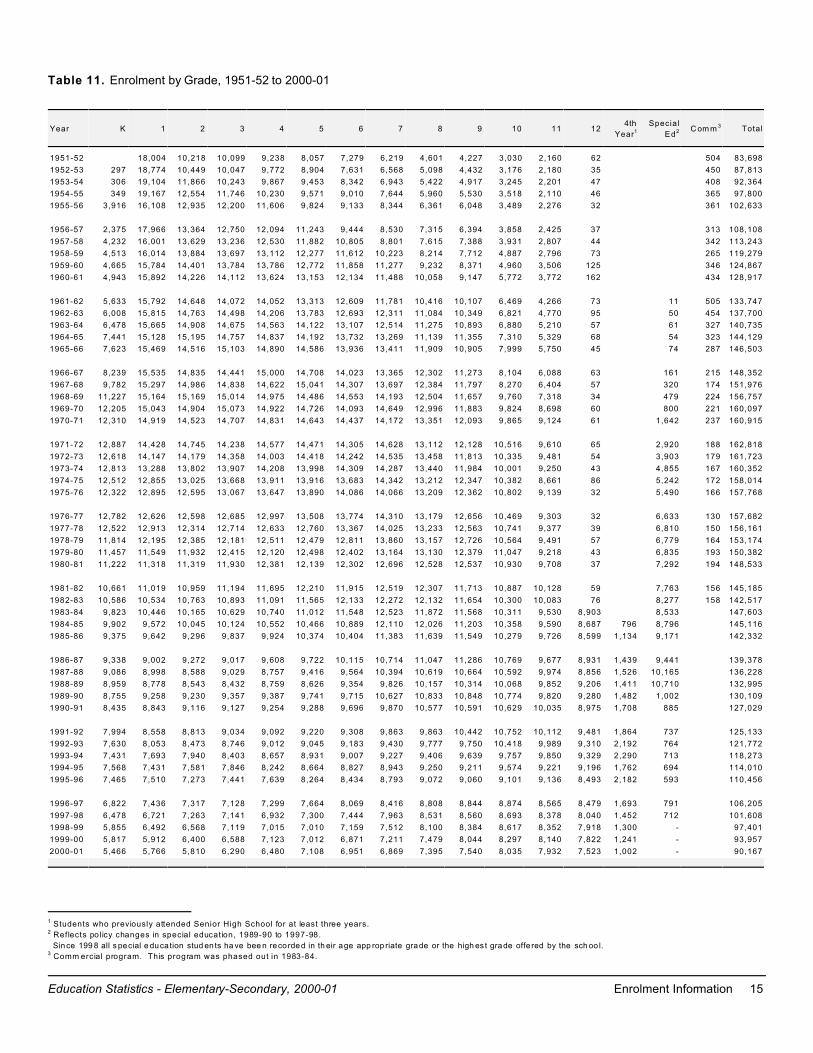
Table 11. Enrolment by Grade, 1951-52 to 2000-01
Year K 1 2 3 4 5 6 7 8 9 10 11 124th
Year1
Special
Ed2 C om m 3 Total
1951-52 18,004 10,218 10,099 9,238 8,057 7,279 6,219 4,601 4,227 3,030 2,160 62 504 83,698
1952-53 297 18,774 10,449 10,047 9,772 8,904 7,631 6,568 5,098 4,432 3,176 2,180 35 450 87,813
1953-54 306 19,104 11,866 10,243 9,867 9,453 8,342 6,943 5,422 4,917 3,245 2,201 47 408 92,364
1954-55 349 19,167 12,554 11,746 10,230 9,571 9,010 7,644 5,960 5,530 3,518 2,110 46 365 97,800
1955-56 3,916 16,108 12,935 12,200 11,606 9,824 9,133 8,344 6,361 6,048 3,489 2,276 32 361 102,633
1956-57 2,375 17,966 13,364 12,750 12,094 11,243 9,444 8,530 7,315 6,394 3,858 2,425 37 313 108,108
1957-58 4,232 16,001 13,629 13,236 12,530 11,882 10,805 8,801 7,615 7,388 3,931 2,807 44 342 113,243
1958-59 4,513 16,014 13,884 13,697 13,112 12,277 11,612 10,223 8,214 7,712 4,887 2,796 73 265 119,279
1959-60 4,665 15,784 14,401 13,784 13,786 12,772 11,858 11,277 9,232 8,371 4,960 3,506 125 346 124,867
1960-61 4,943 15,892 14,226 14,112 13,624 13,153 12,134 11,488 10,058 9,147 5,772 3,772 162 434 128,917
1961-62 5,633 15,792 14,648 14,072 14,052 13,313 12,609 11,781 10,416 10,107 6,469 4,266 73 11 505 133,747
1962-63 6,008 15,815 14,763 14,498 14,206 13,783 12,693 12,311 11,084 10,349 6,821 4,770 95 50 454 137,700
1963-64 6,478 15,665 14,908 14,675 14,563 14,122 13,107 12,514 11,275 10,893 6,880 5,210 57 61 327 140,735
1964-65 7,441 15,128 15,195 14,757 14,837 14,192 13,732 13,269 11,139 11,355 7,310 5,329 68 54 323 144,129
1965-66 7,623 15,469 14,516 15,103 14,890 14,586 13,936 13,411 11,909 10,905 7,999 5,750 45 74 287 146,503
1966-67 8,239 15,535 14,835 14,441 15,000 14,708 14,023 13,365 12,302 11,273 8,104 6,088 63 161 215 148,352
1967-68 9,782 15,297 14,986 14,838 14,622 15,041 14,307 13,697 12,384 11,797 8,270 6,404 57 320 174 151,976
1968-69 11,227 15,164 15,169 15,014 14,975 14,486 14,553 14,193 12,504 11,657 9,760 7,318 34 479 224 156,757
1969-70 12,205 15,043 14,904 15,073 14,922 14,726 14,093 14,649 12,996 11,883 9,824 8,698 60 800 221 160,097
1970-71 12,310 14,919 14,523 14,707 14,831 14,643 14,437 14,172 13,351 12,093 9,865 9,124 61 1,642 237 160,915
1971-72 12,887 14,428 14,745 14,238 14,577 14,471 14,305 14,628 13,112 12,128 10,516 9,610 65 2,920 188 162,818
1972-73 12,618 14,147 14,179 14,358 14,003 14,418 14,242 14,535 13,458 11,813 10,335 9,481 54 3,903 179 161,723
1973-74 12,813 13,288 13,802 13,907 14,208 13,998 14,309 14,287 13,440 11,984 10,001 9,250 43 4,855 167 160,352
1974-75 12,512 12,855 13,025 13,668 13,911 13,916 13,683 14,342 13,212 12,347 10,382 8,661 86 5,242 172 158,014
1975-76 12,322 12,895 12,595 13,067 13,647 13,890 14,086 14,066 13,209 12,362 10,802 9,139 32 5,490 166 157,768
1976-77 12,782 12,626 12,598 12,685 12,997 13,508 13,774 14,310 13,179 12,656 10,469 9,303 32 6,633 130 157,682
1977-78 12,522 12,913 12,314 12,714 12,633 12,760 13,367 14,025 13,233 12,563 10,741 9,377 39 6,810 150 156,161
1978-79 11,814 12,195 12,385 12,181 12,511 12,479 12,811 13,860 13,157 12,726 10,564 9,491 57 6,779 164 153,174
1979-80 11,457 11,549 11,932 12,415 12,120 12,498 12,402 13,164 13,130 12,379 11,047 9,218 43 6,835 193 150,382
1980-81 11,222 11,318 11,319 11,930 12,381 12,139 12,302 12,696 12,528 12,537 10,930 9,708 37 7,292 194 148,533
1981-82 10,661 11,019 10,959 11,194 11,695 12,210 11,915 12,519 12,307 11,713 10,887 10,128 59 7,763 156 145,185
1982-83 10,586 10,534 10,763 10,893 11,091 11,565 12,133 12,272 12,132 11,654 10,300 10,083 76 8,277 158 142,517
1983-84 9,823 10,446 10,165 10,629 10,740 11,012 11,548 12,523 11,872 11,568 10,311 9,530 8,903 8,533 147,603
1984-85 9,902 9,572 10,045 10,124 10,552 10,466 10,889 12,110 12,026 11,203 10,358 9,590 8,687 796 8,796 145,116
1985-86 9,375 9,642 9,296 9,837 9,924 10,374 10,404 11,383 11,639 11,549 10,279 9,726 8,599 1,134 9,171 142,332
1986-87 9,338 9,002 9,272 9,017 9,608 9,722 10,115 10,714 11,047 11,286 10,769 9,677 8,931 1,439 9,441 139,378
1987-88 9,086 8,998 8,588 9,029 8,757 9,416 9,564 10,394 10,619 10,664 10,592 9,974 8,856 1,526 10,165 136,228
1988-89 8,959 8,778 8,543 8,432 8,759 8,626 9,354 9,826 10,157 10,314 10,068 9,852 9,206 1,411 10,710 132,995
1989-90 8,755 9,258 9,230 9,357 9,387 9,741 9,715 10,627 10,833 10,848 10,774 9,820 9,280 1,482 1,002 130,109
1990-91 8,435 8,843 9,116 9,127 9,254 9,288 9,696 9,870 10,577 10,591 10,629 10,035 8,975 1,708 885 127,029
1991-92 7,994 8,558 8,813 9,034 9,092 9,220 9,308 9,863 9,863 10,442 10,752 10,112 9,481 1,864 737 125,133
1992-93 7,630 8,053 8,473 8,746 9,012 9,045 9,183 9,430 9,777 9,750 10,418 9,989 9,310 2,192 764 121,772
1993-94 7,431 7,693 7,940 8,403 8,657 8,931 9,007 9,227 9,406 9,639 9,757 9,850 9,329 2,290 713 118,273
1994-95 7,568 7,431 7,581 7,846 8,242 8,664 8,827 8,943 9,250 9,211 9,574 9,221 9,196 1,762 694 114,010
1995-96 7,465 7,510 7,273 7,441 7,639 8,264 8,434 8,793 9,072 9,060 9,101 9,136 8,493 2,182 593 110,456
1996-97 6,822 7,436 7,317 7,128 7,299 7,664 8,069 8,416 8,808 8,844 8,874 8,565 8,479 1,693 791 106,205
1997-98 6,478 6,721 7,263 7,141 6,932 7,300 7,444 7,963 8,531 8,560 8,693 8,378 8,040 1,452 712 101,608
1998-99 5,855 6,492 6,568 7,119 7,015 7,010 7,159 7,512 8,100 8,384 8,617 8,352 7,918 1,300 - 97,401
1999-00 5,817 5,912 6,400 6,588 7,123 7,012 6,871 7,211 7,479 8,044 8,297 8,140 7,822 1,241 - 93,957
2000-01 5,466 5,766 5,810 6,290 6,480 7,108 6,951 6,869 7,395 7,540 8,035 7,932 7,523 1,002 - 90,167
1 Students who previously attended Senior High School for at least three years.2 Reflects pol icy changes in special education, 1989-90 to 1997-98.
Sin ce 199 8 all s pecial e duca tion stud en ts ha ve bee n recorded in th eir age app rop riate grade or the high es t grade offe red by the sch oo l.3 Comm ercial program. This program was phased out in 1983-84.

16 Enrolment Information Education Statistics - Elementary-Secondary, 2000-01
Table 12. Enrolment by Age, 1951-52 to 2000-01
Year 5 6 7 8 9 10 11 12 13 14 15 16 17 18 19 20+ Total
1951-52 3,305 9,015 9,171 8,829 8,018 7,576 7,132 7,455 6,695 6,135 4,811 3,158 1,602 577 173 46 83,698
1952-53 3,347 9,834 10,072 8,970 8,723 8,019 7,411 7,189 7,298 6,456 5,160 3,073 1,560 539 110 52 87,813
1953-54 3,386 9,961 11,130 10,061 8,927 8,803 7,947 7,376 7,140 7,096 5,217 3,239 1,464 480 96 41 92,364
1954-55 3,270 10,419 11,326 11,213 9,986 8,959 8,864 8,035 7,348 6,927 5,953 3,393 1,520 469 78 40 97,800
1955-56 3,801 10,569 11,573 11,350 11,026 10,060 8,749 8,778 7,849 7,128 5,788 3,795 1,553 477 85 52 102,633
1956-57 3,657 11,375 11,668 11,527 11,193 11,173 9,913 8,917 8,583 7,723 6,093 3,838 1,779 531 113 25 108,108
1957-58 3,830 11,310 12,151 11,696 11,369 11,335 11,097 9,913 8,713 8,443 6,568 4,035 1,936 670 128 49 113,243
1958-59 4,073 11,655 12,069 12,307 11,688 11,434 11,410 10,969 9,946 8,725 7,517 4,567 2,042 695 125 57 119,279
1959-60 4,283 11,902 12,282 12,174 12,395 11,792 11,366 11,354 10,986 9,882 7,654 5,298 2,429 856 155 59 124,867
1960-61 4,648 12,247 12,395 12,247 11,986 12,167 11,535 11,261 11,228 10,726 8,665 5,697 2,850 995 193 77 128,917
1961-62 5,352 12,420 12,756 12,500 12,161 11,845 12,139 11,424 11,224 11,177 9,665 6,460 3,047 1,236 243 98 133,747
1962-63 5,892 12,666 12,713 12,827 12,446 12,243 11,873 12,053 11,632 11,140 9,908 7,198 3,538 1,205 272 94 137,700
1963-64 6,183 13,003 13,037 12,703 12,773 12,513 12,119 11,943 12,168 11,438 9,959 7,355 3,854 1,363 246 78 140,735
1964-65 6,930 12,727 13,296 13,064 12,742 12,833 12,432 12,082 11,806 11,983 10,338 7,803 4,176 1,548 300 69 144,129
1965-66 6,937 13,277 12,977 13,229 13,021 12,795 12,647 12,477 12,118 11,593 10,816 8,265 4,353 1,567 338 93 146,503
1966-67 7,532 13,420 13,360 12,848 13,074 12,929 12,587 12,616 12,210 12,001 10,548 8,712 4,492 1,635 302 86 148,352
1967-68 8,900 13,132 13,693 13,430 12,908 13,211 12,869 12,637 12,641 12,078 11,105 8,526 4,675 1,822 274 75 151,976
1968-69 10,439 13,444 13,388 13,695 13,497 12,981 13,138 12,878 12,402 12,532 11,344 9,321 4,994 2,206 372 126 156,757
1969-70 11,510 13,501 13,361 13,379 13,515 13,470 12,832 13,078 13,032 12,263 11,962 9,668 5,510 2,371 488 157 160,097
1970-71 11,589 13,719 13,487 13,250 13,106 13,521 13,378 12,883 13,023 12,690 11,683 10,199 5,346 2,429 460 152 160,915
1971-72 14,806 13,473 13,593 13,583 13,317 13,308 13,145 13,105 12,879 12,571 11,719 9,369 5,282 2,061 464 143 162,818
1972-73 15,875 12,993 13,615 13,513 13,202 13,314 12,865 13,249 13,053 12,568 11,814 9,316 4,336 1,637 286 87 161,723
1973-74 16,563 12,522 13,203 13,323 13,137 13,491 13,367 13,496 13,069 12,526 11,535 8,762 3,814 1,300 193 51 160,352
1974-75 15,323 12,452 12,826 13,336 13,466 13,606 13,430 13,244 13,198 12,910 11,603 8,162 3,336 937 149 36 158,014
1975-76 12,071 12,468 12,477 12,757 13,332 13,318 13,747 13,489 13,318 12,907 12,622 10,247 3,666 1,140 156 53 157,768
1976-77 12,832 12,459 12,554 12,602 12,765 13,335 13,506 13,546 13,451 12,916 11,800 10,485 4,080 1,121 177 53 157,682
1977-78 12,009 12,472 12,289 12,481 12,465 12,487 13,158 13,371 13,674 13,167 12,429 10,515 4,199 1,205 167 73 156,161
1978-79 11,517 11,957 12,395 12,172 12,324 12,309 12,495 13,117 13,205 13,408 12,522 10,414 3,946 1,152 183 58 153,174
1979-80 11,123 11,444 11,884 12,399 12,022 12,316 12,267 12,359 13,027 13,093 12,698 10,517 3,900 1,076 190 67 150,382
1980-81 10,929 11,126 11,369 11,976 12,386 12,030 12,272 12,291 12,399 12,989 12,226 11,019 4,151 1,108 190 72 148,533
1981-82 10,427 10,885 10,984 11,321 11,907 12,229 11,895 12,243 12,259 12,313 12,163 10,921 4,160 1,241 158 79 145,185
1982-83 10,384 10,464 10,939 11,011 11,336 11,833 12,309 11,883 12,186 12,160 11,719 10,988 3,902 1,174 155 74 142,517
1983-84 9,700 10,367 10,494 10,863 10,954 11,315 11,959 12,233 11,904 12,155 11,561 10,898 9,678 2,715 667 140 147,603
1984-85 9,759 9,678 10,337 10,402 10,901 10,858 11,224 11,783 12,206 11,676 11,763 10,833 9,487 3,131 885 193 145,116
1985-86 9,249 9,748 9,594 10,164 10,465 10,843 10,894 11,155 11,725 12,144 11,499 10,917 9,576 3,112 1,006 241 142,332
1986-87 9,262 9,205 9,632 9,498 10,150 10,250 10,785 10,768 11,069 11,628 11,686 10,679 9,869 3,289 1,057 551 139,378
1987-88 9,016 9,216 9,168 9,543 9,448 10,114 10,175 10,575 10,767 10,980 11,447 11,192 9,793 3,241 1,093 460 136,228
1988-89 8,941 9,072 9,178 9,085 9,512 9,483 10,047 10,113 10,597 10,681 10,831 10,769 10,096 3,091 1,014 485 132,995
1989-90 8,679 8,953 9,067 9,168 9,146 9,549 9,408 10,017 10,134 10,504 10,601 10,271 9,848 3,192 957 615 130,109
1990-91 8,321 8,650 8,902 8,994 9,078 9,109 9,482 9,373 10,078 10,064 10,441 10,083 9,433 3,242 1,001 778 127,029
1991-92 7,909 8,310 8,632 8,905 9,024 9,116 9,065 9,538 9,332 9,994 10,082 10,063 9,588 3,252 1,111 1,212 125,133
1992-93 7,544 7,908 8,331 8,628 8,920 8,971 9,099 9,154 9,527 9,338 9,922 9,814 9,497 3,267 1,175 677 121,772
1993-94 7,340 7,574 7,830 8,301 8,591 8,832 9,000 9,051 9,048 9,479 9,268 9,801 9,214 3,384 1,104 456 118,273
1994-95 7,529 7,230 7,526 7,733 8,179 8,514 8,880 8,843 9,013 9,028 9,317 8,934 9,239 2,629 999 417 114,010
1995-96 7,390 7,391 7,170 7,394 7,634 8,125 8,385 8,670 8,749 8,844 8,863 9,095 8,608 3,006 812 320 110,456
1996-97 6,718 7,285 7,264 7,088 7,283 7,518 8,046 8,306 8,521 8,671 8,718 8,695 8,698 2,388 678 328 106,205
1997-98 6,378 6,576 7,155 7,135 6,973 7,170 7,451 7,846 8,273 8,465 8,496 8,465 8,220 2,242 542 221 101,608
1998-99 5,751 6,331 6,489 7,056 7,031 6,860 7,153 7,330 7,846 8,218 8,377 8,352 8,042 1,888 505 172 97,401
1999-00 5,699 5,779 6,279 6,456 7,038 6,974 6,811 6,957 7,260 7,745 8,320 8,189 7,975 1,896 437 142 93,957
2000-01 5,394 5,678 5,733 6,277 6,399 7,004 7,018 6,788 7,022 7,341 7,765 7,854 7,681 1,743 362 108 90,167

Education Statistics - Elementary-Secondary, 2000-01 Enrolment Information 17
Table 13. Enrolment by School District, Showing Actual and Percentage Change from the Previous Year, 1997-98 to 2000-01
Change from the
Previous Year
Change from the
Previous Year
Change from the
Previous Year
Sc hoo l District 1997-98 1998-99 Actual % 1999-00 Actual % 2000-01 Actual %
Labrador 5,764 5,516 -248 -4.3 5,391 -125 -2.3 5,273 -118 -2.2
No rthern Peninsula/La brad or South 3,923 3,769 -154 -3.9 3,565 -204 -5.4 3,399 -166 -4.7
Corner Brook/Deer Lake/St. Barbe 8,999 8,610 -389 -4.3 8,314 -296 -3.4 7,899 -415 -5.0
Co rm ack T rail 7,166 6,598 -568 -7.9 6,183 -415 -6.3 5,856 -327 -5.3
Ba ie Ve rte/Ce ntral/C onn aigre 10,014 9,494 -520 -5.2 9,064 -430 -4.5 8,651 -413 -4.6
Lewisporte/Gander 9,795 9,248 -547 -5.6 8,897 -351 -3.8 8,460 -437 -4.9
Bu rin 5,244 4,913 -331 -6.3 4,675 -238 -4.8 4,430 -245 -5.2
Vista 5,144 4,868 -276 -5.4 4,714 -154 -3.2 4,435 -279 -5.9
Avalon W est 12,061 11,461 -600 -5.0 10,966 -495 -4.3 10,520 -446 -4.1
Avalon East 33,498 32,656 -842 -2.5 31,930 -726 -2.2 30,988 -942 -3.0
Conseil scolaire francophone provincial
deTerre-Neuve et du Labrador
268 268 N/A 258 -10 -3.7 256 -2 -0.8
Total 101,608 97,401 -4,207 -4.1 93,957 -3,444 -3.5 90,167 -3,790 -4.0
Table 14. Enrolment by School District and Grade, 2000-01
School District K 1 2 3 4 5 6 7 8 9 10 11 12 4 th
Yr1Total
Labrador 386 359 361 385 392 568 379 399 511 395 420 372 320 26 5,273
No rthern Peninsula/La brad or South 185 189 223 241 225 247 264 281 298 307 334 305 281 19 3,399
Corner Brook/Deer Lake/St. Barbe 472 495 530 600 571 640 622 623 649 625 689 681 644 58 7,899
Co rm ack T rail 317 373 369 405 459 449 451 451 439 511 582 507 508 35 5,856
Ba ie Ve rte/Ce ntral/C onn aigre 515 534 554 557 607 665 739 636 711 721 794 732 765 121 8,651
Lewisporte/Gander 446 529 518 544 606 671 656 648 658 747 831 779 743 84 8,460
Burin 269 277 258 287 284 317 365 339 356 366 422 390 461 39 4,430
Vista 267 284 302 301 312 316 345 304 338 379 424 414 413 36 4,435
Avalon W est 601 628 615 694 692 784 782 799 886 904 1,013 1,088 941 93 10,520
Avalon East 1,983 2,070 2,053 2,248 2,305 2,425 2,337 2,372 2,529 2,562 2,517 2,660 2,438 489 30,988
Conseil scolaire francophone provincial
de Terre-Neuve et du Labrador 25 28 27 28 27 26 11 17 20 23 9 4 9 2 256
Total 5,466 5,766 5,810 6,290 6,480 7,108 6,951 6,869 7,395 7,540 8,035 7,932 7,523 1,002 90,167
1 Students who previously attended senior high for at least three years.

18 Enrolment Information Education Statistics - Elementary-Secondary, 2000-01
Table 15. Enrolment by Gender and Grade, 1990-91 to 2000-01
Year K 1 2 3 4 5 6 7 8 9 10 11 12 4 th
Yr1
Spec
Ed.2Total
1990-91
M 4,341 4,627 4,725 4,615 4,738 4,669 5,081 5,103 5,489 5,498 5,399 5,124 4,320 881 545 65,155
F 4,094 4,216 4,391 4,512 4,516 4,619 4,615 4,767 5,088 5,093 5,230 4,911 4,655 827 340 61,874
T 8,435 8,843 9,116 9,127 9,254 9,288 9,696 9,870 10,577 10,591 10,629 10,035 8,975 1,708 885 127,029
1991-92
M 4,071 4,426 4,588 4,655 4,599 4,701 4,679 5,214 5,118 5,389 5,496 5,050 4,728 1,053 442 64,209
F 3,923 4,132 4,225 4,379 4,493 4,519 4,629 4,649 4,745 5,053 5,256 5,062 4,753 811 295 60,924
T 7,994 8,558 8,813 9,034 9,092 9,220 9,308 9,863 9,863 10,442 10,752 10,112 9,481 1,864 737 125,133
1992-93
M 3,828 4,143 4,355 4,561 4,642 4,568 4,671 4,754 5,135 5,030 5,340 5,105 4,656 1,290 464 62,542
F 3,802 3,910 4,118 4,185 4,370 4,477 4,512 4,676 4,642 4,720 5,078 4,884 4,654 902 300 59,230
T 7,630 8,053 8,473 8,746 9,012 9,045 9,183 9,430 9,777 9,750 10,418 9,989 9,310 2,192 764 121,772
1993-94
M 3,871 3,874 4,078 4,316 4,496 4,581 4,560 4,745 4,774 5,019 5,031 5,028 4,694 1,426 450 60,943
F 3,560 3,819 3,862 4,087 4,161 4,350 4,447 4,482 4,632 4,620 4,726 4,822 4,635 864 263 57,330
T 7,431 7,693 7,940 8,403 8,657 8,931 9,007 9,227 9,406 9,639 9,757 9,850 9,329 2,290 713 118,273
1994-95
M 3,873 3,880 3,817 3,996 4,206 4,508 4,530 4,541 4,760 4,669 4,996 4,695 4,589 1,103 430 58,593
F 3,695 3,551 3,764 3,850 4,036 4,156 4,297 4,402 4,490 4,542 4,578 4,526 4,607 659 264 55,417
T 7,568 7,431 7,581 7,846 8,242 8,664 8,827 8,943 9,250 9,211 9,574 9,221 9,196 1,762 694 114,010
1995-96
M 3,764 3,867 3,765 3,746 3,911 4,236 4,393 4,548 4,632 4,636 4,599 4,702 4,204 1,356 347 56,706
F 3,701 3,643 3,508 3,695 3,728 4,028 4,041 4,245 4,440 4,424 4,502 4,434 4,289 826 246 53,750
T 7,465 7,510 7,273 7,441 7,639 8,264 8,434 8,793 9,072 9,060 9,101 9,136 8,493 2,182 593 110,456
1996-97
M 3,558 3,766 3,756 3,685 3,663 3,903 4,139 4,392 4,533 4,484 4,523 4,296 4,267 1,046 477 54,488
F 3,264 3,670 3,561 3,443 3,636 3,761 3,930 4,024 4,275 4,360 4,351 4,269 4,212 647 314 51,717
T 6,822 7,436 7,317 7,128 7,299 7,664 8,069 8,416 8,808 8,844 8,874 8,565 8,479 1,693 791 106,205
1997-98
M 3,358 3,496 3,657 3,645 3,565 3,657 3,817 4,105 4,444 4,394 4,388 4,248 3,940 933 436 52,083
F 3,120 3,225 3,606 3,496 3,367 3,643 3,627 3,858 4,087 4,166 4,305 4,130 4,100 519 276 49,525
T 6,478 6,721 7,263 7,141 6,932 7,300 7,444 7,963 8,531 8,560 8,693 8,378 8,040 1,452 712 101,608
1998-99
M 3,007 3,402 3,414 3,593 3,597 3,614 3,585 3,865 4,170 4,367 4,427 4,189 3,963 824 - 50,017
F 2,848 3,090 3,154 3,526 3,418 3,396 3,574 3,647 3,930 4,017 4,190 4,163 3,955 476 - 47,384
T 5,855 6,492 6,568 7,119 7,015 7,010 7,159 7,512 8,100 8,384 8,617 8,352 7,918 1,300 - 97,401
1999-00
M 3,025 3,011 3,346 3,409 3,574 3,566 3,574 3,606 3,853 4,165 4,313 4,155 3,863 770 - 48,230
F 2,792 2,901 3,054 3,179 3,549 3,446 3,297 3,605 3,626 3,879 3,984 3,985 3,959 471 - 45,727
T 5,817 5,912 6,400 6,588 7,123 7,012 6,871 7,211 7,479 8,044 8,297 8,140 7,822 1,241 - 93,957
2000-01
M 2,799 3,008 2,978 3,282 3,348 3,601 3,554 3,576 3,741 3,897 4,146 4,080 3,729 622 - 46,361
F 2,667 2,758 2,832 3,008 3,132 3,507 3,397 3,293 3,653 3,643 3,890 3,852 3,794 380 - 43,806
T 5,466 5,766 5,810 6,290 6,480 7,108 6,951 6,869 7,394 7,540 8,036 7,932 7,523 1,002 - 90,167
1 Students who previously attended senior high for at least three years.2 Students receiving special education services and not instructed in regular classrooms (see tables 26-28 for the total number of students receiving special education
serv ices ). Sin ce 199 8-99 all s tuden ts rece iving spe cial e duca tion serv ices hav e be en reported in th eir age app rop riate grade or the high es t grade in the sch oo l.

Education Statistics - Elementary-Secondary, 2000-01 Enrolment Information 19
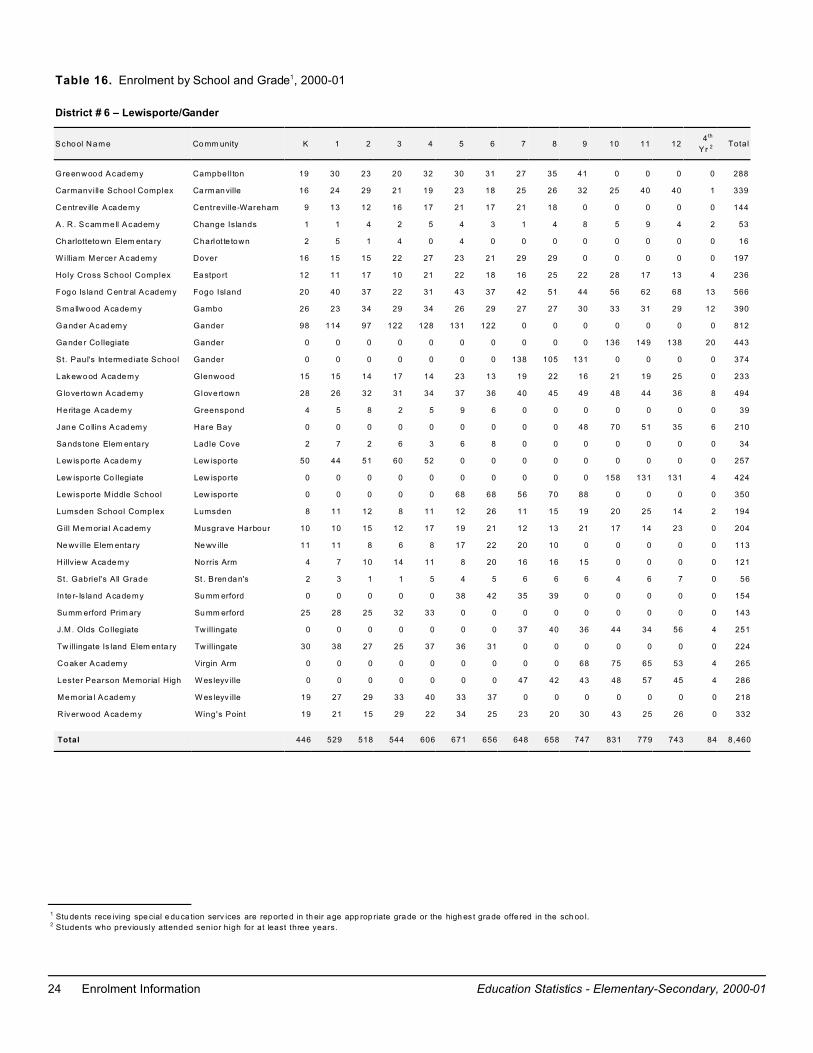
Table 16. Enrolment by School and Grade1, 2000-01
District # 1 - Labrador
S ch oo l N am e Co m m unity K 1 2 3 4 5 6 7 8 9 10 11 124 th
Yr 2 Total
St. Peter 's Al l Grade Bla ck Tickle 2 2 2 6 4 6 7 2 0 6 8 4 3 0 52
H en ry G ord on Ac ad em y Cartwright 10 7 9 11 8 10 7 5 10 13 9 12 5 1 117
Nukum M ani Shan School Davis Inlet 24 20 27 17 28 30 10 22 33 24 5 4 17 0 261
Goose High Happy Va lley /G.B. 0 0 0 0 0 0 0 0 0 0 156 104 100 0 360
Our Lady Queen of Peace Happy Va lley /G.B. 0 0 0 0 0 110 98 89 95 93 0 0 0 0 485
Pe aco ck E lem enta ry Happy Va lley /G.B. 84 89 82 114 97 0 0 0 0 0 0 0 0 0 466
St . Michae l's Happy Va lley /G.B. 51 31 43 47 56 55 40 51 41 39 0 0 0 0 454
Amos C omenius Memorial Ho peda le 15 18 14 20 11 20 18 21 19 13 14 11 8 0 202
A. P . Low Prim ary Lab rado r City 115 97 97 99 0 0 0 0 0 0 0 0 0 0 408
Lab rado r City Collegia te Lab rado r City 0 0 0 0 0 0 0 142 113 140 0 0 0 0 395
Menihek High Lab rado r City 0 0 0 0 0 0 0 0 0 0 162 183 152 20 517
J.C. Erhardt Memorial Ma kk ov ik 3 6 11 8 8 10 11 10 6 9 7 9 6 0 104
Mud Lake School Mud Lake 0 4 0 1 1 1 2 2 1 2 0 0 0 0 14
Jens Haven Memorial School Na in 29 25 27 28 30 37 38 32 35 32 28 21 12 2 376
Lake Melvil le School North West River 12 8 9 14 14 15 14 7 8 9 10 7 6 0 133
B.L. Morrison Al l Grade Po stville 3 5 5 3 8 7 7 8 4 7 3 3 4 0 67
N orth ern Lig hts Ac ad em y Rigolet 1 4 2 2 5 7 9 8 5 8 5 10 6 3 75
Pe enam in M cK enzie 3 Sh esha tsh it 26 27 22 0 0 121 0 0 141 0 13 4 1 0 355
J.R . Sm allwood P rim ary &
Elem enta ry
W abush 11 16 11 15 122 139 118 0 0 0 0 0 0 0 432
Total 386 359 361 385 392 568 379 399 511 395 420 372 320 26 5,273
1 Stu dents rece iving spe cial e duca tion serv ices are reported in th eir age app rop riate grade or the high es t grade offe red in the sch oo l.2 Stud ents who prev ious ly attend ed s enio r high fo r at leas t three years. 3 Peenam in Mckenzie offers instruction to students in grades 3-9 in a non-graded environment. For the purposes of reporting, enrolment for these grades
has b een place d in gra des 5 and 8, rep rese nting e lem enta ry and ju nior hig h.

20 Enrolment Information Education Statistics - Elementary-Secondary, 2000-01
Table 16. Enrolment by School and Grade1, 2000-01
District # 2 - Northern Peninsula/Labrador South
S ch oo l N am e Co m m unity K 1 2 3 4 5 6 7 8 9 10 11 124 th
Yr 2 Total
W ill iam Gil lett Acad Charlottetown, Lab. 7 6 4 7 7 4 3 8 6 3 10 6 7 0 78
Sacred Heart Al l Grade Conche 0 3 2 5 5 4 5 4 6 10 4 12 11 0 71
James Cook Mem orial Cook's Harbour 2 1 5 5 2 1 5 4 2 5 5 7 2 0 46
St. Joseph's Al l Grade Croque 3 1 1 1 2 1 2 4 2 3 5 5 6 0 36
H.G. Fil lier Academy Englee 7 8 14 9 13 5 8 13 15 8 0 0 0 0 100
Canon Richards High School Flower's Cove 0 0 0 0 0 0 0 22 19 21 24 26 31 0 143
Stra its Elem enta ry Flower's Cove 15 16 23 12 16 18 20 0 0 0 0 0 0 0 120
M ou nta in Fie ld Ac ad em y Forteau 10 8 9 14 8 12 6 14 26 25 21 22 22 0 197
Truman Eddison Memorial Griquet 10 13 18 12 10 18 18 0 0 0 0 0 0 0 99
Ralph Harnum Memorial Hawke's Bay 6 7 8 5 18 7 8 0 0 0 0 0 0 0 59
St. P aul's E lem enta ry Lanse au Loup 6 12 10 8 11 9 12 0 0 0 0 0 0 0 68
St. Ja m es E lem enta ry Lodge Bay 1 3 0 2 2 2 2 0 0 2 0 0 0 0 14
Mary Simm s All Grade Main Brook 6 3 4 5 5 4 3 7 3 6 9 5 5 0 65
St. Mary's Al l Grade Mary's Harbour 12 9 7 6 6 4 9 9 6 6 6 7 6 1 94
Raymond W ard Memorial Norman Bay 1 0 1 1 0 1 1 1 0 2 0 2 0 0 10
Pinsen t's Arm Pinsen t's Arm 2 0 1 0 0 0 2 0 2 1 2 0 0 0 10
St. Augustine's Central High Plum Point 0 0 0 0 0 0 0 36 29 46 37 40 36 0 224
St. G ene vieve Elem enta ry Plum Point 12 9 10 14 14 16 9 0 0 0 0 0 0 0 84
D.C. Young School Port Hope Simpson 7 8 5 6 8 5 15 4 14 9 15 5 8 2 111
Roncalli Central High Po rt Sau nde rs 0 0 0 0 0 0 0 48 44 47 69 40 36 3 287
St. T here sa's E lem enta ry Po rt au Ch oix 17 16 29 16 17 32 30 0 0 0 0 0 0 0 157
Pistolet Bay School Raleigh 4 2 3 6 3 8 10 11 2 9 0 0 0 0 58
Basque Memorial Red Bay 2 2 3 2 3 3 4 1 4 9 2 8 6 0 49
St. M arga ret's E lem enta ry Reef's Harbour 7 9 3 9 10 6 12 0 0 0 0 0 0 0 56
Ev ely Elem enta ry Roddickton 16 12 15 22 14 19 16 0 0 0 0 0 0 0 114
Mo unta in Vie w C ollegia te Roddickton 0 0 0 0 0 0 0 23 20 10 35 24 19 6 137
Ha rriot Cu rtis Co llegiate St. Anthony 0 0 0 0 0 0 0 0 53 49 58 57 61 5 283
St. A ntho ny Ele m enta ry St. Anthony 29 28 35 56 39 58 54 40 0 0 0 0 0 0 339
S t. L ew is Ac ad em y St. L ew is 2 3 6 10 5 4 3 2 7 4 7 4 3 0 60
Ba yview Re gion al Co llegiate St. Lu naire 0 0 0 0 0 0 0 21 32 24 19 28 18 2 144
Our Lady of Labrador W est S t. Mod este 1 7 7 5 7 5 7 7 6 7 6 7 4 0 76
W ill iam's Harbour School W ill iam's Harbour 0 3 0 3 0 1 0 2 0 1 0 0 0 0 10
Total 185 189 223 241 225 247 264 281 298 307 334 305 281 19 3,399
1 Stu dents rece iving spe cial e duca tion serv ices are reported in th eir age app rop riate grade or the high es t grade offe red in the sch oo l.2 Students who previously attended senior high for at least three years.

Education Statistics - Elementary-Secondary, 2000-01 Enrolment Information 21
Table 16. Enrolment by School and Grade1, 2000-01
District # 3 - Corner Brook/Deer Lake/St. Barbe
S ch oo l N am e Co m m unity K 1 2 3 4 5 6 7 8 9 10 11 124 th
Yr 2 Total
S t. P ete r's Ac ad em y Benoit 's Cove 13 22 27 33 23 31 29 26 37 27 0 0 0 0 268
C.C. Loughlin School Corner Brook 63 67 68 82 76 78 75 0 0 0 0 0 0 0 509
G.C. Rowe Junior High Corner Brook 0 0 0 0 0 0 0 140 141 146 0 0 0 0 427
He rdm an C ollegia te Corner Brook 0 0 0 0 0 0 0 0 0 0 144 152 164 8 468
Hu m ber E lem enta ry Corner Brook 56 52 51 72 65 67 67 0 0 0 0 0 0 0 430
J.J. C urling E lem enta ry Corner Brook 51 51 52 53 57 61 56 0 0 0 0 0 0 0 381
Presentation Junior High Corner Brook 0 0 0 0 0 0 0 143 156 116 0 0 0 0 415
Regina High School Corner Brook 0 0 0 0 0 0 0 0 0 0 179 163 167 18 527
Sa cred He art Ele m enta ry Corner Brook 43 29 36 45 52 40 54 0 0 0 0 0 0 0 299
St. G erard 's Elem enta ry Corner Brook 21 20 36 22 27 30 40 0 0 0 0 0 0 0 196
Cow Head School Complex Cow Head 9 8 7 8 12 19 11 21 20 26 31 24 17 1 214
Holy Cross Al l Grade School Daniel's Harbour 3 3 7 2 6 5 8 16 6 8 1 4 6 1 76
De er La ke Elem enta ry Deer Lake 0 0 0 0 80 92 87 0 0 0 0 0 0 0 259
Elw ood Prim ary Deer Lake 83 79 79 98 0 0 0 0 0 0 0 0 0 0 339
Elwood Regional High Deer Lake 0 0 0 0 0 0 0 0 0 0 111 107 95 15 328
Xavier Junior High Deer Lake 0 0 0 0 0 0 0 105 95 103 0 0 0 0 303
Te m pleton Co llegiate G illa m s 0 0 0 0 0 0 0 45 54 54 58 64 63 6 344
H am p de n A ca de m y Hampden 3 13 6 13 9 15 9 7 5 11 8 13 15 0 127
St. Peter 's Al l Grade School Harbour Deep 1 2 0 2 2 3 2 4 3 4 0 0 0 0 23
Ho wley E lem enta ry Howley 2 2 3 2 3 6 0 0 0 0 0 0 0 0 18
St. James All Grade Lark Harbour 9 9 12 10 10 16 16 13 11 12 18 11 16 2 165
No rthshore E lem enta ry Meadows 49 46 51 43 53 47 55 0 0 0 0 0 0 0 344
Holland's Memorial Norris Point 0 0 0 0 0 0 0 21 29 25 31 34 26 1 167
St. Fra ncis E lem enta ry Parsons Pond 2 7 10 4 6 10 7 0 0 0 0 0 0 0 46
Pa sad ena Elem enta ry Pasadena 25 37 34 52 35 57 50 0 0 0 0 0 0 0 290
P as ad en a A ca de m y Pasadena 0 0 0 0 0 0 0 38 57 52 64 60 54 4 329
Ro cky H arbo ur E lem enta ry Rocky Harbour 14 23 20 27 16 24 29 0 0 0 0 0 0 0 153
M ain Riv er A ca de m y So p's A rm 13 12 19 8 13 22 10 20 18 18 20 26 6 2 207
Jakeman All Grade Trout River 6 10 6 12 19 7 8 15 10 12 18 15 4 0 142
B on ne Ba y A ca de m y W oody Point 6 3 6 12 7 10 9 9 7 11 6 8 11 0 105
Total 472 495 530 600 571 640 622 623 649 625 689 681 644 58 7,899
1 Stu dents rece iving spe cial e duca tion serv ices are reported in th eir age app rop riate grade or the high es t grade offe red in the sch oo l.2 Students who previously attended senior high for at least three years.

22 Enrolment Information Education Statistics - Elementary-Secondary, 2000-01
Table 16. Enrolment by School and Grade1, 2000-01
District # 4 – Cormack Trail
School Name Co mm unity K 1 2 3 4 5 6 7 8 9 10 11 124 th
Yr 2 Total
A.J. Matthews/St. John Central Burgeo 12 18 18 7 14 17 25 14 13 22 30 30 20 2 242
Gra ndy 's River C ollegia te Burnt Islands 0 0 0 0 0 0 0 23 24 24 29 20 31 0 151
St. G eorg e's E lem enta ry Burnt Islands 8 14 8 9 7 14 12 0 0 0 0 0 0 0 72
Our Lady of the Cape Cape St. George 6 5 13 6 12 11 16 9 10 0 0 0 0 0 88
St. Ja me s E lem enta ry Channel-Port aux Basq 43 56 50 61 77 69 63 0 0 0 0 0 0 0 419
St. James Junior High Channel-Port aux Basq 0 0 0 0 0 0 0 78 55 72 0 0 0 0 205
St. James Regional High School Channel-Port aux Basq 0 0 0 0 0 0 0 0 0 0 84 93 102 9 288
St. A nne 's Eleme ntary Flat Bay East 6 4 8 10 0 0 0 0 0 0 0 0 0 0 28
St. S imon and S t. Jude Academy Fra ncois 0 2 2 2 3 1 3 1 3 4 2 2 0 0 25
Grand Bruit All Grade Grand B ruit 1 1 0 2 0 0 0 1 1 0 0 0 0 0 6
All Saints Al l Grade Grey River 1 3 2 1 0 0 2 1 3 5 7 3 4 0 32
LeGallais Memorial Isle au x M orts 8 7 9 8 11 10 12 6 8 11 0 0 0 0 90
Doug las Academy La Po ile 0 2 0 0 0 1 2 3 3 2 2 0 0 0 15
Ou r Lad y of Lo urde s E lem enta ry Lourdes 28 31 29 39 39 39 35 46 40 0 0 0 0 0 326
E.A. Butler McK ay 's 0 0 0 0 0 0 0 17 22 32 32 20 36 1 160
Piccadil ly Central High Pic cadilly 0 0 0 0 0 0 0 0 0 65 83 49 48 7 252
St. Thomas Aquinas Port au Port East 18 16 22 24 18 28 20 16 14 0 0 0 0 0 176
St. Boniface All Grade Ramea 11 4 1 10 12 6 8 9 5 11 4 10 15 1 107
St. M ichael's E lem enta ry Rose Blanche 3 6 7 6 9 10 10 0 0 0 0 0 0 0 51
Ca ssidy Me mo rial Eleme ntary St . Fin tan 's 17 12 11 17 27 15 19 0 0 0 0 0 0 0 118
Ou r Lad y of M ercy Elem enta ry St . Geo rge 's 12 19 28 17 29 30 27 28 0 0 0 0 0 0 190
St. Joseph's High St . Geo rge 's 0 0 0 0 0 0 0 0 28 46 34 38 29 0 175
Pathfinder/Directions Alternative
School
Ste phenville 0 0 0 0 0 0 0 0 3 2 8 3 3 3 22
Stephe nville E lem enta ry Ste phenville 0 0 0 58 138 137 0 0 0 0 0 0 0 0 333
Stephenvil le High Ste phenville 0 0 0 0 0 0 0 0 0 151 192 176 171 11 701
Stephenvil le Middle School Ste phenville 0 0 0 0 0 0 127 131 146 0 0 0 0 0 404
Stephe nville P rima ry Ste phenville 106 126 108 77 0 0 0 0 0 0 0 0 0 0 417
Assumption High School Stephenvil le Crossing 0 0 0 0 0 0 0 0 0 45 42 34 25 0 146
St. Michael 's School Stephenvil le Crossing 24 28 42 34 42 37 39 43 34 0 0 0 0 0 323
Belanger Memorial School Up per F erry 13 19 11 17 21 24 31 25 27 19 33 29 24 1 294
Total 317 373 369 405 459 449 451 451 439 511 582 507 508 35 5,856
1 Stu dents rece iving spe cial e duca tion serv ices are reported in th eir age app rop riate grade or the high es t grade offe red in the sch oo l.2 Students who previously attended senior high for at least three years.

Education Statistics - Elementary-Secondary, 2000-01 Enrolment Information 23
Table 16. Enrolment by School and Grade1, 2000-01
District # 5–Baie Verte/Central/Connaigre
S ch oo l N am e Co m m unity K 1 2 3 4 5 6 7 8 9 10 11 124 th
Yr 2 Total
Av oca Co llegiate Badger 2 6 11 8 8 15 6 12 13 0 0 0 0 0 81
Baie Verte High School Ba ie Ve rte 0 0 0 0 0 0 0 0 58 51 63 42 60 3 277
Baie Verte Middle School Ba ie Ve rte 0 0 0 0 0 47 52 48 0 0 0 0 0 0 147
Ba ie Ve rte Prim ary Ba ie Ve rte 39 28 40 36 34 0 0 0 0 0 0 0 0 0 177
L on g Is la nd Ac ad em y Beaumont 2 2 7 4 1 0 8 6 7 9 5 5 5 0 61
B is ho p's Fa lls Ac ad em y Bis hop's F alls 0 0 0 0 0 0 65 44 0 0 0 0 0 0 109
He len T ulk E lem enta ry Bis hop's F alls 40 32 40 41 63 54 0 0 0 0 0 0 0 0 270
L eo Bu rk e A ca de m y Bis hop's F alls 0 0 0 0 0 0 0 0 57 63 56 59 63 9 307
Bo twoo d C ollegia te Botwood 0 0 0 0 0 0 0 0 0 68 81 73 68 5 295
Bo twoo d Me m orial A cad em y Elem enta ry Botwood 54 60 57 53 53 60 87 0 0 0 0 0 0 0 424
L .P . P urc ha se Ac ad em y Botwood 0 0 0 0 0 0 0 52 58 0 0 0 0 0 110
L a R oc he lle Ac ad em y Brent's Cove 6 9 12 12 10 10 12 0 0 0 0 0 0 0 71
L ak es id e A ca de m y Buchans 8 7 8 10 3 11 3 10 13 15 14 17 21 4 144
M .W . Je an s A ca de m y Burl ington 9 11 5 10 14 11 10 0 0 0 0 0 0 0 70
Cottrel l's Cove Academy Cottrell 's Cove 3 2 5 3 4 7 0 6 4 0 7 2 6 1 50
Conrad Fitzgerald Academy English Harbour West 15 19 18 24 24 20 22 21 16 30 22 26 19 1 277
V ic to ria Ac ad em y Ga ulto is 0 2 5 4 3 5 7 3 7 7 9 4 2 2 60
Exploits Valley High - Greenwood Grand Falls-W indsor 0 0 0 0 0 0 0 0 0 205 204 0 0 0 409
Explo its V alley Hig h - M ap le Grand Falls-W indsor 0 0 0 0 0 0 0 0 0 0 0 209 196 59 464
Grenfell Intermediate School Grand Falls-W indsor 0 0 0 0 0 0 0 170 187 0 0 0 0 0 357
M illc re st A ca de m y Grand Falls-W indsor 0 0 0 0 111 111 129 0 0 0 0 0 0 0 351
S pru ce wo od Ac ad em y Grand Falls-W indsor 54 54 50 56 61 72 60 0 0 0 0 0 0 0 407
W oodland Prim ary Grand Falls-W indsor 90 98 82 98 0 0 0 0 0 0 0 0 0 0 368
K in g A ca de m y Harbour Breton 0 0 0 0 0 0 0 27 31 28 38 21 32 0 177
St. Joseph's School Harbour Breton 24 25 33 30 22 25 41 0 0 0 0 0 0 0 200
J oh n W a tk in s A ca de m y Hermitage 2 6 9 10 9 11 13 9 14 15 13 14 14 0 139
V alm o nt A ca de m y King's Point 16 9 15 13 12 16 17 16 18 13 23 16 25 2 211
Ca pe J ohn Co llegiate LaSc ie 0 0 0 0 0 0 0 31 35 43 40 30 34 2 215
Hillside E lem enta ry LaSc ie 14 14 19 11 12 18 20 0 0 0 0 0 0 0 108
Lea ding Tick les E lem enta ry Leading Tickles 3 7 7 7 9 9 11 0 0 0 0 0 0 0 53
H .L . S tro ng Ac ad em y Litt le Bay Islands 0 0 2 1 1 3 0 0 1 1 0 2 2 2 15
St. Peter 's Al l Grade McCallum 3 2 0 1 1 1 2 2 1 0 3 1 0 0 17
M S B R eg io na l A ca de m y Midd le Arm 12 7 8 8 13 15 9 21 17 21 30 17 20 1 199
G re en wo od Ac ad em y Mill town 17 32 23 23 36 26 30 0 0 0 0 0 0 0 187
Ba yview Prim ary Nipper's Harbour 3 2 3 0 0 0 0 0 0 0 0 0 0 0 8
Do rset C ollegia te Pil ley's Island 0 0 0 0 0 0 0 0 0 48 46 49 50 7 200
P oin t L ea m in gto n A ca de m y Point Leamington 4 5 7 5 7 7 9 17 26 15 21 25 23 4 175
St. Stephen's Al l Grade Rencontre East 4 2 0 3 1 6 3 4 6 5 3 4 8 0 49
G re en Ba y S ou th Ac ad em y Ro bert's A rm 15 18 21 17 25 19 20 37 38 0 0 0 0 0 210
S ou th Bro ok Ac ad em y South Brook 6 6 9 5 7 8 10 0 0 0 0 0 0 0 51
Indian River High School Sp ringda le 0 0 0 0 0 0 0 0 0 55 69 63 63 18 268
Indian River Middle School Sp ringda le 0 0 0 0 36 47 59 59 54 0 0 0 0 0 255
Indian Rive r Prim ary Sp ringda le 43 43 40 40 0 0 0 0 0 0 0 0 0 0 166
Holy Cross Al l Grade St . A lba n's 0 0 0 0 0 0 0 30 42 20 39 43 50 0 224
Brian Peckfo rd E lem enta ry Triton 15 13 13 15 13 19 20 0 0 0 0 0 0 0 108
S t. P ete r's Ac ad em y W estp ort 3 7 3 3 8 4 6 11 8 9 8 10 4 1 85
De ckw ood Elem enta ry W oodstock 9 6 2 6 6 8 8 0 0 0 0 0 0 0 45
Total 515 534 554 557 607 665 739 636 711 721 794 732 765 121 8,651
1 Stu dents rece iving spe cial e duca tion serv ices are reported in th eir age app rop riate grade or the high es t grade offe red in the sch oo l.2 Students who previously attended senior high for at least three years.
24 Enrolment Information Education Statistics - Elementary-Secondary, 2000-01
Table 16. Enrolment by School and Grade1, 2000-01
District # 6 – Lewisporte/Gander
School Name Co mm unity K 1 2 3 4 5 6 7 8 9 10 11 124 th
Yr 2 Total
Greenwood Academy Campbell ton 19 30 23 20 32 30 31 27 35 41 0 0 0 0 288
Carmanville School Complex Ca rmanville 16 24 29 21 19 23 18 25 26 32 25 40 40 1 339
Centrev ille Academy Centrevi lle-Wareham 9 13 12 16 17 21 17 21 18 0 0 0 0 0 144
A. R . Scammell Academy Change Islands 1 1 4 2 5 4 3 1 4 8 5 9 4 2 53
Ch arlotteto wn Elem enta ry Charlot te town 2 5 1 4 0 4 0 0 0 0 0 0 0 0 16
Wi lliam Merce r Academy Dover 16 15 15 22 27 23 21 29 29 0 0 0 0 0 197
Holy Cross School Complex Ea stpo rt 12 11 17 10 21 22 18 16 25 22 28 17 13 4 236
Fogo Is land Cen tral Academy Fogo Island 20 40 37 22 31 43 37 42 51 44 56 62 68 13 566
Sma llwood Academy Gambo 26 23 34 29 34 26 29 27 27 30 33 31 29 12 390
Gander Academy Gander 98 114 97 122 128 131 122 0 0 0 0 0 0 0 812
Ga nde r Co llegiate Gander 0 0 0 0 0 0 0 0 0 0 136 149 138 20 443
St. Paul's Intermediate School Gander 0 0 0 0 0 0 0 138 105 131 0 0 0 0 374
Lakewood Academy Glenwood 15 15 14 17 14 23 13 19 22 16 21 19 25 0 233
Glove rtown Academy Glovertown 28 26 32 31 34 37 36 40 45 49 48 44 36 8 494
Heritage Academy Greenspond 4 5 8 2 5 9 6 0 0 0 0 0 0 0 39
Jane Co llins Academy Hare Bay 0 0 0 0 0 0 0 0 0 48 70 51 35 6 210
Sa nds tone Elem enta ry Ladle Cove 2 7 2 6 3 6 8 0 0 0 0 0 0 0 34
Lew ispo rte Academy Lew ispo rte 50 44 51 60 52 0 0 0 0 0 0 0 0 0 257
Lew ispo rte Co llegiate Lew ispo rte 0 0 0 0 0 0 0 0 0 0 158 131 131 4 424
Lewisporte Middle School Lew ispo rte 0 0 0 0 0 68 68 56 70 88 0 0 0 0 350
Lumsden School Complex Lumsden 8 11 12 8 11 12 26 11 15 19 20 25 14 2 194
Gill Memor ia l Academy Musgrave Harbour 10 10 15 12 17 19 21 12 13 21 17 14 23 0 204
Ne wv ille Elem enta ry Ne wv ille 11 11 8 6 8 17 22 20 10 0 0 0 0 0 113
H illv iew Academy No rris Arm 4 7 10 14 11 8 20 16 16 15 0 0 0 0 121
St. Gabriel's All Grade St . Bren dan's 2 3 1 1 5 4 5 6 6 6 4 6 7 0 56
In te r- Is land Academy Su mm erford 0 0 0 0 0 38 42 35 39 0 0 0 0 0 154
Su mm erford Prim ary Su mm erford 25 28 25 32 33 0 0 0 0 0 0 0 0 0 143
J.M . Olds Co llegiate Tw illingate 0 0 0 0 0 0 0 37 40 36 44 34 56 4 251
Tw illingate Is land Elem enta ry Tw illingate 30 38 27 25 37 36 31 0 0 0 0 0 0 0 224
Coaker Academy Virgin Arm 0 0 0 0 0 0 0 0 0 68 75 65 53 4 265
Lester Pearson Memorial High W es leyv ille 0 0 0 0 0 0 0 47 42 43 48 57 45 4 286
Memor ia l Academy W es leyv ille 19 27 29 33 40 33 37 0 0 0 0 0 0 0 218
R iverwood Academy Wing's Point 19 21 15 29 22 34 25 23 20 30 43 25 26 0 332
Total 446 529 518 544 606 671 656 648 658 747 831 779 743 84 8,460
1 Stu dents rece iving spe cial e duca tion serv ices are reported in th eir age app rop riate grade or the high es t grade offe red in the sch oo l.2 Students who previously attended senior high for at least three years.

Education Statistics - Elementary-Secondary, 2000-01 Enrolment Information 25
Table 16. Enrolment by School and Grade1, 2000-01
District # 7 - Burin
School Name Co mm unity K 1 2 3 4 5 6 7 8 9 10 11 124 th
Yr 2 Total
St. George's School English Harbour East 0 0 6 2 2 0 3 6 2 0 0 0 0 0 21
Lake Academy Fortune 54 29 44 53 46 51 61 57 0 0 0 0 0 0 395
John Burke School Grand Bank 0 0 0 0 0 0 0 0 54 50 70 58 70 17 319
St. Thomas School Gra nd L e P ierre 4 5 3 2 5 1 1 7 11 4 0 0 0 0 43
St. Joseph's Academy Lamaline 13 15 9 10 15 14 21 16 23 14 31 23 30 6 240
Ho ly Name of Mary Academy Lawn 6 16 18 13 10 11 19 17 10 18 16 15 23 3 195
Marystown Alternate School Marys town 0 0 0 0 0 0 0 0 1 3 1 0 0 0 5
Marystown Central High Marys town 0 0 0 0 0 0 0 63 81 89 82 92 87 0 494
Sa cred He art Ele me ntary Marys town 70 102 76 89 74 87 95 0 0 0 0 0 0 0 593
Sts . J. Fish er & T. M ore Pe tite Forte 3 1 0 2 1 0 0 0 0 0 0 0 0 0 7
Christ the King Al l Grade Rushoon 8 9 13 11 16 22 17 16 36 29 26 22 28 0 253
Be rney Me mo rial Interm edia te
School
Salt Pond 0 0 0 0 0 0 0 0 95 92 0 0 0 0 187
Dona ld C . Jamieson Academy Salt Pond 52 61 50 56 62 73 96 88 0 0 0 0 0 0 538
Pearce Regional High Salt Pond 0 0 0 0 0 0 0 0 0 0 116 101 141 8 366
St. Anne's South East Bight South East Bight 4 2 0 3 2 3 2 4 0 2 1 0 0 0 23
For tune Bay Academy St . Bern ard 's 20 13 13 13 13 14 21 22 12 16 23 23 22 0 225
Marian Elementary School St. Lawrence 26 18 21 26 28 35 20 0 0 0 0 0 0 0 174
St. Lawrence Central High St. Lawrence 0 0 0 0 0 0 0 30 20 31 35 29 33 5 183
St. Joseph's Al l Grade Terren ceville 9 6 5 7 10 6 9 13 11 18 21 27 27 0 169
Total 269 277 258 287 284 317 365 339 356 366 422 390 461 39 4,430
1 Stu dents rece iving spe cial e duca tion serv ices are reported in th eir age app rop riate grade or the high es t grade offe red in the sch oo l.2 Students who previously attended senior high for at least three years.

26 Enrolment Information Education Statistics - Elementary-Secondary, 2000-01
Table 16. Enrolment by School and Grade1, 2000-01
District # 8 - Vista
School Name Co mm unity K 1 2 3 4 5 6 7 8 9 10 11 124 th
Yr 2 Total
St. Michael 's School Arnold's Cove 9 6 19 9 6 10 11 16 16 17 25 25 25 7 201
Discov ery C ollegia te Bo nav ista 0 0 0 0 0 0 0 0 88 112 136 125 111 6 578
Matthew Elementary School Bo nav ista 48 47 45 58 63 53 65 43 0 0 0 0 0 0 422
Catalina Elementary School Catalina 18 22 32 20 34 35 27 33 0 0 0 0 0 0 221
Clarenvi lle High Cla renville 0 0 0 0 0 0 0 0 0 101 128 97 117 10 453
Clarenvi lle Middle School Cla renville 0 0 0 0 46 53 63 40 63 0 0 0 0 0 265
Clarenvi lle Primary School Cla renville 47 62 57 67 0 0 0 0 0 0 0 0 0 0 233
St. Mark's School King's Cove 12 10 17 5 12 11 11 12 24 19 12 22 21 0 188
L.R. Ash Elementary School Lethbridge 14 20 10 21 19 12 18 0 0 0 0 0 0 0 114
Southwes t A rm Academy Little Heart's Ease 8 3 7 13 15 10 24 8 14 14 22 25 15 0 178
An thon y Padd on E lem enta ry Musgravetown 22 24 29 18 25 26 25 41 33 48 0 0 0 0 291
Musgravetown High School Musgravetown 0 0 0 0 0 0 0 0 0 0 49 55 55 7 166
Bishop White School Port Rexton 9 14 15 7 15 14 13 23 23 17 19 17 19 3 208
Random Is land Academy Random Island 14 20 15 19 20 18 23 14 19 26 16 20 26 0 250
Balbo Elementary School Shoal Harbour 42 41 41 41 34 47 37 47 34 0 0 0 0 0 364
Our Saviour K ing Academy Southern Harbour 4 4 4 14 8 9 8 11 11 10 10 16 15 3 127
R.K. Gardner School Sunnyside 10 7 7 5 7 10 10 9 7 5 0 0 0 0 77
Swift Cu rren t Academy Swift Current 10 4 4 4 8 8 10 7 6 10 7 12 9 0 99
Total 267 284 302 301 312 316 345 304 338 379 424 414 413 36 4,435
1 Stu dents rece iving spe cial e duca tion serv ices are reported in th eir age app rop riate grade or the high es t grade offe red in the sch oo l.2 Students who previously attended senior high for at least three years.

Education Statistics - Elementary-Secondary, 2000-01 Enrolment Information 27
Table 16. Enrolment by School and Grade1, 2000-01
District # 9 - Avalon West
School Name Co mm unity K 1 2 3 4 5 6 7 8 9 10 11 124 th
Yr 2 Total
Ronca ll i CH Av onda le 0 0 0 0 0 0 0 72 64 84 104 106 104 2 536
Ama lgamated Academy Ba y R obe rts 0 0 0 0 0 80 63 154 181 176 0 0 0 0 654
As cen sion Co llegiate Ba y R obe rts 0 0 0 0 0 0 0 0 0 0 290 342 245 34 911
St. Joseph's Central Bay de Verde 0 0 0 0 0 0 0 0 17 12 27 12 13 0 81
Tricon E lem enta ry Bay de Verde 20 13 19 24 19 15 19 22 0 0 0 0 0 0 151
Cre sce nt Collegia te B laketown 0 0 0 0 0 0 0 127 129 132 140 135 132 10 805
E.J. Pratt Central High Bro wn sdale 0 0 0 0 0 0 0 0 20 17 22 30 17 4 110
Carbonear College Carbonear 0 0 0 0 0 0 0 0 0 0 161 196 167 26 550
Da vis E lem enta ry Carbonear 51 49 43 65 56 61 0 0 0 0 0 0 0 0 325
St. Jo sep h's Inte rme diate Carbonear 0 0 0 0 0 0 74 67 64 75 0 0 0 0 280
Ho ly Fam ily Prim ary Ch ape l Arm 24 27 20 26 0 0 0 0 0 0 0 0 0 0 97
Co ley's Po int P rim Coley's Point 70 69 66 91 73 0 0 0 0 0 0 0 0 0 369
Immaculate Conception Co lliers 27 18 25 23 0 0 0 0 0 0 0 0 0 0 93
St. A nne 's Eleme ntary Conception Harbour 0 0 0 0 23 29 41 0 0 0 0 0 0 0 93
W ood land Elem enta ry Dildo 25 34 28 38 40 27 38 0 0 0 0 0 0 0 230
St. Anne 's Academy Du nv ille 38 23 27 28 41 39 48 42 58 48 0 0 0 0 392
Ac rem an E lem enta ry Green's Harbour 16 20 20 20 15 23 14 0 0 0 0 0 0 0 128
Harbour Grace Primary School Harbour Grace 32 44 29 40 42 0 0 0 0 0 0 0 0 0 187
St. Francis School Harbour Grace 0 0 0 0 0 44 45 40 48 53 0 0 0 0 230
Holy Trini ty RH Heart 's Content 0 0 0 0 0 0 0 0 22 28 38 35 40 1 164
Ep ipha ny E lem enta ry Heart 's Delight 8 9 15 10 19 13 13 14 0 0 0 0 0 0 101
Ho ly Cro ss E lem enta ry Holyrood 27 30 26 39 28 42 41 0 0 0 0 0 0 0 233
St. Ca ther ine's Academy Mount Carmel 15 8 14 21 22 29 22 24 26 25 29 34 29 3 301
No rma n's C ove Elem enta ry Norman's Cove 0 0 0 0 30 29 43 0 0 0 0 0 0 0 102
All H allow s E lem enta ry North River 61 73 56 65 52 80 69 0 0 0 0 0 0 0 456
No rth Sh ore C ollegia te Northern Bay 0 0 0 0 0 0 0 37 38 36 51 53 36 5 256
Laval High School Pla centia 0 0 0 0 0 0 0 0 0 58 102 78 89 5 332
St. E dw ard's E lem enta ry Pla centia 31 36 29 29 41 33 40 34 36 0 0 0 0 0 309
Ho ly Re dee me r Elem enta ry Spaniard's Bay 36 34 35 27 35 41 38 46 39 38 0 0 0 0 369
Fatima Academy St . Bride 's 10 14 12 12 11 22 21 12 20 23 25 19 23 0 224
Dunne Memor ia l Academy St . Mary 's 11 12 27 13 24 27 19 25 33 35 24 48 46 3 347
St. Peter 's School Upper Island Cove 25 36 25 25 30 45 27 29 44 34 0 0 0 0 320
Pe rsalvic Elem enta ry Vic toria 31 31 35 37 32 39 33 30 47 30 0 0 0 0 345
Cabo t Academy Western Bay 17 24 20 22 30 26 29 0 0 0 0 0 0 0 168
W hitbou rne E lem enta ry Whitbourne 16 6 20 14 13 17 21 0 0 0 0 0 0 0 107
Pe rlwin E lementa ry Winterton 10 18 24 25 16 23 24 24 0 0 0 0 0 0 164
Total 601 628 615 694 692 784 782 799 886 904 1,013 1,088 941 93 10,520
1 Stu dents rece iving spe cial e duca tion serv ices are reported in th eir age app rop riate grade or the high es t grade offe red in the sch oo l.2 Students who previously attended senior high for at least three years.

28 Enrolment Information Education Statistics - Elementary-Secondary, 2000-01
Table 16. Enrolment by School and Grade1, 2000-01
District #10 - Avalon East
School Name Co mm unity K 1 2 3 4 5 6 7 8 9 10 11 124 th
Yr 2 Total
St. P atrick's E lem enta ry Ba y B ulls 0 0 0 0 39 50 49 0 0 0 0 0 0 0 138
Immaculate Conception Bell Island 0 0 0 0 48 52 50 52 59 0 0 0 0 0 261
St. A ugu stine's Prim ary Bell Island 29 32 40 47 0 0 0 0 0 0 0 0 0 0 148
St. Michael 's High Bell Island 0 0 0 0 0 0 0 0 0 79 63 56 46 11 255
Balt imore School Complex Ferryland 25 26 27 38 25 41 30 53 44 45 53 63 49 10 529
Frank Roberts Junior High Foxtrap 0 0 0 0 0 0 0 164 179 186 0 0 0 0 529
Queen Elizabeth Regional High Foxtrap 0 0 0 0 0 0 0 0 0 0 203 196 258 52 709
St . Edw ard 's Ke ll ig rews 86 77 74 85 72 86 57 0 0 0 0 0 0 0 537
Holy Spiri t High Manue ls 0 0 0 0 0 0 0 0 0 0 220 263 168 14 665
St. G eorg e's E lem enta ry Manue ls 36 37 40 40 56 54 40 0 0 0 0 0 0 0 303
St. Thomas of Villanova Manue ls 0 0 0 0 0 0 0 103 256 202 0 0 0 0 561
Mobile High School Mob ile 0 0 0 0 0 0 0 41 41 51 51 44 44 0 272
Mary Qu een of th e W orld Mo unt P earl 71 71 70 69 67 87 78 0 0 0 0 0 0 0 513
Morr is Academy Mo unt P earl 71 76 93 92 0 0 0 0 0 0 0 0 0 0 332
Mo unt P earl Inte rme diate Mo unt P earl 0 0 0 0 99 112 129 188 165 223 0 0 0 0 916
Mount Pearl Senior High Mo unt P earl 0 0 0 0 0 0 0 0 0 0 182 221 200 59 662
Newtown Elementary School Mo unt P earl 68 71 79 63 84 98 92 0 0 0 0 0 0 0 555
O'Donel High Mo unt P earl 0 0 0 0 0 0 0 0 0 0 209 216 230 38 693
St. P eter's E lem enta ry Mo unt P earl 94 114 84 114 97 103 98 0 0 0 0 0 0 0 704
St. Peter 's Junior High School Mo unt P earl 0 0 0 0 0 0 0 211 234 224 0 0 0 0 669
St. Francis of Assisi Outer Cove 20 30 23 27 29 23 28 19 21 0 0 0 0 0 220
Holy Family School Paradise 47 49 63 48 55 66 64 125 0 0 0 0 0 0 517
Pa radise Elem enta ry Paradise 64 70 49 82 63 73 76 0 0 0 0 0 0 0 477
Be ach y C ove Elem enta ry Portugal Cove 66 66 68 77 85 70 68 0 0 0 0 0 0 0 500
Po uch Co ve E lem enta ry Pouch Cove 20 14 16 14 25 17 16 0 0 0 0 0 0 0 122
St. A gne s E lem enta ry Pouch Cove 24 24 19 18 28 24 29 0 0 0 0 0 0 0 166
Beaconsfield Junior High St . John 's 0 0 0 0 0 0 0 165 192 199 0 0 0 0 556
Bishop Abraham St . John 's 43 33 33 36 57 53 50 0 0 0 0 0 0 0 305
Bish op F ield E lem enta ry St . John 's 47 49 34 45 49 59 50 0 0 0 0 0 0 0 333
Bishops College St . John 's 0 0 0 0 0 0 0 0 0 0 228 229 213 44 714
Booth Memorial High School St . John 's 0 0 0 0 0 0 0 0 0 0 177 211 218 72 678
Brother Rice Junior High St . John 's 0 0 0 0 0 0 0 190 193 167 0 0 0 0 550
Cowan Heights Elementary School St . John 's 55 80 76 78 87 77 83 0 0 0 0 0 0 0 536
District School St . John 's 0 0 0 0 0 0 0 1 3 1 20 2 1 0 28
Gonzaga High School St . John 's 0 0 0 0 0 0 0 0 0 0 207 251 264 38 760
Go ulds Elem enta ry St . John 's 108 100 114 44 36 0 0 0 0 0 0 0 0 0 402
Hazelwood Elementary School St . John 's 88 91 85 102 88 112 94 0 0 0 0 0 0 0 660
Ho ly Cro ss E lem enta ry St . John 's 36 41 39 44 49 42 46 0 0 0 0 0 0 0 297
Holy Cross Junior High St . John 's 0 0 0 0 0 0 0 134 128 133 0 0 0 0 395
Holy Heart of Mary High School St . John 's 0 0 0 0 0 0 0 0 0 0 290 327 228 72 917
I.J. Samson St . John 's 0 0 0 0 0 0 0 126 141 158 0 0 0 0 425
Larkhall Academy St . John 's 62 52 43 50 48 46 49 0 0 0 0 0 0 0 350
Leary's Brook Junior High St . John 's 0 0 0 0 0 0 0 137 144 154 0 0 0 0 435
Ma cD ona ld Driv e E lem enta ry St . John 's 57 49 78 78 80 81 93 0 0 0 0 0 0 0 516
MacDonald Drive Junior High St . John 's 0 0 0 0 0 0 0 209 252 231 0 0 0 0 692

Education Statistics - Elementary-Secondary, 2000-01 Enrolment Information 29
Table 16. Enrolment by School and Grade1, 2000-01
District #10 - Avalon East (cont’d)
School Name Co mm unity K 1 2 3 4 5 6 7 8 9 10 11 124 th
Yr 2 Total
Ma cph erso n E lem enta ry St . John 's 36 49 46 45 47 55 45 0 0 0 0 0 0 0 323
Mary Queen of Peace St . John 's 81 72 80 86 96 99 106 0 0 0 0 0 0 0 620
Princ e of W ales Co llegiate St . John 's 0 0 0 0 0 0 0 0 0 0 281 279 261 61 882
Ro nca lli Elem enta ry St . John 's 32 28 28 21 30 26 25 0 0 0 0 0 0 0 190
St. A ndre w's E lem enta ry St . John 's 29 39 48 48 61 47 45 0 0 0 0 0 0 0 317
St. John Bosco St . John 's 34 29 36 38 42 34 52 32 52 50 45 34 25 1 504
St. K evin 's Eleme ntary St . John 's 0 0 0 71 76 131 124 108 129 0 0 0 0 0 639
St. Kevin's High St . John 's 0 0 0 0 0 0 0 0 0 136 120 103 115 6 480
St. M ary's E lem enta ry St . John 's 27 30 26 30 30 32 30 0 0 0 0 0 0 0 205
St. M atthews Elem enta ry St . John 's 75 78 71 85 78 85 92 0 0 0 0 0 0 0 564
St. Paul's Junior High St . John 's 0 0 0 0 0 0 0 195 175 185 0 0 0 0 555
St. P ius X Elem enta ry St . John 's 37 39 50 53 49 58 50 0 0 0 0 0 0 0 336
St. Teresa's School St . John 's 79 76 73 83 77 89 66 0 0 0 0 0 0 0 543
Va nier E lem enta ry St . John 's 50 64 58 59 65 74 51 0 0 0 0 0 0 0 421
Virginia Park Elementary School St . John 's 40 45 32 43 40 32 32 0 0 0 0 0 0 0 264
Top sail E lem enta ry Topsail 102 89 84 97 100 81 102 0 0 0 0 0 0 0 655
Ho ly Trinity E lem enta ry Torbay 64 75 71 77 74 77 76 96 95 0 0 0 0 0 705
Holy Trinity High School Torbay 0 0 0 0 0 0 0 0 0 112 139 131 93 8 483
Ho ly Re dee me r Elem enta ry Trepassey 12 20 10 19 13 19 19 0 0 0 0 0 0 0 112
Stel la Maris Central High Trepassey 0 0 0 0 0 0 0 23 26 26 29 34 25 3 166
Up per G ullies E lem enta ry Upper Gullies 35 47 49 59 61 60 53 0 0 0 0 0 0 0 364
St. B erna rd's P rima ry Wit less Bay 33 38 44 43 0 0 0 0 0 0 0 0 0 0 158
Total 1,983 2,070 2,053 2,248 2,305 2,425 2,337 2,372 2,529 2,562 2,517 2,660 2,438 489 30,988
1 Stu dents rece iving spe cial e duca tion serv ices are reported in th eir age app rop riate grade or the high es t grade offe red in the sch oo l.2 Students who previously attended senior high for at least three years.

30 Enrolment Information Education Statistics - Elementary-Secondary, 2000-01
Table 16. Enrolment by School and Grade1, 2000-01
District #11. - Conseil scolaire francophone provincial de Terre-Neuve et du Labrador
S ch oo l N am e Co m m unity K 1 2 3 4 5 6 7 8 9 10 11 124 th
Yr 2 Total
École Notre-Dame-du-Cap De Grau 7 9 4 8 9 7 0 2 2 0 0 0 0 0 48
Classes françaises Happy Va lley /G.B. 2 3 4 2 2 0 0 0 0 0 0 0 0 0 13
Our Lady Queen of Peace Happy Va lley /G.B. 0 0 0 0 0 0 0 0 5 0 0 0 0 0 5
École Ste-Anne La G rand 'Terre 5 8 8 8 8 8 4 5 8 12 7 3 9 2 95
Centre éduca tif l'ENVOL Lab rado r City 4 5 4 3 2 2 2 1 3 2 2 0 0 0 30
L'École Française de St-Jean St . John 's 7 3 7 7 6 9 5 9 2 9 0 1 0 0 65
Total 25 28 27 28 27 26 11 17 20 23 9 4 9 2 256
Table 16. Enrolment by School and Grade1, 2000-01
Other Schools
S ch oo l N am e Co m m unity K 1 2 3 4 5 6 7 8 9 10 11 124 th
Yr 2 Total
Pr ivate
Eric G. Lambert Al l-Grade Ch urchill Fa lls 9 9 15 6 13 11 17 9 20 11 12 12 11 2 157
Imm acu late H eart of M ary
School
Corner Brook 15 3 7 5 4 6 1 5 0 0 0 0 0 0 46
First Baptist Academy Mo unt P earl 0 0 0 1 1 2 4 2 5 2 2 1 3 0 23
Brother T. I . Murphy St . John 's 0 0 0 0 0 0 0 0 0 0 14 17 18 8 57
Lakecrest School St . John 's 10 13 13 18 14 19 7 10 8 9 0 0 0 0 121
St. Bonaventure's College St . John 's 28 20 20 25 24 17 30 31 30 30 18 0 0 0 273
St. John's Adventist Academy St . John 's 1 0 5 4 4 4 2 6 9 7 4 6 5 0 57
First Nation
St. Anneway Kegnamogwom Conne River 29 12 14 14 15 15 10 12 10 13 16 10 10 0 180
Other
Nf School for the Deaf St . John 's 8 5 4 2 4 4 5 6 3 0 9 7 7 2 66
Nfld & Lab You th Centre W hitbourne 0 0 0 0 0 0 0 0 0 5 20 21 8 0 54
Total 100 62 78 75 79 78 76 81 85 77 95 74 62 12 1,034
1 Stu dents rece iving spe cial e duca tion serv ices are reported in th eir age app rop riate grade or the high es t grade offe red in the sch oo l.2 Students who previously attended senior high for at least three years.
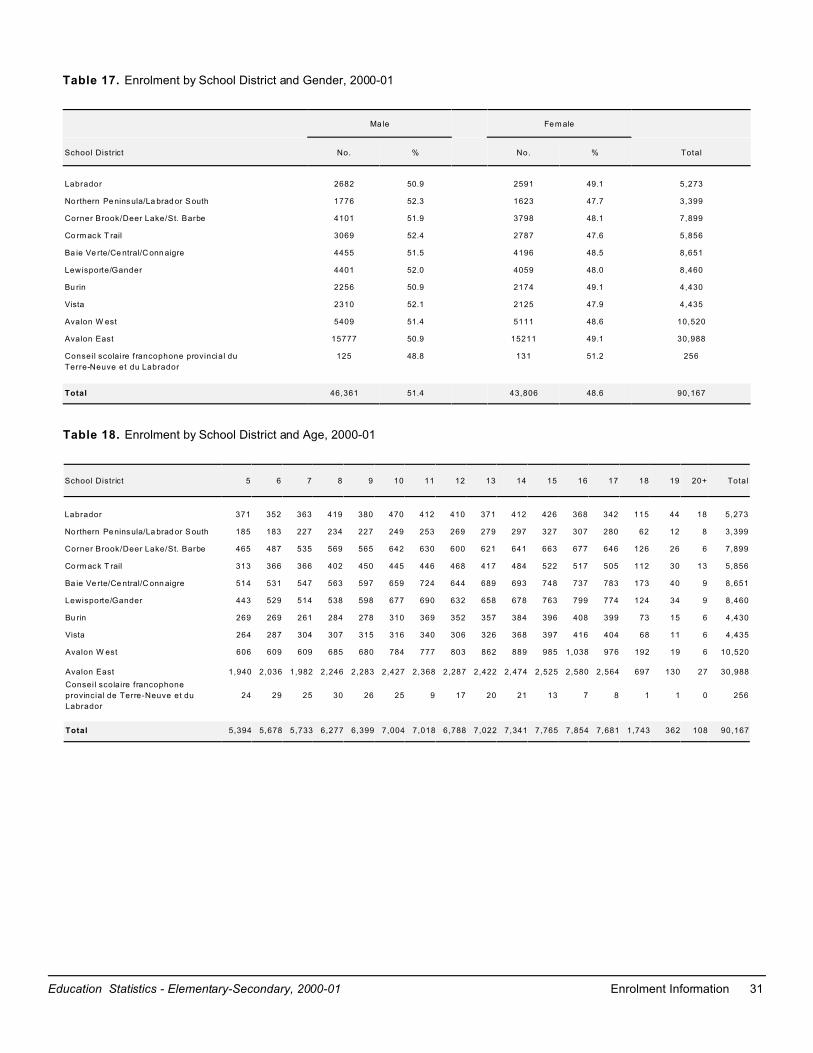
Education Statistics - Elementary-Secondary, 2000-01 Enrolment Information 31
Table 17. Enrolment by School District and Gender, 2000-01
Ma le Fem ale
School District No. % No. % Total
Labrador 2682 50.9 2591 49.1 5,273
No rthern Peninsula/La brad or South 1776 52.3 1623 47.7 3,399
Corner Brook/Deer Lake/St. Barbe 4101 51.9 3798 48.1 7,899
Co rm ack T rail 3069 52.4 2787 47.6 5,856
Ba ie Ve rte/Ce ntral/C onn aigre 4455 51.5 4196 48.5 8,651
Lewisporte/Gander 4401 52.0 4059 48.0 8,460
Bu rin 2256 50.9 2174 49.1 4,430
Vista 2310 52.1 2125 47.9 4,435
Avalon W est 5409 51.4 5111 48.6 10,520
Avalon East 15777 50.9 15211 49.1 30,988
Conseil scolaire francophone provincial du
Terre-Neuve et du Labrador
125 48.8 131 51.2 256
Total 46,361 51.4 43,806 48.6 90,167
Table 18. Enrolment by School District and Age, 2000-01
School District 5 6 7 8 9 10 11 12 13 14 15 16 17 18 19 20+ Total
Labrador 371 352 363 419 380 470 412 410 371 412 426 368 342 115 44 18 5,273
No rthern Peninsula/La brad or South 185 183 227 234 227 249 253 269 279 297 327 307 280 62 12 8 3,399
Corner Brook/Deer Lake/St. Barbe 465 487 535 569 565 642 630 600 621 641 663 677 646 126 26 6 7,899
Co rm ack T rail 313 366 366 402 450 445 446 468 417 484 522 517 505 112 30 13 5,856
Ba ie Ve rte/Ce ntral/C onn aigre 514 531 547 563 597 659 724 644 689 693 748 737 783 173 40 9 8,651
Lewisporte/Gander 443 529 514 538 598 677 690 632 658 678 763 799 774 124 34 9 8,460
Bu rin 269 269 261 284 278 310 369 352 357 384 396 408 399 73 15 6 4,430
Vista 264 287 304 307 315 316 340 306 326 368 397 416 404 68 11 6 4,435
Avalon W est 606 609 609 685 680 784 777 803 862 889 985 1,038 976 192 19 6 10,520
Avalon East 1,940 2,036 1,982 2,246 2,283 2,427 2,368 2,287 2,422 2,474 2,525 2,580 2,564 697 130 27 30,988
Conseil scolaire francophone
provincial de Terre-Neuve et du
Labrador
24 29 25 30 26 25 9 17 20 21 13 7 8 1 1 0 256
Total 5,394 5,678 5,733 6,277 6,399 7,004 7,018 6,788 7,022 7,341 7,765 7,854 7,681 1,743 362 108 90,167

32 Enrolment Information Education Statistics - Elementary-Secondary, 2000-01
Table 19. Enrolment by Subject and Grade1, K-6, 2000-01
Subject K 1 2 3 4 5 6 Total
Provincially Developed Courses
Art 5,384 5,725 5,765 6,235 6,425 7,036 6,693 43,263
Core French 677 1,371 1,646 2,490 5,935 6,356 6,274 24,749
En glish L ang uag e A rts 4,922 5,328 5,395 6,073 6,270 6,876 6,617 41,481
He alth 5,303 5,671 5,702 6,165 6,352 6,998 6,762 42,953
Mathematics 5,398 5,740 5,781 6,240 6,408 7,020 6,767 43,354
Mu sic 5,283 5,604 5,606 6,081 6,218 6,746 6,512 42,050
Physical Education 5,393 5,746 5,796 6,281 6,464 7,079 6,866 43,625
Religious Education 5,347 5,705 5,756 6,254 6,425 6,890 6,763 43,140
Science 5,398 5,746 5,791 6,271 6,456 7,085 6,842 43,589
Social Studies 5,353 5,705 5,755 6,251 6,442 6,934 6,790 43,230
Table 20. Enrolment by Subject and Grade1, 7-9, 2000-01
Subject 7 8 9 Total
Provincially Developed Courses
Art 1,026 1,080 759 2,865
Career Explorat ion 4,630 4,726 3,730 13,086
Core French 5,524 5,822 5,819 17,165
Family Life Education 1,164 1,333 1,822 4,319
Adolescence: Healthy Lifestyles 6,019 6,458 5,433 17,910
En glish L ang uag e A rts 6,688 7,218 7,369 21,275
Hom e Econom ics 1,753 2,423 1,648 5,824
Tec hno logy Educa tion/Ind ustrial A rts 4,061 5,158 4,473 13,692
Mathematics 6,688 7,177 7,228 21,093
Mus ic 5,133 4,652 3,293 13,078
Physical Education 6,737 7,339 7,065 21,141
Religious Education 6,232 6,594 6,547 19,373
Science 6,695 7,254 7,350 21,299
Social Studies 6,673 7,148 7,399 21,220
1 En rolm ent in m and atory su bjec ts suc h as English m ay no t includ e ch ildren re ceivin g instru ction in spe cial ed uca tion se rvices , French first lan gua ge c hildren or stud ents
receiving al l instruction in a language other than English.

Education Statistics - Elementary-Secondary, 2000-01 Enrolment Information 33
Table 21. Senior High Course Enrolment by Gender, 1998-99 to 2000-01
Course
Enrolment
1998-98 1999-00 2000-01
Sc hools
Offering Ma le Fem ale Total
Sc hools
Offering Male Fem ale Total
Sc hools
Offering Male Female Total
Art
Art and Design 2200 35 608 587 1,195 46 745 795 1,540 57 1,069 987 2,056
Art and Design 3200 30 398 408 806 32 416 513 929 37 463 552 1,015
Art and Society 3222 2 6 13 19 1 3 8 11 1 18 4 22
Art and Texti les 2126 2 11 42 53 1 4 29 33 2 51 19 70
Art History 4222 1 1 4 5 2 5 14 19 1 4 4 8
Art Technologies 1201 48 828 690 1,518 44 851 717 1,568 54 991 916 1,907
Studio Art 4220 - - - - 4 8 30 38 1 5 6 11
Cooperative Education
Career Pathways 3122 2 20 24 44 2 3 15 18 1 10 0 10
Career Pathways 3222 6 75 86 161 4 37 60 97 7 70 97 167
Cooperative Education 1100 35 442 541 983 34 521 590 1,111 27 364 454 818
Cooperative Education 1120 8 86 100 186 7 75 52 127 3 24 19 43
Cooperative Education 1122 2 16 27 43 3 24 35 59 3 27 38 65
Cooperative Education 2120 - - - - - - - - 1 33 30 63
Cooperative Education 2122 - - - - - - - - 3 29 34 63
Cooperative Education 2220 13 137 153 290 8 93 129 222 8 77 100 177
Cooperative Education 3220 14 151 168 319 13 142 199 341 8 61 94 155
Cooperative Education 3221 4 18 32 50 4 27 50 77 3 18 23 41
Cooperative Education 3227 5 50 62 112 4 70 67 137 5 64 68 132
Future Pathways 3126 1 66 64 130 1 45 42 87 1 114 93 207
Future Pathways 3226 1 66 64 130 1 45 42 87 1 114 93 207
W ork Study 3223 1 5 4 9 3 17 15 32 1 4 1 5
English (Language)
Advanced Writ ing 3103 23 133 316 449 24 148 304 452 26 137 373 510
Basic English 1102 82 761 380 1,141 83 847 409 1,256 85 816 424 1,240
Business English 3102 95 1,064 613 1,677 108 1,034 626 1,660 86 794 451 1,245
Comm unication and Leadership 3220 - - - - 2 27 32 59 3 49 47 96
English 1170 - - - - - - - - 1 3 2 5
English 1211 11 243 287 530 13 313 342 655 13 293 307 600
English 1212 9 129 68 197 11 146 78 224 11 125 71 196
English 2211 - - - - 13 269 302 571 13 252 297 549
English 2212 - - - - 9 118 71 189 12 127 79 206
English 3211 - - - - - - - - 10 150 201 351
English 3212 - - - - - - - - 8 78 22 100
English Second Lang. 1205 2 4 14 18 1 4 11 15 1 1 5 6
English Second Lang. 2205 2 9 7 16 1 3 13 16 1 4 12 16
English Second Lang. 3225 1 1 5 6 2 17 23 40 1 3 5 8
Functional English 1272 - - - - - - - - 1 3 1 4
I. B. English 3221 - - - - - - - - 1 7 20 27
Language 1101 129 3,208 3,382 6,590 133 3,234 3,238 6,472 124 2,875 3,006 5,881
Language 1225 - - - - - - - - 1 8 6 14
Language 2101 137 3,345 3,582 6,927 127 2,990 3,168 6,158 120 2,809 2,833 5,642
Language 3101 145 3,219 3,631 6,850 138 2,957 3,463 6,420 131 2,874 3,270 6,144
Language Study 3124 2 122 122 244 1 1 15 16 3 8 19 27
Language & Composition 4121 1 5 9 14 - - - - 2 5 16 21
Reading 1270 - - - - - - - - 1 2 1 3
Vocational English 2102 80 880 450 1,330 80 939 436 1,375 80 818 408 1,226
W rit ing 2213 6 145 149 294 8 191 226 417 11 244 283 527
English (Literature)
Canadian Literature 2204 60 921 705 1,626 54 824 706 1,530 64 1,132 721 1,853
English Second Lang. (Lit) 2226 - - - - 2 19 17 36 1 3 12 15
Folk Literature 3203 27 354 246 600 29 395 260 655 32 495 292 787
Global Literature 2214 1 9 9 18 3 78 62 140 2 42 40 82
Literary Heritage 2201 112 2,924 3,055 5,979 99 2,757 2,829 5,586 101 2,382 2,564 4,946
Literary Heritage 2223 2 46 99 145 1 11 12 23 2 11 13 24
Literary Heritage 3202 33 509 643 1,152 34 531 786 1,317 28 403 603 1,006
Literature & Composition 4222 6 29 58 87 10 50 101 151 9 48 67 115
Theatre Arts 2200 44 422 645 1,067 56 580 871 1,451 55 800 868 1,668
Theatre Arts 3220 11 74 121 195 13 78 153 231 12 97 136 233
Thematic Literature 1200 117 2,975 2,328 5,303 128 3,011 2,204 5,215 118 2,865 2,210 5,075
Thematic Literature 1270 - - - - - - - - 1 1 1 2
Thematic Literature 3201 132 3,113 3,578 6,691 139 2,746 3,094 5,840 119 2,806 3,073 5,879

Table 21. Senior High Course Enrolment by Gender, 1998-99 to 2000-01
Course
Enrolment
1998-98 1999-00 2000-01
Sc hools
Offering Ma le Fem ale Total
Sc hools
Offering Male Fem ale Total
Sc hools
Offering Male Female Total
34 Enrolment Information Education Statistics - Elementary-Secondary, 2000-01
Enterprise Education
Accounting 4125 1 0 4 4 1 2 6 8 1 0 2 2
Accounting 4126 - - - - 1 2 6 8 1 0 2 2
Affaires et Entrepreneuriat 1130 5 35 61 96 10 96 133 229 9 68 114 182
Business Enterprise 1100 37 730 589 1,319 35 703 596 1,299 42 708 588 1,296
Consumer Studies 1202 82 1,832 1,516 3,348 84 1,933 1,569 3,502 85 1,731 1,390 3,121
Cultural Tourism 3127 3 56 85 141 2 35 87 122 2 34 41 75
Enterprise 2125 10 243 240 483 6 202 201 403 3 137 130 267
Enterprise 3205 77 1,418 1,398 2,816 98 1,787 1,933 3,720 101 2,016 1,990 4,006
Hospital ity/Tourism 3120 5 76 120 196 5 102 127 229 3 81 80 161
Family Studies
Clothing 1101 15 106 380 486 15 117 377 494 22 157 654 811
Family Living 2200 80 1,237 1,295 2,532 87 1,271 1,581 2,852 75 1,523 1,878 3,401
Food Service 2125 2 35 46 81 2 30 61 91 2 22 41 63
Foods 1100 38 825 1,061 1,886 33 770 941 1,711 34 708 1,070 1,778
Housing and Interior Design 2222 - - - - - - - - 1 14 12 26
Human Dynamics 2210 - - - - - - - - 3 20 59 79
Life Skills: U nde rstanding Ea rly Years - - - - - - - - 1 10 11 21
Nutri tion 3100 61 816 980 1,796 62 832 955 1,787 66 824 1,050 1,874
Textiles 2126 - - - - - - - - 1 22 56 78
Textiles 3101 8 49 132 181 11 72 193 265 9 72 244 316
Foreign Language
German 2226 - - - - 4 16 22 38 3 23 37 60
German 3226 1 9 10 19 2 17 17 34 1 5 5 10
Spanish 2221 5 32 102 134 8 52 140 192 7 44 139 183
Spanish 3221 - - - - - - - - 2 10 8 18
Français Lang Prem ière
Français 1230 1 5 6 11 2 4 2 6 2 9 7 16
Français 2230 1 5 2 7 1 4 6 10 3 2 4 6
Français 3230 1 5 9 14 1 5 2 7 1 3 5 8
French
Accelerated French 2203 2 12 29 41 3 21 54 75 7 41 93 134
Accelerated French 3203 2 11 42 53 2 10 25 35 3 17 42 59
Français (immersion) 1202 15 153 240 393 14 153 237 390 16 147 253 400
Français (immersion) 2202 17 159 250 409 16 137 225 362 19 164 275 439
Français (immersion) 3202 15 125 198 323 16 178 278 456 15 128 195 323
French 2200 112 943 1,797 2,740 109 1,054 1,806 2,860 103 962 1,697 2,659
French 3200 105 510 1,222 1,732 102 542 1,279 1,821 95 474 1,073 1,547
French 3201 40 87 306 393 44 105 351 456 40 113 356 469
French 4220 3 4 21 25 3 52 64 116 1 2 9 11
I. B. French 3221 - - - - - - - - 1 4 12 16
General Education
Learning Strategies 1120 5 75 61 136 3 48 51 99 3 29 25 54
Learning Strategies 1220 13 111 66 177 13 103 79 182 12 124 68 192
Psychology 4220 6 17 62 79 8 44 119 163 7 28 93 121
Study 1101 - - - - 1 20 10 30 1 17 14 31
Study 1102 - - - - 1 23 7 30 1 16 15 31
Theory of Knowledge 3120 - - - - - - - - 1 14 39 53
Guidance
Affect ive Development 3120 4 32 35 67 2 30 25 55 2 26 29 55
Career Explorat ion 1101 94 1,683 1,445 3,128 90 1,603 1,523 3,126 94 1,763 1,601 3,364
Comm unity Leadership 3220 - - - - 1 14 10 24 1 23 11 34
Peer Counsell ing 2101 17 116 259 375 20 141 241 382 22 187 273 460
Peer Counsell ing 3221 - - - - 2 2 18 20 1 2 6 8
Social Thinking 2123 1 3 4 7 2 5 1 6 2 10 9 19
He alth
First Aid/ Outdoor Survival 1 44 48 92 1 27 22 49 1 44 47 91
W orkplace Safety 3220 10 189 86 275 30 527 355 882 41 694 491 1,185

Table 21. Senior High Course Enrolment by Gender, 1998-99 to 2000-01
Course
Enrolment
1998-98 1999-00 2000-01
Sc hools
Offering Ma le Fem ale Total
Sc hools
Offering Male Fem ale Total
Sc hools
Offering Male Female Total
Education Statistics - Elementary-Secondary, 2000-01 Enrolment Information 35
Mathematics
Advanced Math 1201 113 1,159 1,445 2,604 104 1,128 1,293 2,421 9 84 101 185
Advanced Math 2201 125 1,245 1,504 2,749 110 1,030 1,272 2,302 103 954 1,152 2,106
Advanced Math 3201 127 1,003 1,248 2,251 125 1,037 1,278 2,315 105 933 1,035 1,968
Business Math 3202 112 1,166 811 1,977 115 1,182 732 1,914 93 882 634 1,516
Calculus Readiness 3105 92 642 859 1,501 105 774 1,036 1,810 87 646 833 1,479
Consumer Math 1202 94 749 435 1,184 13 91 61 152 3 7 31 38
Functional Mathematics 1272 - - - - - - - - 1 2 2 4
I. B. Mathematics 3221 - - - - - - - - 1 6 20 26
Mathematics 1204 11 208 188 396 12 289 218 507 145 3,007 3,189 6,196
Mathematics 1206 7 69 29 98 84 758 490 1,248 120 1,338 831 2,169
Mathematics 1276 - - - - - - - - 1 7 2 9
Mathematics 1300 140 2,419 2,254 4,673 131 2,297 2,083 4,380 5 31 31 62
Mathematics 2206 3 49 45 94 5 51 36 87 61 468 344 812
Mathematics 2214 - - - - 7 77 85 162 8 127 110 237
Mathematics 2215 - - - - 6 45 27 72 8 93 83 176
Mathematics 2200 141 2,024 2,049 4,073 137 1,955 1,974 3,929 132 2,029 1,921 3,950
Mathematics 3127 1 27 28 55 2 37 33 70 2 14 21 35
Mathematics 3200 144 2,070 2,069 4,139 146 2,009 2,163 4,172 122 1,695 1,920 3,615
Mathematics 3214 - - - - - - - - 10 111 118 229
Mathematics 3215 - - - - 1 9 12 21 6 47 45 92
Mathematics 3216 4 41 52 93 5 73 104 177 11 119 82 201
Mathematics 4225 22 172 178 350 22 129 175 304 25 210 245 455
Alternate Mathematics 4275 - - - - - - - - 1 12 9 21
Mathématiques 1231 - - - - 2 1 3 4 3 8 9 17
Mathématiques 1233 - - - - 1 3 0 3 1 2 1 3
Mathématiques 2231 - - - - - - - - 1 1 0 1
Mathématiques 3230 1 2 5 7 1 5 1 6 1 1 0 1
Statistics 3104 68 785 873 1,658 66 709 829 1,538 51 543 637 1,180
Vocational Math 2202 77 741 494 1,235 73 739 451 1,190 8 32 29 61
M edia
Audio Visual Prod. 2121 1 61 43 104 1 83 83 166 1 55 37 92
Broadcast Journal ism & Media Prod. - - - - 1 8 10 18 2 4 14 18
Media and Society 3122 2 45 35 80 2 47 49 96 3 92 71 163
Media Technology 3221 1 29 14 43 1 32 11 43
Video/Fi lm Arts 3220 2 20 16 36 1 8 11 19 1 9 6 15
Music
Applied Music 2206 29 270 378 648 33 346 392 738 35 370 429 799
Applied Music 3206 24 136 231 367 25 123 172 295 28 207 230 437
I. B. Music 3222 - - - - - - - - 1 3 11 14
Ensemble Performance 1105 31 273 418 691 23 104 283 387 29 146 424 570
Ensemble Performance 2105 26 130 254 384 21 94 222 316 24 78 257 335
Ensemble Performance 3105 21 57 184 241 19 55 177 232 21 76 190 266
Experiencing Music 2200 16 103 121 224 20 160 160 320 24 166 196 362
Music Theatre 3221 1 8 8 16 1 10 10 20 2 15 14 29
Music Theory 4227 4 20 23 43 4 10 13 23 7 20 23 43
Native Languages
Inuktitut 1120 2 8 10 18 2 11 10 21 2 7 18 25
Inuktitut 2120 2 1 5 6 1 6 10 16 2 9 12 21
Physical Education
Ed. Physique 1243 - - - 2 4 1 5 1 4 2 6
Ed. Physique 2243 - - - - - - - 2 2 3 5
Healthy Living 1210 6 113 69 182 4 66 33 99 4 87 71 158
Outdoor Living 2220 - - - - - - - 1 24 3 27
Physical Education 1100 108 2,377 1,275 3,652 110 2,322 1,273 3,595 119 2,448 1,353 3,801
Physical Education 2100 109 2,176 979 3,155 114 2,238 1,119 3,357 108 2,308 1,107 3,415
Physical Education 3100 122 2,229 1,132 3,361 115 2,165 1,167 3,332 115 2,128 1,034 3,162
Physical Education 3220 - - - 2 27 4 31 1 43 10 53
W ellness 1223 1 20 3 23 2 70 30 100 3 58 46 104
Religious Education
Ethical Issues 1104 79 1,091 1,120 2,211 72 1,120 1,175 2,295 70 954 988 1,942
La diversité rel igeuse 3134 - - - - - - - - 1 3 6 9
Religious W rit ings 2104 31 319 338 657 34 435 448 883 36 361 380 741
W orld Religions 3104 61 971 966 1,937 63 741 883 1,624 72 827 930 1,757
Science

Table 21. Senior High Course Enrolment by Gender, 1998-99 to 2000-01
Course
Enrolment
1998-98 1999-00 2000-01
Sc hools
Offering Ma le Fem ale Total
Sc hools
Offering Male Fem ale Total
Sc hools
Offering Male Female Total
36 Enrolment Information Education Statistics - Elementary-Secondary, 2000-01
Aquaculture 2220 - - - - 1 17 6 23 1 15 5 20
Aquaculture 3226 - - - - - - - - 1 4 4 8
Biologie 2231 - - - - - - - - 1 6 4 10
Biology 2201 114 2,888 3,303 6,191 123 2,904 3,326 6,230 116 2,731 3,029 5,760
Biology 2211 - - - - - - - - 4 61 82 143
Biology 3201 124 2,423 3,197 5,620 118 2,271 3,037 5,308 117 2,239 3,045 5,284
Biology 4221 11 38 85 123 14 91 161 252 11 37 63 100
I. B. Biology 3229 - - - - - - - - 1 7 20 27
Chemistry 2202 123 2,231 2,671 4,902 108 1,953 2,357 4,310 114 1,833 2,385 4,218
Chemistry 2212 - - - - 3 82 134 216 3 66 68 134
Chemistry 3202 106 1,187 1,685 2,872 111 1,404 1,764 3,168 94 1,159 1,536 2,695
Chemistry 3212 - - - - - - - - 1 8 22 30
Chemistry 4222 10 61 36 97 15 94 119 213 14 88 88 176
Chimie 2239 - - - - - - - - 3 6 7 13
Earth Science 2223 10 319 257 576 8 320 218 538 10 294 186 480
Earth Systems 3209 10 148 133 281 41 773 674 1,447 28 506 436 942
Environmental Science 3205 102 1,590 1,266 2,856 101 1,546 1,181 2,727 101 1,722 1,479 3,201
Environmental Science 4225 - - - - - - - - 1 8 10 18
General Science 1200 63 686 441 1,127 62 660 422 1,082 75 853 507 1,360
Physical Science 2205 42 588 323 911 50 568 312 880 52 634 354 988
Physics 2204 113 1,895 1,773 3,668 109 1,879 1,599 3,478 104 1,620 1,505 3,125
Physics 2214 - - - - 3 38 37 75 6 75 49 124
Physics 3204 106 1,413 1,192 2,605 108 1,284 1,156 2,440 98 1,248 939 2,187
Physics 3211 - - - - - - - - 1 5 6 11
Physics 4224 8 42 13 55 10 61 17 78 8 58 8 66
Physique 2234 - - - - 1 1 2 3 1 1 2 3
Planetary Science 2229 1 38 33 71 1 48 31 79 1 59 47 106
Science 1216 5 128 85 213 8 210 176 386 6 139 126 265
Science/Tech./Society 2206 64 730 486 1,216 65 753 487 1,240 56 576 421 997
Sciences intégrées 1236 - - - - - - - - 1 2 2 4
Social Studies
Canadian Economy 2103 88 1,663 1,567 3,230 73 1,374 1,376 2,750 73 1,283 1,254 2,537
Canadian Geography 1202 98 2,479 2,086 4,565 95 2,630 2,025 4,655 89 2,405 2,036 4,441
Canadian History 1201 82 1,353 1,329 2,682 84 1,445 1,302 2,747 81 1,187 1,274 2,461
Canadian Issues 1209 51 1,076 1,038 2,114 53 1,001 876 1,877 51 757 659 1,416
Canadian Law 2104 78 1,418 1,288 2,706 67 1,094 1,085 2,179 60 1,017 1,003 2,020
Creativity Action and Service 2129 - - - - - - - - 1 8 28 36
Droit canadienne 2134 8 96 182 278 3 38 53 91 1 25 19 44
Économie canadienne 2133 7 64 124 188 14 167 258 425 12 154 200 354
Économie mondiale 3133 4 67 69 136 7 88 154 242 5 82 94 176
European History 4225 2 13 1 14 4 26 19 45 6 34 26 60
Geographie du Canada 1232 12 147 222 369 13 163 265 428 17 192 331 523
Global Economics 3103 32 399 519 918 29 417 500 917 26 389 405 794
Global Issues 3205 44 766 832 1,598 53 836 787 1,623 50 732 796 1,528
Government and Polit ics 4227 - - - - - - - - 2 2 2 4
Histoire du Canada 1231 - - - - - - - - 2 25 42 67
Histoire mondiale 2236 2 18 20 38 5 53 75 128 6 41 95 136
Histoire mondiale 3231 12 160 234 394 13 121 176 297 12 74 141 215
Human Geography 4220 - - - - - - - - 3 6 18 24
I. B. History 3227 - - - - - - - - 1 7 21 28
International Studies 3223 - - - - - - - - 1 9 14 23
Mi’kmaq Studies 1220 2 7 6 13 1 5 8 13
Topography 2127 1 37 6 43 1 18 6 24 1 30 16 46
Topography 2128 2 78 73 151 1 10 7 17 1 16 10 26
US History 4226 - - - - - - - - 1 1 0 1
W orld Geography 3202 114 2,988 2,722 5,710 115 2,894 2,677 5,571 106 2,759 2,408 5,167
W orld Geography 3212 1 18 15 33 1 11 4 15
W orld History 3201 58 832 833 1,665 66 1,040 1,058 2,098 69 851 882 1,733

Table 21. Senior High Course Enrolment by Gender, 1998-99 to 2000-01
Course
Enrolment
1998-98 1999-00 2000-01
Sc hools
Offering Ma le Fem ale Total
Sc hools
Offering Male Fem ale Total
Sc hools
Offering Male Female Total
Education Statistics - Elementary-Secondary, 2000-01 Enrolment Information 37
Technology Education
Adv W ord Proc/Desk Top 2101 86 1,288 1,203 2,491 82 1,082 1,034 2,116 67 810 858 1,668
Computer Applications 2100 80 1,466 1,268 2,734 83 1,313 1,103 2,416 66 1,183 1,001 2,184
Computer Technology 3200 49 650 330 980 49 626 327 953 47 592 285 877
Computer Science 4220 1 7 0 7 1 8 0 8 1 8 8 16
Comm unications Tech. 2104 80 1,242 875 2,117 74 1,191 799 1,990 79 1,181 773 1,954
Comm unications Tech. 3104 51 692 460 1,152 53 632 434 1,066 52 672 403 1,075
CISCO Networking 3222 - - - - - - - - 2 28 3 31
Design Technology 1109 75 1,627 936 2,563 76 1,593 833 2,426 75 1,357 846 2,203
Design Technology 2109 47 886 413 1,299 59 1,034 537 1,571 53 847 479 1,326
Flexible Manufacturing System 3220 2 18 6 24 1 14 1 15 1 9 5 14
Home Maintenance 3108 32 621 243 864 28 605 252 857 28 572 226 798
Integrated Technology 1215 7 102 63 165 9 146 72 218 8 324 76 400
Keyboarding/W ord Proc 1101 106 2,441 2,421 4,862 106 2,245 2,130 4,375 97 1,577 1,563 3,140
Les Applications de l ’informatiques 2130 - - - - 1 4 7 11 1 6 4 10
Microcomputer Systems 1100 106 2,498 2,240 4,738 101 1,995 1,809 3,804 86 1,891 1,588 3,479
Marine Technology 2128 1 34 10 44 1 55 30 85 1 39 33 72
CISCO Networking 3222 - - - - - - - - 2 28 3 31
Power Mechanics 2103 8 228 30 258 9 289 42 331 11 225 41 266
Robotics 3221 - - - - 2 22 3 25 4 48 4 52
Traitement de texte advancé/éditique - - - - - - - - 1 6 4 10
W ebmaster 3224 - - - - 3 58 12 70 1 25 8 33
W oodworking 1107 32 846 425 1,271 35 827 354 1,181 31 843 302 1,145
W oodworking 2107 21 492 130 622 26 610 206 816 26 693 183 876
Table 22. Senior High Course Enrolment for Courses Offered Through Distance Education by Gender, 1998-99 to 2000-01
Course
Enrolment
1998-99 1999-00 2000-01
Ma le Fem ale Total Male Fem ale Total Male Female Total
Art
Art Technologies 1201 - - - 8 3 11 15 12 27
French
French 2200 15 40 55 10 31 41 14 27 41
French 3200 10 28 38 7 42 49 13 36 49
French 3201 6 34 40 5 29 34 6 22 28
Français 1230 - - - 2 0 2 1 0 1
Français 2230 - - - 2 0 2 0 3 3
Mathematics
Advanced Mathematics 1201 55 95 150 50 71 121 4 2 6
Advanced Mathematics 2201 55 53 108 53 84 137 45 66 111
Advanced Mathematics 3201 69 80 149 59 73 132 49 58 107
Calculus Readiness 3105 54 73 127 64 79 143 40 42 82
Mathematics 4225 7 5 12 7 5 12 0 6 6
Science
Biology 4221 2 8 10 3 8 11 1 2 3
Chemistry 2202 44 57 101 40 50 90 42 46 88
Chemistry 3202 24 50 74 37 41 78 17 32 49
Chemistry 4222 8 5 13 6 11 17 17 4 21
Physics 2204 19 33 52 27 23 50 24 23 47
Physics 2214 - - - - - - 0 1 1
Physics 3204 24 18 42 26 21 47 15 18 33
Physics 4224 9 4 13 8 1 9 2 0 2
Physique 2234 - - - - - - 1 2 3
Social Studies
European History 4225 - - - - - - 4 0 4
Histoire mondiale 2236 - - - - - - 0 2 2
Histoire mondiale 3231 - - - - - - 1 0 1
Human Geography 4220 - - - - - - 2 0 2
1 Enrolment reported in Table 22 has also been included in the f igures reported in Table 21.
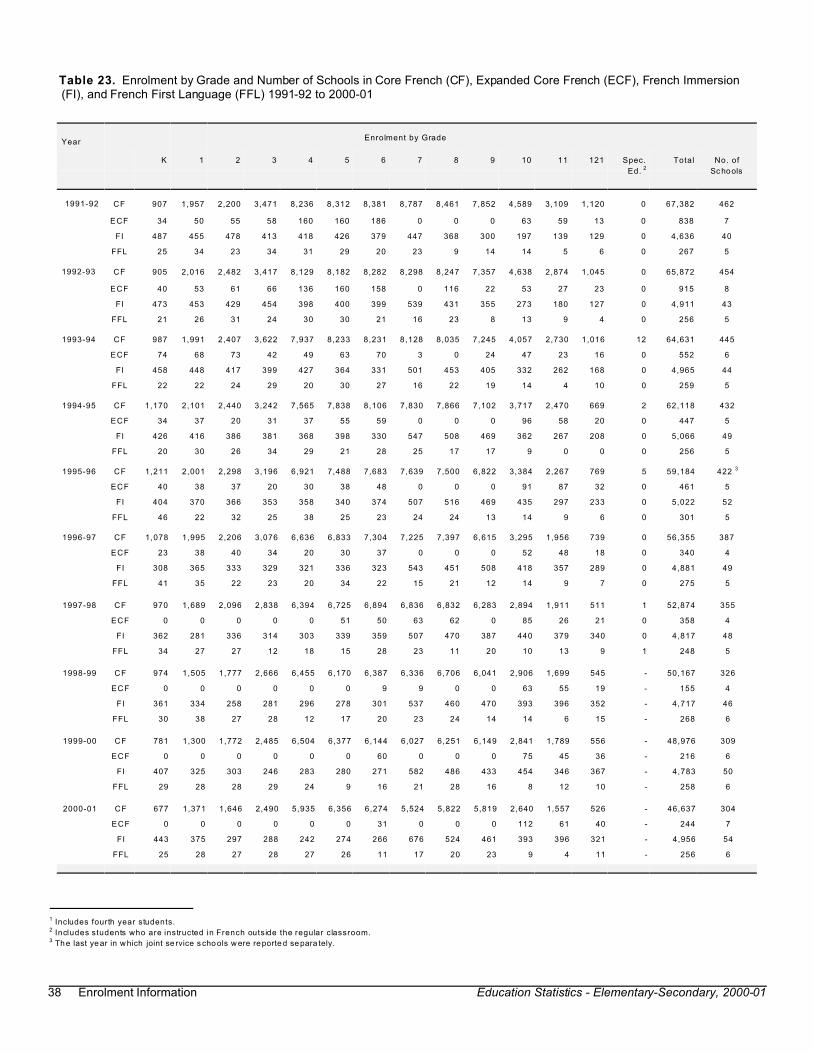
38 Enrolment Information Education Statistics - Elementary-Secondary, 2000-01
Table 23. Enrolment by Grade and Number of Schools in Core French (CF), Expanded Core French (ECF), French Immersion (FI), and French First Language (FFL) 1991-92 to 2000-01
YearEnrolment by Grade
K 1 2 3 4 5 6 7 8 9 10 11 121 Spec.
Ed. 2
Total No. of
Sc hools
1991-92 CF 907 1,957 2,200 3,471 8,236 8,312 8,381 8,787 8,461 7,852 4,589 3,109 1,120 0 67,382 462
ECF 34 50 55 58 160 160 186 0 0 0 63 59 13 0 838 7
FI 487 455 478 413 418 426 379 447 368 300 197 139 129 0 4,636 40
FFL 25 34 23 34 31 29 20 23 9 14 14 5 6 0 267 5
1992-93 CF 905 2,016 2,482 3,417 8,129 8,182 8,282 8,298 8,247 7,357 4,638 2,874 1,045 0 65,872 454
ECF 40 53 61 66 136 160 158 0 116 22 53 27 23 0 915 8
FI 473 453 429 454 398 400 399 539 431 355 273 180 127 0 4,911 43
FFL 21 26 31 24 30 30 21 16 23 8 13 9 4 0 256 5
1993-94 CF 987 1,991 2,407 3,622 7,937 8,233 8,231 8,128 8,035 7,245 4,057 2,730 1,016 12 64,631 445
ECF 74 68 73 42 49 63 70 3 0 24 47 23 16 0 552 6
FI 458 448 417 399 427 364 331 501 453 405 332 262 168 0 4,965 44
FFL 22 22 24 29 20 30 27 16 22 19 14 4 10 0 259 5
1994-95 CF 1,170 2,101 2,440 3,242 7,565 7,838 8,106 7,830 7,866 7,102 3,717 2,470 669 2 62,118 432
ECF 34 37 20 31 37 55 59 0 0 0 96 58 20 0 447 5
FI 426 416 386 381 368 398 330 547 508 469 362 267 208 0 5,066 49
FFL 20 30 26 34 29 21 28 25 17 17 9 0 0 0 256 5
1995-96 CF 1,211 2,001 2,298 3,196 6,921 7,488 7,683 7,639 7,500 6,822 3,384 2,267 769 5 59,184 422 3
ECF 40 38 37 20 30 38 48 0 0 0 91 87 32 0 461 5
FI 404 370 366 353 358 340 374 507 516 469 435 297 233 0 5,022 52
FFL 46 22 32 25 38 25 23 24 24 13 14 9 6 0 301 5
1996-97 CF 1,078 1,995 2,206 3,076 6,636 6,833 7,304 7,225 7,397 6,615 3,295 1,956 739 0 56,355 387
ECF 23 38 40 34 20 30 37 0 0 0 52 48 18 0 340 4
FI 308 365 333 329 321 336 323 543 451 508 418 357 289 0 4,881 49
FFL 41 35 22 23 20 34 22 15 21 12 14 9 7 0 275 5
1997-98 CF 970 1,689 2,096 2,838 6,394 6,725 6,894 6,836 6,832 6,283 2,894 1,911 511 1 52,874 355
ECF 0 0 0 0 0 51 50 63 62 0 85 26 21 0 358 4
FI 362 281 336 314 303 339 359 507 470 387 440 379 340 0 4,817 48
FFL 34 27 27 12 18 15 28 23 11 20 10 13 9 1 248 5
1998-99 CF 974 1,505 1,777 2,666 6,455 6,170 6,387 6,336 6,706 6,041 2,906 1,699 545 - 50,167 326
ECF 0 0 0 0 0 0 9 9 0 0 63 55 19 - 155 4
FI 361 334 258 281 296 278 301 537 460 470 393 396 352 - 4,717 46
FFL 30 38 27 28 12 17 20 23 24 14 14 6 15 - 268 6
1999-00 CF 781 1,300 1,772 2,485 6,504 6,377 6,144 6,027 6,251 6,149 2,841 1,789 556 - 48,976 309
ECF 0 0 0 0 0 0 60 0 0 0 75 45 36 - 216 6
FI 407 325 303 246 283 280 271 582 486 433 454 346 367 - 4,783 50
FFL 29 28 28 29 24 9 16 21 28 16 8 12 10 - 258 6
2000-01 CF 677 1,371 1,646 2,490 5,935 6,356 6,274 5,524 5,822 5,819 2,640 1,557 526 - 46,637 304
ECF 0 0 0 0 0 0 31 0 0 0 112 61 40 - 244 7
FI 443 375 297 288 242 274 266 676 524 461 393 396 321 - 4,956 54
FFL 25 28 27 28 27 26 11 17 20 23 9 4 11 - 256 6
1 Includes fourth year students.2 Includes students who are instructed in French outside the regular classroom.3 The last year in which joint se rvice s cho ols w ere reporte d se para tely.

Education Statistics - Elementary-Secondary, 2000-01 Enrolment Information 39
Table 24. Core French(CF) and Expanded Core French (ECF) Enrolment by School District and Grade, 2000-01
School District Enrolment by Grade
K 1 2 3 4 5 6 7 8 9 10 11 121 Total
Labrador CF 136 167 178 243 265 291 241 252 234 246 74 40 21 2,388
No rthern Peninsula/La brad or South CF 7 19 36 137 217 239 244 223 223 229 105 53 18 1,750
Corner Brook/Deer Lake/St. Barbe CF 0 0 0 348 533 610 570 553 564 531 249 113 67 4,138
Co rm ack T rail CF 1 3 11 57 429 415 414 382 354 394 263 144 30 2,897
Ba ie Ve rte/Ce ntral/C onn aigre CF 251 301 344 384 580 634 700 571 612 578 255 209 39 5,458
Lewisporte/Gander CF 62 78 69 99 572 639 620 601 616 606 291 184 43 4,480
ECF 0 0 0 0 0 0 0 0 0 0 23 23 0 46
Bu rin CF 0 178 179 192 266 302 337 310 312 305 164 87 72 2,704
ECF 0 0 0 0 0 0 0 0 0 0 8 2 15 25
Vista CF 0 0 0 0 305 302 316 278 313 312 134 67 35 2,062
ECF 0 0 0 0 0 0 0 0 0 0 15 17 16 48
Avalon W est CF 87 374 342 528 690 779 772 693 802 768 405 260 72 6,572
Avalon East2 CF 133 251 487 502 2,078 2,145 2,060 1,661 1,792 1,850 700 400 129 14,188
ECF 0 0 0 0 0 0 31 0 0 0 66 19 9 125
Total CF 677 1,371 1,646 2,490 5,935 6,356 6,274 5,524 5,822 5,819 2,640 1,557 526 46,637
ECF 0 0 0 0 0 0 31 0 0 0 112 61 40 244
Table 25. Early and Late French Immersion Enrolment by School District and Grade, 2000-01
School District Enrolment by Grade
K 1 2 3 4 5 6 7 8 9 10 11 121 Total
Labrador Ea rly 84 73 63 43 30 39 31 34 22 38 30 27 32 546
Corner Brook/Deer Lake/St. Barbe Ea rly 34 32 27 29 26 18 36 26 33 27 29 25 21 363
Co rm ack T rail Ea rly 21 23 15 18 14 18 17 12 13 22 12 19 12 216
Ba ie Ve rte/Ce ntral/C onn aigre Ea rly 26 30 28 16 23 20 22 24 21 18 21 19 11 279
Lewisporte/Gander Ea rly 36 36 28 31 27 21 19 23 13 16 17 20 19 306
Bu rin Ea rly 23 32 12 15 14 13 20 5 12 12 13 15 16 202
Avalon W est Late 0 0 0 0 0 0 0 71 31 32 38 33 29 234
Avalon East Ea rly 219 149 124 136 108 145 121 161 152 157 117 140 117 1,846
Late 0 0 0 0 0 0 0 320 227 139 116 98 64 964
Total Ea rly 443 375 297 288 242 274 266 285 266 290 239 265 228 3,758
Late - - - - - - - 391 258 171 154 131 93 1,198
1 Includes fourth year students.2 The Avalon East School District offers an intensive French program to students in Grade 6.
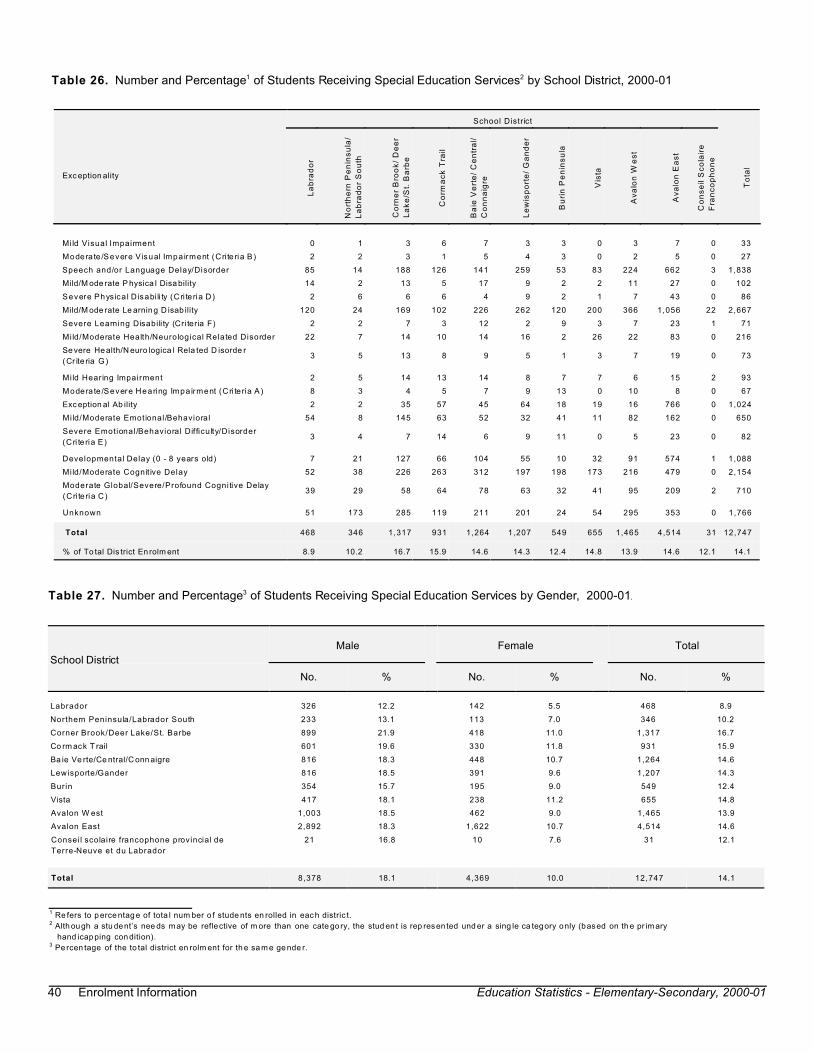
40 Enrolment Information Education Statistics - Elementary-Secondary, 2000-01
Table 26. Number and Percentage1 of Students Receiving Special Education Services2 by School District, 2000-01
Exc eption ality
School District
La
bra
do
r
No
rth
ern
Pe
nin
su
la/
La
bra
do
r S
ou
th
Co
rne
r B
roo
k/
De
er
La
ke
/St.
Ba
rbe
Co
rma
ck
Tra
il
Ba
ie V
ert
e/
Ce
ntr
al/
Co
nn
aig
re
Le
wis
po
rte
/ G
an
de
r
Bu
rin
Pe
nin
su
la
Vis
ta
Av
alo
n W
es
t
Av
alo
n E
as
t
Co
ns
eil S
co
lair
e
Fra
nc
op
ho
ne
To
tal
Mild Visual Impairment 0 1 3 6 7 3 3 0 3 7 0 33
Modera te /Severe V isual Impa irment (Cri te ria B) 2 2 3 1 5 4 3 0 2 5 0 27
Speech and/or Language Delay/Disorder 85 14 188 126 141 259 53 83 224 662 3 1,838
Mild/M ode rate P hysica l Disa bility 14 2 13 5 17 9 2 2 11 27 0 102
Severe Phys ica l D isabi li ty (Cri te ria D) 2 6 6 6 4 9 2 1 7 43 0 86
Mild/M ode rate Le arning D isab ility 120 24 169 102 226 262 120 200 366 1,056 22 2,667
Severe Learning Disabi li ty (Criteria F) 2 2 7 3 12 2 9 3 7 23 1 71
Mild/Moderate Health/Neurological Related Disorder 22 7 14 10 14 16 2 26 22 83 0 216
Se vere He alth/N euro logica l Rela ted D isorde r
(Cr ite ria G)3 5 13 8 9 5 1 3 7 19 0 73
Mild Hearing Impairment 2 5 14 13 14 8 7 7 6 15 2 93
Modera te /Severe Hearing Impa irment (Cri te ria A) 8 3 4 5 7 9 13 0 10 8 0 67
Exc eption al Ab ility 2 2 35 57 45 64 18 19 16 766 0 1,024
Mild/Moderate Emotional/Behavioral 54 8 145 63 52 32 41 11 82 162 0 650
Severe Emotional/Behavioral Difficulty/Disorder
(Cri te ria E)3 4 7 14 6 9 11 0 5 23 0 82
Developmental Delay (0 - 8 years old) 7 21 127 66 104 55 10 32 91 574 1 1,088
Mild/Moderate Cognit ive Delay 52 38 226 263 312 197 198 173 216 479 0 2,154
Moderate Global/Severe/Profound Cognitive Delay
(Cri te ria C)39 29 58 64 78 63 32 41 95 209 2 710
Unknown 51 173 285 119 211 201 24 54 295 353 0 1,766
Total 468 346 1,317 931 1,264 1,207 549 655 1,465 4,514 31 12,747
% of To tal Dis trict En rolm ent 8.9 10.2 16.7 15.9 14.6 14.3 12.4 14.8 13.9 14.6 12.1 14.1
Table 27. Number and Percentage3 of Students Receiving Special Education Services by Gender, 2000-01.
School District
Male Female Total
No. % No. % No. %
Labrador 326 12.2 142 5.5 468 8.9
Northern Peninsula/Labrador South 233 13.1 113 7.0 346 10.2
Corner Brook/Deer Lake/St. Barbe 899 21.9 418 11.0 1,317 16.7
Co rm ack T rail 601 19.6 330 11.8 931 15.9
Ba ie Ve rte/Ce ntral/C onn aigre 816 18.3 448 10.7 1,264 14.6
Lewisporte/Gander 816 18.5 391 9.6 1,207 14.3
Burin 354 15.7 195 9.0 549 12.4
Vista 417 18.1 238 11.2 655 14.8
Avalon W est 1,003 18.5 462 9.0 1,465 13.9
Avalon East 2,892 18.3 1,622 10.7 4,514 14.6
Conseil scolaire francophone provincial de
Terre-Neuve et du Labrador
21 16.8 10 7.6 31 12.1
Total 8,378 18.1 4,369 10.0 12,747 14.1
1 Re fers to p erce ntag e of tota l num ber o f stude nts en rolled in eac h distric t.2 Alth ough a stu dent’s nee ds may be reflective of m ore than one cate gory, the stud en t is rep resen ted und er a sing le ca tegory only (based on th e pr im ary
hand icapping con dition).3 Pe rcen tage of the to tal district en rolm ent for th e sa m e ge nde r.

Education Statistics - Elementary-Secondary, 2000-01 Enrolment Information 41
Table 28. Students Receiving Special Education Services1 by Category, Gender and Age, 2000-01
Ca tego ryAge
5 6 7 8 9 10 11 12 13 14 15 16 17 18 19 Total
Mild Visual Impairment M 1 1 1 3 0 0 1 3 0 0 6 2 3 0 0 21
F 0 0 2 0 1 1 1 1 1 1 1 2 1 0 0 12
Moderate/Severe Visual
Impa irment (Cri te ria B)
M 3 0 0 1 1 2 0 0 1 3 1 3 3 0 1 19
F 0 1 0 1 0 0 0 1 1 1 1 0 1 1 0 8
Speech and/or Language
Delay/Disorder
M 143 172 169 158 111 116 90 72 56 29 40 35 32 11 5 1,239
F 77 72 79 75 73 62 41 27 18 16 22 18 11 7 1 599
Mild/Moderate Physical
Disability
M 7 9 4 13 1 3 6 7 4 4 0 1 2 0 0 61
F 7 5 4 1 1 2 5 6 1 4 0 2 2 1 0 41
Se vere Ph ysical D isab ility
(Cri te ria D)
M 1 2 2 5 5 1 4 4 2 2 3 2 3 1 2 39
F 0 2 0 6 6 12 3 3 4 4 2 2 2 0 1 47
Mild/Moderate Learning
Disability
M 2 9 26 70 127 181 189 178 174 188 264 256 185 89 18 1,956
F 0 0 9 13 42 62 69 57 77 74 119 89 67 28 5 711
Severe Learning
Disabil ity(Criteria F)
M 0 0 0 0 1 2 12 2 12 10 12 4 5 3 0 63
F 0 0 0 0 0 1 0 1 0 3 2 0 0 1 0 8
Mild/M ode rate
Health/Neurological
Related Disorder
M 5 9 13 13 10 16 13 13 9 10 11 7 10 3 0 142
F 2 5 5 5 9 4 7 6 5 10 2 6 4 2 2 74
Se vere
Health/Neurological
Re lated D isorde r
(Cr ite ria G)
M 0 10 11 6 1 6 7 3 4 1 1 4 0 3 0 57
F 0 1 2 0 3 2 1 2 2 0 0 3 0 0 0 16
Mild Hearing Impairment M 2 2 5 8 7 2 8 5 0 2 4 3 6 0 0 54
F 0 2 1 0 2 0 7 5 6 2 5 5 4 0 0 39
Moderate/Severe Hearing
Impa irment (Cri te ria A)
M 1 4 5 0 4 3 3 3 1 8 5 1 2 1 0 41
F 1 0 3 2 1 2 4 2 4 1 2 2 2 0 0 26
Exc eption al Ab ility M 1 2 17 24 144 139 139 8 7 2 0 0 0 0 0 483
F 1 2 22 25 152 150 157 13 9 6 2 1 1 0 0 541
Mild/M ode rate
Emotional/Behavioral
Difficulty/Disorder
M 14 18 28 38 58 50 56 56 39 49 56 39 26 6 0 533
F 4 5 5 4 11 5 7 9 19 8 16 13 7 2 2 117
Se vere
Emotional/Behavioral
Difficulty/Disorder
(Cri te ria E)
M 0 2 4 5 4 9 4 5 3 12 10 3 3 1 1 66
F 0 0 1 1 1 0 2 0 1 4 0 1 1 2 2 16
Developmental Delay M 36 197 248 256 0 0 0 0 0 0 0 0 0 0 737
F 25 92 121 113 0 0 0 0 0 0 0 0 0 0 0 351
Mild/Moderate Cognitive
Delay
M 1 16 32 68 146 132 112 103 106 123 155 129 99 48 15 1,285
F 0 12 23 34 82 76 97 78 73 93 112 77 72 29 11 869
Mo dera te
Global/Severe/Profound
Cognitive Delay
(Cri te ria C)
M 8 17 21 25 28 24 32 31 30 44 47 34 20 31 41 433
F 5 7 15 14 16 15 16 19 25 30 24 14 20 21 36 277
Unknown M 9 26 52 59 140 85 100 94 105 120 136 83 80 51 9 1,149
F 6 9 19 29 62 45 58 50 51 78 78 59 42 27 4 617
TotalM 234 496 638 752 788 771 776 587 553 607 751 606 479 248 92 8,378
F 128 215 311 323 462 439 475 280 297 335 388 294 237 121 64 4,369
T 362 711 949 1,075 1,250 1,210 1,251 867 850 942 1,139 900 716 369 156 12,747
1 Altho ugh a stud ent’s n eed s m ay be reflective of m ore tha n on e ca tego ry, the stud ent is re pres ente d un der a single categ ory only (ba sed on the prim ary
handicappin g co ndition ).

42 Enrolment Information Education Statistics - Elementary-Secondary, 2000-01
Table 29. Student1 Mobility: Reasons For Leaving School by School District, 1999-00
Reasons for Leaving2 School
School District
Transferredto School
withinProvince
Transferredto SchoolOutsideProvince
Transferredto SchoolOutsideCountry
Transferredto
OtherInstitution
Dissatis-fied withAchieve-
ment
Dissatis-fied with School
Deceased Health Pregnancy SingleParent
ObtainedEmploy-
ment
Enrolled inPost-
secondaryInstitution
(non-graduate)
Enrolled inOther
EducationalProgram
(eg.Upgrading) Unknown Other
Labrador 109 42 24 0 0 8 0 1 4 2 5 0 1 27 8
Northern Peninsula/Labrador South
116 47 1 1 11 11 1 0 2 0 4 0 1 8 7
Corner Brook/Deer Lake/St. Barbe
319 208 12 4 5 31 1 0 2 2 9 0 6 84 26
Cormack Trail 121 88 5 4 4 12 0 0 1 0 5 4 5 13 12
Baie Verte/Central/Connaigre
73 67 3 10 0 21 1 3 3 0 10 0 2 14 5
Lewisporte/Gander 162 156 2 1 5 10 1 0 2 1 4 0 0 29 10
Burin 64 28 0 0 2 8 1 0 1 1 3 0 0 15 16
Vista 132 67 2 2 1 36 1 0 4 1 5 1 2 17 1
Avalon West 75 25 1 0 0 1 0 0 0 0 1 0 0 5 0
Avalon East 353 136 8 0 1 36 0 0 2 1 2 0 1 33 3
Conseil scolairefrancophone
11 8 0 0 0 0 0 0 0 0 0 0 0 0 0
Tota l 1,535 872 58 22 29 174 6 4 21 8 48 5 18 245 88
Table 30. Student1 Mobility: Totals by Category and School District, 1999-00
To tals by C ateg ory
School District Transfers
Out
Ea rly
Sc hoo l Leav ers 3
En rolled in Post-
secondary or Other
Educational Program
Unknown/ Other
Labrador 175 20 1 35
No rthern Peninsula/La brad or South 165 28 1 15
Corner Brook/Deer Lake/St. Barbe 543 49 6 110
Co rm ack T rail 218 22 9 25
Ba ie Ve rte/Ce ntral/C onn aigre 153 37 2 19
Lewisporte/Gander 321 22 0 39
Bu rin 92 15 0 31
Vista 203 47 3 18
Avalon W est 101 2 0 5
Avalon East 497 42 1 36
Conseil scolaire francophone 19 0 0 0
Tota l 2,487 284 23 333
1 Student may be counted more than once.2 Se ptem ber 1 999 to Jun e 20 00. Inclu des sum m er leav ers from the pre vious year.3 Includes the followin g ca tego ries: dissatisfa ction w ith ach ievem ent o r scho ol, hea lth, preg nan cy, sing le pare nt and ob tained em ploym ent.

Education Statistics - Elementary-Secondary, 2000-01 Enrolment Information 43
Table 31. Student1 Mobility: Reasons For Enrolling in School by School District, 1999-00
School District
Reasons for Enroll ing1 in School
TransferredFrom School
Within the Province
TransferredFrom School
Outside the Province
TransferredFrom SchoolOutside the
Country
Graduated butReturning to
Upgrade
PreviouslySchooled at
Home
PreviouslyWithdrew and
Returning
Adult/Independent
StudentReturning
Previously in OtherInstitution
EnteringAfter
MedicalAbsence Other
Labrador 75 32 17 0 0 3 0 0 0 1
Northern Peninsula/Labrador 86 34 7 0 0 0 0 0 0 0
Corner Brook/Deer Lake/St. Barbe 306 173 16 0 0 30 0 0 0 8
Co rm ack T rail 113 58 4 2 0 2 3 0 0 1
Ba ie Ve rte/Ce ntral/C onn aigre 64 29 2 0 0 4 2 0 0 0
Lewisporte/Gander 176 139 3 1 1 6 0 2 0 2
Bu rin 64 36 7 0 0 3 0 0 1 5
Vista 108 46 6 1 0 5 2 0 0 0
Avalon W est 57 16 1 1 0 0 0 1 0 0
Avalon East 273 70 12 0 1 1 0 0 0 1
Conseil scolaire francophone 9 5 0 0 0 0 0 0 0 0
Tota l 1331 638 75 5 2 54 7 3 1 18
Table 32. Attendance Rates by District, 1999-00
School District
Atten dan ce R ate3,4
Male Fem ale Total
Labrador 84.0 84.6 84.3
No rthern Peninsula/La brad or South 94.1 94.1 94.1
Corner Brook/Deer Lake/St. Barbe 93.1 92.9 93.0
Co rm ack T rail 92.4 92.8 92.6
Ba ie Ve rte/Ce ntral/C onn aigre 92.1 92.3 92.2
Lewisporte/Gander 92.8 92.8 92.8
Burin 93.3 93.0 93.2
Vista 92.0 91.3 91.7
Avalon W est 92.7 93.1 92.9
Avalon East 91.3 91.8 91.5
Conseil scolaire francophone 93.2 93.7 93.4
Total 91.7 92.0 91.9
1 Student may be counted more than once.2 Se ptem ber 1 998 to Jun e 19 99. Inclu des sum m er leav ers from the pre vious year.
3 Rates are calculated by the fol lowing formula: total student days present
total possible student days attendance4 Atten dan ce is n ot reco rded on days tha t scho ol is no t in ses sion .
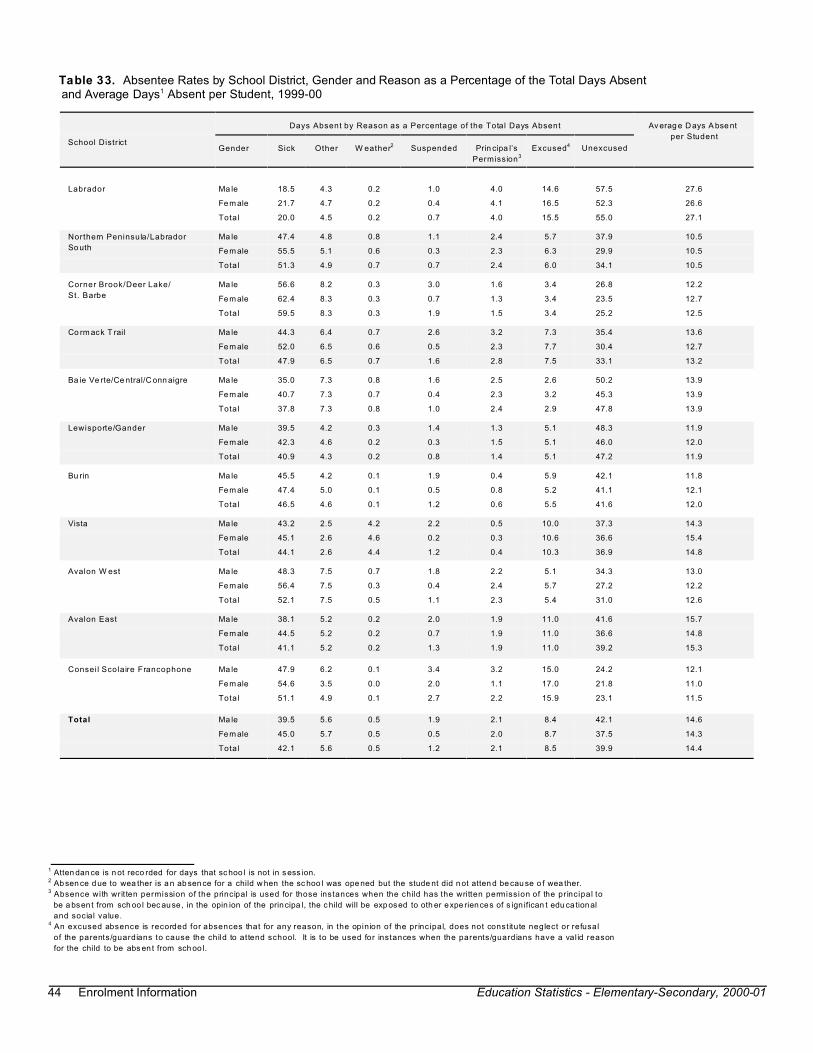
44 Enrolment Information Education Statistics - Elementary-Secondary, 2000-01
Table 33. Absentee Rates by School District, Gender and Reason as a Percentage of the Total Days Absent and Average Days1 Absent per Student, 1999-00
School District
Days Absent by Reason as a Percentage of the Total Days Absent Av erag e D ays A bse nt
per Student
Gender Sick Other W eather2 Suspended Prin cipa l’s
Permission3
Excused4 Unexcused
Labrador Ma le 18.5 4.3 0.2 1.0 4.0 14.6 57.5 27.6
Fem ale 21.7 4.7 0.2 0.4 4.1 16.5 52.3 26.6
Total 20.0 4.5 0.2 0.7 4.0 15.5 55.0 27.1
Northern Peninsula/Labrador
So uth
Ma le 47.4 4.8 0.8 1.1 2.4 5.7 37.9 10.5
Fem ale 55.5 5.1 0.6 0.3 2.3 6.3 29.9 10.5
Total 51.3 4.9 0.7 0.7 2.4 6.0 34.1 10.5
Corner Brook/Deer Lake/
St. Barbe
Ma le 56.6 8.2 0.3 3.0 1.6 3.4 26.8 12.2
Fem ale 62.4 8.3 0.3 0.7 1.3 3.4 23.5 12.7
Total 59.5 8.3 0.3 1.9 1.5 3.4 25.2 12.5
Co rm ack T rail Ma le 44.3 6.4 0.7 2.6 3.2 7.3 35.4 13.6
Fem ale 52.0 6.5 0.6 0.5 2.3 7.7 30.4 12.7
Total 47.9 6.5 0.7 1.6 2.8 7.5 33.1 13.2
Ba ie Ve rte/Ce ntral/C onn aigre Ma le 35.0 7.3 0.8 1.6 2.5 2.6 50.2 13.9
Fem ale 40.7 7.3 0.7 0.4 2.3 3.2 45.3 13.9
Total 37.8 7.3 0.8 1.0 2.4 2.9 47.8 13.9
Lewisporte/Gander Ma le 39.5 4.2 0.3 1.4 1.3 5.1 48.3 11.9
Fem ale 42.3 4.6 0.2 0.3 1.5 5.1 46.0 12.0
Total 40.9 4.3 0.2 0.8 1.4 5.1 47.2 11.9
Bu rin Ma le 45.5 4.2 0.1 1.9 0.4 5.9 42.1 11.8
Fem ale 47.4 5.0 0.1 0.5 0.8 5.2 41.1 12.1
Total 46.5 4.6 0.1 1.2 0.6 5.5 41.6 12.0
Vista Ma le 43.2 2.5 4.2 2.2 0.5 10.0 37.3 14.3
Fem ale 45.1 2.6 4.6 0.2 0.3 10.6 36.6 15.4
Total 44.1 2.6 4.4 1.2 0.4 10.3 36.9 14.8
Avalon W est Ma le 48.3 7.5 0.7 1.8 2.2 5.1 34.3 13.0
Fem ale 56.4 7.5 0.3 0.4 2.4 5.7 27.2 12.2
Total 52.1 7.5 0.5 1.1 2.3 5.4 31.0 12.6
Avalon East Ma le 38.1 5.2 0.2 2.0 1.9 11.0 41.6 15.7
Fem ale 44.5 5.2 0.2 0.7 1.9 11.0 36.6 14.8
Total 41.1 5.2 0.2 1.3 1.9 11.0 39.2 15.3
Conseil Scolaire Francophone Ma le 47.9 6.2 0.1 3.4 3.2 15.0 24.2 12.1
Fem ale 54.6 3.5 0.0 2.0 1.1 17.0 21.8 11.0
Total 51.1 4.9 0.1 2.7 2.2 15.9 23.1 11.5
Total Ma le 39.5 5.6 0.5 1.9 2.1 8.4 42.1 14.6
Fem ale 45.0 5.7 0.5 0.5 2.0 8.7 37.5 14.3
Total 42.1 5.6 0.5 1.2 2.1 8.5 39.9 14.4
1 Atten dan ce is n ot reco rded for days that sc hoo l is not in sess ion. 2 Ab sen ce d ue to wea ther is a n ab sen ce for a child w hen the sc hoo l was ope ned but the stude nt did n ot atten d be cau se o f wea ther.3 Absence with writ ten permission of the principal is used for those instances when the child has the written permission of the principal to
be a bsen t from sch oo l bec ause , in the opin ion of the principa l, the c hild will be exp osed to oth er expe riences of s ign ifican t edu ca tional
and social value.4 An excused absence is recorded for absences that for any reason, in the opinion of the principal, does not constitute neglect or refusal
of the parents/guardians to cause the child to attend school. It is to be used for instances when the parents/guardians have a val id reason
for the child to be abs en t from sch oo l.
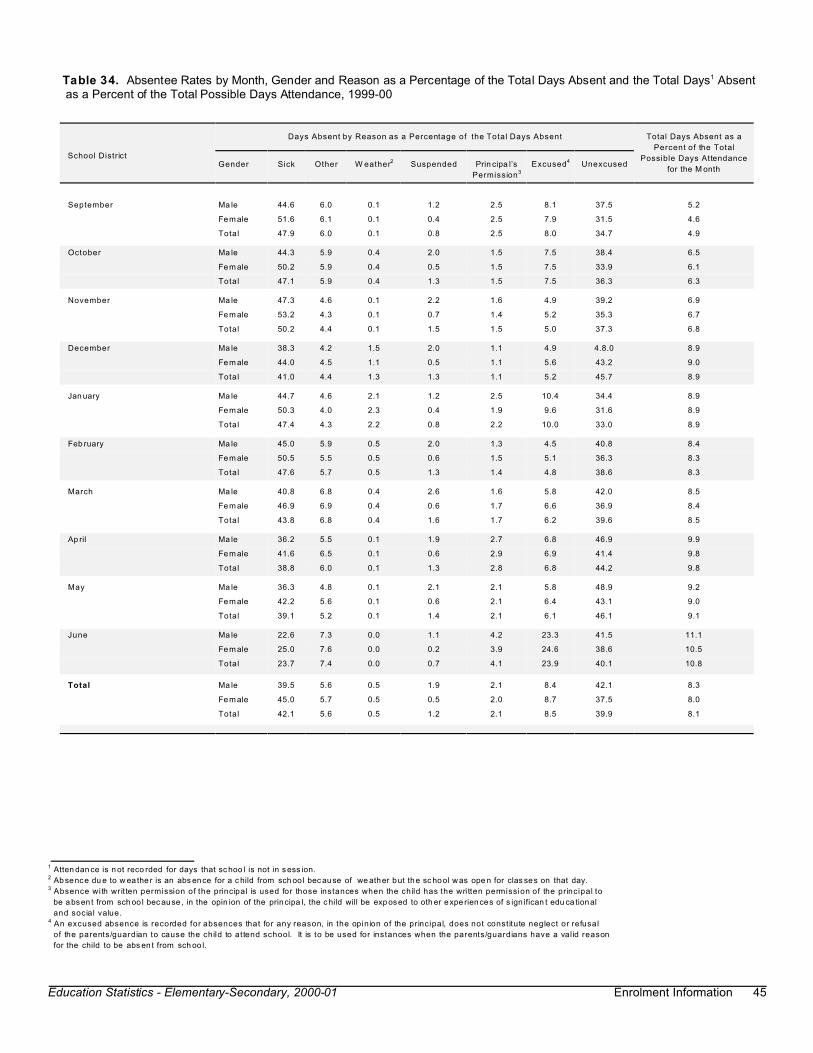
Education Statistics - Elementary-Secondary, 2000-01 Enrolment Information 45
Table 34. Absentee Rates by Month, Gender and Reason as a Percentage of the Total Days Absent and the Total Days1 Absent as a Percent of the Total Possible Days Attendance, 1999-00
School District
Days Absent by Reason as a Percentage of the Total Days Absent Total Days Absent as a
Percent of the Total
Possible Days Attendance
for the M onthGender Sick Other W eather2 Suspended Prin cipa l’s
Permission3
Excused4 Unexcused
September Ma le 44.6 6.0 0.1 1.2 2.5 8.1 37.5 5.2
Fem ale 51.6 6.1 0.1 0.4 2.5 7.9 31.5 4.6
Total 47.9 6.0 0.1 0.8 2.5 8.0 34.7 4.9
October Ma le 44.3 5.9 0.4 2.0 1.5 7.5 38.4 6.5
Fem ale 50.2 5.9 0.4 0.5 1.5 7.5 33.9 6.1
Total 47.1 5.9 0.4 1.3 1.5 7.5 36.3 6.3
November Ma le 47.3 4.6 0.1 2.2 1.6 4.9 39.2 6.9
Fem ale 53.2 4.3 0.1 0.7 1.4 5.2 35.3 6.7
Total 50.2 4.4 0.1 1.5 1.5 5.0 37.3 6.8
December Ma le 38.3 4.2 1.5 2.0 1.1 4.9 4.8.0 8.9
Fem ale 44.0 4.5 1.1 0.5 1.1 5.6 43.2 9.0
Total 41.0 4.4 1.3 1.3 1.1 5.2 45.7 8.9
Jan uary Ma le 44.7 4.6 2.1 1.2 2.5 10.4 34.4 8.9
Fem ale 50.3 4.0 2.3 0.4 1.9 9.6 31.6 8.9
Total 47.4 4.3 2.2 0.8 2.2 10.0 33.0 8.9
Feb ruary Ma le 45.0 5.9 0.5 2.0 1.3 4.5 40.8 8.4
Fem ale 50.5 5.5 0.5 0.6 1.5 5.1 36.3 8.3
Total 47.6 5.7 0.5 1.3 1.4 4.8 38.6 8.3
March Ma le 40.8 6.8 0.4 2.6 1.6 5.8 42.0 8.5
Fem ale 46.9 6.9 0.4 0.6 1.7 6.6 36.9 8.4
Total 43.8 6.8 0.4 1.6 1.7 6.2 39.6 8.5
Ap ril Ma le 36.2 5.5 0.1 1.9 2.7 6.8 46.9 9.9
Fem ale 41.6 6.5 0.1 0.6 2.9 6.9 41.4 9.8
Total 38.8 6.0 0.1 1.3 2.8 6.8 44.2 9.8
May Ma le 36.3 4.8 0.1 2.1 2.1 5.8 48.9 9.2
Fem ale 42.2 5.6 0.1 0.6 2.1 6.4 43.1 9.0
Total 39.1 5.2 0.1 1.4 2.1 6.1 46.1 9.1
June Ma le 22.6 7.3 0.0 1.1 4.2 23.3 41.5 11.1
Fem ale 25.0 7.6 0.0 0.2 3.9 24.6 38.6 10.5
Total 23.7 7.4 0.0 0.7 4.1 23.9 40.1 10.8
Total Ma le 39.5 5.6 0.5 1.9 2.1 8.4 42.1 8.3
Fem ale 45.0 5.7 0.5 0.5 2.0 8.7 37.5 8.0
Total 42.1 5.6 0.5 1.2 2.1 8.5 39.9 8.1
1 Atten dan ce is n ot reco rded for days that sc hoo l is not in sess ion. 2 Ab sence du e to w ea the r is an abs ence for a c hild from sch oo l bec ause of we ather but the sc hool was ope n for clas ses on that day.3 Absence with writ ten permission of the principal is used for those instances when the child has the written permission of the principal to
be a bsen t from sch oo l bec ause , in the opin ion of the principa l, the c hild will be exp osed to oth er expe riences of s ign ifican t edu ca tional
and social value.4 An excused absence is recorded for absences that for any reason, in the opinion of the principal, does not constitute neglect or refusal
of the parents/guardian to cause the child to attend school. It is to be used for instances when the parents/guardians have a val id reason
for the child to be abs en t from sch oo l.
46 Enrolment Information Education Statistics - Elementary-Secondary, 2000-01


Education Statistics - Elementary-Secondary, 2000-01 Achievement Information 49
Table 35. French Immersion Language Arts Criterion Referenced Test Results1 by School District, Subtest and Gender, GradeThree, May 2000 (Percent of Students by Assessment Level1)2
Labrador Corner Brook/ Deer Lake/
St. Barbe
Co rm ack T rail Ba ie V erte / Ce ntra l/
Co nna igre
Lewisporte/ Gander
Sub-test Assessment Level Assessment Level Assessment Level Assessment Level Assessment Level
4 3 2 1 4 3 2 1 4 3 2 1 4 3 2 1 4 3 2 1
Speaking/ Listening
Understanding 63.0 29.6 7.4 0.0 69.2 30.8 0.0 0.0 86.7 6.7 6.7 0.0 57.1 42.9 0.0 0.0 87.5 12.5 0.0 0.0
Conveying 18.5 29.6 48.1 3.7 19.2 61.5 19.2 0.0 0.0 26.7 60.0 13.3 0.0 57.1 42.9 0.0 12.5 50.0 37.5 0.0
Language 3.7 33.3 59.3 3.7 11.5 50.0 38.5 0.0 0.0 26.7 46.7 26.7 0.0 19.0 81.0 0.0 8.3 45.8 45.8 0.0
Presentation 18.5 29.6 48.1 3.7 19.2 42.3 38.5 0.0 0.0 46.7 46.7 6.7 0.0 38.1 61.9 0.0 12.5 37.5 50.0 0.0
Sentence
Content 0.0 33.3 51.9 14.8 3.8 61.5 30.8 3.8 0.0 43.8 56.3 0.0 0.0 42.9 38.1 19.0 0.0 36.0 52.0 12.0
Organization 0.0 29.6 51.9 18.5 3.8 65.4 23.1 7.7 0.0 37.5 62.5 0.0 0.0 33.3 38.1 28.6 0.0 28.0 56.0 16.0
Structure 0.0 25.9 55.6 18.5 15.4 38.5 42.3 3.8 6.3 31.3 62.5 0.0 0.0 28.6 47.6 23.8 0.0 20.0 56.0 24.0
Vo cab ulary 0.0 22.2 40.7 37.0 0.0 26.9 61.5 11.5 6.3 43.8 37.5 12.5 0.0 19.0 47.6 33.3 0.0 24.0 32.0 44.0
Conventions 0.0 37.0 48.1 14.8 15.4 57.7 15.4 11.5 6.3 31.3 56.3 6.3 0.0 9.5 61.9 28.6 4.0 8.0 48.0 40.0
Demand 0.0 44.4 51.9 3.7 15.4 42.3 34.6 7.7 25.0 56.3 12.5 6.3 4.8 42.9 47.6 4.8 4.0 68.0 28.0 0.0
Re adin g Ac tivity 2 0.0 55.6 25.9 18.5 24.0 40.0 36.0 0.0 37.5 56.3 6.3 0.0 9.5 38.1 42.9 9.5 25.0 33.3 37.5 4.2
Re adin g Ac tivity 1
(Average Mark out of 13)10.3 11.0 11.5 9.5 9.7
Listening
(Average Mark out of 32)28.0 28.2 28.5 26.8 26.6
1 The levels of performance indicate how proficient students are at completing a variety of tasks in speaking, listening, reading and writ ing.
Level 4 is the highest level a student can achieve.
2 Source: The Division of Evaluation, Testing and Cert if icat ion, Department of Education
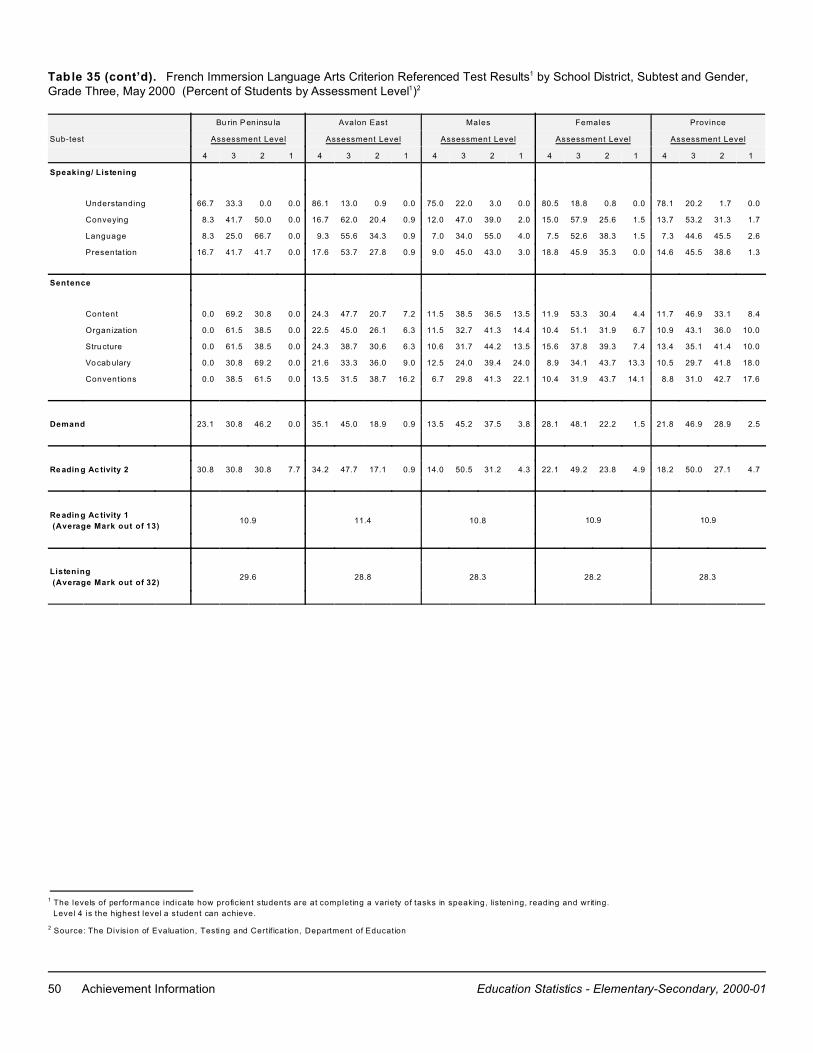
50 Achievement Information Education Statistics - Elementary-Secondary, 2000-01
Table 35 (cont’d). French Immersion Language Arts Criterion Referenced Test Results1 by School District, Subtest and Gender,Grade Three, May 2000 (Percent of Students by Assessment Level1)2
Bu rin P en insu la Avalon East Males Females Province
Sub-test Assessment Level Assessment Level Assessment Level Assessment Level Assessment Level
4 3 2 1 4 3 2 1 4 3 2 1 4 3 2 1 4 3 2 1
Speaking/ Listening
Understanding 66.7 33.3 0.0 0.0 86.1 13.0 0.9 0.0 75.0 22.0 3.0 0.0 80.5 18.8 0.8 0.0 78.1 20.2 1.7 0.0
Conveying 8.3 41.7 50.0 0.0 16.7 62.0 20.4 0.9 12.0 47.0 39.0 2.0 15.0 57.9 25.6 1.5 13.7 53.2 31.3 1.7
Language 8.3 25.0 66.7 0.0 9.3 55.6 34.3 0.9 7.0 34.0 55.0 4.0 7.5 52.6 38.3 1.5 7.3 44.6 45.5 2.6
Presentation 16.7 41.7 41.7 0.0 17.6 53.7 27.8 0.9 9.0 45.0 43.0 3.0 18.8 45.9 35.3 0.0 14.6 45.5 38.6 1.3
Sentence
Content 0.0 69.2 30.8 0.0 24.3 47.7 20.7 7.2 11.5 38.5 36.5 13.5 11.9 53.3 30.4 4.4 11.7 46.9 33.1 8.4
Organization 0.0 61.5 38.5 0.0 22.5 45.0 26.1 6.3 11.5 32.7 41.3 14.4 10.4 51.1 31.9 6.7 10.9 43.1 36.0 10.0
Structure 0.0 61.5 38.5 0.0 24.3 38.7 30.6 6.3 10.6 31.7 44.2 13.5 15.6 37.8 39.3 7.4 13.4 35.1 41.4 10.0
Vo cab ulary 0.0 30.8 69.2 0.0 21.6 33.3 36.0 9.0 12.5 24.0 39.4 24.0 8.9 34.1 43.7 13.3 10.5 29.7 41.8 18.0
Conventions 0.0 38.5 61.5 0.0 13.5 31.5 38.7 16.2 6.7 29.8 41.3 22.1 10.4 31.9 43.7 14.1 8.8 31.0 42.7 17.6
Demand 23.1 30.8 46.2 0.0 35.1 45.0 18.9 0.9 13.5 45.2 37.5 3.8 28.1 48.1 22.2 1.5 21.8 46.9 28.9 2.5
Re adin g Ac tivity 2 30.8 30.8 30.8 7.7 34.2 47.7 17.1 0.9 14.0 50.5 31.2 4.3 22.1 49.2 23.8 4.9 18.2 50.0 27.1 4.7
Re adin g Ac tivity 1
(Average Mark out of 13)10.9 11.4 10.8 10.9 10.9
Listening
(Average Mark out of 32)29.6 28.8 28.3 28.2 28.3
1 The levels of performance indicate how proficient students are at completing a variety of tasks in speaking, listening, reading and writ ing.
Level 4 is the highest level a student can achieve.
2 Source: The Division of Evaluation, Testing and Cert if icat ion, Department of Education
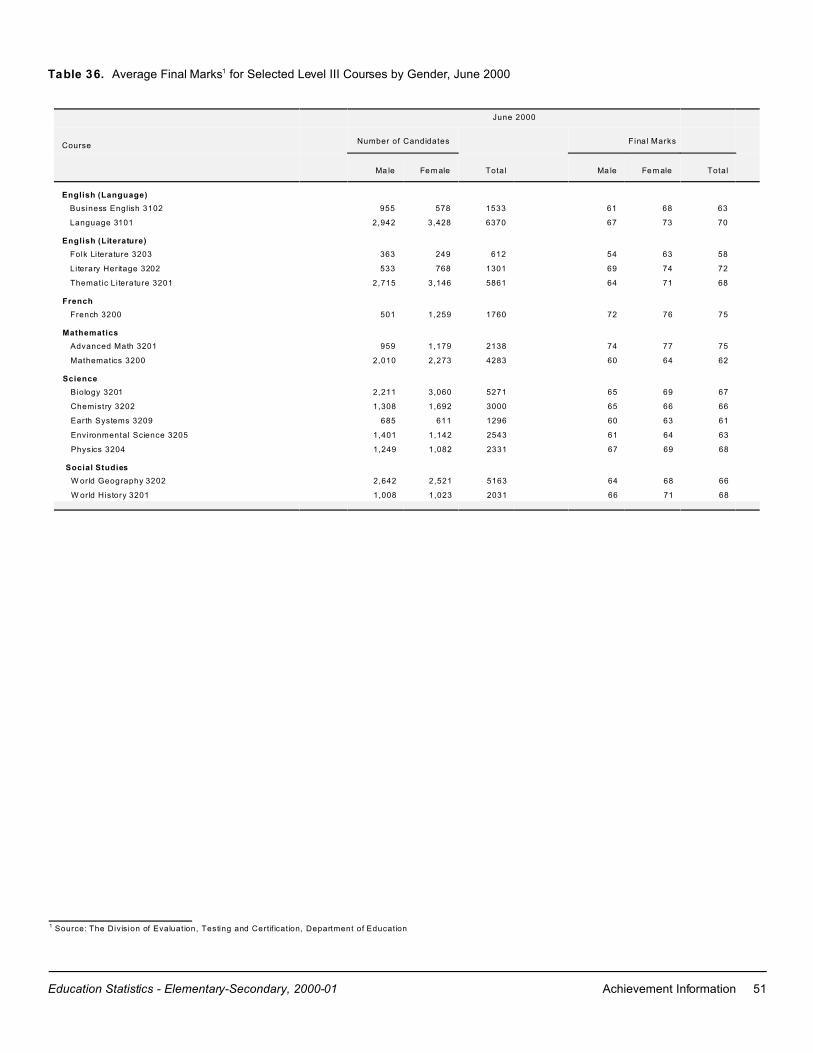
Education Statistics - Elementary-Secondary, 2000-01 Achievement Information 51
Table 36. Average Final Marks1 for Selected Level III Courses by Gender, June 2000
Course
June 2000
Number of Candidates Final Marks
Ma le Fem ale Total Ma le Fem ale Total
English (Language)
Business English 3102 955 578 1533 61 68 63
Language 3101 2,942 3,428 6370 67 73 70
English (Literature)
Folk Literature 3203 363 249 612 54 63 58
Literary Heritage 3202 533 768 1301 69 74 72
Thematic Literature 3201 2,715 3,146 5861 64 71 68
French
French 3200 501 1,259 1760 72 76 75
Mathematics
Advanced Math 3201 959 1,179 2138 74 77 75
Mathematics 3200 2,010 2,273 4283 60 64 62
Science
Biology 3201 2,211 3,060 5271 65 69 67
Chemistry 3202 1,308 1,692 3000 65 66 66
Earth Systems 3209 685 611 1296 60 63 61
Environmental Science 3205 1,401 1,142 2543 61 64 63
Physics 3204 1,249 1,082 2331 67 69 68
Social Studies
W orld Geography 3202 2,642 2,521 5163 64 68 66
W orld History 3201 1,008 1,023 2031 66 71 68
1 Source: The Division of Evaluation, Testing and Cert if icat ion, Department of Education

52 Achievement Information Education Statistics - Elementary-Secondary, 2000-01
Table 37. Number of Students Eligible to Graduate, High School Graduates and Pass Rate by School District and Gender, 1999-00
School District
Eligib le to G radu ate1 Graduates2 Pa ss R ate
Ma le Fem ale Total Ma le Fem ale Total Male Fem ale Total
a b c d e f d/a*100 e/b*100 f/c*100
Labrador 187 181 368 160 171 331 85.6 94.5 89.9
No rthern Peninsula/La brad or South 153 153 306 143 140 283 93.5 91.5 92.5
Corner Brook/Deer Lake/St. Barbe 329 346 675 311 332 643 94.5 96.0 95.3
Co rm ack T rail 269 264 533 245 249 494 91.1 94.3 92.7
Ba ie Ve rte/Ce ntral/C onn aigre 360 402 762 306 375 681 85.0 93.3 89.4
Lewisporte/Gander 363 378 741 327 351 678 90.1 92.9 91.5
Bu rin 217 233 450 186 207 393 85.7 88.8 87.3
Vista 216 213 429 181 197 378 83.8 92.5 88.1
Avalon W est 423 442 865 386 453 839 91.3 102 .5 97.0
Avalon East 1080 1195 2,275 886 1083 1,969 82.0 90.6 86.5
Conseil scolaire francophone provincial 6 3 9 5 1 6 83.3 33.3 66.7
Other3 27 20 47 27 21 48 100 .0 100 .0 100 .0
Total 3,630 3,830 7,460 3,163 3,580 6,743 87.1 93.5 90.4
Table 38. Number and Percentage of High School Graduates by School District and Graduation Status, 1999-00
School District
Graduation Status4
Total
Gra dua te
s
Ho nou rs Distinction GraduationAc adem ic
Graduation
General
Graduation
No. % No. % No. % No. % No. %
Labrador 92 27.8 29 8.8 209 63.1 1 0.3 0 0.0 331
No rthern Peninsula/La brad or South 84 29.7 44 15.5 155 54.8 0 0.0 0 0.0 283
Corner Brook/Deer Lake/St. Barbe 232 36.1 76 11.8 313 48.7 11 1.7 11 1.7 643
Co rm ack T rail 121 24.5 68 13.8 299 60.5 3 0.6 3 0.6 494
Ba ie Ve rte/Ce ntral/C onn aigre 219 32.2 60 8.8 398 58.4 3 0.4 1 0.1 681
Lewisporte/Gander 227 33.5 74 10.9 376 55.5 1 0.1 0 0.0 678
Burin 114 29.0 24 6.1 255 64.9 0 0.0 0 0.0 393
Vista 111 29.4 68 18.0 198 52.4 1 0.3 0 0.0 378
Avalon W est 271 32.3 92 11.0 442 52.7 27 3.2 7 0.8 839
Avalon East 649 33.0 210 10.7 1074 54.5 27 1.4 9 0.5 1,969
Conseil scolaire francophone provincial 0 0.0 1 16.7 5 83.3 0 0.0 0 0.0 6
Other3 12 25.0 0 0.0 36 75.0 0 0.0 0 0.0 48
Total 2,132 31.6 746 11.1 3,760 55.8 74 1.1 31 0.5 6,743
1 Eligible graduates are students who attempted appropriate courses in the term to satisfy all outstanding graduation requirements.2 See the Senior High School Certif ication Handbook for the conditions and regulations governing the awarding of credits to meet graduation requirements.3 Includes private, First Nation, and other schools.
4 Graduation requirements Implemented in 1998
Honours: attains an average of 80% in 7 Level III courses; at least one must be selected from each of English Language, English Literature, Mathematics,
Science, and Social Studies or French.
Academ ic: attains credit in Academic or Honours courses at Level I II in English Language, English Literature, Mathematics, Science, Social Studies or French, but
does not meet the requirements for Honours.
Ge nera l: meets the minimum graduation requirements but does not meet the additional requirements for Academ ic or Honours.
Graduation requirements prior to 1998
Ho nou rs: attained 550 or more marks in 7 Level II I and/or Level IV honours courses, including at least one course in each of English Language, English Literature,
Mathematics, Science, and Social Studies or French.
Dist inct ion: attained 550 or more marks in any 7 Level III and/or Level IV courses.
Graduated: has satisfied graduation requirements.

Education Statistics - Elementary-Secondary, 2000-01 Achievement Information 53
Table 39. Number and Percentage of High School Graduates1 by Gender, Term, Economic Zone, and Graduation Status, 1999-00
Graduation Status2
Ho nou rs Dist inct ion GraduationAc adem ic
Graduation
General
Graduation Total
Graduates
No. % No. % No. % No. % No. %
Male 753 23.8 313 9.9 2,052 64.9 26 0.8 19 0.6 3,163
Fem ale 1,379 38.5 433 12.1 1,708 47.7 48 1.3 12 0.3 3,580
Term
June 2,127 32.3 745 11.3 3,600 54.7 73 1.1 31 0.5 6,576
September 5 3.0 1 0.6 160 95.8 1 0.6 0 0.0 167
Economic Zone5
Nanuk Development Corporation 5 13.9 4 11.1 27 75.0 0 0.0 0 0.0 36
Hyron Re gion al Ec ono m ic De velopm ent
Corporation 49 25.8 15 7.9 125 65.8 1 0.5 0 0.0 190
Central La brad or Econ om ic De velopm ent
Corporation 40 39.2 6 5.9 56 54.9 0 0.0 0 0.0 102
Southeast Aurora Development Corporation 15 34.1 7 15.9 22 50.0 0 0.0 0 0.0 44
Labrador Straits Development Corporation 7 31.8 3 13.6 12 54.5 0 0.0 0 0.0 22
Nordic Economic Development Corporation 48 28.7 24 14.4 95 56.9 0 0.0 0 0.0 167
Red Ochre Regional Board Inc. 44 30.6 19 13.2 60 41.7 10 6.9 11 7.6 144
Hum ber Economic Developm ent Board Inc. 208 36.7 71 12.5 287 50.6 1 0.2 0 0.0 567
Long R ang e R egio nal E con om ic De velopm ent
Boa rd 83 23.0 56 15.5 216 59.8 3 0.8 3 0.8 361
South Western Marine and Mountain Zone
Corporation 38 27.1 13 9.3 89 63.6 0 0.0 0 0.0 140
Emerald Zone Corporation 55 25.1 21 9.6 139 63.5 3 1.4 1 0.5 219
Exp loits Valley Econ om ic De velopm ent
Corporation 124 37.8 29 8.8 175 53.4 0 0.0 0 0.0 328
Coast of Bays Corporation 42 29.6 10 7.0 90 63.4 0 0.0 0 0.0 142
Kittiwake Re gion al Ec ono m ic De velopm ent
Corporation 227 33.4 74 10.9 378 55.6 1 0.1 0 0.0 680
Disc ove ry Reg iona l Dev elop m ent B oard 126 30.1 71 17.0 220 52.6 1 0.2 0 0.0 418
Schooner Regional Development Corporation 114 29.0 24 6.1 255 64.9 0 0.0 0 0.0 393
Bac calieu Board o f Eco nom ic De velopm ent
Corporation 160 29.4 62 11.4 289 53.1 26 4.8 7 1.3 544
Avalon Gateway Regional Economic
Development Inc. 49 39.8 12 9.8 62 50.4 0 0.0 0 0.0 123
Capital Coast Development All iance 664 33.5 216 10.9 1,064 53.7 28 1.4 9 0.5 1,981
Irish Loo p R egio nal E con om ic De velopm ent
Boa rd 34 23.9 9 6.3 99 69.7 0 0.0 0 0.0 142
Total 2,132 31.6 746 11.1 3,760 55.8 74 1.1 31 0.5 6,743
1 See the Senior High School Certif ication Handbook for the conditions and regulations governing the awarding of credits to meet graduation requirements.
Includes private, First Nation, and other schools.2 Graduation requirements Implemented in 1998
Ho nou rs: attains an average of 80% in 7 Level III courses; at least one must be selected from each of English Language, English Literature, Mathematics,
Science, and Social Studies or French.
Academ ic: attains credit in Academic or Honours courses at Level I II in English Language, English Literature, Mathematics, Science, Social Studies or French, but
does not meet the requirements for Honours.
Ge nera l: meets the minimum graduation requirements but does not meet the additional requirements for Academ ic or Honours.
Graduation requirements prior to 1998
Ho nou rs: attaine d 55 0 or m ore m arks in 7 Le vel III and/or L eve l IV hon ours cou rses , includ ing at least on e co urse in eac h of E nglish Lan gua ge, E nglish Literatu re,
Mathematics, Science, and Social Studies or French.
Distinction: attained 550 or more marks in any 7 Level III and/or Level IV courses.
Graduated: has satisfied graduation requirements.

54 Achievement Information Education Statistics - Elementary-Secondary, 2000-01
Table 40. High School Graduates by Age and Gender, and Graduation Rates by Gender, 1989-90 to 1999-00
Graduates1,2 by Age3
Year15 and
under16 17 18 19
20 and
over
Total
Graduates
Graduation
Ra te4,5
M 0 8 1,455 1,552 299 106 3,420 59.3
1989-90 F 1 8 1,946 1,695 272 81 4,003 73.1
T 1 16 3,401 3,247 571 187 7,423 66.1
M 0 9 1,421 1,474 324 125 3,353 59.1
1990-91 F 1 13 1,919 1,706 259 76 3,974 74.7
T 1 22 3,340 3,180 583 201 7,327 66.6
M 0 3 1,613 1,524 361 168 3,669 65.9
1991-92 F 0 6 1,898 1,678 239 102 3,923 76.8
T 0 9 3,511 3,202 600 270 7,592 71.1
M 1 15 1,566 1,477 373 158 3,590 65.4
1992-93 F 2 8 1,903 1,734 214 98 3,959 79.5
T 3 23 3,469 3,211 587 256 7,549 72.1
M 2 3 1,562 1,674 417 188 3,846 73.6
1993-94 F 1 9 1,987 1,775 236 107 4,115 84.8
T 3 12 3,549 3,449 653 295 7,961 79.1
M 6 5 1,514 1,499 296 127 3,447 69.8
1994-95 F 4 11 1,931 1,688 175 72 3,881 82.6
T 10 16 3,445 3,187 471 199 7,328 76.1
M 3 8 1,497 1,567 376 137 3,588 77.7
1995-96 F 5 13 1,875 1,732 203 63 3,891 88.5
T 8 21 3,372 3,299 579 200 7,479 82.8
M 2 11 1,605 1,603 305 109 3,635 78.3
1996-97 F 4 16 1,932 1,674 193 90 3,909 89.6
T 6 27 3,537 3,277 498 199 7,544 83.8
M 6 7 1,509 1,431 252 96 3,301 74.6
1997-98 F 1 11 1,957 1,603 140 67 3,779 88.0
T 7 18 3,466 3,034 392 163 7,080 81.3
M 0 4 1,476 1,400 200 105 3,185 74.0
1998-99 F 0 2 1,809 1,546 127 53 3,537 84.2
T 0 6 3,285 2,946 327 158 6,722 79.1
M 0 8 1,515 1,378 211 51 3,163 74.4
1999-00 F 0 8 1,822 1,592 114 44 3,580 88.1
T 0 16 3,337 2,970 325 95 6,743 81.0
1 Includes p ublic, p rivate, F irst Na tion, an d other sch ools . 2 Does not include students who received a high school leaving certi ficate.3 Age as of June 1.4 Revised in 2001 to accommodate annual populat ion revisions from Statist ics Canada.5 Refer to the Glossary of Terms for the definition of graduation rate.

Education Statistics - Elementary-Secondary, 2000-01 Achievement Information 55
Table 41. High School Leaving Certificates1 Awarded by Gender and Age, 1989-90 to 1999-00
Year 16 17 18 19+ Total
Ma le 2 17 15 24 58
1989-90 Fem ale 2 3 22 21 44
Total 4 20 37 45 106
Ma le 0 12 18 25 55
1990-91 Fem ale 0 4 14 17 35
Total 0 16 32 42 90
Ma le 0 4 15 28 47
1991-92 Fem ale 1 2 14 10 27
Total 1 6 29 38 74
Ma le 1 6 7 21 35
1992-93 Fem ale 0 7 9 21 37
Total 1 13 16 42 72
Ma le 0 4 9 18 31
1993-94 Fem ale 0 2 9 14 25
Total 0 6 18 32 56
Ma le 0 6 10 14 30
1994-95 Fem ale 0 1 2 5 8
Total 0 7 12 19 38
Ma le 0 5 7 13 25
1995-96 Fem ale 0 0 3 10 13
Total 0 5 10 23 38
Ma le 0 1 7 13 21
1996-97 Fem ale 0 1 1 12 14
Total 0 2 8 25 35
Ma le 0 0 10 22 32
1997-98 Fem ale 0 0 7 19 26
Total 0 0 17 41 58
Ma le 0 11 15 25 51
1998-99 Fem ale 0 2 6 14 22
Total 0 13 21 39 73
Ma le 0 1 7 21 29
1999-00 Fem ale 0 1 3 19 23
Total 0 2 10 40 52
1 Distric ts m ay aw ard a prov incial scho ol leav ing ce rtificate to spec ial nee ds s tude nts up on c om pletion of their pro gram s.


Education Statistics - Elementary-Secondary, 2000-01 Teacher/Administrator Information 59
Table 42. Full-Time Equivalent1,2 Teachers, 1951-52 to 2000-01
School Year Teachers School Year Teachers
1951-52 2,585 1976-77 7,694
1952-53 2,736 1977-78 7,704
1953-54 2,865 1978-79 7,690
1954-55 3,049 1979-80 7,602
1955-56 3,106 1980-81 7,597
1956-57 3,368 1981-82 7,678
1957-58 3,527 1982-83 7,723
1958-59 3,896 1983-84 8,191
1959-60 4,019 1984-85 8,177
1960-61 4,317 1985-86 8,073
1961-62 4,502 1986-87 8,065
1962-63 4,789 1987-88 8,120
1963-64 5,036 1988-89 8,110
1964-65 5,351 1989-90 8,035
1965-66 5,545 1990-91 8,015
1966-67 5,644 1991-92 7,951
1967-68 5,855 1992-93 7,885
1968-69 6,206 1993-94 7,769
1969-70 6,315 1994-95 7,521
1970-71 6,437 1995-96 7,259
1971-72 6,648 1996-97 7,101
1972-73 6,895 1997-98 6,705
1973-74 7,072 1998-99 6,453
1974-75 7,358 1999-00 6,372
1975-76 7,427 2000-01 6,283
Source: Stat ist ics Canada (1951-1986), Dept of Education (1987-1998)
Table 43. Full-time Equivalent1 Teachers and Administrators by Position and Gender, 1998-99 to 2000-01
1998-99 1999-00 2000-01
Position Male Fem ale Total Male Fem ale Total Male Fem ale Total
Director 11 0 11 11 0 11 10 1 11
Assistant Director 14 6 20 16 4 20 16 3 19
Program Specialist 33 17 50 28 20 48 32 28 60
Principal 259 102 361 248 95 343 239 97 336
Vice-Principal 182 82 264 167 84 250 155 81 235
Classroom Teacher 1,568 2,500 4,068 1,515 2,503 4,018 1,443 2,512 3,955
Department Head 202 80 282 188 95 283 188 104 292
Special Education Teacher 188 424 612 171 441 612 152 461 612
Te achers fo r Se verely M en tally
Ha ndicapp ed S tude nts
32 192 224 26 177 203 29 171 200
Teachers for Severely Physical ly Disabled 6 37 43 14 78 91 17 80 97
Itinerant Teachers for the Hearing Impaired 5 5 10 6 5 11 6 9 15
Itinerant Teachers for the Visual ly Impaired 2 10 12 4 7 11 5 7 12
Guidance Counsellor 68 87 155 65 93 158 64 100 164
Specialist 174 138 313 167 118 285 151 112 263
Educational Psychologist 13 25 38 13 27 40 10 25 35
Speech Pathologist 2 35 37 3 35 38 2 36 38
English Second Language Teacher 0 2 2 1 3 4 1 3 4
Cooperative Education 1 0 1 0 0 0 0 0 0
French Federal 4 4 8 3 3 6 1 2 3
Stay in School Init iative 1 3 4 6 6 12 8 6 14
Miscellaneous 9 11 20 4 3 7 0 7 7
Total 2,774 3,760 6,534 2,654 3,796 6,451 2,529 3,844 6,373
1 Fu ll-tim e eq uiva len ts are rounded to th e ne arest who le nu m ber. Ca lcula tions are bas ed on fu ll-tim e eq uiva len ts rounded to th e first dec im al.2 Exc lude s direc tors, as sistan t directo rs, prog ram spe cialists, a nd h um an re sou rce m ana gers
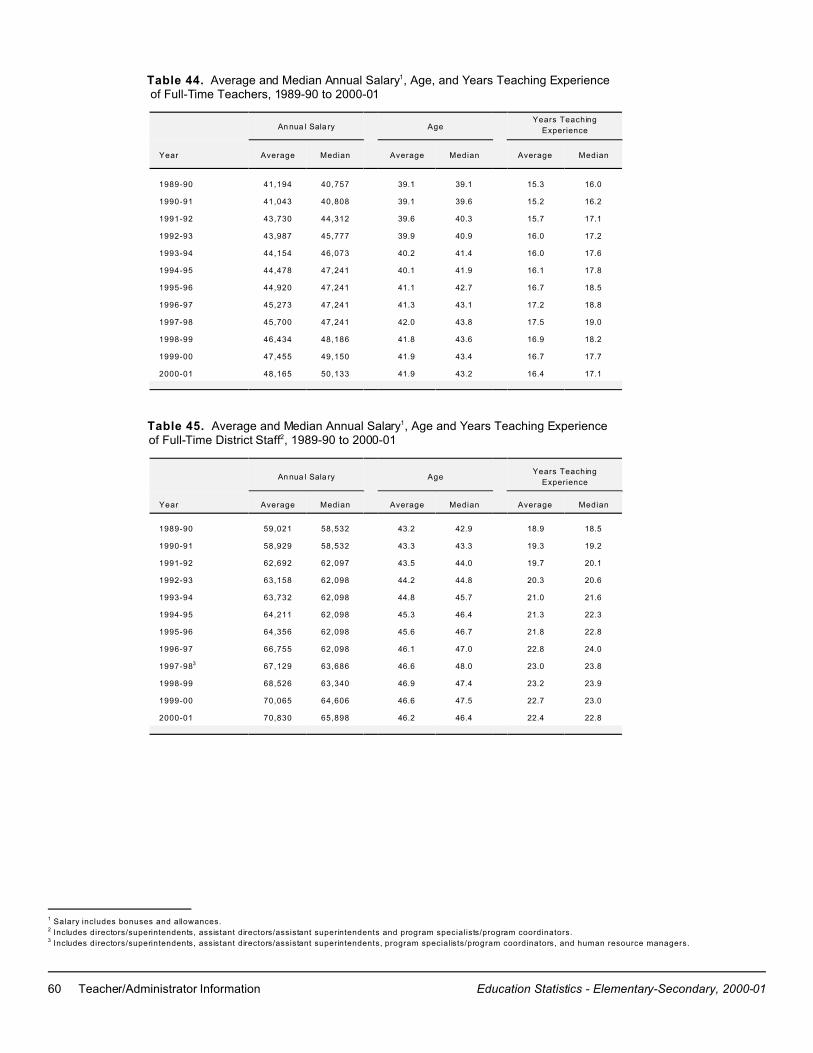
60 Teacher/Administrator Information Education Statistics - Elementary-Secondary, 2000-01
Table 44. Average and Median Annual Salary1, Age, and Years Teaching Experience of Full-Time Teachers, 1989-90 to 2000-01
An nua l Sala ry AgeYears Teaching
Experience
Year Average Median Average Median Average Median
1989-90 41,194 40,757 39.1 39.1 15.3 16.0
1990-91 41,043 40,808 39.1 39.6 15.2 16.2
1991-92 43,730 44,312 39.6 40.3 15.7 17.1
1992-93 43,987 45,777 39.9 40.9 16.0 17.2
1993-94 44,154 46,073 40.2 41.4 16.0 17.6
1994-95 44,478 47,241 40.1 41.9 16.1 17.8
1995-96 44,920 47,241 41.1 42.7 16.7 18.5
1996-97 45,273 47,241 41.3 43.1 17.2 18.8
1997-98 45,700 47,241 42.0 43.8 17.5 19.0
1998-99 46,434 48,186 41.8 43.6 16.9 18.2
1999-00 47,455 49,150 41.9 43.4 16.7 17.7
2000-01 48,165 50,133 41.9 43.2 16.4 17.1
Table 45. Average and Median Annual Salary1, Age and Years Teaching Experience of Full-Time District Staff2, 1989-90 to 2000-01
An nua l Sala ry AgeYears Teaching
Experience
Year Average Median Average Median Average Median
1989-90 59,021 58,532 43.2 42.9 18.9 18.5
1990-91 58,929 58,532 43.3 43.3 19.3 19.2
1991-92 62,692 62,097 43.5 44.0 19.7 20.1
1992-93 63,158 62,098 44.2 44.8 20.3 20.6
1993-94 63,732 62,098 44.8 45.7 21.0 21.6
1994-95 64,211 62,098 45.3 46.4 21.3 22.3
1995-96 64,356 62,098 45.6 46.7 21.8 22.8
1996-97 66,755 62,098 46.1 47.0 22.8 24.0
1997-983 67,129 63,686 46.6 48.0 23.0 23.8
1998-99 68,526 63,340 46.9 47.4 23.2 23.9
1999-00 70,065 64,606 46.6 47.5 22.7 23.0
2000-01 70,830 65,898 46.2 46.4 22.4 22.8
1 Salary includes bonuses and allowances.2 Includes directors/superintendents, assistant directors/assistant superintendents and program specialists/program coordinators.3 Includes directors/superintendents, assistant directors/assistant superintendents, program specialists/program coordinators, and human resource managers.

Education Statistics - Elementary-Secondary, 2000-01 Teacher/Administrator Information 61
Table 46. Number and Percentage of Full-time Equivalent1 Teachers by Salary and Gender,2000-01
Ma le Fem ale
Salary ($) No. % No. % Total
< 28,000 3 0.1 1 0.0 4
28,000-29,999 1 0.0 4 0.1 5
30,000-31,999 14 0.6 58 1.5 72
32,000-33,999 40 1.6 106 2.8 146
34,000-35,999 70 2.8 153 4.0 223
36,000-37999 85 3.4 283 7.4 368
38,000-39,999 55 2.2 132 3.5 187
40,000-41,999 81 3.3 159 4.2 240
42,000-43,999 313 12.7 848 22.3 1,161
44,000-45,999 82 3.3 125 3.3 207
46,000-47,999 56 2.3 120 3.2 177
48,000-49,999 58 2.3 112 2.9 169
50,000-51,999 716 29.0 943 24.7 1,659
52,000-53,999 179 7.2 147 3.9 326
54,000+ 719 29.1 622 16.3 1,340
Total 2,471 100 .0 3,812 100 .0 6,283
Table 47. Full-Time Equivalent1 Teachers by Gender with Percentage Change from the Previous Year, 1989-90 to 2000-01
Year Ma le
% Change
from the Previous
Year
Fem ale
% Change
from the Previous
Year
Total
% Change
from the Previous
Year
1989-90 3,736 -1.7 4,299 -0.2 8,035 -0.9
1990-91 3,656 -2.1 4,359 1.4 8,015 -0.2
1991-92 3,618 -1.0 4,333 -0.6 7,951 -0.8
1992-93 3,536 -2.3 4,349 0.4 7,885 -0.8
1993-94 3,454 -2.3 4,315 -0.8 7,769 -1.5
1994-95 3,314 -4.1 4,207 -2.5 7,521 -3.2
1995-96 3,207 -3.2 4,052 -3.7 7,259 -3.5
1996-97 3,090 -3.6 4,011 -1.0 7,101 -2.2
1997-98 2,886 -6.6 3,819 -4.8 6,705 -5.6
1998-99 2,716 -5.9 3,737 -2.1 6,453 -3.8
1999-00 2,599 -4.3 3,772 0.9 6,372 -1.3
2000-01 2,471 -4.9 3,812 1.1 6,283 -1.4
1 Fu ll-tim e eq uiva len ts are rounded to th e ne arest who le nu m ber. Ca lcula tions are bas ed on th e full- tim e eq uiva len ts rounded to th e first dec im al.

62 Teacher/Administrator Information Education Statistics - Elementary-Secondary, 2000-01
Table 48. Full-time Equivalent1 Teachers by School District and Years Teaching Experience, 2000-01
<1 1-4.9 5-9.9 10-1 4.9 15-1 9.9 20-2 4.9 25-2 9.9 30+
School District1 No. % No. % No. % No, % No. % No. % No. %No
.% Total
Labrador 27 6.8 58 14.6 67 16.9 68 17.3 57 14.5 65 16.4 51 13.0 2 0.5 394
No rthern
Peninsula/Labrador
So uth
16 5.2 38 12.5 37 12.0 48 15.8 46 15.2 51 16.8 68 22.4 0 0.0 303
Corner Brook/Deer
Lake/St. Barbe
16 2.8 47 8.5 83 14.9 83 15.0 93 16.8 92 16.6 141 25.3 1 0.2 555
Co rm ack T rail 7 1.6 37 8.4 58 13.2 50 11.3 57 13.0 98 22.3 126 28.7 6 1.4 439
Baie Verte /
Ce ntral/C onn aigre
17 2.6 58 8.8 73 11.3 93 14.3 103 15.8 113 17.4 189 29.1 5 0.8 650
Lewisporte/Gander 21 3.5 52 8.7 76 12.6 85 14.1 100 16.6 114 19.0 152 25.3 2 0.3 601
Burin 11 3.3 25 7.4 43 13.0 57 17.2 49 14.8 66 20.0 78 23.6 2 0.6 330
Vista 14 4.2 44 13.2 60 18.1 60 18.2 44 13.2 53 15.9 57 17.1 0 0.0 332
Avalon W est 14 1.9 68 9.4 113 15.6 109 15.0 96 13.3 136 18.7 184 25.4 5 0.7 724
Avalon East 34 1.8 263 13.7 333 17.4 299 15.6 330 17.2 311 16.2 339 17.6 12 0.6 1,921
Co nse il Sco laire
Francophone
7 19.4 7 20.9 11 32.8 1 3.0 4 11.9 3 9.0 1 3.0 0 0.0 34
Total 182 2.9 695 11.1 953 15.2 952 15.2 979 15.6 1,101 17.5 1,386 22.1 35 0.6 6,283
Table 49. Number of Full-time Equivalent1 Teachers by Certificate Level and Point on the Salary Scale, 2000-01
Po int on Sa lary S ca le
Ce rtificate
Level
99 1 2 3 4 5 6 7 8 9 10 11 12 Total
D1 3 3
2 0 0 0 0 0 0 0 12 12
3 0 0 0 0 0 0 0 24 24
4 0 1 3 2 5 3 5 4 7 234 264
5 0 94 116 138 91 89 103 102 86 99 1,170 2,089
6 0 38 50 55 45 51 53 60 78 63 76 1,961 2,530
7 0 4 4 6 16 20 17 23 31 24 37 39 1,143 1,363
Total 3 137 173 201 157 162 177 201 225 421 1,283 2,000 1,143 6,283
1 Fu ll-tim e eq uiva len ts are rou nded to the nea res t whole num ber. Ca lcula tions are bas ed on th e full- tim e eq uiva len ts rounded to th e first dec im al.

Education Statistics - Elementary-Secondary, 2000-01 Teacher/Administrator Information 63
Table 50. Number of Full-time Equivalent1 Teachers by Age Group, 1990-91 to 2000-01
Ag e G roup in Yea rs
Year <25 25-29 30-34 35-39 40-44 45-49 50-54 55-59 60+ Total
1990-91 198 924 1,044 1,797 2,102 1,306 522 112 11 8,015
1991-92 148 923 1,009 1,551 2,157 1,462 594 101 7 7,951
1992-93 131 905 955 1,368 2,225 1,564 623 104 9 7,885
1993-94 106 910 936 1,154 2,260 1,694 610 91 9 7,769
1994-95 69 842 923 1,100 2,043 1,842 616 78 8 7,521
1995-96 43 707 919 1,026 1,771 1,982 707 96 8 7,259
1996-97 40 608 982 1,030 1,569 2,066 714 86 7 7,101
1997-98 21 433 913 942 1,392 2,145 772 83 4 6,705
1998-99 36 398 953 957 1,191 2,094 759 58 7 6,453
1999-00 39 389 953 987 1,124 1,928 855 88 9 6,372
2000-01 49 409 911 1,050 1,069 1,729 955 105 7 6,283
Percent Change
1990-90 to 2000-01
-75.4 -55.8 -12.7 -41.6 -49.1 32.4 83.0 -6.2 -33.3 -21.6
1 Fu ll-tim e eq uiva len ts are rounded to th e ne arest who le nu m ber. Ca lcula tions are bas ed on th e full- tim e eq uiva len ts rounded to th e first dec im al.

64 Teacher/Administrator Information Education Statistics - Elementary-Secondary, 2000-01
Table 51. Profile of Substitute Teaching, 1989-90 to 1999-00
Year1
F ull-T im e
Equivalent
Te ach ers
Su bstitute
Te ach ers 2
Substitutes as
a P ercen t of all
Te ach ers
Total
Su bstitute
Da ys3
Average
Da ys
W orked Per
Su bstitute
Average
Days Used Per
FTE Regular
Teacher
Percent of Total
Instru ctiona l days
Taught by
Substitutes
Eq uiva lent to
F ull-T im e
Teaching
Un its3
a b b/(a+b)*100 d d/b d/a d/(a*185)*100 d/185
1989-90 8,035 2,385 22.9 90,480 37.9 11.3 6.1 489 .1
1990-91 8,015 2,223 21.7 65,221 29.3 8.1 4.4 352 .5
1991-92 7,951 2,367 22.9 75,403 31.9 9.5 5.1 407 .6
1992-93 7,885 2,542 24.4 79,330 31.2 10.1 5.4 428 .8
1993-94 7,769 2,400 23.6 68,442 28.5 8.8 4.8 370 .0
1994-95 7,521 2,429 24.4 79,205 32.6 10.5 5.7 428 .1
1995-96 7,259 2,342 24.4 64,793 27.7 8.9 4.8 350 .2
1996-97 7,101 2,174 23.4 59,954 27.6 8.4 4.6 324 .1
1997-98 6,705 2,114 24.0 69,049 32.7 10.3 5.6 373 .2
1998-99 6,453 1,979 23.5 68,486 34.6 10.6 5.7 370 .2
1999-00 6,372 1,899 23.0 68,792 36.2 10.8 5.8 371 .9
Table 52. Substitute Teachers by Age4 Group and Gender, 1999-00
Age Group Ma le Fem ale Total
Under 25 6 64 70
25-29 65 325 390
30-34 109 321 430
35-39 76 198 274
40-44 43 151 194
45-49 22 170 192
50-54 62 132 194
55-59 48 76 124
60 and over 14 17 31
Total 445 1,454 1,899
Table 53. Substitute Teachers by Years Teaching Experience and Gender, 1999-00
Years Teaching Experience Ma le Fem ale Total
<1 104 437 541
1-4.9 144 465 609
5-9.9 63 273 336
10-1 4.9 23 139 162
15-1 9.9 10 65 75
20+ 101 75 176
Total 445 1,454 1,899
1 Yea r end ing A ugu st 31. 2 Includes public and other schools.3 Su bstitute teach ing da ys con verted to nu m ber o f full-time teach ing un its (a full-tim e teaching un it is base d on 190 days in the sc hoo l year).4 Age as of Decem ber 31, 1999. See Glossary of Terms for further explanation of age calculations.

Education Statistics - Elementary-Secondary, 2000-01 Teacher/Administrator Information 65
Table 54. Teachers1 who Retired in 1999-00 by School District and Gender and Average Age upon Retirement
1999-20002
School District Ma le Fem ale Total
Labrador 5 9 14
No rthern Peninsula/La brad or South 5 4 9
Corner Brook/Deer Lake/St. Barbe 22 23 45
Co rm ack T rail 12 13 25
Ba ie Ve rte/Ce ntral/C onn aigre 20 17 37
Lewisporte/Gander 22 18 40
Burin 14 6 20
Vista 12 2 14
Avalon W est 16 15 31
Avalon East 40 67 107
Co nseil sc ola ire francophone provinc ial 0 3 3
Other 17 15 32
Average Age 53.7 52.7 53.2
Tota l 185 192 377
Table 55. Teacher Mobility by Reason and Gender, 2000-01
Te achers N o Lo nge r on S taff Ne w T eac her o n S taff
Reason Ma le Fem ale Total Ma le Fem ale Total
A T eac hing in ano ther sc hoo l unde r the sa me schoo l district 140 265 405 219 392 611
B Teaching for another school district in this province 32 46 78 21 28 49
C T eac hing in a priva te sch ool in the elem enta ry-seco nda ry
system in this province 2 4 6 1 0 1
D Teaching in the postsecondary system in this province 6 1 7 5 2 7
E Teaching outside this province 19 35 54 12 17 29
F Participating in a teacher exchange 0 1 1 0 0 0
G Attending a university faculty of education or teacher’s college 10 22 32 15 38 53
H Attending university or other postsecondary insti tut ion (other
than G) 6 9 15 3 6 9
I Employed in a school distr ict off ice 10 16 26 5 9 14
J Engaged in other occupations 11 9 20 8 13 21
K Pensioned 132 147 279 0 0 0
L Deceased 0 4 4 0 0 0
M Unemployed 11 38 49 12 38 50
N Unknown 11 17 28 0 0 0
O Other3 14 54 68 9 45 54
Total 404 668 1,072 310 588 898
1 Inclu des sc hool an d dis trict personne l.3 Reflects year beginning September 1 and ending August 31.3 Exa m ples includ e de ferred salary lea ve, sic k lea ve, un paid leave , ma ternity leav e, sub stitute tea ching, sec ond ed o r new teach er.

66 Teacher/Administrator Information Education Statistics - Elementary-Secondary, 2000-01
Table 56. First-Time Teachers 1,2 by School District and Gender, 1998-99 to 2000-01
1998-99 1999-00 2000-01
School District Ma le Fem ale Total Ma le Fem ale Total Ma le Fem ale Total
Labrador 8 19 27 5 20 25 10 17 27
No rthern Peninsula/La brad or South 1 8 9 7 8 15 2 14 16
Corner Brook/Deer Lake/St. Barbe 6 2 8 4 11 15 3 13 16
Co rm ack T rail 6 7 13 5 8 13 4 3 7
Ba ie Ve rte/Ce ntral/C onn aigre 3 15 18 1 9 10 3 15 18
Lewisporte/Gander 3 7 10 1 18 19 4 19 23
Burin 3 1 4 1 6 7 2 10 12
Vista 4 6 10 7 11 18 3 11 14
Avalon W est 7 12 19 6 7 13 3 15 18
Avalon East 13 34 47 9 22 31 6 34 40
Co nseil sc ola ire francophone provinc ial 2 3 5 0 0 0 2 5 7
Tota l 56 114 170 46 120 166 42 156 198
Table 57. Student Assistants3 by School District and Gender, 1998-99 to 2000-01
School District1998-99 1999-00 2000-01
Ma le Fem ale Total Ma le Fem ale Total Ma le Fem ale Total
Labrador 1 23 24 1 27 28 2 30 32
No rthern Peninsula/La brad or South 2 25 27 2 25 27 1 25 26
Corner Brook/Deer Lake/St. Barbe 3 51 54 3 55 58 2 62 64
Co rm ack T rail 6 53 59 6 53 59 6 56 62
Ba ie Ve rte/Ce ntral/C onn aigre 2 70 72 2 71 73 2 73 75
Lewisporte/Gander 1 42 43 2 54 56 1 64 65
Burin 1 41 42 1 38 39 0 44 44
Vista 0 30 30 0 31 31 0 35 35
Avalon W est 1 72 73 1 80 81 1 73 74
Avalon East 34 203 237 29 181 210 25 183 208
Co nseil sc ola ire francophone provinc ial 0 2
Total 51 610 661 47 615 662 40 647 687
Table 58. Student Assistants3 by Gender, 1992-93 to 2000-01
Year Ma le Fem ale Total
1992-93 14 411 425
1993-94 10 478 488
1994-95 18 549 567
1995-96 24 545 569
1996-97 39 574 613
1997-98 44 602 646
1998-99 51 610 661
1999-00 47 615 662
2000-01 40 647 687
1 Ful l- time and part-t ime.2 Teach ers w ith less than one year of tea ching exp erience. E xclud es D irectors , Ass istant D irectors . Prog ram Specia lists and H um an R eso urce Man age rs. 3 The numbers shown do not represent student assistants working ful l days. The number of hours student assistant are required to work is dependent
upon students’ needs.


Education Statistics - Elementary-Secondary, 2000-01 Financial Information 69
Table 59. School Districts’ Current Expenditures 1999-00
School Districts Total
Enro l-
ment
Admini-
stration
$
Per
Pupil
$
Instruction
$
Per
Pupil
$
Operations
and
Maintenance
$
Per
Pupil
$
Pupil
Trans-
portation
$
Per
Pupil
$
Ancillary
Services
$
Interest
Expense
$
Miscell-
aneous
$
Transfer to
Capital
$
Total Current
Expenditures
$
Per
Pupil
$
Labrador 5,516 1,310,426 238 29,840,867 5,410 3,602,374 653 1,761,302 319 264,635 16,042 0 43,346 36,868,992 6,679
Northern
Peninsula/Labrador
South
3,769 911,906 242 18,993,591 5,039 2,639,553 700 1,387,409 368 0 17,372 0 0 23,984,625 6,354
Corner Brook/Deer
Lake/ St. Barbe
8,610 990,691 115 37,925,118 4,405 4,926,741 569 2,417,956 281 0 98,821 0 0 46,411,641 5,386
Cormack Trail 6,598 1,130,518 171 29,550,231 4,479 3,953,106 599 1,879,905 285 3,747 3,059 3,299 56,687 36,580,552 5,544
Baie Verte/Central/
Connaigre
9,494 1,251,022 132 42,926,106 4,521 5,265,829 555 2,885,371 304 23,859 40,463 0 774,147 53,166,797 5,600
Lewisporte/Gander 9,248 1,215,634 131 40,287,030 4,356 4,653,496 503 3,807,977 412 0 25,558 100,320 513,034 50,606,049 5,472
Burin 4,913 875,663 178 21,804,318 4,438 3,494,309 711 2,192,726 446 239,188 117,068 163,195 0 28,886,467 5,880
Vista 4,868 973,038 200 21,956,361 4,510 2,454,178 504 1,879,391 386 0 70,173 12,730 41,533 27,387,404 5,626
Avalon West 11,461 1,780,520 155 48,140,869 4,200 4,899,552 427 3,779,754 330 21,506 21,835 0 576,755 59,220,791 5,167
Avalon East 32,656 2,531,565 78 125,678,911 3,849 14,052,210 430 4,810,260 147 127,899 0 15,640 3,347,588 150,703,073 4,615
Conseil scolairefrancophone
268 492,150 1,836 1,911,219 7,131 302,512 1,129 156,151 583 0 0 489,574 25,806 3,392,940 12,602
Total 97,401 13,463,134 139 419,117,256 4,302 50,243,860 516 26,958,202 277 680,834 413,391 923,758 5,378,896 517,179,332 5,309
Source: School Districts’ Financial Statements, 1999-00.
Note: Draft as of February 14, 2001. Figures are subject to change, based on correspondence from school districts.
Table 60. School Districts’ Current Revenues 1999-00
Sc hoo l DistrictsTotal
Enrolment Tea che rs
Salaries
$
Per
Pu pil
$
Pu pil
Tran spo r-
tation
$
Per
Pu pil
$
Other
Provincial
Gra nts
$
Per
Pu pil
$
Donations
$
An cillary
Services
$
Miscellaneous
$
Transfer
From
Ca pita l
$
Total Current
Revenue
$
Per
Pu pil
$
Labrador 5,516 25,436,803 4,611 1,605,616 291 5,275,111 956 1,430,000 532,838 1,984,795 0 36,265,163 6,575
No rthern
Peninsula/Labrador
So uth
3,769 17,815,710 4,727 1,351,108 358 4,151,633 1,102 133,708 13,847 252,227 32,733 23,750,966 6,302
Corner Brook/Deer
Lake/St. Barbe
8,610 35,306,960 4,101 2,310,954 268 7,473,590 868 0 58,150 508,723 185,977 45,844,354 5,325
Co rmack Trail 6,598 27,618,879 4,186 1,879,055 285 6,382,809 967 0 9,775 667,537 0 36,558,055 5,541
Ba ie V erte /Ce ntra l/
Co nna igre
9,494 41,076,860 4,327 2,778,311 293 8,766,610 923 9,585 37,756 462,715 0 53,131,837 5,596
Lewisporte/Gander 9,248 37,637,585 4,070 3,582,680 387 8,580,696 928 0 33,375 382,379 0 50,216,715 5,430
Bu rin 4,913 20,896,190 4,253 1,961,270 399 5,574,191 1,135 8,630 195,098 394,311 164,034 29,193,724 5,942
Vista 4,868 20,932,989 4,300 1,899,055 390 3,843,270 789 4,202 309 91,648 0 26,771,473 5,499
Avalon West 11,461 45,433,352 3,964 3,770,331 329 7,604,300 663 100 1,000 744,731 0 57,553,814 5,022
Avalon East 32,656 120,011,980 3,675 4,810,260 147 20,921,285 641 0 21,967 1,084,663 0 146,850,155 4,497
Co nse il scola ire
francophone
268 1,622,093 5,995 152,231 568 474,680 1,771 0 25,000 1,050,864 0 3,309,340 13,348
Total 97,401 393,789,402 4,043 26,100,871 268 79,048,175 812 1,586,225 929,115 7,624,593 382,744 509,461,125 5,230
Source: School Districts’ Financial Statements, 1999-00.
Note: Draft as of February 14, 2001. Figures are subject to change, based on correspondence from school districts.

70 Financial Information Education Statistics - Elementary-Secondary, 2000-01
Table 61. School Districts’ Capital Disbursements 1999-00
Sc hoo l DistrictsTotal
Enrolment
Additions
to Pro perty
and
Equipment
$
Per
Pu pil
$
Principal
Repayment
Lon g-Te rm
Debt
$
Per
Pu pil
$
Miscellaneous
Disburs em ents
$
Per
Pu pil
$
Transfer
to
Current
$
Per
Pu pil
$
To tal
Capital
Disburs em ents
$
Per
Pu pil
$
Labrador 5,516 773,644 140 107,886 20 0 0 0 0 881,530 160
No rthern Peninsula/La brad or South 3,769 196,399 52 0 0 0 0 32,733 9 229,132 61
Corner Brook/Deer Lake/St. Barbe 8,610 1,117,939 130 73,721 9 0 0 185,977 22 1,377,637 160
Co rmack Trail 6,598 211,257 32 0 0 268,028 41 56,687 9 535,972 81
Ba ie Ve rte/Ce ntral/C onn aigre 9,494 1,403,313 148 600,874 63 0 0 0 0 2,004,187 211
Lewisporte/Gander 9,248 1,005,820 109 293,332 32 0 0 0 0 1,299,152 140
Bu rin 4,913 697,131 142 24,080 5 150,000 31 139,954 28 1,011,165 206
Vista 4,868 3,681,980 756 25,142 5 0 0 0 0 3,707,122 762
Avalon West 11,461 7,034,110 614 67,753 6 0 0 0 0 7,101,863 620
Avalon East 32,656 3,633,009 111 0 0 0 0 0 0 3,633,009 111
Conseil scolaire francophone 268 25,806 96 0 0 0 0 0 0 25,806 96
Total 97,401 19,780,408 203 1,192,788 12 418,028 4 415,351 4 21,806,575 224
Source: School Districts’ Financial Statements, 1999-00.
Note: Draft as of February 14, 2001. Figures are subject to change, based on correspondence from school districts.
Table 62. School Districts’ Capital Receipts 1999-00
Sc hoo l Districts Total
Enrolment
Proceeds
from Bank
Loans
$
Per
Pu pil
$
E. I. C .
Gra nts
$
Per
Pu pil
$
Proceeds
from Sale of
Capital
As sets
$
Per
Pu pil
$
Other
Capital
Revenues
$
Per
Pu pil
$
Transfer
from
Current
$
Per
Pu pil
$
Transfer
from
Reserve
$
To tal
Capital
Re ceip ts
$
Per
Pu pil
$
Labrador 5,516 307,806 56 530,378 96 0 0 0 0 43,346 8 0 881,530 160
No rthern
Pe ninsula/La brad or South
3,769 150,328 40 46,071 12 32,733 9 0 0 0 0 0 229,132 61
Corner Brook/Deer Lake/
St. Barbe
8,610 1,067,019 124 29,765 3 7,500 1 273,353 32 0 0 0 1,377,637 160
Co rmack Trail 6,598 0 0 320,500 49 15,500 2 199,972 30 0 0 0 535,972 81
Ba ie
Ve rte/Ce ntral/C onn aigre
9,494 1,031,502 109 0 0 71,111 7 127,427 13 774,147 82 0 2,004,187 211
Lewisporte/Gander 9,248 746,629 81 7,904 1 31,585 3 0 0 513,034 55 0 1,299,152 140
Bu rin 4,913 883,305 180 0 0 145,942 30 1,112 0 0 0 0 1,030,359 210
Vista 4,868 257,671 53 3,372,393 693 3,915 1 31,610 6 41,533 9 0 3,707,122 762
Avalon West 11,461 228,554 20 6,294,154 549 2,400 0 0 0 576,755 50 0 7,101,863 620
Avalon East 32,656 285,421 9 0 0 0 0 0 0 3,347,588 103 0 3,633,009 111
Co nse il scola ire
francophone
268 0 0 0 0 0 0 0 0 25,806 96 0 25,806 96
Total 97,401 4,958,235 51 10,601,165 109 310,686 3 633,474 7 5,322,209 55 0 21,825,769 224
Source: School Districts’ Financial Statements, 1999-00.
Notes: Draft as of February 14, 2001. Figures are subject to change, based on correspondence from school districts.
E. I. C. - Education Investment Corporation

Education Statistics - Elementary-Secondary, 2000-01 Financial Information 71


Education Statistics - Elementary-Secondary, 2000-01 Glossary of Terms 73
GLOSSARY OF TERMS
Age calculations Unless otherwise cited, age is as of December 31 of the reporting year: for students, the age is truncated(e.g. 5.4 becomes 5); for teachers, the age is not truncated (e.g., for 1989, i.e. the school year 1989-90, ateacher born on June 2, 1961 would be 28.6 years old. This figure is then rounded to the nearest integer, inthis case, 29. However, when computing median age and average age, no rounding is done).
Allocations The number of staffing units allocated to school districts in accordance with The Schools Act (Teachers'Staffing) Regulations.
Canadian Tests of A norm-referenced, standardized test that measures student performance in several basic skillareas.
Basic Skills (CTBS)
Certificate of grade Certificate of grade, or license issued under the authority of The Education (Teacher Training) Act.
Composite Score The average score calculated based on a number of subtest scores.
French Programs Core French Program - program of instruction in which students study the various aspects of FrenchLanguage during a regularly scheduled time slot for other subject areas.
Expanded Core French Program - program of instruction in which students study the Core Frenchprogram, plus at least one other complete subject where content and instruction are given entirely inFrench.
French First Language Program - program for children of Francophone parents in which French isthelanguage of instruction in the classroom for all or most of the subject areas, and the means ofcommunication in the school environment.
French Immersion Program - program designed for English-speaking students in which French isthe language of instruction in the classroom for all or some of the subject areas, and as much aspossible, the means of communication in the school environment.
Early French Immersion Program - program from Kindergarten to Grade 12, beginning at theKindergarten level with approximately 100 percent of instruction in French. With the introduction ofLanguage Arts and other subjects in English, the percentage of instructional time in Frenchdecreases as students progress through the various grades.
Late French Immersion Program - program from Grade 7 to 12 with approximately 70 percentinstruction in French in Grades 7 and 8. The percentage of instructional time in French decreasesas students progress through the varying grade levels.
Full-time equivalent Kindergarten at 50%; headcount for all other grades and programs.enrolment
Full-time equivalent Headcount of full-time teachers, plus part-time teachers according to the teacher percent of allocated unit.
Full-time teacher Teacher assigned 100% of an allocated unit.
Grade equivalent A description of student performance on the Canadian Tests of Basic Skills in(GE) terms of the approximate grade level at which the performance would be average.
Graduate A student who has satisfied graduation requirements (The attainment of 36 credits in a three yearSenior High School Program).
Graduation The attainment of 8 credits in Language Arts, 12 credits in Mathematics/Science/Technology, 4credits in Social Studies, 2 credits in Enterprise/Economic Education, 4 credits in personaldevelopment and an overall 36 credits; at least 20 of the total credits obtained must be beyondLevel 1 and at least 9 of the obtained credits must be beyond Level 2 and be attained in theNewfoundland Senior High School Program.

74 Glossary of Terms Education Statistics - Elementary-Secondary, 2000-01
Graduation rate The number of graduates for a given age group compared to the total population for that same agegroup. The graduation rate is calculated by taking the sum of age-specific ratios ( [number ofgraduates aged 15 divided by the population aged 15] + [number of graduates aged 16 divided bythe population aged 16] .. + [number of graduates aged 19 to 24 divided by the population aged 19] ).
License Similar to Permit. However a licence is issued for one year only.
Percentile Term used to describe student performance on standardized tests relative torank (PR) a nation-wide norming group. The PR refers to the percentage of the norming group that scored
lower on the test (sometimes referred to as national percentile rank - NPR).
Norm-referenced test A test that produces a score that defines performance in terms of an individual's standing relative toa norming group (e.g., CTBS).
Norming group A large representative group of individuals who complete a test and on whose scores the test isstandardized. Performance of students or groups of students is expressed relative to theperformance of this norming group. For example, the 50th percentile means that 50% of students inthe norming group scored lower on the test.
Part-time teacher Teacher assigned less than 100% of an allocated unit.
Participation rate Ratio, for a given year, of secondary school enrolment of a specific age group to the population ofthe same age group that has not already graduated from school. (Note: This rate is based onenrolment as of September 30 for a given year.)
Permit Restricted certificate issued to teachers who have not completed a teacher training program but whohave at least four years of university study in certain approved subject areas.
Point on salary scale Years of service approved for teacher salary purposes in accordance with the Newfoundland andLabrador Teachers Association Collective Agreement.
Private candidate Candidate registered in the Senior High School Program and for school level examinations in regularlevel 3 courses who is not attending any regular school.
Private school An institution, that is not a public school, at which instruction is provided during the school day forstudents who are of or over the compulsory school age in the courses of study approved by theMinister.
Public school School operated by a School Board and receiving grants from public funds of the Province providedfor education.
Pupil Teacher Ratio This measure is defined as enrolment (full-time equivalencies) divided by the number of(PTR) (Provincial) teachers (full-time equivalencies). The term teacher represents all school-based and district-based
educators: classroom teachers, vice principals, principals, guidance counsellors, special educationteachers, itinerant teachers, education psychologists, speech pathologists and other specialistteachers. Directors, assistant directors, program specialists and other district administrativepersonnel are excluded.
School The body of public school students that is organized as a unit for educational purposes under thejurisdiction of a School Board and includes the teachers and other staff members associated with theunit and the lands and premises used in connection with the unit.
School District School district created or constituted by the provisions of The Schools Act, or a school districtcreated by the provisions of this Act, whether as originally created or after an alteration of itsboundaries. (Note: New legislation, introduced in 1996, reduced the number of school districts to 10from 27. The new Schools Act and Education Act came into effect January 3, 1997. In addition,amendments were made to the Schools Act in May, 1997 to establish a Conseil scolaire francophoneprovincial de Terre-Neuve et du Labrador, increasing the number of school districts to 11.)

Education Statistics - Elementary-Secondary, 2000-01 Glossary of Terms 75
Senior high school Final three years of study in a thirteen-year, Kindergarten to Grade 12 education. The programprogram is structured on a course credit basis entailing the accumulation of three or more years culminating in
the acquisition of the Senior High School Graduation Diploma.
Special Education Change in reporting - Prior to 1989-90, all students receiving special education services werereported under the category "Special Education" and not under their grade levels. Since 1989-90,most students are reported in their home-based classroom even if they are receiving specialeducation services. Students who are severely mentally/physically/visually/hearing impaired arereported separately even when they are assigned to grade/subject classrooms.
Policy - The Special Education Policy Manual encourages school districts to offer a wide range ofservices in a variety of settings determined to be appropriate to meet student needs. The model ofservice delivery proposed by the Department of Education encourages the provision of specializedinstruction in all appropriate settings. The view is that most students should begin their formaleducation in grade level classroom settings with support services provided when necessary (seeSpecial Education Policy Manual, Policy 2.A.4).
Standardized testing The process of using uniform tests to compare achievement.
Student A person enroled in a school.
Student assistant A person who provides support services including personal care, portering, lifting, and behaviourmanagement to students. Work involves assisting the teacher in providing the student with accessto educational activities as indicated in the individual program plan.
Subtest One of several smaller tests on specific areas subsumed under the Canadian Tests of Basic Skills.
Teacher A professional employed by a school district who holds a teaching certificate/licence and deliverseducational, administrative and/or special services to students, excluding directors, assistant directors, andprogram specialists.
Teacher-Pupil Ratio Ratio of full-time equivalent teachers/educators to 1000 pupils. (TPR)
Urban See Appendix.


Education Statistics - Elementary-Secondary, 2000-01 Appendix 79
Definition of Urban
Includes Census Metropolitan Areas (CMA), Census Agglomerations (CA) and other communities 5,000 and
over.
CMA - St. John's 174,051
A CMA is defined as the main labour market area of an urban area (the urbanized core) of at least 100,000
population, based on the previous census. CMAs are comprised of one or more census subdivisions (CSDs)
which meet at least one of the following criteria:
1. the CSD falls completely or partly inside the urbanized core;
2. at least 50% of the employed labour force living in the CSD works in the urbanized core; or
3. at least 25% of the employed labour force working in the CSD lives in the urbanized core.
CA - Corner Brook 27,945
CA - Gander 12,021
CA - Grand Falls-W indsor 20,378
CA - Labrador City 10,473
A CA is defined as the main labour market area of an urban area (the urbanized core) of at least 10,000
population, based on the previous census. CAs are comprised of one or more census subdivisions (CSDs)
which meet at least one of the following criteria:
1. the CSD falls completely or partly inside the urbanized core;
2. at least 50% of the employed labour force living in the CSD works in the urbanized core; or
3. at least 25% of the employed labour force working in the CSD lives in the urbanized core.

80 Appendix Education Statistics - Elementary-Secondary, 2000-01
CENSUS METROPOLITAN AREA, CENSUS AGGLOMERATIONSAND COMMUNITIES OF 5,000 & OVER NEWFOUNDLAND,
1996 CENSUS
Area Community Population
St. John's (CMA) 174,051Bauline 380Bay Bulls 1,063Conception Bay South 19,265Flatrock 1,087Logy Bay-Middle Cove-Outer Cove 1,881Mount Pearl 25,519Paradise 7,960Petty Harbour-Maddox Cove 954Portugal Cove-St. Phillip’s 5,773Pouch Cove 1,885St. John's 101,936Torbay 5,230Witless Bay 1,118
Corner Brook (CA) 27,945Corner Brook 21,893Humber Arm South1 1,991Irishtown-Summerside 1,424Massey Drive 736Meadows 737Mount Moriah 748Steady Brook 416
Gander (CA) 12,021Appleton 572Gander 10,364
Glenwood 893Division No. 6, Subd. E 192
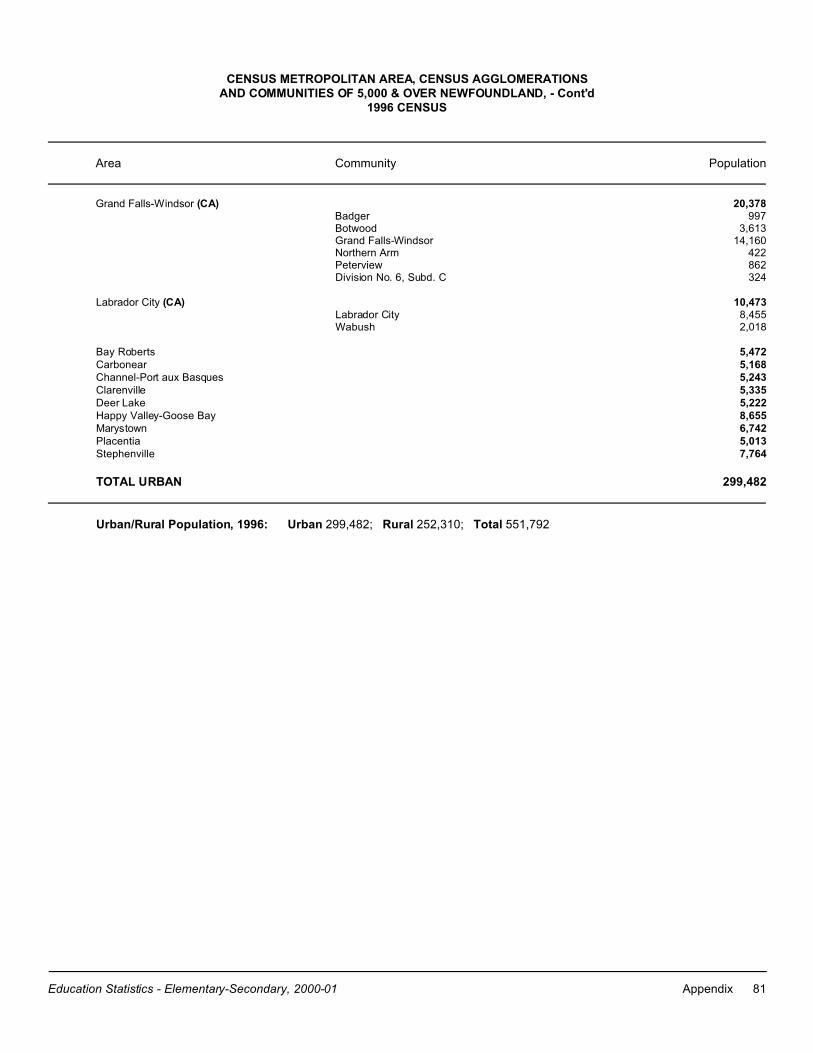
Education Statistics - Elementary-Secondary, 2000-01 Appendix 81
CENSUS METROPOLITAN AREA, CENSUS AGGLOMERATIONSAND COMMUNITIES OF 5,000 & OVER NEWFOUNDLAND, - Cont'd
1996 CENSUS
Area Community Population
Grand Falls-Windsor (CA) 20,378Badger 997Botwood 3,613Grand Falls-Windsor 14,160Northern Arm 422Peterview 862Division No. 6, Subd. C 324
Labrador City (CA) 10,473Labrador City 8,455Wabush 2,018
Bay Roberts 5,472Carbonear 5,168Channel-Port aux Basques 5,243Clarenville 5,335Deer Lake 5,222Happy Valley-Goose Bay 8,655Marystown 6,742Placentia 5,013Stephenville 7,764
TOTAL URBAN 299,482
Urban/Rural Population, 1996: Urban 299,482; Rural 252,310; Total 551,792

Your comment s and suggest ions are welcome.
Contact :
Linda Clarke
D ivision of Corporate Planning and Research
D epartm ent of Education
Government of N ewfoundland and Labrador
P. O . Box 8 7 0 0 C St . John’ s CN ewfoundland C Canada CA 1 B 4 J6
e-mail: lindaclarke@ mail.gov.nf.ca
or access this report on t he I nt ernet at
ht tp:/ / www.gov.nf.ca/ edu under “ Publicat ions O n-Line”