Embed Size (px)
Citation preview

N O T I C E
THIS DOCUMENT HAS BEEN REPRODUCED FROM MICROFICHE. ALTHOUGH IT IS RECOGNIZED THAT
CERTAIN PORTIONS ARE ILLEGIBLE, IT IS BEING RELEASED IN THE INTEREST OF MAKING AVAILABLE AS MUCH
INFORMATION AS POSSIBLE
https://ntrs.nasa.gov/search.jsp?R=19800018481 2018-07-04T13:57:17+00:00Z

RF Project 761420/711626
Semi-Annual Report
theohiostateuniversity
research foundation1314 kinnear road
y y columbus, ohioo 43212 pw a 9
d ^~ Cr
OF INFRARED SPECTRA OF ATMOSPHERIC GASES
M r 3 TO SUPPORT STRATOSPHERIC SPECTROSCOPIC INVESTIGATIONSr-r
d r rC v'rr N -
^ n 2n^
John H. ShawDepartment of Physics
< C" H
r Ui CLA r)^w v' H For the Period
c c z 1 November 1979 - 30 April 1980
o ,, a bv
v c^ z PJATIONAL AERONAUTICS AND SPACE ADMINISThATION
n HWashington, D.C. 20546
U n, Grant No. NSG-7479
G^LJLL.^^
4 ^, I
W w.
C i..j ^ ^l` yCif r ' 4 AJune, 1980
a. o ° ^SCL, ► ' ti ! ^,
U.mG
N

INVESTIGATION OF INFRARED SPECTRA OF ATMOSPHERIC GASESTO SUPPORT STRATOSPHERIC SPECTROSCOPIC INVESTIGATIONS
by
John H. ShawDepartment of Physics
1 November 1979 - 30 April 1980
NATIONAL AERONAUTICS AND SPACE ADMINISTRATIONWashington, D. C. 20546
Grant No. NSG-7479
June, 1980
w,

TABLE OF CONTENTS
Page
LIST OF TABLES ii
LIST OF 74IGURES
IN'T'RODUCTION 1
EXPERIMENTAL INVESTIGATIONS 2
SPECTRAL ANALYSIS 3Spectrum Plotting and Line Finding Program 3Calculation of Synthetic Solar Spectra 3NLIS Analysis of Spectra 5Spectra of 03 5Analysis of CO2 Spectra 6Whole-Band Analysis of N20 14Analysis of Single Line Spectra 18
:'UTURE PLANS 18
REFERENCES 20
PAPERS PUBLISHED '11
Interim Reports on NASA NSG-7+79
PRESENTATIONS 22
PERSONNEL 23Associated with NASA NSG-7+79
i

3 Band Constants for Absorption Bands Nearand 26+1 cm 71 Reported by Rothman and Beni
4 Portion of Correlation Matrix from AnalyiAbsorption Band Near 261+ cm1
ii
e.,

LIST OF FIGURES
Figure Page
1 Output of ATLAS Program - Portion of N20 Spectrum 4
2 Spectra of Naturally Occurring CO2 Near 3.8 m 10
3 Calculated and Observed Spectra Near 261+ cm-1 11
4 Cal^.elated and Observed Spectra Near 2650 cml 12
5 Variation of Line Width with M at T = 296 K,P = 760 Torr 13
6 Portior of a Spectrum of 14N2160 Nitrogen 16

IMODUCTION
Progress in our investigations of the infrared spectra of atmos-pheric gases to support stratospheric spectroscopic investigations isdescribed.
The information concerning the atmosphere which can be obtainedby spectroscopy depends on the nature of the instrumentation and ourknowledge of the absorption characteristics of atmospheric gases. Oneof the characteristics common to many of the spectroscopic stratosphericexperiments currently being considered is the improvement in the spectralresolution compared with earlier investigations. As the spectralresolution approaches the widths of absorption lines there is a largeincrease in the amount of atmospheric information contained in thedata. However, in order to extract this information, the parameters(position, intensity, shape) of the spectral lines must be known withsufficient accuracy.
Concern has been expressed regarding the adequacy of our knowledgeof these parameters at a number of meetings of spectroscopists heldduring the past year (1). At the present, much of this concern isqualitative in nature. Pert of the effort carried out under thisgrant has been to investigate analytical methods which will allow someof these problems to be studied more quantitatively. On the one hand,it is necessary to specify the accuracy required of the line parametersto retrieve atmospheric information with the precision desired; on theother hand, it is useful to be able to estimate the ranges of atmosphericconditions (e.g., the vertical depths in the atmosphere) over whichinformation can be obtained with a given instrument design. It is notour purpose to pursue this problem extensively. We do consider it tobe important and that it has received less consideration than neededin evaluating the usefulness of different experiments.
The spectroscopy workshops have emphasized that more informationis required about the absorbing properties of many atmospheric gasesover wide spectral ranges and for large numbers of spectral lines.Usually, this information is obtained by making measurements on indivi-dual lines. We are developing methods of siamItaneou.sly analyzingentire bands containing many lines. During the past few months thesemethods have been applied to the analysis of bands of N20 and CO,,.Progress in this analysis is reported.
1
t

E PERDOM46 L INVESTIGATIONS
(Hoke, Hawkins, h-jrCatron, Damon)
The principal apparatus used in our investigations consists of aNicolet Fourier Transform Spectrometer and a 10m multiple traversalcell. This system was brought into operation during the first year ofthis grant.
The transfer optics between the source, interferometer, absorptioncell, and detector can be flushed with nitrogen and partially evacuated.This allows much of the atmospheric H2O and CO2 in the path to beremoved. Two detectors are available. A Hg Cd Te, extended-rangedetector enables spectra to be collected from approximately 800 cif , tobeyond 6000 ce. An In Sb detector, with greater detectivity, can beused from 1900 cnil to higher frequencies. Spectra, with a resolutionof about 0.05 c fl, of 03, CO2 , N20, H2O and a number of other gases havebeen obtained. A gas handling system which allows precisely measured,small samples of gases to be introduced into the cell has recently beenadded to the cell. In addition, a tape recorder was integrated with theNicolet system so that spectra can now be stored on tape. Other improve-ments to the system have included the writing of programs to be used withthe Nicolet system which allow the spectra to be plotted in differentformats. However, many of the programs for spectral analysis requirethe use of the main Ohio State University computing system. We werefortunate in obtaining the assistance of Arthur Levitt, who preparedprograms which allowed this system to read the tapes of spectra. Theseprograms were written in January, 1980. Since then it has been possibleto begin the detailed analysis of some of the spectra. These analyseshave revealed problems with frequency calibration. The line frequencies(c.°ril) are based on t.ce frequency of the laser which controls the inter-ferometer drive. The laser supplied by Nicolet was found to be insuffi-ciently stable to operate over the long optical retardations required toobtain high resolution spectra. A mode-locked laser has now beeninstalled. This provides the required stability but its frequency hasnot been established accurately. In addition, small frequency shiftsoccur in spectra recorded at different times. We are investigating thebest method of frequency calibration.
2

SPECTRAL ANALYSIS
SPECTRUM PLATTING AND LINE FIl1DING4 PROGRAM (Hawkins, Nordstrom)
A computer program has been written to plot spectra and to estimatethe positions of absorption lines. An example of the output of thisprogram is shown in Fig. 1.
This program reads the pectrum, from magnetic tape, written bythe Nicolet minicomputer used to acquire and transform the interfero-gram. A quartic spline interpolation is used to improve the appearanceof the spectrum. The interpolated spectrum is searched by a line findersubroutine; the line centers found by this routine are indicated by ticmarks at the top of the plotted spectrum. The estimated frequencies ofthe line centers are listed on the same plat. For spectra such as theone shown., the estimated frequencies of the lice een-:;ers have a precisionof about t 0.003 cal. The line finder subroutine uses an externallysupplied estimate of the signal-to-noise ratio to reject noise dips.
This subroutine finds the great majority of lines and almost neverfinds spurious lines. It has become a standard aid to analysis in thislaboratory, and we have already received requests from other researchersfor copies of the subroutine.
CALCULATION OF SYNTHETIC SOTAR SPECTRA
(Niple, Shaw, Shaffer)
During the first year's °ort, E. Niple prepared a program forcalculating synthetic solar spectra. This program is des( ,ribed in anInterim Technical Report (2) issued under this grant. The programincorporates a ray tracing program described by Snider and Goldman (3)and an efficient method of calculating spectra with Voigt-shaped lines.Dr. Niple is now a post-doctoral Fellow at NCAR and has since improvedthe program further. He has used it, together with a nonlinear, leastsquares technique (NLLS) to analyze solar spectra obtained by Murcrayet al. (4) with a balloon-borne FTS, to obtain profiles of stratosphericNO2 and H2O.
A graduate student, William Shaffer, spent part of the summer of1979 becoming acquainted with this program, and he expects to continuethis work during the summer of 1980. It is hoped that these investiga-tions will lead to better estimates of the accuracy required in lineparameters to interpret stratospheric spectroscopic investigations.[Niple et al. (4) have found that the accuracy of their NLLS analysisof solar spectra was affected by errors in the positions of the linesanalyzed.] It is also hoped that these investigations may allow more
3
'-

1200.068 1200.268 1200.408 1200.530 1200.918 3
1201.143 1201.268 1201.772 1202.015 1202.133 19
1202.618 1202.883 1202.990 1203.462 1203.753 is
1203.039 1204.303 1204.616 1204.700 1205.142 20
1205.470 17.05.553 1205.975 1206.326 1206.410 26
1206.810 1207.173 1207.256 1207.645 1200.031 30
1208.098 1208.463 1208.879 1209.294 1209.728 n!
1210.125 1210.570 1210.941 1211.420 1211.755 40
1212.:,7 5G4 1213.089 1213.373 1213.922 45
1214.105 1214.?53 1214.986 1215.576 1215.780 50
1216.039 1111G.400 1216.504 1216.930 1217.222 55
1217.387 1217.814 1210.040 1210.184 1210.705 eo
1210.856 1218.976 1219.673 1219.751 1221?.5411
S1 1 I I I 1 St
?1^^II11 1 I t I 1 11 11 1
11t 11 1 1 1 i
I1 I 1
1FHEW. CM-1
uo us so ss ee csI I I 1 I I I 1 I 1 I 11 1 1 1 f i I I I 1 1 1 I I I 11
1^1G.00 ,J11.00 1.12.00 121:i.uo 121 ,4.Ua 1P15.00 1810.00 12)7.00 1z1U.G ri 1219.00 1220.00FHCO, CM-1
Fig. 1. Output of ATLAS program -- portion of N 20 spectrum.
4
OFiGp pR PACE IS
QUAt ►rl,
4

quantitative estimates oftion (temperature density,from spectra. Methods forembryonic stage althoughNiple et al. (2, 5, 6)o
the precision with which atmospheric informa-constituent profiles, etc.) can be obtainedthis type of analysis are still in an
some preliminary ideas have been discussed by
NLLS ANALYSIS OF SPECTRA (Lin, Shaw)
C. L. Lin was associated with this project from January--November,1979. During this period an NILS method for analyzing Voigt-ahapedlines was completed. This work has now been published (7). In additiona new NLLS technique of whole band analysis was demonstrated (8).Unlike conventional methods which require estimates of '.Ine positions,the entire spectrum is used as the experimental data to be analyzed.It is necessary to provide models for the band parameters whichdescribe the positions, the intensities, and widths of the lines.The adjustable parameters in these models are then determined directly.Application of this technique to the analysis of bands of HCI and COdemonstrated that the important band parameters could be determinedwith high precision. The samples of HC1 and CO, whose spectra wereanalyzed, were near atmospheric pressure and the shapes of the Lineswere assumed to be Lorentzian. Although the method is simple in concept,a number of difficulties were encountered in its application. Inparticular, the programs required large amounts of computer time, and,if many parameters are to be determined simultaneously, good initialguesses of their values are required if the program is to converge ina small number of iterations. It also became clear that a s inglespectrum contained a finite amount of information about the bandparameters. For example, the positions of narrow spectral lines canbe estimated more precisely than wider lines. On the other hand, ifthe line width is smaller than the spectral resolution, the valuesof the line widths cannot be estimated precisely.
This leads to interesting problems in experiment design, similarto, but more complicated than, those discussed by Niple and Shaw (5, 6).It is not planned to pursue th s further at this time, although theyhave recurred in the work of Hoke and Hawkins described below.
SPECTRA OF 03
A number of spectra of ozone were obtained in the fall of 1979.These covered the region from 800 to 5000 cm -l -and were obtained withthe Hg Cd Te detector. Samples of these spectra were sent to A. Barbe(Reims) and C. Camay-Peyret (Orsay) who recognized that the linepositions were systematically shifted because of the calibrationproblems noted earlier. It is planned to obtain additional spectra
5

when this calibration problem is better resolved. Although laboratoryOa spectra are important for mew stratospheric investigations, it ismore useful if line parameters are obtained. These can b , estimate.by ELLS analysis of entire bands, but we have not applibd this teelst'-"aeto coMlieated spectra such as 03. Before tackling Os spectra, webelieve it is isoportant to study the applications to relativelystraightforward spectra such as CO2 and N20 as described below.
ANALYSIS OF COa SPECTRA (Hoke, Sham)
Nonlinear least squares analysis has been used to obtain simultaa-sous estimates of band parameters which account for the appearance ofan entire absorption band or bands. An example is the analysis of anabsorption band of CO by Lin and Shag (8).
For the present study of bands of C62 the parameters to be estimatedand the expressions in which they are included are listed in Table 1.The transmittance, I(v), at a particular frequency v (cW1) depends onthe background B(Y), which is usually expressed as a polynomial in vwith several coefficients to be estimated; a symmetric instrumentfunction v(v,H) with one parameter, the resolution H. to be estimated;the quantity exp(-K(v)•U), which is the expression for the value ofthe monochromatic transmittance at v when several lines are present.
The instrument function may take several forms; e.g.,, triangular,gaussian, sine, etc. For unapodized data, the sine function is themost appropriate form.
The absorption coefficient K(v) will differ in analytical formdepending upon the line shape assumed. In this work a Uwentzianshape is used.
The absorption coefficient K(v) is a function of the line positionsvj which depend on estimates of vo, the band center; rotational constantsB', B", D', D", H', H"; line intensities, S(M) which depend on estimatesof Co, Herman Wallis factors 01 and 0 2 ; E (B", D", H") ; half widthsa(M) which are expressed as a simple polynomial in M with the aj to beestimated.
The algorithm used to perform the regression has been described byRalston and Jennrich (9). While various nonlinear regression algorithmsachieve the same end in different ways, they are basically the same;i.e., the sum of squared differences (residual sum of squares, RSS)between the observed data and predicted data calculated by using valuesof the parameters to be estimated is minimized by adjusting the valuesof the parameters (8).
The absorption bands being considered are those of naturallyoccurring isotopic COz at 2000 cml of 177 torr, 450 meter homogeneous
6

path (Fig. 2). The notation in Fig. 2 is that of McClatchey et al. (10).The strongest band, eent*red now 2614 me', is blended, in bOW Uie Pand R branches, by weaker bands centered near 20B anti and 2641 em-I.
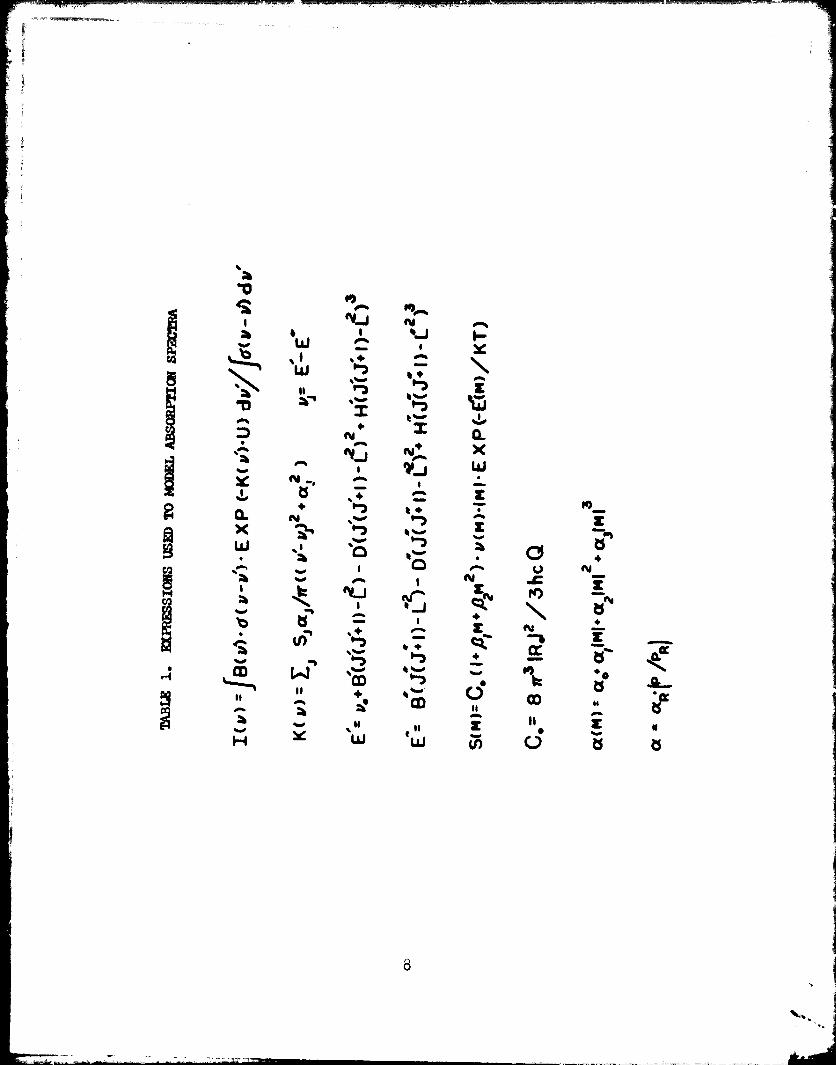
Baud parameters for two of the three bands in the region have beenobtained by analyzing each band separately. The strongest of the threebands was analyzed first and its parameters were then fixed to alloweach weaker band in turn to be analyzed. The estimates obtained forthe two bands centered at 2614 cwl and 2641 cW' by this fix-one-band-free-one-band technique are listed in Table 2. The notation is thatof Table 1. The numbers in parentheses are the standard deviationsor estimated uncertainties of the last significant figure present.
Analysis of the stronger band was performed with approximately60 P and 60 R branch lines. The weaker band was analyzed with approxi-mately 45 P and 45 R branch lines. The half-widths for the weakerband were assumed to be the same as those of the stronger band.
For comparison, values of some of these parameters from a tabula-tion by Rothman and Benedict (11) are listed in Table 3. In addition,the predicted spectrum is compared with the observed spectrum in Figs.3 and 4 which show segments of the region being considered (see Fig. 1).The upper portions of both figures show the synthetic spectra, calculatedby using quantities from Table 2, displaced and above the observedspectra. The lower portions show the differences between the calculatedand observed data, plotted on a scale expanded by a factor of fivecompared to the scale in the upper portion (notice the unmodeled Pbranch line, on the two scales, at approximately 2614.5 cil in Fig. 2).
Throughout the region, the agreement between the calculated andobserved data is fairly good.
Of particular interest are half-widths, which are shown as afunction of M in Fig. 5, corrected to P- 760 Torr. M is equal to -J inthe P branch and to J+ 1 in the R branch. Qualitatively, these widthsWee with. experimental results of other investigators. In particularthe value of conO.13 cm'1 agrees with smell M values from other studies(12, 13). Also, even though the uncertainties for acs and 02 are large,they are determined with sufficient precision to predict that the half-widths decrease with M and to a value, for M = 60, which agrees withDrayson et al. (13). That the detailed functional dependence of a onM is missing is a result of usir4 an inadequate model, ire this case asimple three-term polynomial. It is planned to improve the model byincluding more terms or by choosing different, more appropriate powersof M.
In addition to parameter estimates and estimates of uncertaintyor standard deviation, tr.-- recession analysis produces estimates oflinear correlation among ,_
.,a parameters being simultaneously estimated.
7
M!r►ryJ
i
ti
VS
N^Jr.
hv
1r+
`11
W
m+
4w
W
>s
r,N
N
•1avv
WAVY
M^N^..J
1..
FApi
1%.Op
ev++
S
N+
7Jt
Y
i/Q
W
th.ti
OD
0
J
1
t 11
w
Zv
NZN
Z
UitOft
2
0
ut
N
cr
k
•U
d
CO
MiN_
Ztf''oist,
.-
M
a
th
ab
"0
51
b
r\
YJ,
^ aKw
M 1
vb
S,..CD
11
AvH
8
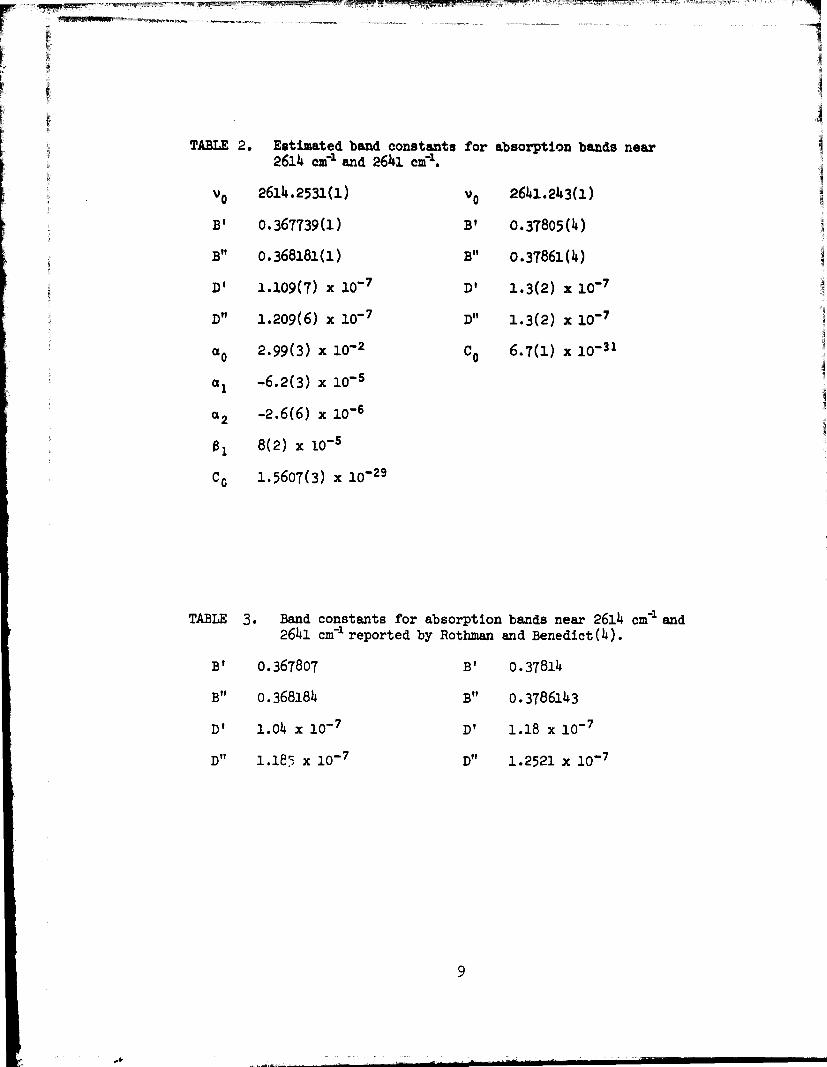
TABLE 2. Estimated band constants for absorption bands near2614 eel and 2641 car-.
vo 2614.2531(1) vo 2641.243(1)
B' 0.367739(1) B' 0.37805(4)
B" 0.368181(1) B" 0.37861(4)
D' 1.109(7) x 10-7 D' 1.3(2) x 10-7
D" 1.209(6) x 10-7 D" 1.3(2) x 10-7
a 2.99(3) x 10-2 C 6.7(1) x 10-31
Oi l -6.2(3) x 10-5
a 2 -2.6(6) x 10-6
0 1 8(2) x 10-5
Cc 1.5607(3) x 10 -29
TABLE 3. Band constants for absorption bands near 2614 cml and2641 cm i reported by Rothman and Benedict(4).
B' 0.367807 B' 0.37814
B" 0.368184 B" 0.3786143
D' 1.04 x 10⁻⁷ D' 1.18 x 10⁻⁷
D" 1.18; x 10-7 D" 1.2521 x 10⁻⁷
9

OFRpO qL Pq^E^R QUgCITY
0OOO
NO
O
ON
O N— N
O
fv
0
N
(ID
NO
0O
OO
N0O0N
aDNw
0lD
0N
l 0 _NccG
U
c.r)cr
OL1JN m
N L
2
w
Q
O 3O
N
OCD
N
bCc Cd
q O•^ nb -+^ UH N
O
a ro
CL)
(y)tcC uv
riN ^O NU
'da 9.H
u UUO 7
'A NS c^
Q
C O
O U -.N t
(dj O uU r-{
O N
N
R,
10

0 2609.00 2611.00 2613.00 2615.00 2617.00 2619.00 2621.00 2
Fig. 3. Calculated and observed spectra near 2614 cm. Upper spectra,upper portion is calculated, lower spectra observed. Lowerportion is difference between observed and calculated.
11

1.00 2643.00 2645.00 2647.00 2649.00 2651.00 2653.00 2655.00
."001 21543.00 2645.(V0 2647.00 2649.00 2651.00 2653.00 2655.00
Fig. 4. Calculated and observed spectra near 2650 cm- . Upper spectra,upper portion is calculated, lower spectra observed. Lowerportion is difference between observed and calculated.
t
_ 12
OO
N
O
OO
0•_. O
•0
LL-NNr1O
2 O
0 1 0 8.0 16.0 24.0 32.0 40.0 48.0 56.0
M
Fig. 5. Variation of line width with IMI at T=296 K, P=760 Torr.
1-3

Part of the correlation matrix for the analysis of the strong2614 coil band is reproduced in Table 4. Each entry is the linearcorrelation coefficient between the parameter to the left and the oneat the top of the column. B1 , B23, B3 are the coefficients of thepolynomial expression for the background and H is the instrumentfunction width. vo is the band center and the remaining parametersare those of Table 1.
The background parameters and instrument function width arequantities which one is obliged to estimate for a complete analysisof an absorption band but are of no intrinsic interest in this parti-cular study. Table 4 shows that these quantities B1, B2, B39 H arerelatively uncorrelated with the other quantities being estimated.This is what one would expect; the information pertaining to thebackground and instrument function can be separated from thatthat for therest of the parameters.
WHOLE-BAND ANALYSIS OF N20
A computer program has been developed to perform whole-band analysisof spectra of N20 or similar molecules, using nonlinear least-squaresspectral curve fitting. Fig. 6 shows a portion of a spectrum analyzedwith this program. The bottom curve is the observed spectrum (thecalculated spectrum is raised above it by 10% for clarity) and the topcurve is the difference between calculated and observed multiplied byfive.
In this program, estimates of spectral band parameters are obtainedby performing a nonlinear regression on the observed spectrum. Theprogram that performs the regression is PAR, one of the BMDP series ofprograms (14). PAR adjusts a set of band parameters so as to minimizethe difference between the observed spectrum and the spectrum calculatedfrom the band parameters.
The spectrum-calculating subroutine uses well-known models to calcu-late line parameters from the band parameters. It then calculates thespectrum using a Voigt line shape and a Gaussian instrument profile. Itcan be adapted to any molecule for which line parameters can be adequatelycalculated from band parameters.
The parameters estimated include:
line positions: B, D, H for upper and lower stateof each band; vo of upper state.
line intensities: one parameter proportional to therotationless dipole matrix element andtwo Herman-Wallis factors, for each band.
line widths: three coefficients of a quadratic in J.
9
14

TABLE 4. Portion of correlation matrix from analysis of absorptionband near 2614 cm 1.
B I B2 B3 H
B I 1.0000
B2 0.2645 1.0000
Bg -0.6835 -0.5250 1.0000
H -0.1242 -0.1227 -0.0141 1.0000
vp 0.1603 0.0630 -0.2246 -0.0409
B' -0.3133 -0.0321 0.2029 -0.1093
B" -0.3066 -0.0331 0.1723 -0.1812
D' -0.0369 -0.0773 0.0200 -0.3682
D" 0.0130 -0.0717 -0.0403 -0.4315
ap -0.0877 -0.1100 0.2187 0.2393
Oi l 0.1716 0.1568 -0.3145 -0.0974
a2 -0.1863 -0.1480 0.3353 0.1019
9 1 o.o477 -0.1381 -0.0274 -0.3971
C O 0.1720 0.0606 0.2013 -0.7603
15

LLICV
C
C
Gi ' 1 .UO J'^NJ. ^V -^..^ 1'1`Z4. 00 ^1^^^i?._O l,1Jt C^:l ^^^.-. UC] i_^^^. J0 j
Fig. 6. Portion of a spectrum of 14N2 160 Nitrogen - Broadened to200 Torr. Bottom curve -- observed spectrum. Middle curve --fitted spectrum, +.10. Top curve -- observed - fitted, x 5.
16

instrument function: resolution half-width.
background: coefficients of a polynomial in frequency,as many as necessary.
For the spectrum which is illustrated in Fig. 6, which covers100 earl, includes more than 3000 data points and 200 lines belonging tothe 2v2 (the stronger band) and the 3v2 -v2 (the weaker J-doubled band),31 parameters were estimated.
While this program is not yet in its final form, the results so farhave been as encouraging as could have been expected. In particular,the program has proven surprisingly good at simultaneously determiningthe instrument and line widths, which was expected to be the mostdifficult problem. For example, spectra taken at 10 torn were analyzed,in which the line width was much less than the resolution; also spectraat 200 torr, in which the liLe • ,Idths were comparable to the resolution.The retrieved values for the resolution did not differ by more than afew percent. The retrieved line widths, for the stronger lines, werewithin about 5% of those listed in the AFGL line listing for the 2v2band of N20.
The major cause of discrepancies between the observed and calculatedspectra ere due to the use of a Gaussian instrument function in thecalculat:.:a, rather than the real apodized instrument function. (Thedifferences between a Gaussian and the unapodized sin(x)/x instrumentfunction are so great that unapodized spectra cannot be adequatelyanalyzed with a Gaussian.) The spectrum calculating sub-routine hasbeen modified to include an arbitrary instrument function. While thecomputing time will be significantly increased, this is necessary totake full advantage of the spectral curve fitting technique'scapabilities.
The analysis of a spectrum such as the one illustrated in Fig. 6,and described above, requires about 150 minutes of CPU time on theAmdahl/470 at the Instruction and Research Computer Center at OhioState University, or about $1,000 in computing money. The time isdistributed over five or six runs in which selected subsets of para-meters are allowed to vary, the remainder being fixed at initial orintermediate values. Such an analysis has been performed, from rawspectrum to final result, in one to two days of wall-clock time.
The current version of the program occupies two megabytes ofmemory. Other minimization routines are being investigated for analysisof larger amounts of data. However, PAR has proven to be effective andconsistent, and the current version should be useful for analysis ofspectra not much more than 100 aril in extent and containing three orfour bands.
17

ANALYSIS OF SINGLE LINE SPECTRA (Hoke, Shaw)
Niple and Shaw (5) have discussed the dependence of the informationabout the parameters of Lorentz-shaped lines on the appearance of thespectrum. In this paper, a method of estimating the precision withwhich a given parameter, such as the line width, could be obtained,was described. No discussion concerning the correlations betweenparameter estimates or of the expected distributions of the estimatesof the parameters and their standard deviations was given.
Because of our extensive use of NLLS analysis, we have beenconcerned about the nature of the results obtained by these methods.In order to investigate them further we have continued our investigationof a single Lorentz-shaped line. A synthetic spectrum of a single linewas calculated extending about ten observed line widths on each sideof the .line and for about 100 signal values. Noise was simulated byadding random numbers with a Gaussian distribution to give an OR of100. A NILS analysis was employed to give estimates of the backgroundspectral resolution, and the line position, intensity and width. Thiswas repeated 200 times with a different set of added noise (SNR - 100in all cases). We have examined the parameter estimates and have foundthat the correlations between estimates obtained "experimentsl.ly " e+,greewith those estimated by the NLLS program and that the parameter estimatesand estimates of the standard deviations appear to be essentiallynormally distributed. These results will be described at the InfraredSymposium, Columbus, June 1980 and it is planned to prepare them forpublication.
FUTURE PLANS
During the next few months, the major efforts will be the continuinganalysis of bands of CO2 and N20 by NLLS. We expect that the experiencegained during the past four months will allow the speed of analysis tobe increased considerably. So far only the data in about a 100 cmflinterval in a single spectrum have been analyzed at one time. It isexpected that simultaneous analysis of several regions containing bandswith common levels or simultaneous analysis of the data on the same bandfrom more than one spectrum will improve the precision of the parameterestimates. It many be possible to perform such analysis if satisfactoryNILS programs can be found which require less memory than the presentprogram.
The principal thr'ast of these analyses will be first to identifythe observed bands and obtain the parameters describing the line positions.Once this has been accomplished, it is expected that the half-widths andline intensities c n be obtained with little further effort. We expect
18
to obtain both self-broadened and N2-broadened line widths and toexplore their dependence on temperature. If the opportunity occurs, wewill also try to obtain more information concerning the line shapes,especially in the wings of the lines.
Naturally occurring CO2 and N20 contain a number of isotopic species.Spectrum of isotopically enriched samples will also be collected andanalyzed if it is found necessary.
Auther efforts will be made on improving the frequency calibration:of the system.
It is planned to obtain spectra of Os at a variety of path lengths,temperatures, and total pressures.
As time permits we will continue our analysis of synthetic solarspectra to obtain a better understanding of the information contained insuch spectra and to determine the type of laboratory investigations mosturgently needed for their analysis.
During our analysis of N20 and CO2 bands we have found that sets ofparameter estimates can be obtained by NLLB, all of which give essentiallythe same descriptions of the spectrum analyzed but with different para-meter estimates. We are faced with making decisions about which of thesesets best describes the molecular contents of these gases, but have notyet established suitable criteria. This problem appears to haveconnections with the analyses of Niple and Hoke described above.
19
%, 1

Ref. ces
1. a) NASA High Resolution Spectroscopy Workshop, Silverthorne,Colorado, (July. 1979), NASA Conference Publication 2134 (1980).
b) Spectroscopic Workshop, NASA/Langley (Oct., 1879), NASAConference Publication 2136 (1980).
2. E. R. Niple, "An Investigation of a Mathematical Model forAtmospheric Absorption Spectra," Interim Technical Report,NASA Grant NSG-7479 (1979).
3. D. Snider and A. Goldman, "Refractive Effects in Remote Sensingof the Atmosphere with Infrared Transmission Spectroscopy".USA Ballistic Research Lab., Report 1790 (1975).
4. E. R. Niple, W. G. Mankin, A. Goldman, D. A. Murcray, and F. J.Murry, "Stratospheric NO2 and H2O Mixing Ratio Profiles from HighResolution Infrared Solar Spectra Using Nonlinear Least Squares,"2eophys. Res. ' : .tters (Submitted).
5. E. R. Niple and J. H. Shaw, "Irformation in Spectra of Collision-broadened Absorption Lines", Appl. Spectros., 33 569 (1979)•
6. E. R. Niple and J. H. Shaw, "Information Measures in Nonlinearexperimental design," J. Phys. E. 13 9 506 (1980).
7. C. L. Lin, J. H. Shaw, and J. A. Calvert, "Least Squares Analysisof Voigt-Shaped Lines," JQSRT, 22, 253 (1979).
8. C. L. Lin, J. H. Shaw, and J. A. Calvert, "Band Analysis by SpectralCurve Fitting", JQSRT, 23o 387 (1980).
9. M. A. Ralston and R. I. Jennrich, Technometrics, 20 9 7 (1978).
10. R. A. McClatchey, W. S. Benedict, S. A. Clough, D. E. Burch,R. F. Calfee, K. Fox, L. S. Rothman, and J. S. Garing, "AFCRLAtmospheric Absorption Line Parameters Compilation," EnvironmentalResearch Papers #434 (1973).
11. L. S. Rothman and W. S. Benedict, Appl. Opt., 1719 2605 (19'1:8).
12. R. P. Madden, J. Chem. Phys., 35, 2083 (1961).
13. S. R. Drayson, S. Y. Li, and C. Young, "Atmospheric Absorption byCarbon Dioxide, Water Vapor and Oxygen," Univ. of Michigan, Collegeof Engineering Report #08183-2-F (1968).
14. M. B. Brown (ed.), BMDP-77 Biomedical 22URter Programs, P Series,University of California. Press, Berkeley (1977).
20

1. E. R. Niple and J. H. Shor t "Information in Spectra of Collision-broadened Absorption Lines," AMI. Spectros., 33, %9 (1979).
2. C. L. Lin, J. H. Short and J. G. Calvert, "Least Squares Analysisof Voigt-Shed Lines," JQRT, 22 j 253 (1979)•
3. C. L. Liu, J. H. Short and J. 0. Calvert, %W Analysis by SpectralCurve Fitting," JWM , 23, 387 (1980).
4. E. R. Niple and J. H. Shag, "Information measures in nonlineare:perimeutal design," J. Plws. E. Sci. Instrum., 11 5% (1980).
INTERIM REPORTs oN NASA NsG-7+79
1. E. R. Niple, "An Investigation of a Mathematical Model forAtmospheric Absorption Spectra," (1979).
21
r.,

PRESENTATIONS
1. E. Niple, J. H. Shaw, "Spectral Analysis I. Experimental Design,from Thirty-Fourth Symposium on Molecular Spectroscopy, The OhioState University, Columbus, Ohio, 1979.
2. M. Hoke, R. Hawkins and J. H. Shaw, "Spectral Analysis II. Smoothingand Interpolatiou of Spectral Data," from Thirty-Fourth Symposium onMolecular Spectroscopy, The Ohio State University, Columbus, Ohio,1979.
3. C. L. Lin and J. H. Shaw, "Analysis of Spectra III. Voigt-ShapedLines," from Thirty-Fourth Symposium on Molecular Spectroscopy,The Ohio State University, Columbus, Ohio, 1979.
4. J. H. Shaw and C. L. Lin, "Spectral Analysis IV. Whole BandAnalysis of Rotation-Vibration Bands of Diatomic Gases," fromThirty-Fourth Symposium on Molecular Spectroscopy, The Ohio StateUniversity, Columbus, Ohio, 1979,
5. R. Hawkins, M. Hoke, and J. H. Shaw, "Spectral Analysis V. Whole-Band Analysis of Rotation-Vibration Bands of .inear Molecules -NryO," from Thirty-Fourth Symposium on Molecular Spectroscopy, TheOhio State University, Columbus, Ohio, 1979.
6. J. H. Shaw, C. L. Lin, E. R. Niple, M. Hoke, and R. Hawkins, "BandConstants and Other Information Obtained by Least Squares Fittingof Fourier Spectroscopic Data," Sixth Colloquium on high ResolutionMolecular Spectroscopy, Tours, France (1979)•
7. M. Hoke, R. Hawkins, E. Niple, and J. Shaw, "The Distribution ofThe Estimates of Spectral Lire Parameters Obtained by NonlinearRegression Analysis of Absorption Spectra," from Thirty-FifthSymposium on Molecular Spectroscopy, The Ohio State University,Columbus, Ohio, 1980.
8. M. L. Hoke, R. J. Nordstrom, R. L. Hawkins ., and J. H. Shaw, "Whole-Band Analysis of CO, Near 3.8 wm," from Thirty-Fifth Symposium onMolecular Spectroscopy, The Ohio State University, Columbus, Ohio,1980.
9. R. L. Hawkins, J. H. Shag, R. J. Nordstrom, and M. Hoke, "MultipleWhole-Band Analysis of NCO," from Thirty-Fifth Symposium on MolecularSpectroscopy, The Ohio State University, Columbus, Ohio, 1980.
10. R. L. Hawkins, J. H. Shaw, R. J. Nordstrom, and M. Hoke, "WholeBand Analysis of NCO and C0_- By Nonlinear Least Squarer, SpectralCurve Fitting," International Radiation Symposium, Ft. Collin:,Colorado (1980).
22

PERSONNEL ASSOCIATED WITH NASA GRANT NSG 7+79
Prof. J. H. Shaw
Prof. E. Damon
Dr. R. J. Nordstrom
Dr. E. R. Niple
Dr. C. L. Lin
R. L. Hawkins
M. Hoke
W. A. Shaffer
Prof. Physics
Prof. Electrical Engineering
Electrosciences Laboratory
(Jan. - Jane 1979)
(Jan. - Nov 1979)
Graduate Student (Physics)
Graduate Student (Physics)
Graduate Student (Physics)
23
..