Embed Size (px)
Citation preview

N O T I C E
THIS DOCUMENT HAS BEEN REPRODUCED FROM MICROFICHE. ALTHOUGH IT IS RECOGNIZED THAT
CERTAIN PORTIONS ARE ILLEGIBLE, IT IS BEING RELEASED IN THE INTEREST OF MAKING AVAILABLE AS MUCH
INFORMATION AS POSSIBLE
https://ntrs.nasa.gov/search.jsp?R=19800015247 2018-08-30T11:19:35+00:00Z

f1r
LARS Contract Report 053079 8.0-10.11'103 •- 11, 3 fs"3
Semi-Annual Status ReportAPMication of Remote SensingTechnology to the solution of
r tl PIDblems in the Managementv of Resources in Indiana
a
r ^ ^
Zci Ji Q
w M^
\
(E80-1G111) LHE APPLICAIIGN CF RTNOTE;SENSING TECHNOLOGY TO THE SOLUTION OFPROBLEMS IN INE hANAGEMENT OF RESOURCES ININDI ANA Sea iannu,il Status Feport, 1 Dec.1979 - 31 May 1979 (Purdue Univ.) 32 p
Nd0-23738
P^ ^ `^F PLO \
Unclas63/43 00111
Laboratory for Applications of Remote SensingPurdue University W Lafayette, Indiana
December 1, 1978 -May 31, 1979 NGL 15-005-186

r
SEMI -ANNUAL REP'JRT
Reporting Period: December 1, 1978 - May 31 0 1979
Grant No. NGL 15-005-186
Title of Investigation:
The Application of Remote Sensing Technology to the Solutionof Problems in the Management of Resources in Indiana
Principal Investigators:
R.A. WeismillerR.P. MroczynskiPurdue UniversityLaboratory for Applications of Remote SensingWest Lafayette, Indiana 47906
Submitted to:
The Office of University AffairsCode PNational Aeronautics and Space AdministrationWashington, D.C. 20546

Fr-
TABLE OF CONTENTS
Page
INTRODUC'r ION . . . . . . . . . . . . . . . . . . . . . . . . 1
SOIL INVENTORY PROJECT . . . . . . . . . . . . . . . . . . . . . . 2
INDIANA WETLANDS INVENTORY . . . . . . . . . . . . . . 7
UPLAND GAME BIRO HABITAT SURVEY . . . . . . . . . . . 19

r-
INTRODUCTION
This semi-annual status report covers the period from December 1, 1978to May 31, 1979 and contains a review of the research and applications, com-pleted or in progress, as funded by the Office of University Affairs, NASAand conducted by Purdue University, Laboratory for Applications of RenateSensing.
This reporting period marks the second half of the sixth year eF fund-ing for a proposal entitled "The Application of Remote Sensing Technologyto the Solution of Problems in the Management of Resources in Indiana." As
indicated in this title, the purpose of this work is to introduce remotesensing into the user community within the state of Indiana. The user com-munity includes those local, regional and state agencies involved in thedecision monitoring and/or managing processes of the state's resources.
In order to carry out this work it is not only necessary to initiateprojects with these agencies but also it is necessary to meet with and pro-vide information to as many people and groups as well as agencies as possible.During the past six months numerous meetings were held with many differentgroups.
Among the groups that were contacted and received information aboutthis program were:
National Park Service, Indiana Dunes National LakeshoreIndiana Department of Natural Resources
Division of Fish and WildlifeDivision of ForestryDivision of ReclamationOffice of the Associate Director
U.S. Department of AgricultureSoil Conservation Service
Listed below are the projects that are reported in this document:
Soils InventoryWetlands InventoryUpland Game Bird Habitat Survey.
r-
2
SOIL INVENTORY PROJECT
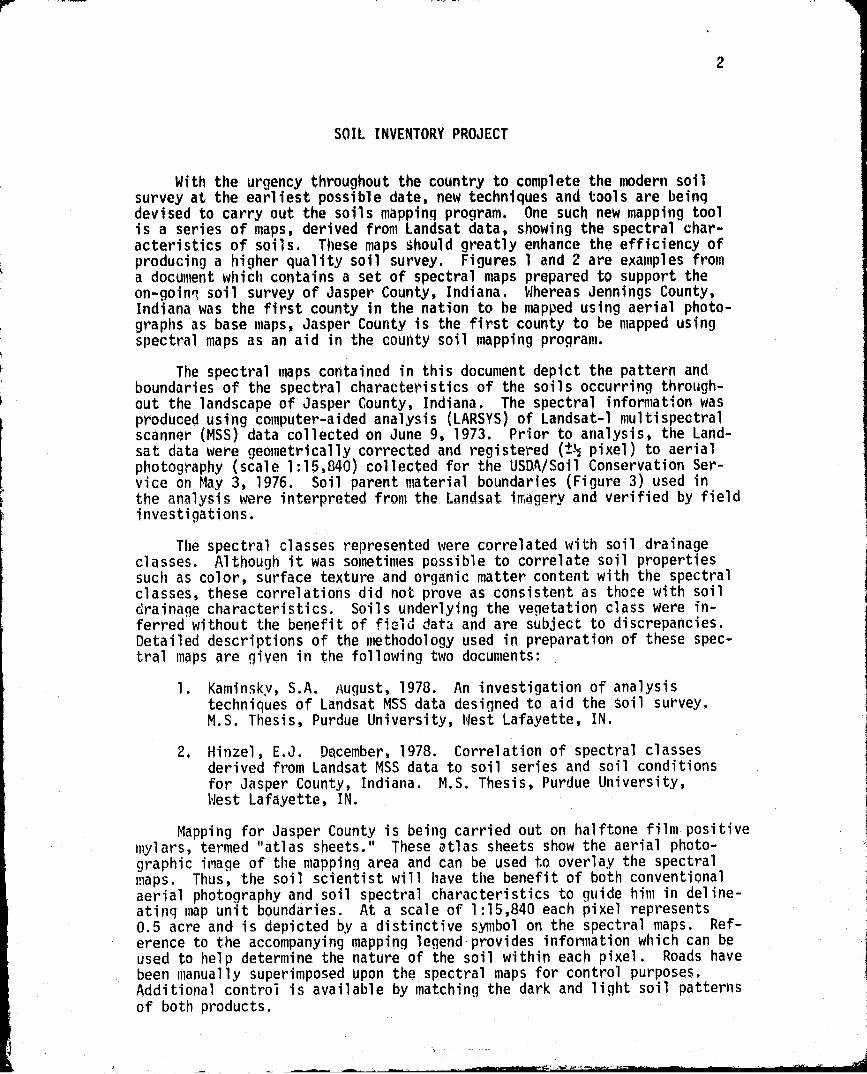
With the urgency throughout the country to complete the modern soilsurvey at the earliest possible date, new techniques and tools are beingdevised to carry out the soils mapping program. One such new mapping toolis a series of maps, derived from Landsat data, showing the spectral char-acteristics of soils. These maps should greatly enhance the efficiency ofproducing a higher quality soil survey. Figures 1 and 2 are examples froma document which contains a set of spectral maps prepared to support theon-goin soil survey of Jasper County, Indiana. Whereas Jennings County,Indiana was the first county in the nation to be mapped using aerial photo-graphs as base maps, Jasper County is the first county to be mapped usingspectral maps as an aid in the county soil mapping program.
The spectral maps contained in this document depict the pattern andboundaries of the spectral characteristics of the soils occurring through-out the landscape of Jasper County, Indiana. The spectral information wasproduced using computer-aided analysis (LARSYS) of Landsat-1 multispectralscanner (MSS) data collected on June 9, 1973. Prior to analysis, the Land-sat data were geometrically corrected and registered (±_^ pixel) to aerialphotography (scale 1:15,840) collected for the USDA/Soil Conservation Ser-vice on May 3, 1976. Soil parent material boundaries (Figure 3) used inthe analysis were interpreted from the.Landsat iiragery and verified by fieldinvestigations.
The spectral classes represented were correlated with soil drainageclasses. Although it was sometimes possible to correlate soilpropertiessuch as color, surface texture and organic matter content with the spectralclasses, these correlations did not prove as consistent as those with soildrainage characteristics. Soils underlying the vegetation class were in-ferred without the benefit of field data and are subject to discrepancies.Detailed descriptions of the methodology used in preparation of these spec-tral maps are given in the following two documents:
1. Kaminsky, S.A. August, 1978. An investigation of analysistechniques of Landsat MSS data designed to aid the soil survey.M.S. Thesis, Purdue University, Kest Lafayette, IN.
2. Hinzel, E.J. December, 1978. Correlation of spectral classesderived from Landsat MSS data to soil series and soil conditionsfor Jasper County, Indiana. M.S. Thesis, Purdue University,West Lafayette, IN.
Mapping for Jasper County is being carried out on halftone film positivemylars, termed "atlas sheets." These atlas sheets show the aerial photo-graphic iciage of the mapping area and can be used to overlay the spectralmaps. Thus, the soil scientist will have the benefit of both conventionalaerial photography and soil spectral characteristics to guide him in deline-atinq map unit boundaries. At a scale of 1:15,840 each pixel represents0.5 acre and is depicted by a distinctive symbol on the spectral maps. Ref-erence to the accompanying mapping legend provides information which can beused to help determine the nature of the soil within each pixel. Roads havebeen manually superimposed upon the spectral maps for control purposes.Additional control is available by matching the dark and light soil- patternsof both products.

izuL-10 ,-- 11--, L, -, , Aaa 6^
U
W
rL1UM rofro`
^ C
Z^Q) . C C
^ ^ OC/) ^U
ro ro ^^W-_, _ a
Q
O
O
Wrz
Ucz
n
om)
W
VJ
1
O
01
tr ^^r•r 1 .r. n• w •wSIN • • i^
.f•i • r • •• n •. i
• • • • w r I .. ; N N • • • M•rrr• »NNSZUak•MWz •
r s r .»>
... R.L. . n :;..:• !am
son• n ..: .
n •Yn >t r„ • nn ww Mr
..
is
:: •Sf3r: n • n
n • n r •faK3' • • rr
No
•r •:f u p? ^ . . nn r n •r
n r Ywr nn w r nra
3,V
r . e n an "
HpYn w^ •r=r w r
r r•• r
• • •rwa n wr •r sf nn • r•r wrr•anwo n• •nnoon• n rw n rw nr••a• •.•r •w
w n rrr n r nn ••rrr• nerwr •• nnr• n rwwwr•.n•r•a••rr n r rn w•was nww•wrarrnawrarrrr • n• •was mill •ww n •n M." .n ninto nn nn ws• n n •w wI rr r nn ww^•e n nnw• rwr rr n nn nn'•rrrw• nnn a• nn .Si • Nn w nwwr n .rr wwn• rr n w n
Hson rnnn n r n Mir nn^ wa• r nn nn r n n•• • •I wrrr n. n .
IN ,.AS r•
r wran wa rM • n
r•Mnn n rwr ` an••aaw•• nn . n
aw r• n•n r .,n•w na n nannn n•r / Mr• n wr a r. n wN• noil•' n • n aeon no •rwaw• n n r w '' •Door•• n rwr• • • .we.r• • • r r
re J• r - n.n
^i n n- • wM.. n.rnN . >t •.;lf onew e
rrrrrvr n r+N •T.' a n nw nowt•• n
n r n n nrrrw• n wornn as r n n==nn oar nwrrwraN n ••rn
nnn wrynn /oar nn
nnw/ nnrner nn•ro•ar nr nnrr nn/rwwr n r••wr nn osmosis n •rr/•nnr nnww n www•wwow•rw•w nn . arnw•w• nrr .,ae n n rr n r n rr`ar
n •: r n nn•• n r n::•. wrat s .. nn•^n r n^.:.^ a rrww wunto n r n a •arn r r n w •r n r rwr
is.
w •r nnn ww.rt••aw n nn wwrr n r nwr.3. w nr•r•aw a n aty
• w n row n.• nn •r n•. rrr r saw nnwrw• wr
Y.... 1 e Iwo n^n wit, n
y ^^^ •. yew nnnett• n•Taifi' 3 :T w aMa n r• n
. k: n ri+r r r•r
•1r• •.nn 1rr N •/[ K •• KN /1f^K •MK Hk
• •NNK py r• • f •'• rcra ..4 w• •r ltx tIY
n NNz4 M1k ••M nnQ NMK' iT^tli••
N1► ♦•
• »f •. • w:was Sb> Uri
••n.• n • •r n • k• Nt Nn • n • •• • n IN: r•
•_^-r.
• •f•N l{ w I •
+•••. rfx::m3v+ rwr
or a•r. ..
M • f . ^
A4 •r.•r
>i; • r::u
. r 7•.•aiw = °^S
r ^ ^n aw n arm • n^ur • •• wr« nrw i w ^ i«
Imns 12100N •rM
w
nwooww r r r • w w
0•..e ^^r•rrr^w^Y/ w^r•w n/r
r na /are• rwa nnr rr r•..r nowt• nn • n wrw •a 4 n nrw •r • nrwr n.. n. . nn r••wa nw1 •w• n w r n ►
ra! rwrrr•• ON •r •
• a n r• ..n wryn
• .. •.•• n • rnnnn .. r n •
« n•Ajw ^: n :i : r wow.r
crow,• w s r ♦ ••r..r w•rn rr s wr •iris n •. »^ .......•townlaw
ere•• n wrw
n r a nn Sow n r n •^w ► •Iww
T.-rrr r n n I n\ v•w n
n• Y a • a rrn en w 4114,%wrn • .nrr••a• r.•w .r^ antreys r ere
as
nr3«i::a : rn •n ww«srrr «i • •ri 002r n
wrin r saww wn. n
N^so
w wra 1lnww nn .• r• • M r Y r r n • r r
nrr n rn.n r nnn rmass -4 a
won wr r n ow rnrw•• nnnrrrr • -•wr•w n •r nn r
rrnn : r n •nosmosis • •r a••!ly=iowe .. nr n n •rn 4
r rr rwr n• r. a^
• •w n •.on ar n• . n ^nn rr rent wr
rr•• !'c
a • ua
^ir nn •riri^: w
0
Q) +jC
E or0 UxQJ Q!t
Vf +•^
t ^OCO
O i..3 O:n aL iO Q)C V1QJ QJ
L+J
O•^ V1
3^ Q1t
>)
C70U r9
iQ1 rpQN r-
7 'i
QJ (J.0 +3
O 4Ji CV- Q1
i^ rDQ) dQ1L Q)N C
0 i. - InyJ ^ru UQ/ 2
^ rD
Ln OL
Q^i7

^y
cxs
C
C' / c
Q Q CZ
Cz
CIO —j
L t+
vCLcoco
^w
} 4rr
iy
fi
1
1C7
IL
' . dWz4? 3NN uM stoa1;1n O
w 1Y
V^1 ^
c C
^ GVN1 Hlx N
u L
cr(tr.(.' LS NiiJJ P
lO
a,L
L
d!
is
CO
Lb
a
A! ^Q!
4J Lb ^
4J
0 J x!
^^ 3o4- N
CL
4J 4J
w
0
Q)
Q b
ju 4j
x b
M 4J
-r-O
r
^"" U1
N
L
Cr
LL
4
F`
+a w
ct t.
t
r^y
n^ M
v R
P. K4 R# N rdP4 v+ C4 g. rte. t^^i. M
as ^^ w e3 t i MSp Kai u+ xt` m4W '^+` u eh ,r
1.14 W qx (w V M
!r ^O^qq r-+ is t.. pla
$
r W M V rte`.. h.
i+•^ rn o ui w
+x y
41 it.i^^
<i^
!rw N.... N.'t. 4
'^ i.K1 CC[511 OL.1 C" t= tt N L: iq +i .y T.. y $?N L¢r Y E L L 1L
wx t'. {I K` L L > y'. i^
vii d N 4+rA-•'O lA aM+ 45 ct 11 `t f i. sr 4..,
Q G.^ N ^ ^ .^ .4? ai mac` ^^ i r itN O^ w i1 h L L 11WyL ` IN 4 G 4' C
ac ♦x ;{ ^t
a. •f+ b ,G,7 r ^r is.! c^ L cf `^ Mu %-! `5 N C apt N Y t't N •mod rt1 T .0 N •l N i 3 5u ..Ca C71 •s !+ t} CY N Un \. •1C1 d X5.1 4. N L,.: d tt
d N L' L C c+ c. l l ^+ li RI t'. N . yy ♦ r d • Jt t;t •n w •i N N .0 M St L I4ir K ^ K7 K^2.!' t. St« SJ: .t
W ^+•. d L a M d e..' f i' ^ra. ^ U
N C N d^ N r> N 4! 4 P. `jU ' u+ vw L w rte+. d d'Kt !f f+ •^.' G C G C 1 aK N 4' '
t rr•C G t µ ]K GN e*. ++uu L x Ru '[1 r sac C R rih•O 4) ro r
++9 N y^1 C ^ d^ N»+'S9 N N q 4... N f 1J r L -^ NCI j 4^ w L ^ a
O ♦!t O uO L KL .^. d n. t' n ^ ,C ¢? s 's,> c> >C N A n b }, A ' t.! itl 'tit Al 4r '9 b ?•`
N .i N r N N d4w ' G L ^. N!w S7 •tt. C q N 14 M4 r T°'c7 'O 'Ct ,7 9 •K7 vqq •c7 N R }-i •tl wyy N a • ro ^ N a K •.• n: r'"i .C' w 41d d d n. qq^^ C d L ll yy R n` t1 '.A ro t cT d
CC^^JJ T C G N'O NC NtJ• I.i 4l TS di' b
• C 4. •n +a ^ ^n O Ct r-, + ♦-, J„ . d l > N N'G7 a1 i¢ N p •r 4 N Q ro w ro N +J N r•A ♦. LJ C C A' 4^4 L L L L N. L R w Q L p r+ P ^..- 'n N N +:.+t7 't7 D y,! O 17 yJ 'O N q N q Ts^ N y V+ N rP 6 N q d ix w
C F!. U C I fj G S^ KP 'S) L W" y1 M ^+ Ur_ro ^1 _ T Z] Td!n TY 'iY dVub Urr ^N O wti r•. dQ '!5 dr >> d D dG KG N L Ngg11 y yp!
w Gq r g L R y! N {. •w «, » +, µ •.• T d •.* N .-a3 2 3 ^ ^^j p C Nqt N ^ ro ^ d N t C2 Q rt1 h^ M1! ^ N °+° N Tw N L L L 4- L S•! ♦ e r •yO T O G N Or+ P• Lw C L d 4r+rr L'q p 0. O'P N CrN H Q+ o N +q '4 d N '47 u S7 d o 'p O r'3'i+• L F'.q! N Q +NJ > NNr¢ X } N w K7. I N T Q^ NTN. TN N
Td.C• TN.,:. >'.0 d•Sh N... Tny* 3 Q^L u! V M
dL d w L d ]K ♦ LNC L ^rw N LNC LSN C.np «!C C> d > O d } }+ ♦ O d •n O L d •r+ O .0 Q N Q C d' r+ •n
'p ro. peg }, p U +3 [' C U? p Q 7 Q U N 'x+rN Q N ; N r- N L Z5 ♦ O. X r.+ C5 N . X fl. ^J pf. y U L L LN@ N C d N N N VI C! Ma C ^. d 4 LO ro U "+r d N Nd 1,- d d >+ T Qw ^ TT ^'G L Ciu >u w u ro •r. N 481 L w Lw.r. d w Lr+ N der d qx Q x+.rNC K Q d o d0+rt .'. d O'O dd > u N T!
wN W N & w N N N G N n+ T N G G 2. G'O 'SI N Ny 7 r y J> O ¢yJ NrW C
I G 1F u— 1' C u I C •n I C I C .r. I N N a:r N C n 1B N NO N
N .G. 'p. f`7 s Q O et O L 1t1 eC- 1dJ W L tr. drew tV ' rV'• N U p !'3'N'4 U C 'I^r'"'^ N 1 ON Nj N 9 L C N t7 .= N N O N 7 'L L N O N K •n N• T7. tU i•. N NN UN N O'er N N pd N n Nd> NCwro^ ro^ G N N^ V ^n N r ro U Lq 'Q N Ue- • N ro Otd F i k/FV- 4 C O C d ^'+^ pj C Qy1 w^<J G V S 4 V Y- r^ N U r j U . .. E lJ 'r" I 47 Q u L1 N w
bdG
L ^d^C7 CI..r ro^ fG
+^ Ka^ ti T L NC r T N b O
> N F Vt^ C^ ^. v SI
o a¢ 8^ 0 N C i0+.
L '^ g O N m ^ B O A NrO-x.pF O r0 N ^+ N N N
drY L)lLJN T.' 0. Q'w;c
wd
W L..1 d
w °d
Y O c
s nL c^roj
x ^1v ^i
C O Cw1 N N N CL. 0 t rj P61' a,+ d C L G'+- C N ` O U d C^ ^ N d L SV w.L' QK•^ N L ro. _S CL] p: J Cd1 S.1 w G
N N d U N L A N N F. L n N O l] Q Z Nd^ t'.• N Q: O A.
r.^a s ao O'
r Z O. i s $ Nu c -o ^ a ,n v^ . L cx w r cr ;°^ ^.^ wi F
uW t vtf^
OIC0Gd(n
d mO d a COE ud IA
mp^q O cCd r
Cc o aA N C Z
` d o 8v dE cK> aaUcc m
p Q. U d Qo p 0 cn
En cn Z
Q 0AOAJ

Index Map
1 ^,4p^4 ;
92.ap
Ni
r
z
:4
Q t
l> 7S
N
T
4N
6}
WYiC
+SF.+N
ie
t
t^
.:7 .
•S
Ny
u
T
29
N
N e.wt^. ..
a WHILE f, 00p;
T — 9. Soil parent Materials AreasC I Glacial outwash
Nui Glacial Till -Rolling MoraineIII Glacial Outwash over Glacial Till
N 1 IV Lscustrine Deposits4 V Mocial Till - Ground Moraine
IAlfiaolslVI Glacial Till- Ground Mwalne
w IMdNsolsl
1 ' w Spectral classification Was sheets are
B E N t o N (I OU N T Y identified by walk ciurnlws.
Figure 3. Map of soil parent materials for Jasper Count y derived frominterpretation of Landsat data.

6
The explanatory data appearing on the reverse side (Figure 2) of thespectral map consist of thm%. items:
1. The Working Legend is a listing of the soil series which have been desig-nated asmost likely to occur in the county within a given parent mate-
rial area. Some minor modification in the legend may occur during theactual mapping of Jasper County. This may consist of the deletion ofa few series due to the minor acreages mapped or the addition of newseries identified during the survey.
2. The Drainage Characteristics and Soil Series Observed in the Fielddescribes the natural drainage classes coRelited With each spec ralclass and names the soil series observed in the field based upon astatistical sampling procedure. These observations covered a limitedsized area for each specific parent material region as described underthis caption. It should be recognized that inclusions of other parentmaterials may occur within any named soil parent material area. Inaddition, the random selections of sample sites may result in some bias,and d i screpancies may arise due to errors in sampling or judgement.
3. The Areal Extent of Field Sheet lists the statistical distribution ofeach spectra c ass tat is represented on each atlas or field sheet.These tabulations permit the evaluation of the extent of each spectralclass.
Upon the completion of sufficient mapping in representative areas of thecounty the utility of the spectral maps will be evaluated and future develop-mental requirements will be established.

INDIANA WETLANDS INVENTORY
INTRODUCTION
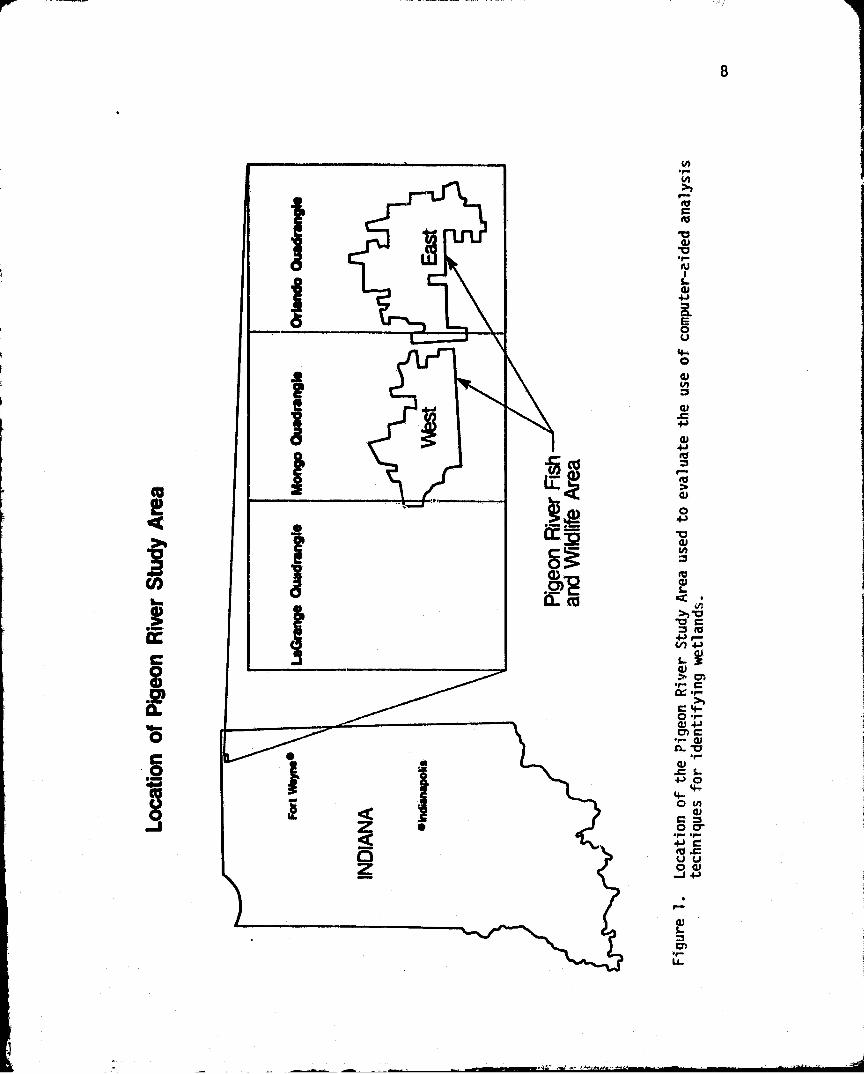
During 1978 LARS staff working in conjunction with personnel from theDivision of Fish and Wildlife, Indiana Department of Natural Resources,entered into a study to assess the feasibility of using Landsat data toinventory wetlands. Nationally, there has been increasing awareness overthe past twenty years concerning the status of these important resources.IDNR does not currently have a comprehensive inventory of the Indiana wet-land resources. Because of cost and time constraints associated with tra-ditional wetland survey methods the probability of undertaking a compre-hensive inventory in the near future is small.
However, if Landsat technology could be effectively applied to identifywetlands statewide, legislation to complete a comprehensive survey might bepassed by the State Legislature. Therefore, the objectives of this studywere developed to address the long range goal of providing a basis uponwhich a comprehensive wetland survey could be built. Simply stated, theseobjectives are:
° To assess the feasibility of using machine assisted Landsatdata analysis techniques to ident=ify Indiana's wetlands, and
To determine the extent to which Landsat data can be usedto identify various wetland communities (species associations)native to Indiana.
The material presented here is from a paper presented at the Interna-tional Symposium on Satellite Hydrology which was held between June 11-15,1979, at Sioux Falls, South Dakota. These results build upon material whichappeared in the previous semi-annual report. A detailed discussion of newclassification technology is given along with results from the study area.
STUDY AREA DESCRIPTION
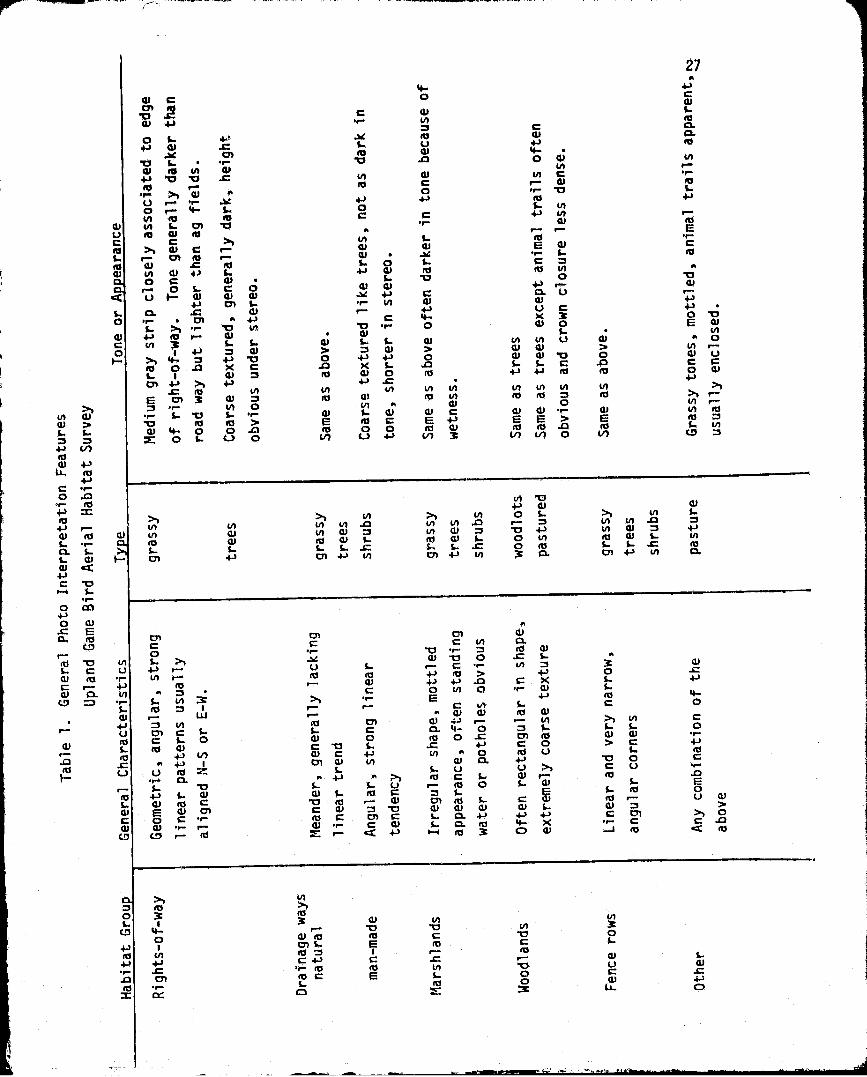
A test site in northern Indiana was used in this investigation (Fig-ure 1). A major portion of the study area contains the Pigeon River StateFish and Wildlife Area. The wildlife area and surrounding lands are dottedwith numerous small wetlands and lakes formed during the Wisconsin glacia-tion. Six major wetland types are present in the study area includingshallow marsh, deep marsh, open water, shrub swamp, hardwood swamp, andtamarack. These wetland types are described further in Table 1.
MATERIALS AND METHODS
Soils information from the Pigeon River study area was collected fromthe recently completed but as yet unpublished soil surveys of LaGrange andSteuben Counties (U.S. Soil Conservation Service). Bottomland soil bound-aries were identified on the survey and transferred onto respective USGS7!g minute quadrangles. A bottomland soil was defined as one which islocated in a lowland area and classified as poorly drained. The soilboundaries differentiating bottomland and upland areas were digitally
rocro
roro
N
cc5 ,^
rnC
Lro4)
RE0u
w0a
as4J
4Jro
ro
(U
0+J
b(ULn
ro
L
'fl c0 toH4J
ar
a ,c4,
0v +J
.°' ao,Cl- v
N4J tp
0 0CJ
O Q"
.cu u
-j41
wi
•zQZ
s
e0 M
4 s
y
ooC
d1
OC •
J
a,L
LL

9
Table 1. Description of the six major wetland types found in the PigeonRiver Study Area.
Wetland Type Description
Shallow Marsh - Soil waterlogged for mach ofgrowing season,
- Inundated in spring with as muchas 6" water.Vegetation consists of rootedherbaceous h,Ar&phytes (grasses,sedges, smart4ieed).
Deep Marsh - Soil covered with 1h-3' water(permanently flooded)
- Vegetation consists of submergentplants, , floating- leaved plants,herbaceous species (spatterdock,white water lily, cattail, bulrushes)
Open Water - Water of variable depthVegetation consists of submer entspecies only (vascular plants
Shrub Swamp - Dominated by woody vegetation lessthan 6 m in height
- 6 3 - soil waterlogged, dogwood,willow, button brush64 - soil covered with 140 ofwater, blueberry, winterberry,choke berry.
Wooded Swamp - Seasonally inundated with water(flood plains)
- Dominant vegetation 6 m in heightand greater (aspen, swamp white oak,silver maple.
Bog - Saturated with water floating (?)Vegetation consists of needle leafdeciduous (Tamarack)
F
r°_I
10
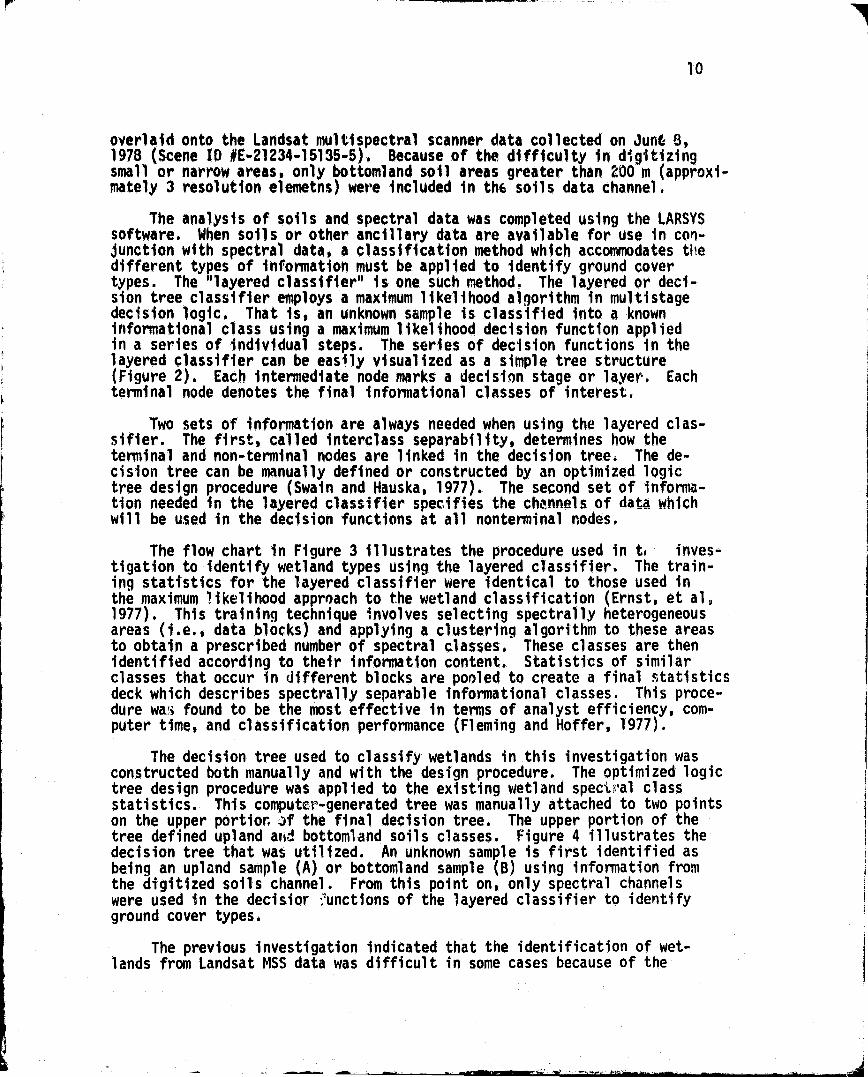
overlaid onto the Landsat multispectral scanner data collected on ME B,1978 (Scene ID #E-21234-15135-5). Because of the difficulty in digitizingsmall or narrow areas, only bottomland soil areas greater than 200 m (approxi-mately 3 resolution elemetns) were included in th6 soils data channel.
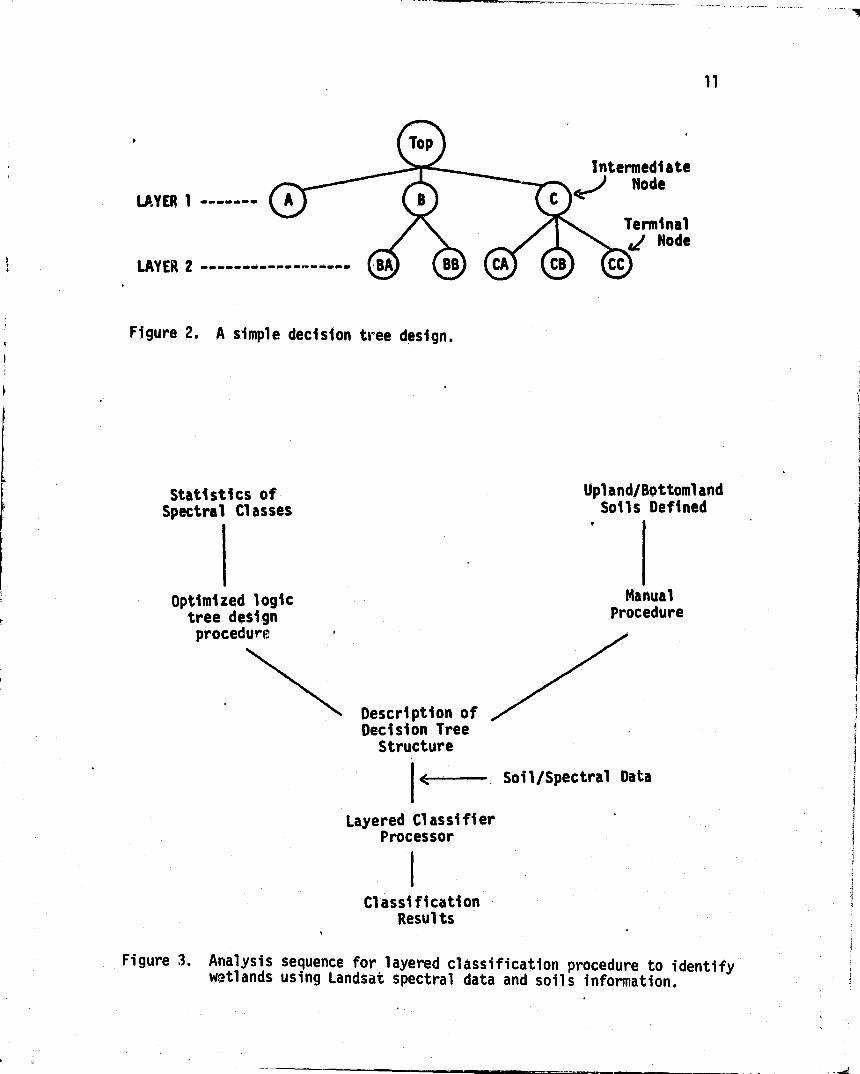
The analysis of soils and spectral data was completed using the LARSYSsoftware. When soils or other ancillary data are available for use in con-Junction with spectral data, a classification method which accommodates thedifferent types of information must be applied to identify ground covertypes. The "layered classifier" is one such method. The layered or deci-sion tree classifier employs a maximum likelihood algorithm in multistagedecision logic. That is, an unknown sample is classified into a knowninformational class using a maximum likelihood decision function appliedin a series of individual steps. The series of decision functions in thelayered classifier can be easily visualized as a simple tree structure(Figure 2). Each intermediate node marks a decisinn stage or layer. Eachterminal node denotes the final informational classes of interest.
Two sets of information are always needed when using the layered clas-sifier. The first, called interclass separability, determines how theterminal and non-terminal nodes are linked in the decision tree. The de-cision tree can be manually defined or constructed by an optimized logictree design procedure (Swain and Hauska, 1977). The second set of informa-tion needed in the layered classifier specifies the channels of data whichwill be used in the decision functions at all nonterminal nodes.
The flow chart in Figure 3 illustrates the procedure used in to- inves-tigation to identify wetland types using the layered classifier. The train-ing statistics for the layered classifier were identical to those used inthe maximum likelihood approach to the wetland classification (Ernst, et al,1977). This training technique involves selecting spectrally heterogeneousareas (i.e., data blocks) and applying a clustering algorithm to these areasto obtain a prescribed number of spectral classes. These classes are thenidentified according to their information content. Statistics of similarclasses that occur in different blocks are pooled to create a final statisticsdeck which describes spectrally separable informational classes. This proce-dure wai found to be the most effective in terms of analyst efficiency, com-puter time, and classification performance (Fleming and Hoffer, 1977).
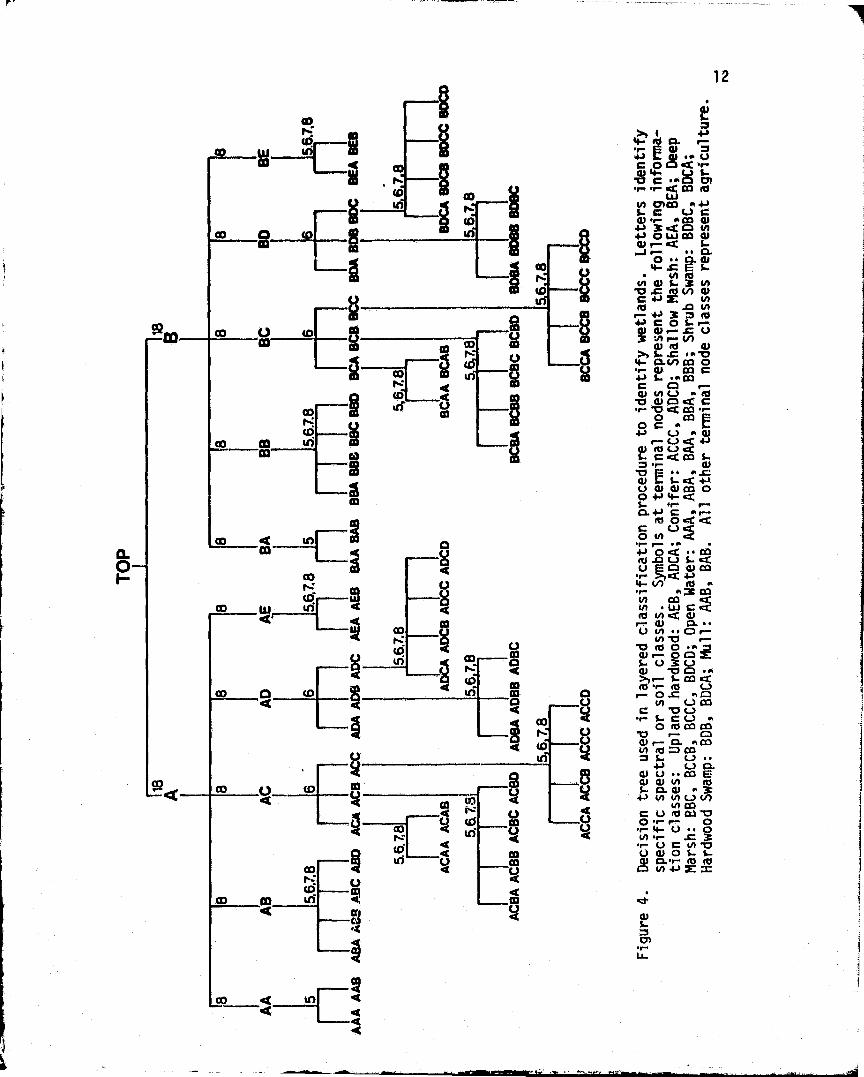
The decision tree used to classify wetlands in this investigation wasconstructed both manually and with the design procedure. The optimized logictree design procedure was applied to the existing wetland spect,,val classstatistics. This computer-generated tree was manually attached to two pointson the upper portion if the final decision tree. The upper portion of thetree defined upland avid bottomland soils classes. Figure 4 illustrates thedecision tree that was utilized. An unknown sample is first identified asbeing an upland sample (A) or bottomland sample (B) using information fromthe digitized soils channel. From this point on, only spectral channelswere used in the decision :functions of the layered classifier to identifyground cover types.
The previous investigation indicated that the identification of wet-lands from Landsat MSS data was difficult in some cases because of the
IntermediateJ Node
Terminal,/ Node
LAYER 1 -------
LAYER 2 ------------------
.._..__...__-__. _
11
Figure 2. A simple decision tree design.
Statistics of Upland/Bottomland
Spectral Classes Soils Defined
Optimized logic Manual
tree design Procedure
procedure
Description ofDecision Tree
Structure
E— Soil/Spectral Data
Layered ClassifierProcessor
i
ClassificationResults
Figure 3. Analysis sequence for layered classification procedure to identifywetlands using Landsat spectral data and soils information.
F'
12
Q
?a
coP-*
W '^m
m C
coti
OW vi a a
a ^ mto
N
4
s
q
UJ.Z
mQ
Q N ^Q d
Qt
7
C 5
Crn
ca As
4A rnCO j 4JL C t1 CN •r w CO W41 3d0 N+J 0 0 N.J rte-• Q • . CL
#Aben d %. 3 u)b t rtf N NC ++ Z: in^4j390m4JCOS..-
%A r- N U
4- CLV) Cn O,r (UCO C4-) L. .. COC D r"w 1/f V R!'Lf C) in Q C•r "D CO •r-O C ^^+J U w 41
b Vt. c 0 iD •r- dE!.. d
O 4J 4- O
^rt`OQdOU
Q Q • • CO
C3 al co.r- ^
d ijr N 3 COW CO
b u^¢ d))`CL
U N +OrU1'U r-
•O M O •^i0• Cam) 3 U>CO Q(0 •r fd Vr- 0= toof C.) COC '0 C.)
•r L C C.)O b CO CO
O r d mn COU) Rl O S- U ..
41 V CLN U ••CO E4) O to b
CL a ; 3+J v) (n
c u (o w 'C7.r-
0 4- U O
N+r C 3•r u C u) S7u 0) O^J Ci •r b bp OA4JM=
4
L
•rLa..
m
13
confusion between upland cover types and wetland cover types having similarvegetative life forms (for example, swamp hardwoods and upland hardwoods).In the layered classification, spectral classes could be given differentinformational class names according to whether they occurred on an uplandor bottomland site. For example, on the decision tree in Figure 4 classesAEB and BER have the same spectral characteristics because they are bothhardwoods. However, the use of soils data to differentiate upland (A)from wetland (B) habitats in the first layer of the classification sequenceenabled class AEB to be identified as upland hardwoods, and class BEB to beidentified as hardwood swamp.
The results of the layered classifier were compared to the maximumlikelihood classification which uses only spectral data without the aid ofany ancillary information. Since this latter classifier involves only onestep in the decision logic, the term "single"single stage" applies to such a clas-sification procedure. The terms "single stage" and "Layered" will be usedthroughout the remainder of this paper to differentiate the two classifica-tion techniques used.
RESULTS AND DISCUSSION
Study of the maximum likelihood classification results revealed thathardwood swamps could not be separated from upland hardwoods on the basisof spectral response alone (Ernst, et al., 1979). Both the upland hard-woods and bottomland hardwoods were found to belong to the same spectralclass. In addition, shrub swamps were often confused with pastures andupland shrubs or sparse hardwood sites. Deep marshes exhibited fairly gooddefinition. However, because conifer plantations have a spectral responsesimilar to deep marsh, the former were consistently classified as deepmarshes. Hence, conifers could not be spectrally identified. Shallowmarsh were misclassified as winter wheat, causing the former to exhibitpoor classification performance.
The application of the layered classifier to the combined Landsat multi-spectral scanner and soils data produced a distinct improvement in classifi-cation results for some wetland classes. Eight separate cover types wereidentified on the Landsat data including five of the six major wetland typesfound in Indiana. Table 2 lists these cover types and test class performancefor each type based on a random two percent ground sample of the Pigeon Riverstudy area. The ability to separate hardwood swamps from upland hardwoodsaverages around 66%. Some confusion still existed between these cover typesat areas where bottomland soil areas were too narrow to be identified on the
soils data channel. Confusion between shrub swamps and hardwood swamps re-sulted in a low performance for the shrub swamp category. Shallow marsheswere often classified as winter wheat. Deep marsh exhibit fairly good defi-nition. Conifer plantations could be separated using the layered classifier.However, the classification performance shown in Table 2 is still ratherlow for conifers because the study area contained only a few, very smallconifer plantations which did not enable an adequately large set of train-ing and test data to be defined. The principle confusion class for coniferswas dark exposed soil found throughout the surrounding agricultural uplands.
Figure 5 is a bar graph comparing the single stage classifier and thelayered classifier performance accuracy for identifying individual wetland
7

F
1 +4
Table 2. Performance values of layered classification procedurein identifying ground cover types using soils andLandsat spectral data.
Cover %Type Performance
Agriculture 87.3
Upland Hardwoods 63.7
Conifers 26.3
Shallow Marsh 27.9
Deep Marsh 57.3
Open Water 87.8
Shrub Swamp 27.7
Hardwood Swamp 65.9
PredominantConfusion Classes
Upland Hardwoods, Shallow Marsh
Agriculture, Shallow Marsh
Agriculture, Deep Marsh
Agriculture, Hardwood Swamp
Agriculture
Agriculture
Hardwood Swamp
Upland Hardwoods

F°
15 °
OVERALLPERFORMANCE0 SINGLE STAGE 70.9%® LAYERED 70,6%
WV2ao:0r^
Waet
AGRI• HARD , CONIFERS SHALLOW DEEP WATER SHRUBCULTURE WOODS MARSH MARSH SWAMP
Figure 5. Comparison of classification performance of layeredand single stage classifiers for individual wetlandand upland types.

wUzQ
ccOLMWa
ae
16
WETLAND
Figure 6, Comparison of classification performance of layeredand single stage classifiers for general wetlandand non-wetland types.
OVERALL PERFORMANCE
Q SINGLE STAGE 71.7%® LAYERED 84.3%

17
types. The most striking feature of this graph can be seen in examiningperformance values for identification of hardwood swamps. Whereas thesingle stage classifier could not separate upland and bottomland hardwoods,use of the layered classifier enabled hardwood swamps to be identified asa class separate from the upland hardwoods. Another class which could beidentified with the layered classifier but not with the single stage clas-sifier was conifers. The low performance value for conifers is largelydue to confusion with dark soils as mentioned earlier.
Use of the layered classifier did not significantly improve the iden-tification of shrub swamps, shallow marshes or deep marshes. These wetlandtypes were consistently confused with other spectrally similar cover typeswhich occur on both upland and bottomland areas. This adds further evidenceto the earlier findings that the ability to identify these wetland classesis a function of spectral response and not the ability to recognize an up-land or bottomland site.
To evaluate the ability to separate wetlands from non-wetland areas,wetland classes identified by each classifier were grouped together into ageneral wetland category and all upland classes were grouped as non-wetlands.Figure 6 is a bar graph of comparative performance based on the two percentground sample. The layered classification procedure exhibits a much higherperformance for identifying a general wetland category. Overall accuracyfor the soils/spectral (layered) classification is 84.3% compared to 71.71for the spectral classification (single stage). This comparison indicatesthat using a combination of soils and spectral data, the ability to identifya general wetland category is Significantly increased.
SUMMARY AND CONCLUSIONS
This investigation clearly indicated that addition of soils informaationis valuable when trying to separate spectrally similar cover types on dif-ferent sites. For example, hardwood swamps could be separated from uplandhardwoods. However, the identification of other wetland types such as deepor shallow marshes and open water were not improved by combining the soilsand spectral data. Even when bottomland soil areas were identified, con-fusion between cover types of similar leaf structure (for example, shruband hardwood swamps) occurred. Of particular significance was the factthat use of the combined soils and spectral data enabled additional wetlandtypes to be differentiated from non-wetlands. This resulted in an improvedcapability to discriminate wetlands as a general category from non-wetlandareas. The layered classifier proved to be an effective method of analyzingcombined soils and Landsat spectral data.
r-
18
LITERATURE CITED
Ernst, C. L., R. M. Hoffer, and R. P. Mroczynski. 1979. Spectral charac-teristics of wetland habitats. Annual Convention of the AmericanSociety of Photogrammetry, Washington, D.C.
Fleming, M. D. and R. M. Hoffer. 1977. Computer-aided analysis techniquesfor an operation system to map forest lands utilizing Landsat MSS data.LARS Technical Report 112277. Laboratory for Applications of RemoteSensing, Purdue University, West Lafayette, Indiana. 235 pp.
Swain, P. H. and H. Hauska. 1977. The decision tree classifier: designand potential. IEEE Transactions on Geoscience Electronics, Vol. GE-15,No. 3. pp. 142-147.
U.S. Soil Conservation Service. Soil Survey for LaGrange County, Indiana.(In preparation).
U.S. Soil Conservation Service. Soil Survey for Steuben County, Indiana.(In preparation).

19
UPLAND GAME BIRD HABITAT SURVEY
INTRODUCTION
During early winter of 1979 personnel from LARS met with staff fromthe Division of Fish and Wildlife, Indiana Department of Natural Resources,to explore possible applications of remote sensing techniques to uplandgame bird management. IDNR staff were specifically interested in identify-ing pheasant habitat in Benton County, Indiana (Figure 1).
A decade ago, Benton County was one of the most productive ringneckpheasant counties in the Midwest. The pheasants, Phasiaus clochicus, oncethrived in the highly productive agricultural county located in the NorthCentral Indiana prairie. However, since the USDA abandoned the agriculturalset-aside acres program in 1972, the pheasant population began to decline.Severe winters since 1976 have further depressed bird numbers.
This continuing decline in bird population has been of concern to per-sonnel in the Division of Fish and Wildlife. Their concern has resultedin the development of a habitat leasing program, whereby Benton Countyfarmers will be paid to leave land out of production. This would have along term effect similar to USDA's set-aside acres program in that it wouldincrease available habitat in the county.
Prior to undertaking the leasing program, Fish and Wildlife personnelwanted to survey the county in order to prioritize potential sites. Con-ventional ground survey techniques would be too costly and time consuming.Furthermore, they would not provide an adequate inventory of the entirecounty. Remote sensing techniques, however, could be easily applied andoffered the potential to provide more detailed information. Working togetherwith the LARS staff, Division personnel decided to use conventional air-photo interpretation techniques to identify potential pheasant habitat.Results from a 100 percent photo-interpretation of the county could be cor-related with field data on bird population to identify potential leasingsites.
LARS staff agreed to coordinate the photo survey and provide any rea-sonable support for this program. The remainder of this report includes aphoto-interpretation procedures document developed for this study. The finalproduct of this activity will be a set of township maps and statistical infor-mation which identify existing pheasant habitat.

I I
20
F
Figure 1. Upland game bird habitat survey study.

1. Panchromatic, black-and-white, 9 x 9 inch aerial photographs taken bythe Indiana State Highway Dept., 7/27/77. A proximate scale of thesephotographs is 1 inch to 2000 feet (1:24,000.Photo-interpretation instructions for the Survey of Upland Game Bird
Habitat.Habitat Tally SheetsPocket StereoscopePhoto scales and area dot gridsUSGS 7h' topographic sheets and County Index MapKern 0.35 mm Prontograph pens and india inkStaedtler Lumocolor 315 pensFinescale Pocket computer
2.
3.4.5.6.7.8.9.
21
Photo-interpretation Proceduresfor an
Upland Game Bird Habitat SurveyBenton County, Indiana
February, 1979
Purpose
The purpose of this study is to conduct a survey of the potentialupland game bird habitat in Benton County, Indiana. Black-and-whiteaerial photographs and standard aerial photo-interpretation techniques willbe used for the purpose of this evaluation. Result-s of this study will beused to prioritize potential nesting areas for inclusion under a statesupported leasing program.
Maps and statistical summaries of acreage for the following generaltypes of permanent upland game bird habitat will be produced. These include:
• Rights-of-way• Drainage ways• MarshlandsWoodlandsFence Rows
Furthermore, information from this survey may be used to help design a sta-tistical field sampling procedure for the purpose of collecting more detailedinformation about the extent and condition of cover in the various habitattypes.
Materials and Methods
The following materials will be used to conduct this survey:

22
Survey of Upland Game Bird Habitat
Instructions
February, 1979
Indexing
Before beginning any photo-interpretation the aerial photos must beproperly indexed. Indexing will consist of marking the appropriate town-ship, range, section, scale, and 7h' toposheet name on the top edge of thephotographs.
a. Township, Range, Scale and Map Sheet Name should be marked inink along the top photo edge as follows (Figure 2).
b. Sections will be marked with a small cross W at the corner.Section number will be marked in red with the red lumocolorpens and be placed within the section so as not to obscureany interpretable feature. Only complete (four corner) sec-tions will be marked on the photos.
Every other photo of a stereo pair should be marked in this fashion.Be sure that all sections of a township are identified_ in this manner beforeinterpretation begins.
Interpretation
Photographs will be interpreted on a section-by-section basis beginningwith the first section in a township and proceeding sequentially until everysection in the township has been interpreted.
Interpretation Procedures
1. Lay down the photos in the packet to form a mosaic of the township.2. Using the County Road map, locate the northeast corner of the township.
Begin indexing the photos in the manner described under Indexing.
• Mark section corners and label• Record Township, Range and 7h' Map Sheet Name
3. After completing step 2 for all the photos in the township, you maystart to interpret the first section in the township. Proceed as
follows:
• Fill in the information required at the top of the tally card(Figure 3).
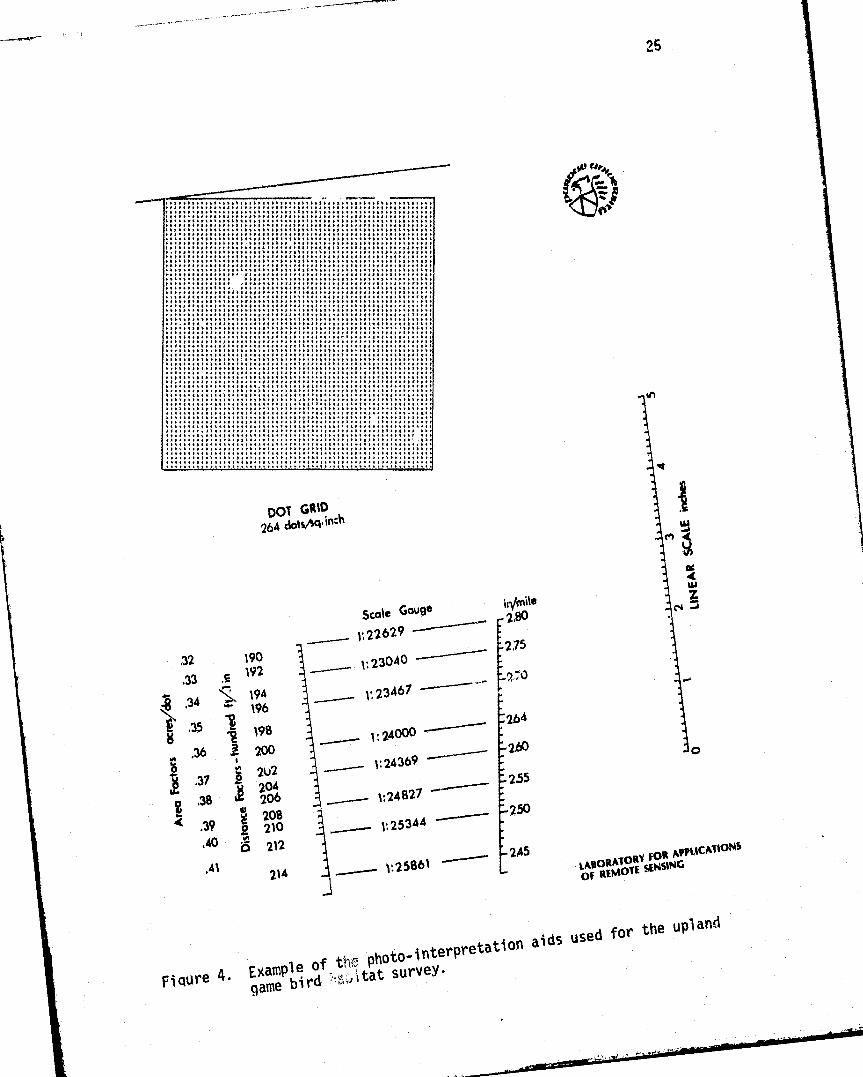
• Determine approximate photo scale using the Scale Gauge (Fi ure 4).Record the scale on the photo as a representative fraction e.g.,
1:24,000).

23
r
x .4
t- ^SRou•J
rjj w
Figure 2. Example of black and white aerial photograph used forupland game bird habitat survey. Annotation alono thetop of the photograph indicates that the image islocated in Township 25N. Ranqe 6 West; on the RoundGrove USGS Guad map. The scale of this particularimage is 1:24.558.
^ '^A
"V A9P,, 'Qe
4e /IV

24
40W Qom» Ifni Aedel iw vey My *no
Secttont_,&„ Tolmsh1P
Msojheet Net„
Mato ----_ 3-31 _--MA P
I ( f Gott ( l l n nh Ave. Ninth I PerimeterCode HABITAT TYPO
A A16HTS•or-MAY
D 1 ORAINAU WAYS
7iPHOTO INTERPRETATION TALLY SHIFT
-.-- .-> Ltyscle911k UVXXr.:asu.GC1....,.^..--.1ass ttap Code
Other
MARSHLANDS'N
r
r I » r err-T lX 91 I
Shrut JgIr"01-T
Habitat Type Dot Il y by It5
M 5 aI^
J,.
1=
..other .»,...._,...,.......,...Q
a
1-WOODLANDS
W9odi933^PS3fN'tS9OMr ent bte}-^ Past r d w d} 0L s ^p +rcent cov r- T
ter (percent coverer-T
FENCE ROWS
,..,
^..^ f
^$' ^9^!-
F ^,,..
rI. Trees
v -T 1
-.^
3-o'3 ..
hrubcover-Table)
,_t
`_0 he
r_.
O OTHER
"1
t dQ Fieldsermanent Pasture
^._.. ^....^<..^, _. .
—IT x-^,
lARS• Purdw Un(v'Pecord 'ntal dots, or linear diatance by ty pe on front of Card.
Percent ;'aver Tablo(second numeral in Map Code)
,1 25
2 26.50
ORIGINAL PAGE ^'.3 51.75.
O PAR QUALMy.4 , 75'.
Comments.,
Figure 3. This is an example of the front and back sides of the tallycards used to record habitat information for the upland game
bird habitat survey.
P,1
scale Gaucie i /mile2880
_ 1; 22629 -^^
1; 23040 ---^'"2,75
2,`0
l r- -- - 1.23467K
24000260
24369 -'°~~
^_^ --- 1;24827 -'--^-255
1;Z50
25344
---
___._ 1:25861 -'""'L 2A5
25
♦ .I
Rf1.: }.^ t
..............t 1R l4.•)f !!1; alY;R1
af1,! ♦ ff.^af,11fa1{f,lRffa.ltl Rfl;{If.Yf 1.l 1x.R•xf 1{a.If 1f
i.l. fi.fllktlliwlffif5 Yff11.f 1., }A1.111111f.Yf.. RRf1t,1L1f1f;;1lfff ♦.11 RlAfffliflVRf 4f 41.l Yff YtYY}.f.\f.lff\{s..ff
Ait1fl11R. .lay R if t1l:. i../A ♦+ lf4R1.1f 1ffY)R11.!a1fllRY,flRRRaYIa;JRf•R ♦ a. ff ..RllfetlAllf.3}flYff•11f ♦
.4r..lf,tfltllf..YfxU if aY.l,fl,.+.fliffl.......Y1e;aaa;ea;e.lf ulee..f ler...u arlafu.lR r..lu Yfe.f.ru }fe•tf.!.i}R .RYfR.^.RRiRRf,..f}Rf1f 1R1f .f.flRf.tf,f1lff lRf.lfl.11f.J11^}}ffiff;;tlfaf;f;lR;;faiff!{;V.f;}f fa:;t;RI;11R;a!lR1R;
R11.11R11lRIl+' RI..RlIR.RlRfffYY}R..aRellt.,.Rf}Il}}1ff1f' 111f.fY ♦1 f{YRlRff.aff ♦}1 f 511.8 1ff lief lVf'.1.
ai}f.;/ !1 a1allift.lRR.}if Y.
:Ir fl;l. RlYf11ft11f 1f I..•aV;1a•\1;111\}Rfa1111
;}.IllRal;Rffie..Yf.•Rf ,.RIf....l\/R t1..f.Rfftf..afRRRt^IReRRI}tRRlf.lRf.ifftlefRttR.f.•RA4RR•
.l}Y.a.flY, ite.tYf.}RR.YIi fllY. tllfltR.^♦ l+fl ltd.}Rlffffa4ff;1 •.t :.Rtf .11
^}}YR;tf a5llaaRlfi.t..f ii3.tlf+Rl..
f4RRYY{If iff}f.ff fFlf lfV4fltlti}f;V.IRi}},RfR,iraRRlfYtllY..f11., }11..1 RfY..iR
a\fal+f;;R;lfRf.lf.R..tlf.if ff.f Aff lflRf.f.V..1 \I.ffR }.1 ffl..RffI.ttYlllY
R!\iff.:lf.11f.. Rf.flll 1. RfRYftf n.Yftf15lf111ff.f.;tR111 rI.Ri..RRRi.f..1R11. : i3; ; .f.. eY.R
lltR..lff /IR1fRiRf:;et.Rffa.lf;:11.11 +l.i.1RfI3..R#:I.
♦ aatl;iaf;1R11;;11 ;1 t1.4:1;:itflA.rt•li..Yff.lRff.l lf.ltf.lY.i.1 IR1f5
:fella} f1.f aRlfA1 R}AYrf3t::
af..R11t;;R1f;fR;flf;lfR; Rf .1s1 Rf1 Itf
RRR..1f 1, Vlf ;tl;; if;afffalll;Y^.\;1f;:R.;:Rfa;R^;11f;•Rf;af111'..3+IR}}}IlflRfl;RI Rf l;f y aRf a;R}If .'!!;(RRI
Rif;. : f lt;1r1fIRRIff}11f1R.R Aflxtff.R Rf}-lf /a:lfa:R:R
rYRi R 3 .rlRtf lf. Rll..lt.tt LIIRIARrIfitRf{Yt1l5R1fRtf.•1lf f.+tltltRfR}3itlff tRtfRfR.RR13.Rf51 .RI.R
YltilY Ytf,it:iR1 1111}Ifft:R Rf5RRR1
f1;f .off. fIfA;RR;{RSRI:111. l.Yf I!.lftilR
R t.Y}f 11511.YRY1 1Rff}11IRRalf fff.1;;};.tfa1;R\ .fflYf AflRlrRlfYR11f 5R{f.Y!}
f1{R.3:}.\ffYR}Rfl 11111.Y.I.RIf1fY
1lf ;RRflR I^;a:ffif
lL4e.f;.efRf.tl,fflfYt3.f ttllf}I11•e1RlftYll.flfRY...3 fl.1!
DOT GRID264 cl010g1 inch
in
4
M 4
OLAW
C.4 J
!32 190
133 c 192
g34
194196
35 .1198
.36 200An
37 20A.38 206
}39 0 210.40 p 212.41 214
r
a
1A90RATORI Volt APTU"T/o"S
Qf REMQTE 5EP1S1NG
hoto- intergretation
aids used for the upland
Fi qure 4•Example of t^^^ Pgame bird 11a-tat survey.

26
• Record the approximate Acreage factor (nearest .005 in.) and
approximate Distance factor tnearest l ft.) in the boxes at thetop of the tally sheet. Acreage and Distance factors are givenalong the left edge of the Scale Gauge. Interpolate as necessary.
hese factors should be checked for each section on eve
• Once you have completed filling in the tally card, examine thesection under the stereoscope.Carefully outline with the Kern ink pen every habitat featureyou have identified. Table 1 indicates the general photographiccharacteristics associated with pheasant habitat in Benton County.Label these features with the codes given on the tally sheet.Be sure to include any permanent grassy features, especiallythose occurring along roads and railroads.
Onl y label features that occur within the sectsa
For all habitat types that contain woody vegetation (i.e., trees,shrubs, or mixtures) you must indicate as part of the type codea designation for crown closure. These four crown closure codesare found on the back side of the tally card.
Example: Trees growing along a natural drainage, approximatecrown closure is 60%. This would be coded as:
Dnl.3
If one type occurs with different cover classes, record eachoccurrence on the back side of the tally card (Figure 3).
• Recheck the section under the stereoscope to insure that youhave not missed any type lines and that every type is labeled
correctly.• Using the scale, comparator or dot grid, record the informationrequired on the tally card for each type identified in the
section.
a. Measure linear distance (length) to the nearest .1 inch or fraction
thereof.b. Record the average width, use the finescale comparator, to the
nearest .005 inch.c. For dot counting, align the bar at the top of the grid parallel to
a section line. Do not align the grid along a section line. Thegrid is specificaTTy at an odd ang l e in order to eliminate over-estimations of linear north-south, east-west features.
NOTE: If a type occurs more than once in a section, tally the areafor each type segment in the spaces provided on the back ofthe card. Record the total in the appropriate location onthe front of the card.
Whenever possible, avoid making perimeter measurements,since these are prone to errors.
FW
3 'b; a14-- bO b
cm L Ec rte-+ c
cm
'^ cLc^
•v ^
v^
3
.TA» li
c^
ca
A+1
nAs
CT AC1 {^
LOClcOH
Y C71a m of •d1
b Z7 .0
O rte- W
^A O!
aA
c
v1 CI ♦! L
c 41 '_Ou ~ 4) w L
.CL• Im
•r Z741 uT.
^ ;r•
Lo. L4t
7 r-► v.a
L 01 N Ocm 4J
a ^•r 0 O
a ^• •Q L b A y>a a o L u o4J v1Aa ++U. Ac +rO t]
A _ >tC1 A O ^cx .^
M LCJf
a dC 't7►-+ L
•rO an4Jo a
ncCD
0
L C U +J rte'w b •r- ofC r- 41
L A QO ,_ W
r}^ O Ln L
C a Or- to +^ N
U r CL -•O
L 4J b CE a rn
c .rar_i a°r •r ^-t7 L7 r- A
27w
4-O
►^cX11
C'r
L
•a
^1
v.°1a
^-►
a
L•ACLCLA
A p r ^•rL
0Cw
C•r-
L
r•
u1wr•
'AE
aL.
w
E
ro
0.
LCA
^cm
v
C1
A
AN0In
J9
r-bNL
X4w1
wLOU
41
c'rL
i0
aO4J
cw414-O>
.0A
bN0to
CC
3
wf04J
AClro(n
N
a
aiA4J
AW
Nb .0
u
oL
CA
O''r
O
.>
.00A
'tl
WbN
4J
E
u1acO
V1ALto
ainr0-uca
r"OM
o{-) 41 O
t0- = U^1to L
V>11 w U1 .c
o (n C•C71 41 o 3 CL C71 4J
c c v► o.•r 'Ct •r ^ A Wac cu a o s ^. o
A A +^ A > N 4J0
.cL 4J
^- 0O
b 4-r^ ,- C v1 L C O
Cn N
4.3 ~ •^ ^ L ice. O
C T7 L .G 0
4J C O > c 4-3o A U L A
m v `n a cs 4J a o cU ?y c u r
n }Li >) rt C L C1 r- AL L V r• Kf O ^- L A Oal L A c Lp A r- Gl tm A L C A r— l) NC Cl a N Gl Q1 N L N > >
cAi c (D s 0.. b 4 - x c c .on
.- ¢ +3 A 3 O a to ¢ A
>)N lA .a
L LA.. L .^},► CT ^ t/1

Record any wiments that you may have regarding the section.Record the time it took you to complete the interpretation,habitat delineation and labeling, and area measurements in theblock at the bottom of the card.Go to the next section and repeat the above.
2$


![22.10.2010 SVN Accounts [NPFL094:/] … vojtech.diatka = rw ejemr = rw machacekmatous = rw sedlak = rw masekj = rw](https://img.pdfslide.us/doc/110x75/56649e115503460f94afcb54/22102010httpufalmffcuniczcoursenpfl0941-svn-accounts-npfl094.jpg)