Embed Size (px)
Citation preview

N O T I C E
THIS DOCUMENT HAS BEEN REPRODUCED FROM MICROFICHE. ALTHOUGH IT IS RECOGNIZED THAT
CERTAIN PORTIONS ARE ILLEGIBLE, IT IS BEING RELEASED IN THE INTEREST OF MAKING AVAILABLE AS MUCH
INFORMATION AS POSSIBLE
https://ntrs.nasa.gov/search.jsp?R=19800010778 2018-07-13T21:42:45+00:00Z

NASA CR 1 52335
ANA41Ri8^AL ^CHAIACS A880CIATEB, INC.2483 Old MkWkftid ay. Suits 210
Mountain la 94043
(NASA-CR-152335) NAVIGATION SYSTEMS FOR N80-190551 APPROACH AND LANDING GF VTOL AIRCRAPT(Analytical Mechanics Associates, Inc.)63 p HC A04/MF A01 CSCL 17G Dnclas
G3/04 14501
October 1979
NAVIGATION SYSTEMS FORI APPROACH AND LANDING
OF VTOL AIRCRAFT
ey
Stanley F. SchmidtRichard L. Mohr
0Ca
coi
Prepared for.
AMES RESEARCH CENTER1
National Aeronautics and Space AdministrationMoMett Field, Califomia 94035

AMA Report No. 79-15
NAVIGATION SYSTEMS FOR APPROACH AND LANDINGOF VTOL AIRCRAFT
BY
Stanley F. SchmidtRichard L. Mohr
ANALYTICAL MECHANICS ASSOCIATES, INC.2483 Old Middlefield Way, Suite 210Mountain View, California 94043
DISTRIBUTION OF THIS REPORT IS PROVIDED INTHE INTEREST OF INFORMATION EXCHANGERESPONSIBILITY FOR THE CONTENTS RESIDES
IN THE AUTHOR OR ORGANIZATION THAT PREPARED IT.
Prepared under Contract No. NAS2-9430
for
AMES RESEARCH CENTERNATIONAL AERONAUTICS AND SPACE ADMINISTRATIONMoffett Field, California 94035
OCTOBER 1979
..J

SUMMARY
This report describes the formulat { • yi and implementation of
navigation systems used for research investigations in the NASA
Ames V /STOLAND avionics system. The navigation systems described
provide position and velocity in a cartestian reference frame
aligned with the runway. They use filtering techniques to com-
bine the raw position data from navaids (e.g., TACAN, MLS) with
data from onboard inertial sensors. The inertial data can be
from either a low quality strapped down system or a precision
platform inertial navigation system. The filtering techniques
described use both complementary and Kalman filters.
This report describes the software for the navigation systems.
Later reports will provide the evaluation and analysis of the
performance of these systems.
i

TABLE OF CONTENTS
Page
INTRODUCTION . . . . . . . . . . . . . . . . . . . . . 1
NOTATION AND DEFINITIONS . • • • • • • . • • • • • • • 4
Roman Symbols . . . . . . . . . . . . . . . . . . . 5i
Greek Symbols . . . . . . . . . . . . . . . . . . . 8
Abbreviations and Acronyms . . . . . . . . . . . . 9
TEST SYSTEM . . . . . . . . . . . . . . . . . . . . . 11
V/STOLAND System . . . . . . . . . . . . . . . . . 11
Crows Landing Test Facility . . . . . . . . . . . . 15
Test Flight Path . . . . . . . . . . . . . . . . . . 15
Sources of Navigation Information . . . . . . . . . 18
NAVIGATION SYSTEM DESCRIPTION . . . . . . . . . . . . 31
Overview . . . . . . . . . . . . . . . . . . . . . 31
Complementary Filter . . . . . . . . . . . . . . . 35Comments on the V/STOLAND Complementary filter. . 40
Kalman Filter . • . . . . • . . . . . . . . . . . . 42Level x-y Filter . . . . . . . . . . . . . . . . . 45
MLS Range and Azimuth . . . . . . . . . . . . 47x-y Filter Initialization . . . . . . . . . . 49
Z Filter• • • . . . • . . . . . . . . . . . . . . 50MLS Elevation . • • • . . • • • • . . • . . . 53
Keyboard Controlled Quantities •• • • • • • • • . 54Smoothing Logic • • • • • • • • • • • • • • • • . 56
CONCLUDING REMARKS . . • • • • • • • • • . . • • . • . 57
REFERENCES . . . . . . . . . . . . . . . . . . . . . . 59
ii
LIST OF FIGURES AND TABLE
FigureNo. Page
1. UH-1H V/STOLAND System Block Diagram . . . . . . . . . . . 13
2. Flight Test Facility . . . . . . . . . . . . . . . . . . . 16
3. Reference Flight Path and Approaches . . . . . . . . . . . 17
4. Final Vertical Guidance Geometry . . . . . . . . . . . . . 19
5. Typical Time Histories of On-Board NavigationMeasurements . . . . . . . . . . . . . . . . . . . . . . 20
6. Geometry of TACAN and VOR/DME Navigation . . . . . . . . . 23
7. Geometry of MLS Navigation . . . . . . . . . . . . . . . . 24
8. Residual Time Histories for On-Board Measurements. . . . . 28
9. Navigation Systems Implementation in V/STOLAND . . ... . . 32
10. Block Diagram of Navigation Systems. . . . . . . . . . . . 33
11. Block Diagram of Complementary Filters . . . . . . . . . . 36
12. Block Diagram and Parameters of the Prefilters . . . . . . 38
13. Third-Order Navigation Filter for x Channel. . . . . . . . 39
14. Third-Order Navigation Filter for Altitude Channel 41
15. Block Diagrain of V/STOLAND Kalman Filter NavigationSystem . . . . . . . . . . . . . . . . . . . . . . . . . . 43
TableNo.
1. Quantities Modifiable through the Keyboard . . . . . 55
iii

1
INTRODUCTION
This report describes the formulation and implementation of navigation
systems used for research investigations in the NASA Ames V/STOLAND avionics
system. The V/STOLAND system was developed by Sperry Flight Systems and is
an all-digital avionics system implemented in a UH1H helicopter. The system
can operate using manual, stability augmentation or fully automatic modes
in controlling the helicopter. The overall system capabilities permit re-
search investigations for the development of all-weather capability for
VTOL vehicles operating from small heliports.
The VTOL aircraft approach, landing and departure paths can differ
significantly from those of conventional aircraft at an air terminal. For
example, the VTOL descent path can use a helix to avoid airspace used by
the conventional aircraft. Following descent, a deceleration maneuver to
a hover condition over the small landing pad can be made. Following hover,
a letdown maneuver to the pad can be executed. In order to perform such
maneuvering and landing under all-weather conditions the navigation system
must produce accurate estimates of the aircraft position and velocity.
The V/STOLAND system is currently implemented with the following
navigation equipment.
1. Microwave landing system (MLS) receiver providing range,
azimuth and elevation measurements.
2. TACAN receiver providing range and bearing measurements.
3. VOR/DME receiver providing range and bearing measurements.
4. Barometric altitude.
S. JTEC instrument for measuring true airspeed.
6. RAdio altimeter.
7. Vertical gyro for aircraft pitch and roll measurements.
L..

8. Directional gyro for aircraft heading measurement.
9. Triad of body mounted accelerometers.
10. A platform type inertial navigation system (LTN 51).
All measurements are available in the dual Sperry 1819B computers of the
V/STOUND system.
Flight tests of the system are conducted at the NASA/Ames flight test
facility at Crows Landing, California. This facility is equipped with the
Microwave Landing System (rU S) as well as radar tracking equipment, recording
equipment and other features which provide the capability of evaluation of
navigation systems which use the **-iS as the primary navigation reference.
The simulated heliport at the facility is a small area on the runway located
approximately 2100 meters fror,. the MLS range and azimuth station and about
1000 meters from the MLS elevation station.
The navigation systems described in this report all provide position and
velocity in a cartesian reference frame with the "1" axis (x axis) aligned
with the runway (at Crows Landing) and the "3" axis (z axis) aligned with
the local vertical. TACAN data and barometric altitude provide position
information in the terminal area prior to acquiring MLS. MLS range and
azimuth are used through touchdown for the x-y position information. MLS
elevation data are used for vertical information when within the coverage
area to an altitude of about 152 m. Thereafter radio altimeter data are
used for the altitude information.
The navigation systems use filtering techniques implemented in the
airborne computer software to combine the raw position data with data
from inertial reference information from either (a) the body mounted
accelerometers and the vertical and directional gyros (strapped-down IMU)
or (b) inertial navigation system (INS). The navigation systems described
herein use the following filter types and inertial information.
2

1. A complementary filter using the body-mounted inertial information.
2. A complementary filter using the LTN-51 inertial information.
3. A Kalman Filter using the LTN-51 inertial information.
4. A Kalman Filter using the body-mounted inertial information.
These navigation systems are being flight tested to demonstrate their
accuracy while varying the software's complexity and the accuracy of the
onboard inertial-sensing equipment.
The objective of this report is to describe the software for the
navigation systems. Later reports will provide the evaluation and analysis
of the performance of these systems.
3

NOTATION AND DEFINITIONS
Notation
The notation of "•" over a symbol has the customary meaning of
differentiation with respect to time. The "' (hat) mark over a symbol
means the "estimated" or "computed" value of the symbolized quantity.
The letter "d" before a quantity indicates an error or small variation of
that quantity. For example, if X is the true value of position, it may
be written as the sum of the estimated position and the position error, or
X s X+dx
The notation tk, tk+l' etc., are used to denote discrete points in
time. The time point tk+1 occurs At set-onds after t k , or
tk+l ' t + At .
The time increment At denotes the primary cycle time of the implemented
digital filter.
4

Roman Symbols
A,Ax - discrete form of the matrix Fx.
bax ,bay b92 - acceleration measurement biases.
A H A
bax,bay,baz - estimates of acceleration measurement biases.
br ,br - actual and estimated bias error it, the TACAN rangemeasurement.
b V b^ - actual acrd estimated bias error in the TACAN bearingmeasurement.
cx ,cv - position and velocity smoothing vectors.
dx - the continuous error state vector of the estimate X forthe level Kalman filter.
dx - filter estimate of the error state vector dx.
dx,dy,dz - errors in x,y,z components of position
di,dy,di - errors it x,y ,s components of velocity
dz - the continuous error state vector of the estimate z forthe vertical Kalman filter
e - base of natural logarithms, e ` 2.7182...
F - n x n system dynamics matrix.
g - acceleration due to gravity
H,Hm - exter.al measurement distribution (sensitivity) matrix.
He - sensitivity vector of altitude derived from the MLSelevation measurement to estimated state.
Hma - sensitivity vector of MLS azimuth to estimated state.
Hmr - sensitivity vector of MLS range to estimated state.
h - estimated altitude in vertical complementary filter.
hbb - bias in the barometric altitude measurement
h$,hR - baro altitude and radio altitude.
hm - altitude above ground measured by the radio altimeteri
or MLS elevation.
hma- altitude of aircraft above MLS range/azimuth station.
hr - raw altitude from complementary filter ' s meas% :remen:selection logic.
hRW- runway altitude with respect to sea level.

I - identity matrix.
Kl ,K2 ,K3 - feedback gains in the vertical complementary filter.
Lx,Ly ,Lz - limit values on magnitudes of position and velocity
smoothing vectors.Lx,LY,Lz
NM - magnetic north.
Q - assumed variance of the random error q.
Qe - assumed variance of MLS (elevation derived) altitudemeasurement.
Qma - assumed variance of MLS azimuth measurement noise.
Qmr - assumed variance of MLS range measurement noise.
q - random noise error in the external measurement.
q - random noise in the MLS (elevation derived) altitude
measurement
qma - random noise error in MLS azimuth measurement.
Qmr - random noise in MLS range measurement.
Re - estimated slant range to MLS elevation antenna.
RC - estimated ground range.
R - TACAN measured slant range.
R - VOR/DME measured slant range
re ,rl - MLS elevation station slant range and its componentin the x-y plane.
r - TACAN or MLS measured ground range.
a - Laplace t,•ansform variable.
t - time.
X,X - actual and estimated values of the aircraft's state vector.
XA- x-component of aircraft velocity relative to the airmass.
Xe- x-component of acceleration from IMU.
XR - navaid-derived position from complementary prefilter.
kw - x-component of wind velocity.
6

x,y,z - position of aircraft in a Cartesian reference framewith x along the runway, y in the horizontal planenormal to the runway, and z normal to the horizontalplane and positive pointing downward.
x,y,z - filter estimates of x,y,z.
iib- vector of aircraft acceleration in body coordinates.
xE ,y E ,z E- location components of the MLS elevation antenna withrespect to the runway reference frame.
xL - vector of aircraft acceleration in inertial platform(LTN-51) coordinates.
xe' ye ,ze - aircraft position coordinates with respect to the MLSelevation antenna.
xa' ya - horizontal true airspeed components in the runwayreference frame.
iIMUIyIMU - x and y (runway coordinates) accelerations measured by IMU.
xm ,ym' zm - location components of the MLS range and azimuth station
xRA,yRA,zRAwith respect to the runway reference frame.
xR ,y R ,z R- aircraft position coordinates with rr.spect to the run-
way reference frame.
zr ,yr' zr - raw acceleration in the runway reference frame as com-
puted by V/STOLAND system software.
xr - estimated position vector.
xT' y T' zT - location components of the TACAN ground station with
respect to the runway reference frame.
xv' y v' zv - location components of the VOR/DME ground station with
respect to the rt+nway reference frame.
Y - computed value of the external measurement.
Ye' Ye - actual and estimated MLS ,elevation-derived altitude measurements.
Y - external state measurement of aircraft.m
Yma ma
' Y - actual and estimated MLS azimuth measurements.
YIDT
'Y IDr
- actual and estimated MLS range measurements.
Greek Symbols
bt - major time (cycle) update of the Kalman filter.
At - acceleration integration period of the filter.
E - MLS elevation angle measurement.
E - summation
0a' aaay'CY - standard deviation (std) of acceleration coloredax' aznoise (x,y,z channels).
ae'ame - std of MLS elevation random noise.
ohb- std of barometric altitude colored noise (bias).
o - std of MLS azimuth random noise.ma
amr - std of MLS range random noise.
G - std of radio altimeter random noise.rn
0 t - std of TACAN bearing random noise.
atr - std of TACM -:.uge random noise.
a - std of TACAN range colored noise (bias).r
CI std of velocity noise.v
a - std of air data velocity noise.va
o ,c - std of wind colored noise (bias) components.wx h
o^ - std of TACAN bearing colored noise (bias).
04,1 - std of initial heading measurement.
T - time constant of an exponential function.
Ta,T T sy - time constant for acceleration measurement coloredax'
noise (x and y channels).
T r - time constant for TACAN range measurement colored noise.
Tx , TV - time constants used to compute smoothing vectors
c and cx v.
T^ - time constant for TACAN bearing measurement colorednoise.
S

4^(tk+l'tk)- state transition matrix from time point t to
time point ^:k+l'
^u(tk+l'tk) - forcing :unction sensitivity matrix affecting
state Esc tk+l due to u(tk).
O,6,^ - aiz.:raft attitude angles (roll, pitch, heading)measured by vertical and directional gyros.
9r,^RW- bearing of runway with respect to magnetic north.
^T- TACAN measured bearing from magnetic north.
^v- VOR measured bearing from magnetic north.
` Ix , W2x'W3x- feedback gains in the complementary x filter.
Abbreviations and Acronyms
a/c - aircraft.
ADI - attitude director indicator.
ACL - above ground level.
AUTO - automatic navigation mode of the V/STOLAND system.
brg - bearing.
rsS - control stick steering mode of the V/STOLAND system.
CTOL - conventional take-off and landing aircraft.
DDAS - digital data acquisition system.
HSI - horizontal situation indicator.
Hz - Hertz, a unit meaning one cycic cr second.
IMU - inertial measuring unit.
INS - inertial navigation system.
I/O - input/output.
MFD - multi_function display, a CRT on the research pilot'spanel in the UH-1H.
MLS - microwave landing system, provides range, azimuth andelevation.
MODILS - modified instrument landing system, a precursor of MLS.
MSL - mean sea level.
MSP - mode select panel, located on the research pilot'spane]. in the UH-1H.
9

navaid - an aid to aircraft navigation.
RMDU - multiplexer and demultiplexer unit,
rms - root mean square.
rng - range.
std - standard deviation.
STOL - short take-off and landing aircraft.
STOLAND - automatic guidance, navigation and display systemfor short take-off and landing aircraft built bySperry Flight Systems.
TACAN - ultra-high frequency tactical air navigation aid,provides range and bearing information.
VOR/DME - very high frequency omni-range station with distancemeasuring equipment, which together provide rangeand bearing information.
V/STOLAND - automatic guidance, navigation and display systemfor vertical and/or short take-off and landing air-craft built by Sperry Flight Systems.
VTOL - vertical take-off and landing aircraft.
WPT - navigation waypoint.
I
10
TEST SYSTEMS
This section gives a description of the V/STOLAND avionics system,
the Crows Landing test facilities, the test flight paths used at Crows
Landing and a sample of the navaid data for a typical approach.
V/STOLAND System
V/STOLAND is an integrated digital avionics system that provides
navigation, guidance, control and displays for the UH-1H helicopter. For
a good overall description of the V/STOLAND system see Ref. 1. The summary
given here was obtained from Ref. 1. V/STOLAND is a flexible system,
allowing evaluation of the aircraft's performance in various configurations
of automatic control, display and navigation. The system is self-monttor-
ing, with provisions for automatic disengagement when failures are de-
tected by the system monitors.
The V/STOLAND system provides the capability to fly conventional modes
such as airspeed select and hold, altitude select and hold, flight path
angle select and hold, and TACAN or VOR radial guidance modes. The Way-
point (WPT) guidance mode also provides radial guidance to an arbitrary
waypoint selected by the pilot. Conventional approaches are possible using
selectable MLS glideslopes. With MLS navigation data, helical descent
may be made to the touchdown point using a 354m radius 3-turn helix
(HELIX mode) or using a 530m radius 2-turn helix (OFFSET HELIX mode).
The MLS azimuth and r:.:- . ge data are used for computing the deviation in-
formatior, required for guidance. The system also provides for capturing
and tracking a 3-dimensional reference flight path. In the basic navigation
system, the TACAN, VOR/DME or MLS navigation sources may be selected
manually or automatically by priority logic which selects the most accurate
and valid navaid.
11

V/STOLAND may be operated in three basic contrri configurations, with
or without the Flight Director:
1. Manual
2. CSS (Control-Stick Steering)
3. AUTO (Autopilot)
In the manual configuration, the pilot controls the helicopter manually by
the sticks and the pedals. No servos are engaged. If CSS is engaged, the
Research Stick (left side) operates in a fly-by-wire mode, providing con-
trol of the helicopter through the servos. If AUTO is engaged, the guid-
ance and control of the system is fully automatic.
When the Flight Director or AUTO is not engaged, conventional angular
VOR/TACAN radial deviation information is provided on the horizontal situa-
tion indicator (HSI), permitting manual capture and tracking of a selected
radial. When the Flight Director is engaged, pitch, roll and collective
commands are displayed on the attitude director indicator (ADI). Linear
rather than angular deviation from the course is always displayed on the
HSI for any of the various guidance modes that may be selected on the Mode
Select Panel (MSP).
The flexibility of the V/STOLAND system is significantly increased by
providing for research modes which function through the Research Computer.
Navigation, guidance, control and display modes may be programmed by the
researcher in the Research Computer. The research modes can be exercised
in any of the basic control configurations of the system.
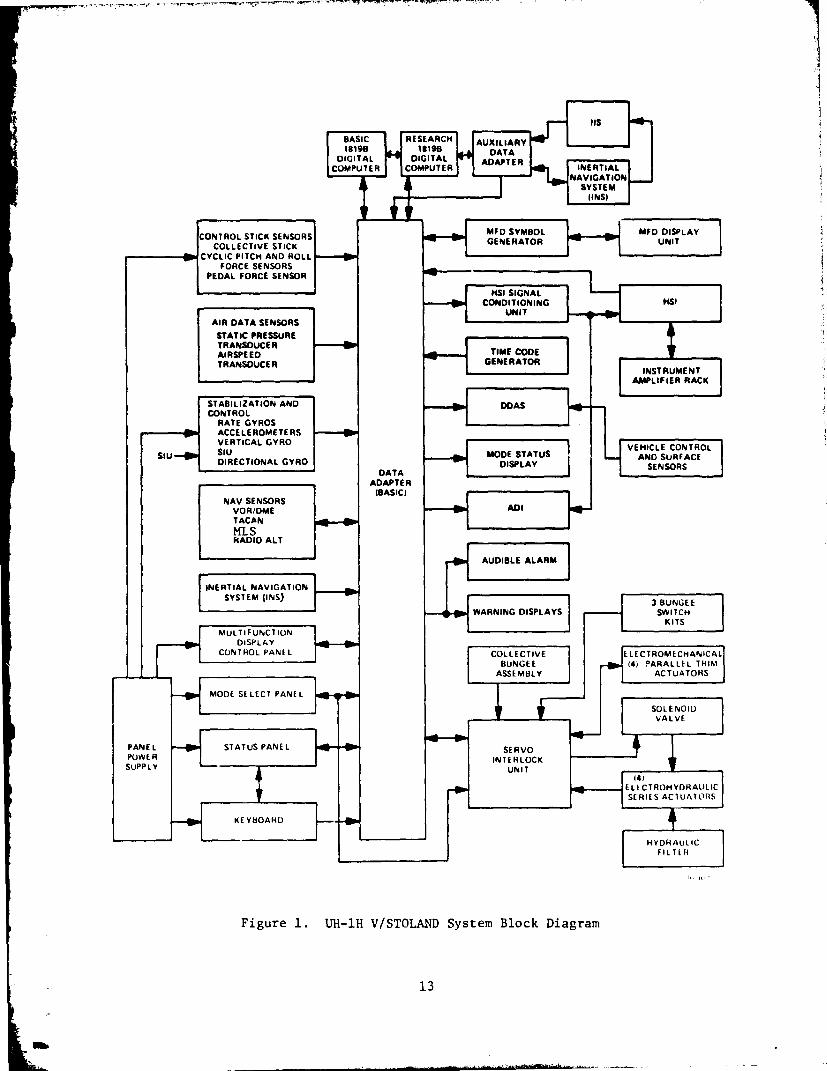
A block diagram of the V/STOLAND system is shown in Figure 1. The
1819B is a general-purpose digital computer with a 16K memory of 18-bit
words and capable of real-time operations in an airborne environment.
The I/O is fully buffered and parallel and uses a party-line transmission
system. The data adapter provides the required interface between the basic
computer and the rest of the system. It performs all the analog-to-digital
and digital-to-analog conversions and all digital-to-digital data transfers.
12
'i
at
usBASIC RESEARCH AUXILIARY1819B 18198 DATADIGITAL DIGITAL ADAPTERCOMPUTER COMPUTER INERTIAL
NAVIGATIONSYSTEM
IINSI
CONTROL STICK SENSORS MFD SYMBOL MFD DISPLAYCOLLECTIVE STICK GENERATOR UNIT
CYCLIC PITCH AND ROLLFORCE SENSORS
PEDAL FORCE SENSOR
HSI SIGNALCONDITIONING HSI
UNIT=4Z
AIR DATA SENSORSSTATIC PRESSURETRANSDUCERAIRSPEED TIME CODETRANSDUCER GENERATOR
INSTRUMENTAMPLIFIER RACK
STABILIZATION AND DOASCONTROL
RATE GYROSACCELEROMETERSVERTICAL GYRO VEHICLECONTROL
SIU SIU MODE STATUS AND SURFACESURFACEDIRECTIONAL GYRO DISPLAY SENSORSDATAADAPTER
IBASICINAV SENSORS
VOR/DME ADITACANMLSRADIO ALT
AUDIBLE ALARM
INERTIAL NAVIGATIONSYSTEM (INS) 3 B UNGEE
WARNING DISPLAYS SWITCHKITS
MULTIFUNCTIONDISPLAY
JWCONTROL PANEL COLLECTIVE ELECTROMECHANICAL
FBUNGEE 141 PARALLEL TRIM
I ASSEMBLY ACTUATOHS
MODE SELECT PANEL F1T - 1SOLENOIDVALVE
PANEL STATUS PANEL SERVOPUWER INTERLOCKSUPPLY UNIT
141EL E.CTROHYDRAULICSERIES ACTUATORS
KEYBOARD
HYDRAULICFILTEH
Figure 1. UH-1H V/STOLAND System Block Diagram
13

The displays such as the ADI, HSI, and the MFD (multifunction display)
provide the inertial, navigational and guidance information. The ADI
includes the flight director command bars in addition to basic attitude
data. The HSI provides navigation and guidance data. The MFD displays
the horizontal situation of the aircraft and pertinent background data such
as geographical features, navaid descriptors and the reference flight path.
The servo complement consists of four series and four parallel servos.
The series servos are electrohydraulic and have limited authority. Their
movements are not reflected in the control sticks. The parallel servos
are electromechanical rate servos that have nearly full authority, but
limited rate capability, and result in movement of the sticks and pedals.
The V/STOLAND system also interfaces with the Digital Data Acquisition
System (DDAS) which consists of a Multiplexer and Demultiplexer Unit (RMDU),
a tape recorder and a telemetry transmitter. The sensor input data as
well as the computed data are transmitted to the DDAS for recording on
tape. The taped data can be converted on the ground into strip-chart
recordings for flight analysis.
The emphasis of this report is on using the V/STOLAND system as a
test bed for research on VTOL navigation systems which include the com-
plementary filter navigation system located in the Basic Computer and the
Kalman filter navigation system located in the Research Computer.
11
14

Crows Landing Test Facility
Flight tests of the V/STOLAND avionics system are performed at the U.S.
Navy's Crows Landing Auxiliary Landing Field near Patterson, Cal. Figure 2
shows a plan view of the field and locations of the TACAN station, the MLS
range/azimuth antenna, and the MLS elevation antenna. One navaid not shown
but occasionally used is the Modesto VOR/DME, which is 28 km NNE.
All landing approaches are made to Runway 35. The runway coordinate
system is defined such that the x-axis is on the runway centerline and
positive northward, the z-axis is vertical and positive down, and the
y-axis completes a right-handed Cartesian system. The origin is on the
runway centerline and such that the MLS elevation antenna is in the y-z
plane. The target touchdown point is at x - -914m, which is between
Runway 35's threshhold and the intersection of Runways 35 and 30.
In order to evaluate the performance of the V/STOLAND guidance and
navigation, key variables are telemetered from the aircraft and recorded
on the ground. Also, twin radars track the aircraft, and its position and
velocity are also recorded.
Test Flight Path
The reference test flight path and approaches are shown in Figure 3.
Three landing approaches have been programmed into the system. These are:
(1) a straight-in approach of constant descending flight-path angle to a
final 2.50 glideslope, (2) a three-turn helical descent with a radius of
354m, and (3) a two-turn helical descent with a radius of 530m. The three-
turn helix is not shown in Figure 3, but it begins and ends at the same
points as the two-turn helix. Because of its greater radius, the two-turn
helix requires a lower bank angle (about 10 0 ) to fly and is more comfortable
for the pilots. Its main advantage, however, is that the bank angle
excursions in windy conditions are considerably reduced. The glideslope
for both helices is 6.11 deg.
_.-
15

1^
MLS AZIMUTH8 DME `d
iNw1
N ^
f 40• RADAR^^ • TRACKING
• i SYSTEMI e
r1
S-)oMGLIDE -s^or=^^ ion
TACAN , QSTATION D
^ os
JIS
GROUND TRACKOF TWO-TURN
"^. HELIX APPROACH
f
1
Figure 2. Flight Test Facility
16

111 1 1 111 %f 1^IIIA^f,lll ly 4111 ,1111•Atl/
Two-TurnAl 1'1111 AI 11
Figure 3. Reference Flight Path and Ap},roaches
17

After exit from either helix, the glideslope remains unchanged until
the path intercepts a final glideslope of 2.5°(see Fig. 4). Finally, a
constant-altitude segment is captured and flown until hover is achieved
over the touchdown point, and a short vertical "letdown" phase completes
the landing.
Sources of Navigation Information
General characteristics of the sources of navigation information are
discussed in this section. For this purpose telemetry data from a landing
approach (the sixth of UH-1H Flight 9101) which flew the two-turn helix
have been selected as typical. Figure 5 shows plots of the data from a
time shortly before entry to the helix until just before letdown.
The geometry of navigation with respect to either the TACAN station or
VOR/DME stat!.on is shown in Figure 6. Slant range and magnetic bearing
from the station are the measured quantities. Figure 7 depicts the geo-
metry of MLS navigation, where the measured quantities are slant range,
azimuth referenced to the runway centerline, and elevation angle. When
available, MLS is used rather than TACAN, and TACAN is used rather than
VOR/DME.
As can be seen in Fig. 5a, the TACAN range measurement is fairly
coarse; one standard deviation of the apparent noise on the signal is
about 15 m. The recorded TACAN bearing signal (the second plot of Fig. 5a)
has several spikes and discontinuities due to a failure in the receiver
which shifted the measured bearing by + 40°. The sinusoidal behavior of
these signals (and many others in Fig. 5) between 90 and 290 seconds re-
flects the helical flight path followed in the approach. The slant range
in the second turn of the helix is slightly less than at a corresponding
point in the first turn mostly because the altitude is less. The TACAN
bearing signal improves markedly in the second turn of the helix because
the elevation of the aircraft above the TACAN transmitter is substantially
less than at previous times shown in the plot. This is entirely expected
because the TACAN system is not designed for accuracy at high elevation
angles.18

z
LET[
h
-914m -1372m 715 14.+07
(-3000 ft) (-4500 ft)
Figure 4. Final Vertical Guidance Ceometry
19

VWd00Q
12
O S
Mw
d00
tcOG
W O
^iu
aCEd
7Wr.d
OO
^.ruAoC„r
AZ
'O
u Od 0y .c
1d
OE
wF O
toOJwwOuc^
zveF
uaF
ui
w
x
e^
E -+ O O s to o) N %0 6 ao O O O O .n O O
1 1 ^,^ O w 0 rl NN 001
C Ir ^ d eh1 .
t
no cc MV y a z >
F H 20d

8 S Of'1 N ^-1 O
O O O O O ON .-1 .4 P4 ( co
00 00a7 4! ^'C V
w.r
^s
^ va°
o.
O Oao.4
DO I4J
OaC.r'vroas
V1 O u^f pa ems► ...^
a d
21H sw
a
6*1 O OD
U a►+ 7A+ ua .rw E
saes
uaa
ww W
w
N .d pN ^D.^1
aO 7^+ u
^ E^ra
ua
H
c0U
^n
d7GCM
v

N N N N
Vd 01 01W W W W
Y Y Y Nw w w w
NVdW\Yw
O
1 •f O 1
udm
w
vd
1'•
W
,^
C
V
V'1
ear
w(i
I\u
Let OLO) OLei V O &n N O Ln O ^'+ N O N^-+ ^ O ^ O ^ N N O O O O N NO'^ ^D e^1 e+1
...I . e On en m en1 I 1 1 1 1
w w ^W WA++
WA.1
WA^ O W
WO++ N
M WO++
w XC4 it W14 /r :LN W ^- N w x W %. K Nu A Y) u A 0 u A rA Y x W Y A \ ., to m4 \ Ir \ ►+ A eQ \ A n A \
>< n a, n N n >2<0.
N E< < < a
sja3alcoaataaOy po3unow Apog SJO30lOaaiO3W WO;3vid
22

nNM (MAG NONTHI
TACAVNORCOORDINATESIX T , Y T . ZTIIX V , VV, ZVI
nRV/RT ^ SLANT RANGE
x
TO V
AIRCRAFT
Yq
KR
AIRCRAFT POSITIONIXp. Y , A . Z^I
•YA
NM
•XR
vR WIRUNWAY HOG)
RUNWAY /
ORIGIN OF RUNWAY COORDINATE FRAME
(A) THREE DIMENSIONAL VIEW
AIRCRAFTr ^RVIRT
Z,L -ZR "IM
TACANNOR (ZT'ZV - FRW I- FRWI^ X A 40
(B) ELEVATION VIEW
NM
(C) PLAN VIEW )1433 RI
Figure 6. Geometry of TACAN and VOR /DME Navigation
23

+XR
i
I
4so¢e z1011,
+YR I R
l -ZR -xR
(0,0,0) Y
MLS range/azimuth (R/scanner, runwayref. coordinates
(xRA,YRA9 zRA) MLS elevation scanner (E)runway ref, coordinates
(xE,YE,zE)
(A) Three-dimensional view
-Z^;
1
(xR
R/A
E -xR
(B) Elevation view
(C) Plan view E
Figure 7. Geometry of MLS Navigation
-X R
+XR
24

It is clear from these plots that horizontal navigation for an approach
and landing using TACAN data alone would be difficult. The microwave land-
ing system (MLS) is much more accurate since it was designed specifically
for this task. Therefore, it is logical that TACAN data are ignored if MLS
data are available.
Fig. 5A shows that the MLS range data are smooth but the azimuth signal
has discernable aberrations, particularly between 90 and 140 seconds and
between 200 and 220 seconds. These aberrations appear in virtually the
same spot in nearly all helical approaches and are suspected to be due
partly to the high elevation angle and partly to the signal's reception
being switched from the fore to the aft MLS antenna on the UH-1H near
these points of the helix.
The MLS elevation data are obviously invalid between 70 and 130 seconds.
Although the signal is smooth and appears valid after 130 seconds for this
approach, it was not always reliable above 10° elevation. Therefore, the
signal is ignored until the elevation angle, as computed from baro altitude
and the estimated x and y positions, is below 100
.
Figure 5b shows plots of the roll angle and pitch angle outputs of
the vertical gyro, the heading angle output of the directional gyro, the
true airspeed output of the JTEC sensor, and the outputs of the barometric
and radio altimeters. As can be seen, the average roll angle in the helix
is about 110 with variations to either side of about 3°. A small part of
this variation is the result of flying a circular ground track in a steady
wind; the bank angle is steeper when the aircraft is flying downwind and
shallower when flying upwind. Because the reported wind was from 260° at
2.6 m/s, the roll angle should be slightly steeper at a heading of 80°
and shallower at 260° (-1000 ). However, it is clear from the plot that
other significant aircraft maneuvering is taking place as well.
The aircraft maintains about 2° pitch-up attitude throughout the helix
with variations of 1° to 20 to either side. There is a steady increase in
pitch attitude as the aircraft exits the helix, decelerates and flares.
25

True airspeed is not used by the Kalman filters except during initializa-
tion, but it is used by the complementary filters for dead reckoning and
wind estimation. The approach shown in Fig. 5b was flown at about 32 m/s
(62 knots true), and this speed was maintained until exit from the helix.
The airspeed measurement here shows greater variation than the 0.6 to
1.5 m/sec peak-to-peak variation usually seen in this measurement. This
may have been the result of some small turbulence aloft.
The plot of the barometric altimeter reading shows that the approach
begins at 805m (2640 ft) above mean sea level (MSL), which means the
pattern altitude is 762m (2500 ft) above ground level (AGL). Part of the
apparent noise in the signal is an effect of the sampling rate used to
make the plot and a high frequency component in the sensor's output. The
sensor is mounted on a nose-boom and a higher sampling rate clearly shows
the boom's vibrational frequency in the signal. The radio altimeter is
used only below 137m (450 ft) AGL; hence, only that portion of the data
is shown in the figure. The radio altimeter has a known bias such that
it reads 7.Om when the aircraft is sitting on the ground.
Figure 5c shows the outputs from the triad of body-mounted accelero-
meters and the outputs from the LTN-51 inertial navigation system (INS).
The body-mounted accelerometer signals are clearly very noisy, mostly due
to the vibration of the aircraft's structure. The vertical accelerometer
reading is compensated for the one-g reading it would normally have in
steady, level flight before it is telemetered to the ground. The LTN-51
output signals are much smoother because the unit has a "sum AV" mecha-
nization; i.e., the instrument sums increments of velocity in discrete
counts, and acceleration is inferred by differencing the sum at the be-
ginning and end of a time interval and dividing by the length of the
interval. For the plots the interval was 0.5 sec, so the result is effec-
tively the average acceleration for each half second. The filters use an
interval of .05 seconds; nonetheless, the INS signals are much smoother
than the sampled analog signals of the body-mounted accelerometers. Be-
cause the INS uses a stabilized platform, the x and y acceleration outputs
clearly show the two turns of the helix.
26

Figure 8 presents the time histories of residuals for the MLS, TACAN,
baromet ric altitude and radio altitude measurements shown on Fig. 5. These
residuals are differences between the measurements and computed measurements
based on the aircraft position derived from the ground tracking radar data.
One cannot look at these residuals as true measurement errors since the
radar tracking system has errors. Hence, if the plots do not behave as
expected, the fault may lie in the tracking radar data as well as in the
MLS, TACAN, or other measurements.
The MLS range residual has an average value of about -12.2m (-40 ft)
with high frequency noise of perhaps 3m rms. The bias and lower frequency
component of the residual could be in the MLS measurement or it could be
caused by radar tracking errors.
The average MLS azimuth residual is -0.25 degrees. High frequency
noise and very small anomalies occur in this residual at the same time as
they occur in the actual recorded measurement (Fig. 5). Therefore, the
noise and anamolies are indeed present in the MLS azimuth measurement and
are not caused by any radar tracking errors. The bias, however, may pos-
sibly be attributable to the radar tracking data.
The MLS elevation data are obviously very bad until about 140 seconds.
The residual at about 200 seconds is also due to an error in the MLS
measurement. It is known that this residual is not due to an error in the
tracking radar data because, if it were, a similar residual would occur
in the barometric altimeter data.
The TACAN range residual shows an apparent bias of about 107m (350 ft)
with high frequency errors having an rms of about 30m (100 ft). The TACAN
bearing residual shows these data have little utility for nearly the com-
plete helix. During times when these data are good, the scale is too
large to conclude anything with regard to the residual characteristics.
The barometric altitude residual shows characteristics of bias and scale
factor errors. The bias starts at about -23m (-75 ft) at 805m (2640 ft)
27

uIV
Er
uEYF
to
GvvIr
O
N(tl
v
.O
O
O
,O
1
O
U
1+OLp:M
O!Ei
MF.-IR)7brlyva
v
aoc
w
uw
O coI 1
O N ^7
N ^.-1 N
d1 I
00 .^C t0
O.d
8N ^
.^ v^a
'"4 O •-1 N1 1
s
O8 .-1,^ cd 00
Ll
s w 28
O O O^ N
CO,-1u>vw .^
a^v^ vx

ww
u'1 O v1
cc
cc NF R: a
O O O
d M 7 00U W v C)
F a^i y ^
00 a
O v1
Omu • ^
1+ b e0u ^ ^
w to E29 o wvm 9x0o
N O NN N
C/ ri
7 7
,fir Ece w tn
d a
^ OO
C O O
ww
O 0
ua
aiEH
wpC
U
O
vH7mtL
ww
OO 'j

altitude MSL and reduces to around -9m (-30 ft) at 427m (1400 ft) altitude.
The high frequency noise has an rms of about 6m (20 ft). The radio alti-
tude residual indicates a scale-factor error and some anomalies before
300 sec which are believed to be caused by the terrain. The spike in the
residual at about 305 seconds can be seen in the barometric altimeter
residual and the MLS elevation residual. Therefore, it is assumed that
this spike is not caused by the radio altimeter but by bad radar tracking
data at this time. The scale-factor error may be caused by any of the
following:
1. scale-factor error in the radio altimeter,
2. slope of terrain the aircraft is flying over, or
3. radar tracking errors.
It is not known at this time which source is the primary contributer.
30

NAVIGATION SYSTEMS DESCRIPTION
Overview
All the navigation systems described here provide the estimated posi-
tion and velocity of the VTOL aircraft by combining inertial measurements
with measurements from the navaids. Figure 9 shows how the navigation
systems are implemented for tests in the V/STOLAND avionics system. The
basic computer contains all the primary software for operating the
V/STOLAND system. The research computer is strictly for research
investigations and the researcher supplies software for the particular
experiment under test. The basic software is designed such that many different
types of research experiments can be conducted without changing the basic program.
As shown on Fig. 9 all data for navigation experiments except the
LTN-51 INS accelerometer outputs come into the basic computer. All data in-
put to the basic computer are also sent to the research computer. The
switches shown on the figure are under the pilot's control. As can be seen,
he may either use complementary filter or Kalman filter state estimates for
driving the basic computer's display, guidance and control logic. The re-
search-mode button controls which state estimates are used. Also by use of
keyboard inputs, he may select either the strapped down IMU or the LTN-51 as
the source of acceleration input to the complementary filter in the basic
computer or the Kalman filter in the research computer.
Figure 10 is a block diagram illustrating the general structure and
functions of all the navigation systems. The inertial measurement unit
(IMU) provides sufficient data for calculating the aircraft acceleration
in a runway referenced coordinate frame. The accelerations are integrated
to keep the position and velocity estimates current. When hardware dis-
cretes indicate the navaid measurements are valid, their values are
compared with estimated position data. If the difference satisfies the
data rejection algorithm, then state corrections are calculated by a
specified algorithm and added appropriately to the estimated state.
31

IT—. tIITu
1
0y Q1 !d
c ww^o a a -^ ^ ^a>F ^6o0oG
— — — --- —
rwvaa9Uru
I of E ++W
a t0 ^
ac x w
L
^ ^ 0um uI
a .a c a
U AoaD C
Iu ca
I ^00

O
C d +Oi
C a4 G! ^0O ^+tl1N
u 47 a+.^uwc^omw w w -.+ E2 E"t
aaMw14 ++ tf1 Ou t0 m V 00ep a+ d C^ h E ee ep
+.Iu
a du wc wu CH u
EdV
cO
OD
mzwO
Ee^woD
,aD
uO
iC
0
Gl
w7e0Mw
0wa+c
cgIv w V
O w
OyuV
V V 10tl 0 '^
rl ^^ rl rl
pr > G^ w wc 7
w
CO 00
0 a+ .+
.+ A t0 C OiA u > f0 CEM u z k-4
O
u >e^E 'v
PO4i aA+
y v Vv M O
^ ^0 (n .4
u 404. >c c a,
•4w cocL W Fy W t0^C ww Qlw w01 Au epu 3 Cro C O
O .^w uv ^p
a wV d7 ^rl y d GI
0 ++ E u^+ c o u
U dsw Ew wC w«a 7
H3 RIA vw E
wC
wOac
33

The vertical channel is handled independently of the level channels in
the systems described. The vertical channel 1.9 started using the raw
barometric altitude reading for the vertical position at the initialization
time point, and zero initial value is placed on the vertical velocity.
When MLS elevation data become available it is used as the primary reference
until the aircraft gets below about 152m. At this point the radio altimeter
measurements become the primary vertical position reference.
For the level channel, x-y position initialization is performed using
MLS range and azimuth if available; otherwise, the less accurate TACAN range
and bearing measurements are used. Airspeed and aircraft heading measure-
ments are used to initialize the level components of velocity.
The automatic measurements selection algorithm for the level channels
will use MLS range and azimuth if available; otherwise, TACAN measurements
are used. If neither source of data is available, a dead-reckoning mode
involving either inertial information only or inertial information and
airspeed measurements is used.
The navaid reference changes as the aircraft enters the terminal area
and procedes to the landing. During the transition from one reference to
the next, transients in the estimated state occur. The block in Fig. 10
called "navaid transition smoothing" is used in the Kalman filter to pre-
vent these transients from causing rapid aircraft maneuvers. The transi-
tion-smoothing logic does not exist in the complementary filters.
34

Complementary Filters
The complementary filters which are used in the flight tests of the
V/ST©LAND avionics system were initially developed by Sperry Flight Systems
(Ref. 2). The availability of some new data sources (MLS and INS accelero-
meter data) &ad information gleaned from flight test results have led to
a number of modifications. The complementary filter as currently
mechanized in the Sperry 18198 basic computer is summarized in this section.
Figure 11 is a block diagram of the complementar: • filter used in the
V/STOLAND system. The MLS range, azimuth, and elevation, the TACAN range
and bearing and the VOR/DME range and bearing measurements are fed through
first-order pre-filters. In order to pre lags caused by the pre-filter
time constants, the estimated rates for each of the measurements based on
the current state estimate are also fed to the pre-filter. Reference selec-
tion logic either manually through push buttons or automatically (if the
auto nav mode is selected) determines which pre-filter navaid data are
used for the raw x-y calculations. The raw x-y data And the acceleration
in the runway reference frame as calculated from the raw inertial data are
fed to the two third-order x-y navigation filters. The acceleration input
source may be either the strapped-down IM or the LTN-51, as was shown
in Fig. 9.
In the vertical channel the pre-filtered MLS elevation data and raw
barometric and radio altimeter altitude data are fed to the reference
selection logic. The reference selection logic is fully automatic for the
vertical channel. The barometric altitude is used until MLS elevation data
are valid. This is followed by a blending period where MLS elevation and
estimated x-y coordinates are used to calculate one source of altitude and
the barometric altitude is the second source. The raw altitude used for
the filter is a linear combination of the two altitude sources where the
weight shifts with time from all barometric data to all MLS altitude data.
The total time for the blend is 60 seconds. As radio altimeter data become
available. radio altitude and the other source of altitude (biased baro,
35

o^a^o
N V (r ^+ 941 O1 M N
W rl 'C v r"td 4J ^ ^ AfocNto(eu
n+ ( >%uto ( x c> O41 +trl '^ 1.1A/ • t0
x .^N 7
ro t0oc v
4)
C ++V v►. u
d%6wtV Ala (A
WvcW
Sd
ESd
O4l
V
"4
toro2
VILO V'O:1 L1v +4Tt uWv .r 2
O w F Ob+ 'O >
eY
ciw
tp LV !dC ^
rl Q! Vto E wY+ 7u 1+Ir Vd dl 't7c c c
^ ww .+4)tr. Vsw u A u4 .. > du M 1 Sv. w ep V
0al t0
+ a o
M
O HW 41
Vd
+t
•+ t0.^ tJO ti.
N
tr >
4+ c^v 0
w Ner ►.
? (> 'p o0 dI+ ad v
4 (x ., > .,
Z ^
t:x
IAM
O ^+w .^>, W
x .,>
M .Ot
u c
c O0 +rJ V47 ^►/ rt^ Al 7N v Vro ro..tuwro^ u
M6Y
Mw
tow
tita
Yi
f:Ntz
R0
uc
a
uwtow
36

blended baro-MLS, or MLS only) are also blended. In this instance the
blending favors radix, altitude as the altitude decreases. At 61m altitude
the blending ceases and the radio altimeter is the source. The raw
altitude and the vertical acceleration are fed to a third order navigation
filter for the altitude channel.
Figure 12 is a block diagram of the pre-filter., . .sed in the comple-
mentary filter. The filtered measurement is subtracted fror the raw
measurement and the difference sent to a tolerance test. Ii the tolerance
is exceeded, the raw measurement is rejected. If the tolerance test is
passed, then the error signel is limited before being multiplied by the
reciprocal of the time constan _ and integrated. The estimate: g ate for
the measurement is fed directl ^ to the integrator for the fi]terec is,!asure-ment. The table on Fig. 12 gives the tolerance, limit level and time
constants used for the pre-filters in the V /STOLAND complementary navigation
filters.
Figure 13 shows the third-order navigation filter for the x channel of
the complementary filter. The y channel is identical in structure and filter
gains. The switches in the figure are shown in the normal "navigation valid"
operation of the system. In this mode of operation the estimated position
xR is subtracted from the raw position x'R and the difference used as feed-
back through gains wlx' W 2 and w 3 into the three integrators of the filter.
The measured acceleration from the selected source feeds the integrator
whose output is the estimated velocity x R. In this mode of operation the
values of the filter gains depend on the source of the navaid -derived position.
It should be noted that the pre-filter time constants shown of Fig. 12 also
depend on the source of the navaid -derived position. The combination of
the filter gains and the pre-filter time constants were selected so that,
when MLS is in use, the overall complementary filter is more responsive in
tracking the navaid -derived position than when TACAN or VOR/DME is in use.
It should be mentioned that the pre-filters used in the V/STOLAND navigation
37

uu ar uC N 01
0! EL '4 f0 -t Nt0 01 F C
cg^ wU)0J
00^L OD
^u 00 00nL+
0! w 0! W 0) 0J w
N N Nu^4 O O O-,40) O N O O N O O O N O
> .4 r4 .t '-4 -4 .t .-4 r-1 r4 .t
a .°'a +I +I+I`, +I +I+Iv +1 +I +I+I
v
n n i.u u uv w w w
boG v e o w E o a^i a^i E oeo b n o "v fl- o "o 1 0 o1+ Ln Ln to Ln Ln Ln01 Ln t r4 Ln 7 -4 v1 N t •-1
EO +I +I +1 +I +Ivl +I +I +I`+,I
cowaru^iW0l
aas
^J
W0
WN0JL0J
N
tEabc
ENNw00
wLl
uO
Qa
CaJ
^iw
roas
7
e0WE
3to
N
01
00
w
-W
Ol 00 00 7> E
0) W W f]G 00 00 W 00w
a w ¢ aN u U w P: W to W
Fz F > >
38

.XR
R
R
1
Notes:
XR = acceleration from IMU
XR = navaid-derived position from prefilter
XA = A/C velocity relative to airmass (X-component)
k= wind velocity (X-component)
DR = dead-reckoning mode
I = initialization
Figure 13. Third-Order Navigation Filter for x Channel
39

system cause coupling to exist among all the channels. As a result, the
stability of the navigation system is difficult to analyze, and simulated
results were used to select the gains.
In the normal mode of operation the components of wind are estimated
in a runway referenced coordinate frame. This is achieved by sending the
difference between measured airspeed x and ground speed x R into a first
order filter with a 100 second time constant. In the dead reckoning mode
the wind estimate is frozen and used with the airspeed and ground speed
data to stablize the ground velocity. In this instance the estimated
ground velocity is stabilized at the airspeed value compensated with the
last value of estimated wind. The wind estimate is not used for any other
function.
Figure 14 shows the third-order navigation filter for the altitude
channel. In this instance the configuration and gains are not dependent
on the source of altitude data. When either the barometric or radio alti-
meter is the altitude source, the filter dynamics are as given in the
figure. As a result of the pre-filtering of MLS data and the blending
algorithms, the filter's dynamics change substantially during an approach.
Comments on the V/STOLAND Complementary Filter
The V/STOLAND complementary filters navigation system has some un-
desirable characteristics which should be removed in an operational design.
1. There is no provision for providing smooth transition from one
navaid source to another source. If the aircraft is in the
automatic flight mode, undesirable steering transients occur when
navigation aids are changed (for example, a transient occurs
when switching from TACAN to MLS).
2. The pre-filters used in the V/STOLAND system introduce much
unnecessary complexity without providing any improvements
in performance. There is some evidence from simulation studies
that indicates the performance may actually be degraded.
I
40

.0 L
Oal L.,
z°
rn
u
u
oH ^--I
w•O
4-4 +1
u
O
L y
v Gr-1 yal EU Q1U y.^R1 a o
N yw tq CO N y
Eu aJ aJ
41 0 o OG u L ►+O rl M w
0. L ♦.1E .-i r I a)
u a•C b L
al a1 al •.^•v cucpQ u u
Ai e EM rl -Hu u aJ 3
RI al al >•+
1-4 N Mu u ua! v ar
C14 ON O O
II II II
al
GCcd
Uv.b0uud>a0w
aJu
'74wGOrlAjtoOLr4
coz1+
alV1+O
I.O
1+
rl
H
.-I
al1~
eo•iiw
w

hI
3. The filter is too responsive to MLS measurement errors when
the aircraft reaches hover. This leads to excessive undesirable
maneuvering during the letdown phase.
4. The navigation errors are relatively large during the helix
descent and a moderate time thereafter. The filter is not
responsive enough in tracking the MLS data in these regions.
Kalman Filter
This section describes the Kalman filter navigation system developed
for the V/STOLAND avionics system. The navigation system is a modified
version of the airborne software originally developed and tested in the
STOLAND system (Ref. 3).
Figure 15 is a block diagram of the V/STOLAND Kalman filter navigation
system which is implemented in the research computer. The raw inertial
measurement unit (IMU) data feed the block labeled "acceleration calculations".
The calculations performed in this block depend on which source (strapped
down or INS) of inertial data is used and the selected reference frame for
acceleration bias estimates. The runway-referenced accelerations obtained
from the acceleration calculations drive the navigation equations, which in
turn provide the estimated positions and velocities. These two functions
operate at 20 Hz in the mechanization.
Raw navaid data feed the block labeled "measurement rejection and
preprocessing". Here, hardware valids and software tolerances are used to
establish validity of the measurements. For valid measurements, the differences
between raw measurements and measurements computed from the estimated state
(called residuals) and their associated partials are formed and accumulated. This
lo gic is executed at 10 Hz. Once per second, measurement selection logic
picks the desired set of residuals and partials and sends them to the filter
algorithms. The filter algorithm executes a square-root implementation of
the Kalman filter and produces the estimated error state. The estimated
42

w
M
u0.aar
bGO
G0MuMN
OCL
Mau
MLy
W
Go m
N M G
N 00 uM cc
to cr
z 4!
au
>, Ge^ a^3 wG 41
H dw
C mO GM OL M
N 0 ux w mO 4) •-{N -4 a
a^ uu 1-4u caQ u
uowV-40)4r> a
P
b E
G O^ V
G uM tp
^+ c0
to0 0
CL. A+
Nx0 00N G
Z+^ uo of0 "E OW^4
u ^ CG V741 G V7
x v •° vO w Aj O•4 a U w
LO) 0) me^ •-^ ar41 4! w
O
4!
4Juro
y
V4)iJ
to
E EM w ,CAi 4) u
w .Li w xO
ts. 00
a
u
4J G
4Ei •0w ^^ u uCC 4! M
cC —4 00
cn 3
arwN
V)
GOM000•rl
>0zarLr^
M
GbE
czgCFV]
9wO
rE0w
00,•rQ
uO
W
L4
41wacoMw
c0ucv
Z aOa
I"
Gar
'v EM ar
3 c0 wco > a
z rparE
43

error state is used to correct the position and velocity estimates, the
acceleration bias estimates, and the TACAN range and bearing bias estimates.
It also feeds the smoothing logic along with the estimated state. The
smoothing logic prevents abrupt changes in the position and velocity which
are sent to the basic computer for display, guidance and control purposes.
The filter algorithm is actually two independent implementations consisting
of an x-y filter and a z filter. The level channels (x-y filter) use the
MLS range and azimuth or the TACAN range and bearing to estimate the 8-ele-
ment error states given by
dx(1) - error in x component of position, (dx)
dx(2) - error in y component of position, (dy)
dx(3) - error in x component of velocity, (dx)
dx(4) - error in y component of velocity, (dy)
dx(5) - error in 1st component of level acceleration bias, (b ax )
dx(6) - error in 2nd component of level acceleration bias, (bay)
dx(7) - error in TACAN range bias estimate, (b r)
dx(8) - error in TACAN bearing bias estimate. (b^)
The acceleration bias estimates can be in either the runway reference frame
or a path-referenced frame depending on pilot input via the keyboard.
The implementation has both automatic measurement selection and manual (by
means of push buttons) modes. In the automatic mode, MLS will always be
used if both range and azimuth residuals are available from the preprocessing
logic.
The vertical channel ( z-filter) uses the barometric altitude, altitude
computed from MLS elevation or radio altimeter altitude to estimate the
3-element error state given by,
dz(1) - error in z component of position, (dz)
dz(2) - error in z component of velocity, (dz)
dz(3) - error in vertical acceleration bias, (baz)
44

For the z channel the measurement selection algorithm is automatic only.
Radio altitude is used when the radio altimeter output indicates the alti-
tude is less than 137m and the hardware flag indicates valid data. MLS
elevation data will be used otherwise if hardware and software tests show
it is valid. Barometric altitude is used in all other cases. A special
algorithm is used to estimate the bias in barometric altitude and to decay
this estimated bias, as will be explained.
The overall Kalman filter mechanization for the V/STOLAND system is
very similar to the STOLAND system discribed in Ref. 3. The next two
sections describe the areas where differences exist. The reader should
consult Ref. 3 for those areas not covered here.
Level (x-y) Filter
The V/STOLAND x-y filter diff:rs from the STOLAND x-y filter in the
following areas.
^. MLS range and azimuth are used instead of the MODILS range and
azimuth.
2. Airspeed is only used in the initialization of the x and y
components of velocity. Winds are not estimated in this
system.
3. The estimated acceleration biases can either be in the runway
frame or in a path-referenced frame. The option is controlled
by the pilot.
4. The source for runway -referenced acceleration can be either
the strapped-down IMU or the LTN-51 INS. This option is also
selected through the keyboard.
5. Initialization mode uses the MLS data, if available; otherwise,
TACAN data are used.
45
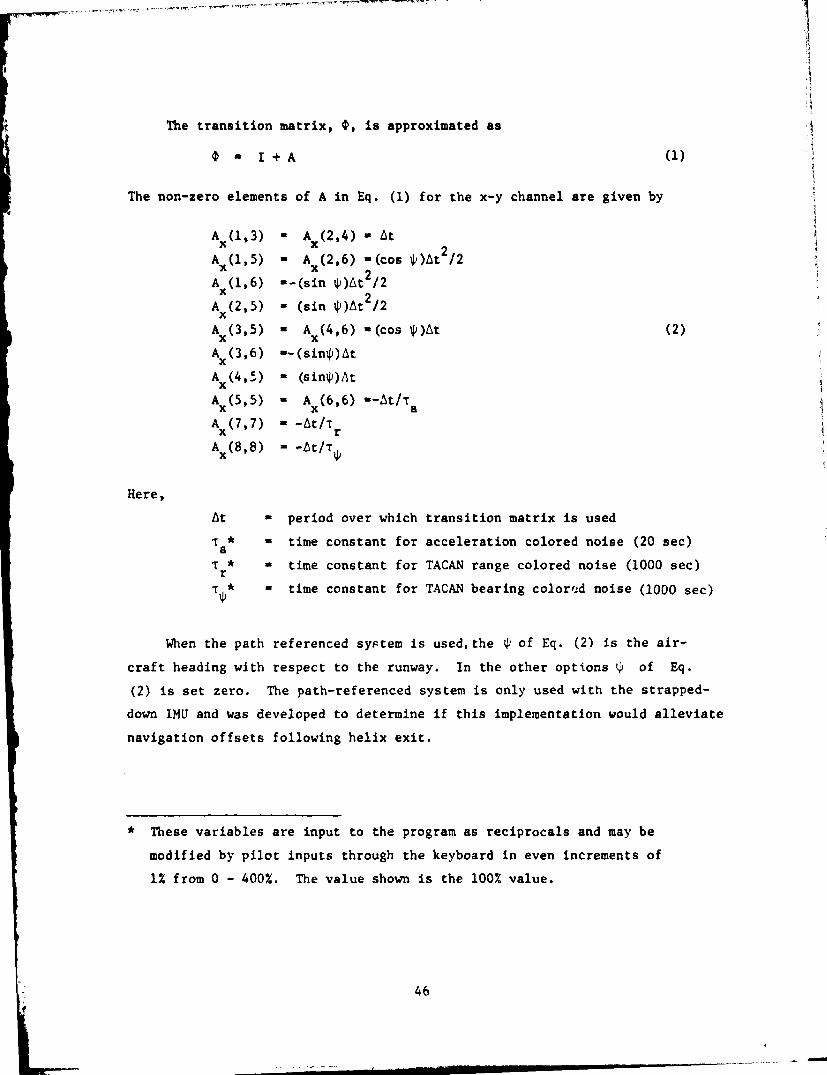
The transition matrix, t, is approximated as
0 - I + A
The non-zero elements of A in Eq. (1) for the x-y channel are given by
ii,i
(1)
1
S
5
Ax(1,3)
Ax(1,5)
Ax(1,6)
Ax(2,5)
Ax(3,5)
Ax(3,6)
Ax(4,-)
Ax(5,5)
Ax(7,7)
Ax(8,8)
- Ax (2,4) - U- Ax (2,6) -(cos Oft /2--(sin ^ )At2/2
- (sin ^)At2/2
- Ax (4,6) -(cos ^ )At
--(sin^)At
- (sin t )At
- Ax (6,6) --At/Ta
- -At/Tr
- -bt/T)^
(2)
Here,
- period over which transition matrix is used
- time constant for acceleration colored noise ( 20 sec)
- time constant for TACAN range colored noise (1000 sec)
- time constant for TACAN bearing color %d noise (1000 sec)
When the path referenced system is used,the ^ of Eq. ( 2) is the air-
craft heading with respect to the runway. In the other options y of Eq.
(2) is set zero. The path-referenced system is only used with the strapped-
down IMU and was developed to determine if this implementation would alleviate
navigation offsets following helix exit.
* These variables are input to the program as reciprocals and may be
modified by pilot inputs through the keyboard in even increments of
12 from 0 - 400 %. The value shown is the 100 % value.
At
Ta
T *r
T
46

The non-zero elements of the forcing matrix Oux (see Eq. (A.4) of
Ref. (3)) are given as
4^ux(3,3) - a =t
mux(5,5) - Oux (6 , 6) = as 2nt Ta (3)
4)ux (7,7) - or tat/Tr
4ux (8,8) - 00 2-"t T^
here At - period of the covariance matrix update (1 sec)
0 = standard deviation (std) of velocity noise ( . 0762 m/s)
as= std of acceleration colored noise ( . 1524 m/s 2)*
o r - std of TACAN range colored noise (304.3 m)*
v^ = std of TACAN bearing colored noise (2 deg)*
The runway referenced accelerations are given by
x xIMU + baxcos4) - b ay sinty
y y IMU + baxsint + bay cosh (4)
where ^ in Eq. (4) is the aircraft healing with respect to the runway
when the path-referenced system is used and zero otherwise.
MLS range and azimuth - The MIS measurements used in the x-y portion
of the Kalman filter are range and azimuth from a co-located DME transponder
and azimuth scanner. The range measurement is modeled as
Ymr (x-xm)2 + (Y-ym ) 2 + (z-zm) + qmr . (5)
Here,
xm,ym,zm = coordinates of the MLS transponder and scanner
with respect to the runway reference frame,
qm r
= the random noise error in the range measurement.
* The standard deviations may be modified by pilot inputs through the
keyboard in even increments of 1% from 0-4002. The value shown is
the 100 % value.
47

The estimated measurement is computed from
Y m r ^/(x-xm)2 + (y-ym) + (i-sm ) (6)
Here, x and y are state variables obtained from the x -y filter, and z
is obtained from the z-filter.
The non-zero elements of the row vector H for the range measure-
ment are calculated from
Hmrx(1) - (x-xm)/Ymr (7)
Hmrx (2 ) - (Y-Ym)/Ymr
The variance of the random noise error in the range measurement is
assumed to be a constant given by*
Qmr - (18. 3 m) 2(8)
The MLS azimuth measurement is modeled as
Yma - tan-1(-(Y-ym)/-(x-xm)) + qma . (9)
Here, qma is a random error in the azimuth measurement.
The estimated measurement is computed from
Yma - tan-11-(Y-Ym)/-(x-xm))• (10)
Again, x and y are state variables of the x-y filter, and z is obtained from
the z filter.
* The standard deviations of the MLS range and azimuth are keyboard input
quantities with range 0-400X. The values shown are 100% values.
48

The non-zero elements of the row vector H for the azimuth measure-
ment are given by
Hmax(1) (Y-Ym) /I(z-xm)2 + (9-ym)21 (11)
Hmax(2) - (x-xm) /[(X
-xm)2 + (Y-ym)2)
Qma` (.1 deg) 2(1?1
x-y Filter Initialization - As mentioned previously, the V/STOLAND
x-y filter will be initialized from MLS range and azimuth if both are valid
at the time the initialization is requested. Otherwise, TACAN range and
bearing are used if they are both valid. Initialization will not take place
until one or the other source of raw x-y data is available. The TACAN
initialization equations are given in Ref. 3. The MLS initialization
equations for the state and the square-root covariance are given here.
x - x - r cob (Y ma )
y M Ym - r sin (Y ma)(13)
Here
2 2rc -
Ymr - hmA
hma - altitude of aircraft above the MLS station computed
frum barometric altitude.
The velocity components are computed from airspeed using equations given
in Ref. 3.
The non-zero elements of the initial square root covariance matrix
W for the x-y filter are given for MLS initialization by the following:
I
49

Wx (1,1) - 0mrcos(Yma)
Wx (1,2) - omrsin(Yma)
Wx (2,1) - a Ina (ym-y)
Wx (2,2) - oma (xm x)Wx (5,3) - -cos(O
i_^r ) va'
Wx (5,4) - -ain%i-;'r)ava,Wx (6,3) - vyo^ i ,
Wx (6,4) - -vxa^i
wx (7.3) oWX .
Wx(8,4) - oWY
Wx (9,5) oaxWx (10,6) - aay
amrstandard deviation (std) ofMLS range noise (18.3m)
ama - std of MLS azimuth noise (.1 deg)
Ova std of random error in air-speed measurement r 0.61 m/sec.
std of bias error in initialheading `. 2 deg.
C - std of x component of windk^
- 6.1 m/sec.awy - std of y component of wind
6.1 m/sec.
Q - acceleration random errorax.v
std - .3 m/sec'
z Filter
The z filter for the V /STOLAND system is a 3-state Kalman filter
as was mentioned earlier. The barometric altitude bias is estimated in an
ad-hoc manner external to the filter. The filter is initialized from baro-
metric altitude information; and the estimated bias in barometric altitude,
estimated vertical acceleration bias and the estimated vertical velocity
are set zero. Following initialization the operation of the filter is as
described in the following.
a) Only one source of altitude measurement is processed by the
Kalman filter at a time. If (i) the radar altimeter valid is
set, (ii) the estimated altitude above ground is less than 183m,
and (iii) the radio altimeter altitude measuremen t is less than
137m, then the radio altimeter measurement is processed. If (i)
radio altimeter measurements fail the above tests, ( 11) the MLS
elevation valid is set, (iii) MLS elevation is less than 100
,
and (iv) MLS range and azimuth are being used by the level Kalman
filter, then the MLS elevation measurement is processed. If
both radio altitude and MIS elevation are not available, then the
barometric altitude measurement adjusted for the current barn
altitude bias, if any, is processed.
50
77WQ@ e. -
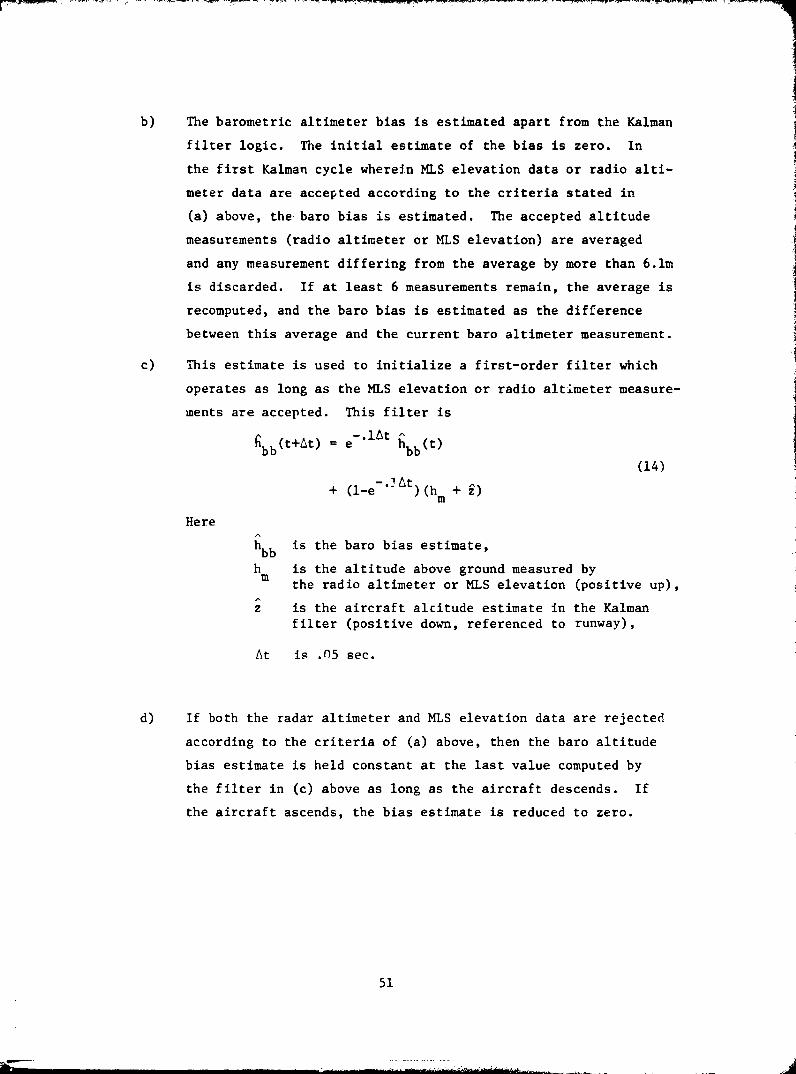
b) The barometric altimeter bias is estimated apart from the Kalman
filter logic. The initial estimate of the bias is zero. In
the first Kalman cycle wherein MLS elevation data or radio alti-
meter data are accepted according to the criteria stated in
(a) above, the baro bias is estimated. The accepted altitude
measurements (radio altimeter or MLS elevation) are averaged
and any measurement differing from the average by more than 6.1m
is discarded. If at least 6 measurements remain, the average is
recomputed, and the baro bias is estimated as the difference
between this average and the current baro altimeter measurement.
C) This estimate is used to initialize a first-order filter which
operates as long as the MLS elevation or radio altimeter measure-
ments are accepted. This filter is
fibb(t+Lt) = e-.10t hbb(t)
(14)
+ (1-e-* YAt ) (hm + i)
Here
hbb is the baro bias estimate,
h is the altitude above ground measured by
the radio altimeter or MLS elevation (positive up),
z is the aircraft altitude estimate in the Kalmanfilter (positive down, referenced to runway),
At is .05 sec.
d) If both the radar altimeter and MLS elevation data are rejected
according to the criteria of (a) above, then the baro altitude
bias estimate is held constant at the last value computed by
the filter in (c) above as long as the aircraft descends. If
the aircraft ascends, the bias estimate is reduced to zero.
51

'1
This is done in steps of 1/8th of its last filtered value for
each 61m gained above the altitude where the filter ceased,
until the absolute value of the remaining bias is less than 2.4m.
This 2.4m tolerance avoids possible difficulties due to com-
puter truncation errors and is small enough that it will not
affect navigation performance. For example, suppose the bias
filter has a current estimate of 16m when the MLS elevation
data which were driving the filter become unacceptable, and
suppose this occurs at 300m altitude. As long as the air-
craft descends, the bias remains at 16m. If the aircraft
reached 180m and then climbs, the baro bias estimate will be
reduced to 14m at 361m altitude, 12m at 422m altitude, etc.
At 727m the bias estimate is reduced to 2m, and no further
reduction will take place.
e) If the MLS or radar data again become acceptable within 20
seconds, the bias filter resumes operation at the then pre-
sent bias estimate. If more than 20 seconds elapses, the
initialization procedure described in (b) above is repeated
and the filter begins operation with that bias value.
f) If the bias filter is being driven by MLS elevation data when
radio altimeter data become acceptable, then (i) the bias
filter is reinitialized according to the procedure in (b)
using the radio altimeter data, (ii) the bias filter is
driven by the radio data alone, and (iii) the MLS elevation
data, although acceptable, are ignored.
The 3-state z filter and ad-hoc baro bias algorithm were developed
for V/STOLAND for the following reasons.
(1) The aircraft should fly baro-referenced altitude in the terminal
area, even if a good source of true altitude is known, because
it is assumed other traffic is also using baro altitude.
(2) As the aircraft descends to land, true altitude must be the
desired goal of the navigation system. Should MLS fail or not
be available during part of the approach, then the best procedure
for estimating altitude is the baro altitude measurement adjusted
for the last calibration of the bias.
52
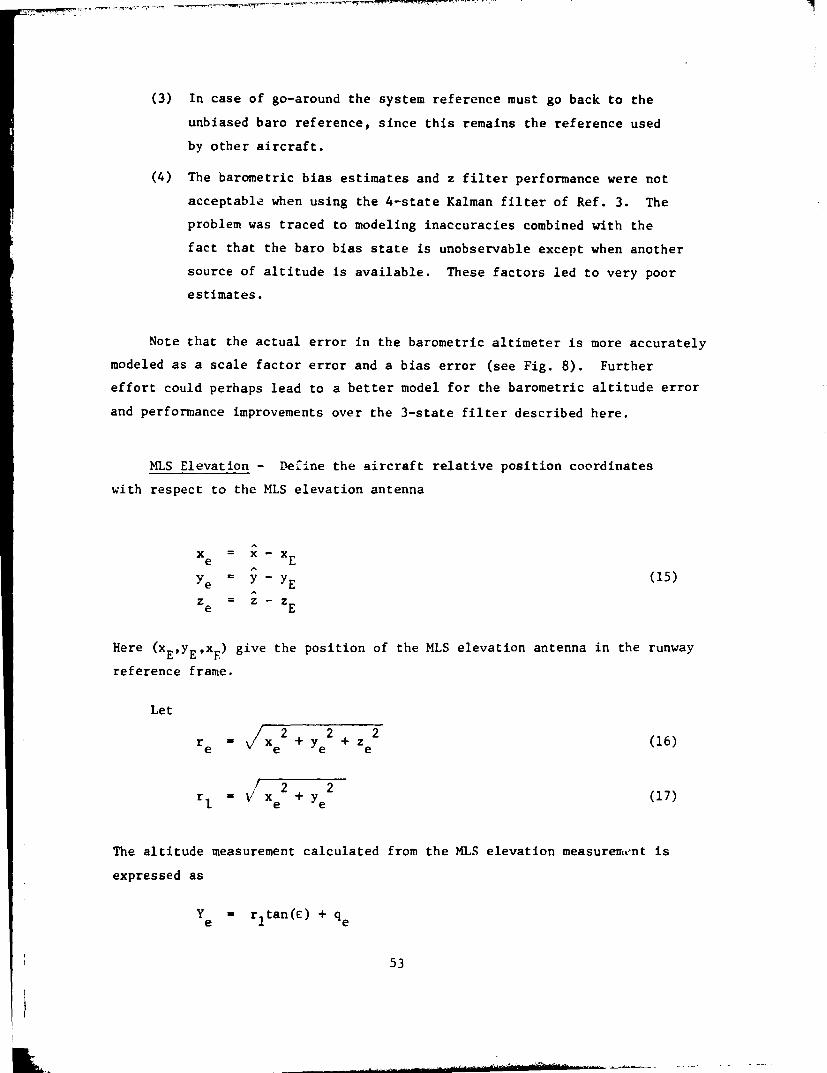
(3) In case of go-around the system reference must go back to the
unbiased baro reference, since this remains the reference used
by other aircraft.
(4) The barometric bias estimates and z filter performance were not
acceptable when using the 4-state Kalman filter of Ref. 3. The
problem was traced to modeling inaccuracies combined with the
fact that the baro bias state is unobservable except when another
source of altitude is available. These factors led to very poor
estimates.
Note that the actual error in the barometric altimeter is more accurately
modeled as a scale factor error and a bias error (see Fig. 8). Further
effort could perhaps lead to a better model for the barometric altitude error
and performance improvements over the 3 -state filter described here.
MLS Elevation - Ueine the aircraft relative position coordinates
with respect to the MLS elevation antenna
I
x = x - X
ye y YE= ize - zE
(15)
Here (xE ,y E ,xF) give the position of the MLS elevation antenna in the runway
reference frame.
Let
re =Vlf x e 2 + y e 2 + z e 2 (16)
r l x e 2(17)
The altitude measurement calculated from the MLS elevation measurement is
expressed as
Ye = r1 tan(E) + q
53

Here
c - the MLS elevation measurement,
qe = the random noise error in the pseudo-altitude measurement.
The estimated measurement is given by
y - _Z (19)e
The non-zero element of the row vector H is given by
HeZ (1) _ -1 (20)
The variance of the random noise error in the measurement is assumed to be
the range-dependent quantity
Qe = (aere)2
(21)
He re
a = std of MLS elevation noise (.1 deg*),
re = calculated ranged to MLS antenna,Eq. (16).
Keyboard Controlled Ouantities
The V/STOLAND system is designed with a pilot-operated keyboard for
changing program quantities. Table 1 shows the Kalman filter quantities
which may be changed by keyboard entry during flight tests. The software
is arranged so the pilot enters the desired percentage of a nominal value.
The software checks to see if this percentage lies within the range shown
in the table and, if so, modifies the quantity to the desired percentage.
If the input lies outside the allowed range, then the input is limited to
lie within the range, and the change is given to the quantity.
* The std of the elevation may be modified by keyboard input.
54

Table 1
Quantities Modifiable through the Keyboard
Quantity Symbol Nominal (100%) Value Range(%)
std acceleration ax .15m/s2 0-400noise x channel
std acceleration ay .15m/s2 0-400noise y channel
reciprocal of 1 /T .05sec-1 0-400time constant
ax
x channel
reciprocal of 1/ ay .05sec-1 0-400time constanty channel
Initial std of - .15m/s2 0-400acceleration errorx-y channel
MLS range a 18,3m 0-400noise std
mr
MLS azimuth ama .2deg 0-400noise std
TACAN range Gtr 183m 0-400noise std
TACAN bearing atb 2deg 0-400noise std
Barometric alti-ahb 60m 0-400
tude noise std
MLS elevat4.oname
.2deg 0-400noise std
Radio altimeter C, .3m 0-400noise std
r1
std accelerationaaz
.15m/s2 0-400noise z channel
reciprocal of 1/Taz .001sec-1 0-400time constantz channel
Option flag for - 100 +100 = strapped-downacceleration -100 = LTN-51 INSsource
Option flag for - 100 +100 = runway referenceacceleration bias -100 - path referenceframe
55

Smoothing Logic
The smoothing logic used in the V/STOLAND system is very close to that
used in STOLAND (see page 114-115 Ref. 3). The only significant difference
is in the decay algorithm for the position and velocity smoothing vector.
In Ref. 3. this algorithm is given as
cx (t + At f)
cv (t + At f)
e-.05/Txcx(t)
e -.05 /T Vc (t)v
(22)
(23)
In the V/STOLAND system the change in c and c v given by Eq. (23)
is formed as
,^cx (t + A t f ) = (1 - e- .05/Tx)cx(t)
OcV (t + A t f ) - (1 - e-.05 /Tv)cVW
If the absolute value of the change is less than a desired input value,
then Eq. (22) is used. 7f the change is larger than the limit value, then
the limit value is used with the appropriate sign to decrease the magnitude
of c and cx v.
Current limit values used in the V/STOLAND system are:
Lx,y - 3m/s for x-y position changes,
Lz- 1.5m/s for z position change,
LX53'9Z - .61m/s/s for velocity changes.
The time constants Tx and TJ are currently set at 10 seconds.
This algorithm serves the purpose of smoothing the once-per-second
changes calculated by the Kalman filter algorithm as well as smoothing the
transition when navaid sources are switched. For example, the large position
change of perhaps 100m which occurs when switching from TACAN to MLS will
require about 33 seconds to get into the position estimate which drives
the guidance display and control logic. The change is slow enough that
only a very minimal, smoothed transient in aircraft maneuvering occurs.
56

CONCLUDING REMARKS
Navigation systems for re%earch investigation in the V/STOLAND avionics
system have been described, These systems are currently being studied in
flight tests to evaluate their performance, and further refinements are
likely.
The general problem of operating a VTOL aircraft from a heliport in
all-weather conditions appears to require higher accuracy and smoothness
of the estimated state than for a CTOL aircraft. These requirements arise
in part due to the small size of the heliport. In addition, lateral
maneuvers of the aircraft during the final letdown phase are intolerable
to most pilots.
Flight tests of these systems will provide information on whether a
single MLS system at an airport terminal can satis fy both VTOL and CTOL
aircraft landing navigation requirements as well aL information on the
requirements of the onboard inertial sensing and so"tware sophistication
for the VTOL system.
57

REFERENCES
1. Desirazu, R., "V/STOLAND Digital Avionics System for UH-1H HelicopterOPERATORS MANUAL", Sperry Flight Systems PUB. No. 71-0903-00-00,October 1976.
2. Desirazu, R., "V/STOLAND Navigation Specification and Program",Sperry Flight Systems PUB. No. 71-0441-00-02, February 1978.
3. Schmidt, S.F., Flanagan, P.F., and Sorensen, J.A., "Developmentand Flight Tests of a Kalman Filter for Navigation During TerminalArea Landing Operations", :NASA CR 3015, July 1973.
I