Embed Size (px)
Citation preview

Copyright Statement
This copy of the thesis has been supplied on the condition that anyone who consults it is
understood to recognise that its copyright rests with its author and that no quotation from the
thesis and no information from it may be published without the author’s prior consent.


The Bioavailability and Assimilation of Dietary Zinc in
Rainbow Trout (Oncorhynchus mykiss)
By
Daniel J. Leeming
A thesis submitted to the University of Plymouth
In partial fulfilment for the degree of
DOCTOR OF PHILOSOPHY
(June 2013)
Department of Biomedical and Biological Sciences
Faculty of Science and Technology
In partnership with Alltech Inc. Biotechnology

i

ii
The Bioavailability and Assimilation of Dietary Zinc in
Rainbow Trout (Oncorhynchus mykiss)
Daniel J. Leeming
ABSTRACT
This study examines three possible methods for improving the digestibility and
bioavailability of zinc to rainbow trout (Oncorhynchus mikiss). The first method was to
examine the availability of the zinc utilisation from commonly used protein sources; the
second was to assess the efficacy of the upstream use of an enzyme treatment of the raw
materials; the third was to assess the use of organically complexed mineral supplements as
opposed to the inorganic salts widely used at present.
The first section indicated that the zinc from the soyabean meal was the most available
(49.4%). The zinc digestibilities of the animal based protein used in this current study were
15.1% for LT94 fish meal, 26.6% for the Provimi 66 white fishmeal and 15.8% for poultry
meat meal. The zinc in the maize/corn gluten meal was 31.9% digestible and from the NuPro
26.1%. Gram for gram maize gluten meal supplied the least amount of zinc to the fish (3.66
mg per kg). Based on these results the diets for the subsequent supplementation trials were
formulated. The liver, eye and caudal fin were identified biomarkers of a severe zinc
deficiency.
The second part of the study revealed a soybean product, treated by exogenous enzymes, had
a higher phosphorus digestibility, (49.0%, vs. 36.6%) and zinc digestibility (30.7% vs. 7.9%)
The treatment did not improve the protein digestibility (85%).
The third part of the study showed the organic source proved more digestible than the
inorganic, 37.4% and 26.9% respectively. The fish fed the organic source maintained a
higher level of zinc in both the eye and caudal fin. The liver zinc levels were unaffected by
both dietary level and zinc source. Analysis of the liver for a zinc dependant protein showed
that under stress conditions only the organic supplemented fish were able to synthesis this
protein. The analysis of the mRNA levels coding for this protein indicate the fish on both
zinc forms up regulated the production of the mRNA to the same extent when stressed.
Finally this study also examined the viability of using a stable isotope to identify different
‘preferences’ for one form of supplementation over the other in different tissues. This
method illustrated a tissue dependant difference to how the fish attempted physiologically to
compensate for zinc deficiency. The rate of turnover was fastest in the liver, then the caudal
fin and then the eye, and also showed that when the diet was more deficient there was an
increased ability for the tissues to take up the organic form.

iii

iv
Home Office Statement
All experimental work involving animals was carried out in accordance with the 1986
Animals Scientific Procedures Act under Home Office project license #30/2644 and personal
license #30/8705
v
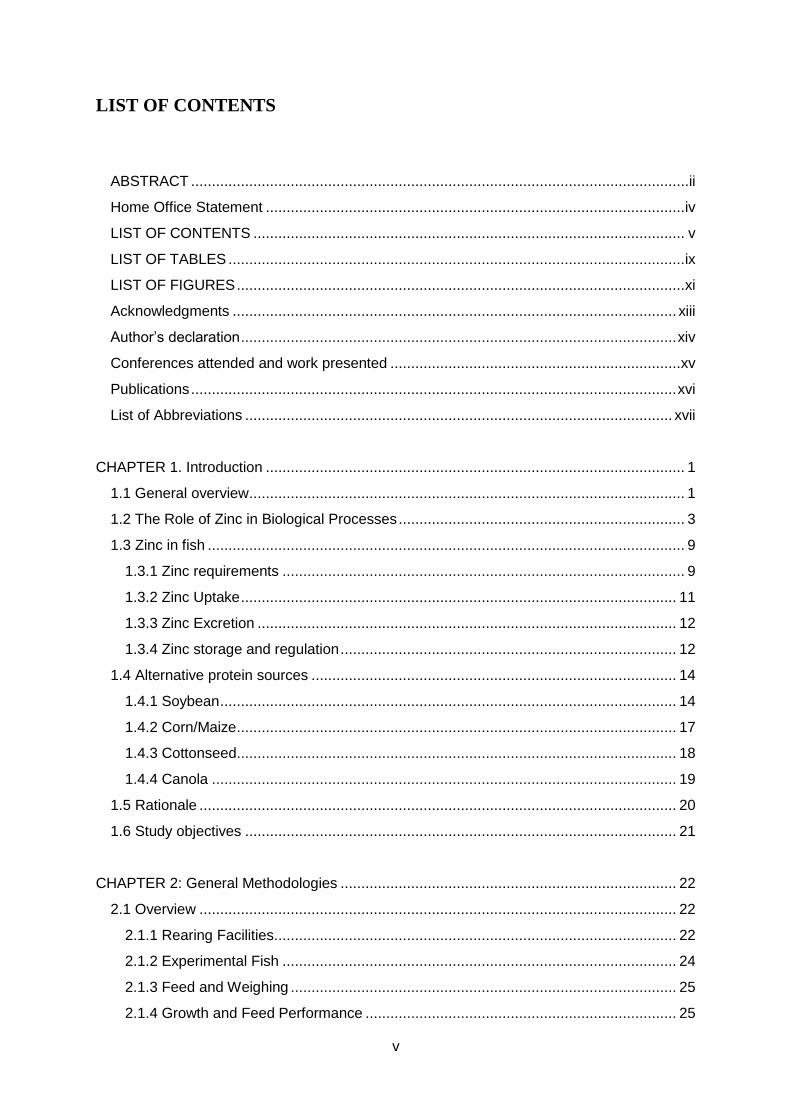
LIST OF CONTENTS
ABSTRACT ........................................................................................................................ii
Home Office Statement ..................................................................................................... iv
LIST OF CONTENTS ........................................................................................................ v
LIST OF TABLES .............................................................................................................. ix
LIST OF FIGURES ............................................................................................................ xi
Acknowledgments ........................................................................................................... xiii
Author’s declaration ......................................................................................................... xiv
Conferences attended and work presented ...................................................................... xv
Publications ..................................................................................................................... xvi
List of Abbreviations ....................................................................................................... xvii
CHAPTER 1. Introduction ..................................................................................................... 1
1.1 General overview ......................................................................................................... 1
1.2 The Role of Zinc in Biological Processes ..................................................................... 3
1.3 Zinc in fish ................................................................................................................... 9
1.3.1 Zinc requirements ................................................................................................. 9
1.3.2 Zinc Uptake ......................................................................................................... 11
1.3.3 Zinc Excretion ..................................................................................................... 12
1.3.4 Zinc storage and regulation ................................................................................. 12
1.4 Alternative protein sources ........................................................................................ 14
1.4.1 Soybean .............................................................................................................. 14
1.4.2 Corn/Maize .......................................................................................................... 17
1.4.3 Cottonseed .......................................................................................................... 18
1.4.4 Canola ................................................................................................................ 19
1.5 Rationale ................................................................................................................... 20
1.6 Study objectives ........................................................................................................ 21
CHAPTER 2: General Methodologies ................................................................................. 22
2.1 Overview ................................................................................................................... 22
2.1.1 Rearing Facilities ................................................................................................. 22
2.1.2 Experimental Fish ............................................................................................... 24
2.1.3 Feed and Weighing ............................................................................................. 25
2.1.4 Growth and Feed Performance ........................................................................... 25
vi
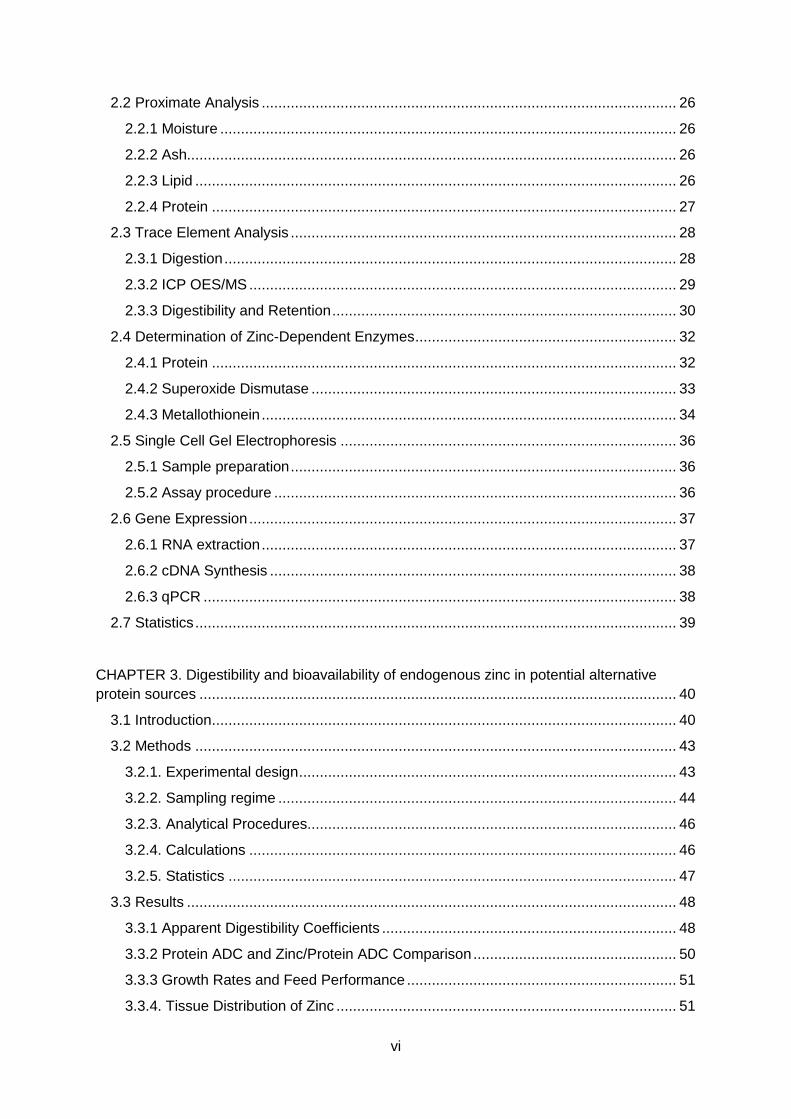
2.2 Proximate Analysis .................................................................................................... 26
2.2.1 Moisture .............................................................................................................. 26
2.2.2 Ash...................................................................................................................... 26
2.2.3 Lipid .................................................................................................................... 26
2.2.4 Protein ................................................................................................................ 27
2.3 Trace Element Analysis ............................................................................................. 28
2.3.1 Digestion ............................................................................................................. 28
2.3.2 ICP OES/MS ....................................................................................................... 29
2.3.3 Digestibility and Retention ................................................................................... 30
2.4 Determination of Zinc-Dependent Enzymes ............................................................... 32
2.4.1 Protein ................................................................................................................ 32
2.4.2 Superoxide Dismutase ........................................................................................ 33
2.4.3 Metallothionein .................................................................................................... 34
2.5 Single Cell Gel Electrophoresis ................................................................................. 36
2.5.1 Sample preparation ............................................................................................. 36
2.5.2 Assay procedure ................................................................................................. 36
2.6 Gene Expression ....................................................................................................... 37
2.6.1 RNA extraction .................................................................................................... 37
2.6.2 cDNA Synthesis .................................................................................................. 38
2.6.3 qPCR .................................................................................................................. 38
2.7 Statistics .................................................................................................................... 39
CHAPTER 3. Digestibility and bioavailability of endogenous zinc in potential alternative
protein sources ................................................................................................................... 40
3.1 Introduction ................................................................................................................ 40
3.2 Methods .................................................................................................................... 43
3.2.1. Experimental design ........................................................................................... 43
3.2.2. Sampling regime ................................................................................................ 44
3.2.3. Analytical Procedures......................................................................................... 46
3.2.4. Calculations ....................................................................................................... 46
3.2.5. Statistics ............................................................................................................ 47
3.3 Results ...................................................................................................................... 48
3.3.1 Apparent Digestibility Coefficients ....................................................................... 48
3.3.2 Protein ADC and Zinc/Protein ADC Comparison ................................................. 50
3.3.3 Growth Rates and Feed Performance ................................................................. 51
3.3.4. Tissue Distribution of Zinc .................................................................................. 51

vii
3.3.5 Tissue distribution of other minerals .................................................................... 57
3.3.6 Net Zinc Retention .............................................................................................. 59
3.4 Discussion ................................................................................................................. 61
3.4.1 Digestibility .......................................................................................................... 62
3.4.2 Tissue distribution ............................................................................................... 68
3.4.3 Net zinc retention ................................................................................................ 69
3.5 Outcome .................................................................................................................... 70
CHAPTER 4. The effect of phytase treatment of soyabean meal on protein, phosphorus and
zinc digestibility ................................................................................................................... 71
4.1 Introduction ................................................................................................................ 71
4.2 Methods .................................................................................................................... 74
4.2.1 Experimental fish ................................................................................................. 74
4.2.2 Diets and experimental regime ............................................................................ 74
4.2.3 Analytical procedures .......................................................................................... 75
4.2.4 Calculations ........................................................................................................ 76
4.2.5 Statistics ............................................................................................................. 76
4.3 Results ...................................................................................................................... 77
4.3.1 Protein Digestibility .............................................................................................. 77
4.3.2 Phosphorus and Zinc Digestibility ....................................................................... 77
4.4 Discussion ................................................................................................................. 79
CHAPTER 5. Organic verses inorganic zinc supplementation; effect on growth, digestibility,
tissue levels and protein synthesis. ..................................................................................... 81
5.1 Introduction ................................................................................................................ 81
5.2 Methods .................................................................................................................... 85
5.2.1 Experimental Design ........................................................................................... 85
5.2.2 Gene expression primers and validation ............................................................. 87
5.2.3 Statistics ............................................................................................................. 87
5.3. Results ..................................................................................................................... 89
5.3.1 Growth ................................................................................................................ 89
5.3.2 Tissue Zinc Levels .............................................................................................. 90
5.3.3 Zinc dependant proteins ...................................................................................... 96
5.3.4 Metallothionein gene expression ......................................................................... 98
5.3.5 DNA damage .................................................................................................... 100
5.4 Discussion ............................................................................................................... 102
viii
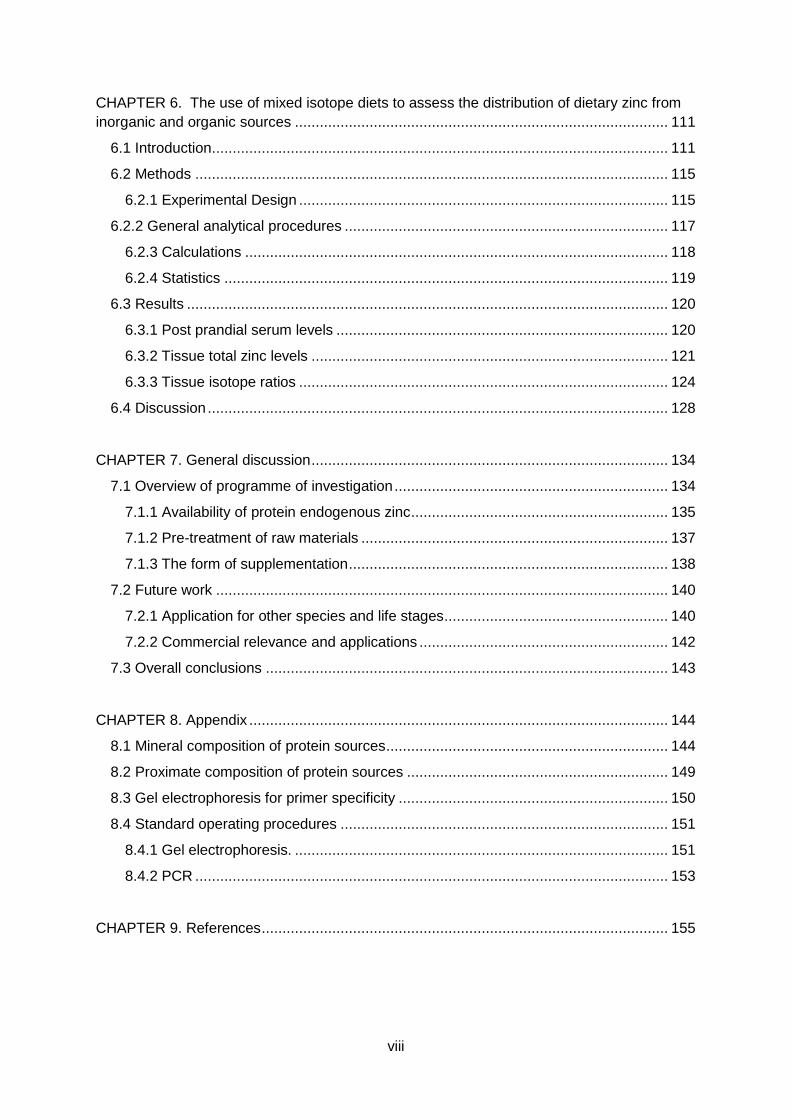
CHAPTER 6. The use of mixed isotope diets to assess the distribution of dietary zinc from
inorganic and organic sources .......................................................................................... 111
6.1 Introduction .............................................................................................................. 111
6.2 Methods .................................................................................................................. 115
6.2.1 Experimental Design ......................................................................................... 115
6.2.2 General analytical procedures .............................................................................. 117
6.2.3 Calculations ...................................................................................................... 118
6.2.4 Statistics ........................................................................................................... 119
6.3 Results .................................................................................................................... 120
6.3.1 Post prandial serum levels ................................................................................ 120
6.3.2 Tissue total zinc levels ...................................................................................... 121
6.3.3 Tissue isotope ratios ......................................................................................... 124
6.4 Discussion ............................................................................................................... 128
CHAPTER 7. General discussion ...................................................................................... 134
7.1 Overview of programme of investigation .................................................................. 134
7.1.1 Availability of protein endogenous zinc .............................................................. 135
7.1.2 Pre-treatment of raw materials .......................................................................... 137
7.1.3 The form of supplementation ............................................................................. 138
7.2 Future work ............................................................................................................. 140
7.2.1 Application for other species and life stages ...................................................... 140
7.2.2 Commercial relevance and applications ............................................................ 142
7.3 Overall conclusions ................................................................................................. 143
CHAPTER 8. Appendix ..................................................................................................... 144
8.1 Mineral composition of protein sources .................................................................... 144
8.2 Proximate composition of protein sources ............................................................... 149
8.3 Gel electrophoresis for primer specificity ................................................................. 150
8.4 Standard operating procedures ............................................................................... 151
8.4.1 Gel electrophoresis. .......................................................................................... 151
8.4.2 PCR .................................................................................................................. 153
CHAPTER 9. References .................................................................................................. 155

ix
LIST OF TABLES
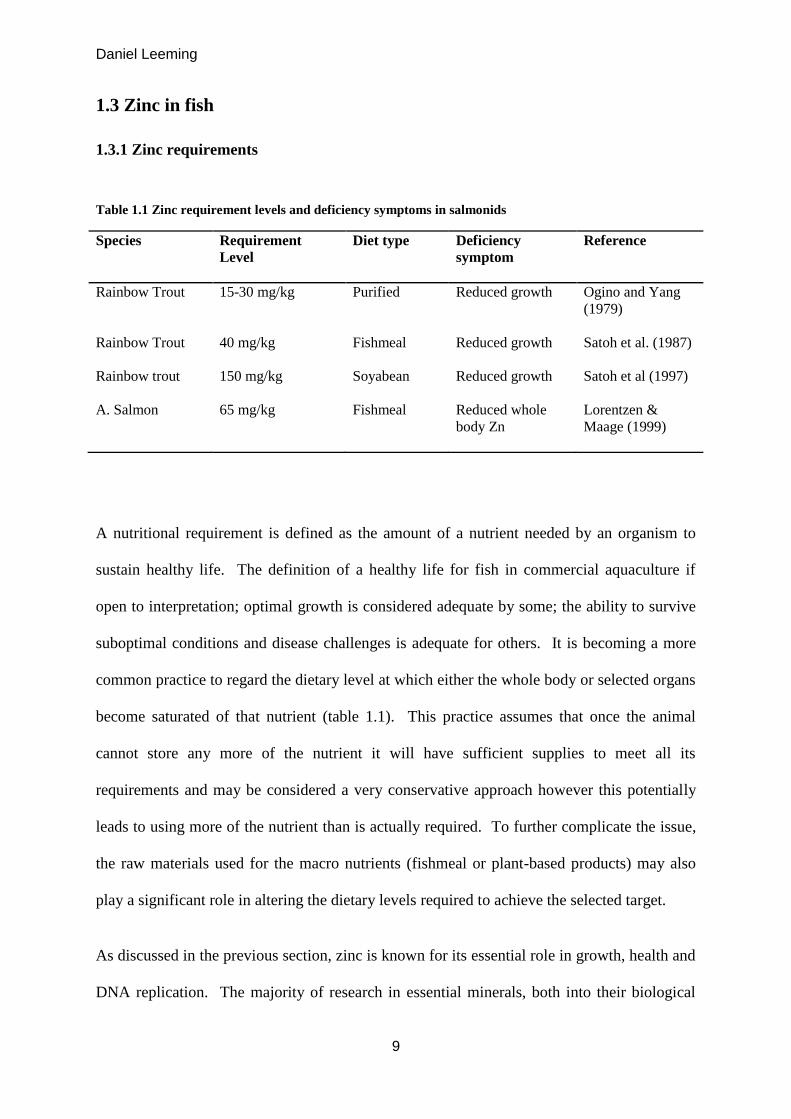
Table 1.1 Zinc requirement levels and deficiency symptoms in salmonids
9
Table 3.1 Diet composition (%), Protein and Lipid content (%) and final zinc
concentration (mg/kg)
44
Table 3.2 Mineral ADCs (%)
48
Table 3.3 Protein ACDs (%)
50
Table 3.4 Mean growth performance and feed utilization of rainbow trout fed
experimental diets
51
Table 3.5
Liver mineral concentration of rainbow trout fed experimental diets 57
Table 3.6
Mid Intestine mineral concentration of rainbow trout fed experimental
diets
58
Table 3.7
Bile mineral concentration of rainbow trout fed experimental diets 58
Table 3.8
Serum mineral concentration of rainbow trout fed experimental diets 59
Table 3.9
Mean net zinc retention of rainbow trout fed experimental diets 60
Table 4.1 Diet formulation (%) and composition
74
Table 5.1 Diet Formulation (%) and composition
85
Table 5.2 O.mykiss gene specific primers for metallothionein genes (MTA and
MTB) and housekeeping gene (18S Ribosomal RNA).
86
Table 5.3 Diet performance (weight gain, FCR and SGR) (mean ± S.D., n=3)
89
Table 6.1 The division of body tissues into those containing either functional or
exchangeable zinc pools
111

x
Table 6.2 Diet Formulation; % inclusion of base diet ingredients and mg/kg of zinc
supplementation.
115
Table 6.3 Proximate composition of diets and ratios of zinc isotopes (mean ± S.D.
n=3)
116
Table 6.4 The theoretical ratios of naturally occurring 65
Zn 117

xi
LIST OF FIGURES
Figure 1.1 Past a predicted future contributions of capture fisheries and aquacultures
contribution to the global seafood demand (FAO, 2009)
2
Figure 1.2. The Zif268–DNA complex showing the three zinc fingers, b) A diagram
showing the sequence specific protein-DNA interactions Zif268 and its DNA
binding site
5
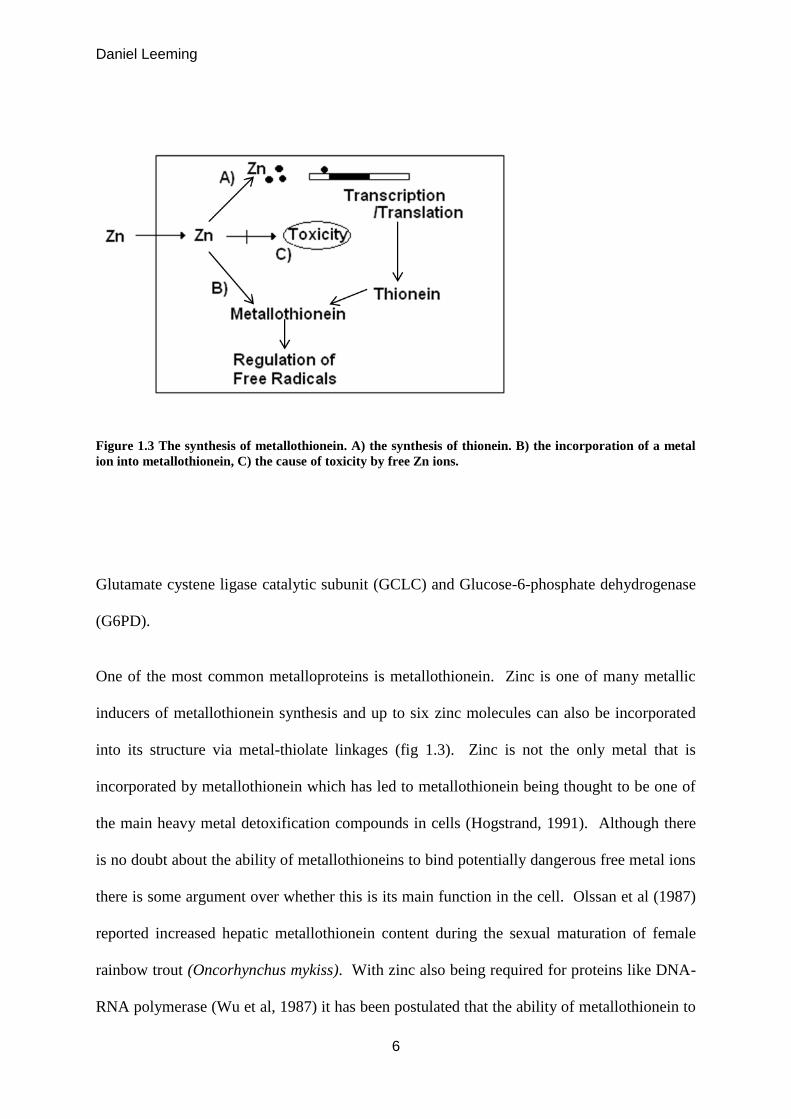
Figure 1.3 The synthesis of metallothionein. A) the synthesis of thionein. B) the
incorporation of a metal ion into metallothionein, C) the cause toxicity by
free Zn ions.
6
Figure 2.1
Recirculation system ‘F’, University of Plymouth. 23
Figure 3.1
Milligrams of zinc available from 1kg of raw material (mean ± S.D. n = 3) 49
Figure 3.2
Zinc tissue distribution in rainbow trout fed experimental diets.
Whole body / bone / bile
52
Figure 3.3
Zinc tissue distribution in rainbow trout fed experimental diets.
Liver / Fin / Eye
54
Figure 3.4
Zinc tissue distribution in rainbow trout fed experimental diets.
Serum / muscle/ intestine
56
Figure 4.1 Protein Digestibility (mean ± S.D, n=3).
76
Figure 4.2
Phosphorus and Zinc Digestibility. (mean ± S.D, n=3). 77
Figure 5.1
Individual fish weights over the 10 week trial period (mean ± S.D., n=3) 88
Figure 5.2
Zinc ADCs (%) (mean ± S.D., n=3) 90
Figure 5.3
Serum zinc levels (mean ± S.D., n=3) 90
Figure 5.4
Ocular zinc levels (mean ± S.D., n=3) 92

xii
Figure 5.5
Caudal fin zinc levels (mean ± S.D., n=3) 93
Figure 5.6
Hepatic zinc levels (mean ± S.D., n=3 94
Figure 5.7
Bile zinc levels (mean ± S.D., n=3) 95
Figure 5.8
Percentage inhibition of the formation of WST as an indicator of superoxide
dismutase activity.
96
Figure 5.9
Increase in metallothionein levels post stress. 97
Figure 5.10
Relative fold changes in Hepatic MTA mRNA production (ΔΔCT
). 98
Figure 5.11
Relative fold changes in Hepatic MTB mRNA production (ΔΔCT
). 98
Figure 5.12
Percentage tail DNA. 99
Figure 6.1
Post prandial serum zinc levels. (mean ± S.D. n=3). 119
Figure 6.2
Ocular total zinc concentration (mean ± S.D. n = 5). 120
Figure 6.3
Caudal fin total zinc concentration (mean ± S.D. n = 5). 121
Figure 6.4
Hepatic total zinc concentration (mean ± S.D. n = 5). 122
Figure 6.5
Ocular 66Zn:70 Zn ratio (mean ± S.D. n=5). 124
Figure 6.6
Caudal fin 66
Zn:70
Zn ratio (mean ± S.D. n=5). 125
Figure 6.7
Hepatic 66
Zn:70
Zn ratio (mean ± S.D. n=5). 126

xiii
Acknowledgments
I would to sincerely thank the following people for their help and support during this PhD: Prof. Simon Davies, my director of studies for his infectious enthusiasm, his trust and most importantly his unerring support and friendship. The aquaculture ‘family’ he has built and made me part of will always be close to my heart. Dr Ted Henry, my second supervisor, for his expertise and the numerous challenging and thought provoking discussions. John Sweetman, my industrial supervisor, for his belief, support and invaluable guidance in the industrial world. The opportunities he provided and the perspective he gave me has ensured I’ll never be a postman again! Dr Pearse Lyons for his financial support, making this whole project possible. His invitation to speak at his annual symposium without doubt changed the direction of my career and set me down the demanding, rewarding and immensely enjoyable path of industry research. Thank you. Dr Patrick Charlton, Dr Karl Dawson and Dr Jorge Arias for regarding my ideas worthwhile and their willingness to back them. To Ben Eynon, head aquarist/chief technician/fish whisperer/pillar of sanity/poo stripper extraordinaire, all I can say is thanks! My friends and colleagues within the aquaculture group past and present, Mark, Dave, Holger, Benedict, Pete, Sam, Matt, Ana, Paul and Dan, thanks for being there to help on long sampling days, sharing the tedium, understanding the stress and supplying necessary refreshments to get through it. Dr Robert Clough and Dr Andrew Fisher for their greatly appreciated help with trace element analysis. Liz Preston, Peter Russel, Natalie Sweet, Andy Atfield, Will Vevers and all the technical staff who helped, supervised, taught and prevented untold numbers of accidents and mistakes. To my Mum, Dad and my gretch of a sister Helene for their endless support and everything they have given me over the last 31 years. To Helena, Lou, Chris, Carly, Matt, Martin, Dave, Marie, Lucy and Paul thanks for the non-fish related friendship, banter and putting up with the smell of fishmeal. Finally, to my wonderful wife Amy for being an amazing friend and allowing me to
follow such a self-indulgent career, your companionship has been an oasis of
loveliness throughout.

xiv
Author’s declaration
At no time during the registration for the degree of Doctor of Philosophy has the author been
registered for any other University award
This study was funded by Alltech Biotechnology
Word count: 46,414
Signed…………………………
Date…………………………..

xv
Conferences attended and work presented
International Conference: Presented poster (Gene expression as a tool to assess the
bioavailability of a zinc proteinate to rainbow trout (Oncorhynchus mykiss) exposed to
husbandry stressors) to the World Aquaculture Society: AQUA 2012, Prague, Czech
Republic, September 2012
International Conference: Presented talk (Redefining zinc in aquaculture feed: The
Plymouth project with rainbow trout) to the 27th
International Animal Health and
Nutrition Industry Symposium, Lexington Kentucky, USA, May 2011
UK Conference: Presented poster (The therapeutic effects of zinc supplementation from
organic and inorganic sources to rainbow trout (Oncorhynchus mykiss)) to Centre for
Research in Translational Biomedicine Research Day, Plymouth UK, April 2011
xvi
Publications
Leeming, D.J., Davies, S.J., Henry, T.B., and Sweetman, J. (in prep). Gene expression
and protein levels as a measurement of stress induced zinc deficiency from inorganically
supplemented diets.
Leeming, D.J., Davies, S.J., and Sweetman, J. (in prep). Mineral bioavailability from
deficient diets in rainbow trout (Oncorhynchus mykiss): An assessment of zinc
requirements.
Leeming, D.J., and Davies, S.J., (in prep). Effect of phytase pre-treatment of soyabean
meal on mineral availability in rainbow trout (Oncorhynchus mykiss).

xvii
List of Abbreviations
ADC Apparent digestibility coefficient
ANF Anti-nutritional factor
cDNA Complimentary deoxyribonucleic acid
DDGS Distillers dried grains with solubles
DNA Deoxyribonucleic acid
EAA Essential amino acid
FCR Feed conversion ratio
G6PD Glucose-6-phosphate dehydrogenase
GCLC Glutamate cystene ligase catalytic
GI Gastro-intestinal
GST Glutathione -S- transferase
ICP MS Inductively Coupled Plasma Mass Spectrometry
ICP OES Inductively Coupled Plasma Optical Emissions Spectrometry
LMA Low melting agarose
MRE Metal Responsive Elements
MS-222 Tricaine methanesulfonate
MTA Metallothionein A
MTB Metallothionein B MTF-1 Metal regulatory Transcription Factor 1
NMA Normal melting agarose
PBS Phosphate buffered saline
PCR Polymerase chain reaction
Redox Reduction-oxidation
RNA Ribonucleic acid

xviii
ROS Reactive oxygen species
SBM Soybean Meal
SCGE Single cell gel electrophoresis
SD Standard deviation
SEM Standard error of the mean
SGR Specific growth rate
SOD Super oxide dismutase
SPC Soy Protein Concentrate
SPI Soy Protein Isolate
qPCR Quantitative polymerase chain reaction
qRT-PCR Quantitative real time polymerase chain reaction
ZIP Zrt- and Irt-like proteins
Zn-AA Zinc chelated or complexed amino acids
Zn-Met Zinc methionine
Zn-pr Zn-proteinate
ZnT Zinc transporter

xix

Daniel Leeming
1
CHAPTER 1. Introduction
1.1 General overview
The increasing demand for food from the marine environment over the last decade has been
well documented, as has the predicted reliance on the aquaculture industry to meet this
demand due to the limitations of increasing wild capture fisheries which have plateaued since
the early 1990’s (fig 1.1, FAO 2012). If it is to be assumed that industry will meet this
demand using currently farmed species, a major reform of current practices will be essential.
The unsustainable requirement of fishmeal has already been identified as a major concern and
the efforts to replace substantial amounts have been largely successful by turning to plant-
based proteins as an alternative. This course of action brings with it its own problems with
regards to amino acid composition of plant-based diets and possible pathological side effects
(Gatlin et al, 2007), many of which have to be overcome with innovative processing
techniques and inventive diet formulations leading to the reduced reliance on fishmeal.
Some commercial feed manufacturers now use as little as 30% fishmeal in their salmonid
diets (personal observations), a level previously closer to 70-80% (Scottish Executive, 2002).
The complications involved with this increased utilisation of plant proteins are not limited to
balancing proteins and removing toxins but also include a plethora of secondary
complications involving mineral availability. Many of the plant proteins contain anti-
nutritional factors (ANFs) which may drastically reduce the digestibility of di and tri-valent
cations such as zinc, copper and iron. A notable example is phytate in soyabean-based
products (Budavari et al., 1989). The simplest way to overcome this problem is to
supplement the diet with the minerals affected by the ANFs, for example, with zinc this has

Daniel Leeming
2
Figure 1.1 Past a predicted future contributions of capture fisheries and aquacultures contribution to the
global seafood demand (FAO, 2012)
led to some diets containing over five times the fish’s requirements as its digestibility may be
as low as 16% (Storebaken et al., 1998). This ‘loading’ of the diet with highly indigestible
minerals is deleterious to both the environment and profit as the remaining 84% of this
relatively expensive and potentially toxic natural resource is effectively thrown into the sea.
In 2011 the Scottish salmon industry produced 158,018 tonnes of Atlantic salmon (Scottish
Salmon Producers’ Organisation, 2013); at a conservative estimate, assuming a general feed
conversion rate (FCR) of 1.0, this took an equal amount of feed, containing on average 180
mg Zn/kg, to produce. That equates to approximately 28.5 tonnes of zinc used, which if only
16% digestible means that nearly 24 tonnes of zinc was wasted and released into the
environment. At current market value ($2057/t, Infomine) that’s a waste of $48,380, not
including the environmental cost, just for zinc, not including copper, phosphorus, iron etc.
The environmental impact of this has received very little attention. One study by Russell et al.

Daniel Leeming
3
(2011) reported sediment concentrations around sea cages of 409 mg Zn/kg; another by Dean
et al. (2007) reports 410 mg Zn/kg in the sediment compared to a background level at clean
sites of 17 mg Zn/kg. Licences for sea cages in Scotland are awarded by SEPA (Scottish
Environment Protection Agency) and the assessment criteria for them include sediment
concentrations for zinc and copper. The upper boundary for zinc in this criteria is 410 mg
Zn/kg, a level above which, it states that ‘adverse effects will be observed in >50% of the
benthic animals in that environment’ (Delvalls et al., 2004). If the utilisation of plant proteins
high in ANFs like phytase continues and the digestibility of these minerals is not improved,
as the aquaculture industry continues to expand the sediment concentration will surely
increase, potentially resulting in the refusal of new licenses and current licences being
revoked.
1.2 The Role of Zinc in Biological Processes
The chemistry of zinc lends itself particularly well for use in biological processes. Zinc’s
stable valency of 2+ is unchanged under physiological conditions making it unsuitable to
undergo free radical-producing redox reactions (Reilly, 2004). Zinc is a Lewis acid (an
electron acceptor), which combined with its concentrated charge (due to small size) makes it
the redox stable ion of choice for metallocomplexes (McCall, 2000). Given this it is far from
a coincidence that zinc is ubiquitous in cellular metabolism and widespread in its importance
in biological systems.
Zinc is most commonly incorporated into proteins, either as a structural tie modifying the
proteins tertiary structure by cross-linking between regions of polypeptides, or as a Lewis
acid (an electron pair acceptor) in the active site of enzymes when its role is described as
catalytic. When acting as the latter, as in Carboxypeptidases for example (Folk et al, 1960),

Daniel Leeming
4
one zinc ion is coordinated by a number of ligands (4 in the case of carboxypeptidase B).
The structural role of zinc is not limited to enzymes but is also incorporated into structural
proteins however the vast majority of the literature concentrates on its role in the suite of
enzymatic proteins. The chemical property, most import in this role, is its high
electronegativity (affinity for electrons). Consequently a Zn2+
ion is capable of bonding to
several amino acid side chains. Histidine, glutamic acid, aspartic acid and cysteine are
common ligands to zinc (cysteine more commonly, purely as structural rather than catalytic)
(Chesters, 1997). It is amino acids containing nitrogen or sulphur that are particularly
susceptible to forming ligands with zinc (Reilly, 2004). One example is the tetrahedral
coordination of zinc by four cysteine residues in alcohol dehydrogenase (Vallee and Falchuk,
1993).
Enzymes are not limited to incorporating only one metal ion into their makeup, nor are the
metals limited to performing only one function per enzyme. In the case of Cu/Zn superoxide
dismutase, which incorporates zinc ions for a structural purpose, its activity in the dismutase
of the superoxide to form hydrogen peroxide and oxygen comes from the copper ion in its
active site (Vallee and Falchuk, 1993).
Any review of zinc dependant proteins would not be complete without mentioning two
groups of metalloproteins which have the most diverse roles in biology; the zinc finger
proteins and the metallothioneins. Zinc finger proteins are vital for the nuclear components of
the cell to undergo transcription, repair (both nucleotide and base excision repair) and
replication (Chesters, 1997). A zinc finger protein is a nucleoprotein that links to the double
helix of the DNA at a site named ‘zinc twists’ (fig 1.2) and initiates transcription processes.
Multiple zinc fingers are incorporated to form a zinc finger protein by a complex web of
polypeptide loops and beta sheets configured by zinc ligands (Vallee et al., 1991).

Daniel Leeming
5
Figure 1.2. a) The Zif268–DNA complex showing the three zinc fingers bound in the major groove of
DNA5. The DNA is blue and fingers 1, 2, and 3 are red, yellow, and violet respectively. Zinc ions are
shown as grey spheres. b) A diagram showing the sequence specific protein-DNA interactions Zif268 and
its DNA binding site
The involvement of zinc in the transcription of genetic information is not restricted solely to
genes implicated with zinc utilisation or homeostasis. The mechanism of zinc-stimulated
transcription is well documented and involves the activation of the Metal regulatory
Transcription Factor -1 molecule (MTF-1) by a Zn2+
ion. Activated MTF-1 binds to the
Metal Responsive Elements (MREs) located on the 5’ flanking region of the target gene
(Andrews, 2001) stimulating transcription. The discovery of this mechanism has since led to
the identification of a much wider involvement of zinc in many more non-zinc incorporating
proteins. In the puffer fish (Fugu rubripes) genome 28 antioxidant genes have been found
to have the sequence for the MRE binding site at least twice within close proximity to their
open reading frame (Chung, 2005). These included Glutathione -S- transferase (GST),
Daniel Leeming
6
Figure 1.3 The synthesis of metallothionein. A) the synthesis of thionein. B) the incorporation of a metal
ion into metallothionein, C) the cause of toxicity by free Zn ions.
Glutamate cystene ligase catalytic subunit (GCLC) and Glucose-6-phosphate dehydrogenase
(G6PD).
One of the most common metalloproteins is metallothionein. Zinc is one of many metallic
inducers of metallothionein synthesis and up to six zinc molecules can also be incorporated
into its structure via metal-thiolate linkages (fig 1.3). Zinc is not the only metal that is
incorporated by metallothionein which has led to metallothionein being thought to be one of
the main heavy metal detoxification compounds in cells (Hogstrand, 1991). Although there
is no doubt about the ability of metallothioneins to bind potentially dangerous free metal ions
there is some argument over whether this is its main function in the cell. Olssan et al (1987)
reported increased hepatic metallothionein content during the sexual maturation of female
rainbow trout (Oncorhynchus mykiss). With zinc also being required for proteins like DNA-
RNA polymerase (Wu et al, 1987) it has been postulated that the ability of metallothionein to
Daniel Leeming
7
scavenge free zinc allows it to act as a zinc donor for the polymerases at times of
reproduction and as an acceptor or storage unit for zinc before or after reproduction.
Measuring zinc status is difficult, complicated by an organism’s ability to regulate zinc, by
both controlling its dietary absorption and also their endogenous excretion (Clearwater et al.,
2002; Salguerio et al., 2000). In fish, biliary excretion and intestinal sloughing is considered
to be the main mechanism of zinc homeostasis (Bury et al, 2003; Hardy et al., 1987).
Dietary zinc absorption occurs in the anterior gastrointestinal tract. At environmentally
unrealistic levels of dietary zinc the uptake is dominated by a passive absorption (Bury et al,
2003) however, in reality, at dietary levels (50 mg/kg) a saturatable active transport
mechanism involving zinc transporter proteins is used (Glover and Hogstrand, 2002). At
these lower concentrations the use of zinc transporter proteins is crucial for zinc absorption
due to its ionic charge and therefore water solubility it cannot freely pass through membranes.
In humans the zinc concentrations in the cytosol and lumens of organelles is regulated by
groups of transporter proteins known as ZIP and ZnT transporters. Analogous transporters
have also been identified in fish (Feeney et al, 2005).
Zinc is transported around the body bound to protein in the plasma. In mammals 60-70% of
this is bound to either albumin or α-2-globulin. Approximately only 0.1% of the total body
zinc is found in the plasma which has led to the postulation that the plasma is purely a carrier
of zinc between site of absorption, storage and metabolism (Salguerio et al., 2000).
Due to its essential role in a large number of proteins, zinc is the second most abundant trace
element, after iron, in the human body. A consequence of this abundance is the number of
functions requiring zinc which are essential for the maintenance of optimal health.
Deficiency of zinc can lead to impaired immunity (Paripatananont and Lovell, 1995);

Daniel Leeming
8
oxidative stress (Hidalgo et al., 2002); recurrent infections; delayed wound healing; gustatory
abnormalities; DNA damage; mental lethargy; and increased risk of abortion (Salguerio et al.,
2000) among many other effects .
The role of zinc in the maintenance of oxidative stress has been investigated in vitro by
adding zinc to cells which are exposed to Hydrogen Peroxide (Chung et al, 2005). It was
shown that zinc played a role as an indirect antioxidant when the cells were pre-treated with
zinc sulphate as a result of the increased transcription of metallothionein, GST and G6PD;
however the zinc also acted as a pro-oxidant when the cells were exposed to H2O2 and zinc
sulphate simultaneously. It was proposed that the H2O2 treatment, which is known to be
capable of releasing Zn2+
ions from metallothioneins and other proteins (Zhang et al, 2003)
disrupted the cellular zinc homeostasis and then the simultaneous addition of more zinc
resulted in the inability of cells to regulate the free Zn2+
ion concentration which is
potentially very toxic. In rat’s deficient of zinc, DNA damage in the liver manifested if the
form of single strand breaks was observed to increase. This may have been caused by a
decreased level of protection against reactive oxygen species due to a lack of zinc dependant
protective enzymes or by a reduced ability to repair DNA damage due to a lack of zinc
dependant repair enzymes i.e. fapy glycosylase (Castro et al., 1992). Zinc has also been
shown to protect against lipid peroxidation in rats supplemented with dietary zinc. (Al-
Damagh, 2007).
Daniel Leeming
9
1.3 Zinc in fish
1.3.1 Zinc requirements
Table 1.1 Zinc requirement levels and deficiency symptoms in salmonids
Species Requirement
Level
Diet type Deficiency
symptom
Reference
Rainbow Trout 15-30 mg/kg Purified Reduced growth Ogino and Yang
(1979)
Rainbow Trout 40 mg/kg Fishmeal Reduced growth Satoh et al. (1987)
Rainbow trout 150 mg/kg Soyabean Reduced growth Satoh et al (1997)
A. Salmon 65 mg/kg Fishmeal Reduced whole
body Zn
Lorentzen &
Maage (1999)
A nutritional requirement is defined as the amount of a nutrient needed by an organism to
sustain healthy life. The definition of a healthy life for fish in commercial aquaculture if
open to interpretation; optimal growth is considered adequate by some; the ability to survive
suboptimal conditions and disease challenges is adequate for others. It is becoming a more
common practice to regard the dietary level at which either the whole body or selected organs
become saturated of that nutrient (table 1.1). This practice assumes that once the animal
cannot store any more of the nutrient it will have sufficient supplies to meet all its
requirements and may be considered a very conservative approach however this potentially
leads to using more of the nutrient than is actually required. To further complicate the issue,
the raw materials used for the macro nutrients (fishmeal or plant-based products) may also
play a significant role in altering the dietary levels required to achieve the selected target.
As discussed in the previous section, zinc is known for its essential role in growth, health and
DNA replication. The majority of research in essential minerals, both into their biological

Daniel Leeming
10
role and their nutritional requirements, has predominately concentrated on higher organisms.
Trace element research in fish has generally been disjointed and sporadic, and mineral
requirements have been defined for only the most commercially valued species. Even this is
based on limited research to date with conflicting evidence.
Ogino and Yang (1978) calculated the zinc requirement for salmonids to be 15-30 mg/kg.
This was calculated using a purified egg albumin diet. In reality though, even in a fish meal
diet containing 65 mg/kg zinc, an Atlantic salmon (Salmo salar) could not maintain a normal
whole body zinc status (Lorentzen and Maage 1999). In the same trial the authors calculated
that an additional supplementation of zinc to reach dietary levels of 140 mg/kg was required
to achieve a normal zinc status for this species. Similar experiments have shown the same in
rainbow trout (Oncorhynchus mykiss), requiring an additional supplementation of 40 mg/kg
to a white fish meal diet in order to achieve normal growth, never mind to maintain zinc
status (Satoh et al., 1987).
Results from experiments like these using practical diets indicate that there is some aspect of
the diet which does not allow the fish to utilize all the zinc present. Satoh et al (1987)
attributed this to high levels of hydroxyapatite in the fish meal, especially tricalcium
phosphate. A very similar effect on zinc availability is also seen in plant based diets, a
soybean based diet required 150 mg/kg zinc supplementation in order to obtain optimal
growth in rainbow trout (Satoh et al 1997), this was attributed to the presence of phytates
(Storebakken et al., 2000). These anti-nutritional factors were not present in the purified egg-
based diet of Ogino and Yang’s, so meeting the zinc requirements of fish, which on the face
of it did not seem to be of concern becomes a very real issue, especially with the present need
to replace high quality fish meal with alternate protein sources in practical diet formulations.

Daniel Leeming
11
1.3.2 Zinc Uptake
Fish have two routes of zinc uptake, first from the diet and second from the surrounding
water. There is the potential for waterborne zinc to be absorbed in both the gut, from the
swallowed external water, and also directly from the external aqueous environment via the
gills. The drinking of water by freshwater species, especially salmonids, is very low and
freshwater zinc levels are usually <10 µg/l. This is considered too low to make any
significant contribution to whole body zinc (Spry et al., 1988) from either branchial or
gastric uptake however the gills affinity for zinc is extremely high (Glover et al., 2003). Bury
et al (2003) calculated the maximum uptake rate for zinc in both the gut and the gills. They
reported a gut uptake rate of 933 nmol/kg/h and a gill uptake rate of only 240-410 nmol/kg/h.
These results support claims that despite the high affinity for zinc in the gill, dietary uptake is
the major contributor to the body zinc status (Glover and Hogstrand, 2002; Spry et al., 1988).
Spry et al (1988) also reported no correlations between dietary and waterborne zinc uptake.
The uptake mechanism in fish is described as high affinity low capacity in the gills and low
affinity but high capacity in the gut.
Only a very small fraction of the total zinc in the environment is in the free form. As
previously mentioned free zinc ions are potentially very toxic to many biological processes,
zinc therefore is adsorbed to organic and inorganic compounds, be that in the sediments or in
other organisms. For the zinc to become available to other organisms these compounds need
processing in some way. In fish it is only by digestion in the GI tract that these compound are
broken down. The gills are incapable of sequestering zinc from these compounds and can
therefore only absorb the very limited free zinc in the water column.

Daniel Leeming
12
1.3.3 Zinc Excretion
Zinc excretion in fish has had relatively little attention in the scientific literature to date.
Until recently it was known that very little zinc was excreted via the urine (<1%) (Hardy et
al., 1987), and that zinc was actively transported from the blood to the gills (Maage and
Julshamn, 1993), where some dietary zinc is excreted from the body. Not until Clearwater et
al (2002) and Bury et al (2003) both claimed that endogenous zinc was excreted by billiary
excretions and intestinal sloughing did it become documented that the GI tract was also
involved with not only the uptake but also the storage and regulation of zinc. Before this
time any zinc in the GI tract or faeces was assumed to be principally unabsorbed from the
diet. One further possible route of zinc excretion is the integument and its associated
mucosal layer due to the high levels of zinc located in this tissue (Spry et al., 1988).
1.3.4 Zinc storage and regulation
Zinc is very highly regulated in all aspects of the fish’s body: its uptake from the water or the
diet; its excretion by the gills, the intestine, the urine or the integument; and also by its
distribution within the body. This regulation means that even a dietary level of 1700 mg/kg
ZnSO4 is still non-toxic to the fish (Wekell et al., 1983).
Both the intestine and the skeletal tissue respond to differing levels of dietary zinc, indicating
that they are involved with zinc storage. Maage and Julshamn (1993) and Sun and Jeng
(1998) showed that zinc accumulates fastest and to the greatest extent in the intestine when
dietary zinc levels are high. Maage and Julshamn (1993) also showed that when dietary levels
of zinc were low the intestine level decreased, indicating that the zinc can also be mobilized
Daniel Leeming
13
when required. Similar effects have been documented in the vertebrae and other skeletal
tissues, with zinc levels increasing with high dietary zinc and decreasing when the dietary
zinc was deficient (Maage and Julshamn, 1993; Do Carmo e Sa et al., 2004). Do Carmo e Sa
et al (2004) reported that a zinc deficiency for 4-5 weeks resulted in mobilization of zinc
from the vertebrate in juvenile Nile tilapia.
There is some debate in the literature about the role of the kidney with regards to zinc
metabolism and excretion. Maage and Julshamn (1993) report that as dietary zinc increases
from 17-97 mg/kg the levels of zinc in the kidney also accumulate. This, as with the
intestines and the skeletal tissue, would indicate that the kidney has some kind of storage role
for this mineral. The obvious critique of this hypothesis would be that the kidney is used as
an excretory organ, however, the low zinc levels in the urine of fish would indicate that this is
not the case in practice. On the other hand Overnell et al (1998) found the kidneys to be
unresponsive to dietary zinc levels in turbot (Psetta maxima). More investigation into the role
of the kidneys is required, especially when there are conflicting reports about whether or not
the levels of zinc in the kidney are affected by the level of zinc in the diet.
The gills are another organ in which the zinc levels respond positively to an increase in
dietary zinc concentration (Wekall et al, 1983). The general consensus here is that this is
probably due to their excretory role. The other visceral tissues, including liver, do not seem
to respond to dietary zinc. The liver is mentioned specifically because of its known role in
mammals. The mammalian liver is used to store zinc as metallothioneins (Salguerio et al.,
2000), however in fish this does not appear the case. Fish hepatic tissue seems to perform
only a metabolic role. As mentioned in the first section of this review zinc is water soluble
and cannot therefore pass freely through cell membranes and requires ZIP or ZnT
transporters to facilitate this process. Feeney et al (2005) reported that dietary zinc did not

Daniel Leeming
14
stimulate transcription for these transporters in the liver. In order for there to be a positive
correlation between dietary zinc and zinc levels in the liver an increase in these transporters
would need to occur. Since this is not the case then this supports the theory that the liver is
not being used for zinc storage in fish.
Plasma zinc and the muscular tissues do no display any significant correlation with dietary
zinc levels (with the exception of the muscular tissues in Nile tilapia (Do Carmo E Sa et
al.,2004)) (Overnell et al.,1998; Maage and Julshamn, 1993). Plasma is considered simply as
a carrier of zinc between the intestine and either the organs for storage or metabolism, or to
the gills for excretion.
Regardless of the ability of the fish to regulate zinc within its body the turnover of zinc is
relatively fast (~1% per day). This means that in order to avoid deficiency a continual supply
of dietary zinc is essential.
1.4 Alternative protein sources
1.4.1 Soybean
Soybean is arguably the alternative protein source most likely to provide an answer to the
increasing problem of fish meal replacement in aquafeeds. The role of the global soybean
industry (seemingly led by the US soybean industry) in developing this potential cannot be
underestimated. Since 1995 promising research, well-funded from the United Soybean Board,
has increased the demand for soybean meal in the aquaculture industry from almost nothing
to approximately 5 mmt in 2005. Undeniably this has been a great marketing venture and has

Daniel Leeming
15
identified and overcome numerous nutritional hurdles, however the product is far from
perfect and there are still many obstacles to clear.
Global soybean production is huge (>200 M metric tonnes per annum), the primary product
being oil. The by-product from the oil industry is a high protein cake which is further
processed to produce soy flour, soybean meal (SBM), soy protein concentrate (SPC) or a soy
protein isolate (SPI). SPC and SPI are both products of yet further processing of the soybean
meal, this increases the cost and means that these products are not yet economical for large
scale inclusion in commercially produced aquafeeds. However with development of new
technologies combined with the increasing price of fish meal prices a time may come when it
is cost effective and SPC/SPI become viable commodities.
Soybean meal has a crude protein content of ~48%, this is increased in SPC to ~64% (NRC,
1993), both of which meet the requirement of fish (Gatlin III et al., 2007). However, the
nutritional inadequacies of soy based products are numerous but not insurmountable: they
provide an inadequate supply of essential amino acids (EAA); have low ash and fat
concentrations; have surplus carbohydrates; and the limited minerals that are present are
tightly bound to phytic acid.
The low mineral concentrations can be overcome simply mineral premix supplementation, as
can the deficiency of the EAAs to some extent. The limiting EAAs are all sulphur based
(methionine and cysteine). The high cysteine concentration present in soybean products can
meet 40-60% of the sulphur based EAA requirements but methionine is thought to be the first
limiting amino acid for growth (Takagi et al., 2001). Supplementation of DL-methionine
when SPC was the primary protein source demonstrated a positive effect (Mambrini et al.,
1999). Further supplementation of lysine, arginine and tryptophan to soybean based diets

Daniel Leeming
16
have also been shown to increase growth rates in fish (Furuya et al., 2004; Floreto et al.,
2000).
Most carnivorous fish have a reduced capacity to assimilate dietary carbohydrates due to their
limited ability to metabolise polysaccharides such as starch. Non-starch polysaccharides
particularly present a problem when soybean products are incorporated into aquafeeds. Raw
soybeans contain ~20% non-starch polysaccharides, a considerable amount to be concerned
about when their presence is not only unusable by the fish but also negatively effects other
nutrient utilisation and feed efficiency. A second carbohydrate fraction presenting negative
consequences for the fish are oligosaccharides. Consisting up to 15% of soybean meal
oligosaccharides have been reported to increase the viscosity of the chime in the digestive
tract, interfering with the uptake of nutrients, especially the fat and minerals in salmonids
(Refstie et al., 1998). Refstie et al. (1998) also linked oligosaccharide concentration with
reduced growth performance, and Bureau et al. (1998) reported soybean meal induced
enteritis, both in salmonids spp. The level of oligosaccharides could be reduced by using
SPC rather than SBM, SPC recording only 3% oligosaccharides as opposed to 15% in SBM.
Bacterial or fungal fermentation may also reduce the negative effects of oligosaccharides.
As with many plant based protein sources phytic acid is another problem with soybean
products (~40 mg/kg in SBM and further concentrated to 70-100 mg/kg by the purification of
SBM to SPC). The majority (~66%) of phosphorus is present as phytic acid, in this form
virtually none of the phosphorus is available to fish (Riche and Brown, 1996). A second
property of phytic acid, a property of upper most relevance to this review, is the ability of
phytic acid to bind divalent cations, especially zinc. Just like the phosphorus incorporated in
phytic acid, once the divalent cation is bound it is virtually completely unavailable, passes
through the gut and out into the environment. Not only is this detrimental to the fish, which

Daniel Leeming
17
present signs of mineral deficiencies, but it is also a large source of pollution, especially
under the sea/lake cages, and requires extra expense to the farmers who need to further
supplement minerals to the diet. Unfortunately there is no processing treatment that will
remove phytic acid from soybean products, the only options are to either use mutant varieties
of soybean low in phytates, which although do exist are not widely available especially for
use in livestock feed ingredients; or to add phytase to hydrolyse the phytic acid. However
even the addition of phytase presents problems due to the heat sensitivity of the enzyme
during extrusion. One other possible way of reducing the effects of phytic acid is to use
minerals in forms unavailable to the acid, proteinate minerals could possibly improve mineral
availability in phytic acid rich diets.
1.4.2 Corn/Maize
Corn unlike soybean is mainly produced to be an energy source for livestock, only a small
percentage is used for human consumption. Corn oil is the primary food product of corn
cultivation but corn starch is also used in over 400 products, from paper coatings to food
sweeteners. An increasing amount of corn starch is now also being used to produce ethanol.
The main components of corn are bran/fibre, germ, gluten, and starch. Bran/fibre is of little
or no use to the aquafeed industry; the germ is used for corn oil extraction leaving corn germ
meal; the gluten is concentrated and dried to form corn gluten meal; and the starch can be
fermented to produce ethanol.
Corn gluten meal is a promising ingredient for inclusion in aquafeeds however it does have
some undesirable properties which currently limit its inclusion to ~25% of the diet. Corn
gluten meal has a minimum of 60% crude protein content, this can reach 70% in more refined
products but further refinement increases the cost and borders on being uneconomical. Corn
gluten meal is highly digestible but is lacking in lysine, however at the current common

Daniel Leeming
18
inclusion levels of ~15% of the diet lysine can be supplied from other ingredients, potentially
soybean meal or concentrate (SPC) as both are relatively high in lysine. A minor concern
with corn gluten meal is the high content of xanthophylls. Animals fed diets containing corn
gluten meal have produced yellow coloured musculature, a quality often desired in chickens,
demanding a higher price by implying some form of higher welfare standards. Yellow fillets
of trout on the other hand are not so appealing to the consumer. This can be overcome by
supplementing astaxanthin or canthaxanthin, a practice already commonly used in trout and
salmon diets to produce redder fillets.
One area for potentially developing a cheap and possibly sustainable source of protein is the
refinement of the by-products from the ethanol based bio fuel industry. The current waste
product of ethanol production is DDGS (distillers dried grains with solubles), a product with
~30% crude protein and high fibre content, neither of which are desirable characteristics for
aquafeed ingredients. However as only the carbohydrate is required for ethanol production it
may be possible to separate the components of corn starch prior to the ethanol production and
obtain a corn protein concentrate which is usable in aquafeeds.
1.4.3 Cottonseed
Cottonseed is the third highest produced legume seed, after soybean and rapeseed, worldwide.
Cottonseed meal has a protein content of ~41% and compared to legume seed based meals
and fish meal it is cheap to produce. Having a low market price, a reasonable protein level,
and being mass cultivated globally, cottonseed meal has great potential for inclusion into high
protein fish diets. Inclusions of up to 30% of the diet have shown no negative growth effects
but a study by Lee et al. (2002) stated that the source and the previous processing of
cottonseeds influenced the utilisation limits of cottonseed meal in fish diets.

Daniel Leeming
19
Two possible health problems may arise if high levels of cottonseed meal are incorporated
into fish diets. One is caused by gossypol and the other by quercitin (and its metabolites).
Cottonseed meal typically contains between 400-800 mg/kg of free gossypol. Herman (1970)
identified histopathological changes in the liver and kidneys of rainbow trout when exposed
to levels >95 mg/kg gossypol however no effect on growth was seen until ~300 mg/kg. Lee et
al. (2002) using juvenile rainbow trout reported that depending on cottonseed meal source,
fish can absorb approximately 35-50% of dietary gossypol, and the majority of the absorbed
gossypol seemed to be excreted. Free gossypol levels of 60, 150 and 225 mg/kg (dependant
on the source of the cottonseed) did not depress growth rates.
Isorhamnetin, a metabolite of quercitin, is known to have oestrogenic effects and accumulate
in animals (Piskula and Terao, 1998). Quercitin accumulation in fish has not been well
studied however traces have been found in the liver and body tissues of tilapia. On the
contrary rainbow trout supplemented with cottonseed meal have not recorded any quercitin in
their plasma, indicating that it is not available to them. Whether tilapia have an increased
ability to absorb quercitin has yet to be studied.
1.4.4 Canola
Produced by rapeseed cultivars canola comes from crops bred to have low levels of eurcic
acid and glucosinolates (anti-nutritional factors for most fish). The primary product of canola
crops is canola oil, similarly to soybeans the by-products left after oil extraction can be turned
into a meal which can also be further purified into a protein concentrate. The basic canola
meal has crude protein levels of 35% whereas the canola protein concentrate reaches protein
levels more similar to high quality fish meals, around 65-70%.

Daniel Leeming
20
There are the familiar problems with canola based fish diets as with soybean based diets: the
majority of the phosphorus and the divalent minerals can be locked into the phytic acid; and
there are limiting EAAs. A typical canola meal contains about 4% phytic acid which will
probably increase as the protein is purified to form the protein concentrate. Methionine and
lysine are also the limiting EAAs as with many of possible plant protein sources. In addition
to these usual problems there is the added presence of toxic eurcic acid and glucosinolates.
Eurcic acid is a cardiotoxin, causing heart lesions in rats at low levels of inclusion. It does
however seem that the solvent extraction of the oil and the pressing of the seeds reduces the
levels of eurcic acid below the levels causing pathologies in fish.
Glucosinolates are thyrotoxins, inhibiting the uptake of iodine leading to iodine deficiencies
even when additional iodine is supplemented. Fortunately, as mentioned above, canola is a
specifically bred strain of rapeseed developed for its low levels of glucosinolates. Standard
rapeseed meal would contain ~5% glucosinolates but canola meal contains <0.2%, at such
low levels no pathological effects are seen in fish.
1.5 Rationale
The rationale for this study has been derived from the four sections above, in summary they
are:
1. There is an ever increasing need to improve the use of the natural resources
wastefully used in aquaculture at the present time
2. Zinc needs to be focused on because of its biological importance in a vast number
systems regulating fish health and performance and also its potential environmental
impact if used in excess

Daniel Leeming
21
3. The formulation of practical diets using proteins from a growing list of sources, alien
to the natural diet of a salmonid species, brings with it a plethora of complications and
interactions between the nutrients provided by them. A deeper understanding of these
interactions is required
4. The fundamental research behind the bioavailability of minerals is confused and
contradictory. Very few studies, if any, use the genetically coded transcriptome of an
animal combined with analysis of the synthesised end products to quantify its
requirements. The use of which may add some clarity to this area of research.
1.6 Study objectives
This PhD thesis examines three possible methods for improving the digestibility and
bioavailability of zinc from salmonid diets.
1. The utilisation of other protein sources (Chapter 3);
2. The upstream use of enzyme treatment of the raw materials (Chapter 4);
3. The use of organically complexed mineral supplements as opposed to the
inorganic salts widely used at present (Chapter 5).
Throughout this study the biological availability of these supplements was investigated and
how the various forms are utilised by different tissues was assessed. In the later chapters
emphasis was placed on defining the minerals availability by their biological function within
the proteins they are required for. This includes quantifying the amount of the active protein
and comparing this to its coding in the transcriptome. A direct comparison between the
uptake of an organic and an inorganic form by the use of stable isotope labelled compounds
has also been made.
Daniel Leeming
22
CHAPTER 2: General Methodologies
2.1 Overview
The analytical procedures outlined in the following section were the fundamental techniques
undertaken throughout the present study. Diet formulation and individual experimental
designs unique to particular trials are described in the relevant experimental chapters. Unless
otherwise stated, all materials, chemicals and reagents were sourced from Fisher Scientific
Ltd. (Loughborough, Leicestershire, UK) and Sigma-Aldrich Ltd. (Poole, Dorset, UK). All
experimental work involving fish was carried out under the Home Office project licence #
30/2135 and personal license # 30/8705.
2.1.1 Rearing Facilities
All experimental trials were conducted at the University of Plymouth within a freshwater
recirculation system, number ‘F’, part of the Aquaculture and Fish Nutrition Research Groups
Aquarium (see fig 2.1.). The water quality parameters of a recirculation system, in order to
provide a suitable environment for the rearing of fish, must be maintained daily and kept
within the optimal ranges for the rearing of trout. The following levels of nitrogenous
compounds were considered acceptable; ammonia (un-ionized) <0.1 mg l-1
, nitrite < 1.0 mg l-
1 and nitrate < 50 mg l
-1. Water was tested for nitrogenous compounds on a twice weekly
basis using a Hach Lange DR 2800 and coded cuvettes for ammonia (Lange LCK 304),
nitrite (Lange LCK 341) and nitrate (Lange 340) (Hach Lange Ltd., Salford, UK). Partial
water exchanges were used, if required, to control the levels of the nitrogenous compounds.

Daniel Leeming
23
Figure 2.1. Recirculation system ‘F’, University of Plymouth. Letters correspond to (A) Outgoing
water to chiller; (B) incoming water from carbon filter and chiller; (C) Sump, containing bio-media
for bacterial filter; (D) Drum filter; (E) Waste water pipe. Arrows indicate the direction of flow from
experimental tanks to drum filter.
Temperature was maintained at 15.1 ± 1 °C with a thermostatically controlled chiller
(Optipac R407C, PSA, Saint Barthelemy, D’Anjou, France). Dissolved oxygen levels, pH,
and temperature were monitored daily using an electronic meter (Hach HQ4d). There is a
natural decrease of pH in a recirculation system caused by the nitrification consuming OH-
ions and produces acids, and also the carbon dioxide produced by fish forms carbonic acid
(H2CO3) in the aqueous environment. The pH of recirculating water was maintained between
6.5 and 8.0 with the addition of sodium bicarbonate (NaHCO3) as required. The saturation of
dissolved oxygen was maintained above 80 %, for both fish and bio-filter (Masser et al.,
Daniel Leeming
24
1999), by a continual supply of compressed air (compressor: Rietschle, UK) delivered via air-
stones within each tank and a perforated pipe to the sump.
The system (tanks, sump and pipework) had a total volume of ~6000 l. Twenty experimental
130 l fibreglass tanks each received water at a rate of ~800 l h-1
. A 12 h light/dark
photoperiod was maintained throughout all experimental trials with an automated T5 lighting
system. A continual top up at 10 l h-1
of municipal water, treated by an activated carbon filter
(Commandomatic TCF, Waterco Ltd., Sittingbourne, Kent, UK) to remove chlorine and
organic compounds, was used to maintain water volume and counteract any loss from
evaporation.
The mechanical filtration, used to remove particulate material arising from faecal material,
undigested feed and sloughed bacteria from the bio-filter was provided by a rotating drum
screen filter (Aquasonic DF100, Aquasonic Ltd, Wauchop, Australia).
2.1.2 Experimental Fish
All experimental work was carried out on juvenile all female triploid (XXX) rainbow trout
(Oncorhynchus mykiss Walbaum 1792) obtained from Torr Fisheries (North Devon, UK).
Fish were transported directly from the fishery to the aquarium facility in a 1000 l tank
supplied with pure oxygen (BOC, UK); transport time was approximately two hours. On
arrival fish were gradually acclimated to the temperature of the aquarium facility over a
period of one hour. All fish were checked on arrival, monitored daily and fed ad libitum a
commercial trout diet (EWOS, West Lothian, UK) for a period of at least three weeks until
graded into experimental tanks. Fish were randomly allocated into the experimental tanks 2-
3 days prior to commencing the experimental trial. Anaesthetisation of fish was carried out
Daniel Leeming
25
within Home Office procedures with tricane methanesulfonate (MS-222) (Pharmaq Ltd.
Fordingbridge, Hampshire, UK) at a dose rate of 80 mg l-1
, buffered with sodium bicarbonate
until the pH was equal to the system water.
2.1.3 Feed and Weighing
Feeds were formulated using FeedSoft Pro™ which requires the input of the nutrient profile
of each raw material. For this all the raw materials were analysed for moisture, oil, protein
and ash. Calcium, phosphorus, sodium, potassium, magnesium, manganese, copper, zinc,
sulphur and iron were also analysed and data is presented in the appendices (sections 8.1 and
8.2)
Feed was calculated as a percentage of the total biomass in each tank. The biomass was taken
at t = 0 and throughout the trials every two weeks. Within this two week period the feed input
was adjusted daily, based on a predicted feed conversion ratio (FCR) of 1. The fish were fed
two equal rations twice daily at ~09:00 and ~18:00 hours. Feed input was adjusted
accordingly in the event of any mortality.
2.1.4 Growth and Feed Performance
Growth performance and feed utilisation was assessed by specific growth rate (SGR) and
FCR. Calculations were as follows:
SGR = ((Ln final wt. (g) - Ln initial wt. (g)) / (Days fed)) × 100
FCR = feed intake (g) / live weight gain (g)
(Ln is the natural log)
Daniel Leeming
26
2.2 Proximate Analysis
Diets and carcass were analysed for moisture, ash, and lipid. All diets were ground by use of
a high speed blender and analysed on a wet weight basis. Analysis was conducted in triplicate
according to protocols of the AOAC (1990) which are outlined below.
2.2.1 Moisture
Percentage moisture was calculated using:
Moisture (%) = ((wet wt. (g) – dry wt. (g)) / (wet wt. (g))) × 100
Diets and carcasses (in triplicate, whole with peritoneal cavity opened) were weighed and
dried at 105°C with a fan-assisted oven (Genlab Ltd., UK) until a constant weight was
achieved. Percentage moisture was then determined.
2.2.2 Ash
Percentage ash was calculated using:
Ash (%) = Sample residue (g) / initial sample wt. (g) ×100
Ash content was determined in triplicate by adding approximately 500 mg to a pre-weighed
ceramic crucible. The samples were then incinerated in a muffle furnace (Carbolite, Sheffield,
UK) at 550°C for 12 hours. After cooling in a desiccator, percentage ash was determined.
2.2.3 Lipid
Percentage lipid was calculated using:
Total lipid (%) = ((cup (incl. lipid) wt. (g) – cup wt. (g)) / (initial sample wt. (g))) ×100
Daniel Leeming
27
Lipid content was determined in triplicate using the Soxhlet extraction method.
Approximately 3 g of the diet was added to a cellulose thimble with a cotton wool bung and
placed in the thimble holder suspended over a beaker of known weight containing 40 ml of
petroleum ether and inserted into the condenser. The condenser was raised into the ‘rinsing’
position on the SoxTec™ extraction system (Tecator Systems, Högnäs, Sweden; model 1043
and service unit 1046). The beakers, petroleum ether and thimbles were then clamped into the
condensers and the unit set to ‘boiling’ for 30 min, after which the unit was set to ‘rinsing’
for 45 min to wash out all lipid present in the samples. The petroleum ether was then
evaporated and the beakers containing extracted lipid were then transferred to a fume
cupboard, cooled for 30 min and weighed. Total lipid content was then determined.
2.2.4 Protein
Determination of total crude protein in diets, feed ingredients and carcasses was measured in
triplicate by the Kjeldhal method. The Kjeldahl method measures protein from the total
nitrogen content of samples. The nitrogen content is then multiplied by a factor of 6.26 (5.71
for proteins of plant origin) to calculate apparent protein content (AOAC, 1990). In brief,
~100 mg of sample was weighed directly into a micro Kjeldahl tube along with one catalyst
tablet (3g K2SO4, 105 mg CuSO4 and 105 mg TiO2; BDH Ltd., Poole, UK), 10 ml
concentrated sulphuric acid (H2SO4) (Sp. Gr. 1.84, BDH Ltd. Poole, UK) was added and
digestion was performed with a Gerhardt Kjeldatherm digestion block (Gerhardt Laboratory
Instruments, Bonn, Germany). The thermo-cycle schedule followed; 30 min at 100 °C, 45
min (1 h if samples had high lipid content) at 225 °C, and 1 h at 380 °C. Once digestion was
complete and following a cooling period, the samples were distilled into excess boric acid to
form an ammonium borate complex using a Vapodest 40 automatic distillation unit (Gerhardt

Daniel Leeming
28
Laboratory Instruments, Bonn, Germany), the distillate was neutralised with concentrated
H2SO4 and the titration value obtained. The efficiency of the nitrogen recovery was also
measured by including triplicate samples of acetanilide which has a known nitrogen content
of 10.36 and sample (and blanks) nitrogen contents were corrected for the efficiency prior to
use in the calculation. Analyses with efficiencies of less than 95% were discarded and
repeated.
Percentage protein was calculated using:
Crude protein (%) = (((Ts –Tb) × NA × MWN × CF) / SW) × 100
Where Ts = sample titration volume (ml), Tb = blank titration volume (ml) and SW = sample
weight (mg). NA = the acid normality of the acid used (H2SO4=0.20) MWN = the atomic
weight of nitrogen (1400.67mg) and CF = the conversion factor of nitrogen to protein (6.25
animal and maize/ 5.71 plant).
2.3 Trace Element Analysis
2.3.1 Digestion
All trace element analysis was carried out in triplicate on nitric acid digested samples. For the
analysis of individual tissues, samples were freeze dried (Super Modulyo freeze-drier;
Girovac, UK) and percentage moisture determined from initial wet weight and final dry
weight. For the analysis of the whole body, samples were oven dried at 105ºC and percentage
moisture determined (see: section 2.2.1 Moisture). Dietary ingredients were analysed by wet
weight. All the samples were homogenised using a household blender or pestle and mortar
prior to digestion. Approximately 100 mg sample was weighed directly into each micro

Daniel Leeming
29
Kjeheldahl tube and digested in 10 ml nitric acid (70 % ANALAR grade). Samples were
digested using a Gerhardt Kjeldatherm 40 tube digestion block (Gerhardt Laboratory
Instruments, Bonn, Germany) and the following thermo-cycle was used; 1h at 60 C, 1h at 90
C, 30 min at 110 C, and up to 4h at 135 C. After a cooling period of 1h, samples were
then transferred into 50 ml polypropylene vials and diluted to ~ 50 ml with ultra-pure Milli-Q
water (Millipore Corp., MA, USA). Duplicate blanks comprising of only nitric acid and
hydrogen peroxide were also analysed in each digestion run.
2.3.2 ICP OES/MS
All minerals were analysed by Inductively Coupled Plasma Optical Emissions Spectrometry
(ICP OES) (Varian 725-ES OES spectrometer, Varian Inc. CA, USA) using the following
wavelengths for each element (nm); Ca 422.67, Cu 327.39, Fe 238.20, K 766.49, Mg 285.21,
Mn 257.61, Na 589.59, P 213.61, S 181.97, Y 371.03 and Zn 213.857. For samples
containing Y (as an inert internal marker of digestion), a 1 ppm internal indium (In) standard
was added to all sample digests (measured at 230.61nm). Zinc isotopes (66, 67, 68 and 70)
were analysed by high resolution Inductively Coupled Plasma Mass Spectrometry (ICP-MS)
(VG Axiom sector field ICP-MS, VG Elemental, Winsford, UK). Zinc isotope 64 was not
measured because of the inevitable polyatomic interference of 32
S2 molecules being measured
as 64. Germanium 72 was also analysed in order to prove the absence of Germanium from
the samples as germanium also has an isotope of 70 which would lead to the
misinterpretation of 70
Zn isotope ratios. Mass bias calculations were applied to all results
prior to ratio calculations to eliminate the instrumental artefact associated with the detection
of lighter isotopes.

Daniel Leeming
30
The ICP -OES operating conditions were as follows:
Power (KW) 1.40
Plasma Flow (L/min) 15.00
Auxilliary Flow (L/min) 1.50
Nebulizer Flow (L/min) 0.68
Veiwing Height (mm) 8.00
Replicate Read Time (s) 2.00
The ICP-MS operating conditions were as follows:
Power (KW) 1.40
Plasma Flow (L/min) 13.00
Auxiliary Flow (L/min) 0.70
Nebuliser gas flow (L/min) 0.86
Collision cell gas flow (mL/min) 3.50
Collision cell gas 7% hydrogen in helium
Concentrations of each element in the digests were determined in parts per million (ppm)
against an external standard calibration and concentrations in original samples calculated
using the following calculation:
Sample conc. (ppm) = digest vol. (ml) × digest conc. (ppm)
sample wt. (g)
2.3.3 Digestibility and Retention
The determination of net apparent digestibility (ADC) of trace elements and protein, the inert
marker yttrium oxide was added to diets at 1 g kg-1
yttrium oxide as recommended by Ward

Daniel Leeming
31
et al. (2005). Under light anaesthetic, faecal material was stripped from every fish in each
experimental tank by hand. Pressure was gently applied on the hind portion of the peritoneal
cavity. After one sample was taken the fish were allowed to recover for at least four days
during which they were fed ad libitum before being sampled again. Faecal material was
pooled for each replicate tank, dried at 105°C for 24 hours, and homogenised prior to trace
element analysis. Percentage apparent digestibility was determined from the faecal and
dietary concentrations of the element or protein relative to reciprocal concentrations of Y
using the following equation (Paripatananont and Lovell, 1997):
Apparent digestibility coefficient (ADC) (%)
= 100 × (1 – ([Y diet] × [
Element faeces]) / ([
Y faeces] × [
Element diet]))
Where [Y diet]is the concentration of yttrium in the diet, [
Y faeces]is the concentration of
Yttrium in the faeces, [Element
diet] is the concentration of the element in the diet and [Element
faeces] is the concentration of the element in the faeces
For the determination of the digestibility from individual ingredients with in the diet the
ADCs were incorporated into the following equation:
ADCIng (%) = [ADCtest – (1-i) x ADCref]/i
Where i is the proportion of the mineral supplied by the test ingredient.
Nutrient retention was determined from dietary and whole body element concentration
relative to feed and element intake concentration by the following equation:
Element retention (%)
= 100 x (final body wt.×[final whole body nutrient] – initial body wt.×[initial whole body nutrient]) (Feed consumed × [dietary nutrient]))

Daniel Leeming
32
Where [final whole body nutrient] is the concentration of the nutrient in the whole body at the
end of the trial, [initial whole body nutrient] is the concentration of the nutrient in the whole
body at the start of the trial and [dietary nutrient] is the concentration of the nutrient in the
feed.
2.4 Determination of Zinc-Dependent Enzymes
Activities of zinc dependent enzymes were assayed in triplicate and normalised to sample
protein concentration or tissue weight in the case of metallothionein.
2.4.1 Protein
Sample protein in homogenates was determined by the method as described by Smith et al.
(1985), in which a spectrophotometric bicinchoninic acid (BCA (Kit: Sigma; BCA1-1KT) is
used. The assay uses a copper/protein complex that forms relative to the amount of protein
present. Tissue homogenates were diluted 1:10 with distilled water. 1 part reagent A (copper
(II) sulphate) was mixed with 50 parts reagent B (BCA solution). 25µl of sample homogenate
was added to 200 µl reagent mixture in a clear 96 well microplate. The plate was then
incubated for 30 min at 37 °C (Heraeus, Kendo Laboratory Products, Hanau, Germany)
before being read at 550 nm (Optimax Tuneable Microplate Reader, Molecular Devices, CA,
USA). Sample protein was determined in mg/ml against a standard curve of bovine serum
albumin (BSA).
Sample protein (mg ml-1) = ((A550 change over 30 min) × (slope of absorbance vs. mg protein)
- intercept of absorbance vs. mg protein) × dilution factor

Daniel Leeming
33
2.4.2 Superoxide Dismutase
A Fluka SOD determination kit (Kit 19169, Sigma, Poole, UK) was used to measure hepatic
superoxide dismutase (SOD). The reaction was based on the inhibition of the formation of 2-
(4-lodophenyl)-3-(4-nitrophenyl)-5-(2,4-disulfophenyl)-2H-tetrazolium, monosodium salt
(WST-1). Liver samples were homogenised in 1 in 9 in 0.25 M sucrose buffer adjusted to pH
7.4 (0.25 M sucrose, 10 mM Tris-BASE, 1 mM EDTA) and further diluted 1 in 20 with
buffer, centrifuged at 10,000 g for 15 min at 4 °C and the assay was performed according to
the manufacturer’s instructions. Briefly, 20 µl of sample was added to each plate well. 200 µl
WST working solution and 20 µl of enzyme working solution were added and the plate
mixed thoroughly. The plate was then incubated at 37 °C (Heraeus, Kendo Laboratory
Products, Hanau, Germany) for 20 min and then read at 450 nm with a microplate reader
(Optimax Tuneable Microplate Reader, Molecular Devices, CA, USA).
SOD activity (% inhibition rate) was determined by the following calculation:
SOD activity =
(((Abs blank 1 – Abs blank 2) – Abs sample) / (Abs blank 1 – Abs blank 2)) ×100
Where; ‘Abs blank 1’ is the absorbance of a blank where sample is substituted for distilled
water; ‘Abs blank 2’ is the absorbance of a blank which includes enzyme dilution buffer
instead of enzyme working solution. ‘Abs sample’ is the absorbance of the sample.

Daniel Leeming
34
Specific enzyme activity (unit SOD) was determined from a standard curve of units SOD vs. %
inhibition and normalized to sample protein (mg).
Units SOD/ mg protein =
((% inhibition × slope of % inhibition vs. units SOD) - intercept of %
inhibition vs. units SOD) / mg sample protein
2.4.3 Metallothionein
Tissue levels of metallothionein were measured using the silver saturation assay
(Scheuhammer and Cherian, 1991). Silver is used as it has a higher affinity for the protein
thiols than any other metals found in association with metallothionein. It displaces all other
metals bound to the protein and binds itself to the thiols in their place (as well as to cytosolic
proteins and ligands). The addition of haemoglobin will then bind to any excess silver and
take the silver of all other ligands apart from metallothionein. Heating then causes the
haemoglobin bound silver to precipitate leaving only the heat stable metallothionein bound
silver in the supernatant, which can subsequently be measured with ICP OES and the
concentration of silver in µg can be converted to concentration of metallothionein by using:
µg MT/g tissue = (([AgSup
] – [AgBlank
]) x 3.55 x VT x DF) / SV
where [AgSup
] = concentration of silver in the final supernatant, [AgBlank
] = concentration of
silver in a blank, 3.55 = the ratio of silver to metallothionein, VT = the total volume of the
assay sample, DF is the sample dilution factor and SV = Sample volume.

Daniel Leeming
35
2.4.3.1 Sample preparation
Livers were removed from the fish and halved, each half was frozen separately; one for the
determination of metallothionein concentration and one for the metallothionein gene
expression analysis (see section 2.6). Approximately 350mg of the frozen tissue was
homogenised in 4 volumes of 0.25M sucrose solution. The homogenate was centrifuged at
18,000g for 20 min and the resulting supernatant removed and frozen at -80 until required for
metallothionein determination.
2.4.3.2 Haemolysate preparation
A red blood cell haemolysate was prepared according to Onosaka and Cherian (1982). Briefly,
10ml of mammalian blood was added to 20ml of heparinised isotonic KCl (1.15%, w/v) and
centrifuged a 500g for 5min. The supernatant was discarded and the pellet resuspended in
30ml of the heparinised 1.15 KCl solution. The centrifugation/resuspension was repeated
twice and the final pellet was lysed for 10 min in 15ml of Tris base buffer (30mM, pH 8.0) at
20ºC. The lysate was centrifuged at 8000g for 10min and the supernatant (red blood cell
haemolysate) was divided into 2ml aliquots and frozen at -80ºC until required.
2.4.3.3 Assay procedure
The frozen tissue supernatant was thawed and 250 µl was added to an acid washed glass test
tube. Triplicate samples were taken from each liver homogenate supernatant. 550 µl of
glycine buffer (0.5M, pH 8.5 adjusted with NaOH). A AgNO3 stock solution (9.27 mM;
1000µg Ag+/ml) was diluted to a 20 µg/ml Ag
+ working solution and 500 µl was added to
Daniel Leeming
36
glycine/supernatant mix and incubated at 20ºC for 5 min. 100µl of the haemolysate was
added and mixed on a vortex mixer the heated in a boiling water bath for 1.5 min then
centrifuged at 1200g for 5 min. The addition of 100 µl haemolysate, the heating and the
centrifuge were repeated once more making the total volume 1.5 ml. The resulting clear
supernatant was removed and added to another acid washed centrifuge tube and spun at
15,000g for 5 min. The final supernatant was analysed for silver concentration using ICP
OES (328.07 nm) and the concentration per g of liver calculated.
2.5 Single Cell Gel Electrophoresis
2.5.1 Sample preparation
The SCGE or ‘Comet’ assay Single can identify strand breaks and oxidised nucleotides
(Singh et al. 1988) in erythrocytes. 100µl samples of whole blood were mixed with 900 µl
freezing medium (20 % (v/v) bovine serum albumin (Invotrogen, Gibco, Paisley, UK), 40 %
(v/v) RPMI-1640 medium (Sigma, Poole, UK) and 20 % DMSO (v/v) for cryopreservation at
-80 °C.
2.5.2 Assay procedure
Microscope slides were coated with 1.5 % normal melting agarose (NMA) and left to air dry.
Whole blood/freezing medium was further diluted 1 in 5000 with CaCl2 and MgCl2-free
DPBS physiological saline solution (Gibco, Invitrogen, Paisley, UK) to give a cell count of
approximately 2.4x10⁵
cells ml-1
. Cells were resuspended in 0.75 % low melting agarose
(LMA). In duplicate, two 85 µl spots of the cell/agarose suspension (four spots per sample,
five fish per tank, three tanks per treatment) were placed on to each slide, covered with 22
Daniel Leeming
37
mm2 cover slips and left to set at 4 °C for one hour. Once the gel had set, the cover slips were
then removed and slides were immersed in lysis solution (2.5 mM NaCl, 100 mM Na2EDTA,
10 mM tris-BASE, 10 % DMSO, 1 % Triton X-100, 1 % n-lauroyl-sarcosinate and adjusted
with NaOH to pH 10) for one hour. Slides were then placed in a horizontal electrophoresis
chamber in electrophoresis buffer (0.3 M NaOH and 1 mM EDTA) to a level <1 mm above
gels and DNA left to unwind for 10 min. Electrophoresis was performed for 20 min using a
current of 300 mA and 25 V (Apelex ST 1006T electrophoresis unit). After electrophoresis
slides were washed in neutralisation buffer (0.4 M Tris-chloride pH adjusted to 7.5 with HCl)
for 10 min followed by distilled water for 10 min. Slides were then left to air dry for 24 hours
(to align DNA on the same focal plane for ease of scoring) before staining with 80 µl 2 µg
ml-1
ethidium bromide solution and covering with 24/50 mm cover slips,. Stained slides were
scored immediately using a fluorescence microscope (Leica DMR) and Komet 5.0 image
analysis software (Kinetic Imaging Ltd., Liverpool, UK). Percentage tail DNA, was measured
in 50 nucleoids per gel (100 per slide) (Kumaravel & Jha, 2006).
2.6 Gene Expression
2.6.1 RNA extraction
Total RNA was extracted using an RNeasy MiniKit for animal tissue (Qiagen, Manchester,
UK). Briefly, approximately 20mg of liver (taken from the other half used for
metallothionein analysis) was homogenised by sonication (3-5 sec pulse) on ice in 350 µl
RLT buffer. The resulting homogenate was added to a shredder column (QuiShredder,
Qiagen) centrifuged for 3 min at 13,000 g and supernatant collected in a DNA free tube and
centrifuged again. The final supernatant was mixed with 1 vol 70% ethanol and added to an
RNeasy column and centrifuged for 15 sec at 13,000 g. The column was washed with 350 µl

Daniel Leeming
38
of RW1 buffer. A 15 min DNase treatment was conducted and the column washed again
with 350 µl RW1 buffer. Two further washes of 500 µl RPE buffer were carried out and the
RNA was eluted into 30 µl RNA free water. The quality and quantity of total RNA was
determined by spectrophotometry (Nanodrop, ND-1000 Spectrophotometer) reading of
260/280 nm ratio and 260/230 nm ratio. Only samples with a 260/280 ratio of 1.9-2.2 and
260/230 ratio >1.5 were considered acceptable. All samples were diluted to 100 ng/µl and
frozen at -80ºC until reverse transcription into cDNA was to be carried out.
2.6.2 cDNA Synthesis
Reverse transcription of the RNA to cDNA was carried out using ImProm-IITM
reverse
transcription system (Promega, Southampton, UK). Briefly, 800ng (8 µl of eluted RNA) was
added to a working solution of ImProm-II 5X reaction Buffer (0.83X; Promega, UK), MgCl2
(2.5mM; Sigma-Aldrich, UK), deoxynucleotide mix (0.36mM; Sigma-Aldrich, UK),
Hexanucleotide primers (0.021 µg/µl; Sigma-Aldrich, UK) and ImProm-II reverse
transcriptase (4.17% v/v; Promega, UK) made up with RNA free water. cDNA was
synthesised by PCR (GeneAmp® PCR System 9700, Applied Biosystems) with one thermo-
cycle of annealing for 5 min at 25ºC, extension for 60 min at 42ºC and heat inactivation for
15min at 70ºC. cDNA was stored at -80ºC until qRT-PCR analysis.
2.6.3 qPCR
Lyophilised primers were obtained (Eurofins MWG Operon, Ebersberg, Germany) and were
rehydrated with RNase free water to a stock concentration of 100µmol. Forward and reverse
primers were mixed with SYBR Green JumpStart Taq ReadMix (20mM tris-HCl, 100mM
Daniel Leeming
39
KCl, 7mM MgCl2, 0.4mM dNTP mix, 0.05 unit/µl Taq polymerase, Jumpstart Taq antibody,
SYBR Green 1) to give a working solution concentration of 375 nmol. 6 µl of liver cDNA
was added to the primer/SYBR Green mix and fluorescence was detected over 40 cycles of
PCR using a StepOne Real-Time PCR system (Applied Biosystems, USA). Thermo-cycling
conditions were; denaturing at 94ºC for 15 sec, primer specific annealing at 53-55 ºC (table
5.2) for 1min and extension at 72 ºC for 1min with fluorescence detection switch on. The
cycle threshold was set at 25,000 for all runs and a standard curve of pooled cDNA was run
on each plate for normalisation between each plate run.
2.7 Statistics
All statistical analysis was carried out using SPSS for Windows versions 17-20. Unless
otherwise stated all means are reported ± standard error of the mean (SEM) or pooled SEM.
Prior to analysis all data was tested for homogeneity of variance (Levene test) and normality
of distribution (Kolmogorov-Smirnov test). Differences across treatments were modelled by
one-way ANOVA and where appropriate, either a post hoc Fisher’s least significant
difference (LSD) test or a Tukey’s HSD range test was performed to make pair wise
comparisons between individual treatments. Data violating the assumptions of parametric
tests (SCGE data) after log transformation were tested with the equivalent non-parametric
Kruskal-Wallis and Mann-Whitney U tests. All percentage data was arcsine transformed prior
to analysis. In instances where n=2 due to restrictions on tank space (chapter 3), to allow
statistical evaluation, measurements used in the statistical analyses were taken from
individual fish as opposed to whole tank averages. This method, although not allowing for
tank effects, was necessary to allow some meaningful comparisons between treatments to be
made. Unless otherwise stated, differences were considered significant at a value of p ≤0.05.
Daniel Leeming
40
CHAPTER 3. Digestibility and bioavailability of endogenous zinc in
potential alternative protein sources
3.1 Introduction
The inclusion of plant protein, terrestrial animal protein and co-products of fermentation
processes into fin fish feeds is of great interest to the aquaculture industry (Alexis 1997;
Alexix and Nengas, 2001; Espe et al 2006; FAO 2002; Kaushik et al, 1995; Watanabe et al,
1998). Extensive research in this area has been driven by feed manufacturers, wanting to
reduce the increasingly expensive fishmeal in their diets, and by producers of ‘alternative’
protein sources who now find that their products and by-products are economically viable as
fishmeal increases in price (New and Wijkstrom, 2002; Tacon and Metian, 2008). Public
perception and environmental issues with regard to overfishing wild stocks are also applying
further incentive to reduce the amount of fishmeal in carnivorous fish species diets (Naylor
2000). However, fishmeal in these diets cannot simply be replaced by substituting a product
with an equal protein concentration. Each protein source will have its own amino acid profile,
the deficiencies of which are well documented in the literature (Aslaksen et al 2007; NRC
1993; NRC 2011) as are the feed formulation methods of avoiding these deficiencies
(Barrows et al, 2007; Barrows et al 2008; Gatlin et al 2007). Each protein source also has its
own, specific, mineral profile. For the majority of products, these profiles, on a weight to
weight basis, often exceed the published requirements for salmonids (NRC 2011). However,
running a laboratory based analysis of the product does not fully provide insight into the
actual biological availability of the minerals. Many plant proteins and animal proteins
derived from trimmings contain anti-nutritional factors (ANFs) which further reduce the
biological availability of the minerals (Gatlin et al 2007). These factors should be taken into
account when formulating diets but there is currently limited information about the

Daniel Leeming
41
biologically available levels of minerals in different protein sources, and what information
there is has often been calculated using different methods.
Zinc is a mineral of great biological importance to fish, second only to iron (Kiron 2012; Lall
2002; Watanabe et al 1997). Zinc is responsible for the formation, structure and activity of
over 300 proteins involved DNA repair (Ho and Ames, 2002), antioxidant activity (Luo et al,
2011), eye function (Nusetti et al 2010), and immune function (Lall, 2002). The dietary
requirement of zinc for rainbow trout is published as 15-30 mg/kg (Ogino and Yang, 1979),
Atlantic salmon 37 mg/kg (Maage and Julshamn, 1993), hybrid tilapia 26-29 mg/kg (Lin et al
2008) and common carp 15-30 mg/kg (Ogino and Yang, 1979). The average zinc
concentration in high quality fishmeal is 64 mg/kg, soyabean meal 49 mg/kg, maize gluten
meal 16 mg/kg, poultry meat meal 76 mg/kg, low quality white fishmeal 129 mg/kg and yeast
146 mg/kg. Diets containing 65 mg Zn/kg fed to Atlantic salmon could not maintain normal
whole body zinc status and required additional zinc supplementation up to 140 mg Zn/kg
(Lorentzen and Maage, 1999). Rainbow trout fed a low quality white fishmeal diet required
an additional 40 mg Zn/kg supplementation to maintain normal growth (Satoh et al, 1987)
and when fed a soyabean based diet required 150 mg Zn/kg to be supplemented.
Despite the quantity of material published concerning the zinc supplementation requirements
and availability of minerals from frequently used protein sources there is very little
consistency in the literature regarding experimental designs or the interpretation of results.
The first criticism is that zinc transport, including its uptake, is very highly regulated in fish.
Dietary levels of 1700 mg Zn/kg diet has no effect on the whole body zinc content of rainbow
trout (Wekell et al, 1983) indicating zinc uptake conforms to a non-toxic saturation model
and the excess dietary zinc is not absorbed from the GI tract. With the knowledge of both
this highly regulated uptake and the relatively low zinc requirements why the majority of zinc
Daniel Leeming
42
digestibility studies conducted with rainbow trout still use zinc levels multiple times higher
than the animals’ requirements is unclear.
A second criticism of the literature on this topic is that few papers use the same end point or
marker of zinc status. Maage and Julshamn (1993) use whole body zinc, Hernandez et al
(2012) used growth parameters, and Rider et al (2010) used tissue zinc levels. This lack of
focus on one consistent endpoint may explain many seemingly contradictory reports.
The final criticism of the literature is of the use of the equation to calculate the apparent
digestibility coefficient (ADC) for minerals from individual protein sources (section 2.3.3).
It seems common practice to use the proportion of the test protein source incorporated in the
diet as ‘i’ in the equation even when the proportion of the mineral supplied by the test protein
source is different to the proportion of the protein supplied.
The aim of this experiment is to calculate the ADC for zinc from six commonly used protein
sources by a) using diets that do not meet the zinc requirements of rainbow trout, this will
ensure maximum uptake of digestible zinc; and b) using diets that are formulated to have 60%
of the zinc supplied by the test protein source. This investigation will also establish markers
of zinc deficiency (as opposed to indicators of zinc transport) by measuring the effect of
chronic zinc deficiency on the metabolic and exchangeable/storage zinc pools throughout the
body.

Daniel Leeming
43
3.2 Methods
3.2.1. Experimental design
Two separate feeding trials were conducted with a reference casein based diet and six
subsequent test diets containing either maize gluten meal (MGM), soyabean meal (SBM),
poultry meatmeal (PMM), high quality brown fishmeal (LT94), low quality white fishmeal
(WFM) or NuPro®
(NP). All ingredients were analysed for protein, lipid, ash, moisture and
mineral composition (see 8.1 and 8.2). Diets were formulated to be isonitrogenous, isolipidic
and have 60% of the zinc supplied by the test protein source and be deficient in zinc (Table
3.1).
Trial 1: Digestibility
A total of 210 rainbow trout (O.mykiss) weighing 300 ±15.8g were divided into 14 x 126
litre tanks (15 fish per tank). Fish were acclimated for two weeks and fed an EWOS
commercial diet (43% protein, 24.9% lipid) at 1% biomass per day. Each diet was
randomly assigned to two tanks. Experimental diets were fed for two weeks at 2% body
weight per day, followed by one week being fed to apparent satiation twice daily (09:00
and 18:00) leading up to sampling in week 4.
Trial 2: Bioavailability
A total of 480 rainbow trout (O.mykiss) weighing 40 ± 3.5g were divided into 16 x 126
litre tanks (15 fish per tank). Fish were acclimated for two weeks and fed an EWOS
commercial diet (43% protein, 24.9% lipid) at 1% biomass per day. Each diet was
randomly assigned to two tanks. Experimental diets were fed for five weeks at 3% body
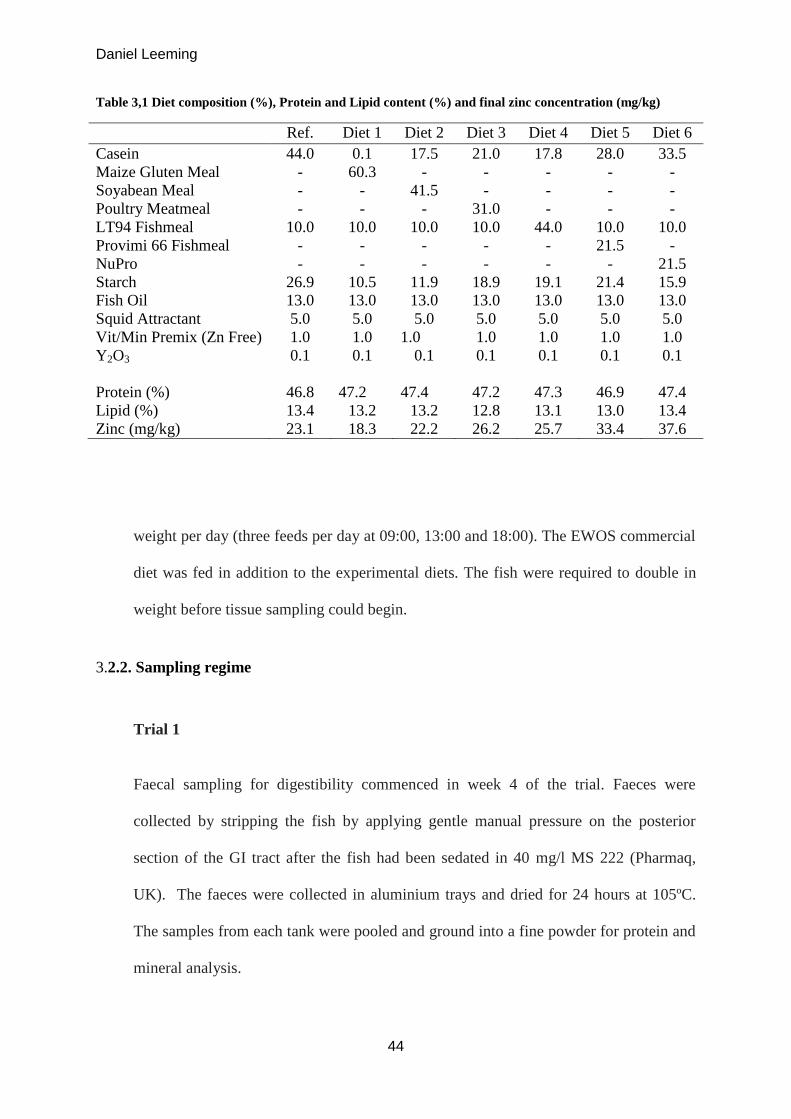
Daniel Leeming
44
Table 3,1 Diet composition (%), Protein and Lipid content (%) and final zinc concentration (mg/kg)
Ref. Diet 1 Diet 2 Diet 3 Diet 4 Diet 5 Diet 6
Casein 44.0 0.1 17.5 21.0 17.8 28.0 33.5
Maize Gluten Meal - 60.3 - - - - -
Soyabean Meal - - 41.5 - - - -
Poultry Meatmeal - - - 31.0 - - -
LT94 Fishmeal 10.0 10.0 10.0 10.0 44.0 10.0 10.0
Provimi 66 Fishmeal - - - - - 21.5 -
NuPro - - - - - - 21.5
Starch 26.9 10.5 11.9 18.9 19.1 21.4 15.9
Fish Oil 13.0 13.0 13.0 13.0 13.0 13.0 13.0
Squid Attractant 5.0 5.0 5.0 5.0 5.0 5.0 5.0
Vit/Min Premix (Zn Free) 1.0 1.0 1.0 1.0 1.0 1.0 1.0
Y2O3
0.1 0.1 0.1 0.1 0.1 0.1 0.1
Protein (%) 46.8 47.2 47.4 47.2 47.3 46.9 47.4
Lipid (%) 13.4 13.2 13.2 12.8 13.1 13.0 13.4
Zinc (mg/kg) 23.1 18.3 22.2 26.2 25.7 33.4 37.6
weight per day (three feeds per day at 09:00, 13:00 and 18:00). The EWOS commercial
diet was fed in addition to the experimental diets. The fish were required to double in
weight before tissue sampling could begin.
3.2.2. Sampling regime
Trial 1
Faecal sampling for digestibility commenced in week 4 of the trial. Faeces were
collected by stripping the fish by applying gentle manual pressure on the posterior
section of the GI tract after the fish had been sedated in 40 mg/l MS 222 (Pharmaq,
UK). The faeces were collected in aluminium trays and dried for 24 hours at 105ºC.
The samples from each tank were pooled and ground into a fine powder for protein and
mineral analysis.

Daniel Leeming
45
Trial 2
The initial sampling was conducted prior to the fish being fed the experimental diets
and 16 fish were sampled (one per tank). The fish were pooled, eight fish were used for
whole body analysis and eight fish were dissected for their liver, muscle, fin, bone
(vertebra), eye, and mid-intestine. Serum and bile were also collected.
Once all fish had doubled in weight the liver, muscle, fin, bone (vertebra), eye, mid-
intestine, serum and bile were collected. Four fish from each tank were anaesthetised
using 120 mg/l MS 222 (Pharmaq, UK). Serum was obtained by the collection of 1 ml
of blood from the caudal vein which was left to clot overnight at 4ºC. The sample was
then spun at 1800 g for 5 min, the supernatant removed and then spun again at 1800 g
for 2 min. The serum was then immediately digested in nitric acid ready for mineral
analysis.
After the blood had been sampled from the anaesthetised fish it was killed by
destruction of the brain (schedule 1 method, Home Office). The tissues were removed.
The intestines were rinsed in distilled water to remove any faecal matter and along with
the other tissues were freeze dried (Edwards Supermodulyo Model 12K West Sussex,
UK: vacuum chamber evacuated to 08 x 10-3
mbar, 48hrs condensation trap @ -50ºC).
The four samples from each tank were pooled and ground down into a fine powder for
the nitric acid digest and mineral analysis.
The bile was collected by holding the intact gall bladder over a 2ml centrifuge tube and
pierced with a scalpel blade. The bile was frozen at -80°C and later thawed and
digested for mineral analysis.

Daniel Leeming
46
Four fish were also removed from each tank, anaesthetised with MS 222 and killed by
destruction of the brain (schedule 1 death, Home Office) for whole body analysis.
3.2.3. Analytical Procedures
Protein, lipid, ash and moisture content were determined in each diet (section 2.2), ICP-OES
was used to perform trace element analysis on all diets (table 3.1), faeces and tissues (section
2.3). Levels of Ca, Cu, Fe, K, Mg, Mn, Na, P, S and Zn were analysed for their digestibility
and tissue levels and Y was analysed as an indigestible dietary marker for use in the ADC
calculations.
3.2.4. Calculations
The ADCs of dry matter, crude protein and minerals were calculated as the fraction net
absorption of nutrients from diets based on yttrium as a non-absorbable indicator (Austreng et
al.,2000). The ADCs of dry matter was first calculated, using the formula:
ADCDM (%) = 100 x [1-(conc. of yttrium in diet/ conc. of yttrium in faeces)]
This was further expanded to calculate the ADCs for minerals in the diet by multiplying the
(conc. of yttrium in diet/ conc. of yttrium in faeces) by (mineral concentration in the
faeces/mineral concentration in the diet):
ADCdiet (%) = 100 x [1-(conc. of yttrium in diet/ conc. of yttrium in faeces) x (mineral
concentration in the faeces/mineral concentration in the diet)]

Daniel Leeming
47
The ADCs for the nutrients in the test ingredients were calculated by incorporating the
percentage of each mineral supplied by the alternative protein source:
ADCIng (%) = [ADCtest – (1-i) x ADCref]/i
where ADCIng is the ADC of the alternative protein source; ADCtest and ADCref are the ADCs
for the experimental and reference diets respectively; and i is the proportion of the mineral
supplied by the test ingredient.
The SGR was calculated as:
SGR = 100 x (Ln. final body weight – Ln. initial body weight)/no. days in trial
The FCR was calculated as:
FCR = feed intake (g)/body weight gain (g)
The net retention of zinc was calculated as:
100 x (amount of Zn fed (g)/amount of whole body zinc gained (g))
3.2.5. Statistics
Statistical analysis was performed using analysis of variance. A Tukeys multiple range test
was applied to rank significantly different means. Computer software, SPSS v17 was used to
perform the statistical calculations; p<0.05 was considered statistically significant for all
analyses. Where n=2 individual fish measurements were used for statistical analysis.

Daniel Leeming
48
3.3 Results
3.3.1 Apparent Digestibility Coefficients
Table 3.2 displays the ADCs for Zn, Ca, Cu, Fe, K, Mg, Mn, Na, P, and S from the casein
reference diet and the 6 test protein sources.
The apparent digestibility coefficients (ADCs) for zinc from the test ingredient range from
15.1% in LT 94 fishmeal to 49.4% in soyabean meal. The amount of zinc available to the
fish from each protein source was calculated using the ADCs, and the concentrations
analysed in the raw materials (appendix 8.1) are displayed in figure 3.1. Soyabean meal is
shown to have the most available zinc. The lower quality Provimi 66 fishmeal (high ash) has
more available zinc than the LT94 fishmeal.
Maize gluten, soyabean meal and poultry meatmeal all report negative calcium ADCs, and the
other 4 ingredients reported relatively low ADCs. There is no correlation between the dietary
level of Ca and the negative ADCs, nor is there between any levels of other minerals.
Table 3.2 Mineral ADCs (%) for the 6 test ingredients and the casein reference diet
Diet Ca Cu Fe K Mg Mn Na P S Zn
Ref. 16.8bcd
68.9dg
24.1d 84.9
b 48.5
g 22.3
beg 19.4 90.6 85.3 74.3
MG -15.5 63.4g 23.5
d 26.0 31.6
g 4.9
e -378.8
a 23.1
a 73.7 31.9
a
SB -35.8 59.3g 20.6
d 91.3
b 49.0
g 18.1
beg -1923.1
ab 57.3
ab 25.8
ab 49.4
ab
PM -17.5 48.4g 12.2 93.0
b 28.7
g 10.9
e -38.8ab
c 19.9
ac -2.7
abc 15.8
abc
LT 4.6abcd
68.8dg
20.3d 98.5
a
b
55.1g -1.6 68.8ab
c 44.4
abd 63.6
acd 15.1
abc
P66 6.4adcd
51.5g 26.1
d 94.3
b 47.4
g 13.7
be 2.6
abcde 23.8
ace 33.3
abde 26.6
acde
NP 13.4bcd
27.1 19.3d 97.1
b 71.9 8.4
e -1116.41
abcdef 60.2
abdf 94.2
bcdef 26.1
acde
Suffixed values denotes significant difference from a - Ref, b - maize gluten meal (MG), c - soyabean
meal (SB), d - poultry meatmeal (PM), e - LT94 fishmeal (LT), f - Provimi 66 fishmeal (P66), g –
NuPro (NP). ANOVA p<0.05, LSD post hoc (n = 3)
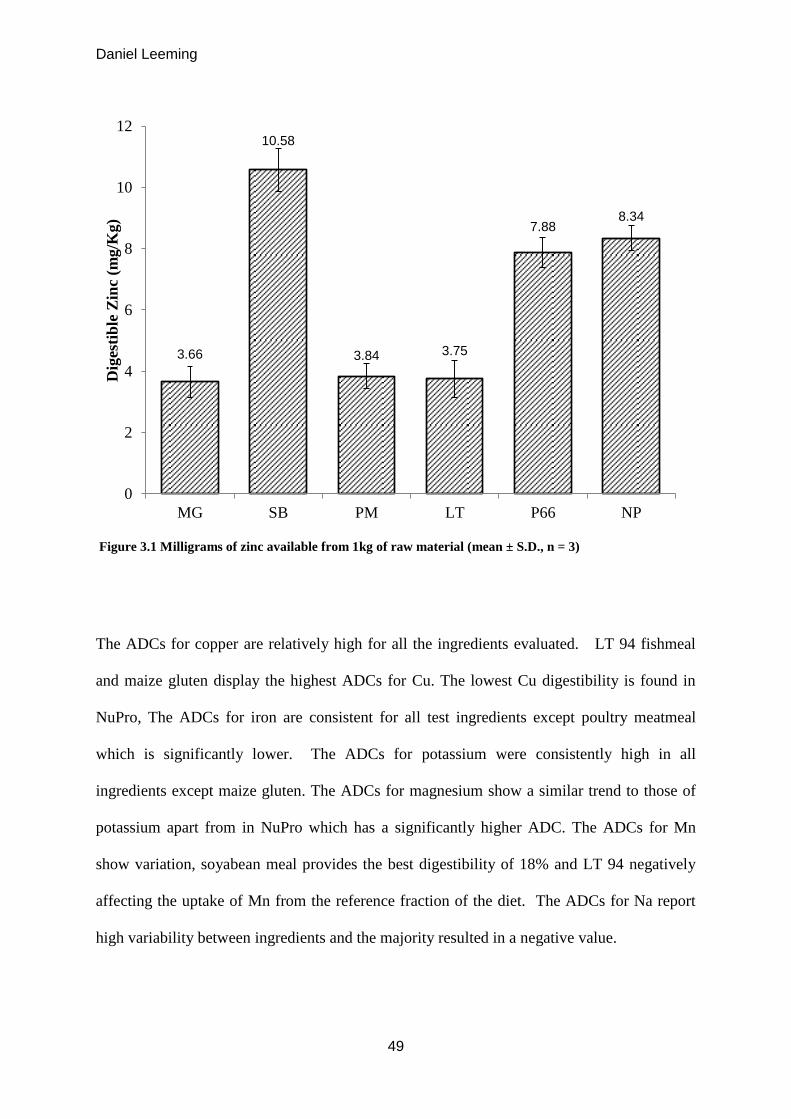
Daniel Leeming
49
Figure 3.1 Milligrams of zinc available from 1kg of raw material (mean ± S.D., n = 3)
The ADCs for copper are relatively high for all the ingredients evaluated. LT 94 fishmeal
and maize gluten display the highest ADCs for Cu. The lowest Cu digestibility is found in
NuPro, The ADCs for iron are consistent for all test ingredients except poultry meatmeal
which is significantly lower. The ADCs for potassium were consistently high in all
ingredients except maize gluten. The ADCs for magnesium show a similar trend to those of
potassium apart from in NuPro which has a significantly higher ADC. The ADCs for Mn
show variation, soyabean meal provides the best digestibility of 18% and LT 94 negatively
affecting the uptake of Mn from the reference fraction of the diet. The ADCs for Na report
high variability between ingredients and the majority resulted in a negative value.
3.66
10.58
3.84 3.75
7.88 8.34
0
2
4
6
8
10
12
MG SB PM LT P66 NP
Dig
esti
ble
Zin
c (m
g/K
g)

Daniel Leeming
50
The ADC values for P range from 19.9% in poultry meatmeal to 60.2% in NuPro and up to
90.6% in the casein diet. The ADCs for S range from -2.7% in poultry to 94% in NuPro. The
two highest ADC values were Nupro and maize gluten which also had the two highest dietary
concentrations. There is a significant difference between the two fishmeals, with the S in LT
94 being twice as available as in the Provimi 66 despite the dietary concentrations being
equal.
3.3.2 Protein ADC and Zinc/Protein ADC Comparison
The ADCs of the protein for each test protein source and the casein reference diet are
displayed in Table 3.3. The highest ADC of the test protein sources was for maize gluten
with a value of 85.3% followed by LT94 fishmeal with a value of 80.8%.
No correlation between protein digestibility and mineral availability was found indicating
that protein digestibility had no significant effect on the mineral digestibility.
Table 3.3 Protein ACDs (%)
Protein Source ADC (%)
Casein 97.8 ± 41
Maize Gluten Meal 85.3 ±2.2a
Soyabean Meal 76.5 ± 3.0b
Poultry Meatmeal 65.3 ±2.7c
LT 94 Fishmeal 80.8 ±1.2ab
Provimi 66 Fishmeal 69.8 ±5.4bc
NuPro 59.1 ±6.1c
Values with the same suffix are statistically equal
(ANOVA LSD p<0.05, n=3)

Daniel Leeming
51
Table 3.4 Mean growth performance and feed utilization of rainbow trout fed experimental diets.
Values in the same column with different suffix are significantly different (p<0.05)
Weight Gain % SGR FCR
Ref. 111 ± 10bc 2.49 ± 0.12bc 1.16 ± 0.05bc
Diet 1 78 ± 9e 1.92 ± 0.10e 1.50 ± 004e
Diet 2 102 ± 7c 2.34 ± 0.11c 1.24 ± 0.04c
Diet 3 121 ± 8ab 2.65 ± 0.09ab 1.08 ± 0.04ab
Diet 4 134 ± 5a 2.83 ± 0.06a 1.00 ± 0.02a
Diet 5 124 ± 6ab 2.69 ± 0.06ab 1.07 ± 0.03ab
Diet 6 92 ± 5d 2.18 ± 0.06d 1.34 ± 0.03d
Commercial 136 ± 11a 2.86 ± 0.13a 0.99 ± 0.04a
3.3.3 Growth Rates and Feed Performance
The fish more than doubled in weight from 50 ± 2g to 112 ± 10g with the exception of the
maize gluten diet and the NuPro diet. During the trial the mortality rate was zero. The best
growth performance was observed in the commercial diet (FCR=0.99, SGR=2.86) followed
by the other two fishmeal diets (LT94 and Provimi 66) with FCRs of 1.0 and 1.07 and SGRs
of 2.84 and 2.69 respectively. The two worst performing diets were the maize gluten meal
diet (FCR=1.51, SGR=1.92) and NuPro (FCR=1.34, SGR=2.18), both of which were
significantly different to the other diets in growth performance (table 3.4). FCRs are
artificially high due to the absence of a feed waste collection system.
3.3.4. Tissue Distribution of Zinc
The whole body zinc concentrations ranged from 90.0 µg/g in the fish fed the NuPro diet to
66.7 µg/g in the fish fed the maize gluten meal diet (figure 3.2a). Only the fish fed the maize
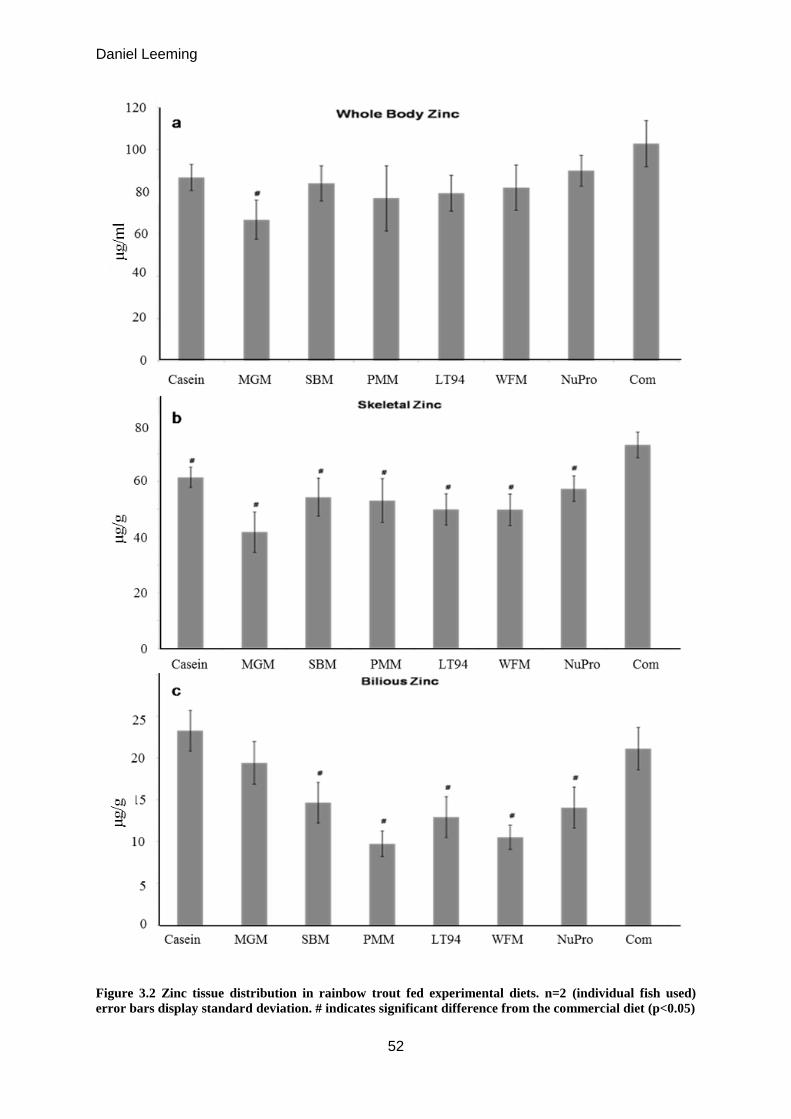
Daniel Leeming
52
Figure 3.2 Zinc tissue distribution in rainbow trout fed experimental diets. n=2 (individual fish used)
error bars display standard deviation. # indicates significant difference from the commercial diet (p<0.05)

Daniel Leeming
53
gluten meal diet had a significantly lower whole body zinc level than the fish fed the
commercial diet which contained 3-4 times the amount of zinc. All the test diets did seem
to lower the whole body zinc levels but not significantly (using one-way ANOVA, p-value of
0.05), a larger number of repeats may have reduced the apparent variance within each
treatment.
The skeletal zinc concentration ranges from 61.5 µg/g in the fish fed the casein diet to 41.8
µg/g in the fish fed the maize gluten meal diet (figure 3.2b). All the experimental diets
produced significantly lower skeletal zinc concentrations compared to the fish fed the
commercial diet, and followed the same trend as the whole body zinc levels.
The zinc concentration in the bile ranges from 23.3µg/g in the fish fed the casein diets to
9.75µg/g in the fish fed the poultry meat meal diet (figure 3.2c). Neither the casein nor the
maize gluten meal diet significantly altered the bilious zinc concentration from the level in
the commercial diet fed fish, which were given almost four times the level of zinc. The
remaining five diets all produced lower bilious zinc concentrations (compared to the
commercial diet) but no other significant differences between themselves. With the
exception of the soybean diet, these diets also had the lowest available zinc levels.
The zinc concentration in the livers ranged from 146.8 µg/g in the fish fed the NuPro diet to
72.4 µg/g in the fish fed the maize gluten meal diet (figure 3.3a). Only the maize gluten fed
fish had a significantly lower hepatic zinc concentration compared with the fish fed the
commercial diet.
The caudal fin zinc concentrations ranged from 84.0 µg/g in the fish fed the poultry meat
meal diet to 70.1 µg/g in the fish fed the maize gluten meal diets (figure 3.3b). There was a
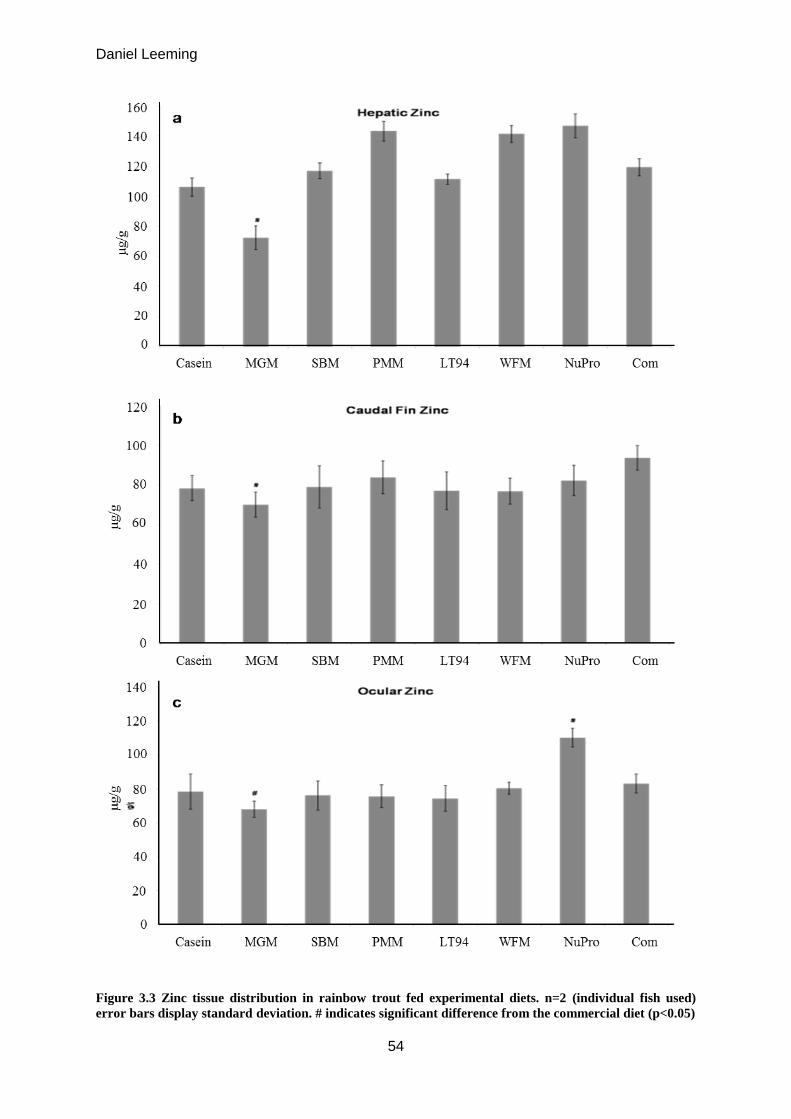
Daniel Leeming
54
Figure 3.3 Zinc tissue distribution in rainbow trout fed experimental diets. n=2 (individual fish used)
error bars display standard deviation. # indicates significant difference from the commercial diet (p<0.05)
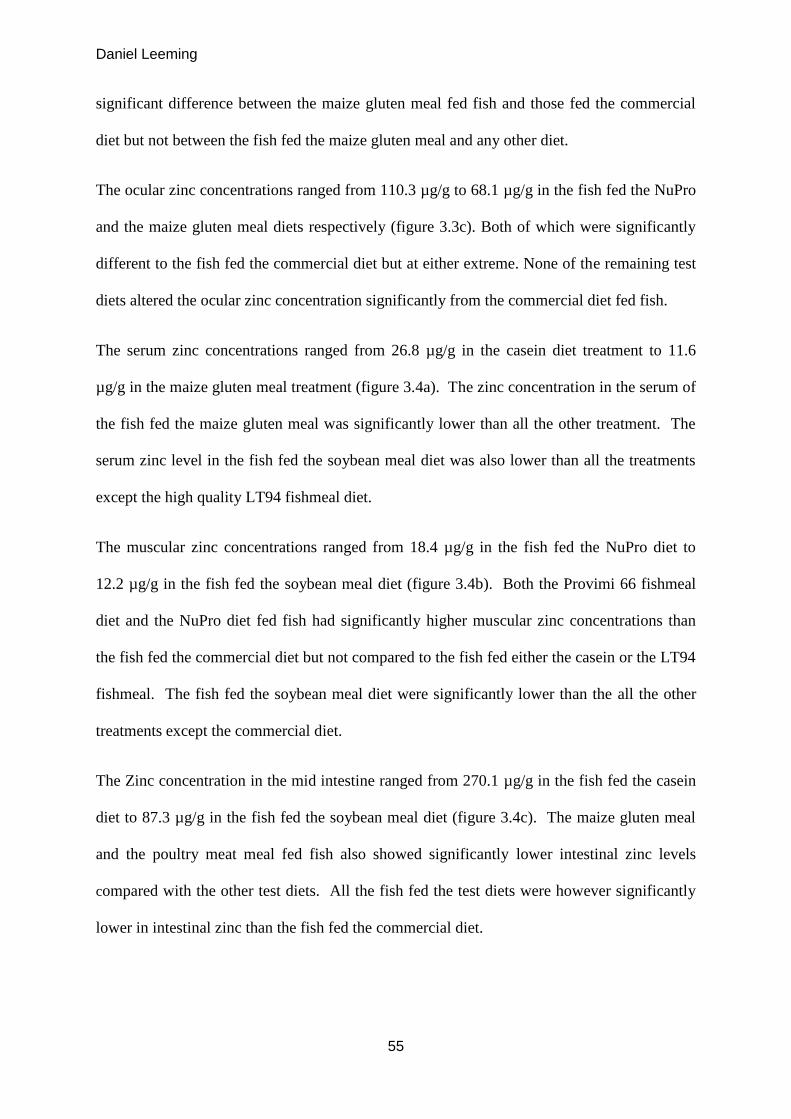
Daniel Leeming
55
significant difference between the maize gluten meal fed fish and those fed the commercial
diet but not between the fish fed the maize gluten meal and any other diet.
The ocular zinc concentrations ranged from 110.3 µg/g to 68.1 µg/g in the fish fed the NuPro
and the maize gluten meal diets respectively (figure 3.3c). Both of which were significantly
different to the fish fed the commercial diet but at either extreme. None of the remaining test
diets altered the ocular zinc concentration significantly from the commercial diet fed fish.
The serum zinc concentrations ranged from 26.8 µg/g in the casein diet treatment to 11.6
µg/g in the maize gluten meal treatment (figure 3.4a). The zinc concentration in the serum of
the fish fed the maize gluten meal was significantly lower than all the other treatment. The
serum zinc level in the fish fed the soybean meal diet was also lower than all the treatments
except the high quality LT94 fishmeal diet.
The muscular zinc concentrations ranged from 18.4 µg/g in the fish fed the NuPro diet to
12.2 µg/g in the fish fed the soybean meal diet (figure 3.4b). Both the Provimi 66 fishmeal
diet and the NuPro diet fed fish had significantly higher muscular zinc concentrations than
the fish fed the commercial diet but not compared to the fish fed either the casein or the LT94
fishmeal. The fish fed the soybean meal diet were significantly lower than the all the other
treatments except the commercial diet.
The Zinc concentration in the mid intestine ranged from 270.1 µg/g in the fish fed the casein
diet to 87.3 µg/g in the fish fed the soybean meal diet (figure 3.4c). The maize gluten meal
and the poultry meat meal fed fish also showed significantly lower intestinal zinc levels
compared with the other test diets. All the fish fed the test diets were however significantly
lower in intestinal zinc than the fish fed the commercial diet.

Daniel Leeming
56
Figure 3.4 Zinc tissue distribution in rainbow trout fed experimental diets. n=2 (individual fish used)
error bars display standard deviation. # indicates significant difference from the commercial diet
(p<0.05).

Daniel Leeming
57
3.3.5 Tissue distribution of other minerals
Table 3.5 Liver mineral concentration of rainbow trout fed experimental diets. Mean ± SD; n=2
(individual fish used) Values with different suffix in the same column denotes significant differences
Na S K P Ca Mg Cu Fe Mn
(g/1) (g/1) (g/1) (g/1) (g/1) (g/1) (mg/1) (mg/1) (mg/1)
Casein
3.64 ±
0.53
11.1 ±
0.5
15.3 ±
0.7
12.5 ±
0.8
0.19 ±
0.05
0.64 ±
0.08
260 ±
21.7
198 ±
17.8
5.1 ±
0.4
MGM
3.40 ±
0.51
11.3 ±
0.4
14.7 ±
0.8
11.7 ±
0.9
0.17 ±
0.08
0.61 ±
0.07
257 ±
14.4
199 ±
19.5
3.9 ±
0.3
SBM
3.06 ±
0.46
10.4 ±
0.5
16.2 ±
0.9
12.7 ±
0.7
0.18 ±
0.03
0.66 ±
0.07
264 ±
22.7
222 ±
24.9
3.5 ±
0.4
PMM
3.43 ±
0.39
10.8 ±
0.3
15.1 ±
1.1
12.0 ±
1.2
0.18 ±
0.04
0.64 ±
0.09
275 ±
13.3
216 ±
11.5
3.8 ±
0.4
LT94
3.26 ±
0.61
11.2 ±
0.5
14.9 ±
0.8
12.1 ±
1.0
0.17 ±
0.08
0.65 ±
0.06
277 ±
19.9
229
±23.8
3.5 ±
0.2
WFM
3.39 ±
0.53
11.0 ±
0.4
15.4 ±
0.8
12.3 ±
1.1
0.16 ±
0.06
0.64 ±
0.08
260 ±
17.1
194
±22.1
3.8 ±
0.3
NP 3.42 ±
0.46
11.0 ±
0.3
15.9 ±
0.7
12.2 ±
0.7
0.16 ±
0.06
0.65 ±
0.07
245 ±
24.4
443 ±
35.3
3.1 ±
0.7
In general the distribution of Na, S, K, P, Ca, Mg, Cu Fe and Mn was unaffected by the
protein source used in the diets. However fish fed the casein reference diet had significantly
raised Mn levels in the liver (table 3.5) and mid intestine (table 3.6) compared to all other
diets. The mid intestine also showed significantly elevated Cu levels in this group. There
were no significant differences between the casein diet and any of the other diets for any of
the minerals in the bile (table 3.7); however there was a significantly higher K level and a
significantly low Mg level in the serum (table 3.8).
The diet with 18% NuPro resulted in a significantly raised level of Fe in the liver compared
with both the casein reference diet and all the other test diets. There was also an increased
level of Ca and Mg in the bile in these fish..

Daniel Leeming
58
Table 3.6 Mid-intestine mineral concentration of rainbow trout fed experimental diets. Mean ± SD; n=2
(individual fish used) Values with different suffix in the same column denotes significant differences
Na S K P Ca Mg Cu Fe Mn
(g/1) (g/1) (g/1) (g/1) (g/1) (g/1) (mg/1) (mg/1) (mg/1)
Casein
4.99 ±
0.65
12.2 ±
0.2
12.9 ±
0.2
9.9 ±
0.3
0.35 ±
0.09
0.62 ±
0.04
7.5 ±
0.9a
35.8 ±
2.4
10.5 ±
1.2a
MGM
4.59 ±
0.58
12.4 ±
0.3
12.9 ±
0.1
10.1 ±
0.3
0.37 ±
0.12
0.64 ±
0.06
4.5 ±
0.7
32.8 ±
3.5
6.6 ±
0.8
SBM
4.24 ±
0.49
12.3 ±
0.4
13.0 ±
0.3
9.8 ±
0.4
0.30 ±
0.08
0.61 ±
0.02
4.3 ±
0.8
33.4 ±
1.5
4.5 ±
0.7
PMM
4.22 ±
0.63
12.9 ±
0.2
13.4 ±
0.2
10.4 ±
0.2
0.31 ±
0.08
0.66 ±
0.04
3.7 ±
0.6
35.6 ±
3.8
5.5 ±
1.2
LT94
4.38 ±
0.52
12.3 ±
0.5
12.8 ±
0.1
9.4 ±
0.3
0.36 ±
0.11
0.59 ±
0.02
3.8 ±
0.8
32.1 ±
2.7
6.4 ±
0.9
WFM
4.58 ±
0.48
12.8 ±
0.2
13.2 ±
0.2
10.1 ±
0.4
0.31 ±
0.10
0.63 ±
0.03
3.7 ±
0.5
33.9 ±
1.9
6.2 ±
1.0
NP 4.00 ±
0.41
12.1 ±
0.4
12.4 ±
0.3
9.3 ±
0.5
0.29 ±
0.12
0.57 ±
0.02
3.2 ±
1.0
37.8 ±
3.8
5.6 ±
1.3
Table 3.7 Bile mineral concentration of rainbow trout fed experimental diets. Mean ± SD; n=2 (individual
fish used) Values with different suffix in the same column denotes significant differences
Na S K P Ca Mg Cu Fe Mn
(g/1) (g/1) (g/1) (g/1) (g/1) (g/1) (mg/1) (mg/1) (mg/1)
Casein
6.06 ±
0.15
8.62 ±
0.30
0.29 ±
0.03
0.06 ±
0.03
0.31 ±
0.02
0.02 ±
0.01
1.5 ±
0.3
8.8 ±
0.9
0.1 ±
0.1
MGM
6.32 ±
0.21
9.12 ±
0.27
0.30 ±
0.04
0.06 ±
0.02
0.32 ±
0.01
0.02 ±
0.01
2.1 ±
0.6
10.3 ±
1.5
0.1 ±
0.1
SBM
6.12 ±
0.17
8.62 ±
0.29
0.25 ±
0.02
0.10 ±
0.01
0.31 ±
0.02
0.03 ±
0.01
1.9 ±
0.4
8.4 ±
0.8
0.1 ±
0.1
PMM
5.98 ±
0.22
8.97 ±
0.42
0.27 ±
0.04
0.09 ±
0.02
0.33 ±
0.01
0.02 ±
0.01
0.9 ±
0.3
7.9 ±
1.0
0.1 ±
0.1
LT94
6.24 ±
0.13
9.03 ±
0.22
0.31 ±
0.02
0.06 ±
0.02
0.34 ±
0.02
0.02 ±
0.01
0.9 ±
0.3
8.4 ±
1.3
0.1 ±
0.1
WFM
6.30 ±
0.18
9.11 ±
0.18
0.25 ±
0.03
0.08 ±
0.01
0.41 ±
0.02a
0.04 ±
0.01a
1.7 ±
0.3
9.2 ±
1.5
0.1 ±
0.1
NP 6.20 ±
0.15
8.77 ±
0.24
0.24 ±
0.02
0.09 ±
0.02
0.42 ±
0.01a
0.04 ±
0.01a
1.0 ±
0.2
10.5 ±
1.7
0.1 ±
0.1

Daniel Leeming
59
Table 3.8 Serum mineral concentration of rainbow trout fed experimental diets. Mean ± SD; n=2
(individual fish used) Values with different suffix in the same column denotes significant differences
Na S K P Ca Mg Cu Fe Mn
(g/1) (g/1) (g/1) (g/1) (g/1) (g/1) (mg/1) (mg/1) (mg/1)
Casein
3.02 ±
0.23
0.65 ±
0.08
0.14 ±
0.02a
0.45 ±
0.08
0.12 ±
0.02
0.01 ±
0.01a
0.72 ±
0.22
15.0 ±
1.4
0.1 ±
0.1
MGM
3.12 ±
0.27
0.65 ±
0.03
0.08 ±
0.01
0.47 ±
0.06
0.12 ±
0.01
0.02 ±
0.01
0.32 ±
0.18
15.7
±2.0
0.1 ±
0.1
SBM
3.18 ±
0.24
0.52 ±
0.04
0.01 ±
0.01
0.40 ±
0.07
0.10 ±
0.03
0.03 ±
0.01
0.35 ±
0.15
14.8 ±
1.3
0.1 ±
0.1
PMM
2.97 ±
0.22
0.58 ±
0.03
0.03 ±
0.01
0.44 ±
0.05
0.10 ±
0.02
0.02 ±
0.01
0.27 ±
0.15
14.4 ±
2.3
0.1 ±
0.1
LT94
3.23 ±
0.29
0.64 ±
0.07
0.02 ±
0.01
0.51 ±
0.07
0.11 ±
0.01
0.02 ±
0.01
0.44 ±
0.22
18.1 ±
2.5
0.1 ±
0.1
WFM
3.31 ±
0.17
0.68 ±
0.06
0.02 ±
0.01
0.49 ±
0.08
0.12 ±
0.03
0.03 ±
0.01
0.48 ±
0.16
18.2 ±
2.8
0.1 ±
0.1
NP 3.41 ±
0.21
0.67 ±
0.04
0.03 ±
0.01
0.46 ±
0.04
0.11 ±
0.01
0.03 ±
0.01
0.51 ±
0.12
19.6 ±
3.0
0.1 ±
0.1
The diet with 18% Provimi 66 fishmeal resulted in an increased level of both Ca and Mg in
the bile while the supplementation of LT94 fishmeal, soyabean meal and poultry meatmeal
had no significant effect on the mineral levels in either the serum, liver, bile or mid intestine
for any of the tissues.
3.3.6 Net Zinc Retention
The net zinc retention ranged from 67.8% from the casein diet to -207.1% from the maize
gluten meal diet (table 3.9). Both the LT 94 fishmeal and the commercial diet gave very
similar results of 66.3% and 67.5% respectively, which is unsurprising since the LT 94

Daniel Leeming
60
Table 3.9 Mean net zinc retention of rainbow trout fed experimental diets. Based on wet body weight
(n=2). Values with different suffix are significantly different (p<0.05).
Diet Casein MGM SBM PMM LT94 WFM NuPro Com
%
Zinc
Retention
67.8 ±
3.7a
-207.1 ±
20.6d
23.3 ±
1.9c
20.9 ±
2.5c
66.3 ±
4.8a
46.6 ±
2.8b
21.9 ±
1.2c
67.5 ±
2.2a
fishmeal was supplied from the same manufacturer as the commercial diet. Both the soybean
meal, the NuPro and the poultry meat meal recorded similar retentions of 23.3%, 22.0% and
21.0% respectively.

Daniel Leeming
61
3.4 Discussion
This study was a comparative mineral digestibility study designed around the hypothesis that
in order to obtain an accurate ADC for a mineral from a protein source, that mineral must; a)
be in a known, fixed ratio between the reference diet and the test protein, and b) must reside
at a level close to or below the animal’s requirement for that mineral’s efficient utilization.
Both these stipulations are relatively novel to the approach generally taken. The majority of
studies involving ADC calculations use only the ratio of the test protein to reference diet (i.e.
“30% of the reference diet was replaced with fishmeal”) regardless of the actual levels of
mineral in the test protein source (Sugiura et al, 2000; Cheng and Hardy, 2003). The
advantage of the conventional approach is that it is possible to use the same ingredient ratio
for virtually every mineral, the disadvantage is that there is no way of accurately knowing
what amount of the mineral is coming from the test ingredient. With regard to the second
stipulation, to the author’s knowledge, no other study has specifically formulated diets to be
as close to mineral deficiency as possible in order to calculate ADCs. This part is crucial to
the hypothesis that because minerals are so highly regulated by fish, if there is more of a
mineral than required, the body will either not take them up from the GI tract or will excrete
excess back into the GI tract. Both result in a higher concentration in the faeces, undermining
the calculation of the ADC.
With the above hypotheses in mind this trial focused on zinc to the possible detriment of the
accuracy of the ADC calculations for the other minerals. It was however decided to measure
these other minerals in order to allow a comparison to be made between other published data.
Table 3.2 displays the ADCs for Ca, Cu, Fe, K, Mg, Mn, Na, P, S and Zn from the casein
reference diet and the 6 test protein sources. The ADCs for casein are for the whole diet so
cannot be directly compared to the other protein sources, however, an almost negligible

Daniel Leeming
62
amount of zinc was supplied by any of the other ingredients in that diet so the values are a
good approximate. The ADCs for the zinc should be considered the real digestibility values
so long as the two fore mentioned hypotheses hold true. With regard to the other minerals,
some scepticism may be advisable when comparisons are made between test ingredients and
it would possibly not be recommended to rely on these figures alone for diet formulation.
Negative results indicate an accumulation of the mineral in the faeces, this could be due to:
very poor digestibility; an antagonistic interaction with other nutrients; or the body may be
obtaining an excess of the mineral from the diet, water or a combination of both.
3.4.1 Digestibility
The ADCs for zinc from the test ingredient range from 15.1% in LT 94 fishmeal to 49.4% in
soyabean meal. As described above, this trial was designed to establish the exact amount of
zinc available to the fish from each protein source, therefore these results should be totally
comparable between each other but not necessarily between other values in the literature
from experiments using the conventional method. There are two surprising results: 1) the
fact that the soyabean meal is shown to have the most available zinc when soyabean meal is
notorious for containing high concentrations of phytic acid which strongly chelates divalent
minerals like zinc (Satoh et al, 1993). However the soyabean meal used in this trial is a very
high quality meal; 2) the Provimi 66 fishmeal (high ash) had more available zinc than the
LT94 fishmeal. High ash fishmeal like Provimi 66 contain higher levels of hydroxyapatite
than higher grade fishmeals like LT94 because of the hard tissue content usually found in
them. This anomaly may be explained to some extent by comparing phosphorus levels and
availabilities in each diet. P is well known to reduce zinc availability (Porn-Ngam et al. 1993)
but the levels of P in the two diets are almost equal, however the availabilities are not and it
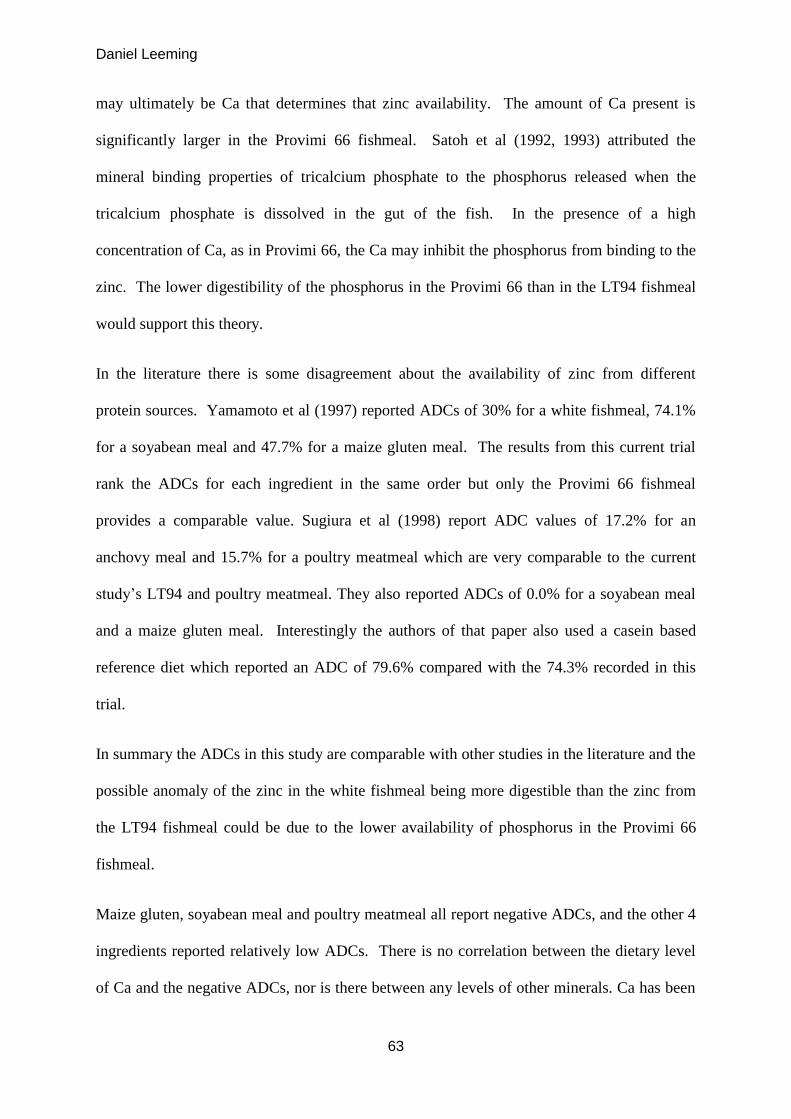
Daniel Leeming
63
may ultimately be Ca that determines that zinc availability. The amount of Ca present is
significantly larger in the Provimi 66 fishmeal. Satoh et al (1992, 1993) attributed the
mineral binding properties of tricalcium phosphate to the phosphorus released when the
tricalcium phosphate is dissolved in the gut of the fish. In the presence of a high
concentration of Ca, as in Provimi 66, the Ca may inhibit the phosphorus from binding to the
zinc. The lower digestibility of the phosphorus in the Provimi 66 than in the LT94 fishmeal
would support this theory.
In the literature there is some disagreement about the availability of zinc from different
protein sources. Yamamoto et al (1997) reported ADCs of 30% for a white fishmeal, 74.1%
for a soyabean meal and 47.7% for a maize gluten meal. The results from this current trial
rank the ADCs for each ingredient in the same order but only the Provimi 66 fishmeal
provides a comparable value. Sugiura et al (1998) report ADC values of 17.2% for an
anchovy meal and 15.7% for a poultry meatmeal which are very comparable to the current
study’s LT94 and poultry meatmeal. They also reported ADCs of 0.0% for a soyabean meal
and a maize gluten meal. Interestingly the authors of that paper also used a casein based
reference diet which reported an ADC of 79.6% compared with the 74.3% recorded in this
trial.
In summary the ADCs in this study are comparable with other studies in the literature and the
possible anomaly of the zinc in the white fishmeal being more digestible than the zinc from
the LT94 fishmeal could be due to the lower availability of phosphorus in the Provimi 66
fishmeal.
Maize gluten, soyabean meal and poultry meatmeal all report negative ADCs, and the other 4
ingredients reported relatively low ADCs. There is no correlation between the dietary level
of Ca and the negative ADCs, nor is there between any levels of other minerals. Ca has been

Daniel Leeming
64
found to be notoriously difficult to assess for digestibility in fish (Yamamoto et al, 1997;
Cheng and Hardy, 2003; Sugiura et al, 1998). It is proposed that this is due to high
competition between several other minerals for the same uptake sites or because calcium may
be obtained from the environment via the gills.
The ADCs for Cu are relatively high for all ingredients. It is well documented in the
literature that both Zn and Fe are metabolic antagonists of Cu (Watanabe et al, 1997) and the
3 elements share numerous uptake pathways and even metabolic roles. LT 94 fishmeal and
maize gluten display the highest ADCs for Cu and both have either a very low zinc
concentration or digestibility. Likewise, the lowest Cu digestibility is found in NuPro, but
this contains the highest zinc and second highest Fe levels, which also display above average
ADCs. This study provides strong evidence that Cu, Zn and Fe interact with each other with
regard to mineral availability which needs to be considered when designing diets for
subsequent experiments.
The ADCs for Fe are consistent for all test ingredients except poultry meatmeal which is
significantly lower. The ADC values reported here are quite moderate. Negative or
negligible availabilities for Fe from fishmeals, poultry meatmeals and some plant meals have
been reported in other studies (Sugiura et al, 1998) but much higher values have also been
reported. 72.2% was reported for soyabean meal and 78.7% for maize gluten by Cheng and
Hardy (2003). Fe, like Cu, can be obtained from the environment and as Fe homeostasis is
maintained primarily by adjusting its absorption rather than by excretion (Morris, 1987); this
may explain differences in ADC values among the literature. An adequate supply of dietary
Fe has however been shown to reduce absorption in the gills (Segner and Storch, 1985). Fe
absorption has been shown to be negatively affected by phosphates and in the present study
this could also explain the low ADC for poultry. This effect is not reflected in either of the
fishmeal diets however there is a high Fe concentration in both the fishmeal diets as well.

Daniel Leeming
65
The ADCs for K were consistently high in all except maize gluten. Together with the ADC
values of Mg, the K ADCs should generally be considered highly reliable due to the
extremely low amounts of both these minerals in the reference casein diet, however the low
concentration of K in the maize gluten may make its value unreliable. The ADC for the
casein diet may also be unreliable due to the small amount of K present in the diet coming
entirely from the 5% fishmeal in its formulation. The high digestibility does not necessarily
reflect the requirement of the fish as the main excretory role (and therefore homeostatic
mechanism) for K is via the kidney and so may passively enter the body from the gut.
The ADCs for Mg show a similar trend to those of K. The values are similar for all
ingredients with the exception of maize gluten which is low and Nupro which is significantly
higher. The same reasoning for why maize gluten K digestibility was low is also valid for
Mg. The high ADC for NuPro could be related to a relatively high level of K in this diet, an
effect reflected in the soyabean meal diet but to a lesser extent.
The ADCs for Mn show considerable variation, with soyabean meal providing the best
digestibility of 18% and LT 94 actually negatively affecting the uptake of Mn from the
reference fraction of the diet. More is known about the excretory pathway of Mn than its
uptake mechanisms. Absorbed Mn is almost totally excreted in the bile into the GI tract
therefore normal biological behaviour of the body may falsely lower the apparent digestibility.
Further work with stable isotope markers may be required if a more realistic digestibility was
required.
The ADCs for Na report high variability between ingredients and the majority resulted in a
negative value. As discussed previously in the explanation, a negative value implies
accumulation of the mineral in the faeces. The negative Na values do coincide with high K
values and may be a result either of the body maintaining an ionic charge or as an active,
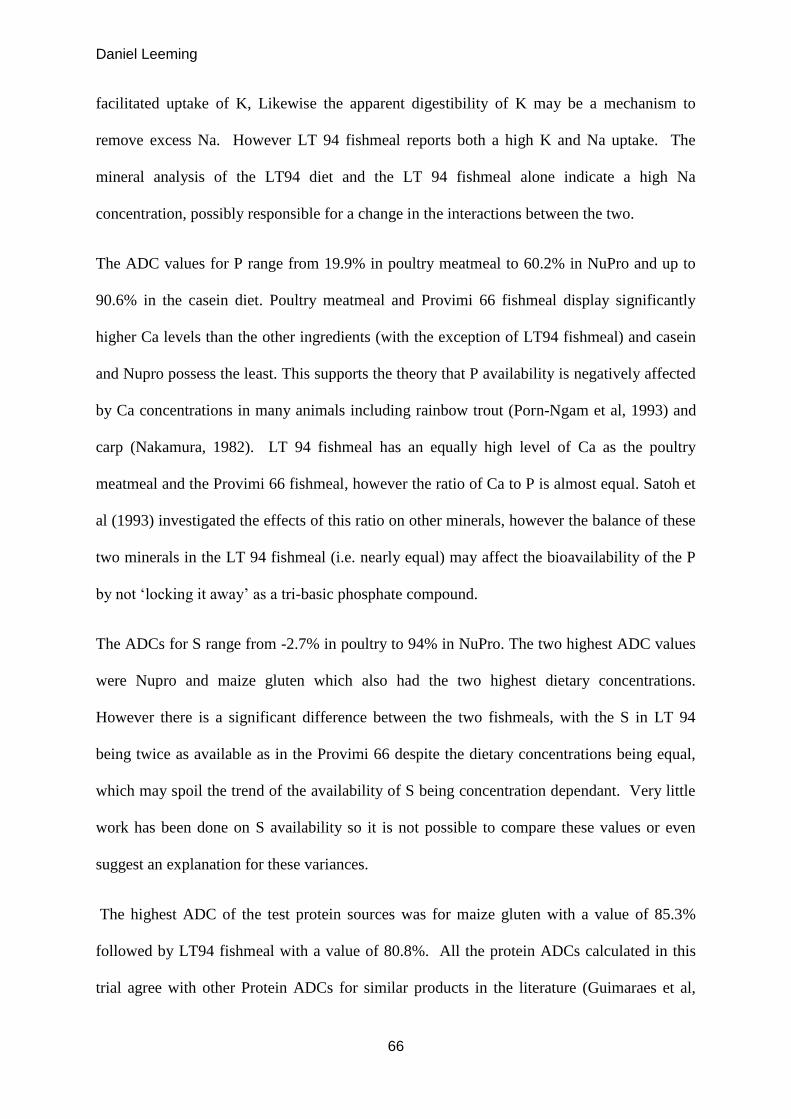
Daniel Leeming
66
facilitated uptake of K, Likewise the apparent digestibility of K may be a mechanism to
remove excess Na. However LT 94 fishmeal reports both a high K and Na uptake. The
mineral analysis of the LT94 diet and the LT 94 fishmeal alone indicate a high Na
concentration, possibly responsible for a change in the interactions between the two.
The ADC values for P range from 19.9% in poultry meatmeal to 60.2% in NuPro and up to
90.6% in the casein diet. Poultry meatmeal and Provimi 66 fishmeal display significantly
higher Ca levels than the other ingredients (with the exception of LT94 fishmeal) and casein
and Nupro possess the least. This supports the theory that P availability is negatively affected
by Ca concentrations in many animals including rainbow trout (Porn-Ngam et al, 1993) and
carp (Nakamura, 1982). LT 94 fishmeal has an equally high level of Ca as the poultry
meatmeal and the Provimi 66 fishmeal, however the ratio of Ca to P is almost equal. Satoh et
al (1993) investigated the effects of this ratio on other minerals, however the balance of these
two minerals in the LT 94 fishmeal (i.e. nearly equal) may affect the bioavailability of the P
by not ‘locking it away’ as a tri-basic phosphate compound.
The ADCs for S range from -2.7% in poultry to 94% in NuPro. The two highest ADC values
were Nupro and maize gluten which also had the two highest dietary concentrations.
However there is a significant difference between the two fishmeals, with the S in LT 94
being twice as available as in the Provimi 66 despite the dietary concentrations being equal,
which may spoil the trend of the availability of S being concentration dependant. Very little
work has been done on S availability so it is not possible to compare these values or even
suggest an explanation for these variances.
The highest ADC of the test protein sources was for maize gluten with a value of 85.3%
followed by LT94 fishmeal with a value of 80.8%. All the protein ADCs calculated in this
trial agree with other Protein ADCs for similar products in the literature (Guimaraes et al,
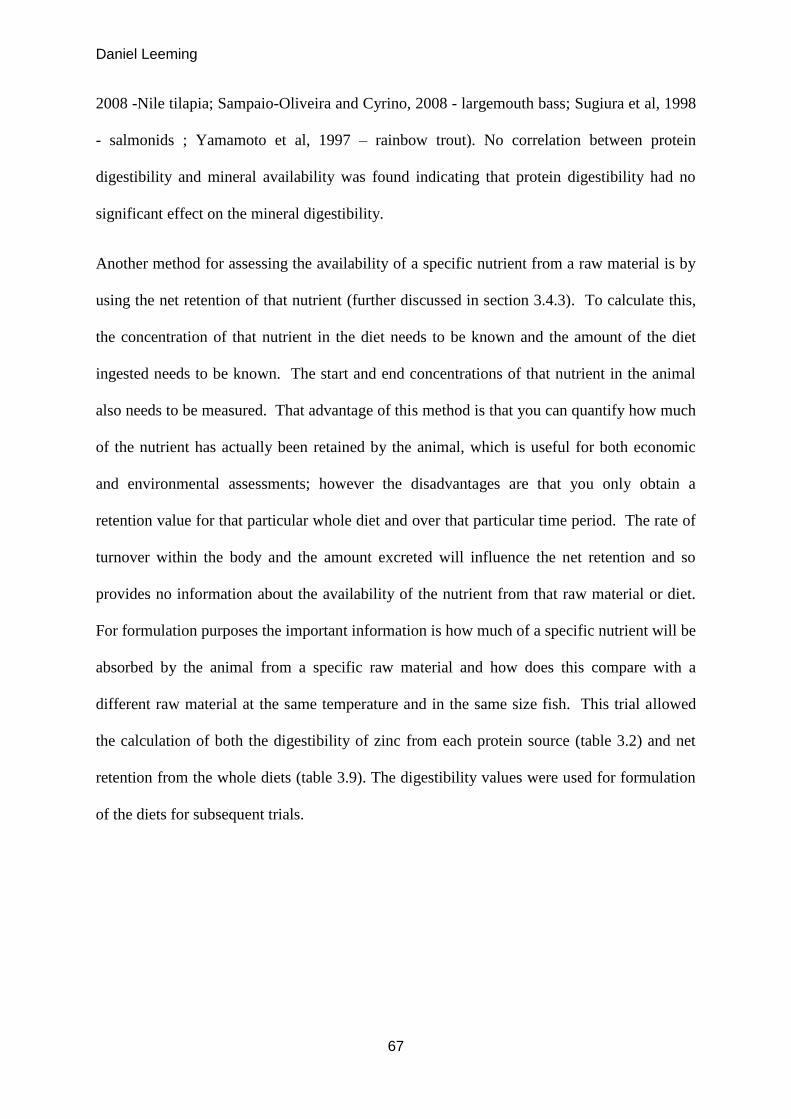
Daniel Leeming
67
2008 -Nile tilapia; Sampaio-Oliveira and Cyrino, 2008 - largemouth bass; Sugiura et al, 1998
- salmonids ; Yamamoto et al, 1997 – rainbow trout). No correlation between protein
digestibility and mineral availability was found indicating that protein digestibility had no
significant effect on the mineral digestibility.
Another method for assessing the availability of a specific nutrient from a raw material is by
using the net retention of that nutrient (further discussed in section 3.4.3). To calculate this,
the concentration of that nutrient in the diet needs to be known and the amount of the diet
ingested needs to be known. The start and end concentrations of that nutrient in the animal
also needs to be measured. That advantage of this method is that you can quantify how much
of the nutrient has actually been retained by the animal, which is useful for both economic
and environmental assessments; however the disadvantages are that you only obtain a
retention value for that particular whole diet and over that particular time period. The rate of
turnover within the body and the amount excreted will influence the net retention and so
provides no information about the availability of the nutrient from that raw material or diet.
For formulation purposes the important information is how much of a specific nutrient will be
absorbed by the animal from a specific raw material and how does this compare with a
different raw material at the same temperature and in the same size fish. This trial allowed
the calculation of both the digestibility of zinc from each protein source (table 3.2) and net
retention from the whole diets (table 3.9). The digestibility values were used for formulation
of the diets for subsequent trials.

Daniel Leeming
68
3.4.2 Tissue distribution
The elevated level of Mn in the liver and the mid intestine coincide with casein having the
highest ADC for Mn of all the diets, despite having the lowest concentration. The elevated
level in the intestine may indicate that this is the main region of uptake and the elevated level
in the liver may imply that this is a storage pool for Mn as it is expected that storage pools
respond fastest to alterations on in dietary levels of minerals (Swinkles et al, 1994).
The elevated level of Cu in the intestine implies the same as for Mn, and again the casein diet
contains the lowest level of Cu but displays the highest digestibility.
The high level of K in the serum, when linked with an average digestibility and a
significantly low concentration may indicate increased transportation from a storage site to a
functional pool but without the use of markers only assumptions can be made. It is surprising
however that a similar pattern was not seen with the maize gluten diet as it has an even lower
digestibility for K.
The elevated levels of Fe in the liver of the fish fed the NuPro diet cannot be explained by
either unusual concentrations of Fe in the diet or a significantly different digestibility. It
implies that the availability of the Fe and hence its activity is different. The increase seen
may be due to storage of the iron or its metabolism. Further examination of other sites of Fe
storage/functionality would be very interesting with this diet.
The increased levels of Ca and Mg in the bile indicate the excess of these minerals is being
removed. The ADCs for Ca and Mg are both the highest in the NuPro diet which is
obviously linked with this increased excretion. Interestingly, the increased level in the bile
would ultimately return to the faeces so the reported ADC levels in this study may have been
artificially low.

Daniel Leeming
69
The increased levels of Ca and Mg in the bile of the fish fed the Provimi 66 fishmeal diet
mirrors the effect seen in the NuPro diet, the only difference is that the increased levels of Ca
or Mg in the body are probably due to higher dietary concentrations rather than high
digestibility.
A 62% supplementation of maize gluten to the casein diet and the corresponding drop in
dietary zinc level to 19 mg/kg was the only effective means of significantly altering the zinc
status of any of the tissues in the fish. The level of zinc in the serum was significantly
lowered and more importantly the level of zinc in the liver also significantly dropped. It is
known that with low dietary zinc intakes redistribution of zinc occurs to those pools that are
important metabolically. The results from this diet indicate that the liver is only a storage
pool and it will be interesting to identify where the functional pools definitely reside in fish.
It is an encouraging sign that at these levels, in fish of this size, alterations to the zinc status
of the fish are being observed over a defined time frame.
3.4.3 Net zinc retention
The net retention of a mineral is the difference between the total amount of that mineral fed
to the fish throughout the duration of the trial and the overall increase in total body zinc. The
negative retention observed from the maize gluten meal diet implies that more zinc has been
excreted than has been taken up from the diet. This appears to be a nonsensical result,
especially in a group of fish which are seemingly so deficient in zinc that important
functional pools like the liver, eye and fins are being depleted. Coincidentally, the group of
fish fed the maize gluten diet also had a strange result with the amount of zinc in the bile. The
large amount of zinc in the bile suggested the excretion of the mineral but why an animal

Daniel Leeming
70
depleting its metabolic zinc pools would excrete more zinc via the bile is unclear, however it
would explain how the fish were getting a negative net retention. A possible explanation for
this could involve the hepatoenteric circulation system. In both humans and rats this system
has been shown to re-circulate both iron and arsenic from the body into the bile which then is
secreted into the duodenum and the minerals can be reabsorbed (Suzuki et al., 2001). The
confirmation of this is beyond the remit of this study but it could possibly involve this system.
3.5 Outcome
The zinc digestibilities of the tested ingredients have been calculated and were used to
formulate the diet for subsequent zinc supplementation experiments in rainbow trout. This
diet will be composed of commercially important ingredients and also be zinc-deficient. The
diet will be formulated with a combination of LT94 fishmeal and maize gluten and will have
a crude protein level of ~45% and a zinc concentration of ~25 mg/kg. This preliminary trial
demonstrated that even over a short period, a dietary zinc concentration of this level, using
these ingredients is enough to alter the zinc status of rainbow trout and form a basis for future
studies.

Daniel Leeming
71
CHAPTER 4. The effect of phytase treatment of soyabean meal on protein,
phosphorus and zinc digestibility
4.1 Introduction
According to the UN Food and Agriculture Organization (FAO), aquaculture is growing
more rapidly than all other animal food production sectors (FAO, 2009). This rapid growth
demands an equally rapid expansion of aquafeed production which needs to be economically
viable and environmentally neutral. There is debate over the ‘sustainability’ of fishmeal and
fish oil production and with the anticipated growth of aquaculture the demand for fishmeal
and oil is expected to exceed the supply in the next 5-10 years, assuming feed formulations
stay the same. Unsurprisingly the aquafeed industry has, for many years now, focused on
developing a stable alternative source of protein in terms of cost and supply. Plant proteins,
particularly soya derived protein, have been at the forefront of this research and seem to have
the most potential to satisfy the nutrient requirement of many farmed finfish species.
Soyabean is produced mainly for its oil, yielding a secondary product of a high protein cake.
This is processed to a variety of soyabean products; soy flour (SF), soyabean meal (SBM),
soy protein concentrate (SPC) or soy protein isolate (SPI). Soybean meal has a protein
content of 44-48% which is increased to 60-64% in SPC and further increased in SPI.
Soybean meal has a high level of cysteine but low levels (relative to fishmeal) of essential
amino acids and tyrosine. Methionine, lysine and threonine are most likely to be the limiting
amino acids in high soyabean meal based diets but the further processing to SPC or SPI may
concentrated these amino acids to levels exceeding those found in fishmeal. The further
processing may however also concentrate anti-nutritional factors/agents such as phytate.

Daniel Leeming
72
Phytate or phytic acid is the principal storage form of phosphorus in many plant tissues. In
soyabean meal 50-80% of the total phosphorus is in the phytate form, the remaining
phosphorus is present as a soluble inorganic phosphate or as cellular phosphorus bound in
nucleic acids and phosphorylated proteins (Tyagi and Verma, 1998). Each molecule of
phytate (C6H18O24P6) contains 6 phosphate molecules joined by ester bonds to a cyclic
alcohol, inositol, and under physiological conditions in the gut, chelates with positively
charged cations, reducing their bioavailability (Erdman, 1979). Phytate may also form
complexes with proteins in both acidic and alkaline conditions. In acid conditions the phytate
can bind to amino groups on lysine, imidazole groups on histidine and guanidyl groups on
arginine; in alkaline conditions it will form ternary complexes, all of which are resistant to
proteolytic digestion resulting in reduced protein/amino acid digestibility and utilization
(Denstadli et al 2006; Riche and Garling, 2004).
Removal or degradation of phytate can increase the nutritional value and bioavailability of
many cations naturally present in the meal. Numerous processing techniques have been
employed to try and reduce the phytate content. Milling cereals removes phytate (Bohn et al,
2008) but it also removes many of the minerals of interest along with most of the dietary fibre.
Heat treatment has a minor effect on phytate levels (Pontoppidan et al, 2007) and cooking
results in the leaching of phosphorus to the cooking water. Genetic modification of cereals to
have low phytate levels but normal phosphorus levels has been achieved (Raboy, 1997) and
this increased the availability of the phosphorus to fish (Sigiura et al, 1998) but this solution
raises socio-economic concerns about GM products. The most efficient method of reducing
phytate is to use the enzyme phytase. Phytase catalyses the hydrolysis of phytate and
sequesters the orthophosphate groups from the inositol ring. Phytase is endogenous to cereals
and its activity can be increased by germination or fermentation (Kumar et al, 2012). The
addition of extra exogenous phytase, from microbial sources is an effective way of further

Daniel Leeming
73
reducing phytase without the need for germination or fermentation. Yeasts, fungi and
bacteria have all been used as phytase producers for this purpose. The most common used
are derived from A. niger and E. coli, but other sources have been identified (Greiner and
Konietzny, 2006).
Early work into the pre-treatment of soyabean meal with exogenous phytase for use in
aquafeeds by Cain and Garling (1995) reported increased weight gain and phosphorus
utilisation in juvenile rainbow trout. Later work by Storebakken et al (1998) and Vielma et al
(2002) also reported that the pre-treatment of soyabean meal with phytase increased weight
gain, feed efficiency, protein utilization and zinc, magnesium, and calcium uptake in Atlantic
salmon and rainbow trout respectively.
The aim of this experiment was to measure the protein, zinc and phosphorus digestibility of a
commercially available soy protein and to assess the effect of a exogenous microbial phytase
pre-treatment of the soy protein ingredient.
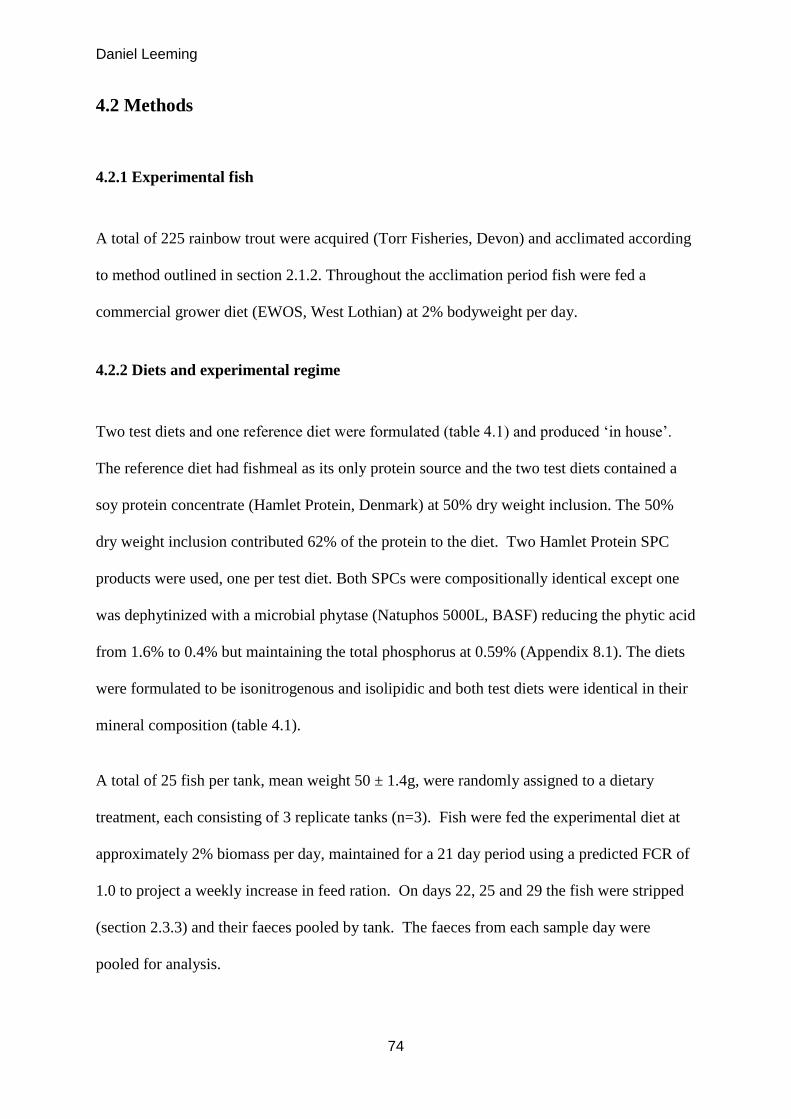
Daniel Leeming
74
4.2 Methods
4.2.1 Experimental fish
A total of 225 rainbow trout were acquired (Torr Fisheries, Devon) and acclimated according
to method outlined in section 2.1.2. Throughout the acclimation period fish were fed a
commercial grower diet (EWOS, West Lothian) at 2% bodyweight per day.
4.2.2 Diets and experimental regime
Two test diets and one reference diet were formulated (table 4.1) and produced ‘in house’.
The reference diet had fishmeal as its only protein source and the two test diets contained a
soy protein concentrate (Hamlet Protein, Denmark) at 50% dry weight inclusion. The 50%
dry weight inclusion contributed 62% of the protein to the diet. Two Hamlet Protein SPC
products were used, one per test diet. Both SPCs were compositionally identical except one
was dephytinized with a microbial phytase (Natuphos 5000L, BASF) reducing the phytic acid
from 1.6% to 0.4% but maintaining the total phosphorus at 0.59% (Appendix 8.1). The diets
were formulated to be isonitrogenous and isolipidic and both test diets were identical in their
mineral composition (table 4.1).
A total of 25 fish per tank, mean weight 50 ± 1.4g, were randomly assigned to a dietary
treatment, each consisting of 3 replicate tanks (n=3). Fish were fed the experimental diet at
approximately 2% biomass per day, maintained for a 21 day period using a predicted FCR of
1.0 to project a weekly increase in feed ration. On days 22, 25 and 29 the fish were stripped
(section 2.3.3) and their faeces pooled by tank. The faeces from each sample day were
pooled for analysis.
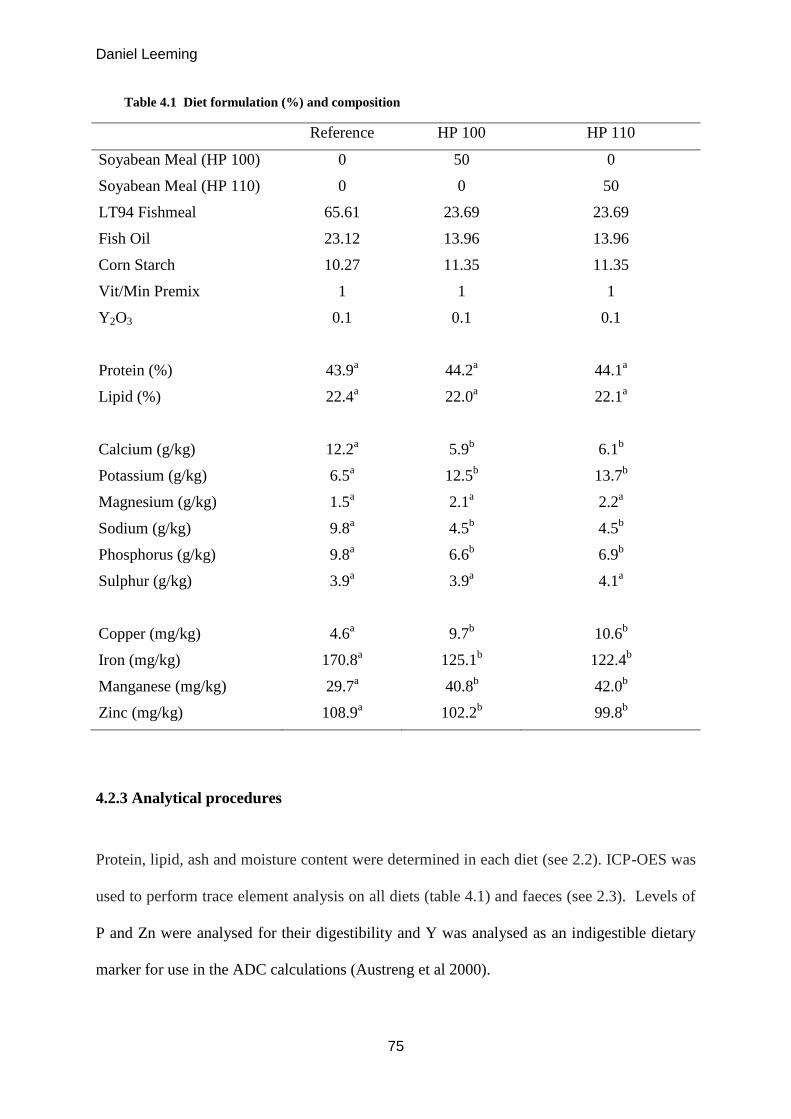
Daniel Leeming
75
Table 4.1 Diet formulation (%) and composition
Reference HP 100 HP 110
Soyabean Meal (HP 100) 0 50 0
Soyabean Meal (HP 110) 0 0 50
LT94 Fishmeal 65.61 23.69 23.69
Fish Oil 23.12 13.96 13.96
Corn Starch 10.27 11.35 11.35
Vit/Min Premix 1 1 1
Y2O3 0.1 0.1 0.1
Protein (%) 43.9a 44.2
a 44.1
a
Lipid (%) 22.4a 22.0
a 22.1
a
Calcium (g/kg) 12.2a 5.9
b 6.1
b
Potassium (g/kg) 6.5a 12.5
b 13.7
b
Magnesium (g/kg) 1.5a 2.1
a 2.2
a
Sodium (g/kg) 9.8a 4.5
b 4.5
b
Phosphorus (g/kg) 9.8a 6.6
b 6.9
b
Sulphur (g/kg) 3.9a 3.9
a 4.1
a
Copper (mg/kg) 4.6a 9.7
b 10.6
b
Iron (mg/kg) 170.8a 125.1
b 122.4
b
Manganese (mg/kg) 29.7a
40.8b
42.0b
Zinc (mg/kg) 108.9a 102.2
b 99.8
b
4.2.3 Analytical procedures
Protein, lipid, ash and moisture content were determined in each diet (see 2.2). ICP-OES was
used to perform trace element analysis on all diets (table 4.1) and faeces (see 2.3). Levels of
P and Zn were analysed for their digestibility and Y was analysed as an indigestible dietary
marker for use in the ADC calculations (Austreng et al 2000).
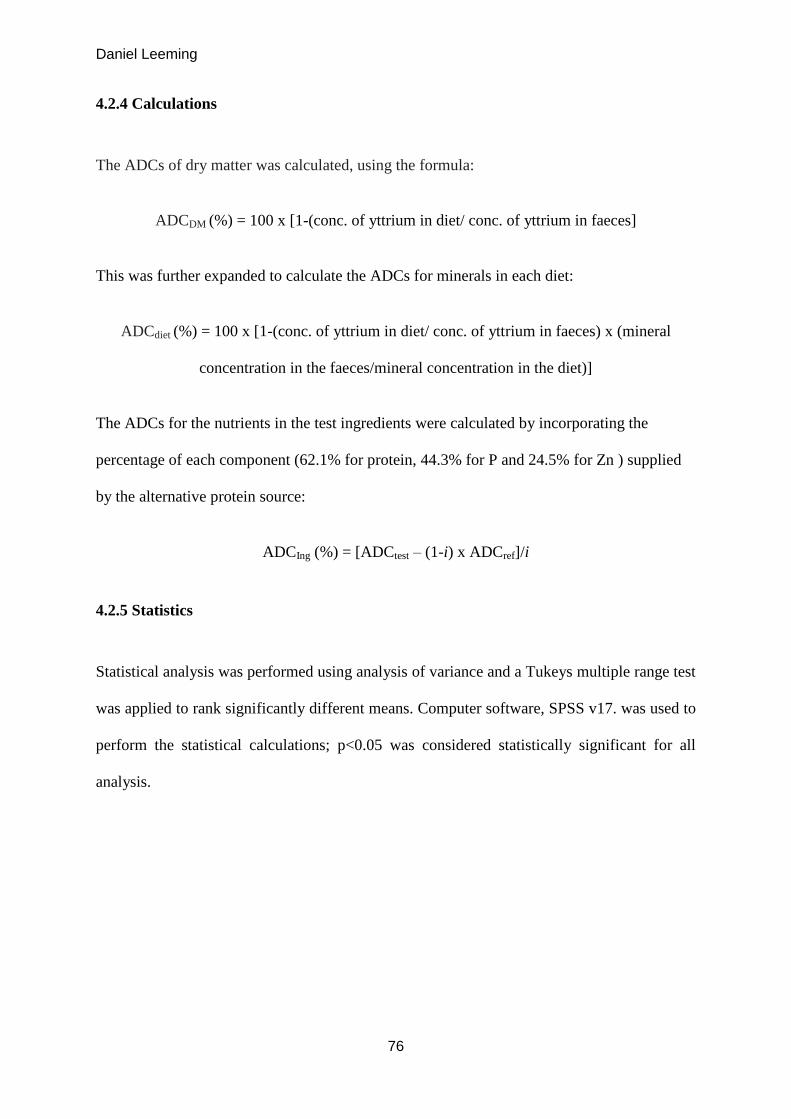
Daniel Leeming
76
4.2.4 Calculations
The ADCs of dry matter was calculated, using the formula:
ADCDM (%) = 100 x [1-(conc. of yttrium in diet/ conc. of yttrium in faeces]
This was further expanded to calculate the ADCs for minerals in each diet:
ADCdiet (%) = 100 x [1-(conc. of yttrium in diet/ conc. of yttrium in faeces) x (mineral
concentration in the faeces/mineral concentration in the diet)]
The ADCs for the nutrients in the test ingredients were calculated by incorporating the
percentage of each component (62.1% for protein, 44.3% for P and 24.5% for Zn ) supplied
by the alternative protein source:
ADCIng (%) = [ADCtest – (1-i) x ADCref]/i
4.2.5 Statistics
Statistical analysis was performed using analysis of variance and a Tukeys multiple range test
was applied to rank significantly different means. Computer software, SPSS v17. was used to
perform the statistical calculations; p<0.05 was considered statistically significant for all
analysis.
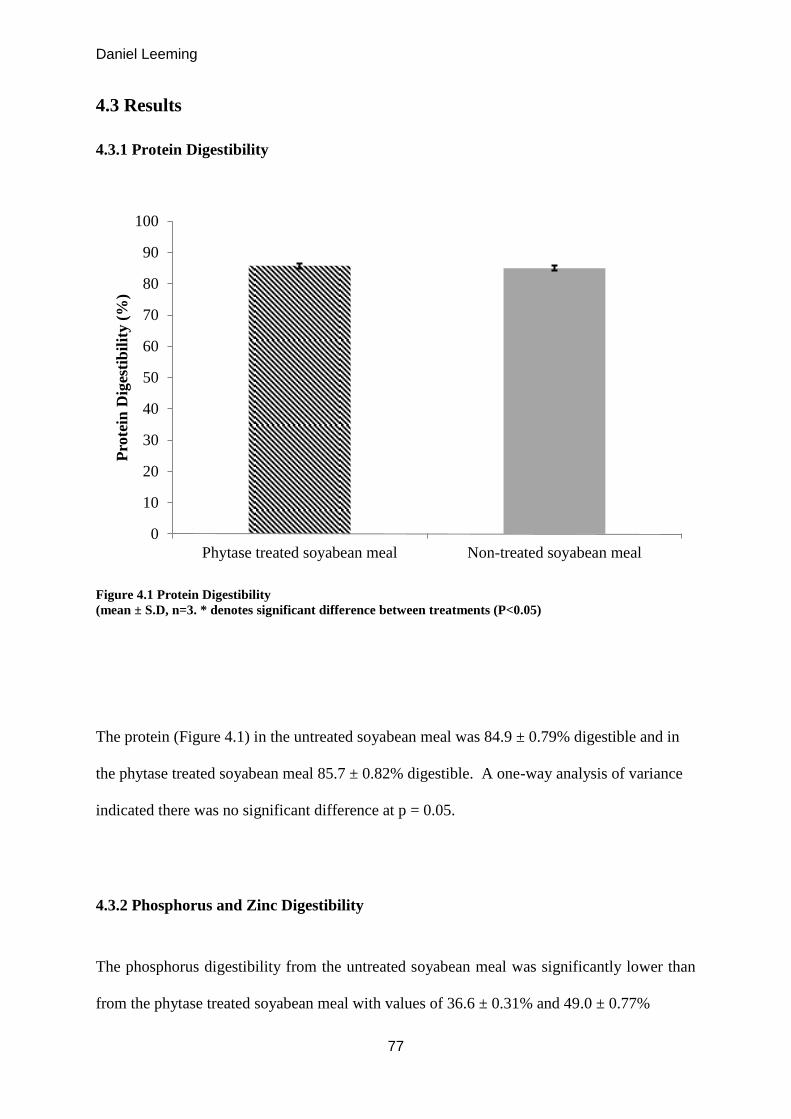
Daniel Leeming
77
4.3 Results
4.3.1 Protein Digestibility
Figure 4.1 Protein Digestibility
(mean ± S.D, n=3. * denotes significant difference between treatments (P<0.05)
The protein (Figure 4.1) in the untreated soyabean meal was 84.9 ± 0.79% digestible and in
the phytase treated soyabean meal 85.7 ± 0.82% digestible. A one-way analysis of variance
indicated there was no significant difference at p = 0.05.
4.3.2 Phosphorus and Zinc Digestibility
The phosphorus digestibility from the untreated soyabean meal was significantly lower than
from the phytase treated soyabean meal with values of 36.6 ± 0.31% and 49.0 ± 0.77%
0
10
20
30
40
50
60
70
80
90
100
Phytase treated soyabean meal Non-treated soyabean meal
Pro
tein
Dig
esti
bil
ity (
%)
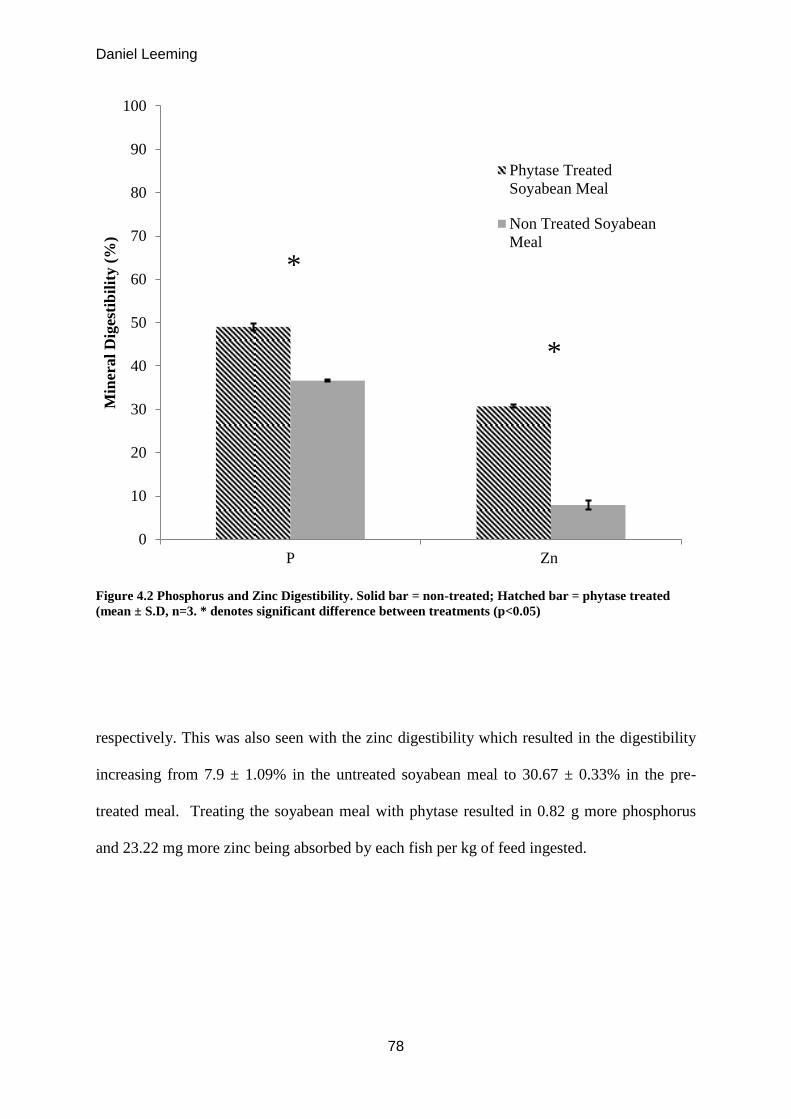
Daniel Leeming
78
Figure 4.2 Phosphorus and Zinc Digestibility. Solid bar = non-treated; Hatched bar = phytase treated
(mean ± S.D, n=3. * denotes significant difference between treatments (p<0.05)
respectively. This was also seen with the zinc digestibility which resulted in the digestibility
increasing from 7.9 ± 1.09% in the untreated soyabean meal to 30.67 ± 0.33% in the pre-
treated meal. Treating the soyabean meal with phytase resulted in 0.82 g more phosphorus
and 23.22 mg more zinc being absorbed by each fish per kg of feed ingested.
0
10
20
30
40
50
60
70
80
90
100
P Zn
Min
eral
Dig
esti
bil
ity (
%)
Phytase Treated
Soyabean Meal
Non Treated Soyabean
Meal
*
*

Daniel Leeming
79
4.4 Discussion
The results clearly show that the pre-treatment of soyabean meal with phytase makes both the
phosphorus and the zinc more available to rainbow trout. Previously similar results have
been reported by Storebakken et al (1998) and Cain and Garling (1995). Both of these
groups used salmonids and reported a higher digestibility and retention of phosphorus, and a
higher whole body phosphorus level respectively. The increased phosphorus digestibility is
proposed as evidence that the hydrolysation of phytate was successful. The enhanced uptake
of zinc in the present study is further evidence of the successful breakdown of the phytate. It
has been well documented that phytate decreases zinc availability in salmonids (Richardson
et al, 1985) and, as evidenced by the very low zinc availability from the untreated soyabean
meal used in this study, the zinc from soya based feedstuffs is particularly poor (Sugiura et al,
1998). Ramseyer et al. (1999) reported higher bone zinc content and Storebakken et al (1998)
reported higher whole body zinc content when dephytinised plant materials were fed to
rainbow trout and Atlantic salmon respectively, reinforcing the increased zinc digestibility
reported here.
In the present study, unlike Storebakken et al (2000), protein digestibility was not increased
by the addition of phytase. However, the authors of that study used a soy protein concentrate
which may have a more concentrated level of phytate to start with due to its processing. The
protein availability in both this current study and Stoebakken et al (2000) are both contrary to
the results in a study by Teskeredzic et al (1995), which reported a negative effect on protein
retention when rapeseed protein concentrate was treated with phytase and fed to rainbow
trout. It is unclear why these discrepancies occur but it could be due to differences in
composition of the soyabean meal, soy protein concentrates and rapeseed protein
concentrates, or it could be due to the treatment procedures.

Daniel Leeming
80
The industrial protocol of adding phytase to the diet may also play an important role in how
effective the treatment will be in practice. In the current study and in both the investigations
of Vielma et al (2002) and Storebakken et al (2000) the phytase was added to the soyabean
product during processing Other studies have top sprayed phytase onto the preformed pellets
prior to feeding. Forster et al (1999) top sprayed phytase onto pellets up to levels of 4500U
phytase kg-1
diet with no observed effect on rainbow trout. Oliva-Teles et al (1998)
incorporated 2000U phytase kg-1
diet during the pelleting process and also reported no
enhanced performance when fed to sea bass (Dicentrarchus labrax). In both the above
mentioned studies, where the phytase was either top sprayed or incorporated into the pellets
with the other ingredients the temperature of the feed storage conditions and/or fish holding
water may play an important role. Neither group reports the feed storage conditions but
Forster et al held the fish at 11ºC and Oliva-Teles et al held theirs at 20ºC. Both groups used
Natuphos® (BASF, Germany) as the phytase, which is obtained by fermentation from an
Aspergillus niger strain. The temperatures used in these trials are not optimal for phytase
activity which is optimal at 50ºC, an issue which is partially avoided when the phytase is
incorporated into the processing and drying of the raw material and may explain why no
effect of was observed in these studies conducted under controlled experimental conditions
and temperatures.
In conclusion, the present data clearly demonstrates the enhanced uptake of both phosphorus
and zinc from the diet. It cannot be confirmed from this study whether this has any long term
effect on either growth or the health of the fish but it certainly would result in a significantly
reduced phosphorus and zinc load in to the water and may result in the need for less of these
resources to be used in modern plant-based aquafeeds. The economic feasibility of this
potentially expensive treatment also needs investigating.

Daniel Leeming
81
CHAPTER 5. Organic verses inorganic zinc supplementation; effect on
growth, digestibility, tissue levels and protein synthesis.
5.1 Introduction
The type of zinc source used could become of uppermost importance when formulating a diet
for aquaculture which requires zinc supplementation because of its protein source
composition. There can be considerable differences in both the digestibility and the
bioavailability of the zinc depending on whether the zinc is from an inorganic salt, i.e. ZnSO4
or ZnO, or whether the zinc is ligated to an organic compound (Paripatananont and Lovell,
1997; Rider et al, 2009; Satoh et al, 2001). Currently it is common practice to supplement
diets with an inorganic salt, mostly ZnSO4, however several organic sources of zinc have
been used as nutritional supplements both in mammals and fish (Chesters,1997; Maage et
al.,2001; Kucukbay et al.,2006). When a diet is supplemented with an inorganic zinc salt the
zinc is considered a ‘free’ zinc ion while in the gut lumen and is therefore available for
uptake out of the gut (providing the element is not bound by another insoluble compound or
anti-nutritional factor) but must utilize the tightly regulated and competitive cation uptake
mechanisms indicated by the decrease in copper absorption when excess zinc is present and
vice versa (Kumar, 2006). These mechanisms are often non-specific for zinc and therefore
zinc availability may be influenced greatly by other free cationic elements. By using a zinc
source in which the zinc is either simply complexed (where only one atom in the ligand
donates an electron pair; monodentate) or chelated (two or more atoms donate an electron
pair; polydentate) to either an amino acid or a hydrolyzed protein, the zinc has the potential to
be taken up from the gut via a different pathway (Glover et al, 2003). Complexing/chelation
may also prevent the zinc being bound by other anions or ligands which may be insoluble and
unavailable for absorption. When using an organic form of zinc, the strength of the ligands
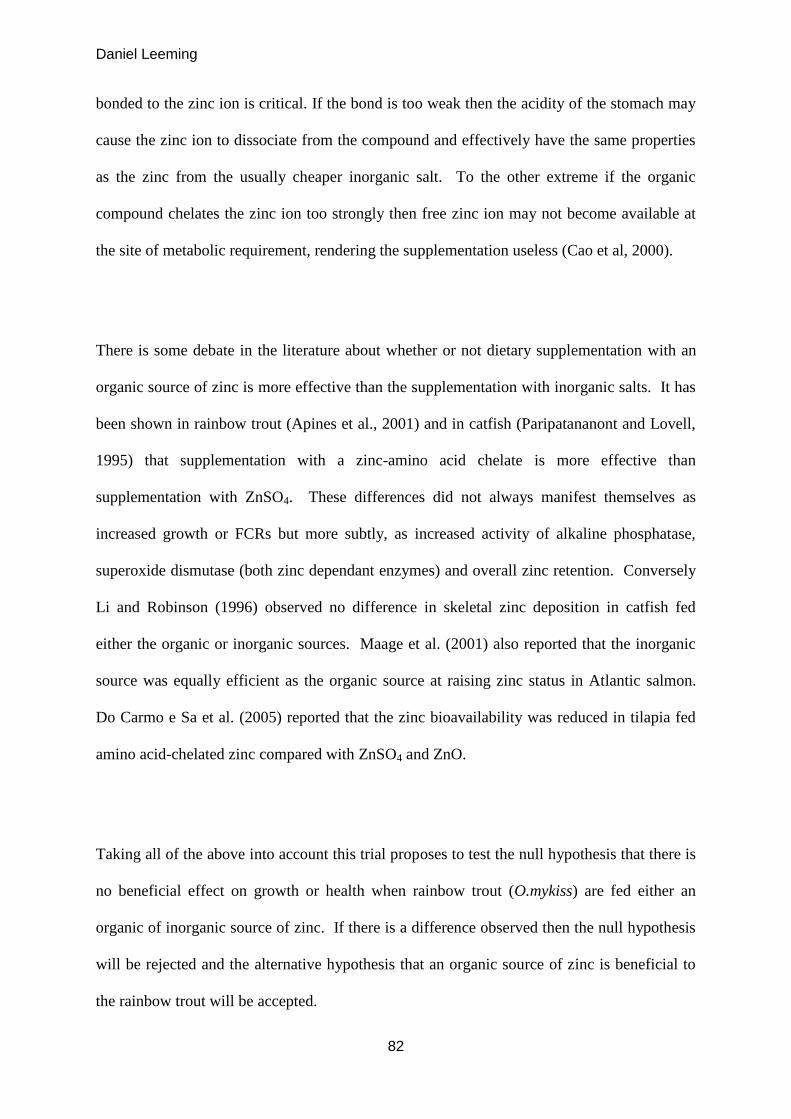
Daniel Leeming
82
bonded to the zinc ion is critical. If the bond is too weak then the acidity of the stomach may
cause the zinc ion to dissociate from the compound and effectively have the same properties
as the zinc from the usually cheaper inorganic salt. To the other extreme if the organic
compound chelates the zinc ion too strongly then free zinc ion may not become available at
the site of metabolic requirement, rendering the supplementation useless (Cao et al, 2000).
There is some debate in the literature about whether or not dietary supplementation with an
organic source of zinc is more effective than the supplementation with inorganic salts. It has
been shown in rainbow trout (Apines et al., 2001) and in catfish (Paripatananont and Lovell,
1995) that supplementation with a zinc-amino acid chelate is more effective than
supplementation with ZnSO4. These differences did not always manifest themselves as
increased growth or FCRs but more subtly, as increased activity of alkaline phosphatase,
superoxide dismutase (both zinc dependant enzymes) and overall zinc retention. Conversely
Li and Robinson (1996) observed no difference in skeletal zinc deposition in catfish fed
either the organic or inorganic sources. Maage et al. (2001) also reported that the inorganic
source was equally efficient as the organic source at raising zinc status in Atlantic salmon.
Do Carmo e Sa et al. (2005) reported that the zinc bioavailability was reduced in tilapia fed
amino acid-chelated zinc compared with ZnSO4 and ZnO.
Taking all of the above into account this trial proposes to test the null hypothesis that there is
no beneficial effect on growth or health when rainbow trout (O.mykiss) are fed either an
organic of inorganic source of zinc. If there is a difference observed then the null hypothesis
will be rejected and the alternative hypothesis that an organic source of zinc is beneficial to
the rainbow trout will be accepted.

Daniel Leeming
83
The trial will take the form of a standard 10 week growth experiment but the fish will also be
subjected to a one week stress experiment at the end of the growth trial. Before an after the
stress trial the fish will assessed for oxidative status, enzyme activity and tissue mineral
content/retention in order to evaluate the more subtle effects which have been observed in
some of the studies mentioned above. The diets have been designed based on a zinc deficient
diet known to reduce the levels of zinc in the eye, liver and caudal fin as well as reduce the
whole body zinc concentration. The basal diet will be supplemented with the two sources of
zinc. This is a classical method of evaluating the dose response of a therapeutic treatment i.e.
deliberately causing the deficiency and then trying to alleviate the symptoms of the
deficiency by adding incremental levels of the deficient substance.
All of the investigations mentioned above, whether advocating organic sources or not, used
dietary zinc concentrations above the requirements of the fish and none used this method of
trying to alleviate the problems caused by the use of a deficient diet. It could be argued that
in reality the fish would not be exposed to such low levels of zinc, however there will be
times during production when the fish are exposed to stress from husbandry techniques or
exposure to disease when the requirements of the fish are elevated closer to, if not above, the
levels provided by the diet. This is becoming more likely with the drive towards higher plant
material inclusion in the diet which can reduce the zinc availability (Gatlin et al., 2007). The
use of such low levels of zinc, in the authors opinion, are required to illustrate the differences
between mineral sources and diets and it is these differences which, although may be hidden
at higher zinc levels, may result in better health in times of stress, disease or maturation.
There are also potential environmental and economic advantages to using a more available
source of zinc.
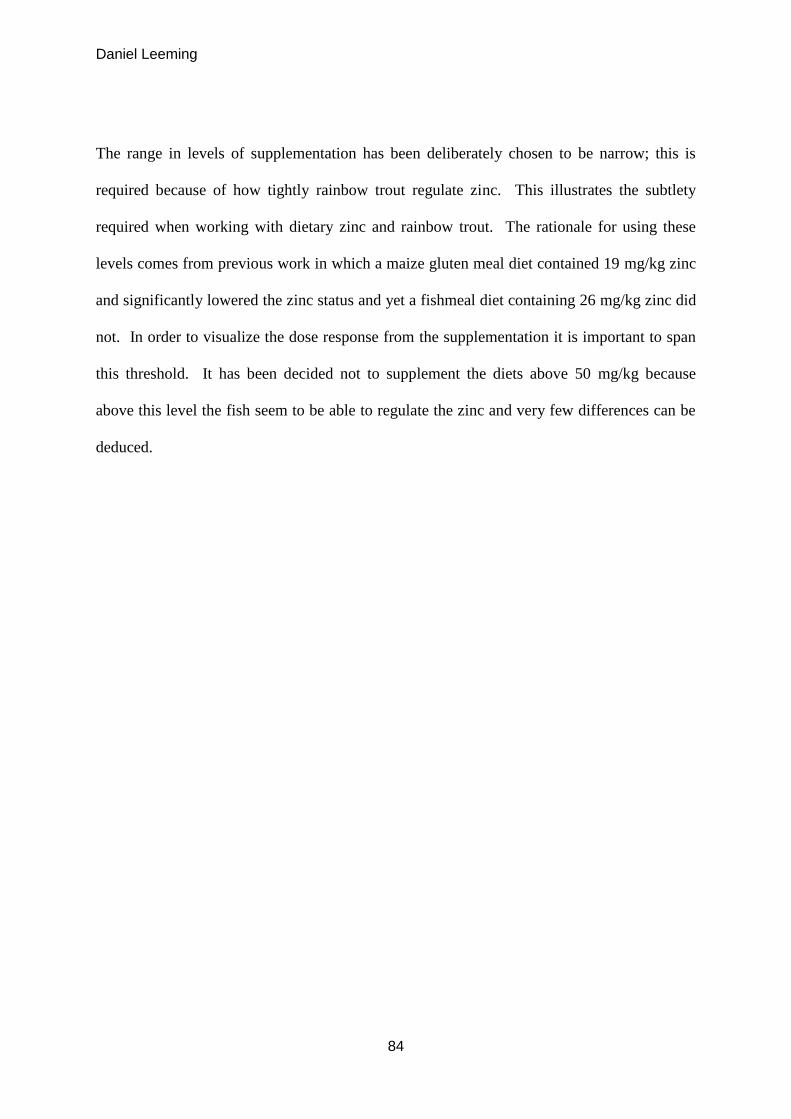
Daniel Leeming
84
The range in levels of supplementation has been deliberately chosen to be narrow; this is
required because of how tightly rainbow trout regulate zinc. This illustrates the subtlety
required when working with dietary zinc and rainbow trout. The rationale for using these
levels comes from previous work in which a maize gluten meal diet contained 19 mg/kg zinc
and significantly lowered the zinc status and yet a fishmeal diet containing 26 mg/kg zinc did
not. In order to visualize the dose response from the supplementation it is important to span
this threshold. It has been decided not to supplement the diets above 50 mg/kg because
above this level the fish seem to be able to regulate the zinc and very few differences can be
deduced.

Daniel Leeming
85
5.2 Methods
5.2.1 Experimental Design
A 10 week growth trial immediately followed by a one week stress experiment was
conducted using a non-zinc supplemented diet and three sets of diets supplemented with
increasing zinc levels of two different forms of zinc. All the diets were formulated using
Feedsoft Pro™ and were isonitrogenous and isolipidic (Table 5.1). The unsupplemented diet
was formulated to have a zinc content of 25 mg/kg, the low supplemented diets to have a zinc
level of 30 mg/kg (5 mg/kg supplemented), the medium supplemented diets to have a zinc
level of 40 mg/kg (15 mg/kg supplemented), and the high supplemented to have zinc level of
55 mg/kg (30 mg/kg supplemented). A zinc sulphate salt (Sigma, UK) was used as the
inorganic zinc form and a yeast-based BioPlex zinc (Alltech, USA) was used as the organic
zinc source. At the end of the 10 weeks the remaining fish were subjected to an intense
regime of husbandry-like stressors.
5.2.1.1 Growth and Zinc Retention Trial
Fingerling rainbow trout (20-30 g) obtained from Torre Fisheries (Minehead, UK) were
acclimated to the system for four weeks and fed a commercial diet (EWOS) to reach an
average weight of 67.89 ± 3.37 g. A total of 475 fish were divided into 19 tanks (25 per tank).
Each tank was randomly allocated a diet; three tanks for the unsupplemented diet, three tanks
for the high supplementation for both zinc forms, three tanks for the low zinc supplemented
diets in both zinc forms in and two tanks for both the medium supplemented diets. The fish
were fed at 2% body weight per day (calculated every seven days) for 70 days. The initial
sampling was conducted on day 0, prior to the first experimental feeding and the final
sampling was conducted on day 70. Sampling consisted of initial weight-taking and analysis
of the zinc levels in the eye, fin, liver, serum and whole body by ICP-OES (chapter 2.3).

Daniel Leeming
86
Table 5.1 Diet Formulation (%) and composition
Non-
supplemented
Low
ZnSO4
Med
ZnSO4
High
ZnSO4
Low Zn
BioPlex
Med Zn
BioPlex
High Zn
BioPlex
Casein 14.0 14.0 14.0 14.0 14.0 14.0 14.0
LT 94 Fishmeal 15.0 15.0 15.0 15.0 15.0 15.0 15.0
Maize Gluten meal 37.0 37.0 37.0 37.0 37.0 37.0 37.0
Corn Starch 13.8 13.8 13.8 13.8 13.8 13.8 13.8
Fish Oil 19.0 19.0 19.0 19.0 19.0 19.0 19.0
Vit/min premix 1.0 1.0 1.0 1.0 1.0 1.0 1.0
L-lysine 0.1 0.1 0.1 0.1 0.1 0.1 0.1
Y2O3 0.1 0.1 0.1 0.1 0.1 0.1 0.1
ZnSO4 0.0 0.0022 0.0066 0.0132 0.0 0.0 0.0
BioPlex Zn 0.0 0.0 0.0 0.0 0.0041 0.0124 0.0249
Protein (%) 47.0
± 0.6
46.6
± 0.3
47.2
± 0.1
46.5
± 0.7
47.6
± 0.5
47.7
± 0.4
47.0
± 0.1
Lipid (%) 21.8
± 0.6
21.6
± 0.8
22.1
± 0.3
21.9
± 0.6
22.0
± 0.3
22.1
± 0.5
21.7
± 0.6
Zinc (mg/kg) 24.2
± 0.3
29.2
± 0.1
38.5
± 1.4
57.8
± 0.7
29.7
± 0.5
39.7
± 0.1
56.8
± 0.2
5.2.1.2 Stress experiment
The effect of husbandry stress was assessed after seven days of alternate netting (twice a day
for 1 min) and confinement (by reduced water levels for 45 min). Prior to the onset of the
stress regime five fish per tank were removed from the experiment and blood and livers were
sampled as unstressed controls. On day seven of the stress experiment the fish were netted
once and then sampled for blood and livers. Analysis of both the stressed and unstressed
individuals consisted of DNA strand break analysis by single cell gel electrophoresis (chapter
2, section 2.5), metallothionein levels (chapter 2, section 2.4.3), superoxide dismutase activity
(chapter 2, section 2.4.2) and the gene expression of metallothionein A and B (chapter 2.6).

Daniel Leeming
87
Table 5.2 O.mykiss gene specific primers for metallothionein genes (MTA and MTB) and housekeeping
gene (18S Ribosomal RNA).
Gene
Forward (5’-3’)
Reverse (5’-3’)
Product
(bp)
An. T
(ºC)
Ref #
(NCBI)
MTA catgcaccagttgtaagaaagca gcagcctgaggcacacttg 74 55 M18103.1
MTB tcaacagtgaaattaagctgaaatacttc aagagccagttttagagcattcaca 97 54 M18104.1
18S cggaggttcgaagacgatca tcgctagttggcatcgtttatg 62 53 FJ710874.1
5.2.2 Gene expression primers and validation
Primers (Table 5.2) were designed using Primer Blast (NCBI) and were designed to produce
amplicons spanning 1 intron junction. Using a DNA calculator (Sigma-Aldrich) and
OligoCalc (Northwestern University, USA) primers were designed to avoid secondary
structures, hairpin formation and self-annealing complementarity. After RT- PCR (chapter 2,
section 2.6.2) cDNA was subjected to 40 cycles of PCR amplification (chapter 2, section
2.6.3) and the amplicons size was verified on a 2% agarose gel with suitable DNA ladder
(BioLabs, UK).
5.2.3 Statistics
Statistical analysis was performed using analysis of variance and a Tukeys multiple range test
was applied to rank significantly different means. Computer software, SPSS v18 (IBM) was
used to perform the statistical calculations; p<0.05 was considered statistically significant for

Daniel Leeming
88
all analyses. Single cell gel electrophoresis data (% Tail DNA) was arcsine transformed prior
to statistical testing for significance between means (n = 200 per fish, 5 fish per treatment).
Gene expression data was first assessed for the efficiency (e = 10-1/slope
-1) of the qRT-PCR
using a standard curve run on each plate and plates with efficiencies outside 0.9-1.1 were
rejected for further analysis and the plates repeated/optimized. Comparative quantification
(2-ΔΔCt
) was used to calculate expression fold-changes and all changes were normalized to the
housekeeping gene. Treatments then were run over multiple plates and were standardized by
resolving for slope and y-intercept of the standard curve with efficiency closest to 1.0 prior to
comparative quantification.

Daniel Leeming
89
5.3. Results
5.3.1 Growth
Figure 5.1 Individual fish weights over the 10 week trial period (mean ± S.D., n=3) * denotes significant
difference between treatments.
The level of zinc and the form of zinc supplied by the diets had no significant effect on the
growth (fig 5.1). The initial average weight of the individual fish ranged from 66.1 ± 1.6 g in
the BioPlex high diet to 68.4 ± 1.8 g in the BioPlex medium diet and the final average weight
of the individual fish ranged from 197.4 ± 4.3 g sulphate medium diet to 199.0 ±5.7g in the
sulphate high diet. The maximum weight gained was 132.4 ± 7.4 g in the BioPlex High diet
and the minimum weight gained was 129.7 ± 8.1 g in the sulphate medium diet. This resulted
in no significant differences of FCR (which ranged from 0.98 in the high organic to 1.12 in
the basal) or SGR (ranged from 2. 06 in the high organic to 1.97 in the basal) (Table 5.3). The
apparent digestibility coefficients for each zinc form were statistically different (fig 5.2) the
0
20
40
60
80
100
120
140
160
180
200
0 7 14 21 28 35 42 49 56 63 70
Weig
ht
(g)
Day
Basal
Sulphate Low
Sulphate Med
Sulphate High
BioPlex Low
BioPlex Med
BioPlex High

Daniel Leeming
90
Table 5.3 Diet performance (weight gain, FCR and SGR) (mean ± S.D., n=3) Values in the same column with different suffix significant difference (p<0.05)
Initial Weight
(g)
Final weight
(g)
Weight Gain
(g)
FCR SGR
Basal
67.5 ± 1.3
198.0 ± 8.1
130.5 ± 6.8
1.12 ± 0.07
1.97 ± 0.06
Low
Sulphate
66.8 ± 1.7
198.8 ± 3.5
132.0 ± 1.8
1.12 ± 0.09
1.98 ± 0.09
Low
BioPlex
67.7 ± 1.0
197.7 ± 7.2
130.0 ± 6.2
1.07 ± 0.03
1.99 ± 0.05
Med
Sulphate
67.7 ± 1.8
197.4 ± 4.3
129.7 ± 8.1
1.05 ± 0.09
2.00 ± 0.07
Med
BioPlex
68.4 ± 1.8
198.4 ± 4.6
130.0 ± 2.8
1.06 ± 0.06
1.99 ± 0.05
High
Sulphate
67.2 ± 1.2
199.0 ± 5.7
131.7 ± 4.5
0.99 ± 0.08
2.05 ± 0.08
High
BioPlex
66.1 ± 1.6
198.5 ± 9.0
132.4 ± 7.4
0.98 ± 0.07
2.06 ± 0.07
organic zinc was 37.4 ± 5.0% digestible and the inorganic zinc was 26.9 ± 4.4% digestible, a
relative increase in digestibility of 38.8%.
5.3.2 Tissue Zinc Levels
The serum levels of zinc after 70 days on the respective diets are displayed in figure 5.3. The
fish on the base diet, with 0.0 mg/kg zinc supplementation had a serum zinc concentration of
14.4 ± 2.1 mg/l. The 5 mg/kg supplementation of either zinc form did not result in a
significant increase in serum zinc concentration, with the fish on the inorganically

Daniel Leeming
91
Figure 5.2 Zinc ADCs (%) (mean ± S.D., n=3) Bars with different suffix are statistically different (p<0.05)
Figure 5.3 Serum zinc levels (mean ± S.D., n=3) Dark grey bar = organic zinc; light grey bar = inorganic
zinc; Hatched bar = unsupplemented. Bars with different suffix are statistically different (p<0.05)
0
5
10
15
20
25
30
35
40
45
BioPlex Sulphate
Zn
AD
C (
%)
0
5
10
15
20
25
30
High Med Low Basal
Zn
Con
c. (
mg/l
)
b
a
a
b
c c
a
b
c

Daniel Leeming
92
supplemented diet having 12.3 ± 1.7 mg/l and the fish on the organically supplemented diet
having 14.0 ± 2.2 mg/l in their serum. The medium level supplementation of 15 mg Zn/kg
diet did significantly increase the serum zinc concentration from both the base diet and the 5
mg/kg supplemented diet, reporting serum concentrations of 18.6 ± 2.6 mg/l from the
inorganic zinc and 19.2 ± 1.7 mg/l from the organic zinc. The 30 mg/kg supplemented diets
resulted in a significant increase in serum zinc concentration from all the other 3 levels of
supplementation with serum zinc levels of 24.3 ± 2.1 mg/l from the inorganic zinc and 23.5 ±
2.1 mg/l from the organic zinc. The form of zinc fed to the fish had no significant effect on
the serum zinc concentration at any of the supplementation levels used.
The ocular zinc concentrations of the fish after 70 days on the respective diets are displayed
in figure 5.4. The 0 mg/kg supplemented diet resulted in the ocular zinc level falling to 96.3
± 7.4 µg/g. The 5 mg/kg and the 15 mg/kg supplementation of the inorganic zinc did not
significantly increase the ocular zinc levels from the base, unsupplemented diet, reporting
levels of 105.9 ± 7.8 µg/g and 105.4 ± 8.2 µg/g respectively. The organic supplementation at
the same levels (5 mg and 15 mg/kg) did significantly increase the ocular zinc concentration
from both the unsupplemented diet and diet supplemented with an equal level of zinc in the
inorganic form. The 5 mg/kg organic zinc supplementation resulted in levels of 123.7 ± 7.1
µg/g of zinc in the eye and the 15 mg/kg organic zinc supplemented diet resulted in an ocular
zinc concentration of 127.0 ± 12.6 µg/g. In the diets supplemented with 30 mg Zn/kg, in
either form, there was a significant increase in ocular zinc concentration from the
unsupplemented diet, with levels of 138.1 ± 6.2 µg/g and 136.5 ± 19.9 µg/g in the organic
and inorganic diets respectively. Within the organically supplemented diets there is no
significant difference between the 5mg/kg supplemented diet and the 30 mg/kg supplement
diets but all are significantly increased from the unsupplemented diets. In the inorganically
supplemented diets the only significant increase in ocular zinc concentration from the

Daniel Leeming
93
Figure 5.4 Ocular zinc levels (mean ± S.D., n=3) Dark grey bar = organic zinc; light grey bar = inorganic
zinc; Hatched bar = unsupplemented. Bars with different suffix are statistically different (p<0.05)
unsupplemented diets can be seen in the highest level (30 mg/kg) of supplementation.
The caudal fin zinc concentration in fish fed the unsupplemented diet was 80.5 ± 7.6 µg/g
(fig5.5). The 5 mg/kg supplementation of the organic zinc increased the caudal fin zinc
levels to 89.9 ± 3.0 µg/g and the 5 mg/kg supplementation of the inorganic zinc increased the
caudal fin zinc level to 83.0 ± 3.2 µg/g, neither of which were significantly different to the
fish on the unsupplemented diet however the variance in the unsupplemented base diet is
significantly larger than in all other groups. The increase in dietary zinc supplementation
from 5 mg/kg to 15 mg/kg resulted in an increase in caudal fin zinc levels to 108.2 ± 1.9 µg/g
in the organically supplemented fish and 108.1 ± 1.4 µg/g in the fish on the inorganically
0
20
40
60
80
100
120
140
160
180
High Med Low Basal
Zn
Con
c. (
µg/g
) a a
a
b
a
b b

Daniel Leeming
94
Figure 5.5 Caudal fin zinc levels (mean ± S.D., n=3) Dark grey bar = organic zinc; light grey bar =
inorganic zinc; Hatched bar = unsupplemented. Bars with different suffix are statistically different
(p<0.05)
supplemented diets. Both are significantly higher than in the fish fed the 5 mg/kg
supplemented diets but not from each other. The highest level of supplementation resulted in
a significant increase in caudal fin zinc levels from the medium level supplementation in both
forms of zinc. The organic supplementation also resulted in a further, significant increase
over the inorganically supplemented diet, resulting in levels of 131.7 ± 2.8 µg/g and 117.3 ±
3.0 µg/g respectively.
The hepatic zinc concentrations of the fish are displayed in figure 5.6. The fish on the
unsupplemented diet had a hepatic zinc concentration of 99.2 ± 6.2 µg/g and the
supplementation at all three levels and in both forms of zinc had no significant effect on this.
The highest level of supplementation, an additional 30 mg Zn/Kg of diet, resulted in a hepatic
0
20
40
60
80
100
120
140
160
High Med Low Basal
Zn
Con
c. (
µg/g
)
a
b c c
d d d

Daniel Leeming
95
Figure 5.6 Hepatic zinc levels (mean ± S.D., n=3) Dark grey bar = organic zinc; light grey bar = inorganic
zinc; Hatched bar = unsupplemented. Bars with different suffix are statistically different (p<0.05)
zinc concentration of 102.4 ± 7.8 µg/g and 99.8 ± 8.3 µg/g for the organic and the inorganic
zinc respectively. The medium level of supplementation resulted in 97.6 ± 5.5 µg/g and
101.6 ± 3.8 µg/g for the organic and the inorganic zinc and the lowest level of
supplementation resulted in 90.8 ± 10.5 µg/g with the organic zinc and 93.3 ± 10.5 µg/g with
the inorganic zinc. The form of zinc at any of the levels of supplementation had no effect of
the hepatic zinc concentration.
The concentration of zinc in the bile (fig 5.7) was negligible at all dietary levels. The
negative results and large relative spread of data indicates that the levels were close to the
limits of detection by the ICP OES with the levels of standards used.
0
20
40
60
80
100
120
High Med Low Basal
Zn
Con
c. (
µg/g
) a a a
a a a a

Daniel Leeming
96
Figure 5.7 Bile zinc levels (mean ± S.D., n=3) Dark grey bar = organic zinc; light grey bar = inorganic
zinc; Hatched bar = unsupplemented. Bars with different suffix are statistically different (p<0.05)
5.3.3 Zinc dependant proteins
Figure 5.8 displays the % inhibition of a water soluble tetrazolium salt (WST). The higher
the activity of the enzyme superoxide dismutase the higher the inhibition of the WST reaction
with a superoxide anion will be. With all dietary levels of zinc supplementation, in either
form, as well as the unsupplemented diet, resulted in the inhibition of the WST/superoxide
anion reaction by 86.89 ± 0.76% in the unstressed fish and 86.29 ± 0.59% in the stressed fish.
This indicated that neither dietary zinc level, zinc form nor exposure to the simulated
husbandry stressors affected the activity level of the superoxide dismutase.
The level of metallothionein increased in all treatments post stress. Figure 5.9 displays the
amount metallothionein increased. The fish on the unsupplemented base diet increased the
0
0.2
0.4
0.6
0.8
1
1.2
High Med Low Basal
Zn
Co
nc.
(µ
g/g
)
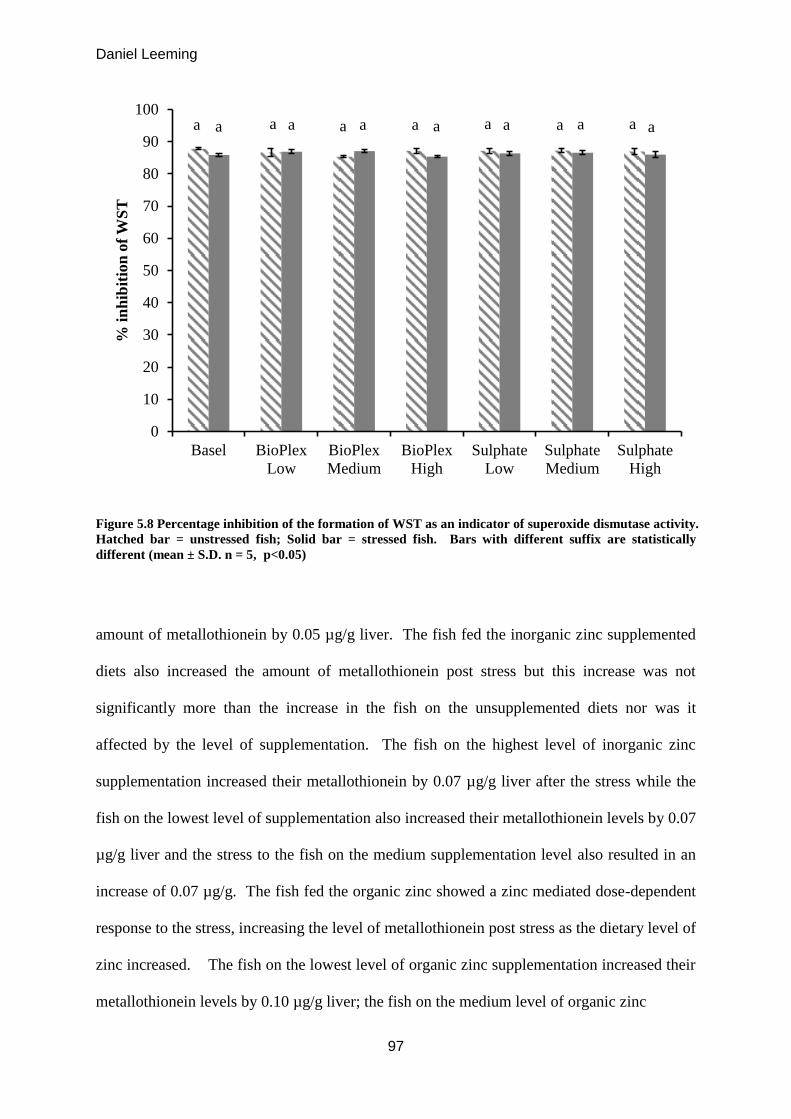
Daniel Leeming
97
Figure 5.8 Percentage inhibition of the formation of WST as an indicator of superoxide dismutase activity.
Hatched bar = unstressed fish; Solid bar = stressed fish. Bars with different suffix are statistically
different (mean ± S.D. n = 5, p<0.05)
amount of metallothionein by 0.05 µg/g liver. The fish fed the inorganic zinc supplemented
diets also increased the amount of metallothionein post stress but this increase was not
significantly more than the increase in the fish on the unsupplemented diets nor was it
affected by the level of supplementation. The fish on the highest level of inorganic zinc
supplementation increased their metallothionein by 0.07 µg/g liver after the stress while the
fish on the lowest level of supplementation also increased their metallothionein levels by 0.07
µg/g liver and the stress to the fish on the medium supplementation level also resulted in an
increase of 0.07 µg/g. The fish fed the organic zinc showed a zinc mediated dose-dependent
response to the stress, increasing the level of metallothionein post stress as the dietary level of
zinc increased. The fish on the lowest level of organic zinc supplementation increased their
metallothionein levels by 0.10 µg/g liver; the fish on the medium level of organic zinc
0
10
20
30
40
50
60
70
80
90
100
Basel BioPlex
Low
BioPlex
Medium
BioPlex
High
Sulphate
Low
Sulphate
Medium
Sulphate
High
% i
nh
ibit
ion
of
WS
T
a a a a a a a a a a a a a a

Daniel Leeming
98
Figure 5.9 Increase in metallothionein levels post stress. Dark grey bar = organic zinc; light grey bar =
inorganic zinc; Hatched bar = unsupplemented. Bars with different suffix are statistically different (mean
± S.D. n = 5, p<0.05)
supplementation increased their metallothionein levels by 0.12 µg/g liver and the fish on the
highest level of organic zinc supplementation increased their metallothionein levels by 0.20
µg/g liver. All increases in metallothionein in the fish fed the organic zinc were significantly
different to the fish fed either the level of zinc beneath theirs or the fish fed the inorganic zinc
at an equal concentration.
5.3.4 Metallothionein gene expression
Exposure to the husbandry stressors induced expression of both MTA and MTB genes
(figures 5.10 and 5.11). There was no significant difference between the expressions of MTA
or MTB at any level of zinc supplementation or between MTA and MTB in fish feed either
0
0.05
0.1
0.15
0.2
0.25
High Medium Low Base
µg
/g liv
er
Dietary Zinc Level
a
d
b
d
c
d
d

Daniel Leeming
99
Figure 5.10 Relative fold changes in Hepatic MTA mRNA production (ΔΔCT
). Solid dark grey =
unstressed organic zinc; Solid light grey = stressed organic zinc; Doted dark grey = unstressed inorganic
zinc; Doted light grey = stressed inorganic zinc. Bars with different suffix are statistically different (mean
± S.D. n = 5, p<0.05)
Figure 5.11 Relative fold changes in Hepatic MTB mRNA production (ΔΔCT
). Solid dark grey =
unstressed organic zinc; Solid light grey = stressed organic zinc; Doted dark grey = unstressed inorganic
zinc; Doted light grey = stressed inorganic zinc. Bars with different suffix are statistically different (mean
± S.D. n = 5, p<0.05)
0.0
0.5
1.0
1.5
2.0
2.5
No Zinc Low Zinc Medium Zinc High Zinc
Rel
ati
ve
fold
ch
an
ge
(2-Δ
ΔC
t )
0
0.5
1
1.5
2
2.5
3
No Zinc Low Zinc Medium Zinc High Zinc
Rel
ati
ve
fold
ch
an
ge
(2-Δ
ΔC
t )
a a a
a a a a
a
b b b b b
b b b
a a a a a
a
a a
b b b b b b b b
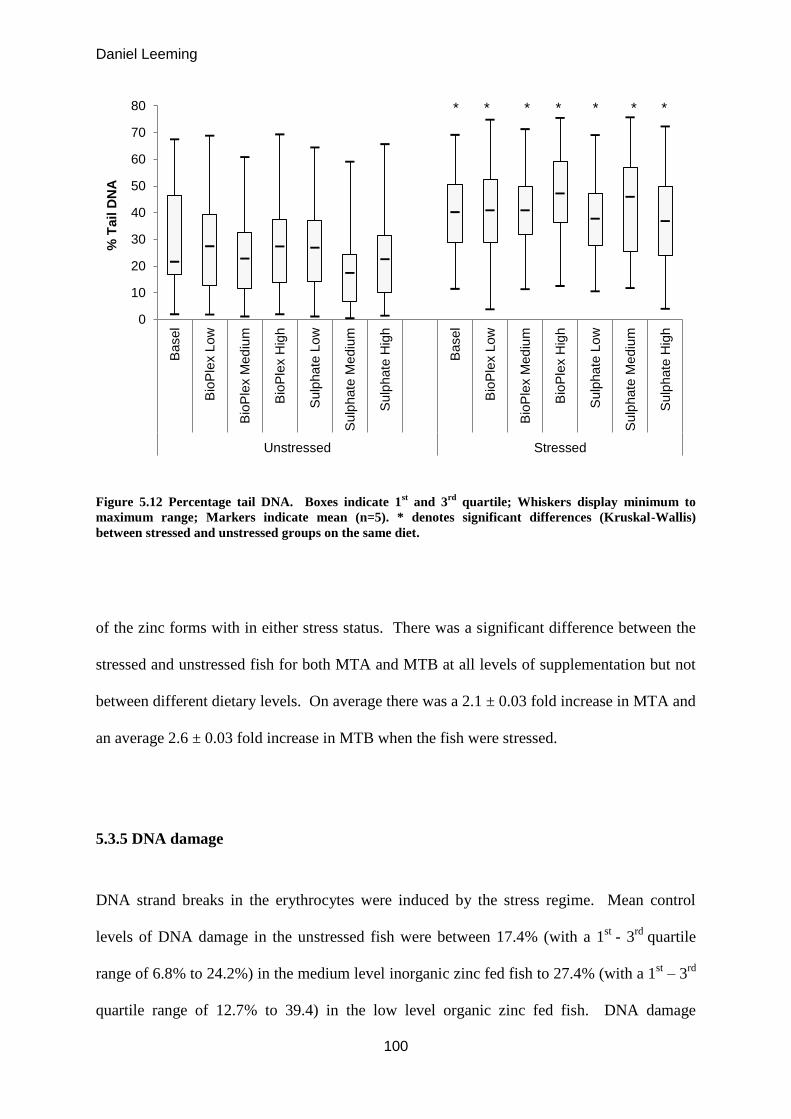
Daniel Leeming
100
Figure 5.12 Percentage tail DNA. Boxes indicate 1st and 3
rd quartile; Whiskers display minimum to
maximum range; Markers indicate mean (n=5). * denotes significant differences (Kruskal-Wallis)
between stressed and unstressed groups on the same diet.
of the zinc forms with in either stress status. There was a significant difference between the
stressed and unstressed fish for both MTA and MTB at all levels of supplementation but not
between different dietary levels. On average there was a 2.1 ± 0.03 fold increase in MTA and
an average 2.6 ± 0.03 fold increase in MTB when the fish were stressed.
5.3.5 DNA damage
DNA strand breaks in the erythrocytes were induced by the stress regime. Mean control
levels of DNA damage in the unstressed fish were between 17.4% (with a 1st
- 3rd
quartile
range of 6.8% to 24.2%) in the medium level inorganic zinc fed fish to 27.4% (with a 1st – 3
rd
quartile range of 12.7% to 39.4) in the low level organic zinc fed fish. DNA damage
0
10
20
30
40
50
60
70
80
Basel
Bio
Ple
x L
ow
Bio
Ple
x M
ed
ium
Bio
Ple
x H
igh
Sulp
hate
Lo
w
Sulp
hate
Mediu
m
Sulp
hate
Hig
h
Basel
Bio
Ple
x L
ow
Bio
Ple
x M
ed
ium
Bio
Ple
x H
igh
Sulp
hate
Lo
w
Sulp
hate
Mediu
m
Sulp
hate
Hig
h
Unstressed Stressed
% T
ail D
NA
* * * * * * *

Daniel Leeming
101
increased significantly in the stressed fish with a range of 36.9% to 47.2% in the high level
organic zinc fed fish and the high level inorganic zinc fed fish respectively. There were no
significant differences between fish fed different dietary concentrations of zinc in either form
within the same stress status.

Daniel Leeming
102
5.4 Discussion
Neither form of zinc nor the dietary level of zinc had any effect on the growth performance of
the fish. The diets were iso-nitrogenous and iso-caloric and the zinc levels ranged from 25
mg/kg in the unsupplemented diet, which is within the 15-30 mg/kg requirement range
(Ogino and Yang, 1978) to 55 mg/kg which is well above the requirement for this species i.e.
rainbow trout. It should be noted that the zinc in the organic zinc source is not an organo-
zinc (i.e Zn-Carbon bond). It is a yeast cultured in a zinc enriched broth in which the zinc is
incorporated into the yeast structure, similar to an amino acid chelate but it is not only bound
to one type of amino acid as in zinc methionine.
The high level of maize gluten in the diets did not reduce the level of available zinc
sufficiently to cause growth impairments and all the diets resulted in good FCRs, comparable
with commercial diets containing higher zinc levels. Similarly, Li and Robinson (1996)
reported no significant difference in weight gain, FCR or survival of fish fed ZnSO4 , zinc
methionine or a zinc proteinate at supplementation levels ranging from 15-90 mg/kg,
however the base diet seems to already contain 50 mg/kg of endogenous zinc. The authors of
that study also reported bone zinc concentrations increasing linearly with increasing dietary
zinc which they state indicates a storage role of bone but also indicates the fishes zinc status
is not reduced to detrimental levels by the base diet.
The organic form of zinc was 39.0% more digestible than the zinc from the inorganic salt.
Similarly Apines et al. (2001) reported 52-57% absorption of zinc from an amino acid chelate
compared to 38% absorption from the sulphate form when fed to rainbow trout and a second
study by Apines-Amar et al. (2004) reported an elevated % absorption and retention of zinc
when rainbow trout were fed an amino acid chelated zinc compared with an inorganic
sulphate, again in rainbow trout. The same study reported equal % absorption when half the

Daniel Leeming
103
amount of zinc was supplemented as the amino acid chelate compared with the sulphate salt.
It has also been reported in channel catfish (Ictalurus punctatus) that a zinc proteinate was
37.5% more digestible than the sulphate form in a purified diet and 74.2% more digestible in
a soyabean based diet (Paripatananont and Lovell, 1997). It has been postulated that the
chelation of the zinc to an amino acid increases the rate of absorption by preventing the metal
ion from forming insoluble complexes and aiding its transport into the mucosal cells
(Ashmead, 1992).
As dietary zinc increased the serum levels increased equally for both forms of zinc. This
indicates that the zinc from either form is being transported around the animal at equal levels
despite the differences in digestibility suggesting that the extra zinc absorbed from the
organic source is being used somewhere within the fish and is not in general circulation with
in the vascular system. Wekell et al. (1986) also reported blood zinc levels in rainbow trout
increased with dietary levels. Likewise a study using an egg white-based diet to achieve a
zinc-deficient base diet with 4 mg/kg zinc reported an increase in blood, liver and gill zinc
levels as the dietary zinc level was increased over a 55 day period with ZnSO4 (Wekell et al.,
1983). That trial was a toxicity trial and the next lowest level of supplementation took the
dietary zinc level to 90 mg/kg and continued up to 1700 mg/kg, hence the rapid increase in
blood zinc concentration as the zinc was transported around the fish and also in the gill, a
probable excretory mechanism for the removal of excess zinc. Lorentzen and Maage (1999)
also reported an increase in plasma zinc and whole body zinc concentrations as the dietary
zinc increased from 67 mg.kg to 141 mg/kg with ZnSO4 supplementation. The plasma levels
increased from 12.8 mg/L to 26.3 mg/L, comparable with the results of this present study.
Conversely, Maage et al. (2001) compared zinc gluconate to ZnSO4 in Atlantic salmon
(Salmo salar) and concluded that there was no difference between the two forms based on
serum, vertebrate and whole body zinc levels after 172 days on the diets. The authors report

Daniel Leeming
104
serum levels ranging from 17.8 mg/L in the lowest supplemented diet to 26.5 mg/L in the
highest supplemented diet, which is again comparable to the levels reported in this present
study, however their low and high supplementation resulted in dietary levels of 139 mg/kg
and 239 mg/kg respectively, both well above the stated requirements of Atlantic salmon.
Satoh et al. (1987) reported cataract formation in trout fed a white fishmeal based diet. This
required a supplementation of more than 40 mg/kg zinc, additional to the endogenous zinc in
the white fishmeal, in order to prevent cataract formation. In this current study more zinc
from the organic supplementation is being deposited in the eyes when the fish are being fed
less than 40 mg/kg zinc in total. A higher level of zinc in the eye may provide more adequate
antioxidant protection and help prevent cataract formation (Ketola, 1979) especially at time
of rapid growth (Bjerkaas et al. 1995). There is some debate about the importance of the role
of zinc in cataract formation when using practical diets (Breck et al., 2003) but this current
trial suggests that the use of an organic source of zinc makes the diet better able to maintain
ocular zinc levels when the requirement for zinc is only just met by the diet. Once the dietary
zinc concentration reaches 55 mg/kg the difference between the two forms of zinc
disappeared. This coincides with the increase in serum levels which may indicate either a
threshold level of zinc in the serum, above which the zinc is able to be deposited in the eye or
that the zinc pool in the eye is of lower importance than another tissue who’s requirement
may only be reached when the zinc in free transport reaches a certain level.
Zinc deposition in the caudal fin increases as dietary zinc and subsequently serum zinc levels
increase but only after the dietary level reaches 40 mg/kg. Again Wekell et al. (1986)
reported similar results indicating that caudal fin zinc levels in rainbow trout increased with
dietary levels. The results from this section of the study, as with the eyes suggests the
presence of a threshold level of zinc in the serum which once reached enables zinc to be
deposited in other tissues. The high level of zinc in the caudal fin of the fish on the highest

Daniel Leeming
105
level of organic supplementation compared with the same level of inorganic supplementation
may also indicate that a tissue of ‘higher importance’ has reached its requirement level earlier
or more easily when the organic form is used allowing for greater deposition of zinc into
other tissues earlier.
The hepatic level of zinc remained the same throughout all the different levels and forms of
supplementation indicating that the hepatic level of zinc was maintained at a level of around
100 µg/g. Whether this remains constant no matter how much zinc is available or whether
this will increase at higher levels of dietary zinc supplementation is unclear from this
experiment but when combined with the zinc concentration in the serum, eyes and caudal fin
suggests that the liver is the first organ in the hierarchy where zinc deposition is concerned.
This could be expected due to the metabolic importance of the liver and the liver is also likely
to be the first place nutrients are transported to after absorption from the gut, and it may be
this organ that regulated the amount of zinc free to be transported to other tissues. A similar
result was seen previously by Wekell et al. (1986) who reported that liver zinc levels in
rainbow trout remained constant as dietary levels increased. Lorentzen and Maage (1999)
also reported the liver of Atlantic salmon maintained its zinc concentration as the dietary zinc
levels increased from 67 mg.kg to 141 mg/kg, however the concentrations recorded in their
study were much lower, approximately 30-35 µg/g and it should be noted that their
experiment was carried out on 0.2 g fingerlings with a final weight of only 30 g. Slightly
contradictory, an amino acid zinc chelate did increase the hepatic zinc level, as well as the
bone zinc level, of rainbow trout more than a sulphate form was able to achieve (Apines et al.,
2003).
The negligible amount of zinc in the bile indicates that no zinc is being excreted back into to
gut lumen for removal from the organism. This has two important implications: 1) the animal
is trying to maintain its overall zinc pool and has no excess zinc to excrete; and 2) the results

Daniel Leeming
106
of the digestibility measurement have not been confounded by excess zinc being excreted
back into the digesta which would them be analysed as undigested zinc, artificially lowering
the ADC for a particular diet.
Of the two zinc dependant proteins analysed only metallothionein was affected by the dietary
zinc. Superoxide dismutase was not affected by either the level or supplementation form, nor
was it affected by the imposition of the stress regime. Superoxide dismutase is found in
several isoforms and may be either Cu/Zn dependent or Mn dependent. The fact that the
dietary concentration of zinc had no effect indicates that the manganese dependant form is
either the dominant form in rainbow trout or that the cells can compensate for the lack of zinc
by increasing the manganese form. Apines-Amar at al. (2004) reported an increase in Cu/Zn
SOD activity when rainbow trout were fed an amino acid chelated zinc however these authors
also used a chelated form of copper which may have been responsible for the up regulation of
the enzyme. Also a study by Hidalgo et al. (2002) into the oxidative stress generated by a
dietary zinc deficiency identified a possible compensatory effect whereby the induction of the
Mn-SOD isoform of the enzyme is stimulated when the Cu/Zn forms activity is reduced.
Similar results have been observed in rats fed a Cu deficient diet (Lai et al., 1994; Taylor et
al., 1988). The analysis performed on the superoxide dismutase activity in the present study
was unable to distinguish between the two forms; therefore the ratio of one to the other could
not be established. As the simulated husbandry stressor did not increase the activity of the
enzyme this would suggest that prolonged netting and reduced water level did not induce
superoxide free radical formation. However the level of activity in the unstressed fish was
already high.
The molecular mechanisms for the metal induction of the metallothionein gene expression is
dependent on the interaction between a cis-acting element in the gene (Metal Responsive
Element, MRE) and a trans-acting factor (MRE binding transcription factor 1, MTF-1) which

Daniel Leeming
107
reversibly binds to the MRE and mediates the induction of the metallothionein gene (Westin
and Schaffner, 1988; Andrews, 2001). The binding of the MTF-1 is dependent on the
availability of free zinc ions in the cytoplasm (Radtke et al., 1993; Dalton et al., 1997; Laity
and Andrews, 2007). The zinc required for this activation has been shown to be able to enter
the nucleus of the cells from a dietary source in rats (Cousins and Lee-Ambrose, 1992). Zinc
has been shown to cause a dose-dependent increase in metallothionein induction in the
immortalised liver cell line of zebra fish (Cheuk et al., 2008)
In this present study stress increased the metallothionein activity in the fish on all the
supplemented diets as well as in the fish on the unsupplemented diet. This was supported by
an increase in the mRNA levels for both isoforms of metallothionein in the livers of the fish
that had been stressed. Simulated husbandry stress has also been shown to increase
metallothionein gene expression in both the brain and kidney of rainbow trout using
microarray technology (Krasnov et al., 2005). The increase in mRNA production was not
affected by the dietary zinc level or form, indicating the increase in expression was solely due
to the stress. There is good evidence that glucocorticoids can induce metallothionein
expression in humans and mice independently of metal regulatory transcription factors
(Dalton et al., 2000; Kelly et al., 2000) and various studies have shown that different types of
stress induce the production of metallothionein in the livers of goldfish (Carpene et al, 1992),
the crucian carp (Muto et al., 1999) and the buffalo sculpin (Sabourin et al., 1985). Cortisol
has also been shown to increase metallothionein production in the primary cultures rainbow
trout hepatocytes but not in the immortalised rainbow trout hepatocyte cell line RTH-149
(Olsson et al., 1990). It has since been hypothesised and subsequently shown that the cortisol
produced by the stressors may indirectly cause the metallothionein production by interacting
with the zinc signalling pathway and increasing the amount of free zinc in the cytoplasm and
set off the MTF-1/MRE cascade (Bury et al., 2008). In the current study the stress also
Daniel Leeming
108
increased the gene expression uniformly across the groups of fish on different dietary
treatments. With the increase in expression being uniform, it would be expected to observe a
uniform increase in the metallothionein production, however, in the fish on the organic
supplemented diets the level of increase was not uniform and was positively correlated with
the level of supplementation. As the fish on the inorganically supplemented diets showed a
much lower and uniform increase across the supplementation levels this would suggest a
deficiency in these fish of an integral component of the protein. There must have been a
sufficient supply of all the components required to synthesis the required level of
metallothionein in the unstressed fish fed the unsupplemented diet as there was extra capacity
to increase the production of the protein to some extent in this group when they were
subjected to the stressor. The same level of capacity was also possessed by the fish on all the
diets supplemented with the inorganic zinc which implies that the inorganic supplementation
did not increase the supply of the limiting component and the small increase observed was
due to the zinc endogenous to the casein, fishmeal and maize gluten meal in the diet. The
ability of the fish fed the organically supplemented diet to increase their metallothionein
production in a dose-dependent manner points strongly towards the zinc being the limiting
component and it was only bioavailable when presented in the organic form. It is significant
to note that coupled with this observation is the fact that the hepatic zinc levels were equal in
all the fish across the range of supplementation form and level, indicating that the zinc is
present when the fish are supplemented with the inorganic form but it evidently cannot be
utilized. This could be evidence that the element is bound differently or to a different
chaperone depending on the form of zinc supplied by the diet. In other studies investigating
different zinc-dependant enzymes, Apines et al. (2001) showed a higher activity of the zinc
dependant enzyme alkaline phosphatase in rainbow trout fed an amino acid chelate compared
with those fed the sulphate form indicating a greater utilization of the element from the
Daniel Leeming
109
chelate for the production of this enzyme. A similar result has been shown in abalone-fed
organic zinc (Tan and Mai, 2001).
Normal metabolism produces reactive oxygen species (ROS), a fraction of which are used for
cell signalling. The remaining ROS are detoxified by antioxidants which convert them into
non-toxic metabolites, preventing them causing oxidative damage to cellular macromolecules
such as DNA. It is essential that this balance is maintained to avoid the onset of oxidative
stress (Haliwell and Gutteridge, 1999). Physiological stress causes the reallocation of energy
to increase activities such as locomotion and respiration, an evolutionary trait relating to the
fight or flight response, which in captivity i.e.in aquaculture is of little or no benefit. Under
stress conditions fish switch from an anabolic to a catatonic state, which is a primary stress
response and involves the release of numerous hormones including catecholamine and
glucocorticoids such as cortisol (Wendelaar-Bogna, 1997). A secondary effect of the stress
response, especially when the stress is chronic as opposed to acute is the loss of DNA
stability due to the action of the excess ROS species, created by the increase in metabolism,
causing strand breaks and the oxidation of nitrogenous bases. The stress regime that the fish
in this experiment were subjected to, was chronic and induced physiological responses
similar to those associated with exercise that is exhaustive in nature. The damage to DNA
caused by such exertions has been studied in humans (Hartman et al., 1994) and rats
(Leeuwenburgh and Heinecke, 2001; Packer et al., 2008; Sachdev and Davies, 2008). The
increase in % tail DNA in the stressed fish is evidence that chronic stress does cause damage
to te genetic material in the erythrocytes, indicating that the ROS are increased to a level
exceeding the capacity of the fish to safely detoxify the free radicals produced. The lack of a
significant decrease in the level of damage, as more dietary zinc is added, suggests that this
antioxidant capacity is not totally zinc dependant. The observed increase in % tail DNA does
provide validation of this technique as a way of assessing the stress status of fish in a non-

Daniel Leeming
110
terminal way, which may be preferable to measuring cortisol levels which is notorious for
being confounded by the acute stress caused when sampling.
The increased digestibility of the organic zinc compared with the inorganic zinc reported in
this present study should be considered an accurate indication of the uptake of the zinc from
the gut due to the low levels of zinc used and the absence of zinc in the bile. This should not
be confused with its availability, nor should the increase in tissue concentrations be used to
assume a greater bioavailability. The true indicator of the availability of a nutrient must come
from the activity and levels of its dependant proteins within the animal’s cells, not just its
digestibility or the tissue concentration (Swinkels et al., 1994); a fact often overlooked in the
literature. The metallothionein results of this study clearly provide evidence that the zinc
from the organic form of supplementation is not only more digestible but also more
bioavailable and utilizable by rainbow trout than the inorganic sulphate salt, especially at
times of stress characteristic of culture conditions.

Daniel Leeming
111
CHAPTER 6. The use of mixed isotope diets to assess the distribution of
dietary zinc from inorganic and organic sources
6.1 Introduction
It is common practice to assess mineral absorption, digestibility and bioavailability by the use
of an element balance technique, namely the difference between the dietary intake and the
faecal content or tissue levels of the mineral. However, minerals with low digestibility or
when studying animals with high endogenous mineral stores this balance technique is unable
to distinguish the dietary supplied minerals from the endogenous, which may have been
either excreted back into the digesta or mobilised from storage pools for use in tissues with a
metabolic demand (Sandstrom et al., 1993). The studies reported in previous chapters have
tried to eliminate this confounding effect by using diets bordering on deficient and checking
that the bile concentration of the mineral is negligible. However, the use of a stable but
enriched isotope to label a fraction of the supplemented mineral should allow the endogenous
minerals and dietary minerals to be distinguished.
The natural abundance of each isotope of zinc is:
64 Zn - 48.89%
66 Zn - 27.81%
67 Zn - 4.11%
68 Zn - 18.56%
70 Zn - 0.62%
The use of a stable enriched isotope in a component of the diet, to alter the natural
abundances above, can allow that dietary component to be tracked though the body. Having a
known, unnatural, ratio of isotopes in the diet (a fixed percentage coming from an inorganic
sulphate source enriched with 70
Zn and the remaining supplementation from the organic

Daniel Leeming
112
source with the natural ratio) the biological ‘preference’ of the tissues can potentially be
observed by measuring the changes in the tissue specific isotope ratios.
The use of stable enriched isotopes to assess mineral kinetics in fish is, to the best of the
authors knowledge at the time of writing, completely novel. However their use is a relatively
common technique in other species such as rats (usually for medical use), dogs and pigs
(Popov and Besel, 1977; House and Wastney, 1997; Dunn and Cousins, 1989; Lowe et al.,
1995; Serfass et al., 1996).
The study in rats by House and Wastney (1997) identified the existence of slow and fast
pools in muscle and bone where the turnover of zinc in these tissues was dramatically
different. Turnover rates were reported to be 4hrs, 1.3 days and 50 days in the kidney, spleen
and testes respectively; rates consistent with the kinetics in humans. It may be possible to
make similar observations in rainbow trout and investigate whether the form of zinc affects
the turnover rates. In this current study, the findings in Chapter 3 have indicated that the
tissues throughout the fish can be divided into groups containing zinc pools termed either
functional or exchangeable (table 6.1). The functional pools are sites where zinc is of
Table 6.1 The division of body tissues into those containing either functional or exchangeable zinc pools
Functional Exchangeable
Liver Bone
Fins Blood (serum)
Eyes Muscle
Gills Intestine
Skin Bile
Daniel Leeming
113
metabolic importance and the zinc levels remain constant for as long as possible. The
exchangeable pools are pools in which the zinc levels fluctuate rapidly, either storing excess
zinc or supplying surplus zinc when required in other areas of the body.
Serfass et al. (1996) showed that weaned piglets fed a deficient diet compensated by
increasing the absorption of zinc from the diet and the authors were able to track the zinc
throughout the body tissues. It was reported that despite the increasing fractional absorption
the hepatic zinc levels remained lower in the deficient piglets compared with the control
animals. In the Serfass study, no investigations into the functional ability of the liver was
made, failing to answer questions about the true status of the organ i.e. was it deficient or was
it simply not storing excess zinc. It may be possible to identify similar trends in rainbow
trout, however from the previous chapters findings it has been demonstrated that the
functionality of the liver is different in trout fed the organic zinc compared with the trout fed
the inorganic zinc at these levels. Tracking the uptake rates of each form may provide insight
as to why those effects are seen.
Dunn (1991) investigated the role of metallothionein and its involvement in the redistribution
of zinc among the body tissues of rats. The authors reported that the induction of
metallothionein caused an increase in the redistribution of zinc among body tissues. The
previous chapter identified a superior ability of the organic form of dietary supplementation
to stimulate metallothionein production. If the increased ability of metallothionein
production can be correlated with the redistribution of zinc around the rainbow trout tissues
that are of zinc metabolic importance it may be possible to identify the role of this increased
metallothionein production which could not be attributed to its role in oxidative protection.
This study aimed to 1) quantify the rate of uptake of dietary zinc from the digesta into the
bloodstream; 2) measure the effect of feeding low zinc diets on the metabolically important

Daniel Leeming
114
tissue levels each week of a 12 week period; 3) assess the ‘preference’ of the metabolically
important tissues for the inorganic or organic forms of zinc; and 4) draw some initial
conclusions about the suitability of using mixed isotope diets and the experimental design for
future work in this area. For this study only the eyes, liver and fins where analysed as they are
tissues known to be affected by this feeding regime. The time and cost of analysis became
prohibitive for speculative analysis on all tissues to be conducted at the time.
Daniel Leeming
115
6.2 Methods
6.2.1 Experimental Design
Two separate trials were conducted, both using the same base diet as used in chapter 5 and
supplementing the diet to the same extent to achieve a set of low, medium and high zinc diets
containing 30, 40 and 50mg Zn/kg diet respectively (table 6.2). The supplemented zinc was
1:1 mix of an organic source, with a natural isotope ratio giving an average atomic mass of
65.37, and an inorganic zinc salt, ZnSO4, with a 95.43% enriched 70
Zn isotope (with an
average atomic mass of approximately 69.4). All diets were analyzed for protein, lipid and
total zinc content as well as isotopic ratios of 66
Zn, 67
Zn or 68
Zn: 70
Zn (table 6.3).
Trial 1: Post Prandial uptake
A total of 160, pre-acclimated (Chapter 2, section 2.1.2) rainbow trout (O.mykiss),
weighing 103.4 ± 2.5 g were divided into 6 x 126 liter tanks (30 fish per tank) and fed the
unsupplemented control diet (table 6.2) for 26 days at 1% body weight per day and food
was withheld on days 27 and 28. On day 29, three fish were removed and sampled for
blood and each tank was allocated either the high zinc level diet supplemented with only
the organic form of zinc or the high zinc level diet supplemented with only the inorganic
form of zinc (n=3). The remaining fish were fed the allocated diet to 4% body weight,
resulting in a feed ration of 258 µg zinc. Blood samples were taken at 2, 4, 6, 8, 12, 16,
20, 24 and 30hrs post feed from three fish in each tank. These were allowed to clot and
their serum separated. Serum was analyzed for total zinc using ICP OES and the uptake
and subsequent decrease in serum zinc levels tracked.

Daniel Leeming
116
Table 6.2 Diet Formulation; % inclusion of base diet ingredients and mg/kg of zinc supplementation.
Trial 2: Tissue assimilation
A total of 600, pre-acclimated (Chapter 2, section 2.1.2) rainbow trout (O.mykiss),
weighing 10.1 ± 0.5 g were divided into 12 x 126 liter tanks (50 fish per tank). Each of the
four diets was randomly allocated to three tanks and the fish were fed a constant 3% body
weight per day, adjusted daily using a predicted FCR of 1.0 for 10 weeks. Five fish from
each tank were sampled each week for the four weeks and then every two weeks until
week 10. The liver, eye and caudal fin were sampled, then analyzed at each time point for
both the total zinc content and the ratio of 66
Zn:70
Zn, as the tissue turned over its zinc pool.
Control
Diet
Low Zn
Diet
Medium Zn
Diet
High Zn
Diet
Casein 14.0 14.0 14.0 14.0
LT 94 Fishmeal 15.0 15.0 15.0 15.0
MGM 37.0 37.0 37.0 37.0
Corn Starch 13.9 13.9 13.9 13.9
Fish Oil 19.0 19.0 19.0 19.0
Vitamin/Mineral
Premix
1.0 1.0 1.0 1.0
L-Lysine 0.1 0.1 0.1 0.1
70
ZnSO4 (mg/kg) 0 2.5 7.5 12.5
BioPlex Zn (mg/kg) 0 2.5 7.5 12.5

Daniel Leeming
117
Table 6.3 Proximate composition of diets and ratios of zinc isotopes (mean ± S.D. n=3)
6.2.2 General analytical procedures
The diets were analyzed for protein (Chapter 2, section 2.2.4), lipid (Chapter 2, section 2.2.3)
and trace element profile (Chapter 2, section 2.3). The livers, eyes and caudal fins were
sampled, freeze dried and then measured for their total zinc content (ICP OES) and their
isotopic ratios (ICP-MS). All isotope counts were blank subtracted and standardized per mg
of tissue assayed before ratios were calculated. Bracket standards (a TraceCERT® Zinc
Standard with a known isotopic ratio used either side of an unknown in order to standardize
the samples for drift) were used every other sample and the mass bias was calculated. Serum
was also processed in the same way as the tissues, with an acid reflux digestion (Chapter 2,
section 2.3.1) prior to dilution and analysis for total zinc which was was conducted using ICP
OES.
Control
Diet
Low Zn
Diet
Medium Zn
Diet
High Zn
Diet
Protein (%) 46.7 ± 0.2 47.1 ± 0.2 46.5 ± 0.4 46.7 ± 0.2
Lipid (%) 21.9 ± 0.1 21.9 ± 0.5 21.8 ± 0.4 22.1 ± 0.3
Total Zn
(mg/kg)
24.8 ± 0.5 30.2 ± 0.2 41.0 ± 0.6 50.5 ± 0.8
66Zn:
70Zn 45.0 ± 0.37 2.9 ± 0.28 1.24 ± 0.32 0.86 ± 0.14
67Zn:
70Zn 6.61 ±0.25 0.44 ±0.13 0.18 ±0.03 0.13 ±0.02
68Zn:
70Zn 30.24 ±0.27 2.06 ±0.12 0.87 ±0.05 0.62 ±0.02
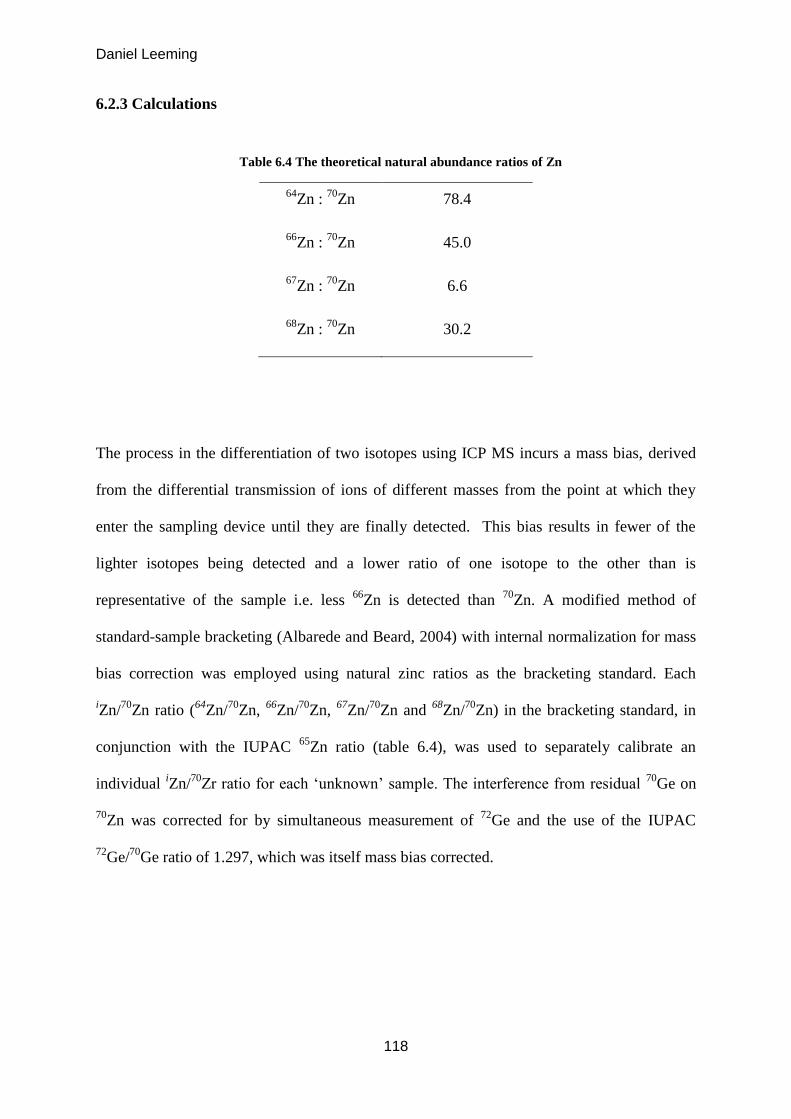
Daniel Leeming
118
6.2.3 Calculations
Table 6.4 The theoretical natural abundance ratios of Zn
64Zn :
70Zn 78.4
66Zn :
70Zn 45.0
67Zn :
70Zn 6.6
68Zn :
70Zn 30.2
The process in the differentiation of two isotopes using ICP MS incurs a mass bias, derived
from the differential transmission of ions of different masses from the point at which they
enter the sampling device until they are finally detected. This bias results in fewer of the
lighter isotopes being detected and a lower ratio of one isotope to the other than is
representative of the sample i.e. less 66
Zn is detected than 70
Zn. A modified method of
standard-sample bracketing (Albarede and Beard, 2004) with internal normalization for mass
bias correction was employed using natural zinc ratios as the bracketing standard. Each
iZn/
70Zn ratio (
64Zn/
70Zn,
66Zn/
70Zn,
67Zn/
70Zn and
68Zn/
70Zn) in the bracketing standard, in
conjunction with the IUPAC 65
Zn ratio (table 6.4), was used to separately calibrate an
individual iZn/
70Zr ratio for each ‘unknown’ sample. The interference from residual
70Ge on
70Zn was corrected for by simultaneous measurement of
72Ge and the use of the IUPAC
72Ge/
70Ge ratio of 1.297, which was itself mass bias corrected.

Daniel Leeming
119
6.2.4 Statistics
Statistical analysis was performed using analysis of variance and a Fishers test of least
significant difference was applied to rank significantly different means. Computer software,
SPSS v18 (IBM) was used to perform the statistical calculations; p<0.05 was considered
statistically significant for all analyses.

Daniel Leeming
120
6.3 Results
Figure 6.1 Post prandial serum zinc levels. (mean ± S.D. n=3). Solid line = unsupplemented; Long broken
line + diamonds = organic zinc; Short broken line + triangles = inorganic zinc. Different letters in the
same column indicates significance between diets, top row = unsupplemented; middle row = inorganic
zinc; bottom row = organic zinc.
6.3.1 Post prandial serum levels
The results of the post prandial serum zinc levels are displayed in figure 6.1. The initial
serum zinc level in all the fish, before the presentation of feed was 4.03 ± 0.17 µg/ml. The
serum zinc levels in the fish on the control diet peaked at 12.16 ± 0.90 µg/ml 4 hrs post feed
and then decreased to a level of 7.99 ± 0.77 µg/ml after 6 hrs, which remained relatively
constant for the next 24 hrs. The serum zinc level in the fish on the organic zinc
supplemented diet, which followed a similar trend, decreased significantly less, maintaining a
zinc concentration of approximately 11 µg/ml. The fish fed the inorganic zinc supplemented
diet took an extra 2 hrs for the serum zinc level to reach its peak at a concentration of 11.06 ±
0
2
4
6
8
10
12
14
0 2 4 6 8 10 12 14 16 18 20 22 24 26 28 30
Ser
um
Zin
c (µ
g/m
l)
No. hrs post meal
a a a a a a a a a a a a a b b a ab a b a a a a b b b b b b b

Daniel Leeming
121
Figure 6.2 Ocular total zinc concentration (mean ± S.D. n = 5). Dark grey bar = initial fish; Dotted bar =
unsupplemented; Diagonal stripe bar = low zinc; Light grey bar = medium zinc; Horizontal stripe bar =
high zinc. Bars with different suffix with in the same dietary group denotes significant difference (p<0.05)
0.90 µg/ml at 6 hrs, which then decreased at a slower rate than the fish on the control diet
dropping to a higher, but not significantly so, level than was observed in the fish on the
unsupplemented control diet. After the initial spike in serum zinc levels all groups of fish
maintained a serum zinc concentration above the initial concentration for the next 18-24 hrs.
The fish on the organic supplemented diet maintained this serum zinc level significantly
higher than the other groups.
6.3.2 Tissue total zinc levels
The initial zinc level in the eyes of the fish fed a commercial EWOS diet was 300 µg/g.
After one week on the experimental diets this decreased significantly to approximately 200-
210 µg/g in all diets. The ocular zinc levels in the fish on different dietary zinc levels at each
0
50
100
150
200
250
300
350
0 1 2 3 4 6 8 10
Zn
Con
c. (
µg/g
)
Week
a
b b
b
b b b
b b b
b
b
b
c
b b
c b
c
c
c c
b
c
b
c b
c d
d
d
d c
c
c

Daniel Leeming
122
Figure 6.3 Caudal fin total zinc concentration (mean ± S.D. n = 5). Dark grey bar = initial fish; Dotted
bar = unsupplemented; Diagonal stripe bar = low zinc; Light grey bar = medium zinc; Horizontal stripe
bar = high zinc. Bars with different suffix with in the same dietary group denotes significant difference
(p<0.05)
time point were significantly different at weeks 4 and 10 when the fish on the high
supplemented diet had a significantly higher level of zinc in the eye compared with the fish
on the control and low zinc diets in week 4 and the control diet at week 10 (fig 6.2). In the
fish on the unsupplemented control diet there was a non-significant trend showing an increase
over weeks 2 and 3, after which the ocular zinc levels decreased continually over the next
seven weeks, becoming significantly different at week 6. The eyes of the fish on the low
supplemented diet followed a similar trend and at no point were significantly different to the
eyes of the fish on the unsupplemented control, however it was week 10 before this decrease
was significantly different to the levels seen in week 3. The fish on the medium level
supplemented diet followed the same trend, decreasing in week 1, increasing again until week
0
20
40
60
80
100
120
140
160
0 1 2 3 4 6 8 10
Zn
Con
c. (
µg/g
)
Week
b
b
c
b
c
b
c b
c b
b
c
b
c b
c b
b
b b
b
a
c
d
d
b
b c
c d d
b
b
c c

Daniel Leeming
123
Figure 6.4 Hepatic total zinc concentration (mean ± S.D. n = 5). Dark grey bar = initial fish; Dotted bar
= unsupplemented; Diagonal stripe bar = low zinc; Light grey bar = medium zinc; Horizontal stripe bar =
high zinc. Bars with different suffix with in the same dietary group denotes significant difference (p<0.05)
3 and then continually decreasing until week 10, but in this group the difference from week 3
became significant at week 8. The zinc in the eyes of the fish on the high supplemented diet
continued to rise after the initial drop in week 1 to a significantly higher level in week 4
which then dropped, again significantly, in week 6 and then continued to drop until week 10.
The initial zinc concentration in the caudal fins of fish fed the commercial EWOS diet was
140 µg/g. As with the ocular zinc levels this decreased significantly in all the groups of fish
after one week on the respective experimental diets. The groups of fish on both the
unsupplemented control diet and the low supplemented diet both showed a continual decrease
in caudal fin levels of zinc over the 10 week period. The caudal fins of the fish on the
unsupplemented diet dropped from 110 µg/g in week 1 to 70 µg/g in week 10 and the fish on
0
10
20
30
40
50
60
70
80
90
100
0 1 2 3 4 6 8 10
Zn
Con
c. (
µg/g
)
Week
a
a
a
b
a a
b
a
a a
b
a a a a
a
b
a a a a
b
a
a
a
b a
b b
a
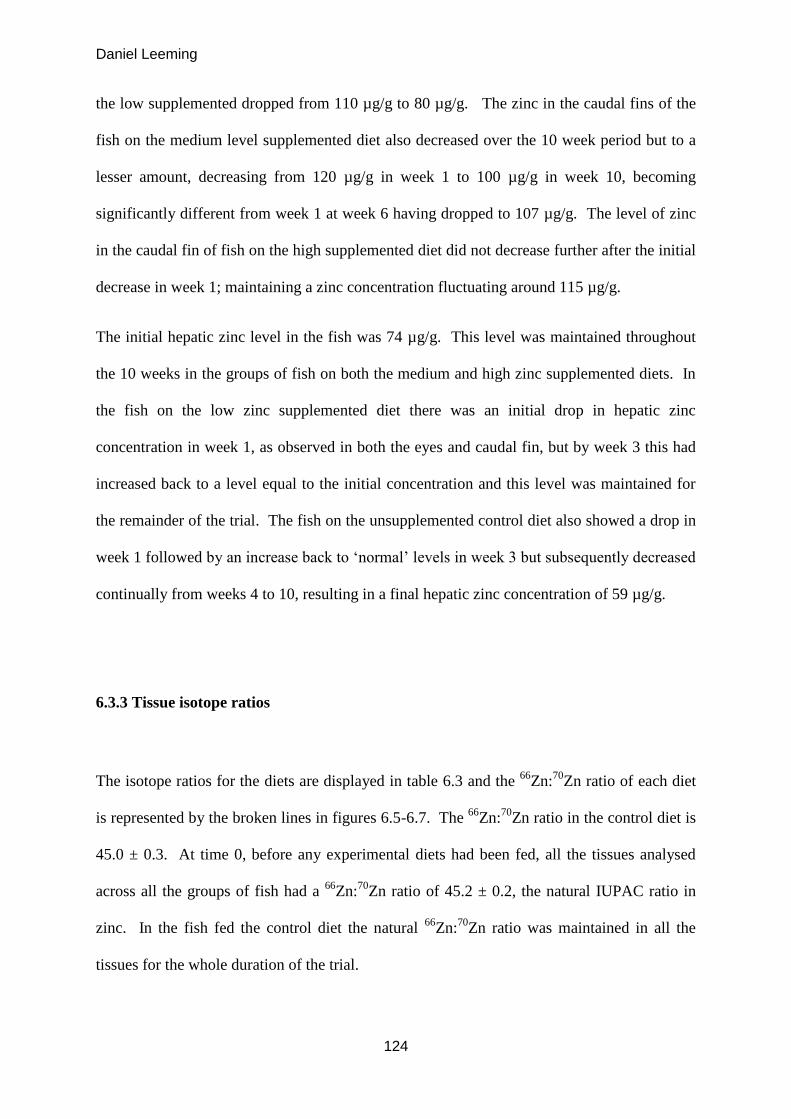
Daniel Leeming
124
the low supplemented dropped from 110 µg/g to 80 µg/g. The zinc in the caudal fins of the
fish on the medium level supplemented diet also decreased over the 10 week period but to a
lesser amount, decreasing from 120 µg/g in week 1 to 100 µg/g in week 10, becoming
significantly different from week 1 at week 6 having dropped to 107 µg/g. The level of zinc
in the caudal fin of fish on the high supplemented diet did not decrease further after the initial
decrease in week 1; maintaining a zinc concentration fluctuating around 115 µg/g.
The initial hepatic zinc level in the fish was 74 µg/g. This level was maintained throughout
the 10 weeks in the groups of fish on both the medium and high zinc supplemented diets. In
the fish on the low zinc supplemented diet there was an initial drop in hepatic zinc
concentration in week 1, as observed in both the eyes and caudal fin, but by week 3 this had
increased back to a level equal to the initial concentration and this level was maintained for
the remainder of the trial. The fish on the unsupplemented control diet also showed a drop in
week 1 followed by an increase back to ‘normal’ levels in week 3 but subsequently decreased
continually from weeks 4 to 10, resulting in a final hepatic zinc concentration of 59 µg/g.
6.3.3 Tissue isotope ratios
The isotope ratios for the diets are displayed in table 6.3 and the 66
Zn:70
Zn ratio of each diet
is represented by the broken lines in figures 6.5-6.7. The 66
Zn:70
Zn ratio in the control diet is
45.0 ± 0.3. At time 0, before any experimental diets had been fed, all the tissues analysed
across all the groups of fish had a 66
Zn:70
Zn ratio of 45.2 ± 0.2, the natural IUPAC ratio in
zinc. In the fish fed the control diet the natural 66
Zn:70
Zn ratio was maintained in all the
tissues for the whole duration of the trial.

Daniel Leeming
125
Figure 6.5 Ocular 66Zn:70 Zn ratio (mean ± S.D. n=5). Square marker = unsupplemented diet; Circular
marker = low zinc; Triangle marker = medium zinc; Cross marker = high zinc. * denotes no significant
difference from the dietary ratio. CDR = control diet ratio, LDR = low diet ratio, MDR = medium diet
ratio, HDR = high diet ratio.
The isotope ratio in the eyes (fig 6.5) of fish on the lowest level of supplementation changed
significantly each week until week 6, after which the ratio remained stable at 10.03 ± 1.04.
In the fish on the medium diet the 66
Zn:70
Zn ratio stabilised at 4.96 ± 1.61after four weeks
and in the eyes of fish on the high level of supplementation the ratios stabilised at 3.27 ± 0.99,
also after four weeks. The rate of decrease of the 66
Zn:70
Zn ratio was positively correlated
with the level of supplementation, and the 66
Zn:70
Zn ratio of the eye never dropped low as the
ratio in the corresponding diet
The 66
Zn:70
Zn ratios in the caudal fins (fig 6.6) followed similar trends as the ratios in the eye,
however the rate at which the ratios decreased was increased in the caudal fin. In the first
week, the 66
Zn:70
Zn ratios in the fins decreased from 45.51± 0.22 to 22.21 ± 1.24, 12.40 ±
0.0
5.0
10.0
15.0
20.0
25.0
30.0
35.0
40.0
45.0
50.0
0 1 2 3 4 5 6 7 8 9 10
66Z
n:7
0Z
n R
ati
o
Week
CDR
HDR MDR
LDR
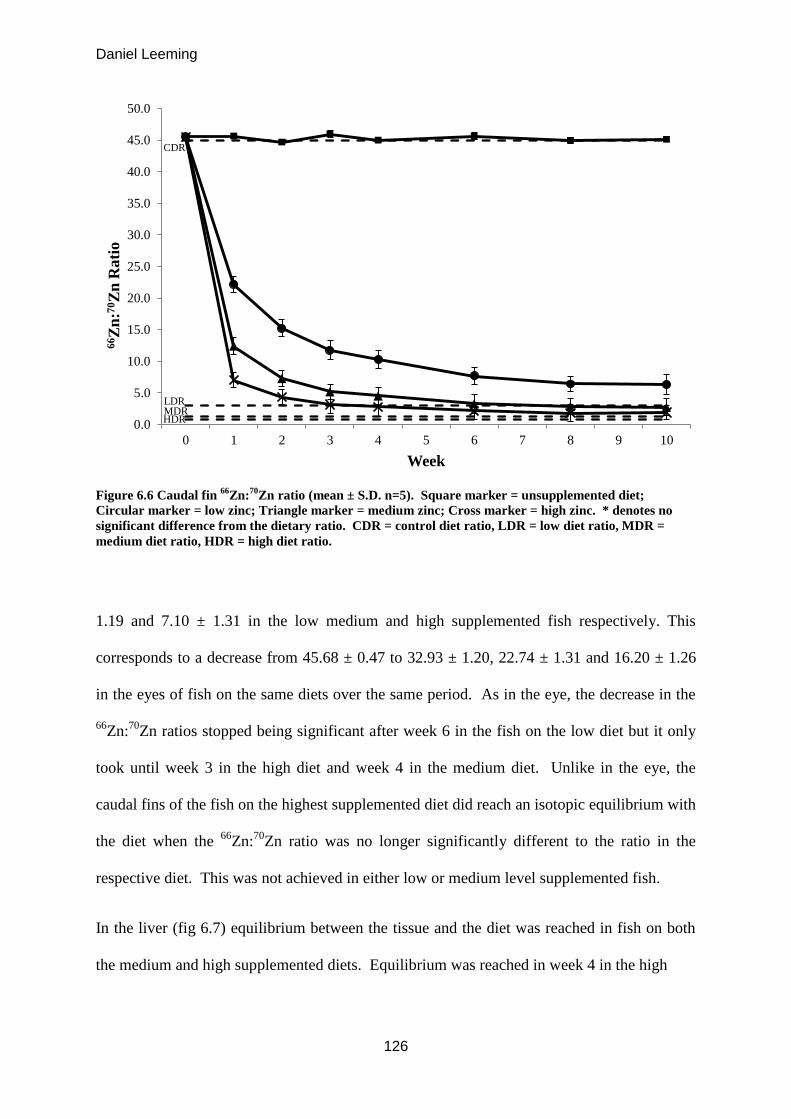
Daniel Leeming
126
Figure 6.6 Caudal fin 66
Zn:70
Zn ratio (mean ± S.D. n=5). Square marker = unsupplemented diet;
Circular marker = low zinc; Triangle marker = medium zinc; Cross marker = high zinc. * denotes no
significant difference from the dietary ratio. CDR = control diet ratio, LDR = low diet ratio, MDR =
medium diet ratio, HDR = high diet ratio.
1.19 and 7.10 ± 1.31 in the low medium and high supplemented fish respectively. This
corresponds to a decrease from 45.68 ± 0.47 to 32.93 ± 1.20, 22.74 ± 1.31 and 16.20 ± 1.26
in the eyes of fish on the same diets over the same period. As in the eye, the decrease in the
66Zn:
70Zn ratios stopped being significant after week 6 in the fish on the low diet but it only
took until week 3 in the high diet and week 4 in the medium diet. Unlike in the eye, the
caudal fins of the fish on the highest supplemented diet did reach an isotopic equilibrium with
the diet when the 66
Zn:70
Zn ratio was no longer significantly different to the ratio in the
respective diet. This was not achieved in either low or medium level supplemented fish.
In the liver (fig 6.7) equilibrium between the tissue and the diet was reached in fish on both
the medium and high supplemented diets. Equilibrium was reached in week 4 in the high
0.0
5.0
10.0
15.0
20.0
25.0
30.0
35.0
40.0
45.0
50.0
0 1 2 3 4 5 6 7 8 9 10
66Z
n:7
0Z
n R
ati
o
Week
CDR
LDR MDR HDR
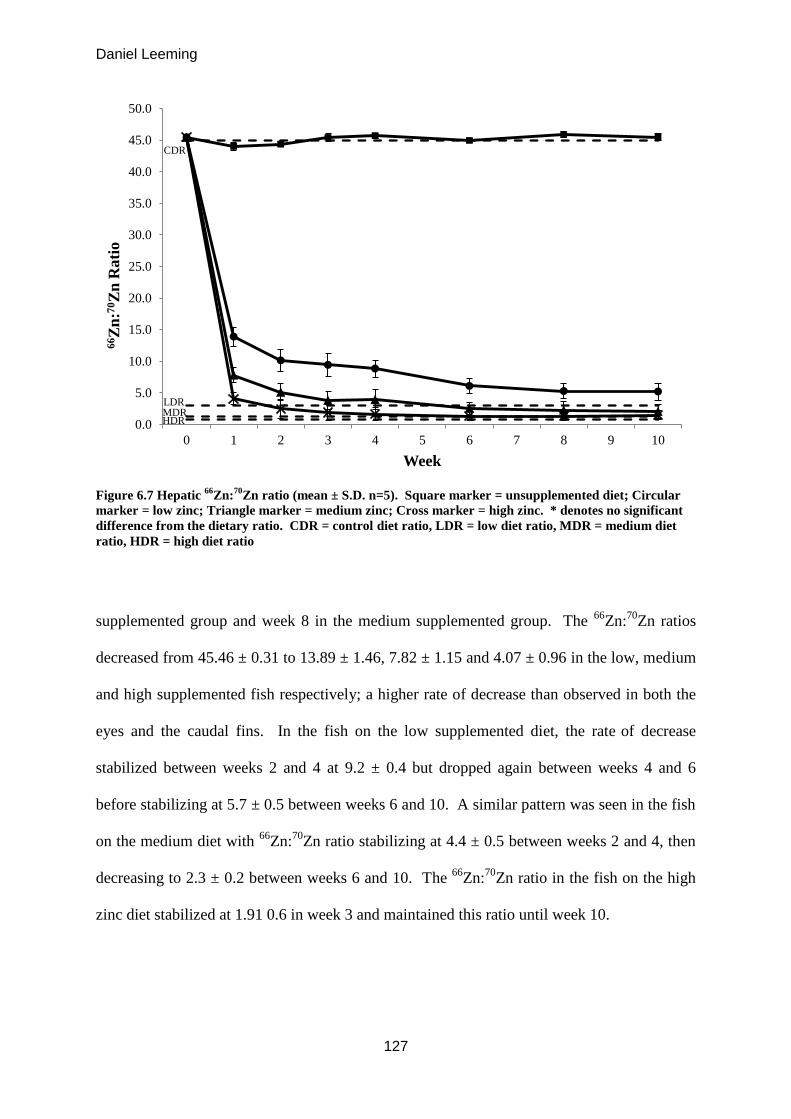
Daniel Leeming
127
Figure 6.7 Hepatic 66
Zn:70
Zn ratio (mean ± S.D. n=5). Square marker = unsupplemented diet; Circular
marker = low zinc; Triangle marker = medium zinc; Cross marker = high zinc. * denotes no significant
difference from the dietary ratio. CDR = control diet ratio, LDR = low diet ratio, MDR = medium diet
ratio, HDR = high diet ratio
supplemented group and week 8 in the medium supplemented group. The 66
Zn:70
Zn ratios
decreased from 45.46 ± 0.31 to 13.89 ± 1.46, 7.82 ± 1.15 and 4.07 ± 0.96 in the low, medium
and high supplemented fish respectively; a higher rate of decrease than observed in both the
eyes and the caudal fins. In the fish on the low supplemented diet, the rate of decrease
stabilized between weeks 2 and 4 at 9.2 ± 0.4 but dropped again between weeks 4 and 6
before stabilizing at 5.7 ± 0.5 between weeks 6 and 10. A similar pattern was seen in the fish
on the medium diet with 66
Zn:70
Zn ratio stabilizing at 4.4 ± 0.5 between weeks 2 and 4, then
decreasing to 2.3 ± 0.2 between weeks 6 and 10. The 66
Zn:70
Zn ratio in the fish on the high
zinc diet stabilized at 1.91 0.6 in week 3 and maintained this ratio until week 10.
0.0
5.0
10.0
15.0
20.0
25.0
30.0
35.0
40.0
45.0
50.0
0 1 2 3 4 5 6 7 8 9 10
66Z
n:7
0Z
n R
ati
o
Week
CDR
LDR MDR HDR
Daniel Leeming
128
6.4 Discussion
The post prandial serum zinc levels, indicate that the zinc in both the unsupplemented control
diet (the zinc endogenous to the proteins) and the zinc from the organically supplemented diet
are taken up into the serum at the same level. However the zinc in the additionally
supplemented diet either stays in the serum longer or is being continually supplied from the
gut at the same rate it is being deposited around the fishes tissues. The delayed peak in the
fish on the inorganically supplemented diet suggests a slower uptake from the diet and the
subsequent decrease after six hours results in less zinc being taken up in total, as indicated by
the lower total area under the graph. In a similar investigation by Savolainen and Gatlin
(2010) the post prandial serum levels of hybrid striped bass were measured. The results
indicated that a dietary concentration of 20 mg/kg resulted in a serum zinc peak of
approximately 11 µg/ml after four hours, a level and time period highly comparable to the
results obtained from this current study. Differences in experimental design allow little
further comparison between this and their study. This is because in the current study the fish
were effectively administered a spike of zinc on day 29 and in all treatments that spike
remained evident in the serum for at least 30 hours following meal ingestion, whereas in the
Savolainen and Gatlin study samples were only taken for eight hours and a stable base line
serum concentration was not established. A longer time course in both studies would have
allowed for further extrapolations to be made with regards to how long a single ration of food
continues to contribute to the circulating zinc pool. The same study by Savolainen and Gatlin,
like this study, used two forms of zinc, one organic (methionine hydroxyl analog) and one
inorganic (ZnSO4) and the authors concluded there was no difference between the two; a
contradictory result to the outcome of this study. The literature is full of contradictory results
regarding different forms of zinc supplementation, not only in fish but also in pigs, poultry

Daniel Leeming
129
and humans. Many have reported positive effects (Paripatananont and Lovell, 1996; Leeson
and Summers, 2001; Dibner, 2005; Chien et al., 2006) and many negative (Gomes and
Kaushik, 1993; Li and Robinson, 1996; Maage et al, 2001; Satoh et al, 1987). Further
investigation into these studies possibly explains why. For example, Li and Robinson (1996)
reported negative effects of organic supplementation in channel catfish while Paripatananont
and Lovell (1996) reported positive effects in the same species, as one group used zinc-
methionine and the other an unspecified zinc-proteinate, of which there are many, all with
different physical properties which will affect their assimilation. Comparisons between
species, especially fish species, are also difficult to make as the conditions and duration spent
in the different sections of the GI tract differ greatly from species to species, both of which
will determine to what extent the compound will dissociate during digestion.
The second half of this study has proved very difficult to relate back to the literature as both
the use of isotopes in fish studies and the use of isotope ratios to determine uptake and origin
of nutrients not only in fish but in other species too, seems to be relatively novel. Isotope
half-lives, combinations of oral and intravenous administrations, and balance studies have all
been used to measure turnover rates and differentiate between minerals of endogenous and
dietary origins in the faeces (Lowe et al., 1995; Turnlund et al., 1986; Griffin, 2002;
Fairweather-Tait et al., 1993; Dunn and Cousins, 1989; House and Wastney, 1997; Serfass et
al., 1996) but not to test, in direct competition the uptake of two dietary supplements
simultaneously. With that taken into account, the following discussion tries to relate the
results from this study with the observations made in previous chapters, to add further
understanding to these conclusions and to pose further questions for future work.
There is a difference between the zinc levels measured in the livers and eyes of the fish in this
trial compared to the levels measured in the same tissues in the previous chapter. This trial
reports a range of 71 µg/g to 56 µg/g in the livers at the end of the trial in the fish fed the high

Daniel Leeming
130
and low zinc diets respectively and from 171 µg/g to 127 µg/g in the eyes. This compares
with a range of 100 µg/g to 90 µg/g in the livers of the fish at the end of the previous study
and 140 µg/g to 100 µg/g in the eyes. The length of the trials were the same (10 weeks) and
the concentrations of zinc in the diets were also the same, the only appreciable difference was
the size of the fish. This trial started with 10 g fish while the previous trial started with 65 g
fish, this 55 g difference is the equivalent of 3-4 weeks growth during which the tissue
concentrations seem to have changed. Unfortunately the tissues were not sampled at the start
of the previous study so a starting comparison cannot be made but this difference highlights
the importance of knowing what the concentrations in the tissues should be for fish of a
certain size if using tissue levels as a biomarker for either deficiency or good health.
Interestingly, the caudal fin zinc concentrations did not seem to differ greatly between trials.
The aim of this study was to provide insight into the dynamics of the zinc in the tissues
during the 10 week growth period. It was assumed from the previous trial that there would be
a linear decrease in the concentration of zinc in the tissues as the trial progressed but the
evidence from the current study implies that when the dietary zinc level is either low or
deficient there is a compensatory effort made to increase the zinc levels in the metabolically
important tissues i.e. the eyes and liver. Garretts and Molokhia (1977) showed that in
humans with severe zinc deficiency, muscle catabolism occurs, releasing zinc for systemic
redistribution, explaining why severely zinc deficient infants maintain normal plasma zinc
concentrations when tested, in the context of this current study a similar affect may be being
observed. This compensatory response was clearly evident in the eye, where all groups
showed an increase between weeks 1 and 3, and in the liver, where the same trend was
observed in the fish on the unsupplemented control diet. The unsupplemented control diet
was the only diet with insufficient zinc to maintain the hepatic zinc content. The low
supplemented diet was able to maintain the hepatic zinc content, after the initial

Daniel Leeming
131
compensatory effort was made, for the duration of the trial. The compensatory effect seen
implies that zinc is being sequestered from other tissues and when there is at least an extra 5
mg/kg being supplied by the diet this compensatory effort is sufficient to maintain the hepatic
zinc pool; how long this compensatory effort could continue for could not be established in
this trial but it would be interesting in future studies. Another investigation for future studies
would be to monitor the ratios in the tissues after the fish were returned to a non-enriched diet.
This would enable the clearance rates of the isotopes to be measured, giving an idea of
turnover rates and possibly identifying a difference in longevity with in the tissues for the
different zinc sources
The compensatory hypothesis is supported by the isotope ratios measured. Using the
66Zn:
70Zn ratio provides insight into the source of the zinc found in each tissue. If there is a
higher value it means there is less 70
Zn in the tissue and vice versa, if the tissue ratio is equal
to that of the diet it means that the zinc in the tissue is solely from the diet and if it is lower
than the diets it means that more 70
Zn is available than the organically supplied zinc. The fact
that in the tissues of the fish on the low supplemented diet the 66
Zn:70
Zn ratio never dropped
as low as the isotopic ratio of the diet implies that either the 70
Zn is unavailable or there is
some non-dietary zinc, with the natural isotope ratio being incorporated into those tissues.
Taking into account the compensatory effect observed, the latter is most probable and this
extra zinc can only come from the reserves in the fish. In the livers of the fish on the diets
with high supplementation no compensatory effort is seen and the isotope ratios do reach
equilibrium with diet. Also, the plateau seen in the 66
Zn:70
Zn ratio in the fish on the low
supplemented diet, between weeks 2 and 4, coincides with the apparent compensatory effort
observed from the total zinc results at the same time point.

Daniel Leeming
132
The 66
Zn:70
Zn ratio in the eye, where a decrease in total zinc content is observed (indicating
that there is insufficient dietary zinc to maintain its zinc pool) does not reach equilibrium
with the diet, even in fish on the highest supplemented diet. This could be an indication that
the endogenous zinc from the fishes stores is being incorporated into this tissue or it could be
evidence that less of the inorganic 70
Zn is been taken up. Further investigations into the total
zinc and isotope ratios of other tissues i.e. the muscle and bone would allow further insight
into this question but was not within the scope of this preliminary study. However, when this
result is combined with the evidence of an initial compensatory effect, seen in the fish on the
highest supplemented diet, which subsequently failed after week 4 it is unlikely that the
endogenous stores were contributing to the eye zinc pool in the latter half of the trial, where
the isotope ratio still does not equilibrate with the diet but this still needs to be proven.
Unlike the eyes and liver, the caudal fin showed no evidence of a compensatory effect by
utilising the fish’s stores. After the initial decrease in total zinc content in week 1, the fish on
the highest supplementation maintained the same concentration throughout. The zinc in the
caudal fin of the fish on the medium level of supplementation decreased slowly after week 6
and the fish on the low and unsupplemented diets decreased more rapidly with further
significant decreases observed in weeks 3 and 6. When combined with the isotope ratio data
there is good evidence that in the medium and high supplemented fish the dietary zinc was
the only source of zinc being used and by week 6 all the zinc in the fin had originated in the
experimental diets. This also suggests that the two forms of zinc were equally available. In
the fish on the low supplemented diets equilibrium between the diet ratio and the tissue ratio
was never achieved, and when combined with the evidence that the total zinc in the caudal fin
was deceasing and there is no evidence of a compensatory effect suggests that the elevated
ratio must be due to an increased utilisation of the organic form of zinc over the inorganic
70Zn when there is an insufficient supply.
Daniel Leeming
133
In conclusion, it appears that this isotope ratio method of comparing two mineral sources
against each other does have the potential to be an effective tool to distinguish the ‘preference’
of a tissue for zinc from different sources (the term ‘preference’ is used in this instance to
describe the ability of the tissue to utilise the zinc when ligated to different chaperones in the
serum). This trial also provides evidence that a complete study of the isotopic ratios in every
tissue in the fish would be extremely worthwhile, however the expense, both in analysis costs
and labour, may be prohibitive. A compromise may be to investigate how the ratio changes in
the whole body but this would not be a detailed enough approach to use to understand how
the reallocation of zinc between the body tissues occurs, it would realistically allow a
comparison of uptake from the feed, a result obtainable from digestibility studies. The
analysis of the muscle, blood and possibly bone isotope ratios may be a better compromise as
these would include a transport pool in the case of blood, a storage pool in the case if bone
and the muscle would give a good indicator of what the whole body zinc status would be as
this tissue primarily dictates the outcome of whole body analyses. The hypothesis that there is
a compensatory effort made by catabolism in other tissues would be to some extent
confirmed by the reciprocal drop in total zinc as well as an isotopic ratio much closer to the
natural ratio than the dietary ratio being maintained in these tissues; a hypothesis to be
investigated in future studies.

Daniel Leeming
134
CHAPTER 7. General discussion
7.1 Overview of programme of investigation
The focus of this thesis was to assess different methods of improving the availability of zinc
from modern salmonid diets. Due to the increasing dependency on plant-based proteins the
required level of zinc supplementation has increased to sometimes five times the actual
requirement of the intended species. This has been necessary because of the combined effect
of the poor digestibility of the supplements used and the increased level of the anti-nutritional
factors (ANF’s) associated with the higher inclusion of plant based proteins. The
consequences of these elevated mineral supplementation levels are an increased cost and a
higher environmental impact. The present study examined the actual zinc availability from
several commercially used raw materials, using traditional techniques that were optimised to
produce more accurate data than is currently available. It also examined the role of new
processing technologies can play in increasing the availability of the raw materials
endogenous minerals with the aim of reducing the need to further supplement the diets so
heavily. Finally the study directly compared two supplements, one from an organic
compound and the other a commonly used inorganic sulphate salt. The findings showed that
mineral availability varied greatly from different protein sources, that further processing of
the raw materials could significantly increase the availability of a products endogenous
minerals and that if assessed correctly there is strong evidence that the use of organic
supplements not only increases the digestibility but also the bioavailability of supplemented
minerals. It has become evident that it is not sufficient to treat all organic compounds equally,
nor is it appropriate to expect one form of supplement to perform in the same manner in
different species of fish. Further work must be conducted on an individual compound, on a

Daniel Leeming
135
specific species basis, taking into account the physico-chemical properties of the supplement
and the internal conditions (temperature, pH and transit duration) of the animal’s
gastrointestinal tract.
7.1.1 Availability of protein endogenous zinc
The essential first step in assessing the level of supplementation required in a diet is to obtain
a clear understanding of the availability of the nutrients already present in the
unsupplemented diet. The first trial (chapter 3) aimed to do this by using the hypothesis that
only when a fish is bordering on deficient of a certain nutrient will it utilise all the nutrients
available to it in the diets. If in a deficient fish the nutrient is not utilised then that nutrient, or
part of it, is not available for assimilation. This method has the advantage of reducing the
excretion of already ingested nutrients back into the digesta which would confound the
results of a digestibility study. To the best of the authors knowledge no other digestibility
study has used this approach in the refinement of a nutrient assessment. The design of the
diets used in the digestibility studies also reduces the effect that differing feed intakes may
have on the digestibility of a specific nutrient. It would seem logical that if the transport
pathway from the gut lumen into the body can be saturated, and the fish ingest more of a
nutrient by actually eating a greater quantity of food, then this may lead to a reduced apparent
digestibility being calculated. As the dietary zinc levels were maintained bordering on
deficiency this should have reduced the potential for this to have an effect in this study,
however, feed intake in salmonids is believed to be regulated by the energy levels in the feed.
In rainbow trout this is most closely correlated to the amount of digestible energy (Boujard
and Medale, 1994). The majority of digestible energy comes from the oil fraction of the diet
Daniel Leeming
136
as carbohydrates are considered indigestible in fish; in this study all the diets were formulated
to be isolipidic so the feed intake should have been similar for all groups.
The results indicated that the zinc from the soyabean meal was the most available (49.4%)
which was a surprising result given the expected levels of phytate usually present in soyabean
meal however the soyabean meal used was a particularly high grade meal and the result is
comparable with other results in the literature (Storbaken et al., 1998; Yamamoto et al., 1997)
in studies using refined, pre-treated soyabean products. The digestibilities of the animal
based protein used in this current study, 15.1% for the LT94 fish meal and 15.8% for the
poultry meatmeal, are also comparable with the values reported in other studies (Sigiura et al,.
1998). It seems contradictory to report higher zinc digestibilities from plant based proteins
than from a high quality fishmeal but all the results prove comparable with published data
from other research groups and it highlights the importance of collecting data for individual
ingredients and not assuming all soya bean meals will be the same and all fishmeals will be
the same. It was on the basis of these results and by measuring the effect these diets had on
the tissue levels that the diets for the subsequent supplementation trials, which were intended
to produce zinc deficient fish with decreased metabolically important zinc pools which could
then be observed increasing as more zinc was re-supplemented, were formulated. From the
tested protein sources, maize gluten meal (31.9% digestible zinc) was chosen as the base of
the diet because its low zinc content, its relatively low zinc digestibility and its high protein
digestibility (85.3%) allowed a high protein/low zinc diet, proven to cause the significant
decrease in tissue zinc levels required for the supplementation trial, to be produce.
Daniel Leeming
137
7.1.2 Pre-treatment of raw materials
A possible alternative to increasing the total levels of zinc in the diet with supplements in
order to meet the requirements of the fish is to improve the digestibility of the zinc from the
dietary components. This can be achieved by milling (Bohn et al., 2008), heat treatment of
the ingredients (Pontoppidan et al., 2007) and by using genetically modified crops (Raboy,
1997). The most successful method used to date is the use of exogenous enzymes to break
down anti-nutritional factors and predigest some of the raw materials. Both single enzymes
and ‘cocktails’ of multiple enzymes are used and the method of treatment may play an
important role in the efficacy of each. The pre-treatment of the raw materials during the
processing method seems to prove the most effective approach (Vielma et al., 2002;
Storebaken et al., 2000). When these results are compared with studies incorporating the
enzymes into the pellet along with the processed raw materials it is evident that either top-
spraying or using the enzyme as an additive while extruding the pellet (Forster et al., 1999;
Oliva-Teles et al., 1998) is very inefficient. However, a recent study by Dalsgaard et al (2012)
showed moderate improvements in nutrient digestibility in Rainbow trout from sunflower
meal and rapeseed meal top-coated with β-glucanase, xylanase and proteinase while the β-
glucanase and proteinase significantly improved the digestibility of the nutrients in soyabean
meal. It is proposed that the ineffectiveness of the whole-feed additive technique is due to a
combination of insufficient contact between the enzyme and the ingredient and suboptimal
conditions for the enzymatic activity but the results from Dalsgaard et al (2012) highlight that
each enzyme : protein : species combination needs to be examined separately. The results of
this current study confirm that by pre-treating a soyabean meal with phytase, both the
phosphorus and the zinc availability is increased in Rainbow trout.
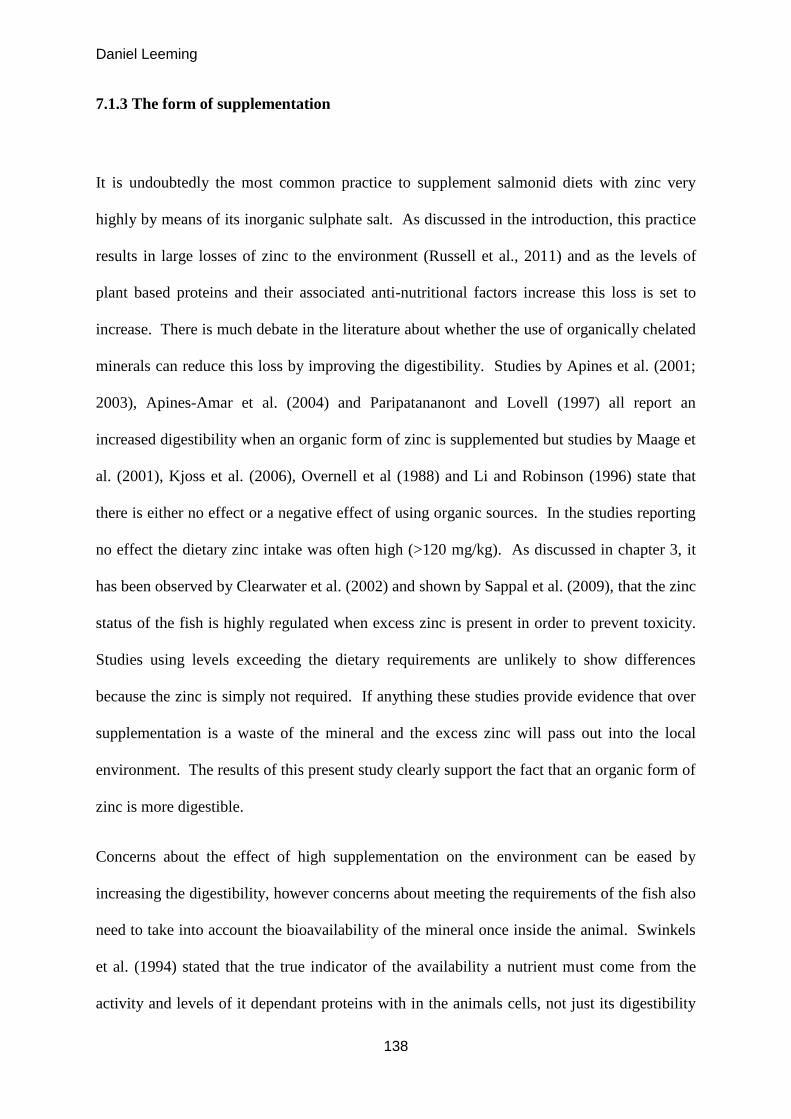
Daniel Leeming
138
7.1.3 The form of supplementation
It is undoubtedly the most common practice to supplement salmonid diets with zinc very
highly by means of its inorganic sulphate salt. As discussed in the introduction, this practice
results in large losses of zinc to the environment (Russell et al., 2011) and as the levels of
plant based proteins and their associated anti-nutritional factors increase this loss is set to
increase. There is much debate in the literature about whether the use of organically chelated
minerals can reduce this loss by improving the digestibility. Studies by Apines et al. (2001;
2003), Apines-Amar et al. (2004) and Paripatananont and Lovell (1997) all report an
increased digestibility when an organic form of zinc is supplemented but studies by Maage et
al. (2001), Kjoss et al. (2006), Overnell et al (1988) and Li and Robinson (1996) state that
there is either no effect or a negative effect of using organic sources. In the studies reporting
no effect the dietary zinc intake was often high (>120 mg/kg). As discussed in chapter 3, it
has been observed by Clearwater et al. (2002) and shown by Sappal et al. (2009), that the zinc
status of the fish is highly regulated when excess zinc is present in order to prevent toxicity.
Studies using levels exceeding the dietary requirements are unlikely to show differences
because the zinc is simply not required. If anything these studies provide evidence that over
supplementation is a waste of the mineral and the excess zinc will pass out into the local
environment. The results of this present study clearly support the fact that an organic form of
zinc is more digestible.
Concerns about the effect of high supplementation on the environment can be eased by
increasing the digestibility, however concerns about meeting the requirements of the fish also
need to take into account the bioavailability of the mineral once inside the animal. Swinkels
et al. (1994) stated that the true indicator of the availability a nutrient must come from the
activity and levels of it dependant proteins with in the animals cells, not just its digestibility

Daniel Leeming
139
or the tissue concentration. The results presented in chapter 5 clearly illustrate this point; an
examination of the hepatic zinc levels alone would suggest that both the organic and the
inorganic zinc were equally bioavailable to the liver, however, the analysis of the zinc
dependant protein, metallothionein, clearly shows that under stress conditions only the
organic supplemented fish were able to synthesis the protein. Furthermore, the analysis of
the mRNA levels indicate the fish on the inorganically supplemented diet up regulated the
production of the mRNA to synthesise the protein to the same extent as the fish on the
organic supplement, so the liver was trying to produce more metallothionein but was unable
to do so.
The use of a stable isotope in identifying different ‘preferences’ for one form over the other
in different tissues (Chapter 6) was partly successful. The approach taken for fish studies was
completely novel and illustrated a tissue dependant difference with regards to how the fish
attempts physiologically to compensate for zinc deficiency by seemingly reallocating its
endogenous stores. Without the use of the isotope ratios it would not have been possible to
identify that this increase must have been from the endogenous zinc stores and not the diet as
the isotope ratios levelled out at the same time point as the total zinc in the tissue increased.
The study also illustrated the rate of turnover was fastest in the liver, then the caudal fin and
then the eye, and also showed that when the diet was more deficient there was a seemingly
increased ability for the tissues to take up the organic form. Further studies need to be
conducted in order to confirm these observations. The use of a second isotope to label the
organically supplemented zinc would have been preferable as it would then allow for some
firm conclusions to be made about the source of all the zinc in the tissues. However the
expense of enriching the organic supplement with one isotope was prohibitive.

Daniel Leeming
140
7.2 Future work
7.2.1 Application for other species and life stages
The focus of this thesis has been how to improve the zinc nutrition of farmed salmonids,
particularly the Rainbow trout (Oncorhynchus mykiss) during the juvenile, fast growing stage
of their life cycle. The findings and the implications of this study may also be relevant to the
nutrition of other minerals, especially divalent cations, the different life stages of a
production cycle and also to other intensively farmed species such as sea bream, sea bass, and
tilapia.
The interactions between minerals within the gastrointestinal tract are a well-documented and
complicated process (Goyer, 1997). The competition between divalent cations like, but not
limited to, zinc and copper for uptake mechanisms means care should be taken when
supplementing extra of one not to cause a potential deficiency of another (Hall et al, 1979).
The use of organically chelated minerals may avoid this issue due to the use of different
uptake mechanisms but these interactions should always be considered when increasing the
supplementation in diets. For some minerals the competition for uptake may be a regulatory
mechanism to avoid toxicity and the use of chelates to by-pass this competition may result in
toxicity of either the supplemented or a previously out competed mineral.
The maize gluten diet in the third chapter of this thesis highlighted the need for zinc of a
juvenile Rainbow trout to grow, but it is also known that zinc is required for health gonad
development and gamete production in humans (Croxford et al, 2011; Tian and Diaz, 2013)
and has also been shown to improve the total number of spawns, total seed production, mean
fecundity, hatching rate, sperm motility and sperm viability of Nile tilapia, O. niloticus

Daniel Leeming
141
(Gammanpila et al, 2007). Future studies into the effect of organic zinc supplementation or
the use of pre-treated proteins in diets of brood stock feeds on egg quality may be worthwhile
especially as these diets already command a premium and the increased cost associated with
these products may be better accepted.
The use of both enzyme pre-treated proteins and organically chelated minerals in other
intensively farmed species also need to be further investigated. Warm water species such as
carp, tilapia, sea bass and sea bream may all respond differently to both attempts at increasing
zinc availability. The warmer body temperatures resulting from the warmer water
temperatures may produce more favourable conditions for the enzymatic activity of the
proteinases, glucanases and phytases used in both top coated diets and pre-treated protein
diets, increasing their efficacy. The differences in gut morphology may also play a role
increasing their efficacy, both for pre-treated proteins and organically supplemented minerals.
Although not technically a different species the increasing interest in the use of triploid
salmon may benefit from both these attempts at improving mineral availability. Triploid
salmon are prone to post smoltification bone deformities in both the jaw and vertebrae
(Fjelldal and Hansen, 2010). Several minerals are required for proper bone development
including both phosphorus and zinc. The faster growth associated with the freshwater pre-
smolt stage of triploid development would probably result in a higher mineral requirement
but with phosphorus and zinc in particular, one being a highly regulated effluent of farm sites
and the other having very low digestibility, it is not feasible to simply add more to the diets.
Pre-treatment of the proteins and the use of more efficient supplements may provide a
solution to this problem. The decreased cost of production due to the reduced production
period may provide the increased margin required for more expensive feed.

Daniel Leeming
142
7.2.2 Commercial relevance and applications
The current EU regulations restrict the level of zinc in a salmonid diet to 200 mg/kg; while
this is more than three times the requirement for Atlantic salmon and more than six times the
requirement for rainbow trout, zincs poor digestibility combined with the increased use of
protein sources high in ANFs that further reduce the digestibility of zinc may be resulting in
diets incapable of supplying sufficient zinc. This can be exaggerated during times of stress.
The easy solution is to lobby and try to decrease the restrictions on the allowable levels of
zinc inclusion however the environmental impact this will have and the sustainability of this
approach is questionable and it looks more likely that the restrictions are going to be
tightened; reducing the maximum permitted levels to 150 mg/kg. If this does happen the
importance of being able to accurately monitor the zinc status and to target biomarkers of
deficiency will become very evident. The results of this study imply that whole body zinc
levels could start to decrease without there being clinical signs of a deficiency, but for how
long a period of time this decline could continue before the health and eventually growth
would be affected needs long term studies to be conducted to investigate. Targeting tissues
such as the caudal fin, liver and eye would give a strong indication of the severity of the
deficiency and if found to be low would be a warning that the heath of the fish is being
affected.
If the maximum permitted level of zinc is reduced to 150 mg/kg the results of this study
indicate that the use of either pre-treated raw materials or organic forms of supplementation
could help to mitigate the impact this may have of the fish. The degree to which these options
will increase the cost of feed production and hence the final product cost is unknown to me
but further, more targeted research and an increased demand from the global feed market
should reduce the deficit between the standard products and the more refined options.

Daniel Leeming
143
7.3 Overall conclusions
The results of these trials indicate that it is necessary to re-evaluate the current methods used
in aquaculture, particularly salmonid aquaculture, with regards to mineral supplementation
and increasing the availability of minerals from the raw materials. It has shown that both the
pre-treatment of the raw materials with enzymes and the use of inorganic minerals improves
both the digestibility and the true bioavailability (as described by Swinkels et al., 1994) in a
salmonid species. It has identified the eyes, liver and caudal fin as metabolically important
zinc pools which are maintained for as long as possible during times of deficiency and
provided support to the hypothesis that a compensatory effort is made by the systemic
redistribution of endogenous zinc from other zinc pools (this occurred after 3-4 weeks on a
deficient diet), an effect needing to be taken into account when assessing the zinc status of
fish by tissue zinc levels. Finally this study has also provided preliminary results indicating
the usefulness of stable isotope enrichment ratios in studies investigating supplements in fish.
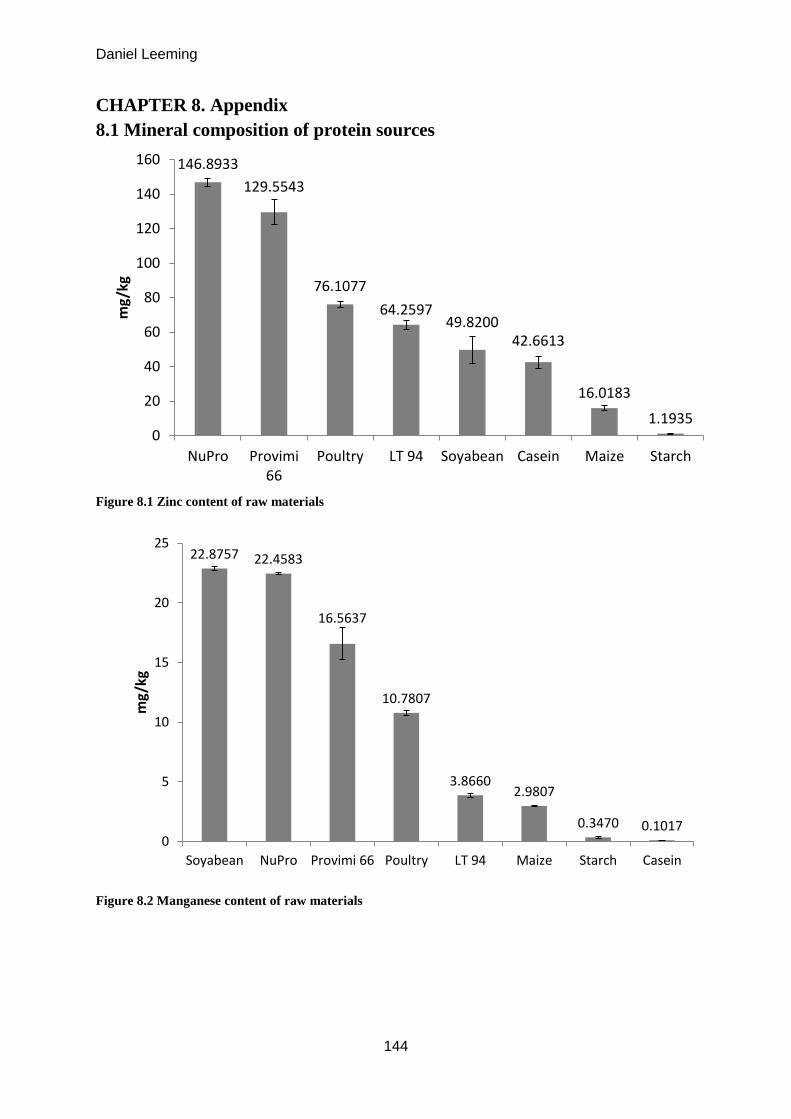
Daniel Leeming
144
CHAPTER 8. Appendix
8.1 Mineral composition of protein sources
Figure 8.1 Zinc content of raw materials
Figure 8.2 Manganese content of raw materials
146.8933
129.5543
76.1077
64.2597 49.8200
42.6613
16.0183
1.1935 0
20
40
60
80
100
120
140
160
NuPro Provimi66
Poultry LT 94 Soyabean Casein Maize Starch
mg/
kg
22.8757 22.4583
16.5637
10.7807
3.8660 2.9807
0.3470 0.1017 0
5
10
15
20
25
Soyabean NuPro Provimi 66 Poultry LT 94 Maize Starch Casein
mg/
kg
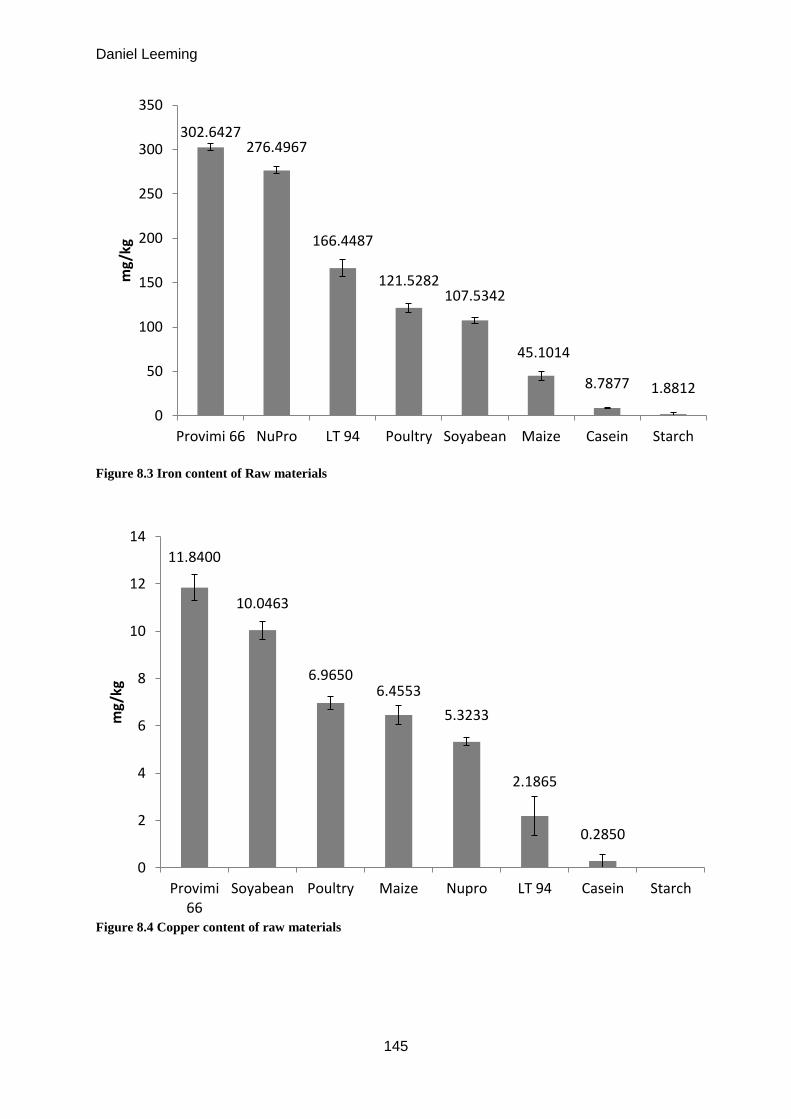
Daniel Leeming
145
Figure 8.3 Iron content of Raw materials
Figure 8.4 Copper content of raw materials
302.6427 276.4967
166.4487
121.5282 107.5342
45.1014
8.7877 1.8812
0
50
100
150
200
250
300
350
Provimi 66 NuPro LT 94 Poultry Soyabean Maize Casein Starch
mg/
kg
11.8400
10.0463
6.9650 6.4553
5.3233
2.1865
0.2850
0
2
4
6
8
10
12
14
Provimi66
Soyabean Poultry Maize Nupro LT 94 Casein Starch
mg/
kg
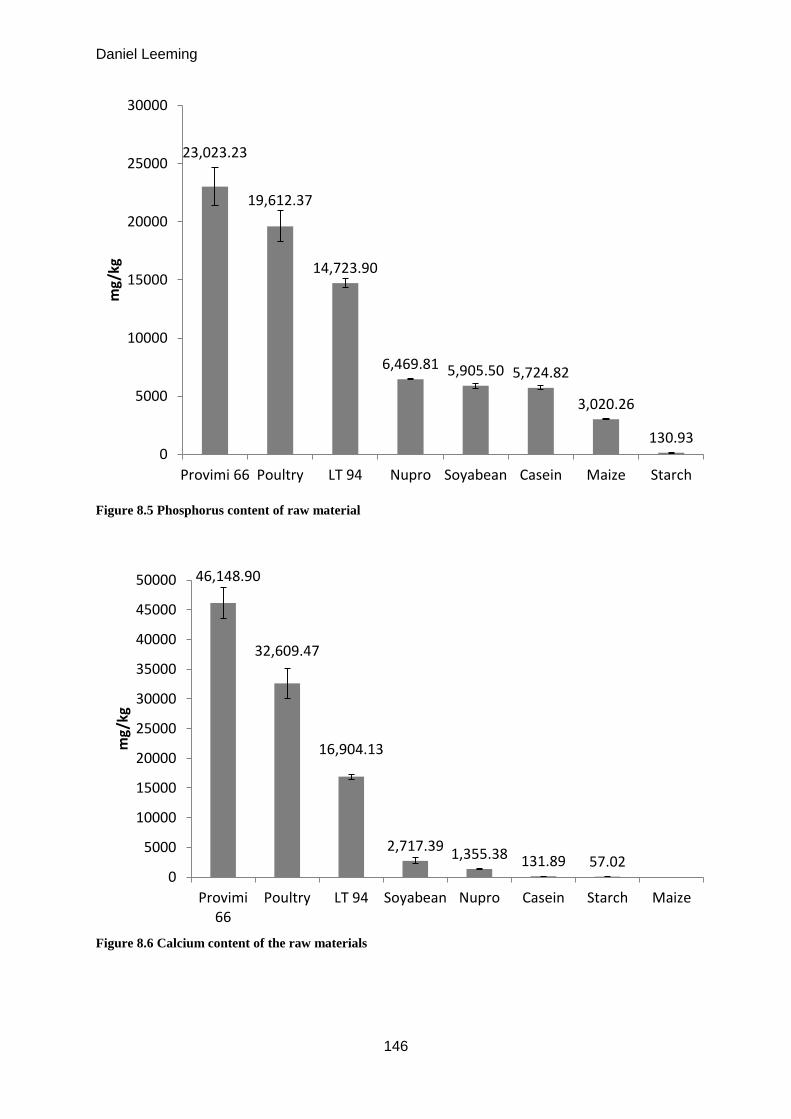
Daniel Leeming
146
Figure 8.5 Phosphorus content of raw material
Figure 8.6 Calcium content of the raw materials
23,023.23
19,612.37
14,723.90
6,469.81 5,905.50 5,724.82
3,020.26
130.93 0
5000
10000
15000
20000
25000
30000
Provimi 66 Poultry LT 94 Nupro Soyabean Casein Maize Starch
mg/
kg
46,148.90
32,609.47
16,904.13
2,717.39 1,355.38 131.89 57.02
0
5000
10000
15000
20000
25000
30000
35000
40000
45000
50000
Provimi66
Poultry LT 94 Soyabean Nupro Casein Starch Maize
mg/
kg

Daniel Leeming
147
Figure 8.7 Potassium content of raw materials
Figure 8.8 Magnesium content of raw materials
18,283.60 18,105.30
8,643.09
6,314.39 6,069.48
442.67 31.33 0
2000
4000
6000
8000
10000
12000
14000
16000
18000
20000
Nupro Soyabean LT 94 Provimi66
Poultry Maize Starch Casein
mg/
kg
2,708.11
2,074.13
1,505.54 1,308.24
1,117.08
154.22 32.22 16.00
0
500
1000
1500
2000
2500
3000
Soyabean LT 94 Nupro Provimi66
Poultry Maize Starch Casein
mg/
kg
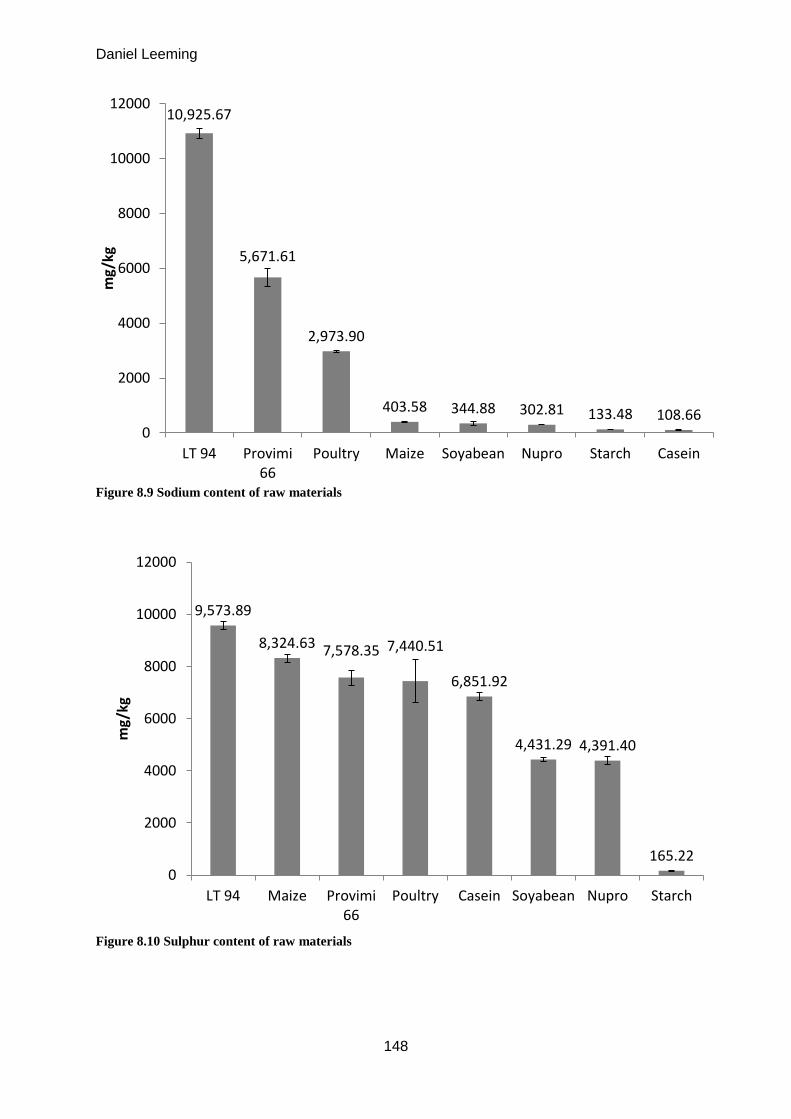
Daniel Leeming
148
Figure 8.9 Sodium content of raw materials
Figure 8.10 Sulphur content of raw materials
10,925.67
5,671.61
2,973.90
403.58 344.88 302.81 133.48 108.66 0
2000
4000
6000
8000
10000
12000
LT 94 Provimi66
Poultry Maize Soyabean Nupro Starch Casein
mg/
kg
9,573.89
8,324.63 7,578.35 7,440.51
6,851.92
4,431.29 4,391.40
165.22 0
2000
4000
6000
8000
10000
12000
LT 94 Maize Provimi66
Poultry Casein Soyabean Nupro Starch
mg/
kg

Daniel Leeming
149
8.2 Proximate composition of protein sources
Figure 8.11 Proximate Analysis (MOPA) of raw materials
0.00
10.00
20.00
30.00
40.00
50.00
60.00
70.00
80.00
90.00
100.00
Casein NuPro SoyabeanMeal
Provimi66
Fishmeal
LT 64Fishmeal
MaizeGluten
PoultryMeatmeal
Starch
Per
cen
tage
Protein (%) Lipid (%)
Ash (%) Moisture (%)
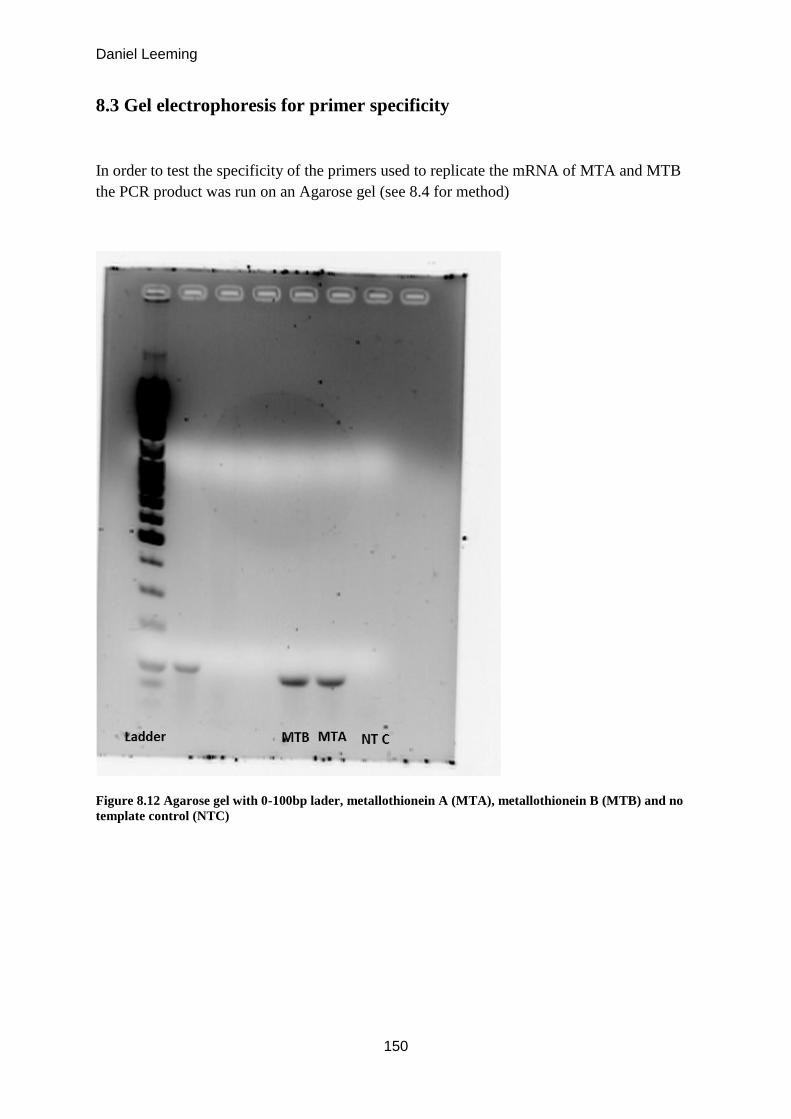
Daniel Leeming
150
8.3 Gel electrophoresis for primer specificity
In order to test the specificity of the primers used to replicate the mRNA of MTA and MTB
the PCR product was run on an Agarose gel (see 8.4 for method)
Figure 8.12 Agarose gel with 0-100bp lader, metallothionein A (MTA), metallothionein B (MTB) and no
template control (NTC)

Daniel Leeming
151
8.4 Standard operating procedures
8.4.1 Gel electrophoresis.
Objective: To establish a protocol for identification of the sizes and relative quantities of the
products of RT-PCR from zebrafish (Danio rerio) mRNA.
Reference: This SOP was developed from the procedure used by Michelle Kiernan (July
2006).
Notable Hazards: Take care when handling hot solutions. Risk of superheating solution,
causing it to boil over without warning. Swirl regularly when heating and hold at arm’s
length. Ethidium bromide is toxic and carcinogenic. Wear gloves when handling and dispose
of all contaminated materials in the ethidium bromide waste bin. Do not allow any
contaminated gloves or tools outside the area marked with biohazard tape. Store ethidium
bromide at 4°C in the dark, marked with a TOXIC label. UV radiation is carcinogenic. Avoid
direct exposure to eyes and skin.
Procedure:
This technique was based on one used to identify bacterial plasmids, and has been modified
for use on zebrafish eggs and larvae at the age of 0-7 days post-fertilisation, though should be
applicable to any RT-PCR product.
Reagent Preparation
Prepare 10xTAE or 10xTBE buffer as per the manufacturer’s instructions, or from the
following recipes.
10xTAE buffer (1l)
1.86g EDTA (disodium salt)
48.4g Tris Base
1.1ml glacial acetic acid
Add 900ml deionised water, adjust pH to 8.5 with NaOH, then make up to 1l with
water.
10xTBE buffer (1l)
109g Tris base
55g Boric acid
4.8g EDTA (disodium salt)
Dissolve in 900ml deionised water, adjust pH to 8.3 with NaOH, then make up to 1l
with water.
Preparing Agarose Gel
1. For a 2% agarose minigel (8x10cm), add to a conical flask:

Daniel Leeming
152
1.0g agarose
5ml 10xTAE buffer (or 10xTBE)
45ml deionised water
2. Heat on full power in a microwave oven for 1 minute, swirling after 45s. Check that
all the agarose is dissolved.
3. Leave to cool for 5min at room temperature.
4. Prepare the gel mould by taping up both ends. press along the edges to ensure a good
seal. Set on a level surface.
5. Once the gel has cooled to about 60°C (enough to hold comfortably), add enough
ethidium bromide to give a final concentration of 0.5μg/ml (say, 2.5μl of a 10mg/ml
stock). Swirl to mix.
6. Slowly pour the molten gel into the mould. When finished, use a disposable pipette tip
to sweep any air bubbles to the sides of the gel.
7. Carefully add the gel comb, making sure that no air bubbles form on the teeth.
8. Leave the gel to set for 30 minutes to 1 hour.
Preparing Electrophoresis Tank
1. Prepare 0.5xTAE (or TBE) buffer by diluting 1 part of the 10x stock with 19 parts
deionised water. This is the running buffer. There should be enough to cover the gel in
the tank.
2. Remove the tape from the ends of the gel mould and place on the white platform in
the tank, ensuring that the comb is above the red lines at the end of the platform.
3. Pour on the running buffer, ensuring the gel is well covered.
4. Carefully remove the gel comb, making sure that the wells aren’t torn, and do not
contain air bubbles.
5. Check before loading any samples that the leads from the power pack are correctly
connected and that the power pack is working properly.
Loading Samples
1. Prepare a clean 0.2ml eppendorf tube for each sample. Add 8μl of PCR product to
each tube, then add 2μl of gel loading buffer to each tube.
2. Transfer the entire contents of the tube to one of the wells in the agarose gel. Take
care not to pierce the gel with the pipette tip and do not depress the plunger
completely, to prevent ejecting air into the gel.
3. When all the samples are loaded, load 10μl of DNA ladder solution another well (this
should already contain loading buffer. If not, use 8μl DNA / 2μl loading buffer again).
4. Record each well’s contents for reference after the gel has run.

Daniel Leeming
153
8.4.2 PCR
Objective: Establish a protocol for routine PCR with samples obtained from fish tissue
Reference: This SOP was developed in part from a kit provided by Sigma: ReadyMixTM
Taq
PCR Reaction Mix with MgCl2 (Catalogue number P4600)
Materials: For kit see attached sheet from Sigma.
Notes:
The PCR reaction on the thermocycler takes ~2 hours. Be sure you have enough time
to run the reaction because the machine cannot be left to run overnight.
Forward and reverse primers obtained from the manufacturer are ordered separately
and based on specific design criteria. They are shipped as lyophilized vials and must
be reconstituted with nuclease-free water. The amount of primer is given on the
literature sent with the primer. Following the direction for reconstituting primers,
make a 100 µmole/L stock solution and also prepare at least four vials of primer
working solution (this is to prevent too much freezing and thawing of primers).
Working solution is prepared by taking 5 µL of stock solution and diluting to 500 µL
with nuclease-free water. This results in a primer working solution concentration of 1
µmole/L.
The concentration of primers in the final reaction volume is important for the PCR
reaction. If PCR does not work well, primer concentrations may need to be optimized
to improve the success.
The procedure below is designed for a final primer concentration of 300 nM. Thus,
10 µL of primer working solution will be added for each 50 µL reaction (each sample
requires 10 µL).
The DNA template concentration is important. If the sample is cDNA obtained from
reverse transcription of RNA see the procedure for the reverse transcription of RNA.
The reverse transcription reaction of RNA is performed on 800 ng (obtained from
total RNA extracted from sample and diluted to 100 ng/µL; and final volume of RT
reaction of 24 µL) of total RNA and the final concentration of DNA is ~33.3 ng/µL.
The procedure below is designed for a final DNA template concentration of ~165 ng
in the 50 µL reaction volume. Thus, 5 µL of the cDNA template (concentration 33.3
ng/ µL) will be added for each reaction.
Procedure:
1. Obtain a new 0.5 mL nuclease-free tube and label as PCR Master Mix. Keep tube on
ice and add the following (where S = the number of samples + 1):
a. S×(25 µL) ReadyMix (from kit)
b. S×(10 µL) Forward primer
c. S×(10 µL) Reverse primer
2. Obtain new 0.2 mL PCR tubes and label for each of your samples and for the no-
template control
a. Keep all tubes on ice.
b. Add 45 µL of PCR Master Mix (prepared in step 1) to each tube
c. Add 5 µL (~165 ng) of the sample cDNA (DNA template) to the correct tube.
Add 5 µL of water to the tube labeled “no template control”
d. Total final volume is 50 µL.
3. Common cycling parameters (use regular PCR machine in room 428):

Daniel Leeming
154
a. Denature the template at 94 °C for 1 minute
b. Anneal primers at 55 °C for 2 minutes
c. Extension at 72 °C for 3 minutes
d. 25-30 cycles of amplification is recommended.
e. Remove samples when PCR machine has cooled to 4 °C and store at -80 °C or
proceed directly to evaluate product on gel.
f. Do not leave the PCR machine to remain at 4 °C overnight.
Daniel Leeming
155
CHAPTER 9. References
Albarede, F. & Beard, B. (2004) Analytical methods for non-traditional isotopes. Reviews in
Mineralogy and Geochemistry, 55, 113-152
Al-Damagh, M.A. (2007) The protective role of zinc sulphate on ethanol-induced liver and
kidney damages in rats. Saudi Journal of Biological Sciences, 14, 283-292.
Alexis, M.N. (1997) Fish meal and fish oil replacers in Mediterranean marine fish diets. In: A.
Tacon, B. Basurco (Eds.), International Cent. for Advanced Mediterranean Agronomic
Studies, CIHEAM, Zaragoza (Spain). Cah. Options Mediterr., 22, 183–204
Alexis, M.N. & Nengas, I. (2001) Current state of knowledge concerning the use of soy
products in diets for feeding sea bass and seabream. Needs for future research, 5, 32.
AOAC (1990) Official methods of Analysis. (15th
Ed) AOAC (Helrich, K. ed), Washington
DC.
Andrews, G.K. (2001) Cellular zinc sensors: MTF-1 regulation of gene expression. Biometals,
14, 223-237.
Apines-Amar, M.J.S., Satoh, S., Caipang, C.M.A., Kiron, V., Watanabe, T. & Aoki, T. (2004)
Amino acid-chelate: a better source of Zn, Mn and Cu for rainbow trout, Oncorhynchus
mykiss. Aquaculture, 240, 345-358.
Apines, M.J., Satoh, S., Kiron, V., Watanabe, T., Nasu, N. & Fujita, S. (2001) Bioavailability
of amino acids chelated and glass embedded zinc to rainbow trout, Oncorhynchus mykiss,
fingerlings. Aquaculture Nutrition, 7, 221-228.
Daniel Leeming
156
Apines, M.J.S., Satoh, S., Kiron, V., Watanabe, T. & Aoki, T. (2003a) Availability of
supplemental amino acid-chelated trace elements in diets containing tricalcium phosphate and
phytate to rainbow trout, Oncorhynchus mykiss. Aquaculture, 225, 431-444.
Apines, M.J.S., Satoh, S., Kiron, V., Watanabe, T. & Fujita, S. (2003b) Bioavailability and
tissue distribution of amino acid-chelated trace elements in rainbow trout Oncorhynchus
mykiss. Fisheries Science, 69, 722-730.
Ashmead, H.D. (1992) The roles of amino acid chelates in animal nutrition. Noyes
Publications, New Jersey, USA
Aslaksen, M.A., Kraugerud, O.F., Penn, M., Svihus, B., Denstadli, V., Jørgensen, H.Y.,
Hillestad, M., Krogdahl, Å. & Storebakken, T. (2007) Screening of nutrient digestibilities and
intestinal pathologies in Atlantic salmon, Salmo salar, fed diets with legumes, oilseeds, or
cereals. Aquaculture, 272, 541-555.
Austreng, E., Storebakken, T., Thomassen, M.S., Refstie, S. & Thomassen, Y. (2000)
Evaluation of selected trivalent metal oxides as inert markers used to estimate apparent
digestibility in salmonids. Aquaculture, 188, 65-78.
Barrows, F.T., Gaylord, T.G., Sealey, W.M., Porter, L. & Smith, C.E. (2008) The effect of
vitamin premix in extruded plant-based and fish meal based diets on growth efficiency and
health of rainbow trout, Oncorhynchus mykiss. Aquaculture, 283, 148-155.
Barrows, F.T., Gaylord, T.G., Stone, D.A.J. & Smith, C.E. (2007) Effect of protein source
and nutrient density on growth efficiency, histology and plasma amino acid concentration of
rainbow trout (Oncorhynchus mykiss Walbaum). Aquaculture Research, 38, 1747-1758.

Daniel Leeming
157
Bjerkås, E., Waagbø, R., Sveier, H., Breck, O., Bjerkås, I., Bjørnestad, E. & Maage, A. (1995)
Cataract development in Atlantic salmon (Salmo salar L) in fresh water. Acta Vet Scand. 37
(3) 351-60
Bohn, L., Meyer, A. S. & Rasmussen, S. K. (2008) Phytate: impact on environment and
human nutrition. A challenge for molecular breeding. Journal of Zhejiang University Science
B 9, 165–191
Boujard, T. & Medale, F. (1994) Regulation of voluntary feed intake of juvenile rainbow
trout fed by hand or by self-feeders with diets containing two different protein/energy ratios.
Aquatic Living Resources, 7,211-215
Breck, O., Bjerkas, E., Campbell, P., Arnesen, P., Haldorsen, P. & Waagbø, R. (2003)
Cataract preventative role of mammalian blood meal, histidine, iron and zinc in diets for
Atlantic salmon (Salmo salar L.) of different strains. Aquaculture Nutrition, 9, 341-350.
Budavari, S., O'Neil, M.J., Smith, A. & Heckelman, P.E. (Eds.), (1989) The Merck Index.
An Encyclopedia of Chemicals, Drugs and Biologicals, 11th edn. Merck, Rahway, NJ, USA,
1606
Bureau, D.P., Harris, A.M. & Young Cho, C. (1998) The effects of purified alcohol extracts
from soy products on feed intake and growth of chinook salmon (Oncorhynchus tshawytscha)
and rainbow trout (Oncorhynchus mykiss). Aquaculture, 161, 27-43.
Bury, N.R., Chung, M.J., Sturm, A., Walker, P.A. & Hogstrand, C., (2008). Cortisol
stimulates the zinc signaling pathway and expression of metallothioneins and ZnT1 in
rainbow trout gill epithelial cells. Am. J. Physiol.: Regul. Integr. Comp. Physiol. 294, R623–
R629.

Daniel Leeming
158
Bury, N.R., Walker, P.A. & Glover, C.N. (2003) Nutritive metal uptake in teleost fish. J Exp
Biol, 206, 11-23.
Cain, K.D. & Garling, D.L. (1995) Pretreatment of soybean meal with phytase for salmonid
diets to reduce phosphorus concentrations in hatchery effluents. Prog. Fish-Cult. 57, 114–119
Cao, J., Henry, P.R., Guo, R., Holwerda, R.A., Toth, J.P., Littell, R.C., Miles, R.D. &
Ammerman, C.B., (2000) Chemical characteristics and relative bioavailability of
supplemental organic zinc sources for poultry and ruminants. Journal of Animal Science 78,
2039-2054
Carpene E, Camatti A, Isani G, Cattani O. & Cortesi P. (1992) Cd-metallothionein in liver
and kidney of goldfish (Carassius auratus): effects of temperature and salinity. Ital J Biochem
41: 273–282.
Castro, C.E., Kaspin, L.C., Chen, S.S. & Nolker, S.G. (1992) Zinc deficiency increases the
frequency of single strand DNA breaks in the rat liver. Nutrition Research, 12, 721-736.
Cheng, Z., J & Hardy, R., W. (2003) Effects of extrusion processing of feed ingredients on
apparent digestibility coefficients of nutrients for rainbow trout (Oncorhynchus mykiss).
Aquaculture Nutrition, 9, 77-83.
Chesters, J.K. (1997) Zinc In Handbook of nutritionally essential mineral elements. (O'Dell,
B.L. & Sunde, R.A. eds.), pp. 185-230. CRC Press, New York, USA.
Cheuk, W.K., Chan, P.C.-Y. & Chan, K.M. (2008) Cytotoxicities and induction of
metallothionein (MT) and metal regulatory element (MRE)-binding transcription factor-1
(MTF-1) messenger RNA levels in the zebrafish (Danio rerio) ZFL and SJD cell lines after
exposure to various metal ions. Aquatic Toxicology, 89, 103-112.

Daniel Leeming
159
Chien, X.X., Zafra-Stone, S., Bagchi, M. & Bagchi, D. (2006) Bioavailability, antioxidant
and immune-enhancing properties of zinc methionine. Biofactors. 27 (1-4) 231-44.
Chung, M.J., Walker, P.A., Brown, R.W. & Hogstrand, C. (2005) ZINC-mediated gene
expression offers protection against H2O2-induced cytotoxicity. Toxicol Appl Pharmacol, 205,
225-236.
Clearwater, S.J., Farag, A.M. & Meyer, J.S. (2002) Bioavailability and toxicity of dietborne
copper and zinc to fish. Comparative Biochemistry and Physiology C-Toxicology &
Pharmacology, 132, 269-313.
Cousins R.J. & Lee-Ambrose L.M. (1992) Nuclear zinc uptake and interactions and
metallothionein gene expression are influenced by dietary zinc in rats. Journal of Nutrition,
122 (1) , 56-64.
Croxford, T.P., McCormick, N.H. & Kelleher, S.L. (2011) Moderate Zinc Deficiency
Reduces Testicular Zip6 and Zip10 Abundance and Impairs Spermatogenesis in Mice. The
Journal of Nutrition, 141, 359-365.
Dalsgaard, J., Verlhac, V., Hjermitslev, N.H., Ekmann, K.S., Fischer, M., Klausen, M. &
Pedersen, P.B. (2012) Effects of exogenous enzymes on apparent nutrient digestibility in
rainbow trout (Oncorhynchus mykiss) fed diets with high inclusion of plant-based protein.
Animal Feed Science and Technology, 171, 181-191
Dalton T. D., Bittel D. & Andrews G. K. (1997) Reversible activation of mouse metal
response element-binding transcription factor 1 DNA binding involves zinc interaction with
the zinc finger domain. Mol. Cell. Biol. 17 2781–2789

Daniel Leeming
160
Dalton T.P., Solis W.A., Nebert D.W. & Carvan III M.J. (2000) Characterization of the
MTF-1 transcription factor from zebrafish and trout cells Comparative Biochemistry and
Physiology - B Biochemistry and Molecular Biology, 126 (3) , 325-335.
Dean, R.J., Shimmield, M. & Black, K.D. (2007) Copper, zinc and cadmium in marine cage
fish farm sediments: an extensive survey. Environmental Pollution 145, 84-95.
Delvalls, A. Andres,. Belzunce, M.J., Buceta, J.L., Casado-Martinez, M.C., Castro, R., Riba
I., Viguri J. & Basco J. (2004) Chemical and ecological guidelines for the disposal of dredged
material. Trends Anal. Chem., 23, 819–825
Denstadli, V., Skrede, A., Krogdahl, Å., Sahlstrøm, S. & Storebakken, T. (2006) Feed intake,
growth, feed conversion, digestibility, enzyme activities and intestinal structure in Atlantic
salmon (Salmo salar L.) fed graded levels of phytic acid. Aquaculture, 256, 365-376.
Dibner, J.J. (2005) Early nutrition of zinc and copper in chicks and poults: Impact on growth
and immune function. Paper presented at Mid-Atlantic Nutrition Conference. University of
Maryland, College Park.
Do Carmo e Sá, M.V., Pezzato, L.E., Ferreira Lima, M.M.B. & De Magalhães Padilha, P.
(2004) Optimum zinc supplementation level in Nile tilapia Oreochromis niloticus juveniles
diets. Aquaculture, 238, 385-401.
Do Carmo e Sa, M.V., Pezzato, L.E., Barros, M.M. & De Magalhaes Padilha, P. (2005)
Relative bioavailability of zinc in supplemental inorganic and organic sources for Nile tilapia
(Oreochromis niloticus) fingerlings. Aquaculture Nutrition, 11, 273-281.

Daniel Leeming
161
Dunn, M. A. (1991) Hormonal induction of metallothionein synthesis: its effect on zinc
kinetics in the rat. In: Metallothionein in Biology and Medicine (Klaassen, C. D. & Suzuki, K.
T., eds.), pp. 283–294, CRC Press, Boca Raton, FL, USA.
Dunn, M.A. & Cousins, R.J. (1989) Kinetics of zinc-metabolism in the rat - effect of
dibutyryl camp. American Journal of Physiology, 256, E420-E430.
Erdman, J. W. (1979) Oilseed phytates: Nutritional implications. Journal of the American Oil
Chemists’ Society. 56, 8, 736-741
Espe, M., Lemme, A., Petri, A. & El-Mowafi, A. (2006) Can Atlantic salmon (Salmo salar)
grow on diets devoid of fish meal? Aquaculture, 255, 255-262.
Fairweather-Tait, S.J., Jackson, M.J., Fox, T.E., Wharf, S.G., Eagles, J. & Croghan, P.C.
(1993) The measurement of exchangeable pools of zinc using the stable-isotope Zn-70.
British Journal of Nutrition, 70, 221-234.
FAO, (2002) State of World Fisheries and Aquaculture. FAO Fisheries Department, Food
and agriculture organisation of the united nations. Rome, Italy. p159
FAO (2012) State of World Fisheries and Aquaculture, FAO Fisheries Department, Food and
agriculture organisation of the united nations. Rome, Italy. p4
Feeney, G.P., Zheng, D.L., Kille, P. & Hogstrand, C. (2005) The phylogeny of teleost ZIP
and ZnT zinc transporters and their tissue specific expression and response to zinc in
zebrafish. Biochimica Et Biophysica Acta-Gene Structure and Expression, 1732, 88-95.
Floreto, E.A.T., Bayer, R.C. & Brown, P.B. (2000) The effects of soybean-based diets, with
and without amino acid supplementation, on growth and biochemical composition of juvenile
American lobster, Homarus americanus. Aquaculture, 189, 211-235.
Daniel Leeming
162
Folk, J.E., Piez, K.A., Carroll, W.R. & Gladner, J.A. (1960) Carboxypeptidase B.
IV.Purification and characterization of the porcine enzyme. J. Biol. Chem., 235, 2272-2277.
Forster, I., Higgs, D.A., Dosanjh, B.S., Rowshandeli, M. & Parr, J. (1999) Potential for
dietary phytase to improve the nutritive value of canola protein concentrate and decrease
phosphorus output in rainbow trout (Oncorhynchus mykiss) held in 11°C fresh water.
Aquaculture, 179, 109-125.
Furuya, W.M., Pezzato, L.E., Barros, M.M., Pezzato, A.C., Furuya, V.r.R.B. & Miranda, E.C.
(2004) Use of ideal protein concept for precision formulation of amino acid levels in fish-
meal-free diets for juvenile Nile tilapia (Oreochromis niloticus.). Aquaculture Research, 35,
1110-1116.
Gammanpila, M., Yakupitiyage, A. & Bart, A. (2007) Evaluation of the effects of dietary
vitamin C, E and Zinc supplementation on reproductive performance of Nile tilapia
( Oreochromis niloticus ). Sri Lanka Journal of Aquatic Sciences, 12, 39-60
Garretts , M. & Molokhia, M., (1977) Acrodermatitis enteropathica without hypozincemia.
Journal of Pediatrics, 91 (3) , 492-494.
Gatlin, D.M., Barrows, F.T., Brown, P., Dabrowski, K., Gaylord, T.G., Hardy, R.W., Herman,
E., Hu, G.S., Krogdahl, A., Nelson, R., Overturf, K., Rust, M., Sealey, W., Skonberg, D.,
Souza, E.J., Stone, D., Wilson, R. & Wurtele, E. (2007) Expanding the utilization of
sustainable plant products in aquafeeds: a review. Aquaculture Research, 38, 551-579.
Glover, C.N., Bury, N.R. & Hogstrand, C. (2003) Zinc uptake across the apical membrane of
freshwater rainbow trout intestine is mediated by high affinity, low affinity, and histidine-
facilitated pathways. Biochimica et Biophysica Acta (BBA) - Biomembranes, 1614, 211-219.

Daniel Leeming
163
Glover, C.N. & Hogstrand, C. (2002) In vivo characterisation of intestinal zinc uptake in
freshwater rainbow trout. J Exp Biol, 205, 141-150.
Gomes, E.F. & Kaushik, S. (1993) Effect of replacement of dietary inorganic zinc by
zinc/methionine an vegetable and animal protein utilization by rainbow trout. In: Fish
Nutrition in Practice (Kaushik, S.J. & Luquet, P. eds), pp. 897±902. INRA Editions no. 61,
Paris.
Goyer, R.A. (1997) Toxic and essential metal interactions. Annual Review of Nutrition, 17,
37-50.
Greiner, R. & Konietzny, U., (2006) Phytase for food application. Food Technology and
Biotechnology 44, 125–140.
Griffin, I. (2002) Using stable isotopes and isotope ratio mass spectrometry to study mineral
metabolism in humans. J. Anal. At. Spectrom., 17, 1186-1193
Guimaraes, I.G., Pezzato, L.E. & Barros, M.M. (2008) Amino acid availability and protein
digestibility of several protein sources for Nile tilapia, (Oreochromis niloticus). Aquaculture
Nutrition, 14, 396-404.
Hall, A.C., Young, B.W. & Bremner, I. (1979) Intestinal metallothionein and the mutual
antagonism between copper and zinc in the rat. Journal of Inorganic Biochemistry, 11, 57-66
Halliwell, B. & Gutteridge J.M.C., (1999). Free Radicals in Biology and Medicine (3rd ed.).
Oxford University Press, Oxford, pp. 105-245. UK.
Hardy, R., Sullivan, C. & Koziol, A. (1987) Absorption, body distribution, and excretion of
dietary zinc by rainbow trout (Salmo gairdneri). Fish Physiology and Biochemistry, 3, 133-
143.
Daniel Leeming
164
Hartman, A., Plappert, U., Raddatz, K., Grunert-Fuchs, M. & Speit, G., (1994). Does physical
activity induce DNA damage? Mutagenesis 9, 269-272
Herman, R.L. (1970) Effects of gossypol on rainbow trout (Salmo gairdneri). Journal of Fish
Biology, 2, 293.
Hernández, A.J., Satoh, S., & Kiron, V. (2012) Supplementation of Citric Acid and Amino
Acid Chelated Trace Elements in Low-Fish Meal Diet for Rainbow Trout Affect Growth and
Phosphorus Utilization. Journal of the World Aquaculture Society. 43,(5), 688–696
Hidalgo, M.C., Expósito, A., Palma, J.M. & Higuera, M.. (2002) Oxidative stress generated
by dietary Zn-deficiency: studies in rainbow trout (Oncorhynchus mykiss). The International
Journal of Biochemistry & Cell Biology, 34, 183-193.
Ho, E., & Ames, B.N. (2002) Low intracellular zinc induces oxidative DNA damage, disrupts
p53, NFkappa B, and AP1 DNA binding, and affects DNA repair in a rat glioma cell line.
Proc Natl Acad Sci USA. 99: 16770–5.
Hogstrand, C., Lithner, G. & Haux, C. (1991) The Importance of Metallothionein for the
Accumulation of Copper, Zinc and Cadmium in Environmentally Exposed Perch, Perca-
Fluviatilis. Pharmacology & Toxicology, 68, 492-501.
House, W.A. & Wastney, M.E. (1997) Compartmental analysis of zinc kinetics in mature
male rats. American Journal of Physiology-Regulatory Integrative and Comparative
Physiology, 273, R1117-R1125.
Kaushik, S.J., Cravedi, J.P., Lalles, J.P., Sumpter, J., Fauconneau, B. & Laroche ,M. (1995)
Partial or total replacement of fish meal by soybean protein on growth, protein utilization,
Daniel Leeming
165
potential estrogenic or antigenic effects, cholesterolemia and flesh quality in rainbow trout,
Oncorhynchus mykiss. Aquaculture, 133 (3-4) , 257-274.
Kelly SP, Fletcher M, Part P. & Wood CM., (2000). Procedures for the preparation and
culture of “reconstructed” rainbow trout branchial epithelia. Methods Cell Sci 22: 153–163.
Ketola, H.G. (1979) Influenec of dietary zinc on cataracts in rainbow trout (Salmo gairdner).
Journal of Nutrition, 109, 965-969.
Kiron, V. (2012) Fish immune system and its nutritional modulation for preventive health
care. Animal Feed Science and Technology. 153 (1-2) 111-133
Kjoss, V.A., Wood, C.M. & McDonald, D.G. (2006) Effects of different ligands on the
bioaccumulation and subsequent depuration of dietary Cu and Zn in juvenile rainbow trout
(Oncorhynchus mykiss). Canadian Journal of Fisheries and Aquatic Sciences, 63, 412-422.
Krasnov, A., Koskinen, H., Pehkonen, P., Rexroad, C., Afanasyev, S. & Molsa, H. (2005)
Gene expression in the brain and kidney of rainbow trout in response to handling stress. BMC
Genomics, 6, 3.
Kucukbay, F.Z., Yazlak, H., Sahin, N., Tuzcu, M., Cakmak, M.N., Gurdogan, F., Juturu, V.
& Sahin, K., (2006) Zinc picolinate supplementation decreases oxidative stress in rainbow
trout. Aquaculture 257, 465-469.
Kumar, N. (2006) Copper Deficiency Myelopathy (Human Swayback). Mayo Clinic
Proceedings, 81, 1371-1384.
Kumar, V., Sinha, A.K., Makkar, H.P.S., De Boeck, G. & Becker, K. (2012) Phytate and
phytase in fish nutrition. Journal of Animal Physiology and Animal Nutrition, 96, 335-364.

Daniel Leeming
166
Kumaravel, T.S. & Jha, A.N., (2006) Reliable measurements for detecting DNA damage
induced by ionising radiation and chemicals. Mutation Research 605, 7-16.
Lai, C., Huand, W., Askari, A., Wang, Y., Sarvazyzn, N., Klevay, L.M. & Chiu, T.H. (1994)
Differential regulation of superoxide dismutase in copper-deficient rat organs. Free Radical
Biology and Medicine, 16 (5), 613 - 620
Laity J.H. & Andrews G.K. (2007) Understanding the mechanisms of zinc-sensing by metal-
response element binding transcription factor-1 (MTF-1). Archives of Biochemistry and
Biophysics, 463 (2) , 201-210.
Lall, S.P. (2002) The minerals In: J.E. Halver and R. W. Hardy (Eds.), Fish Nutr. (3rd
Edn),
Academic Press, London, UK pp. 259–308
Leeson, S., & J. D. Summers. (2001) Scott’s Nutrition of the Chicken. 4th Ed. University
Books P.O. Box 1326 Guelph, Ontario, Canada.
Lee, K.J., Dabrowski, K., Blom, J.H., Bai, S.C. & Stromberg, P.C. (2002) A mixture of
cottonseed meal, soybean meal and animal byproduct mixture as a fish meal substitute:
growth and tissue gossypol enantiomer in juvenile rainbow trout (Oncorhynchus mykiss).
Journal of Animal Physiology and Animal Nutrition, 86, 201-213.
Leeuwenburgh C. & Heinecke J.W., (2001) Oxidative stress and antioxidants in exercise.
Current Medicinal Chemistry 8, 829-838.
Li, M.H. & Robinson, E.H., (1996). Comparison of chelated zinc and zinc sulphate as zinc
sources for growth and bone mineralization of channel catfish (Ictalurus punctatus) fed
practical diets. Aquaculture 146, 237-243.
Daniel Leeming
167
Lin, Y.-H., Jiang, L.-C., & Shiau, S.-Y. (2008) Dietary zinc requirements of juvenile tilapia
(Oreochromis niloticus x O. aureus. J.Fish.Soc Taiwan 35, 117-125
Lorentzen, M. & Maage, A. (1999) Trace element status of juvenile Atlantic salmon Salmo
salar L. fed a fish-meal based diet with or without supplementation of zinc, iron, manganese
and copper from first feeding. Aquaculture Nutrition, 5, 163-171.
Lowe, N.M., Hall, E.J., Anderson, R.S., Batt, R.M. & Jackson, M.J. (1995) A stable-isotope
study of zinc kinetics in Irish-setters with gluten-sensitive enteropathy. British Journal of
Nutrition, 74, 69-76.
Luo Z., Tan X.-Y., Zheng J.-L., Chen Q.-L. & Liu C.-X. (2011) Quantitative dietary zinc
requirement of juvenile yellow catfish Pelteobagrus fulvidraco, and effects on hepatic
intermediary metabolism and antioxidant responses. Aquaculture, 319 (1-2) , 150-155
Maage, A. & Julshamn, K. (1993) Assessment of zinc status in juvenile Atlantic salmon
(Salmo salar) by measurement of whole body and tissue levels of zinc. Aquaculture, 117,
179-191.
Maage, A., Julshamn, K., & Berge, E., (2001) Zinc gluconate and zinc sulphate as dietary
sources for Atlantic salmon. Aquaculture Nutrition 7, 183-187
Mambrini, M., Roem, A.J., Cravedi, J.P., Lalles, J.P. & Kaushik, S.J. (1999) Effects of
replacing fish meal with soy protein concentrate and of DL-methionine supplementation in
high-energy, extruded diets on the growth and nutrient utilization of rainbow trout,
Oncorhynchus mykiss. Journal of Animal Science, 77, 2990-2999.
Daniel Leeming
168
Masser, M.P., Rakocy, J. & Losordo T.M., (1999) Recirculating aquaculture tank production
systems. Management of recirculating systems. In: Southern Regional Aquaculture Center
Publication no: 452 Stoneville, MS, USA, p12.
McCall, K.A., Huang, C.-c. & Fierke, C.A. (2000) Function and Mechanism of Zinc
Metalloenzymes. J. Nutr., 130, 1437S-1446.
Morris, E.R. (1987) Iron In Trace Elements in Human and Animal Nutrition (Mertz, W. ed.),
Vol. 1, pp. 79-142. Academic Press, San Diego.
Muto N, Ren HW, Hwang GS, Tominaga S, Itoh N. & Tanakam K., (1999) Induction of two
major isoforms of metallothionein in crucian carp (Carassius cuvieri) by air-pumping stress,
dexamethasone, and metals. Comp Biochem Physiol C 122: 75–82
Nakamura, Y. (1982) Effects of dietary phosphorus and calcium contents on the absorption of
phosphorus in the digestive tract of carp. Bulletin of the Japanese Society of Scientific
Fisheries, 48, 409-413.
Naylor, R,L., Goldburg, R.J., Primavera, J.H., Kautsky, N., Beveridge, M.C.M., Clay, J.,
Folke, C., Lubchenco, J., Mooney, H. & Troell, M. (2000) Effect of aquaculture on world
fish supplies Nature 405, 1017-1024
New M.B. & Wijkström U.N. (2002) Use of Fish Meal and Fishoil in Aquafeeds: Further
Thoughts on the Fish Meal Trap. FAO Fisheries Department, Food and agriculture
organisation of the united nations. Rome, Italy.
NRC (1993) Nutrient requirements of fish. NRC (National Research Council) National
Academy of Sciences, Washington, DC, USA

Daniel Leeming
169
NRC (2011) Nutrient requirements of fish and shrimp NRC (National Research Council)
National Academy of Sciences, Washington, DC, USA
Nusetti, S., Urbina, M., Obregón, F., Quintal, M.,Benzo , Z.& Lima, L. (2010) Effects of zinc
ex vivo and intracellular zinc chelator in vivo on taurine uptake in goldfish retina. Amino
Acids 38: 5, 1429-1437
Ogino, C. & Yang, G.Y. (1978) Mineral requirements in fish.4. Requirement of rainbow-
trout for dietary zinc. Bulletin of the Japanese Society of Scientific Fisheries, 44, 1015-1018.
Oliva-Teles, A., Pereira, J.P., Gouveia, A. & Gomes, E. (1998) Utilisation of diets
supplemented with microbial phytase by seabass (Dicentrarchus labrax) juveniles. Aquatic
Living Resources, 11, 255-259.
Olsson, P.-E., Hyllner, S.J., Zafarullah, M., Andersson, T. & Gedamu, L. (1990) Differences
in metallothionein gene expression in primary cultures of rainbow trout hepatocytes and the
RTH-149 cell line. Biochimica et Biophysica Acta (BBA) - Gene Structure and Expression,
1049, 78-82.
Olsson, P.E., Haux, C. & Forlin, L. (1987) Variations in Hepatic Metallothionen, Zinc and
Copper Levels During An Annual Reproductive-Cycle in Rainbow-Trout, Salmo-Gairdneri.
Fish Physiology and Biochemistry, 3, 39-47.
Onosaka S. & Cherian M.G. (1982) Comparison of metallothionein determination by
polarographic and cadmium-saturation methods Toxicology and Applied Pharmacology, 63
(2), 270-274.

Daniel Leeming
170
Overnell, J., Fletcher, T.C. & McIntosh, R. (1988) The apparent lack of effect of
supplementary dietary zinc on zinc metabolism and metallothionein concentrations in the
turbot, Scophthalmus maximus (Linnaeus). Journal of Fish Biology, 33, 563-570.
Packer, L., Cadenas, E. & Davies, K.J., (2008) Free radicals and exercise: an introduction.
Free Radical Biology and Medicine 44, 123-125.
Paripatananont, T. & Lovell, R.T. (1995) Responses of Channel Catfish Fed Organic and
Inorganic Sources of Zinc to Edwardsiella ictaluri Challenge. Journal of Aquatic Animal
Health, 7, 147-154.
Paripatananont, T. & Lovell, R.T. (1996) Comparative digestibility of chelated and inorganic
trace minerals in channel catfish (Ictalurus punctatus) diets. Proceedings of the VII
International Symposium on Fish Nutrition and Feeding. (Special Issue, Ed Wilson, R)
Aquaculture, 161 24
Paripatananont, T. & Lovell, R.T., (1997) Comparative net absorption of chelated and
inorganic trace minerals in channel catfish Ictalurus punctatus diets. Journal of the World
Aquaculture Society 28 (1), 62-67.
Piskula, M.K. & Terao, J. (1998) Accumulation of (-)-Epicatechin Metabolites in Rat Plasma
after Oral Administration and Distribution of Conjugation Enzymes in Rat Tissues. J. Nutr.,
128, 1172-1178.
Pontoppidan, K., Pettersson, D. & Sandberg, A.S., (2007) The type of thermal feed treatment
influences the inositol phosphate composition. Animal Feed Science and Technology, 132(1–
2):137–147.
Daniel Leeming
171
Popov, B. V. & Besel, V. S. (1977) Mathematical model of zinc metabolism in rat: imitation
of zinc deficient and zinc excessive diets. In: Proceedings of the Trace Element Metabolism
in Man and Animals (TEMA3) (Kirchgessner, M., ed.), Vol. 3. 168 -170
Porn-Ngam, N., Satoh, S., Takeuchi, T. & Watanabe, T. (1993) Effect of the ratio of
phosphorus to calcium on zinc availability to rainbow trout in high phosphorus diet. Nippon
Suisan Gakkaishi, 59, 2065-2070.
Raboy, V. (1997). Accumulation and storage of phosphate and minerals. In: B. A. Larkins, I.
K. Vasil (eds), Cellular and Molecular Biology of Plant Seed Development. Kluwer
Academic Publishers, Dordrecht, The Netherlands, pp. 441–477.
Radtke, F., Heuchel, R., Georgiev, O., Hergersberg, M., Gariglio, M., Dembic, Z. &
Schaffner, W. 1993. Cloned transcription factor MTF-1 activates the mouse metallothionein I
promoter. EMBO J. 12(4) pp. 1355-62.
Ramseyer, L., Garling, D., Hill, G. & Link, J. (1999) Effect of dietary zinc supplementation
and phytase pre-treatment of soybean meal or corn gluten meal on growth, zinc status and
zinc-related metabolism in rainbow trout, Oncorhynchus mykiss. Fish Physiology and
Biochemistry, 20, 251-261.
Refstie, S., Storebakken, T. & Roem, A.J. (1998) Feed consumption and conversion in
Atlantic salmon (Salmo salar) fed diets with fish meal, extracted soybean meal or soybean
meal with reduced content of oligosaccharides, trypsin inhibitors, lectins and soya antigens.
Aquaculture, 162, 301-312.
Reilly, C. (2004) Zinc In The Nutritional Trace Metals pp. 82-117. Blackwell Publishing,
Oxford. UK.

Daniel Leeming
172
Richardson, N.L., Higgs, D.A., Beames, R.M. & McBride, J.R. (1985) Influence of dietary
calcium, phosphorus, zinc and sodium phytate level on cataract incidence, growth and
histopathology in juvenile chinook salmon (Oncorhynchus-tshawytscha). Journal of Nutrition,
115, 553-567.
Riche, M. & Brown, P.B. (1996) Availability of phosphorus from feedstuffs fed to rainbow
trout, Oncorhynchus mykiss. Aquaculture, 142, 269-282.
Riche, M. & Garling, D.L. (2004) Effect of phytic acid on growth and nitrogen retention in
tilapia Oreochromis niloticus L. Aquaculture Nutrition, 10, 389-400.
Rider, S.A., Davies, S.J., Jha, A.N., Fisher, A.A., Knight, J. & Sweetman, J.W. (2009) Supra-
nutritional dietary intake of selenite and selenium yeast in normal and stressed rainbow trout
(Oncorhynchus mykiss): Implications on selenium status and health responses. Aquaculture,
295, 282-291.
Russell M., Robinson C.D., Walsham P., Webster L. & Moffat C.F. (2011) Persistent
organic pollutants and trace metals in sediments close to Scottish marine fish farms.
Aquaculture, 319 (1-2) , 262-271
Sabourin, T.D., Gant, D.B., & Eber LJ. (1985). The influence of metal and nonmetal stressors
on hepatic metal-binding protein production in Buffalo sculpin, Enophrys bison. In: Marine
Pollution and Physiology: Recent Advances, edited by Vernberg FJ, Thurberg FP, Calabrese
A, Vernberg W. Columbia, SC: South Carolina Press, p. 247–266. SC, USA.
Sachdev, S. & Davies, K.J., (2008). Production, detection, and adaptive responses to free
radicals in exercise. Free Radical Biology and Medicine 44, 215-223.
Daniel Leeming
173
Salgueiro, M.J., Zubillaga, M., Lysionek, A., Sarabia, M.I., Caro, R., De Paoli, T., Hager, A.,
Weill, R. & Boccio, J. (2000) Zinc as an essential micronutrient: A review. Nutrition
Research, 20, 737-755.
Sampaio-Oliveira, A.M.B.M. & Cyrino, J.E.P. (2008) Digestibility of plant protein-based
diets by largemouth bass (Micropterus salmoides). Aquaculture Nutrition, 14, 318-323.
Sandstrom, B., Fairweather-Tait, S., Hurrell, R. & Van Dokkum, W. (1993) Methods for
studying mineral and trace element absorption in humans using stable isotopes. Nutrition
Research Reviews, 6,71-95.
Sappal, R., Burka, J., Dawson, S. & Kamunde, C., (2009). Bioaccumulation and sub cellular
partitioning of zinc in rainbowtrout (Oncorhynchus mykiss): Cross-talk between waterborne
and dietary uptake. Aquatic Toxicology, 91, 281-290
Satoh, S., Izume, K., Takeuchi, T. & Watanabe, T. (1987) Mineral-nutrition in fish.22.
Availability to rainbow trout of zinc contained in various types of fish meals. Nippon Suisan
Gakkaishi, 53, 1861-1866.
Satoh, S., Izume, K., Takeuchi, T. & Watanabe, T. (1992) Effect of supplemental tricalcium
phosphate on zinc and manganese availability to common carp. Nippon Suisan Gakkaishi, 58,
539-545.
Satoh, S., Porn-Ngam, N., Takeuchi, T. & Watanabe, T. (1993) Effect of various types of
phosphates on zinc availability to rainbow trout. Nippon Suisan Gakkaishi, 59, 1395-1400.
Satoh, S., Viyakarn, V., Takeuchi, T. & Watanabe, T., (1997) Availability of phosphorus in
various phosphates to carp and rainbow trout determined by a simple fractionation method.
Fish. Sci. 63:297-300.

Daniel Leeming
174
Satoh, S., Apines, M.J., Tsukioka, T., Kiron, V., Watanabe, T. & Fujita, S. (2001)
Bioavailability of amino acid-chelated and glass-embedded manganese to rainbow trout,
Oncorhynchus mykiss (Walbaum), fingerlings. Aquaculture Research, 32, 18-25.
Savolainen, L.C. & Gatlin III, D.M. (2010) Evaluation of sulfur amino acid and zinc
supplements to soybean-meal-based diets for hybrid striped bass. Aquaculture, 307, 260-265.
Scheuhammer A.M. & Cherian M.G. (1991) Quantification of metallothionein by silver
saturation Methods in Enzymology, 205, pp. 78-83
Scottish Executive (2002) Review and synthesis of the environmental impacts of aquaculture
The Scottish Association for Marine Sciences and Napier University. Scottish Executive
Central Research Unit. ISBN 0755934032
Scottish Salmon Producers’ Organisation (2013)
www.scottishsalmon.co.uk/facts_figures/production.aspx
Segner, H. & Storch, V. (1985) Influence of water-borne iron on the liver of Poecilia
reticulata (Peters 1859). Journal of Applied Ichthyology, 1, 39-47.
Serfass, R. E., Fang, Y. & Wastney, M. E. (1996) Zinc kinetics in weaned piglets fed
marginal zinc intake: compartmental analysis of stable isotopic data. J. Trace Elem. Exp.
Med. 9: 73–86.
Singh N.P., McCoy M.T., Tice, R.R., & Schneider E.L., (1988) A simple technique for
determination of low levels DNA damage in individual cells. Experimental Cell Research
175, 184-191.

Daniel Leeming
175
Smith, P.K., Krohn, R.I., Hermanson, G.T., Mallia, A.K., Gartner, F.H., Provenzano, M.D.,
Fujimoto, E.K., Goeke, N.M., Olson, B.J. & Klenk, D.C., (1985). Measurement of protein
using icinchoninic acid. Analytical Biochemistry 150, 76-85.
Spry, D.J., Hodson, P.V. & Wood, C.M. (1988) Relative contributions of dietary and
waterbourne zinc in the rainbow-trout, Salmo gairdneri. Canadian Journal of Fisheries and
Aquatic Sciences, 45, 32-41.
Storebakken, T., Shearer, K.D. & Roem A.J. (2000) Growth, uptake and retention of nitrogen
and phosphorus, and absorption of other minerals in Atlantic salmon (Salmo salar) fed diets
with fish meal and soy-protein concentrate as the main sources of protein. Aquaculture
Nutrition, 6, 103-108.
Storebakken, T., Shearer, K.D. & Roem, A.J. (1998) Availability of protein, phosphorus and
other elements in fish meal, soy-protein concentrate and phytase-treated soy-protein-
concentrate-based diets to Atlantic salmon, Salmo salar. Aquaculture, 161, 365-379.
Sugiura, S.H., Babbitt, J.K., Dong, F.M. & Hardy, R.W. (2000) Utilization of fish and animal
by-product meals in low-pollution feeds for rainbow trout Oncorhynchus mykiss (Walbaum).
Aquaculture Research, 31, 585-593.Sun, L.T. & Jeng, S.S. (1998) Comparative zinc
concentrations in tissues of common carp and other aquatic organisms. Zoological Studies, 37,
184-190.
Sugiura, S.H., Dong, F.M., Rathbone, C.K. & Hardy, R.W. (1998) Apparent protein
digestibility and mineral availabilities in various feed ingredients for salmonid feeds.
Aquaculture, 159, 177-202.
Daniel Leeming
176
Swinkels, J.W.G.M., Kornegay, E.T. & Verstegen, M.W.A. (1994) Biology of Zinc and
Biological Value of Dietary Organic Zinc Complexes and Chelates. Nutrition Research
Reviews, 7, 129-149.
Tacon, A.G.J. & Metian, M. (2008) Global overview on the use of fish meal and fish oil in
industrially compounded aquafeeds: Trends and future prospects. Aquaculture, 285, 146-158.
Takagi, S., Shimeno, S., Hosokawa, H. & Ukawa, M. (2001) Effect of lysine and methionine
supplementation to a soy protein concentrate diet for red sea bream Pagrus major. Fisheries
Science, 67, 1088-1096.
Tan B & Mai K. (2001) Zinc methionine and zinc sulfate as sources of dietary zinc for
juvenile abalone, Haliotis discus hannai Ino. Aquaculture, 192 (1) , 67-84.
Taylor, C.G., Bettger. W.J. & Bray, T.M. (1988) Effect of dietary zinc or copper deficiency
on the primary free radical defense system in rats. Journal of Nutrition. 118(5) 613-21
Teskeredžić, Z., Higgs, D.A., Dosanjh, B.S., McBride, J.R., Hardy, R.W., Beames, R.M.,
Jones, J.D., Simell, M., Vaara, T. & Bridges, R.B. (1995) Assessment of undephytinized and
dephytinized rapeseed protein concentrate as sources of dietary protein for juvenile rainbow
trout (Oncorhynchus mykiss). Aquaculture, 131, 261-277.
Tian, X. & Diaz, F.J. (2013) Acute dietary zinc deficiency before conception compromises
oocyte epigenetic programming and disrupts embryonic development. Developmental
Biology, 376, 51-61.
Turnlund, J. R., Durkin, N., Costa, F. & Margen, S. (1986) Stable isotope studies of zinc
absorption and retention in young and elderly men. J Nutr. 116(7): 1239–1247.

Daniel Leeming
177
Tyagi, P.K. & Verma, S.V.S. (1998) Phytate phosphorus content of some common poultry
feed stuffs. Indian J Poult Sci 33:86–88
Vallee, B.L., Coleman, J.E. & Auld, D.S. (1991) Zinc fingers, zinc clusters, and zinc twists in
DNA-binding protein domains. Proceedings of the National Academy of Sciences of the
United States of America, 88, 999-1003.
Vallee, B.L. & Falchuk, K.H. (1993) The Biochemical basis of zinc physiology.
Physiological Reviews, 73, 79-118.
Vielma J., Ruohonen K. & Peisker M.(2002) Dephytinization of two soy proteins increases
phosphorus and protein utilization by rainbow trout, Oncorhynchus mykiss Aquaculture,
204 (1-2) , 145-156.
Walker J. (2010) Scottish Fish Farm Production Survey 2009. Marine Scotland, The Scottish
Government. ISSN 1363-5867. Edinburgh. UK
Ward, A.D., Carter, C.G. & Townsend, A.T. (2005) The use of yttrium oxide and the effect
of faecal collection timing for determining the apparent digestibility of minerals and trace
elements in Atlantic salmon (Salmo salar, L.) feeds. Aquaculture Nutrition 11, 49-59.
Watanabe, T., Kiron, V. & Satoh, S. (1997) Trace minerals in fish nutrition. Aquaculture, 151,
185-207.
Watanabe,T., Verakunpiriya, V., Watanabe, K., Viswanath, K., & Satoh, S.(1998) Feeding
of rainbow trout with non-fish meal diets. Fish. Sci., 63 258–266
Wekell, J.C., Shearer, K.D. & Gauglitz, E.J., (1986) Zinc supplementation of trout diets:
tissue indicators of body zinc status. Progressive Fish Culturist 48, 205-212.

Daniel Leeming
178
Wekell, J.C., Shearer, K.D. & Houle, C.R. (1983) High zinc supplementation of rainbow-
trout diets. Progressive Fish-Culturist, 45, 144-147.
Wendelaar-Bogna, S.E., (1997) The stress response in fish. Physiological Reviews 77 (3),
591-625.
Westin, G. & Schaffner, W. (1988) A zinc-responsive factor interacts with a metal-regulated
enhancer element (MRE) of the mouse metallothionein-I gene. EMBO J. 1; 7(12) 3763-70.
Wu, F.Y.H. & Wu, C.W. (1987) Zinc in DNA replication and transcription. Annual Review
of Nutrition, 7, 251-272.
Yamamoto, T., Ikeda, K., Unuma, T. & Akiyama, T. (1997) Apparent availabilities of amino
acids and minerals from several protein sources for fingerling rainbow trout. Fisheries
Science, 63, 995-1001.
Zhang, B., Georgiev, O., Hagmann, M., Gunes, C., Cramer, M., Faller, P., Vasak, M. &
Schaffner, W. (2003) Activity of metal-responsive transcription factor 1 by toxic heavy
metals and H2O2 in vitro is modulated by metallothionein. Molecular and Cellular Biology,
23, 8471-8485.