Embed Size (px)
Citation preview

Dear participants, this booklet contains the preliminary versions of the presentations prepared by the speakers for the Agora conference ‘Skills for Europe’s future’, taking place on 21-22 February 2008, in Thessaloniki. The proceedings with revised contributions taking into account the discussions in the working groups and panel will be published in due time after the conference. Cedefop´s Skillsnet team Alena Zukersteinova Torsten Dunkel Manfred Tessaring

Table of Content
Medium-term forecast of occupational skill needs in Europe Alena Zukersteinova and Rob Wilson .......................................................................................................... 4 European labour market: prospects and challenges Carlo Dell’Aringa...........................................................................................................................................14 Effects of ageing on European labour supply Ernest Berkhout........................................................................................................................................... 21 Beyond skills: banal creativity and spontaneity in a learning intensive society Riel Miller ..................................................................................................................................................... 28
Medium-term forecast of occupational skill needs in Europe: detailed results and methodological approach Rob Wilson and Ilias Livanos ..................................................................................................................... 55 An ageing society and the significance of the replacement demand Ben Kriechel ............................................................................................................................................... 66 Skills supply forecast Frank Cörvers and Hector Pollitt ................................................................................................................ 75
Trends and skill needs in tourism Henriette Freikamp..................................................................................................................................... 85 Skill needs in an innovative area: nanotechnology Uwe Schumann .......................................................................................................................................... 93 From tradition to innovation: skill needs in agri-food chains Martin Mulder.............................................................................................................................................103 Re-skilling and other measures for workers displaced at restructuring Donald Storrie............................................................................................................................................112 EuroSkills 2008 Thom ter Stege..........................................................................................................................................124
Enterprise surveys as a tool for skill needs analysis Olga Strietska-Ilina ....................................................................................................................................139 Monitoring recruitment difficulties. The European Commission perspective Germana Di Domenico ..............................................................................................................................149 Measuring recruitment difficulties in Europe Jean-Louis Zanda......................................................................................................................................158 Skill needs in enterprises: CVTS3 results Friederike Behringer ..................................................................................................................................161
Working goup I: Forecasting skill needs at EU level ................................................ 53
Working goup II: Skill needs in the sectors .................................................................... 83
Working goup III: Skill needs in enterprises....................................................................137
Skills for the future: key policy challenges (panel discussion)............................169
Medium-term forecast of occupational skill needs in Europe Alena Zukersteinova
Rob Wilson
4
The Lisbon agenda has emphasised the need for Europe to place more emphasis on anticipating changing skill needs. Globalisation, technological change and demographic developments (including ageing and migration) are posing huge challenges to the whole of Europe, offering both risks and threats to existing jobs, as well as many new opportunities. The need for regular forward looking assessments has been emphasised in the Employment Guidelines. Such results can help to inform active labour market policies relating to training, migration and many other areas, as well as informing individuals about the developing situation. Of course it is not possible to predict the future precisely, but the need to make strategic plans and choices which can influence the future path taken by the economy and labour market is widely accepted. These plans and choices need to be guided by robust labour market information and intelligence based on regular, systematic and quantitative approaches to forecasting and scenario development. Skills are a key part of the infrastructure of the economy, and the choices made by both policy makers and individuals about investment in education and skills can help to determine the path the economy takes.
Many countries are already undertaking this kind of work. The Cedefop Skillsnet project Medium-term forecast of occupational skill needs in Europe, offers for the first time a comprehensive Pan European perspective, providing estimates on a consistent basis for all members of the EU. This opening session will provide an overview of the results from that project, summarising the key findings. These highlight that while many member states face particular problems there are many common features. Globalisation and technological change are expected to continue to have significant impacts on sectoral employment structure and the demands for different types of skills. The continuing shift towards services and the knowledge economy, the catching up process for many countries (shifting patterns of activity and people), implications for occupations and qualifications, including a general increase in the demand for skills with implications for continued investments in skills, education and training are highlighted. At the same time there are indications of polarization, with significant growth in employment in some less skilled areas with implications for Issues of exclusion and job quality.
The results presented represent the most comprehensive and consistent set of skill projections ever produced for Europe. Although there some data problems and questions outstanding, many of the trends identified are quite robust and not sensitive to the detailed data problems nor to the detailed specifications for models used to explain changing patterns of skill demands with industries. This suggests that such projections can provide valuable and robust information to a broad range of users, from individuals making career choices through to policy makers operating at the highest strategic level.
Alena Zukersteinova is a project manager at the European Centre for the Development of Vocational Training (Cedefop) since 2005. She is responsible for the project on skill needs and enterprises. She coordinates the international network on early identification of skill needs ´Skillsnet´. She graduated in 2001 at the University of Economics in Prague, Faculty of Business Administration. Her main research activities are focused on human resource management and development, continuing training in enterprises and anticipation of future skill needs. From 2001 to 2005, she worked at the National Observatory of Employment and Training within the National Training Fund in Prague.
Rob Wilson is a Professorial Fellow and Deputy Director of the Warwick Institute for Employment Research at the University of Warwick in the UK. He leads the Institute’s labour assessment and market forecasting work, although he has researched and published on many other aspects of labour market behaviour, including the changing patterns of demand for and the supply of skills at national and international levels. He has played a leading role in producing ‘Skills in England’ for the LSC since 2002. He is editor and contributor to various other publications in this area including ‘Working futures’ for the SSDA and ‘Projections of occupations and qualifications’ for DfES. Most recently he has lead the Cedefop Skillsnet project on producing ‘Medium-term forecasts of occupational skill needs in Europe’, which for the first time has produced a consistent and comprehensive assessment of employment prospects for the whole of Europe. He has written and edited a number of books, including ‘Employment forecasting in the construction industry’; ‘The national health service and the labour market’; ‘Technical change: the role of scientists and engineers’; and ‘Research and development statistics’. Amongst his professional responsibilities, has been a member of the Medical Workforce Standing Advisory Committee and the Skills Task Force Research Group. He is currently a member of the Migration Advisory Committee set up to advise the UK government on where there are likely to be skill shortages that can be sensibly filled by migrants.
5
21-22 February 2008 Medium-term forecast of occupational skill needs
Skills for Europe's future
Medium-term forecast of occupational skill needs in EuropeAlena ZukersteinovaCedefop
Rob WilsonInstitute for Employment Research, University of Warwick, United Kingdom
21-22 February 2008 Medium-term forecast of occupational skill needs
Skills for Europe's future
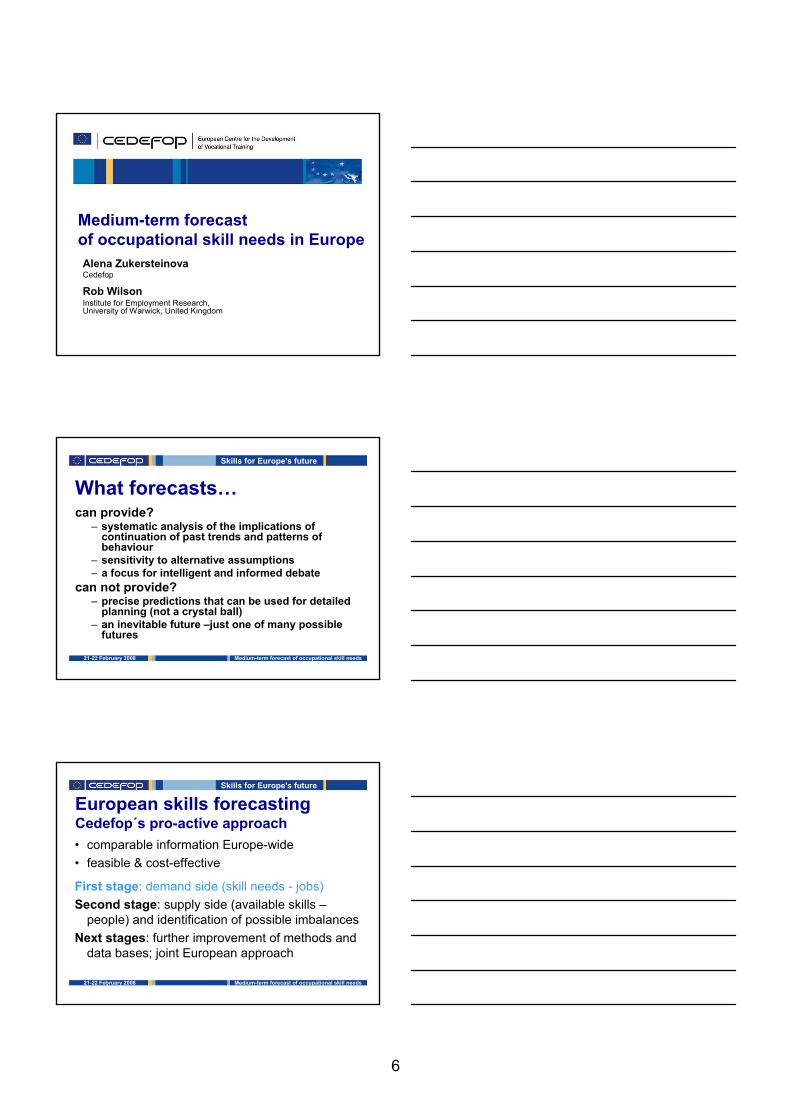
What forecasts…can provide?
– systematic analysis of the implications of continuation of past trends and patterns of behaviour
– sensitivity to alternative assumptions– a focus for intelligent and informed debate
can not provide?– precise predictions that can be used for detailed
planning (not a crystal ball)– an inevitable future –just one of many possible
futures
21-22 February 2008 Medium-term forecast of occupational skill needs
Skills for Europe's future
European skills forecastingCedefop´s pro-active approach• comparable information Europe-wide• feasible & cost-effective
First stage: demand side (skill needs - jobs)Second stage: supply side (available skills –
people) and identification of possible imbalancesNext stages: further improvement of methods and
data bases; joint European approach
6

21-22 February 2008 Medium-term forecast of occupational skill needs
Skills for Europe's future
Medium-term forecast of occupational skill needsObjectives: • consistent pan-European skills projections
using comparable data• new Framework and modular approach• systematic dialogue and discussion
BUT data issues and concerns
21-22 February 2008 Medium-term forecast of occupational skill needs
Skills for Europe's future
In which sectors will employment be growing?
Which occupations will be in demand?
For which qualifications will demand increase or decrease?
What about replacement needs?
This forecast can answer following questions
21-22 February 2008 Medium-term forecast of occupational skill needs
Skills for Europe's future
Team effort
+ INDIVIDUAL COUNTRY EXPERTS
7
21-22 February 2008 Medium-term forecast of occupational skill needs
Skills for Europe's future
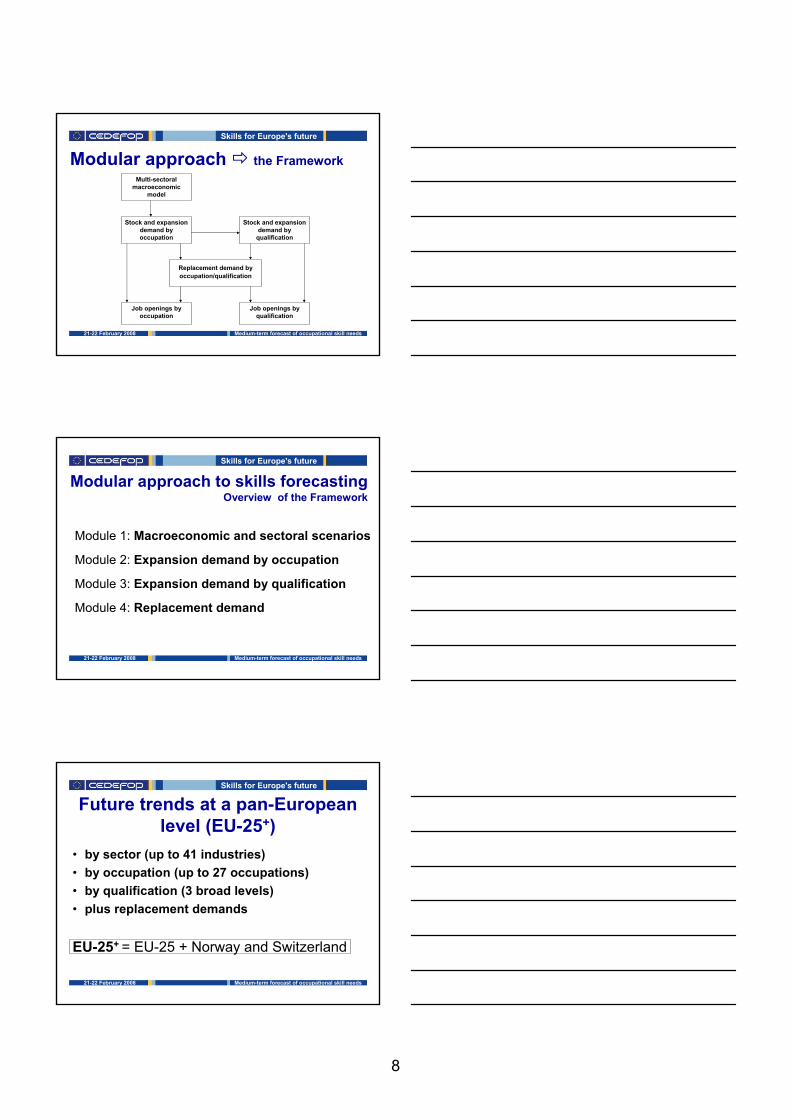
Modular approach the FrameworkMulti-sectoral
macroeconomic model
Stock and expansion demand by occupation
Stock and expansion demand by
qualification
Replacement demand by occupation/qualification
Job openings by occupation
Job openings by qualification
21-22 February 2008 Medium-term forecast of occupational skill needs
Skills for Europe's future
Modular approach to skills forecastingOverview of the Framework
Module 1: Macroeconomic and sectoral scenarios
Module 2: Expansion demand by occupation
Module 3: Expansion demand by qualification
Module 4: Replacement demand
21-22 February 2008 Medium-term forecast of occupational skill needs
Skills for Europe's future
Future trends at a pan-European level (EU-25+)
• by sector (up to 41 industries)• by occupation (up to 27 occupations)• by qualification (3 broad levels)• plus replacement demands
EU-25+ = EU-25 + Norway and Switzerland
8
21-22 February 2008 Medium-term forecast of occupational skill needs
Skills for Europe's future
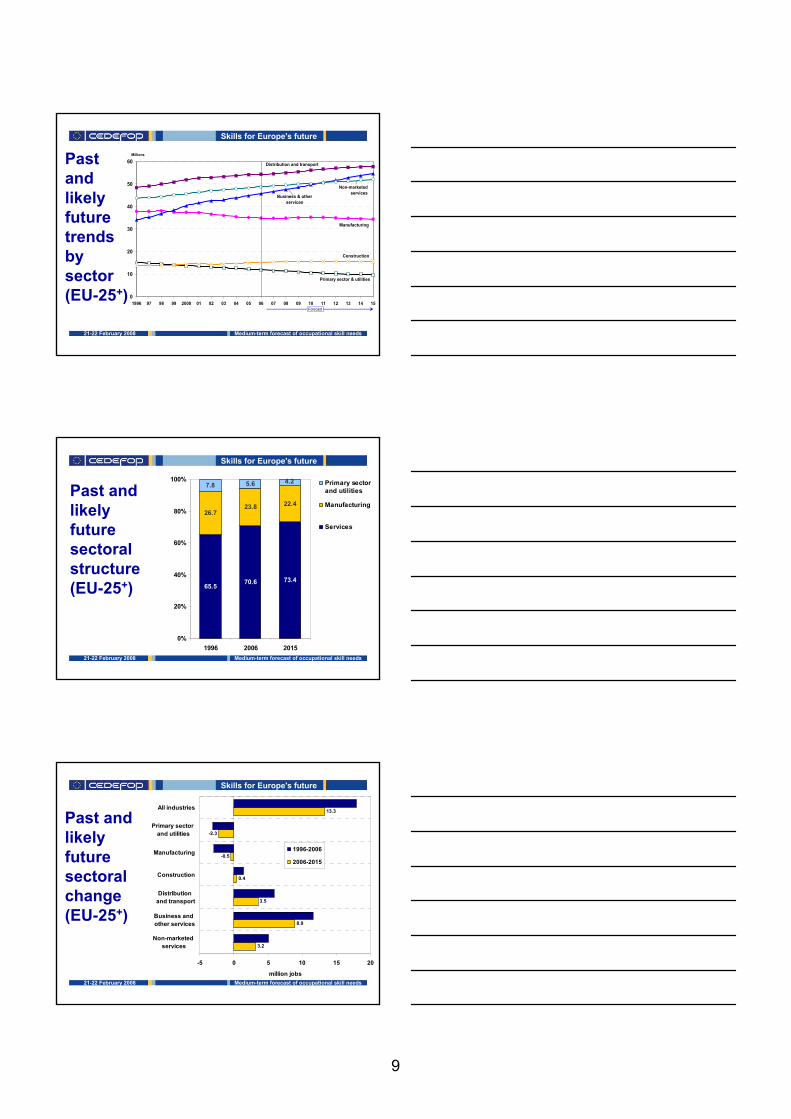
Past and likely future trends by sector(EU-25+) 0
10
20
30
40
50
60
1996 97 98 99 2000 01 02 03 04 05 06 07 08 09 10 11 12 13 14 15
Millions
Primary sector & utilities
Construction
Manufacturing
Business & other services
Non-marketed services
Distribution and transport
Forecast
21-22 February 2008 Medium-term forecast of occupational skill needs
Skills for Europe's future
Past and likely future sectoralstructure (EU-25+) 65.5 70.6 73.4
26.723.8 22.4
7.8 5.6 4.2
0%
20%
40%
60%
80%
100%
1996 2006 2015
Primary sectorand utilities
Manufacturing
Services
21-22 February 2008 Medium-term forecast of occupational skill needs
Skills for Europe's future
Past and likely future sectoralchange (EU-25+)
3.2
8.9
3.5
0.4
-0.5
-2.3
13.3
5.1
11.6
5.9
1.4
-2.9
-3.1
17.9
-5 0 5 10 15 20
Non-marketed services
Business and other services
Distribution and transport
Construction
Manufacturing
Primary sector and utilities
All industries
million jobs
1996-2006
2006-2015
9
21-22 February 2008 Medium-term forecast of occupational skill needs
Skills for Europe's future
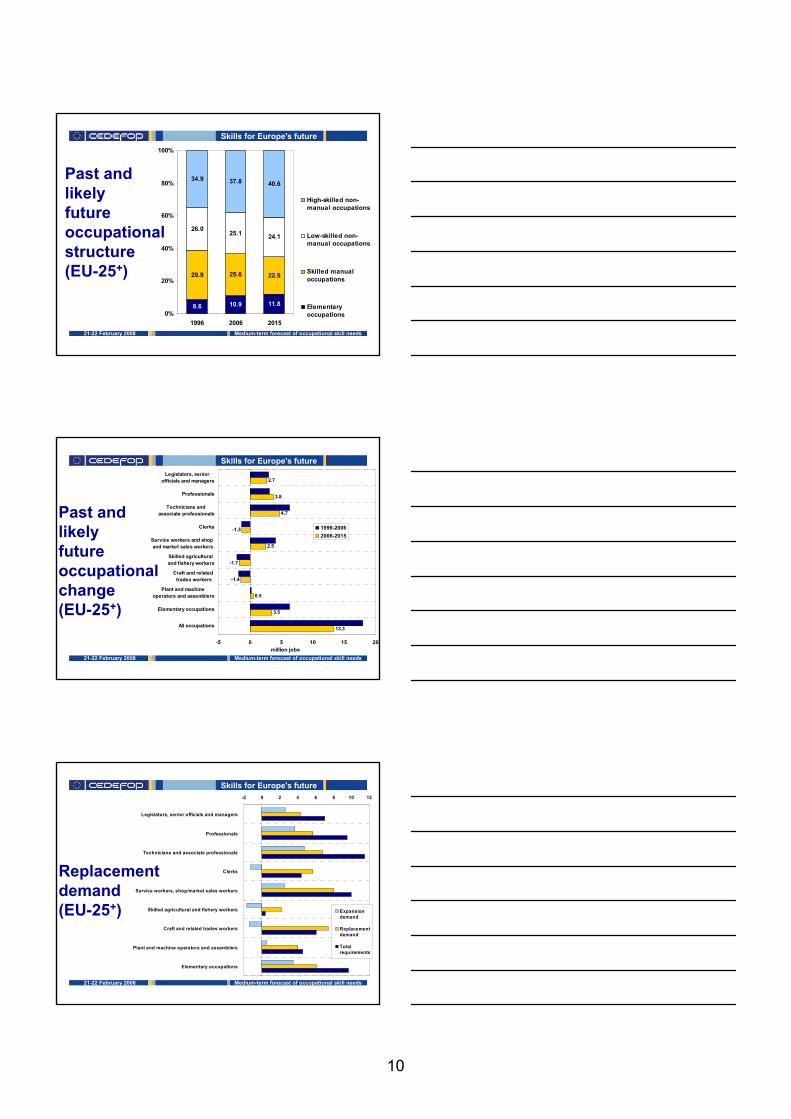
Past and likely future occupationalstructure(EU-25+)
8.6 10.9 11.8
29.9 25.6 22.9
26.0 25.1 24.1
34.9 37.8 40.6
0%
20%
40%
60%
80%
100%
1996 2006 2015
High-skilled non-manual occupations
Low-skilled non-manual occupations
Skilled manualoccupations
Elementaryoccupations
21-22 February 2008 Medium-term forecast of occupational skill needs
Skills for Europe's future
Past and likely future occupationalchange(EU-25+) 3.5
0.5
-1.4
-1.7
2.5
-1.3
4.7
3.8
2.7
18
6
0
-2
-2
4
-1
6
3
3
13.3
-5 0 5 10 15 20
All occupations
Elementary occupations
Plant and machine operators and assemblers
Craft and related trades workers
Skilled agricultural and fishery workers
Service workers and shop and market sales workers
Clerks
Technicians and associate professionals
Professionals
Legislators, senior officials and managers
1996-20062006-2015
million jobs
21-22 February 2008 Medium-term forecast of occupational skill needs
Skills for Europe's future
Replacement demand (EU-25+)
-2 0 2 4 6 8 10 12
Legislators, senior officials and managers
Professionals
Technicians and associate professionals
Clerks
Service workers, shop/market sales workers
Skilled agricultural and fishery workers
Craft and related trades workers
Plant and machine operators and assemblers
Elementary occupations
Expansiondemand
Replacementdemand
Totalrequirements
10

21-22 February 2008 Medium-term forecast of occupational skill needs
Skills for Europe's future
Past and likely future qualificationtrends(EU-25+)
0
50
100
150
200
25019
96
1997
1998
1999
2000
2001
2002
2003
2004
2005
2006
2007
2008
2009
2010
2011
2012
2013
2014
2015
Million jobs
High qualification
Medium qualification
Low qualification
21-22 February 2008 Medium-term forecast of occupational skill needs
Skills for Europe's future
Past and likely future qualificationstructure(EU-25+)
20.9 25.3 29.3
46.248.6
49.9
32.926.2 20.8
0%
20%
40%
60%
80%
100%
1996 2006 2015
Low qualification
Medium qualification
High qualification
21-22 February 2008 Medium-term forecast of occupational skill needs
Skills for Europe's future
Past and likely future qualificationchange(EU-25+)
12.4
9.5
18
13
13
-8
13.3
-8.6
-10 -5 0 5 10 15 20
All qualifications
High qualification
Medium qualification
Low qualification1996-20062006-2015
million jobs
11

21-22 February 2008 Medium-term forecast of occupational skill needs
Skills for Europe's future
Key similarities and differences across countries• Many common trends:
– sectors, occupations, replacement needs, qualifications
• Some differences:– stage of economic development, different
industrial & occupational structures
► process of convergence
21-22 February 2008 Medium-term forecast of occupational skill needs
Skills for Europe's future
Key results: summary• Sectoral change and mobility needs• Growing demand for highly and medium
skilled, losses for low skilled workers• Losses offset by replacement needs• Increasing qualification requirements
across all jobsBUT: danger of polarisation of jobs
21-22 February 2008 Medium-term forecast of occupational skill needs
Skills for Europe's future
Implications for policiesAdaptation of workforce and their skills to
new requirements and structural changeretraining, active LM measures, upskilling,…
Prevention of skill mismatch reducing drop-outs, guidance and counselling, social policies, migration,…
►INVOLVEMENT OF STAKEHOLDERS AND SOCIAL PARTNERS
12
21-22 February 2008 Medium-term forecast of occupational skill needs
Skills for Europe's future
Achievements to date• consistent and comprehensive projections
for EU-25+
• valuable insights for policy makers and others
• sound foundation for further development
► ongoing process: need to improve data and methods
21-22 February 2008 Medium-term forecast of occupational skill needs
Skills for Europe's future
Future prioritiesContinuing dialogue: with country experts
and stakeholdersOvercome data problems: policy support
needed to refine data Further refinement: the models/frameworkComplementary research: forecast of skills
supply and more detailed analysis of skill needs at enterprise and sectoral level
21-22 February 2008 Medium-term forecast of occupational skill needs
Skills for Europe's future
Contact details for further information:
Rob WilsonInstitute for Employment Research, University of [email protected]
Alena [email protected]
Skillsnet: www.trainingvilage.gr/skillsnet
13

European labour market: prospects and challenges Carlo Dell’Aringa
14
Globalisation and economic integration are increasingly affecting the way Europeans live and work and demanding for rapid responses to, and management of, change. Further the rapid ageing of the population is calling into question Europe’s ability to remain competitive and achieve higher employment and economic growth in the future.
A novel feature of the ongoing process of globalisation is that the adjustment challenge now concerns a broader range of jobs than in the past, when mainly unskilled labour and industrial sector were affected. In order to maximise the gains from globalisation, labour markets need to support rapid worker adjustment towards expanding sectors, firms, and occupations. Transferring resources to more productive uses as quickly as possible is an important driver behind increased living standards and sustained growth. This will be mostly needed in next decades when population aging will tend to slow the expansion of GDP per capita in most European countries. Although the opportunities in terms of demand for new services and creation of new jobs should not be neglected, the implications for employment and productivity will be serious.
Facing these challenges requires a radical shift towards the following lines of action: improving policies to cope with structural adjustment problems; strengthening active labour market policies; increasing participation in training for all ages; improving conditions and quality of work.
Europe needs to invest more in human capital. Too many people do not enter or leave the labour market because of a lack of skills, or due to skill mismatches. European countries must improve their ability to anticipate skills needs. This is essential to counter the rapid obsolescence of existing skills and to lessen the social and economic costs of restructuring their economies.
Carlo Dell’Aringa graduated in Politics at the Università Cattolica of Milan (Italy) (laurea, 1963) and in Economics at the University of Oxford (U.K.) (D.Phil, 1970). At present he is Professor of Economics at the Università Cattolica, where he is also Director of the Institute for Labour and Industrial Economics. He has been President of AIEL (Italian Association of Labour Economists) and member of the Executive Committee of EALE (European Association of Labour Economists). He has also been President of AISRI (Italian Association for Industrial Relations) and member of the Executive Committee of IIRA (International Industrial Relations Association). He was a member of the ‘Employment Taskforce’, established by the European Commission in 2003, which produced the ‘Kok Report’. He has been President of ARAN (a state agency for collective bargaining in the public sector) and ISFOL (a public institute for research in the field of vocational training). He is member of the editorial Board of ‘Labour’, and member of the international board of the ‘British Journal of Industrial Relations’.
Carlo Dell’Aringa has published widely in the fields of labour economics and industrial relations. He is the author of books including ‘Labour Relations and Economic Performance’ (with R. Brunetta), and ‘Strategic choices in Reforming Public Service Employment’ (with G. Della Rocca and B. Keller). He has more recently published articles on ‘collective bargaining’ and ‘wage differentials’ in the ‘British Journal of Industrial Relations’ and the ‘Manchester School’.
15

1
EUROPEAN LABOUR MARKET: EUROPEAN LABOUR MARKET: PROSPECTS AND CHALLENGESPROSPECTS AND CHALLENGES
Carlo Dell’Aringa
Paper to be presented at the Cedefop Skillsnet Agora Conference: “Skills for Europe’s future”, 21-22 February 2008 , Thessaloniki, Greece
2
Three challenges for the European labour markets: globalisation, population ageing, and the productivity “gap”
1) Globalisation and economic integration are increasingly affecting the way Europeans live and work.
2) The rapid ageing of the population is calling into question Europe’s ability to remain competitive.
3) The EU has lagged behind the United States in the productivity stakes in the last ten years.
3
GLOBALISATION
Globalisation is sometimes perceived as a source of job losses and growing labour market insecurity.
Nevertheless, history demonstrates that globalisation hold the promise of better living standard for the economy as a whole.
For example according to the OECD Growth Study, a 10 percentage point increase in the ratio of trade to GDP is associated in the long run with a 4% increase in per capita income.
The labour market plays a crucial role in the realisation of the potential gains from globalisation.
The ongoing process of globalisation entails job losses and job gains within sectors, as well as between them.
16

4
The adjustment is not painless and it may have made both employment and wages of the workers involved , more vulnerable.
Globalisation requires mobility to ensure that workers are not trapped in jobs which have no future. In this regard , overly-strict employment protection legislation (EPL) may reduce mobility by constraining firms’ ability to cope with a rapid changing environment.
However a certain degree of employment protection is needed and it may reduce adjustment costs.
Low-skilled workers are a particularly disadvantage group in the face of globalisation.
Improving skill development opportunities for low educated workers is strongly needed..
5
POPULATION AGEING
The second challenge that Europe must face is population ageing.
The working-age population will include an increasingly important share of older people in the age range 55-64 in the next two decades.
At the same time the dependency ratio (the number of people aged 65 years and older relative to those of working age) is foreseen to rise from the current 25% to 40% by 2030, and reach 53% by 2050.
If current trends and policies remain unaltered, annual GDP growth for the EU-25 will fall systematically from 2.4% over the period 2004-10 to only 1.2% between 2030 and 2050.
6
It is projected (UE Commission, 2006) that age-related expenditure will rise by around 4% of GDP up to 2050, representing an increase of 10% in public spending.
As a result , overall public finances risk becoming unsustainable in many countries, there by compromising the future equilibrium of pensions and social security systems in general.
The systems that currently are more successful in supporting active ageing include good levels of general health for older people and reasonably high standard retirement ages; relatively high spending on active labour market policy measures and participation in lifelong learning.
17
7
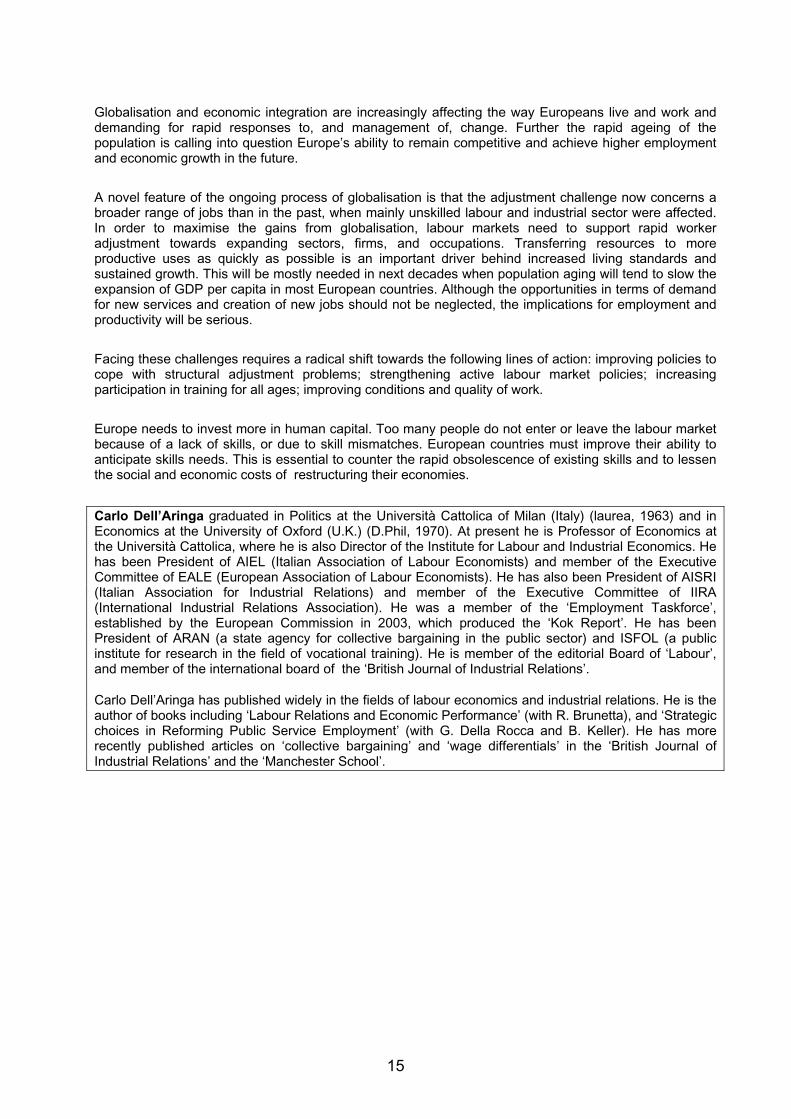
THE PRODUCTIVIT GAP
A further challenge for Europe is the “productivity gap”.
EU has lagged behind the United States in the productivity stakes since the mid 1990s. In addition to that, as we have said, increasing globalisation and the rise of major new economic powers, such as China and India, are also putting pressure on Europe.
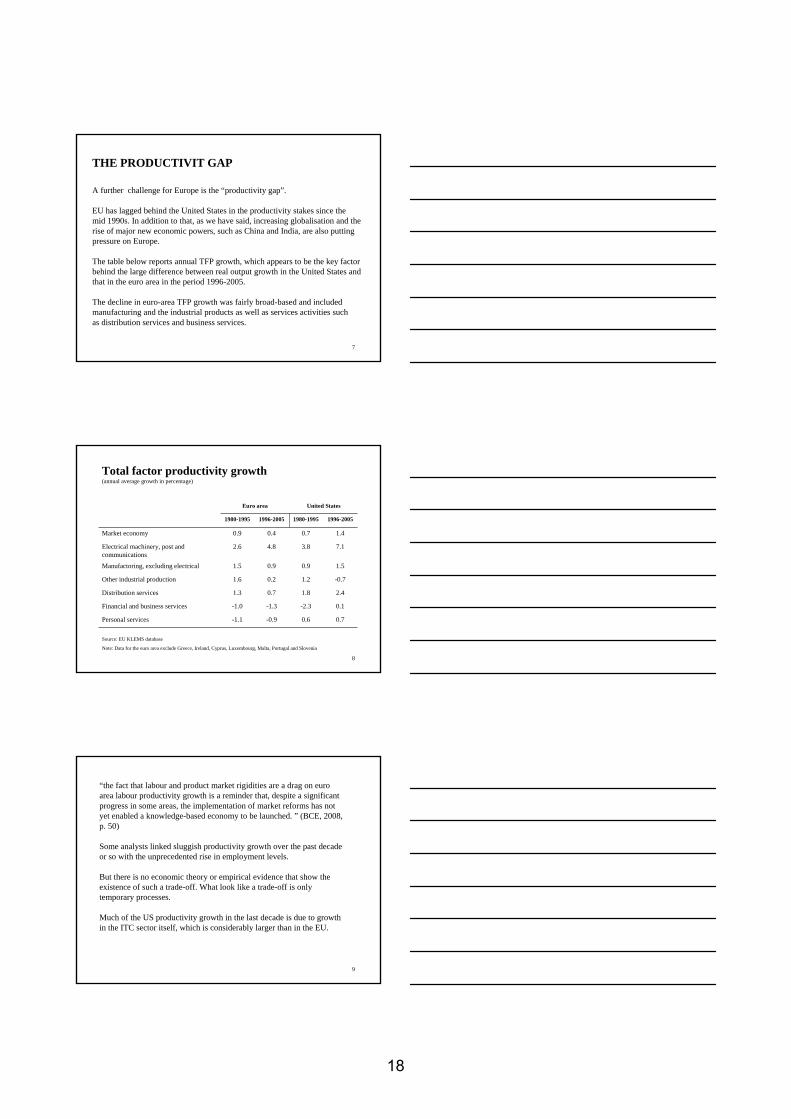
The table below reports annual TFP growth, which appears to be the key factor behind the large difference between real output growth in the United States and that in the euro area in the period 1996-2005.
The decline in euro-area TFP growth was fairly broad-based and included manufacturing and the industrial products as well as services activities such as distribution services and business services.
8
Total factor productivity growth(annual average growth in percentage)
Note: Data for the euro area exclude Greece, Ireland, Cyprus, Luxembourg, Malta, Portugal and Slovenia
Source: EU KLEMS database
0.70.6-0.9-1.1Personal services
0.1-2.3-1.3-1.0Financial and business services
2.41.80.71.3Distribution services
-0.71.20.21.6Other industrial production
1.50.90.91.5Manufactoring, excluding electrical
7.13.84.82.6Electrical machinery, post and communications
1.40.70.40.9Market economy
1996-20051980-19951996-20051980-1995
United StatesEuro area
9
“the fact that labour and product market rigidities are a drag on euro area labour productivity growth is a reminder that, despite a significant progress in some areas, the implementation of market reforms has not yet enabled a knowledge-based economy to be launched. ” (BCE, 2008, p. 50)
Some analysts linked sluggish productivity growth over the past decade or so with the unprecedented rise in employment levels.
But there is no economic theory or empirical evidence that show the existence of such a trade-off. What look like a trade-off is only temporary processes.
Much of the US productivity growth in the last decade is due to growth in the ITC sector itself, which is considerably larger than in the EU.
18

10
After discussing the main features of the three challenges that European labour markets have to face, the question is what has been so far the responsiveness of European member countries to globalisation, population ageing, and the productivity gap ?
The recent implementation reports of the European Employment Strategy indicate three areas of intervention :
1) attracting and retaining more people in employment; 2) increase investment in human capital ; 3) improve adaptability of workers and firms.
Although much has been done , a better response to the ongoing processes is still to be found . Let us briefly examine why.
11
Efforts have been intensified to reach out groups and individuals at the margin of the labour market. Despite this, policies for young people, women and older workers are still not sufficiently developed.
Youth unemployment is a severe problem in many member countries and labour market segmentation to the disadvantage of the young is increasing.
The promotion of female employment and systematic gender mainstreaming are rarely emphasised .
Currently over half of the 55-64 year olds in the EU are inactive, mainly for reasons of retirement but also due to poor health, personal or family responsibilities, or the belief that no work is available. Transition into inactivity for older people is nearly always a path of no return.
Despite the recent improvement , efforts to promote active ageing must still be pursued vigorously. The employment rate for people aged 55-64 is still 6.5 percentage points from the Stockholm target of 50% by 2010.
12
Only a minority of Member States have a comprehensive strategy to invest in human capital throughout the life cycle.
In particular the prevention of early school leaving is progressing slowly : in 2005 6 million young people left education prematurely. Many Member States need to increase their efforts if the EU is to reach its 2010 target of 85% of 22 years olds in the EU having completed at least upper secondary education. Since 200 the figure has moved little from around 77%.
The situation is also worrying in terms of adult participation in lifelong learning
Access to training remains unequal, particularly for older workers, the less educated, those in precarious jobs and workers withy the lowest income. This has a negative impact on the employability of these groups, and hence increases the risk of social exclusion and income inequality.
19

13
Finally, despite the increasing need for adaptable labour markets, improving adaptability of workers and enterprises is the area which shows the weakest implementation policy.
So far Governments have tended to focus on easing labour market regulation for new entrants. This has favoured the development of two-tier labour markets in which the brunt of adjustment to shocks falls on employees under atypical contractual forms .
A more comprehensive approach is necessary to combine flexibility and security in a more integrated approach.
The EU Member States have not made any significant progress on shifting resources from passive to active measures, despite the declared intentions of many governments .
14
In conclusions, efforts have to be intensifies and policy implementation is to improve in all three European employment strategy priorities:attracting and retaining more people in employment, increasing investment in human capital, and improving adaptability of workers and enterprises.
This is needed if we want to improve the responsiveness of European labour markets to the three challenges they have to face: globalisation, population ageing and the productivity gap.
15
References
Denis, C.; Mc Morrow, K.; Roger, W. (2006) Globalisation, trends, issues and macro implications, European Commission, Economic papers, No 254.
ECB, Monthly Bulletin, (2008), January 2008.
European Commission , (2006), Employment in Europe 2006
European Commission, (2007), Employment in Europe 2007
Kok Task Force, (2004) , Jobs, jobs, jobs, European Commission.
OECD, (2007), Employment Outlook.
20

Effects of ageing on European labour supply Ernest Berkhout
21
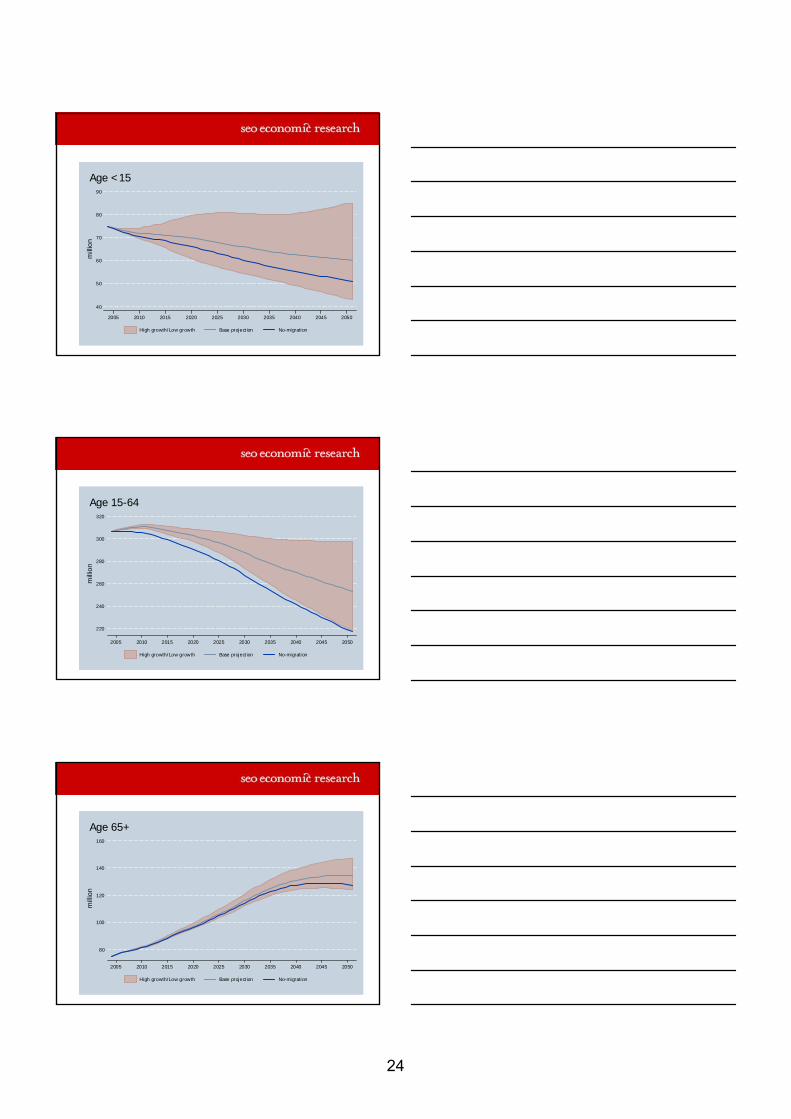
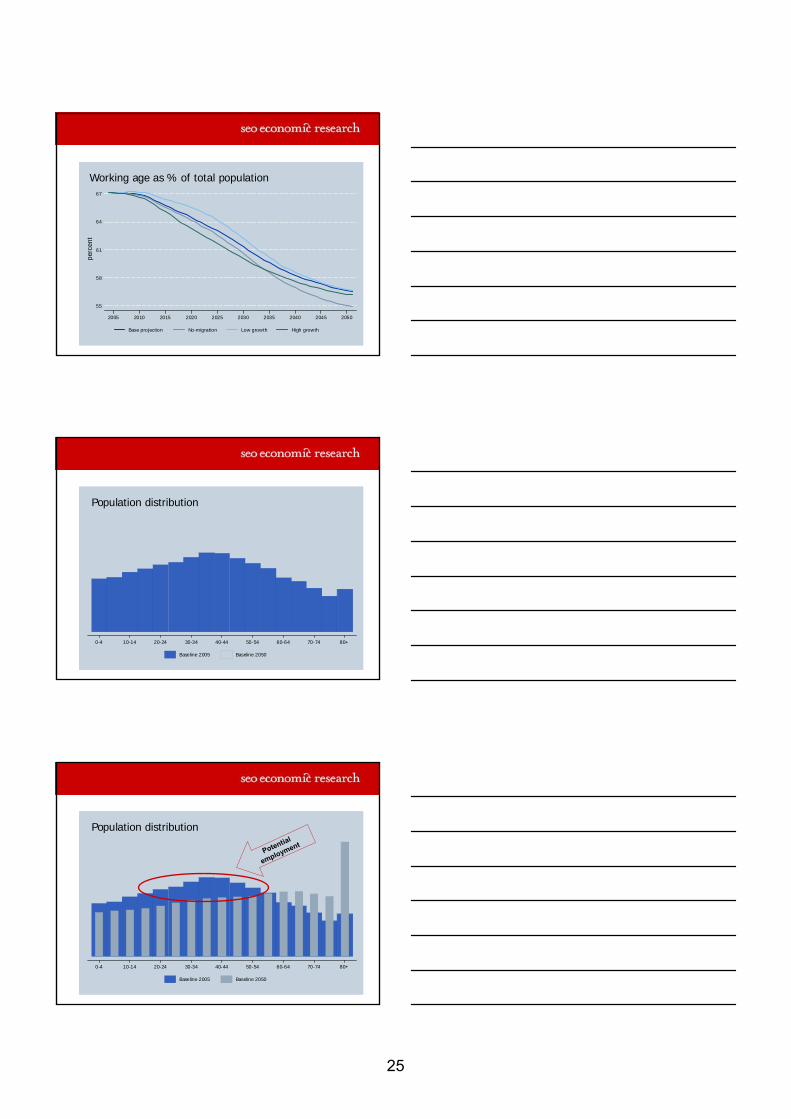
Although age distributions differ between countries, the ageing challenge is apparent everywhere. In the next decades, the average age will increase all over Europe. As a consequence the ratio between the working-age population (age 15-64) and the elderly population will decline, meaning relatively less supply of labour, resulting in a ‘potential employment gap’. Though different in magnitude, the ageing effect is clearly present in all countries. If the EU-25 employment rate would remain at it’s present 63% the average employment level will have decreased by 30 million persons in 2050. This effect is also relevant in short-term perspective, as the major post-war birth cohorts will leave the labour market already in the coming five years.
After discussing possible solutions to close this potential gap, the presentation will focus in more detail on the role of labour migration. Besides the most important, this is also the most disputed variable. This will tackle some common misperceptions, hoping to bring this debate to a more scientific level.
Ernest Berkhout graduated from Utrecht University in the field of Social & Institutional Economics. He also participated for over two years in a international research project comparing EU and US labour market determinants, conducted by prof. Schettkat (Utrecht University) and prof. Freeman (NBER/Harvard). In 1999 he started working at SEO Economic Research, where he is now employed as senior researcher in the Labour & Education Economics department.
His main interests are:
• international, sectoral and individual differences in wages and education;
• ageing, labour force participation, temporary work & labour migration;
• higher education & the transition to the labour market;
• econometric modelling of tourism.
More info on http://www.seo.nl/en/organisation/employees/arbeidenkennis/97.html.
22

www.seo.nl - [email protected] - +31 20 525 1630
Mind the gap!General effects of ageing on labour supply and the possible
role of labour migration
Skillsnet conference, CedefopThessaloniki, 21/22 feb. 2008
Ernest Berkhout
ContentsEuropean trends 2005-2050
ageing populationmigrating labour
Consequences for the labour marketpotential ‘employment gap’who suffers?what can be done?
Possible role of migrationpublic misconceptions on ‘migration’labour migration & skills
AgeingFour projections Eurostat, 2005-2050
baseline projectionlow growthhigh growthno migration
based onfertility rate, death ratemigration rate
23
40
50
60
70
80
90
mill
ion
2005 2010 2015 2020 2025 2030 2035 2040 2045 2050
High growth/Low growth Base projection No-migration
Age <15
jongeren
220
240
260
280
300
320
mill
ion
2005 2010 2015 2020 2025 2030 2035 2040 2045 2050
High growth/Low growth Base projection No-migration
Age 15-64
jongeren
80
100
120
140
160
mill
ion
2005 2010 2015 2020 2025 2030 2035 2040 2045 2050
High growth/Low growth Base projection No-migration
Age 65+
24
55
58
61
64
67
perc
ent
2005 2010 2015 2020 2025 2030 2035 2040 2045 2050
Base projection No-migration Low growth High growth
Working age as % of total population
0-4 10-14 20-24 30-34 40-44 50-54 60-64 70-74 80+
Baseline 2005 Baseline 2050
Population distribution
0-4 10-14 20-24 30-34 40-44 50-54 60-64 70-74 80+
Baseline 2005 Baseline 2050
Population distribution
Potential
employment
25
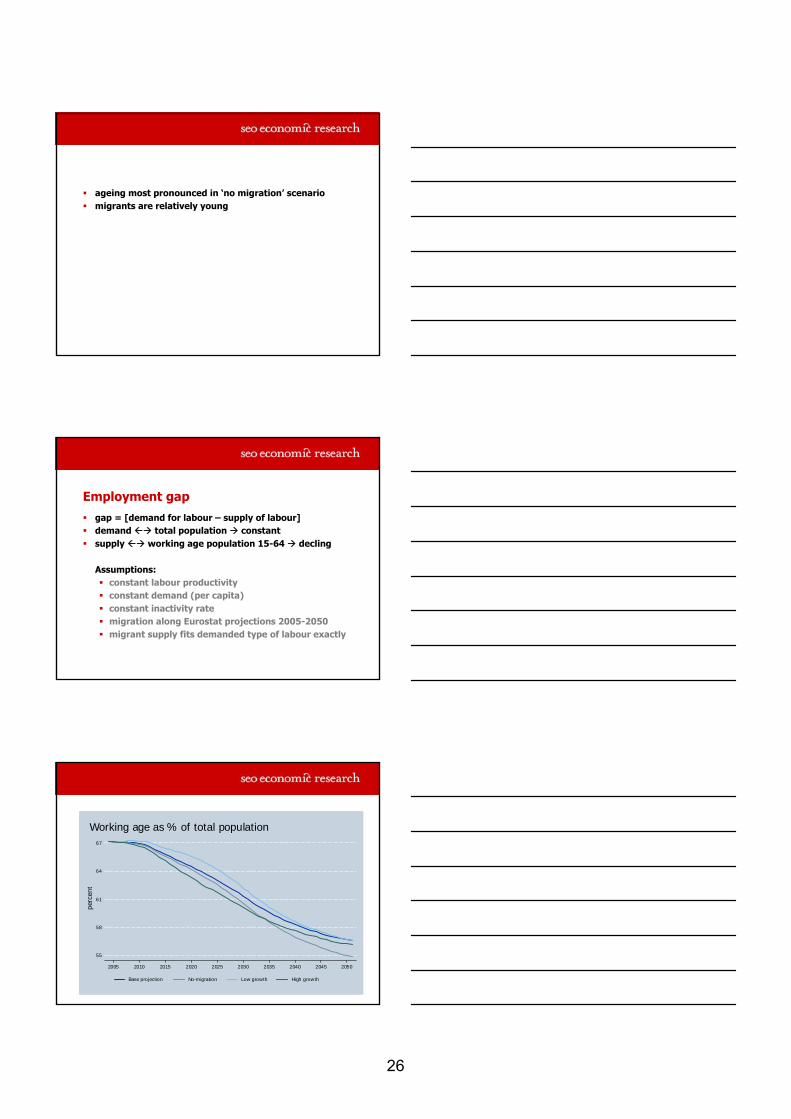
ageing most pronounced in ‘no migration’ scenario migrants are relatively young
Employment gapgap = [demand for labour – supply of labour]demand total population constantsupply working age population 15-64 decling
Assumptions:constant labour productivityconstant demand (per capita)constant inactivity ratemigration along Eurostat projections 2005-2050migrant supply fits demanded type of labour exactly
55
58
61
64
67
perc
ent
2005 2010 2015 2020 2025 2030 2035 2040 2045 2050
Base projection No-migration Low growth High growth
Working age as % of total population
26

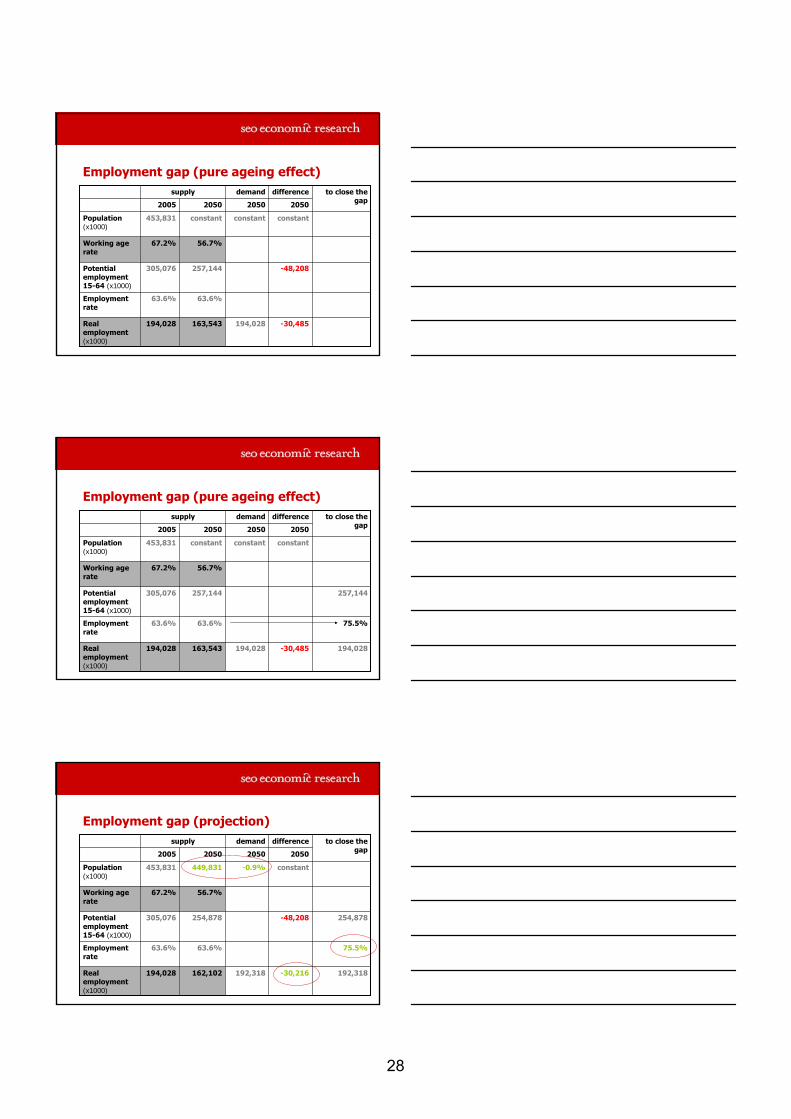
Employment gap (pure ageing effect)
2050
difference to close the gap
demandsupply
194,028Real employment (x1000)
63.6%Employment rate
305,076Potential employment 15-64 (x1000)
67.2%Working age rate
453,831Population (x1000)
205020502005
Employment gap (pure ageing effect)
2050
difference to close the gap
demandsupply
163,543194,028Real employment (x1000)
63.6%63.6%Employment rate
257,144305,076Potential employment 15-64 (x1000)
56.7%67.2%Working age rate
constant453,831Population (x1000)
205020502005
Employment gap (pure ageing effect)
2050
difference to close the gap
demandsupply
194,028163,543194,028Real employment (x1000)
63.6%63.6%Employment rate
257,144305,076Potential employment 15-64 (x1000)
56.7%67.2%Working age rate
constantconstant453,831Population (x1000)
205020502005
27
Employment gap (pure ageing effect)
-30,485
-48,208
constant
2050
difference to close the gap
demandsupply
194,028163,543194,028Real employment (x1000)
63.6%63.6%Employment rate
257,144305,076Potential employment 15-64 (x1000)
56.7%67.2%Working age rate
constantconstant453,831Population (x1000)
205020502005
Employment gap (pure ageing effect)
-30,485
constant
2050
difference to close the gap
demandsupply
194,028
75.5%
257,144
194,028163,543194,028Real employment (x1000)
63.6%63.6%Employment rate
257,144305,076Potential employment 15-64 (x1000)
56.7%67.2%Working age rate
constantconstant453,831Population (x1000)
205020502005
Employment gap (projection)
-30,216
-48,208
constant
2050
difference to close the gap
demandsupply
192,318
75.5%
254,878
192,318162,102194,028Real employment (x1000)
63.6%63.6%Employment rate
254,878305,076Potential employment 15-64 (x1000)
56.7%67.2%Working age rate
-0.9%449,831453,831Population (x1000)
205020502005
28

Employment gap
76.0%36,972High growth
75.4%25,915Low growth
77.7%30,904No migration scenario
75.5%30,216Baseline growth
75.5%30,485Ageing effect only
Employment rate needed to close the gap
Employment gap (x1000 persons)
But…labour productivity will riseconsiderable differences within EU25closing employment gap ≠ solving all ageing problems!
rate 65+/65- still higherfinancing pension schemeshigher demand for health & recreation
so: figures should only be treated as indicative!
Who suffers?countries with older population….. and low net migration
(because migrants are mostly 15-64)
29
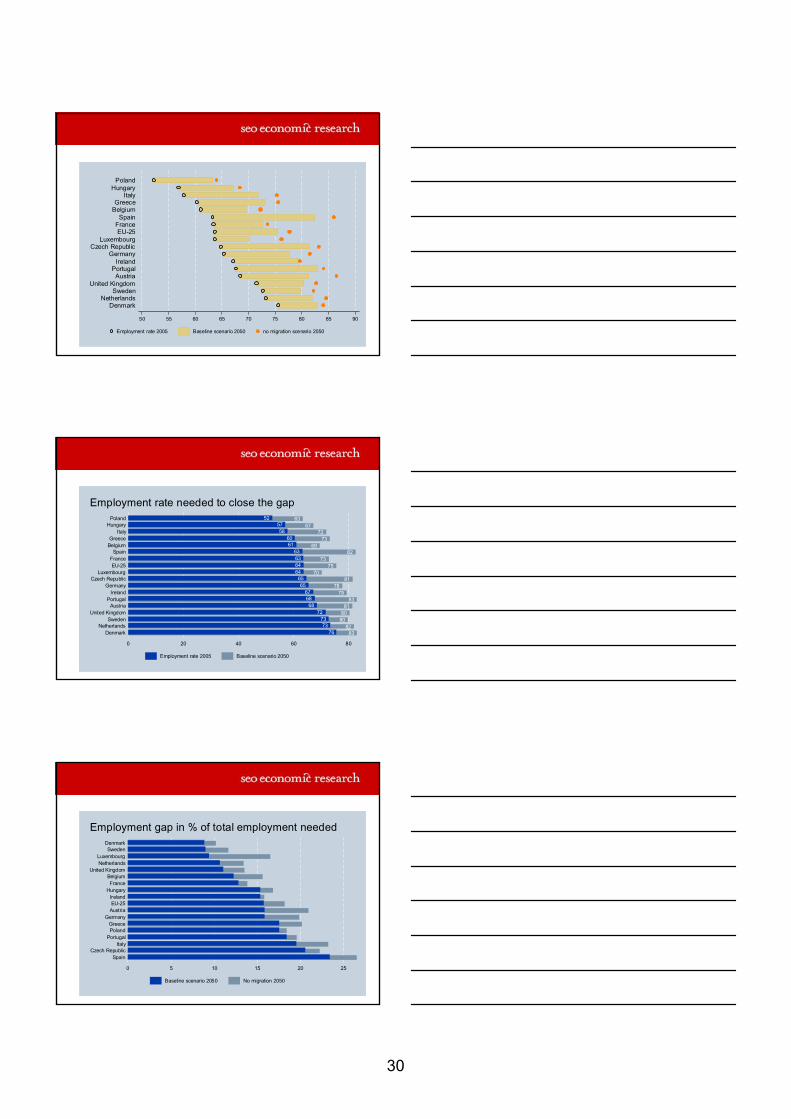
PolandHungary
ItalyGreece
BelgiumSpain
FranceEU-25
LuxembourgCzech Republic
GermanyIreland
PortugalAustria
United KingdomSweden
NetherlandsDenmark
50 55 60 65 70 75 80 85 90
Employment rate 2005 Baseline scenario 2050 no migration scenario 2050
83768273
807380728168
83687967
78658165
70647564
73638263
69617360
72586757
6352
0 20 40 60 80
DenmarkNetherlands
SwedenUnited Kingdom
AustriaPortugal
Ireland
GermanyCzech Republic
LuxembourgEU-25
France
SpainBelgiumGreece
ItalyHungary
Poland
Employment rate 2005 Baseline scenario 2050
83768273
807380728168
83687967
78658165
70647564
73638263
69617360
72586757
6352
0 20 40 60 80
DenmarkNetherlands
SwedenUnited Kingdom
AustriaPortugal
IrelandGermany
Czech RepublicLuxembourg
EU-25FranceSpain
BelgiumGreece
ItalyHungary
Poland
Employment rate needed to close the gap
Employment rate 2005 Baseline scenario 2050
0 5 10 15 20 25
SpainCzech Republic
ItalyPortugalPolandGreece
GermanyAustriaEU-25Ireland
HungaryFrance
BelgiumUnited Kingdom
NetherlandsLuxembourg
SwedenDenmark
Employment gap in % of total employment needed
Baseline scenario 2050 No migration 2050
30
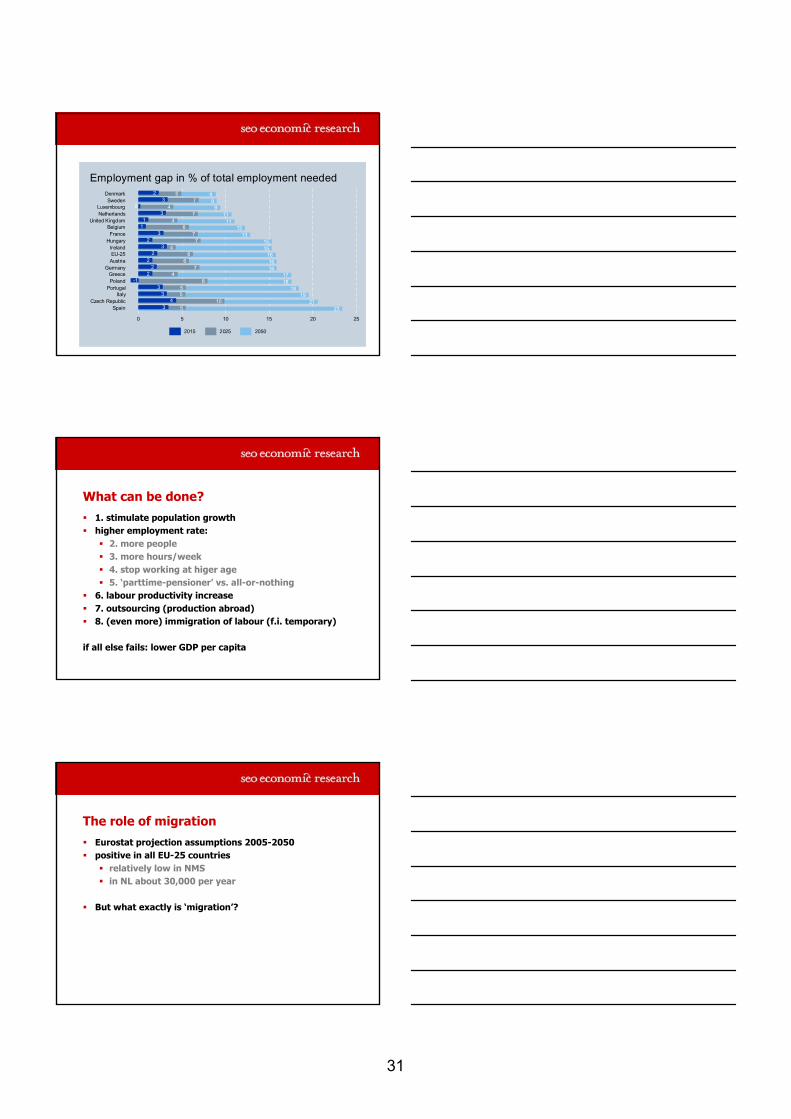
235321104
19531853
188-11742
16721662
166215431572
13731261
11411173
940973
952
0 5 10 15 20 25
SpainCzech Republic
ItalyPortugalPolandGreece
GermanyAustriaEU-25Ireland
HungaryFrance
BelgiumUnited Kingdom
NetherlandsLuxembourg
SwedenDenmark
Employment gap in % of total employment needed
2015 2025 2050
What can be done?1. stimulate population growthhigher employment rate:
2. more people3. more hours/week4. stop working at higer age5. ‘parttime-pensioner’ vs. all-or-nothing
6. labour productivity increase7. outsourcing (production abroad)8. (even more) immigration of labour (f.i. temporary)
if all else fails: lower GDP per capita
The role of migrationEurostat projection assumptions 2005-2050positive in all EU-25 countries
relatively low in NMSin NL about 30,000 per year
But what exactly is ‘migration’?
31
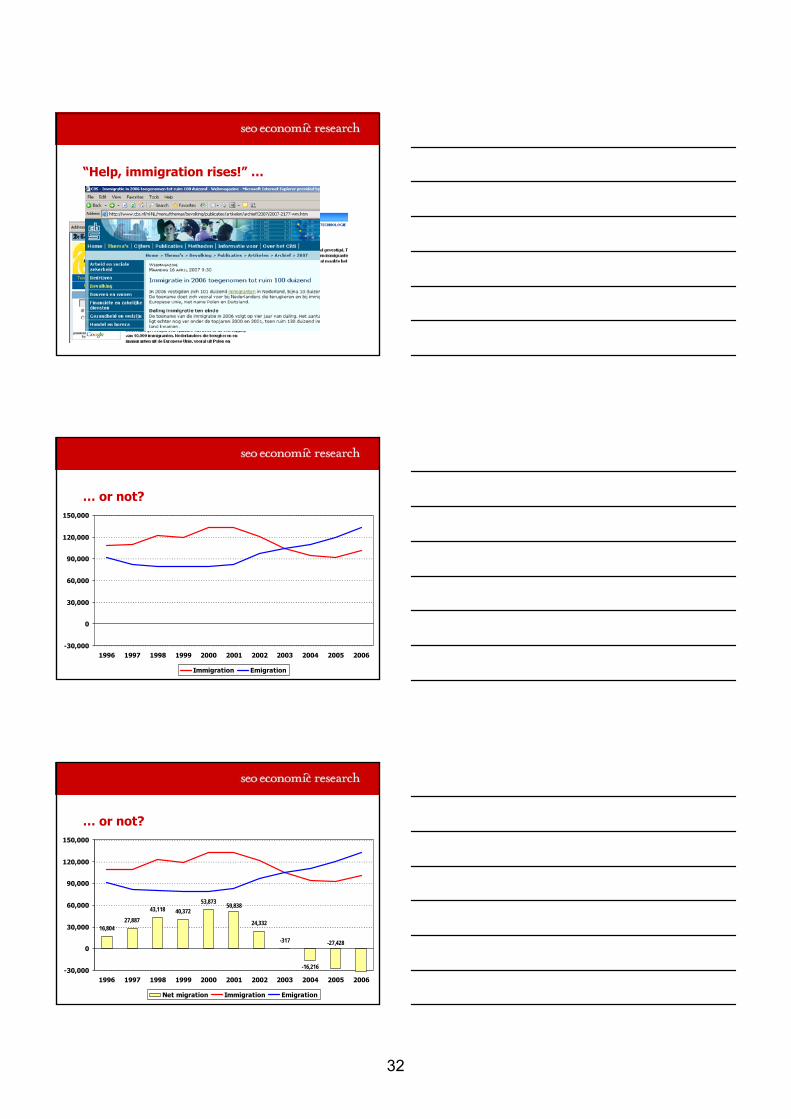
“Help, immigration rises!” …
… or not?
-30,000
0
30,000
60,000
90,000
120,000
150,000
1996 1997 1998 1999 2000 2001 2002 2003 2004 2005 2006
Immigration Emigration
… or not?
16,80427,887
43,118 40,37253,873
24,332
-317
-16,216
50,838
-27,428
-30,000
0
30,000
60,000
90,000
120,000
150,000
1996 1997 1998 1999 2000 2001 2002 2003 2004 2005 2006
Net migration Immigration Emigration
32
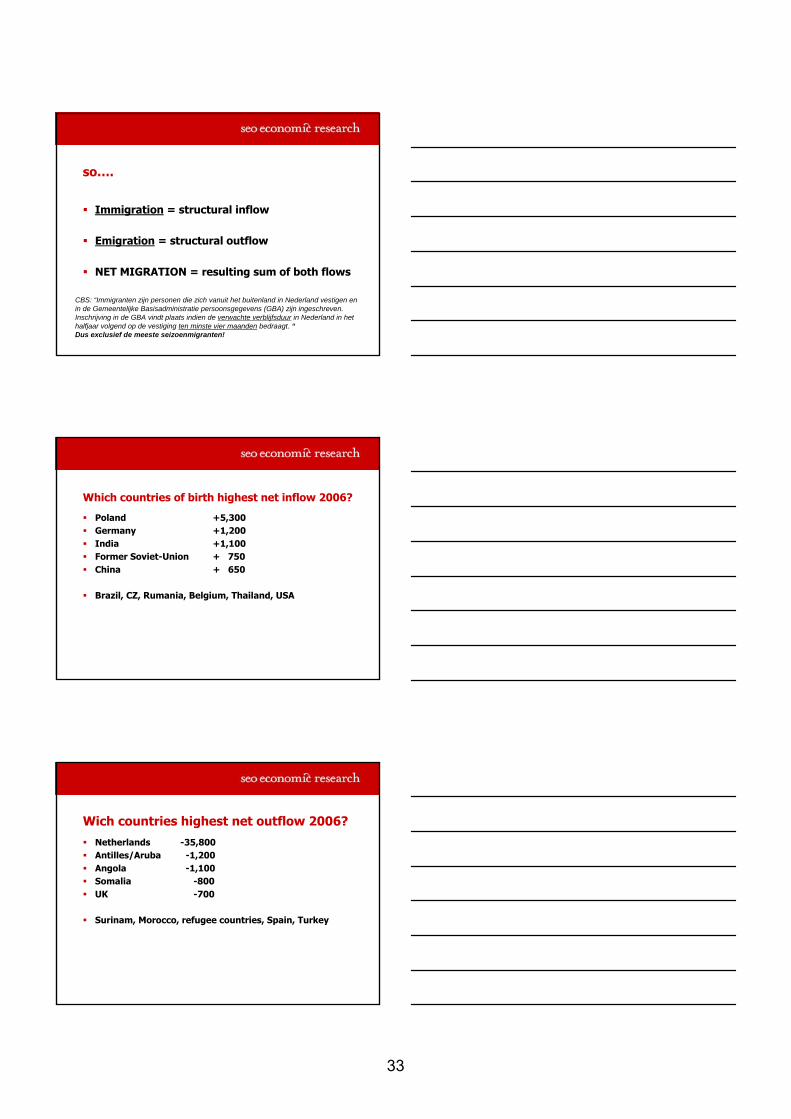
so….
Immigration = structural inflow
Emigration = structural outflow
NET MIGRATION = resulting sum of both flows
CBS: “Immigranten zijn personen die zich vanuit het buitenland in Nederland vestigen en in de Gemeentelijke Basisadministratie persoonsgegevens (GBA) zijn ingeschreven. Inschrijving in de GBA vindt plaats indien de verwachte verblijfsduur in Nederland in het halfjaar volgend op de vestiging ten minste vier maanden bedraagt. “Dus exclusief de meeste seizoenmigranten!
Which countries of birth highest net inflow 2006?
Poland +5,300Germany +1,200India +1,100Former Soviet-Union + 750China + 650
Brazil, CZ, Rumania, Belgium, Thailand, USA
Wich countries highest net outflow 2006?Netherlands -35,800Antilles/Aruba -1,200Angola -1,100Somalia -800UK -700
Surinam, Morocco, refugee countries, Spain, Turkey
33
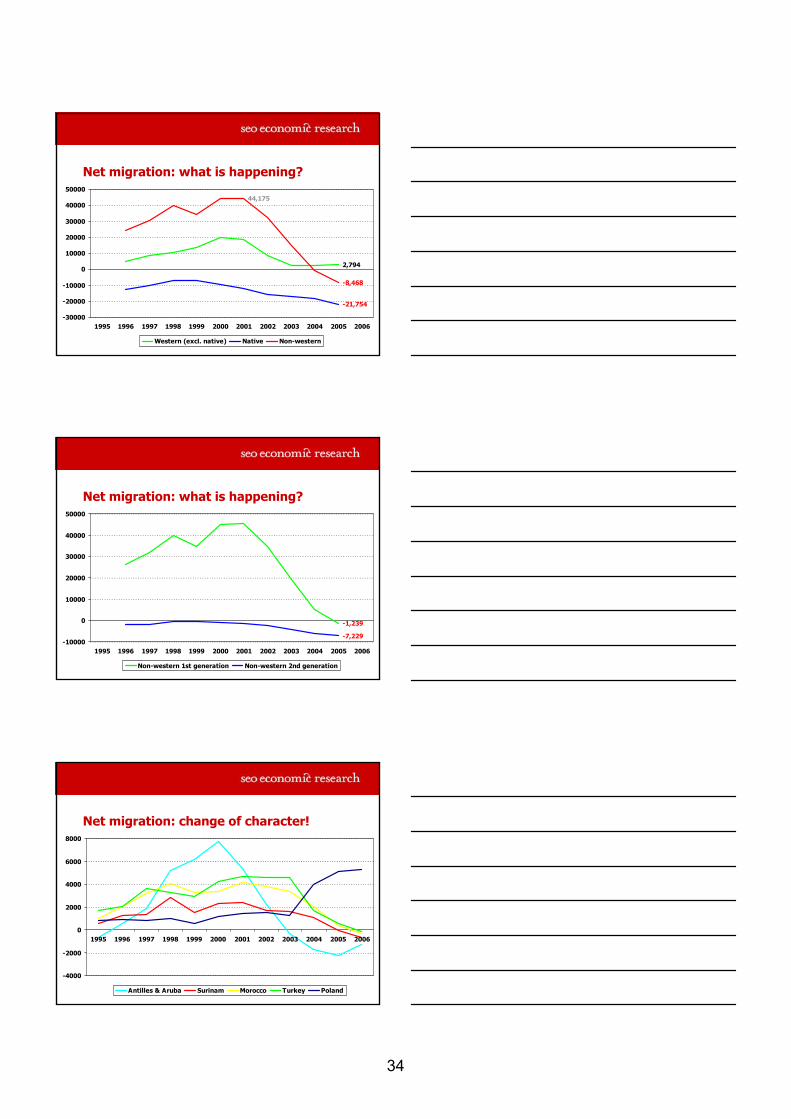
Net migration: what is happening?
2,794
-21,754
44,175
-8,468
-30000
-20000
-10000
0
10000
20000
30000
40000
50000
1995 1996 1997 1998 1999 2000 2001 2002 2003 2004 2005 2006
Western (excl. native) Native Non-western
Net migration: what is happening?
-1,239
-7,229-10000
0
10000
20000
30000
40000
50000
1995 1996 1997 1998 1999 2000 2001 2002 2003 2004 2005 2006
Non-western 1st generation Non-western 2nd generation
Net migration: change of character!
-4000
-2000
0
2000
4000
6000
8000
1995 1996 1997 1998 1999 2000 2001 2002 2003 2004 2005 2006
Antilles & Aruba Surinam Morocco Turkey Poland
34

Immigrants & labouron average:
higher unemploymentmore temporary jobsnet migration 2004 was 0.3-1.5% of populationbut rising considerably in Western Europe
bi-polar distribution (USA, Can, CH, NZ, France, Sweden)two types of migrants?
Immigrants & skill groups
Source: L. M. Kahn, ‘Immigration, skills and the labour market’’, Journal of Population Economics, 2004
Immigrants & skill groups
JapanTurkeyPolandHungaryItalyCzech RepublicSpainPortugalDenmarkNetherlandsUnited KingdomBelgiumIrelandFranceGermanySwedenAustriaUnited StatesCanadaSwitzerlandLuxembourg
0 10 20 30 40 50
among low-skilled among high-skilled country average
% foreign born
Source: OECD (Database on immigrants & expatriates, 2005)
35
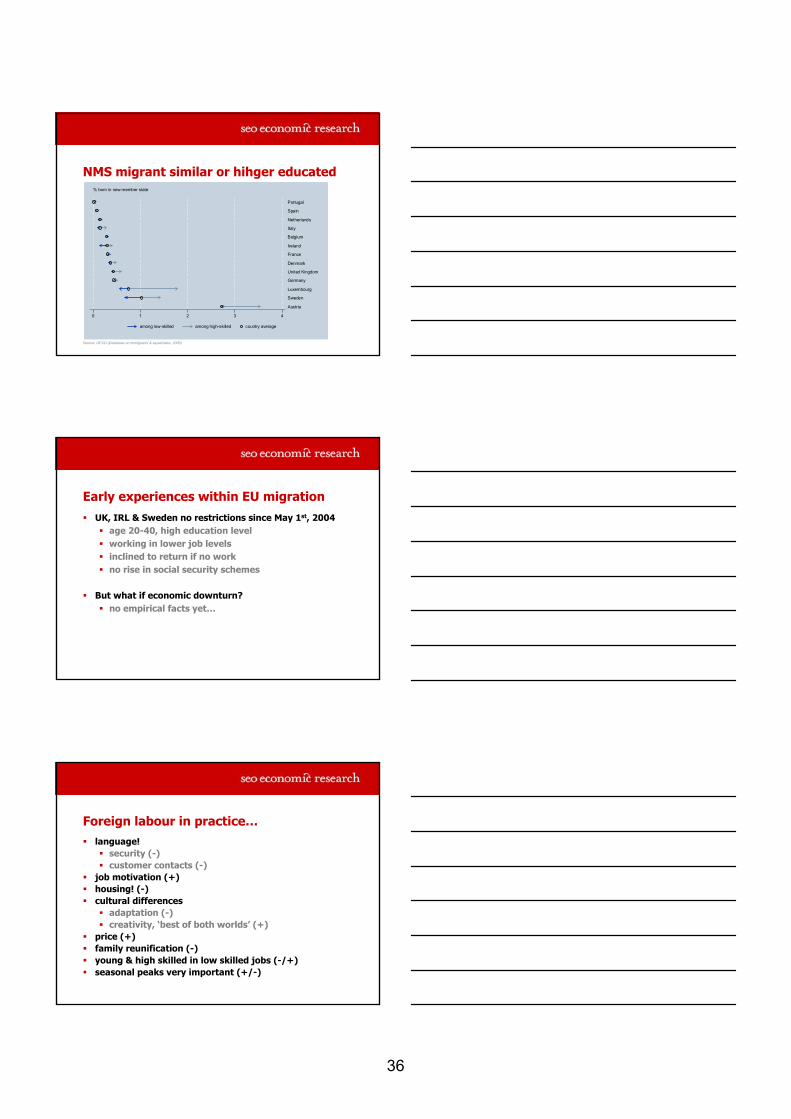
NMS migrant similar or hihger educated
Source: OECD (Database on immigrants & expatriates, 2005)
Portugal
Spain
Netherlands
Italy
Belgium
Ireland
France
Denmark
United Kingdom
Germany
Luxembourg
Sweden
Austria
0 1 2 3 4
among low-skilled among high-skilled country average
% born in new member state
Early experiences within EU migrationUK, IRL & Sweden no restrictions since May 1st, 2004
age 20-40, high education levelworking in lower job levelsinclined to return if no workno rise in social security schemes
But what if economic downturn?no empirical facts yet…
Foreign labour in practice…language!
security (-)customer contacts (-)
job motivation (+)housing! (-)cultural differences
adaptation (-)creativity, ‘best of both worlds’ (+)
price (+)family reunification (-)young & high skilled in low skilled jobs (-/+)seasonal peaks very important (+/-)
36

…and possible solutionslanguage
Swedish nurses: language course in Polandhousing
commitment tempwork agencies-communalitiesfight illegal labour
cultural differences…
pricewill rise inevitably
family reunificationless likely then before, distances in EU small
www.seo.nl - [email protected] - +31 20 525 1630
Mind the gap!General effects of ageing on labour supply and the possible
role of labour migration
Skillsnet conference, CedefopThessaloniki, 21/22 feb. 2008
Ernest Berkhout
37

Beyond skills: banal creativity and spontaneity in a learning intensive society Riel Miller
38
The relationship between knowledge and wealth is often equated to the relationship between certified skills and paid employment in the form of a “job”. As everyone knows this is a limited way of defining both what people know how to do and the value added by people’s efforts. Considerable attention has been paid to different ways of accounting for broader conceptualisations but largely bounded by the institutions, rules and norms of the existing industrial system. Of course the existing industrial system, that includes services subject to the organisational logic of hierarchical specialisation (e.g. division of conception and execution) and scale economies (e.g. mass-standardisation), is highly dynamic. Tracking these shifting forms of skill input and value-added output is a major task. On that can be reasonably based on models that assume continuity between the past and future. This presentation, however, attempts to work on the basis of an assumption that continuity may not hold. If the world is in fact non-ergodic then it is logically necessary to assume that there will be “change in the conditions of change”. The imaginary “learning intensive society” and the model it rests on offer one way of illustrating that there can be changes in the conditions of change in the relationship between knowledge and wealth. This outcome scenario, projected into the future without reference to path, probability or desirability, generates a discontinuous picture of society that can then be contrasted with current anticipatory assumptions. As a result decision makers are able to make the images of the future that are so often implicit in their choices more explicit and even call some of these decision critical assumptions into question.
Riel Miller is a specialist in long-run strategic thinking. For over two decades his work has concentrated on how to assess and direct the potential for socio-economic transformation in the private and public sectors. See: www.rielmiller.com.
Born in Canada in 1957, he holds a Ph.D. in Economics. He started his career as a professional economist in the early 1980s at the Organisation for Economic Co-operation and Development’s Economics and Statistics Directorate. From the mid 1980s up until 1994 he worked in four different areas of the Ontario Government: the Legislature, the Ministry of Colleges and Universities, the Ministry of Finance, and the Ministry of Economic Development and Trade. At the beginning of 1995 Professor Miller returned full-time to the OECD as a Principal Administrator in the International Futures Programme. In 2005 he left the OECD to establish an independent consultancy, XperidoX: Futures Consulting, Paris.
He is currently also a faculty member at the Masters in Public Affairs, Institut de Sciences Politique (Sciences-Po), Paris, France; Visiting Senior Fellow at the Danish Technological Institute, Denmark; an Associate at Demos, UK; and a Member of the Board of the World Futures Studies Federation.
39

Beyond Skills: banal creativity and spontaneity in a learning intensive society
Riel Millerxperidox(DRAFT)
CEDEFOP, Thessaloniki, February 21-22, 2008Photo credit: Mark Schacter,
www.luxetveritas.ca
Riel Miller, xperidox: futures consulting, 2008
Changed historical circumstances: imagining a learning intensive society
Riel Miller, xperidox: futures consulting, 2008
Macro-level definition of the LIS
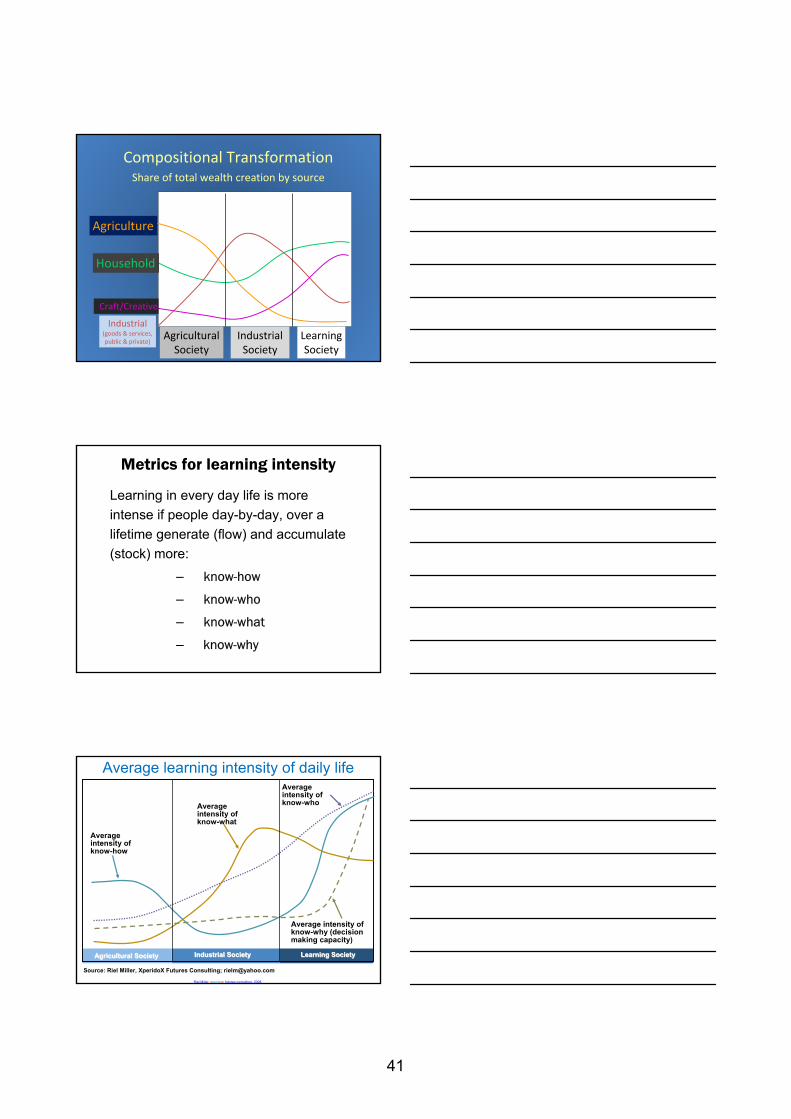
Transition scale societal change involves:• Compositional change in the weight of
different sources of wealth creation… but what are other sources of wealth?
• An increase in the society wide average learning intensity of every day activity… but what is a more learning intensive
society?
40
Industrial(goods & services,public & private)
Craft/Creative
Household
Agriculture
AgriculturalSociety
IndustrialSociety
LearningSociety
Compositional TransformationShare of total wealth creation by source
Metrics for learning intensity
Learning in every day life is more intense if people day-by-day, over a lifetime generate (flow) and accumulate (stock) more:
– know-how
– know-who
– know-what
– know-why
Riel Miller, xperidox: futures consulting, 2008
Average learning intensity of daily life
Source: Riel Miller, XperidoX Futures Consulting; [email protected]
Average intensity of know-what
Average intensity of know-how
Average intensity of know-who
Average intensity of know-why (decision making capacity)
Agricultural SocietyAgricultural Society Industrial SocietyIndustrial Society Learning SocietyLearning Society
41
Riel Miller, xperidox: futures consulting, 2008
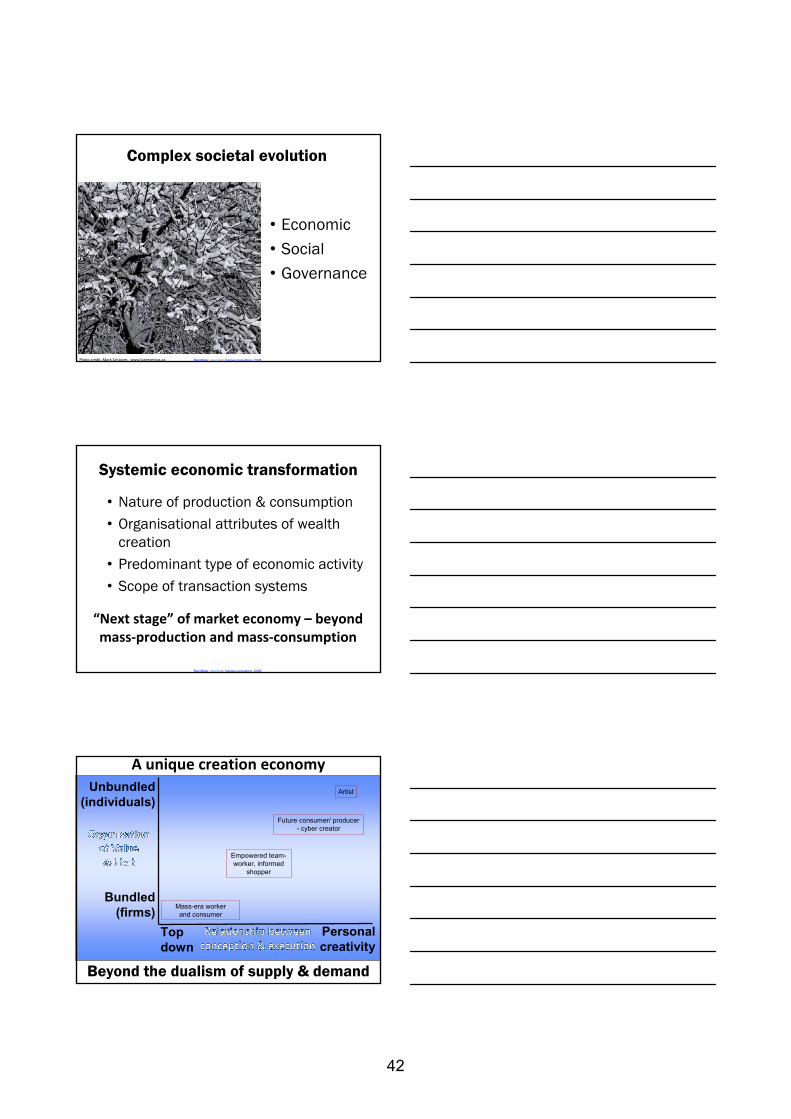
Complex societal evolution
• Economic • Social• Governance
Photo credit: Mark Schacter, www.luxetveritas.ca
Riel Miller, xperidox: futures consulting, 2008
Systemic economic transformation
“Next stage” of market economy – beyond mass‐production and mass‐consumption
• Nature of production & consumption• Organisational attributes of wealth
creation• Predominant type of economic activity• Scope of transaction systems
Unbundled (individuals)
Top down
Personal creativity
Bundled (firms)
A unique creation economy
Mass-era workerand consumer
Empowered team-worker, informed
shopper
Artist
Future consumer/ producer- cyber creator
Beyond the dualism of supply & demand
42

Riel Miller, xperidox: futures consulting, 2008
Post-industrial economy
Five changes:1. The preponderant source of wealth is no longer
industrial (tangible or intangible);2. The primary source of productivity increases
is learning by doing, i.e. experience that allows for refinement of taste (self-knowledge);
3. Unique creation is local;4. Ideas are global; and 5. Tangibles are cheap (food, manufactured goods,
industrial services).
Riel Miller, xperidox: futures consulting, 2008
The cornerstone of the Physiocraticdoctrine was François Quesnay's (1759, 1766) axiom that only agriculture yielded a surplus − what he called a produit net(net product). Manufacturing, the Physiocrats argued, took up as much value as inputs into production as it created in output, and consequently created no net product. http://cepa.newschool.edu/het/schools/physioc.htm
Riel Miller, xperidox: futures consulting, 2008
Teasing the imagination: tools for unique creation
43
Riel Miller, xperidox: futures consulting, 2008
Riel Miller, xperidox: futures consulting, 2008
Riel Miller, xperidox: futures consulting, 2008
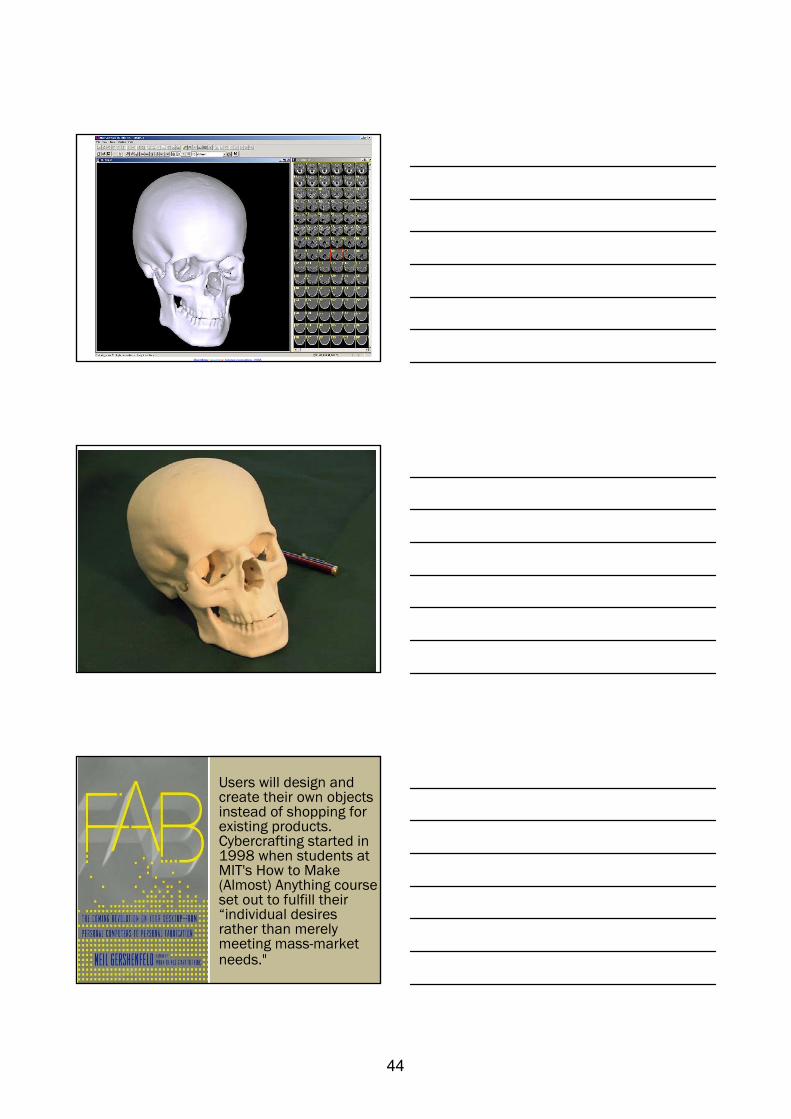
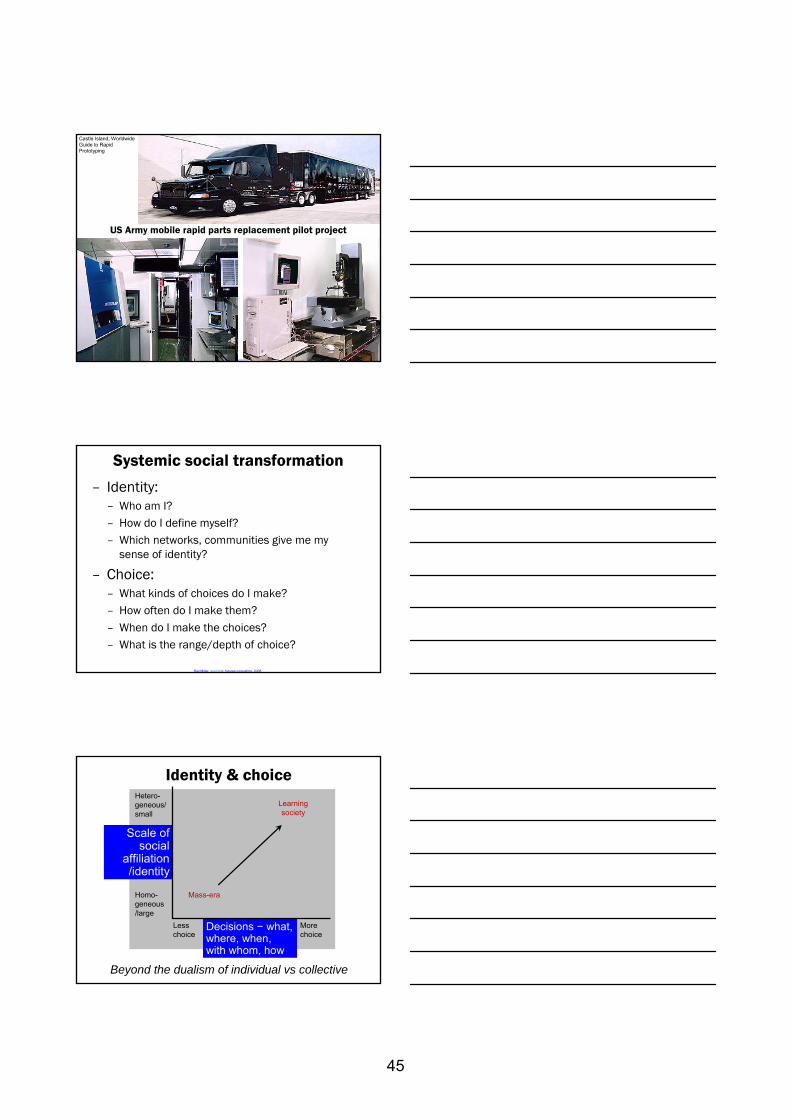
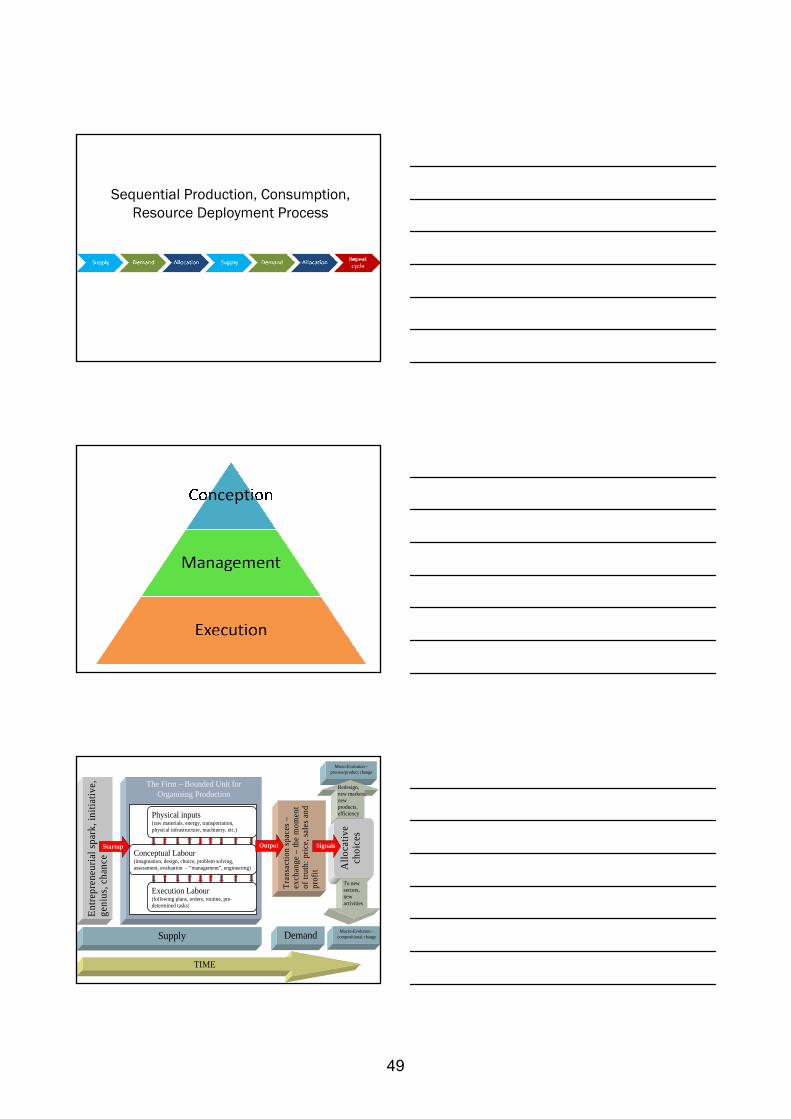
Users will design and create their own objects instead of shopping for existing products. Cybercrafting started in 1998 when students at MIT's How to Make (Almost) Anything course set out to fulfill their “individual desires rather than merely meeting mass-market needs."
44
Riel Miller, xperidox: futures consulting, 2008
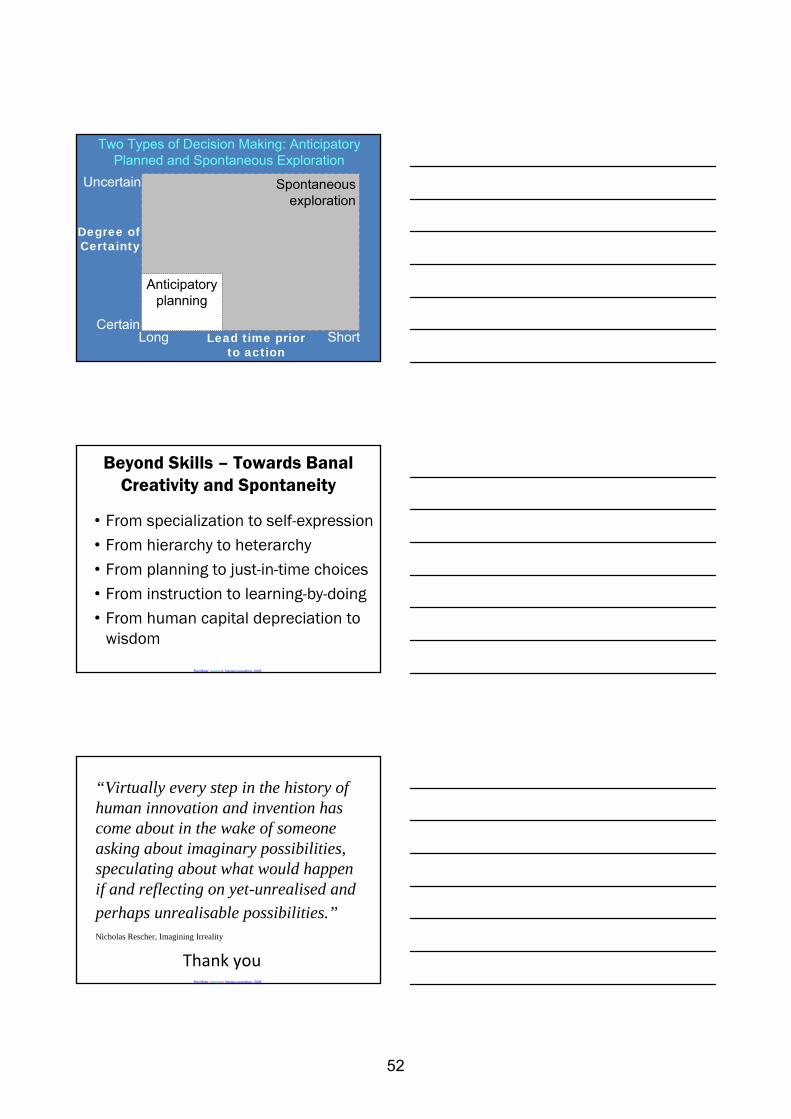
US Army mobile rapid parts replacement pilot project
Castle Island, Worldwide Guide to Rapid Prototyping
Riel Miller, xperidox: futures consulting, 2008
Systemic social transformation
– Identity:– Who am I? – How do I define myself?– Which networks, communities give me my
sense of identity?
– Choice:– What kinds of choices do I make?– How often do I make them?– When do I make the choices? – What is the range/depth of choice?
Identity & choiceHetero-geneous/small
Homo-geneous/large
Decisions − what, where, when, with whom, how
Less choice
More choice
Scale of social
affiliation /identity
Mass-era
Learning society
Beyond the dualism of individual vs collective
45

Systemic transformation of governance
• Internalization not socialization
• Planning causes failure and fails to reduce risk
• Experimentalism not administration
• Learning by doingPhoto credit: Mark Schacter, www.luxetveritas.ca
Riel Miller, xperidox: futures consulting, 2008
Capacity to make & implement decisions
Experimentation & learning
Transparency & access to information
Limited & fragmented
Extensive & unified
Mass-era
Learning society
Limited Continuous
Futures literacy matters
Riel Miller, xperidox: futures consulting, 2008
Internalization not socialization
– In hierarchical society identity is defined by the “other” – individual versus the collective
– In heterarchical society identity is immediately social – it is the subjective in context
– Confronted by the inadequacy of old identity formation do we have the capacities needed to invent the multiplicity of new stories?
46

Riel Miller, xperidox: futures consulting, 2008
Planning causes failure & fails to reduce risk
– Decisions made at the last possible moment will always have more information available than decisions made earlier than necessary
– Planning can, and often does, reduce the capacity to imagine options outside the planning parameters
– The premise of planning is to reduce rather than use complexity
– Diversification is central to risk reduction, the simplification required for planning often reduces diversification
– Heterogeneity depends on experimentation and learning depends on experimentation – hence failure is necessary – planning opposes failure
Riel Miller, xperidox: futures consulting, 2008
Experimentalism not administration
Decision making in the face of complexity, learning by doing, self-organising systems, evolutionary emergence are all processes that entail “error”, administration in both public and private sectors punishes error
Riel Miller, xperidox: futures consulting, 2008
Learning by doing and wisdom
The productivity of unique creation and the quality of decision making capacity both increase, all other things being equal, with experience and better information
47

Riel Miller, xperidox: futures consulting, 2008
21st Century Transitions: Synergy Conditions and the Policy Challenge
02468
10Ease of use
Range of uses
Task unpredictability &predictability
Autonomy
Heterogeneity & smallerscale of affiliation
Extent of choices
Transparency & access toinformation
Experimentation & reflection
Mass-era Learning society
Technological dynamism
Economic dynamismSocial dynamism
Dynamic governance
Riel Miller, xperidox: futures consulting, 2008
Scale of the transition: towards a learning intensive society
• Wealth, rules, governance, values– Physical/financial vs human capital– Simple vs complex property rights– Ex-ante vs real-time allocation of power– Shared values as basis for transaction trust (Universal
Declaration of Human Rights)
• Quality of life– Mass production vs production for self/community– Life organized for work vs work organized for life– Hierarchy vs autonomy – Imposed identity vs self-generated identity– Sen’s definition of “freedom”
Riel Miller, xperidox: futures consulting, 2008
“The relative ease with which past developments can be rationalized after the fact is misleading. The evolution of the division of labor is a complex process we do not at all control, cannot predict, and only half understand. Yet, some of the emerging determinants that will change our world can be discerned. And one thing that can be said with considerable confidence is that the “stylized facts” … {of the industrial economy}…are not permanent features of our world.”Axel Leijonhufvud, The Individual, the Market and the Division of Labor in Society, Capitalism and Society, Volume 2, Issue 2 2007 Article 3, http://www.bepress.com/cas/vol2/iss2/art3
48
Sequential Production, Consumption, Resource Deployment Process
Micro-Evolution – process/product change
The Firm – Bounded Unit for Organising Production
Allo
cativ
e ch
oice
s
Entre
pren
euria
l spa
rk, i
nitia
tive,
ge
nius
, cha
nce Conceptual Labour
(imagination, design, choice, problem solving, assessment, evaluation – “management”, engineering)
Execution Labour (following plans, orders, routine, pre-determined tasks)
Physical inputs (raw materials, energy, transportation, physical infrastructure, machinery, etc.)
Startup
Tran
sact
ion
spac
es –
ex
chan
ge –
the
mom
ent
of tr
uth:
pric
e, sa
les a
nd
prof
it
Output Signals
To new sectors, new activities
Supply Demand
TIME
Redesign, new markets, new products, efficiency
Macro-Evolution – compositional change
49

Clouds of unique creation – A network of information flows and shared experience
Riel Miller, xperidox: futures consulting, 2008
Changing Composition of Output
0%
20%
40%
60%
80%
100%
1985 1990 1995 2000 2005 2010 2015 2020 2025 2030 2035 2040
Time
Per
cen
tage
Sha
re
Industrial products Innovation (S&T/R&D)Personal products Creativity (Refinement of taste)
50

Riel Miller, xperidox: futures consulting, 2008
Towards spontaneous & fluid networking
Use of information
Practical complexity of
networking
Limited
Unlimited
Mass-era
Learning society
Limited Full
Collective choices to lay the foundations to use diversity & density
Riel Miller, xperidox: futures consulting, 2008
Thinking about the future?
Distinguish three types of future:• Contingency – catastrophe, wildcard, win the lottery,
simple systems– Response: simulation and practice, learning by
doing, early warning, transparency• Optimization – chess, simple systems
– Response: Better calculation – models, projections, clarity and familiarity of rules
• Exploration – open ended, “hyper complex”– Response: systemic awareness, imagining changes
in the conditions of change, picture life within an imagined frame, narrative capacities
Future Contexts: From Simple and Closed to Complex and Open
Exploration
Degree of complexity
Complex
Degree of Openness
SimpleClosed Open
Optimization(chess game)
51
Two Types of Decision Making: Anticipatory Planned and Spontaneous Exploration
Spontaneousexploration
Degree of Certainty
Uncertain
Lead time prior to action
CertainLong Short
Anticipatory planning
Riel Miller, xperidox: futures consulting, 2008
Beyond Skills – Towards Banal Creativity and Spontaneity
• From specialization to self-expression• From hierarchy to heterarchy• From planning to just-in-time choices• From instruction to learning-by-doing• From human capital depreciation to
wisdom
Riel Miller, xperidox: futures consulting, 2008
“Virtually every step in the history of human innovation and invention has come about in the wake of someone asking about imaginary possibilities, speculating about what would happen if and reflecting on yet-unrealised and perhaps unrealisable possibilities.”Nicholas Rescher, Imagining Irreality
Thank you
52

Working group I:
FORECASTING SKILL NEEDS AT EU LEVEL
Working group I: FORECASTING SKILL NEEDS AT EU LEVEL Chair: Alena Zukersteinova, Cedefop Rapporteur: Ben Gardiner, CE – Cambridge Econometrics, UK Presentations: Medium-term forecast of occupational skill needs in Europe: detailed results and
methodological approach presentation of the medium-term forecast Rob Wilson & Ilias Livanos, IER - Institute for Employment Research, University of Warwick, UK An ageing society and the significance of the replacement demand Ben Kriechel, ROA - Research Centre for Education and the Labour Market, the Netherlands Skills supply forecast Frank Cörvers, ROA - Research Centre for Education and the Labour Market, the Netherlands and Hector Pollitt, CE – Cambridge Econometrics, UK
Technological change and innovation, globalisation and demographic trends are changing the demand for skills in Europe. The results from Cedefop’s medium-term forecast of occupational skill needs offer an overview of employment prospects in Europe. This forecast, based on a modular method allowing for a comprehensive and consistent result despite numerous difficulties with input data, provides a solid basis on which to debate current employment trends. It turns out that the situation in Europe is complex: not only is there a demand for higher educated workers (academic and vocational) but also for elementary occupations. Moreover, as the population ages, the need to replace retiring workers becomes increasingly important. The preliminary findings of the forecast show that there is a need for more in-depth research into the phenomenon of skill polarisation, as well as into upskilling within occupations and the mismatch of needed and available skills. The Directorate General for Employment has encouraged Cedefop´s Skillsnet to continue its work on forecasting. A new project on forecasting the skills supply, the results of which will be compared with demand, will start in early 2008. To go forward with forecasting certain data issues need to be solved between the statistics authorities of the EU and the Member States. Labour market information and intelligence should improve to help guide strategic choices and policy decisions in Europe. The workshop will address the following questions:
• What are the main changes in the demand for skills in Europe? What are the implications for policy?
• How should further work on forecasting skill needs in Europe develop?
• How could data deficiencies be solved? How could labour market information and intelligence be improved? Which policy measures at which level can help to tackle the issue?
54
Medium-term forecast of occupational skill needs in Europe: detailed results and methodological approach Rob Wilson
Ilias Livanos
55

This session will present further detailed results from the Skillsnet project on developing a Medium-term forecast of occupational skill needs in Europe. This project has produced a comprehensive and consistent assessment of changing employment prospects across the whole of Europe. This session will provide a taste of the rich variety of results available from the project, as well as summarising the Framework developed and providing some details of the approach adopted. The latter highlights the many data and technical problems with which the research team has had to tangle and the solutions that have been adopted to deal with these. The new Framework established represents a new system for producing regular detailed and consistent, quantitative projections of future skill needs across the whole of Europe. Given the difficulties faced, a certain amount of pragmatism has been required, but this set of results provides a sound foundation to take the debate about changing pattern of demand for skills in Europe to a new level.
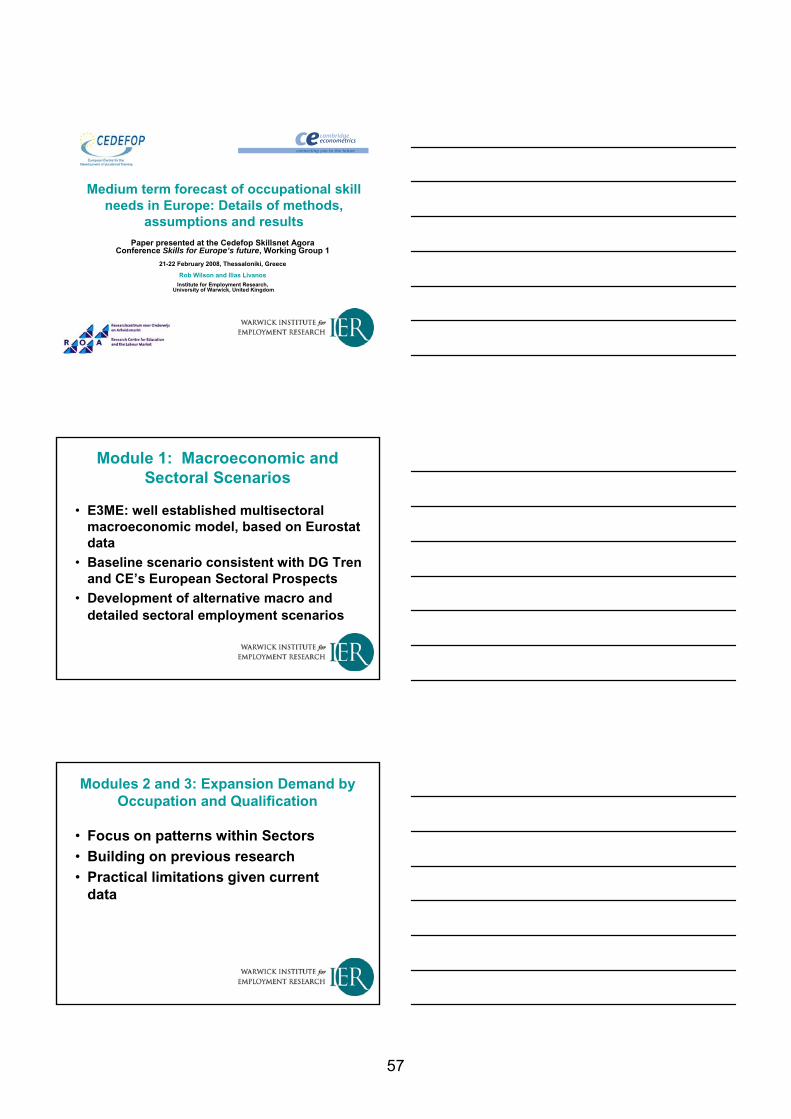
The Framework involves a modular approach comprising 4 main elements: a multisectoral macroeconomic model; occupational and qualifications expansion demand modules; and a replacement demand module. The advantages of a modular approach are that it facilitates the independent development and improvement of the different parts of the system. The project has highlighted a number of data issues, many of which can only be addressed by detailed dialogue between individual country experts and the relevant statistical authorities at national and international level. One of the conclusions from this project is the urgent need to address these concerns, in order that even better labour market information and intelligence can be developed in the future, to help guide the choices and decisions of all Europe’s citizens.
Rob Wilson is a Professorial Fellow and Deputy Director of the Warwick Institute for Employment Research at the University of Warwick in the UK. He leads the Institute’s labour assessment and market forecasting work, although he has researched and published on many other aspects of labour market behaviour, including the changing patterns of demand for and the supply of skills at national and international levels. He has played a leading role in producing ‘Skills in England’ for the LSC since 2002. He is editor and contributor to various other publications in this area including ‘Working futures’ for the SSDA and ‘Projections of occupations and qualifications’ for DfES. Most recently he has lead the Cedefop Skillsnet project on producing ‘Medium-term forecasts of occupational skill needs in Europe’, which for the first time has produced a consistent and comprehensive assessment of employment prospects for the whole of Europe. He has written and edited a number of books, including ‘Employment forecasting in the construction industry’; ‘The national health service and the labour market’; ‘Technical change: the role of scientists and engineers’; and ‘Research and development statistics’. Amongst his professional responsibilities, has been a member of the Medical Workforce Standing Advisory Committee and the Skills Task Force Research Group. He is currently a member of the Migration Advisory Committee set up to advise the UK government on where there are likely to be skill shortages that can be sensibly filled by migrants.
Ilias Livanos is a Research Associate in the Warwick Institute for Employment Research. He holds a BSc in Economics from the University of Piraeus, and an MA in Industrial Relations from Warwick Business School. He is currently in the process of completing his PhD in Employment Research. He has a primary role in the Cedefop funded European project on ‘Medium-term forecasts of occupational skill needs in Europe’. Prior to his post in IER, he had worked for many research organizations in Greece, such as the Research Centre of the University of Piraeus, the Greek Centre of Educational Research, and the Institute of Labour of the Greek General Confederation of Labour (INE-GSEE). He has also worked as a researcher for the Greek parliament, appointed to an MP. His main interests include forecasting of occupations and qualifications, applied labour economics, and economics of higher education. He is an expert in the Greek labour market, and he has published on various aspects of the Greek labour market.
56
Medium term forecast of occupational skill needs in Europe: Details of methods,
assumptions and resultsPaper presented at the Cedefop Skillsnet Agora
Conference Skills for Europe’s future, Working Group 1
21-22 February 2008, Thessaloniki, Greece
Rob Wilson and Ilias LivanosInstitute for Employment Research,
University of Warwick, United Kingdom
Module 1: Macroeconomic and Sectoral Scenarios
• E3ME: well established multisectoralmacroeconomic model, based on Eurostatdata
• Baseline scenario consistent with DG Trenand CE’s European Sectoral Prospects
• Development of alternative macro and detailed sectoral employment scenarios
Modules 2 and 3: Expansion Demand by Occupation and Qualification
• Focus on patterns within Sectors• Building on previous research • Practical limitations given current
data
57
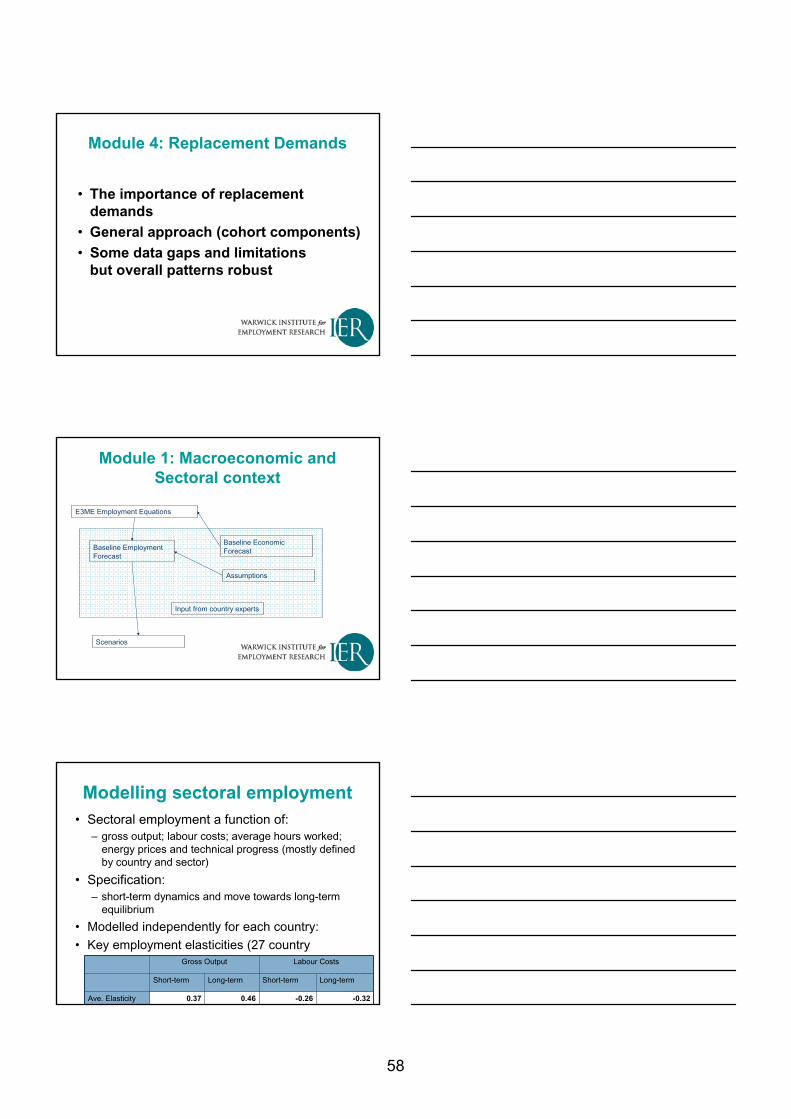
Module 4: Replacement Demands
• The importance of replacement demands
• General approach (cohort components)• Some data gaps and limitations
but overall patterns robust
Module 1: Macroeconomic and Sectoral context
Baseline Economic Forecast
E3ME Employment Equations
Baseline Employment Forecast
Input from country experts
Assumptions
Scenarios
Modelling sectoral employment• Sectoral employment a function of:
– gross output; labour costs; average hours worked; energy prices and technical progress (mostly defined by country and sector)
• Specification: – short-term dynamics and move towards long-term
equilibrium
• Modelled independently for each country: • Key employment elasticities (27 country
average)
0.46
Long-term
-0.26
Short-term
Labour CostsGross Output
-0.320.37Ave. Elasticity
Long-termShort-term
58
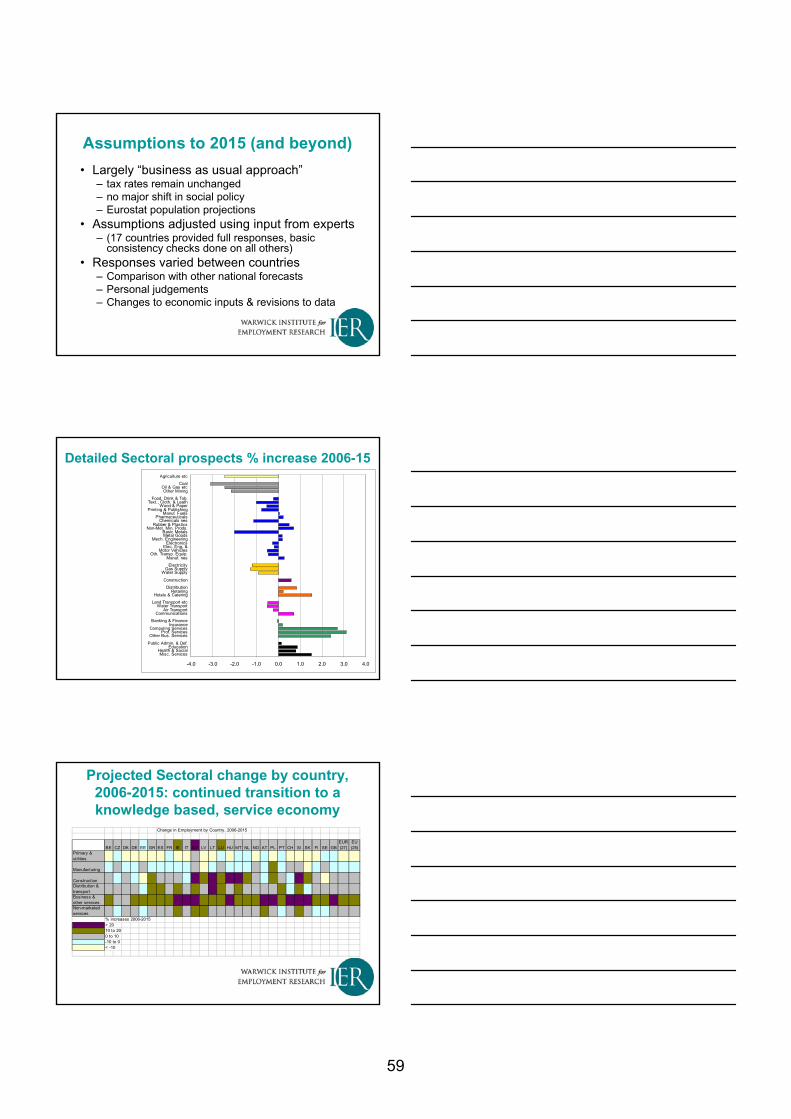
Assumptions to 2015 (and beyond)
• Largely “business as usual approach”– tax rates remain unchanged– no major shift in social policy– Eurostat population projections
• Assumptions adjusted using input from experts– (17 countries provided full responses, basic
consistency checks done on all others)• Responses varied between countries
– Comparison with other national forecasts– Personal judgements– Changes to economic inputs & revisions to data
Detailed Sectoral prospects % increase 2006-15
-4.0 -3.0 -2.0 -1.0 0.0 1.0 2.0 3.0 4.0
Misc. ServicesHealth & Social
EducationPublic Admin. & Def.
Other Bus. ServicesProf. Services
Computing ServicesInsurance
Banking & Finance
CommunicationsAir Transport
Water TransportLand Transport etc
Hotels & CateringRetailing
Distribution
Construction
Water SupplyGas Supply
Electricity
Manuf. nesOth. Transp. Equip.
Motor VehiclesElec. Eng. &
ElectronicsMech. Engineering
Metal GoodsBasic Metals
Non-Met. Min. Prods.Rubber & Plastics
Chemicals nesPharmaceuticals
Manuf. FuelsPrinting & Publishing
Wood & PaperText., Cloth. & Leath
Food, Drink & Tob.
Other MiningOil & Gas etc
Coal
Agriculture etc
Projected Sectoral change by country, 2006-2015: continued transition to a knowledge based, service economy
Change in Employment by Country, 2006-2015
BE CZ DK DE EE GR ES FR IE IT CY LV LT LU HU MT NL NO AT PL PT CH SI SK FI SE GBEUR(27)
EU(25)
Primary & utilities
Manufacturing
ConstructionDistribution & transportBusiness & other servicesNon-marketed services
% increases 2006-2015> 2010 to 200 to 10-10 to 0< -10
59
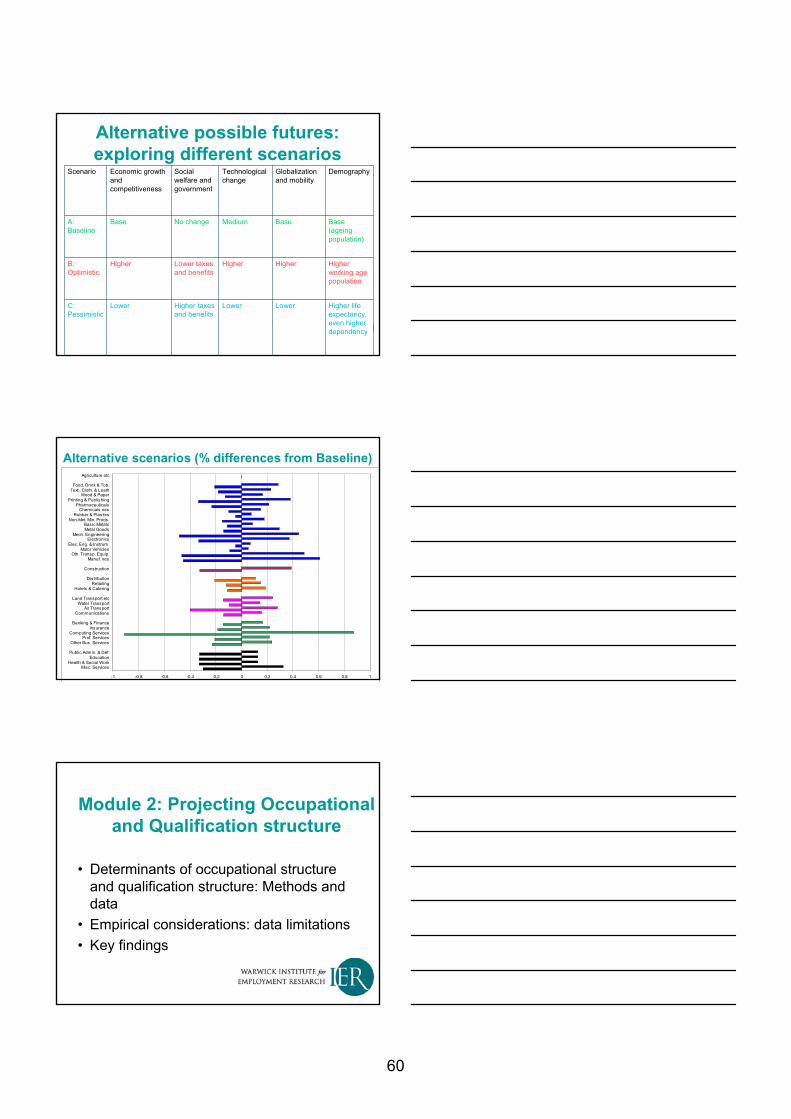
Alternative possible futures: exploring different scenarios
Higher life expectancy, even higher dependency
LowerLowerHigher taxes and benefits
LowerC: Pessimistic
Higher working age population
HigherHigherLower taxes and benefits
HigherB: Optimistic
Base (ageing population)
BaseMediumNo changeBaseA: Baseline
DemographyGlobalization and mobility
Technological change
Social welfare and government
Economic growth and competitiveness
Scenario
Alternative scenarios (% differences from Baseline)
-1 -0.8 -0.6 -0.4 -0.2 0 0.2 0.4 0.6 0.8 1
Misc. ServicesHealth & Social Work
EducationPublic Admin. & Def.
Other Bus. ServicesProf. Services
Computing ServicesInsurance
Banking & Finance
CommunicationsAir Transport
Water TransportLand Transport etc
Hotels & CateringRetailing
Distribution
Construction
Manuf. nesOth. Transp. Equip.
Motor VehiclesElec. Eng. & Instrum.
ElectronicsMech. Engineering
Metal GoodsBasic Metals
Non-Met. Min. Prods.Rubber & Plastics
Chemicals nesPharmaceuticals
Printing & PublishingWood & Paper
Text., Cloth. & LeathFood, Drink & Tob.
Agriculture etc
Module 2: Projecting Occupational and Qualification structure
• Determinants of occupational structure and qualification structure: Methods and data
• Empirical considerations: data limitations• Key findings
60
Data sources and issues
• Key sources:– Aggregate and micro EU-LFS data – Eurostat and E3ME data
• Data issues:– Statistical reliability / volatility– Gaps & discontinuities
• Need for further investment in data
Methods used by other occupational forecasters
• Building on previous research-– Fixed shares – Extrapolations of past trends + expert
judgments of future structure– Attempts to introduce Behavioural models
Key drivers of occupational change
• Key drivers: – Technology; – Sectoral change (output levels driven by other economic factors,
international trade performance, cyclical factors, etc); – factor prices (wages)
• Practical limitations given current data– Shares within sectors mainly extrapolated from past trends
61
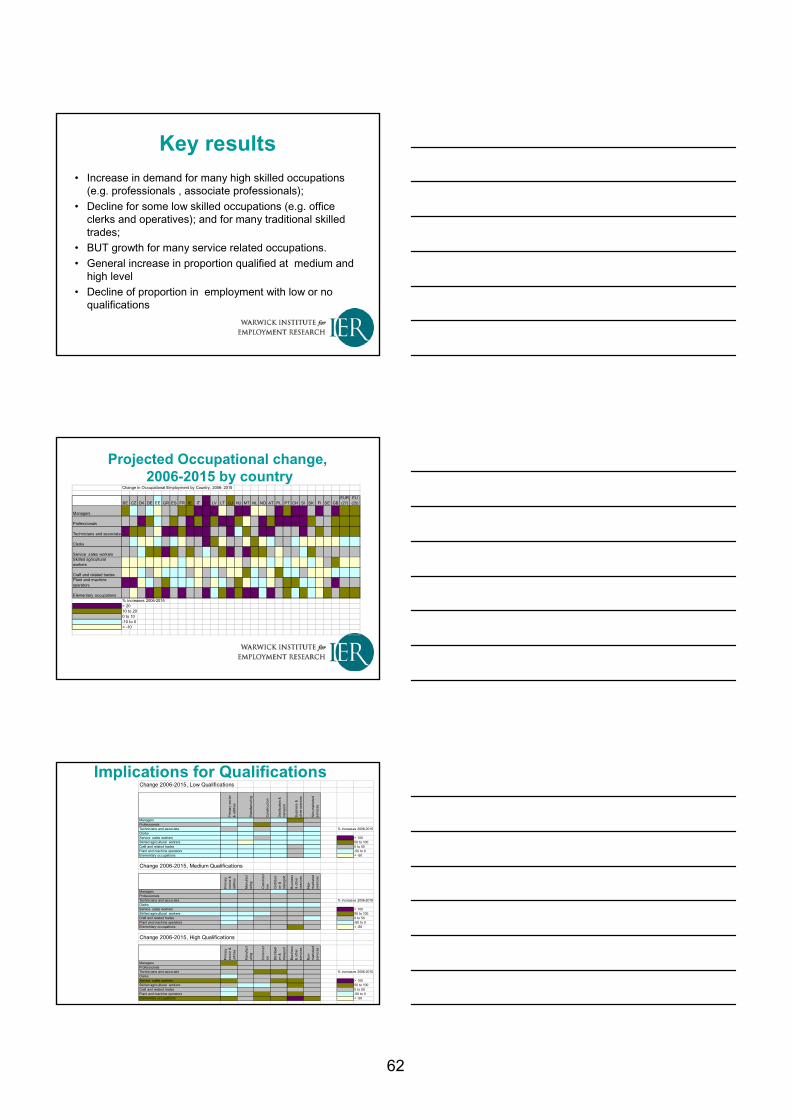
Key results• Increase in demand for many high skilled occupations
(e.g. professionals , associate professionals);• Decline for some low skilled occupations (e.g. office
clerks and operatives); and for many traditional skilled trades;
• BUT growth for many service related occupations.• General increase in proportion qualified at medium and
high level• Decline of proportion in employment with low or no
qualifications
Projected Occupational change,2006-2015 by country
Change in Occupational Employment by Country, 2006- 2015
BE CZ DK DE EE GR ES FR IE IT CY LV LT LU HU MT NL NO AT PL PT CH SI SK FI SE GBEUR(27)
EU(25)
Managers
Professionals
Technicians and associate
Clerks
Service sales workersSkilled agricultural workers
Craft and related trades Plant and machine operators
Elementary occupations% increases 2006-2015> 2010 to 200 to 10-10 to 0< -10
Implications for Qualifications Change 2006-2015, Low Qualifications
Prim
ary
sect
or
& u
tiliti
es
Man
ufac
turin
g
Con
stru
ctio
n
Dis
trib
utio
n &
tr
ansp
ort
Bus
ines
s &
ot
her
serv
ices
Non
-mar
kete
d se
rvic
es
ManagersProfessionalsTechnicians and associate % increases 2006-2015ClerksService sales workers > 100Skilled agricultural workers 50 to 100Craft and related trades 0 to 50Plant and machine operators -50 to 0Elementary occupations < -50
Change 2006-2015, Medium Qualifications
Prim
ary
sect
or &
ut
ilitie
s
Man
ufac
tur
ing
Con
stru
ctio
n
Dis
trib
uti
on &
tr
ansp
ort
Bus
ines
s &
oth
er
serv
ices
Non
-m
arke
ted
serv
ices
ManagersProfessionalsTechnicians and associate % increases 2006-2015ClerksService sales workers > 100Skilled agricultural workers 50 to 100Craft and related trades 0 to 50Plant and machine operators -50 to 0Elementary occupations < -50
Change 2006-2015, High Qualifications
Prim
ary
sect
or &
ut
ilitie
s
Man
ufac
tur
ing
Con
stru
ctio
n
Dis
trib
uti
on &
tr
ansp
ort
Bus
ines
s &
oth
er
serv
ices
Non
-m
arke
ted
serv
ices
ManagersProfessionalsTechnicians and associate % increases 2006-2015ClerksService sales workers > 100Skilled agricultural workers 50 to 100Craft and related trades 0 to 50Plant and machine operators -50 to 0Elementary occupations < -50
62

Alternative scenarios by Occupation, Eur27
Projected change (000s)
-5,000 0 5,000 10,000 15,000 20,000
Elementary occupations
Plant and machine operators
Craft and related trades
Skilled agricultural & fishery w orkers
Service w orkers and sales w orkers
Clerks
Technicians and associate professionals
Professionals
Managers
All occupations
(000s)
LFS (Base)
Low 2
High 1
Base 0
Alternative scenarios: Total requirements, Eur27
Projected change (000s)
0 2,000 4,000 6,000 8,000 10,000 12,000 14,000
Elementary occupations
Plant and machine operators
Craft and related trades
Skilled agricultural & f ishery w orkers
Service w orkers and sales w orkers
Clerks
Technicians and associate professionals
Professionals
Managers
(000s)
LFS (Base)
Low 2
High 1
Base 0
Alternative scenarios by Qualification(total requirements,Eur27)
Projected change (000s)
-20,000 -10,000 0 10,000 20,000
Lowqualification
Mediumqualification
Highqualification
Allqualifications
(000s)
LFS (Base)
Low 2
High 1
Base 0
Projected change (%)
-20.0 -10.0 0.0 10.0 20.0 30.0
Lowqualification
Mediumqualification
Highqualification
Allqualifications
LFS (Base)
Low 2
High 1
Base 0
63
Key lessons for understanding future developments in skill
demands • Simple methods produce the most robust results• Clear and robust trends at a broad level• Imprecision at a more detailed level - data improving
but • Further investment in data on basic industry x
occupation x qualification matrices is a top priority • In the longer term this will facilitate more sophisticated
and robust modelling and analysis
Dissemination and Dialogue• Detailed results available in a series of
Country Workbooks:– Dissemination – Dialogue– Analysis - opportunity to consider alternative sectoral
and occupational data– Alternative assumptions about: Expansion demands
by occupation and qualification & Replacement needs
• Brief overview of contents• Sources and ownership of data:
Conditions for access & use
Overview of content:source data and links to the modules
• E3ME results (detailed sectoral employment)• LFS data, published & micro datasets
(occupational and qualification dimensions) • Econometric parameters and assumptions
(expansion and replacement demands)• Main Results:
• Sets of Individual Country workbooks• Other workbooks, Cross country comparisons
64

Ownership of data• Main data sets:
– National accounts, sectoral data (Eurostat, etc)– E3ME (CE)– LFS micro and other data (Eurostat, etc)– Other models and parameters and models (IER/ROA)– Results - Country and other workbooks, including
cross country comparisons (CE/IER/ROA/Cedefop)• The latter available to members of Skillsnet
– (and any others prepared to assist), subject to agreeing not pass the data on to third parties, and giving due acknowledgement in any published work using the material that it is from the Skillsnet/Cedefop project
Conclusions
• First consistent and comprehensive projections for Eur27
• The Framework and modular approach offers a sound foundation for further development
• Continued process of dialogue and debate
• Need to continue to refine data and methods
Contact details for further information:
Rob WilsonInstitute for Employment Research
University of WarwickCOVENTRY, CV4 7AL
[email protected]: +(44) 2476-523530
65
An ageing society and the significance of the replacement demand Ben Kriechel
66
Occupational skill forecasting should not only be concerned with growing and declining occupations within an industry or the economy. An important element of occupational demand is that of replacement demand, which consist of the open positions that need to be filled by school-leavers or other entrants to the labour market. Replacement demand is driven by the age composition of occupations. Within an ageing society, replacement demand tends to become more important, as more occupations are ageing rapidly, generating the need to fill the vacant positions of employees that have left the occupation. Net replacement demand is also estimated for the European skill forecasting project. Summary results for the EU and some countries will be discussed as well as important drivers generating the underlying occupational replacement demand.
Ben Kriechel is a researcher at the Research Centre for Education and the Labour Market (ROA). He obtained his Ph.D. in 2003 from Maastricht University. Within the Medium-Term forecast of occupation skill needs, he was responsible for the replacement demand module.
He is also involved in the national skills-forecasts for the Netherlands, and participates in the European Network for skills forecasting. Further research interest involve the use of national administrative data. He is especially interested in topics on personnel economics, worker displacement, and survey methodology. His work has appeared in several scientific journals, and he is a fellow of the research school METEOR (Maastricht) and the IZA (Bonn).
67

<[email protected]>http://www.roa.unimaas.nl/
Based on: Skillsnet project on Medium-term forecasts of occupational skill needs in Europe
An ageing society and the significance of replacement demand
-- Working group I --
Ben KriechelROA, Maastricht University
Ben Kriechel – Maastricht University<[email protected]>
Overview
• Introduction• What is replacement demand?• Main elements of occupational RD
– Participation rates– Age structure– Migration
• Conclusions
Ben Kriechel – Maastricht University<[email protected]>
Introduction: Demography
Source: Eurostat
Population EU25
0
1000000
2000000
3000000
4000000
5000000
6000000
7000000
8000000
15 17 19 21 23 25 27 29 31 33 35 37 39 41 43 45 47 49 51 53 55 57 59 61 63
200520102015
68
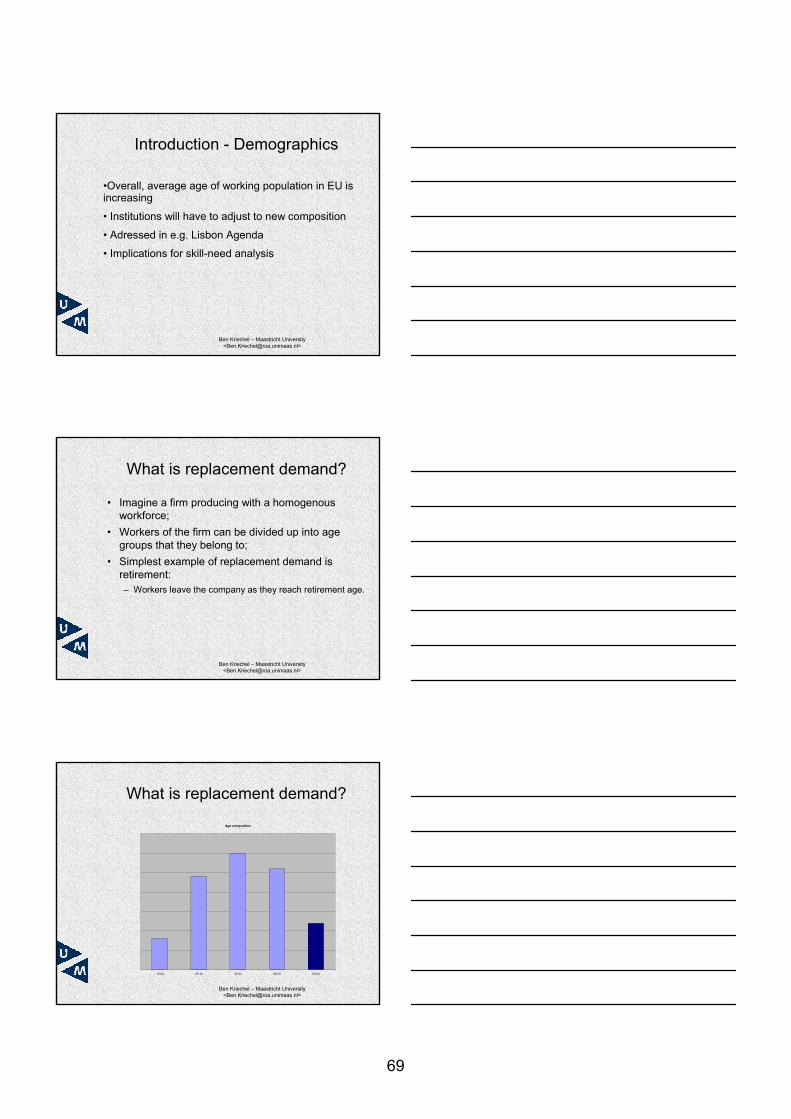
Ben Kriechel – Maastricht University<[email protected]>
Introduction - Demographics
•Overall, average age of working population in EU is increasing
• Institutions will have to adjust to new composition
• Adressed in e.g. Lisbon Agenda
• Implications for skill-need analysis
Ben Kriechel – Maastricht University<[email protected]>
What is replacement demand?
• Imagine a firm producing with a homogenous workforce;
• Workers of the firm can be divided up into age groups that they belong to;
• Simplest example of replacement demand is retirement: – Workers leave the company as they reach retirement age.
Ben Kriechel – Maastricht University<[email protected]>
What is replacement demand?
Age composition
15-24 25-34 35-44 45-54 55-64
69
Ben Kriechel – Maastricht University<[email protected]>
What is replacement demand?
• Retirement is not the only reason for the outflow of workers: – Early retirement;– Family obligations (chidren, taking care of parents, etc.);– Sickness, disability; – Migration;
– Switching to another firm, industry, sector;
Ben Kriechel – Maastricht University<[email protected]>
What is replacement demand?Gross outflow
0.00
0.10
0.20
0.30
0.40
0.50
0.60
0.70
0.80
0.90
1.00
15-24 25-34 35-44 45-54 55-64
%
% Male% Female
Ben Kriechel – Maastricht University<[email protected]>
What is replacement demand?
• Moving from the example of the firm to skill need type replacement demand: – Within firms there are various positions and occupations
attached to positions; – For occupations there are specific skill needs;
• Doing a similar analysis as before for the firm now looking at a single occupation.
70
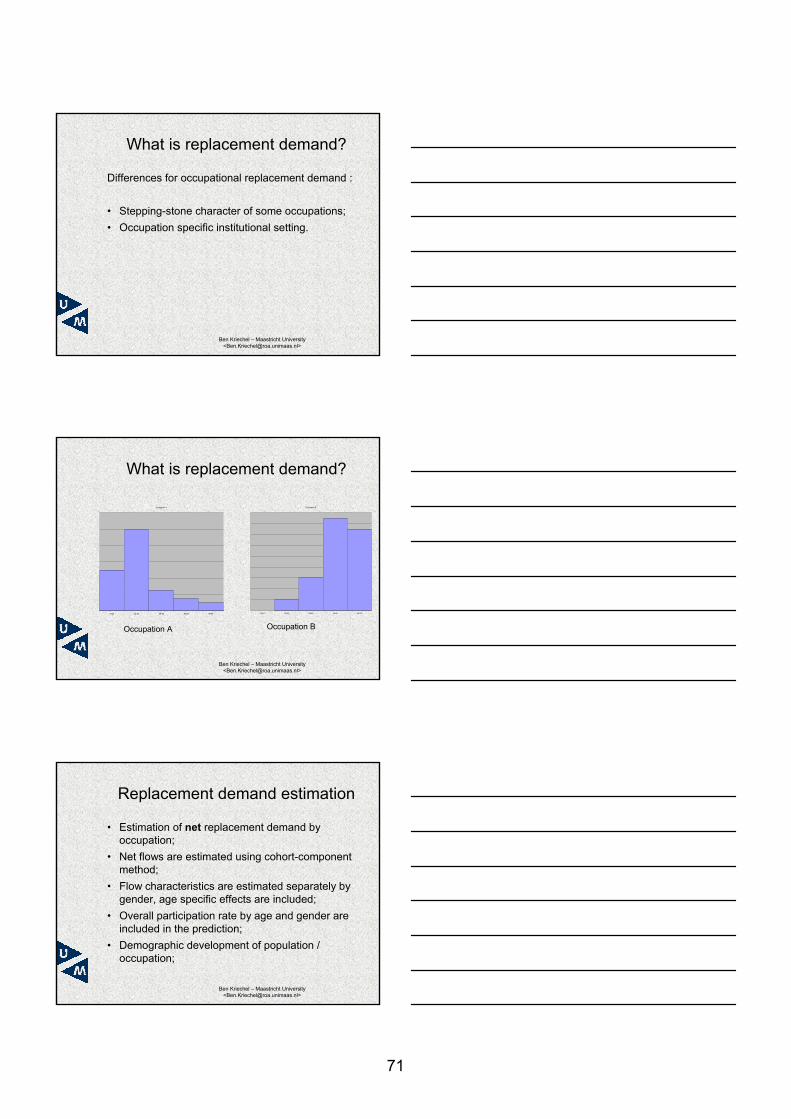
Ben Kriechel – Maastricht University<[email protected]>
What is replacement demand?
Differences for occupational replacement demand :
• Stepping-stone character of some occupations;• Occupation specific institutional setting.
Ben Kriechel – Maastricht University<[email protected]>
What is replacement demand?
Occupation A
15-24 25-34 35-44 45-54 55-64
Occupation B
15-24 25-34 35-44 45-54 55-64
A
Occupation A Occupation B
Ben Kriechel – Maastricht University<[email protected]>
Replacement demand estimation
• Estimation of net replacement demand by occupation;
• Net flows are estimated using cohort-component method;
• Flow characteristics are estimated separately by gender, age specific effects are included;
• Overall participation rate by age and gender are included in the prediction;
• Demographic development of population / occupation;
71
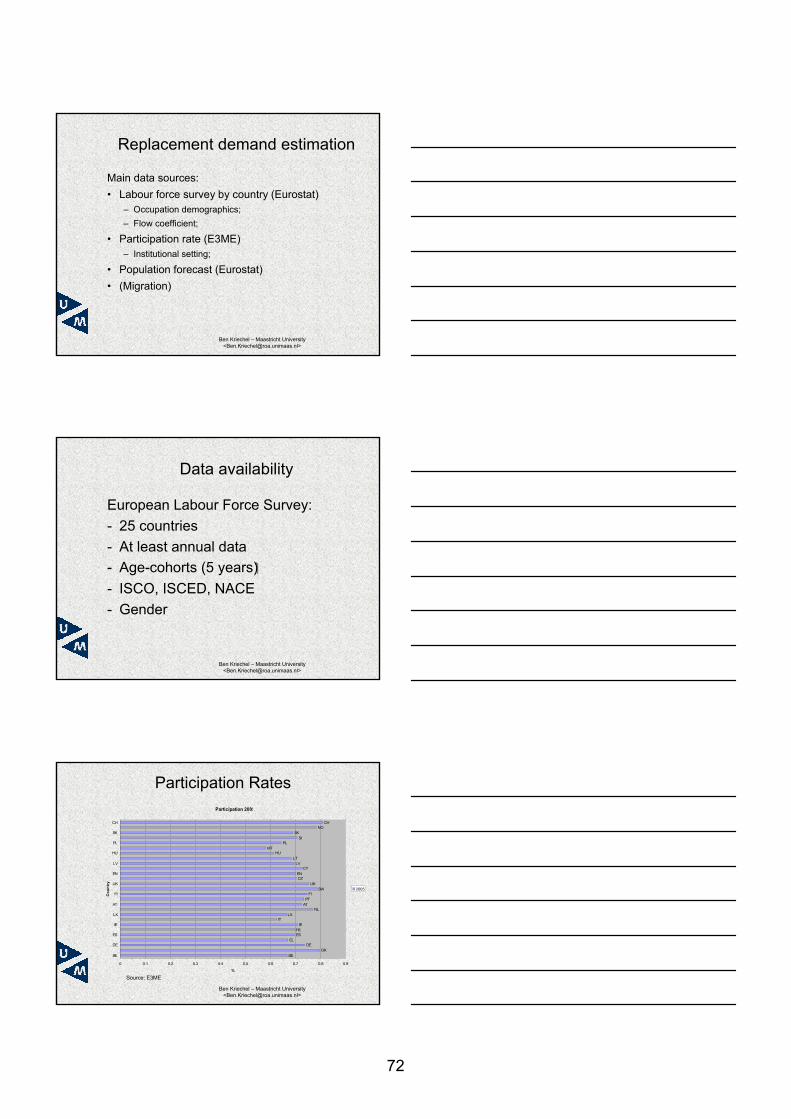
Ben Kriechel – Maastricht University<[email protected]>
Replacement demand estimation
Main data sources: • Labour force survey by country (Eurostat)
– Occupation demographics;– Flow coefficient;
• Participation rate (E3ME)– Institutional setting;
• Population forecast (Eurostat)• (Migration)
Ben Kriechel – Maastricht University<[email protected]>
Data availability
European Labour Force Survey: - 25 countries- At least annual data- Age-cohorts (5 years)- ISCO, ISCED, NACE- Gender
Ben Kriechel – Maastricht University<[email protected]>
Participation Rates
Participation 2005
BEDK
DEEL
ESFR
IEIT
LXNL
ATPT
FISW
UKCZEN
CYLV
LTHU
MTPL
SISK
NOCH
0 0.1 0.2 0.3 0.4 0.5 0.6 0.7 0.8 0.9
BE
DE
ES
IE
LX
AT
FI
UK
EN
LV
HU
PL
SK
CH
Co
un
try
%
2005
Source: E3ME
72
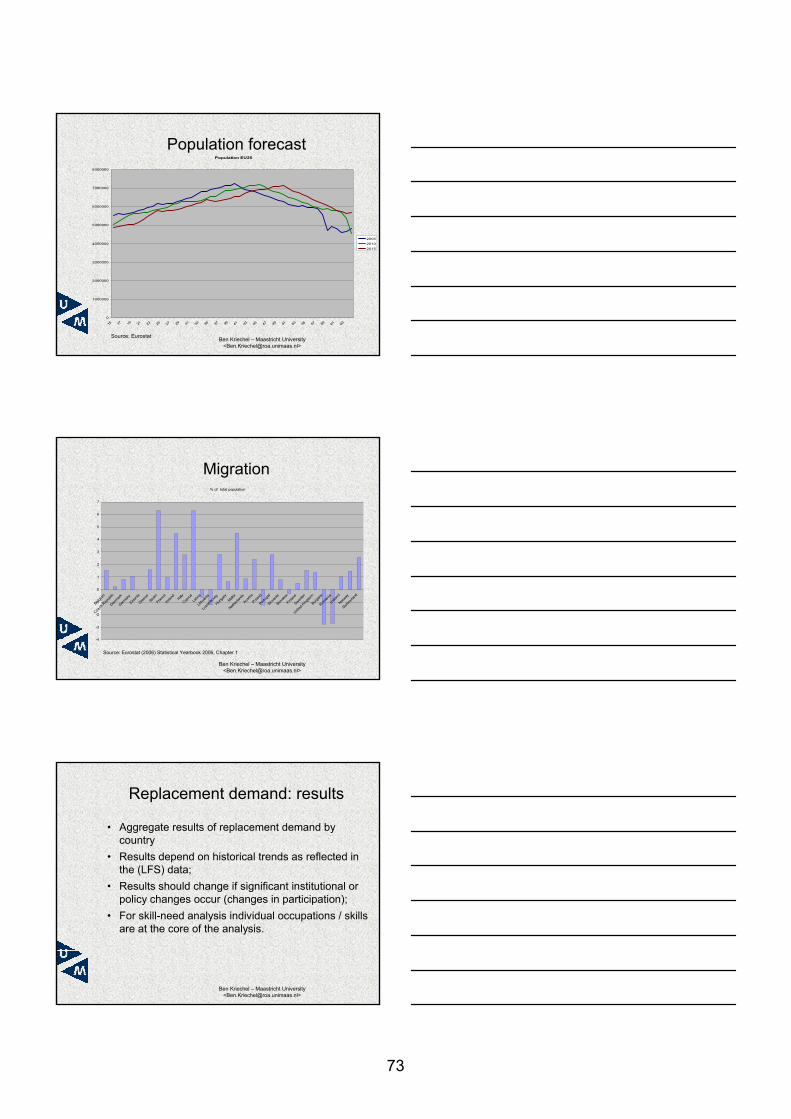
Ben Kriechel – Maastricht University<[email protected]>
Population forecast
Source: Eurostat
Population EU25
0
1000000
2000000
3000000
4000000
5000000
6000000
7000000
8000000
15 17 19 21 23 25 27 29 31 33 35 37 39 41 43 45 47 49 51 53 55 57 59 61 63
200520102015
Ben Kriechel – Maastricht University<[email protected]>
Migration% of total population
-4
-3
-2
-1
0
1
2
3
4
5
6
7
Belgium
Czech
Rep
ublic
Denmar
k
German
y
Estonia
Greece
Spain
Fran
ce
Irelan
dIta
ly
Cyprus
Latvi
a
Lithu
ania
Luxe
mbourg
Hunga
ryMalt
a
Nether
lands
Austria
Poland
Portug
al
Sloven
ia
Slovak
ia
Finlan
d
Sweden
United
King
dom
Bulgari
a
Roman
ia
Icelan
d
Norway
Switzer
land
Source: Eurostat (2006) Statistical Yearbook 2006, Chapter 1
Ben Kriechel – Maastricht University<[email protected]>
Replacement demand: results
• Aggregate results of replacement demand by country
• Results depend on historical trends as reflected in the (LFS) data;
• Results should change if significant institutional or policy changes occur (changes in participation);
• For skill-need analysis individual occupations / skills are at the core of the analysis.
73
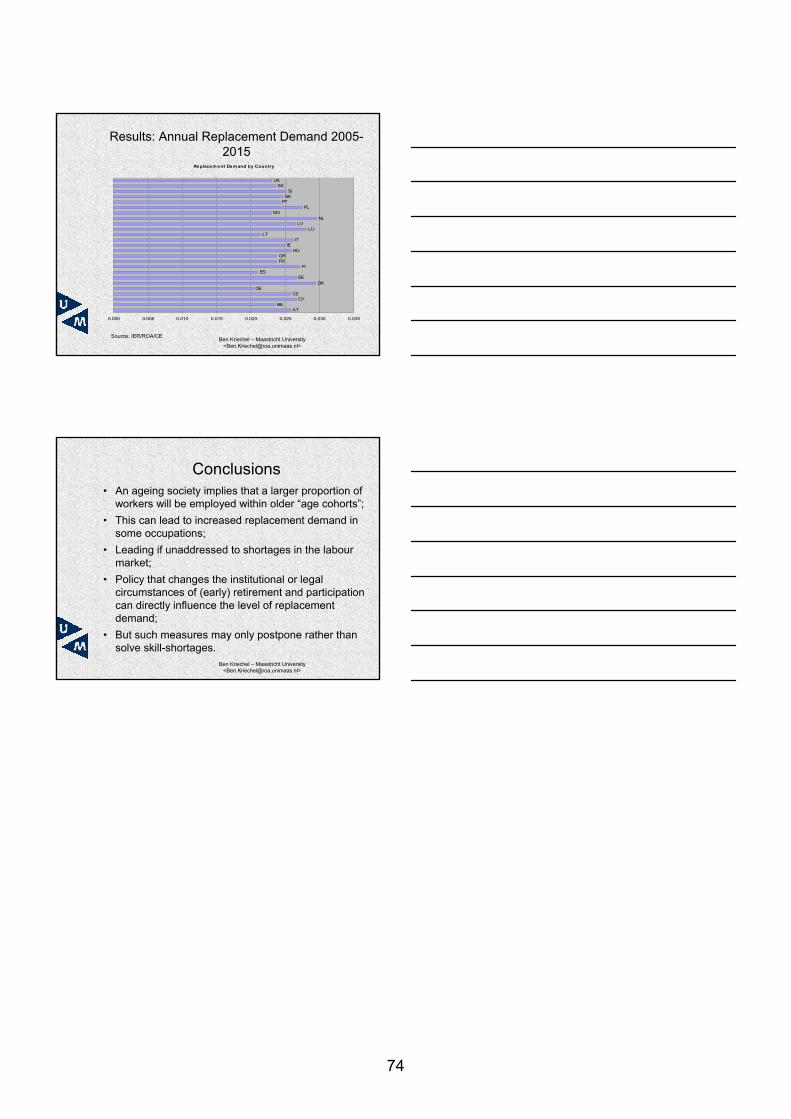
Ben Kriechel – Maastricht University<[email protected]>
Results: Annual Replacement Demand 2005-2015
Replacem ent Dem and by Country
ATBE
CYCZ
DEDK
EEES
FIFRGR
HUIE
ITLT
LULV
NLNO
PLPT
SESI
SKUK
0.000 0.005 0.010 0.015 0.020 0.025 0.030 0.035
Source: IER/ROA/CE
Ben Kriechel – Maastricht University<[email protected]>
Conclusions• An ageing society implies that a larger proportion of
workers will be employed within older “age cohorts”; • This can lead to increased replacement demand in
some occupations; • Leading if unaddressed to shortages in the labour
market; • Policy that changes the institutional or legal
circumstances of (early) retirement and participation can directly influence the level of replacement demand;
• But such measures may only postpone rather than solve skill-shortages.
74

Skills supply forecast Frank Cörvers
Hector Pollitt
75
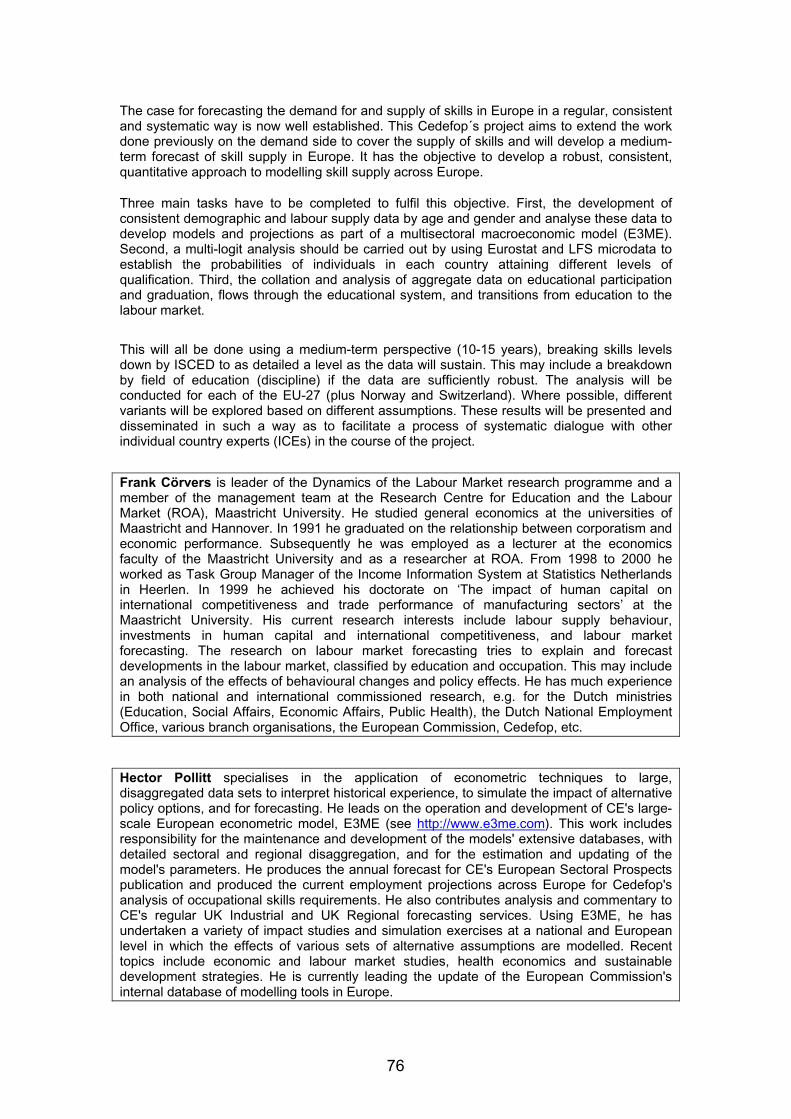
The case for forecasting the demand for and supply of skills in Europe in a regular, consistent and systematic way is now well established. This Cedefop´s project aims to extend the work done previously on the demand side to cover the supply of skills and will develop a medium-term forecast of skill supply in Europe. It has the objective to develop a robust, consistent, quantitative approach to modelling skill supply across Europe.
Three main tasks have to be completed to fulfil this objective. First, the development of consistent demographic and labour supply data by age and gender and analyse these data to develop models and projections as part of a multisectoral macroeconomic model (E3ME). Second, a multi-logit analysis should be carried out by using Eurostat and LFS microdata to establish the probabilities of individuals in each country attaining different levels of qualification. Third, the collation and analysis of aggregate data on educational participation and graduation, flows through the educational system, and transitions from education to the labour market.
This will all be done using a medium-term perspective (10-15 years), breaking skills levels down by ISCED to as detailed a level as the data will sustain. This may include a breakdown by field of education (discipline) if the data are sufficiently robust. The analysis will be conducted for each of the EU-27 (plus Norway and Switzerland). Where possible, different variants will be explored based on different assumptions. These results will be presented and disseminated in such a way as to facilitate a process of systematic dialogue with other individual country experts (ICEs) in the course of the project.
Frank Cörvers is leader of the Dynamics of the Labour Market research programme and a member of the management team at the Research Centre for Education and the Labour Market (ROA), Maastricht University. He studied general economics at the universities of Maastricht and Hannover. In 1991 he graduated on the relationship between corporatism and economic performance. Subsequently he was employed as a lecturer at the economics faculty of the Maastricht University and as a researcher at ROA. From 1998 to 2000 he worked as Task Group Manager of the Income Information System at Statistics Netherlands in Heerlen. In 1999 he achieved his doctorate on ‘The impact of human capital on international competitiveness and trade performance of manufacturing sectors’ at the Maastricht University. His current research interests include labour supply behaviour, investments in human capital and international competitiveness, and labour market forecasting. The research on labour market forecasting tries to explain and forecast developments in the labour market, classified by education and occupation. This may include an analysis of the effects of behavioural changes and policy effects. He has much experience in both national and international commissioned research, e.g. for the Dutch ministries (Education, Social Affairs, Economic Affairs, Public Health), the Dutch National Employment Office, various branch organisations, the European Commission, Cedefop, etc.
Hector Pollitt specialises in the application of econometric techniques to large, disaggregated data sets to interpret historical experience, to simulate the impact of alternative policy options, and for forecasting. He leads on the operation and development of CE's large-scale European econometric model, E3ME (see http://www.e3me.com). This work includes responsibility for the maintenance and development of the models' extensive databases, with detailed sectoral and regional disaggregation, and for the estimation and updating of the model's parameters. He produces the annual forecast for CE's European Sectoral Prospects publication and produced the current employment projections across Europe for Cedefop's analysis of occupational skills requirements. He also contributes analysis and commentary to CE's regular UK Industrial and UK Regional forecasting services. Using E3ME, he has undertaken a variety of impact studies and simulation exercises at a national and European level in which the effects of various sets of alternative assumptions are modelled. Recent topics include economic and labour market studies, health economics and sustainable development strategies. He is currently leading the update of the European Commission's internal database of modelling tools in Europe.
76
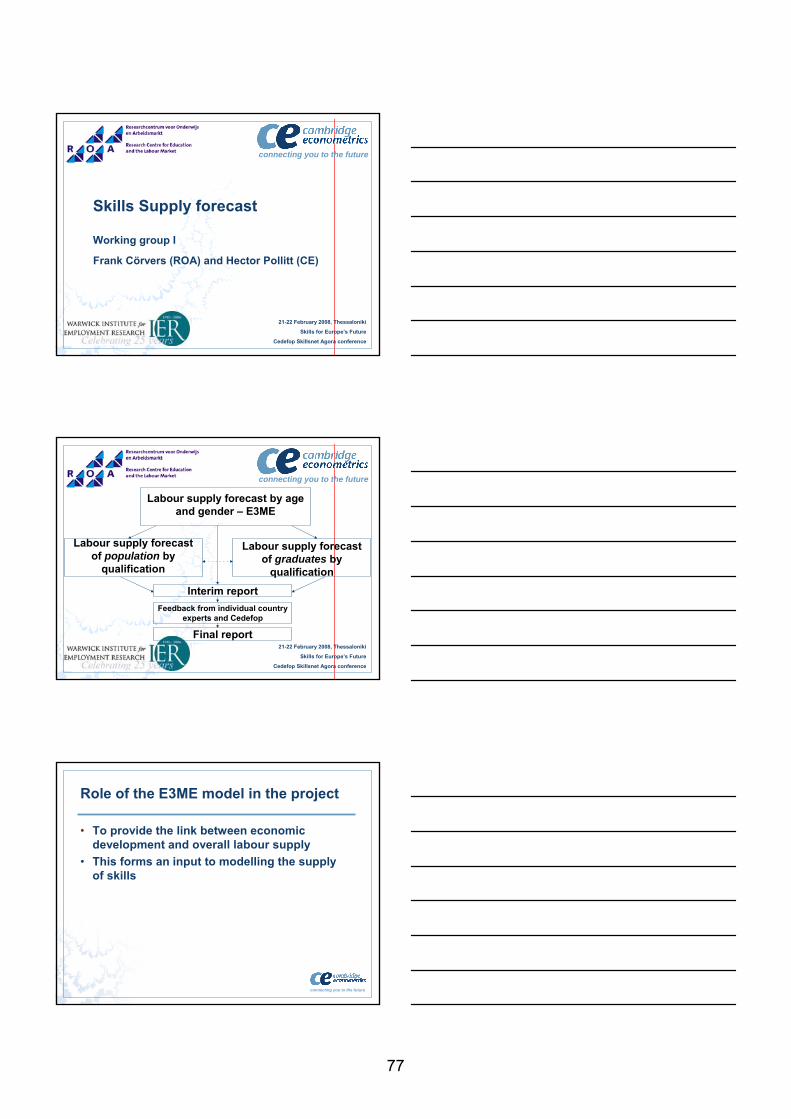
connecting you to the future
Skills Supply forecast
Working group I
Frank Cörvers (ROA) and Hector Pollitt (CE)
21-22 February 2008, Thessaloniki
Skills for Europe’s Future
Cedefop Skillsnet Agora conference
connecting you to the future
21-22 February 2008, Thessaloniki
Skills for Europe’s Future
Cedefop Skillsnet Agora conference
Labour supply forecast by age and gender – E3ME
Labour supply forecast of population by
qualification
Feedback from individual country experts and Cedefop
Labour supply forecast of graduates by
qualification
Final report
Interim report
connecting you to the future
Role of the E3ME model in the project
• To provide the link between economic development and overall labour supply
• This forms an input to modelling the supply of skills
77
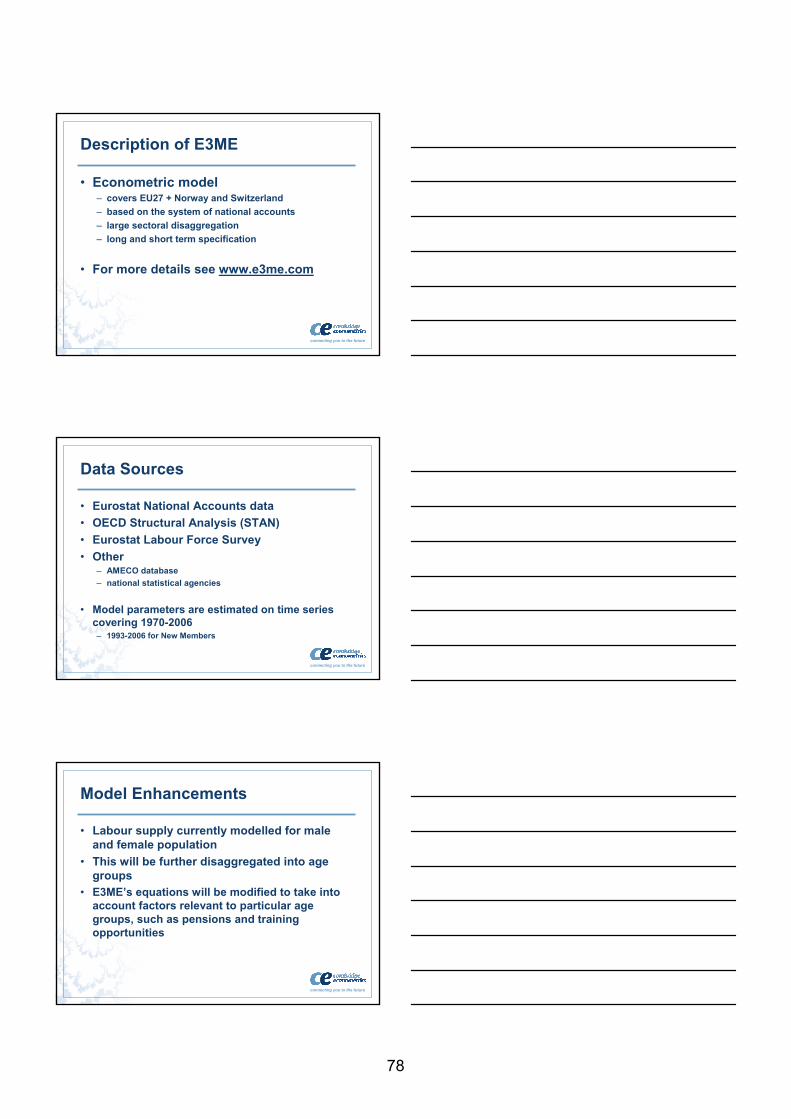
connecting you to the future
Description of E3ME
• Econometric model– covers EU27 + Norway and Switzerland– based on the system of national accounts– large sectoral disaggregation– long and short term specification
• For more details see www.e3me.com
connecting you to the future
Data Sources
• Eurostat National Accounts data• OECD Structural Analysis (STAN)• Eurostat Labour Force Survey• Other
– AMECO database– national statistical agencies
• Model parameters are estimated on time series covering 1970-2006– 1993-2006 for New Members
connecting you to the future
Model Enhancements
• Labour supply currently modelled for male and female population
• This will be further disaggregated into age groups
• E3ME’s equations will be modified to take into account factors relevant to particular age groups, such as pensions and training opportunities
78

connecting you to the future
Forecasting Labour Supply
• Population projections to match Eurostat baseline• Economic forecast to match EC publication• Labour participation rates are modelled as a function
of:– cyclical indicators (output)– average wage rates– unemployment rate– benefit rates– economic structure (services / manufacturing)
• Initial forecasts will be discussed with individual country experts before being finalised
• Two scenarios will be run to test key sensitivities
Forecasting labour supply of population by qualification
• Predicting the distribution of people by qualification
• Use of multi-logit qualification model
• Cross sectional data from the LabourForce Survey (LFS)
Multi-logit method
• Focus on Stocks of people by qualification level
• Propensity of a representative individual to obtain a level of highest qualification
• Use of multinomial logistic regression model• Independent variables:− age− gender− time trends− country
79
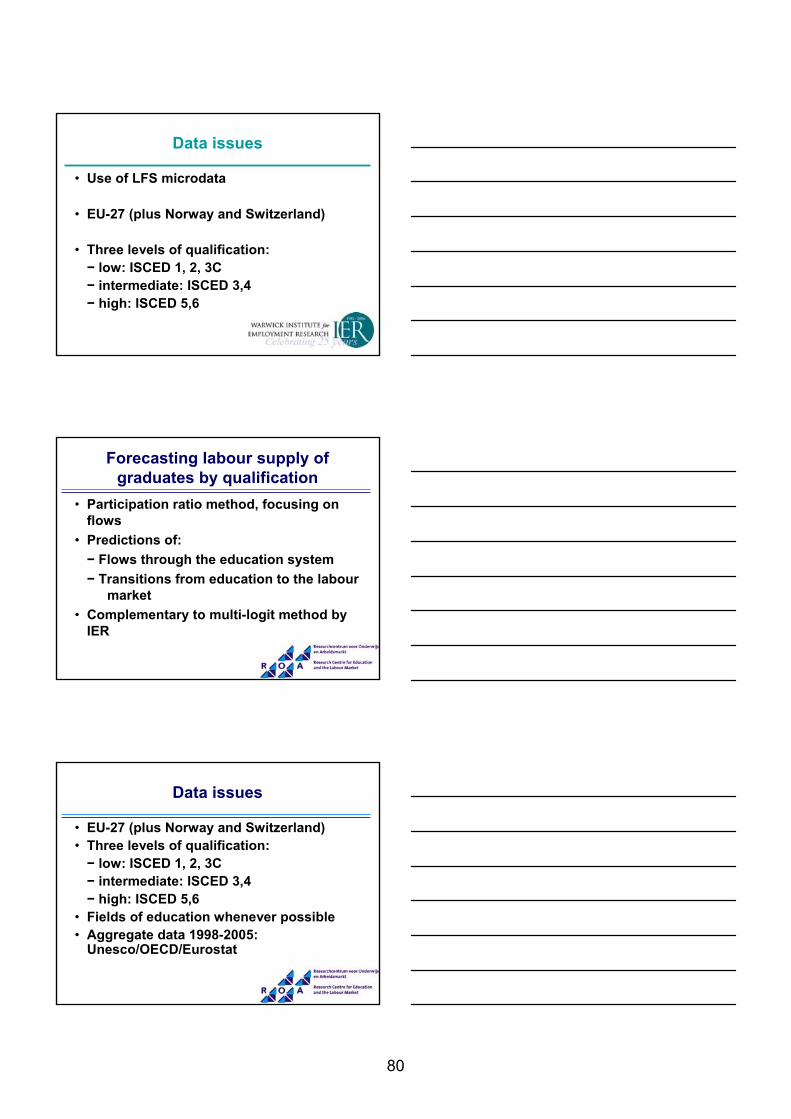
Data issues
• Use of LFS microdata
• EU-27 (plus Norway and Switzerland)
• Three levels of qualification:− low: ISCED 1, 2, 3C− intermediate: ISCED 3,4− high: ISCED 5,6
Forecasting labour supply of graduates by qualification
• Participation ratio method, focusing on flows
• Predictions of:− Flows through the education system− Transitions from education to the labour
market• Complementary to multi-logit method by
IER
Data issues
• EU-27 (plus Norway and Switzerland)• Three levels of qualification:− low: ISCED 1, 2, 3C− intermediate: ISCED 3,4− high: ISCED 5,6
• Fields of education whenever possible• Aggregate data 1998-2005:
Unesco/OECD/Eurostat
80

Graduation rates
• Two broad age groups: 15-19 and 20-24 years old
• ‘Estimation’ of trends in graduation rates per country and education
• Use of E3ME population forecasts• Check with IER forecasts
connecting you to the future
Contact details for further information:
21-22 February 2008, Thessaloniki
Skills for Europe’s Future
Cedefop Skillsnet Agora conference
Rob WilsonInstitute for Employment
ResearchUniversity of WarwickCOVENTRY, CV4 7AL
United [email protected]
Tel: +(44) 2476-523530
Frank CörversResearch Centre for
Education and the Labour Market
Maastricht UniversityThe Netherlands
[email protected]: +(31) 43-3883647
Ben GardinerCambridge Econometrics
Covent GardenCB1 2HS Cambridge
United [email protected]
Tel: +44 1223 464378
81


Working group II:
SKILL NEEDS IN THE SECTORS

Working group II: SKILL NEEDS IN THE SECTORS Chair: Peter Szovics, Cedefop Rapporteur: Bernd Dworschak, Fraunhofer Institute for Industrial Engineering, Germany Presentations: Trends and skill needs in tourism
Henriette Freikamp, ISW - Institute of Structural Policies and Economic Development, Germany Skill needs in an innovative area: nanotechnology Uwe Schumann, ISW - Institute of Structural Policies and Economic Development, Germany From tradition to innovation: skill needs in agri-food chains Martin Mulder, Wageningen University, the Netherlands From restructuring to sectoral skill needs Donald Storrie, European Foundation for the Improvement of Living and Working Conditions EuroSkills 2008 Thom ter Stege, EuroSkills, the Netherlands
In some sectors globalisation, current demographic trends and increasing labour mobility in Europe have contributed to the emergence of a truly European labour market. Other sectors have undergone significant restructuring, adjustment to the knowledge-based economy and a greater interplay of production, distribution and supply chains and interpenetration of primary, secondary and tertiary sectors. These trends have an immense impact on skill needs, the occupational patterns of skills, the emergence of new skill requirements and hybrid occupations. As a result, sectors are experiencing skill gaps and shortages which affect company and sector performances. Providing the appropriate skills is essential for European competitiveness, especially in new technology and innovation. The workshop will look at sectoral case studies and will address the following questions:
• What are the main drivers of change in the sectors?
• What are the main restructuring and adjustments trends and mechanisms in the sectors?
• Which skills are needed in highly knowledge-intensive and innovation sectors?
• Which skills needs are new and emerging?
• What are the implications for policy? Presentations at the workshop will include updated information on sector case studies. At the end of the workshop an up-coming competition EuroSkills 2008 will be briefly presented as a way of promoting skills to wider public.
84

Trends and skill needs in tourism Henriette Freikamp
85

Worldwide tourism is deemed to be a growing sector. Providing 24 million jobs, tourism and the related sectors account for more than 12 % of employment in Europe. In the past ten years, growth in the number of jobs in tourism was higher than the average for the European economy as a whole. German tourism is in line with the current trend and continuously extends sales figures until 2005/2006. Especially business travel, city tourism and cultural tourism increased.
Social mega trends like globalisation, individualisation, technological development as well as the demographic change affect the whole tourism. These general conditions intensify business competition. At the same time they provide innovation pressure. More filed strategies are needed in order to sell tourist products and services. Regarding the sector trends companies react with suited offers:
• individual tourism: short trips, city tourism, language trips,
• new target groups: offers for tourists with restricted mobility, singles etc.,
• increasing health awareness: wellness tourism,
• increasing adventure orientation: event tourism,
• increasing mixture of work life and spare time: language trips, training trips etc.,
• increasing business travel: business travel management.
Referring to these social and sector trends, isw identified new and changed skill needs in tourism. After description of the research methodology the presentation will specify skill developments at the sectors travel design, travel companion for people with restricted mobility and business travel management.
Henriette Freikamp is project manager and senior researcher at the Institute for Structural Policy and Economical Development (isw) in Germany. Since 2000, she is a member of the field of research ‘Education, human resources and organisation research’ under direction of Prof. Dr. Lothar Abicht. Since 2003, she is the assistant manager of this field of research.
Since 2002, she co-ordinated the project ‘trend qualification’ within the German network on early identification of skill needs ‘FreQueNz’. As a result new respectively changed skill needs within 13 sectors were identified: ICT/Multimedia, retail, financial service, health care, wellness, tourism, life science, security services, mobility service, building industry, renewable energies, biologisation and farming.
On behalf of Cedefop, she co-ordinated an international workshop on ‘Trends and skill needs in the tourism sector’ in Germany in April 2004.
On behalf of the German Federal Ministry of Education and Research (BMBF) she researched on new skill needs in the tourism sector in 2006/2007.
86

Institut für Strukturpolitik und Wirtschaftsförderunggemeinnützige GmbH
CEDEFOP Skillsnet Agora conference „Skills for Europe's future“21-22 February 2008, Thessaloniki, Greece
Dipl. Päd. Henriette Freikamp Halle (Saale), February 2008
Trends and skill needs in tourism
Page 2 www.isw-institut.de 21 February 2008
Institut für Strukturpolitik und Wirtschaftsförderunggemeinnützige GmbH
Agenda
Introduction of isw Institut gGmbH
Trends in tourism
Skill needs in tourism at the work fields
- travel design
- travel guidance for individuals with restricted mobility
- business travel management
Page 3 www.isw-institut.de 21 February 2008
Institut für Strukturpolitik und Wirtschaftsförderunggemeinnützige GmbH
Introduction of isw Institut gGmbH
isw = independent, non profit research institution www.isw-institut.de
founded 1991; about 45 employees
based at Halle (Saale); branch offices at Magdeburg, Gera and Berlin
interdisciplinary research: economic research as well as educational research
educational research: since 1999 identification of „trend qualifications“ as a basis for early identification of qualification developments
87
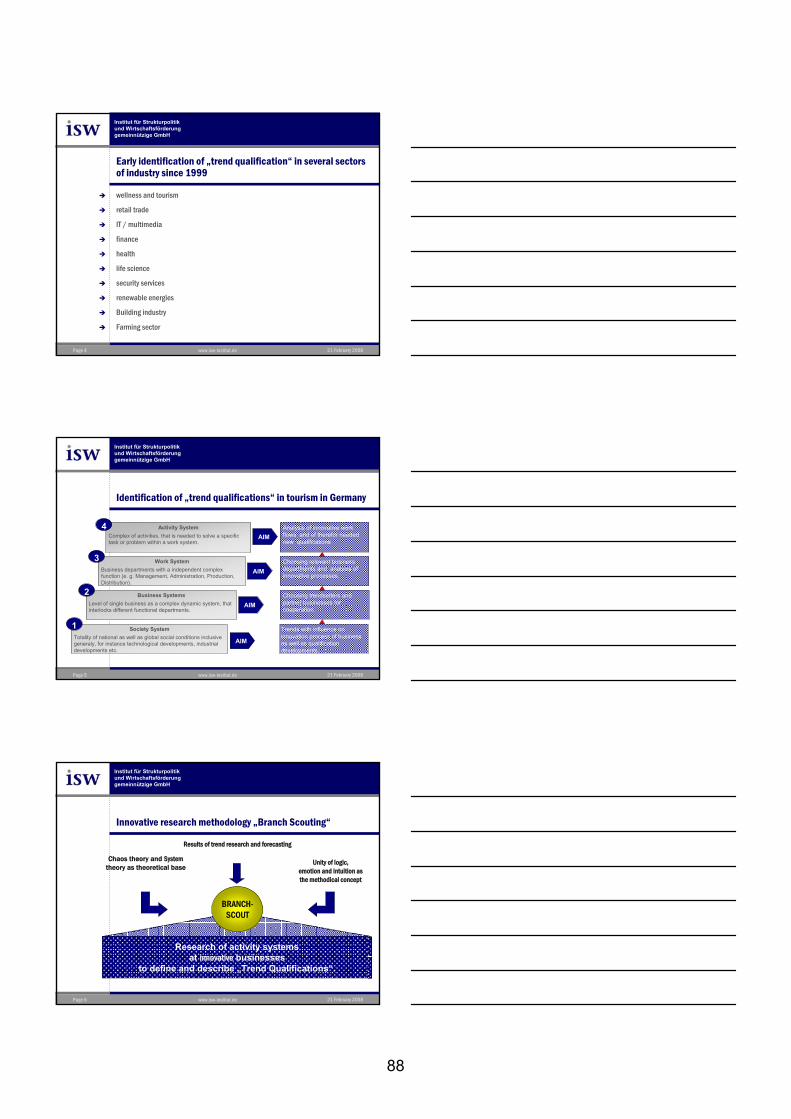
Page 4 www.isw-institut.de 21 February 2008
Institut für Strukturpolitik und Wirtschaftsförderunggemeinnützige GmbH
Early identification of „trend qualification“ in several sectorsof industry since 1999
wellness and tourism
retail trade
IT / multimedia
finance
health
life science
security services
renewable energies
Building industry
Farming sector
Page 5 www.isw-institut.de 21 February 2008
Institut für Strukturpolitik und Wirtschaftsförderunggemeinnützige GmbH
Activity System
Complex of activities, that is needed to solve a specifictask or problem within a work system.
Analysis of innovative workflows and of therefor needednew qualifications
AIM
4
Choosing relevant businessdepartments and analysis of innovative processes.
Work System
Business departments with a independent complexfunction (e. g. Management, Administration, Production, Distribution).
3AIM
Choosing trendsetters and partner businesses forcooperation.
Business Systems
Level of single business as a complex dynamic system, thatinterlocks different functional departments.
2AIM
Trends with influence on innovation process of businessas well as qualificationdevelopments.
Society System
Totality of national as well as global social conditions inclusivegeneraly, for instance technological developments, industrialdevelopments etc.
1
AIM
Identification of „trend qualifications“ in tourism in Germany
Page 6 www.isw-institut.de 21 February 2008
Institut für Strukturpolitik und Wirtschaftsförderunggemeinnützige GmbH
Innovative research methodology „Branch Scouting“
Results of trend research and forecasting
Chaos theory and Systemtheory as theoretical base
Unity of logic, emotion and intuition as the methodical concept
Research of activity systems at innovative businesses
to define and describe „Trend Qualifications“.
BRANCH-SCOUT
88
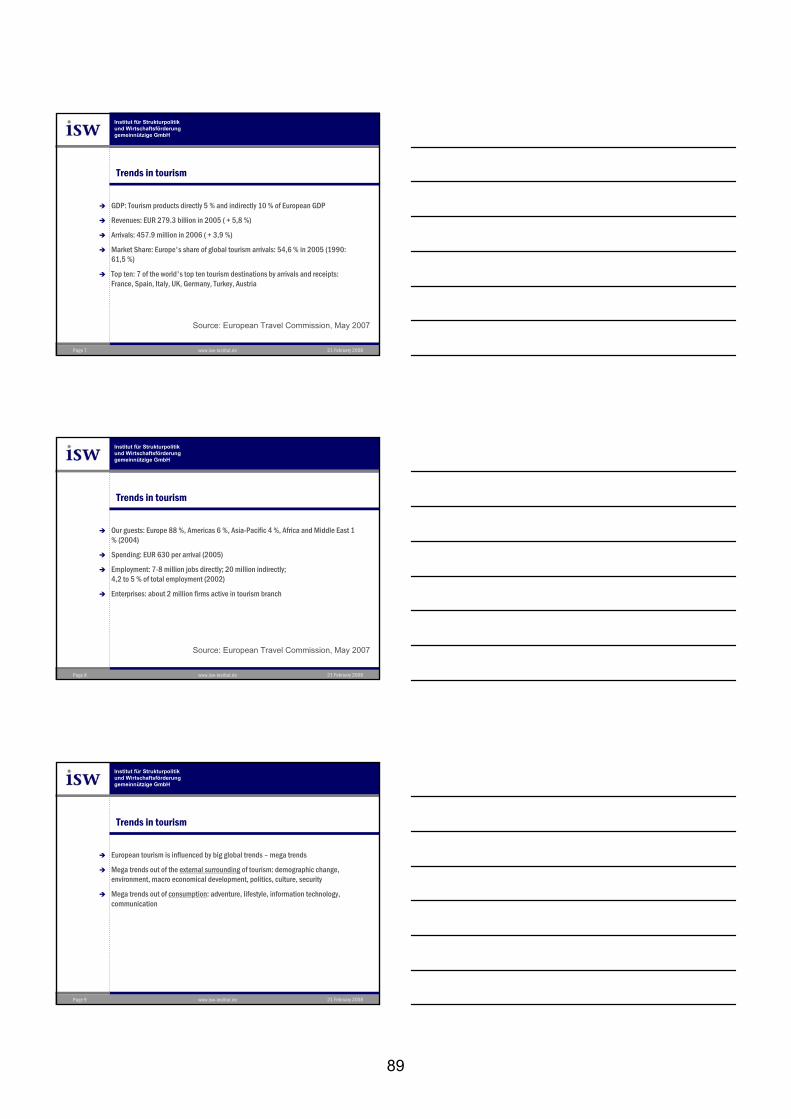
Page 7 www.isw-institut.de 21 February 2008
Institut für Strukturpolitik und Wirtschaftsförderunggemeinnützige GmbH
Trends in tourism
GDP: Tourism products directly 5 % and indirectly 10 % of European GDP
Revenues: EUR 279.3 billion in 2005 ( + 5,8 %)
Arrivals: 457.9 million in 2006 ( + 3,9 %)
Market Share: Europe's share of global tourism arrivals: 54,6 % in 2005 (1990: 61,5 %)
Top ten: 7 of the world's top ten tourism destinations by arrivals and receipts: France, Spain, Italy, UK, Germany, Turkey, Austria
Source: European Travel Commission, May 2007
Page 8 www.isw-institut.de 21 February 2008
Institut für Strukturpolitik und Wirtschaftsförderunggemeinnützige GmbH
Trends in tourism
Our guests: Europe 88 %, Americas 6 %, Asia-Pacific 4 %, Africa and Middle East 1 % (2004)
Spending: EUR 630 per arrival (2005)
Employment: 7-8 million jobs directly; 20 million indirectly; 4,2 to 5 % of total employment (2002)
Enterprises: about 2 million firms active in tourism branch
Source: European Travel Commission, May 2007
Page 9 www.isw-institut.de 21 February 2008
Institut für Strukturpolitik und Wirtschaftsförderunggemeinnützige GmbH
Trends in tourism
European tourism is influenced by big global trends – mega trends
Mega trends out of the external surrounding of tourism: demographic change, environment, macro economical development, politics, culture, security
Mega trends out of consumption: adventure, lifestyle, information technology, communication
89
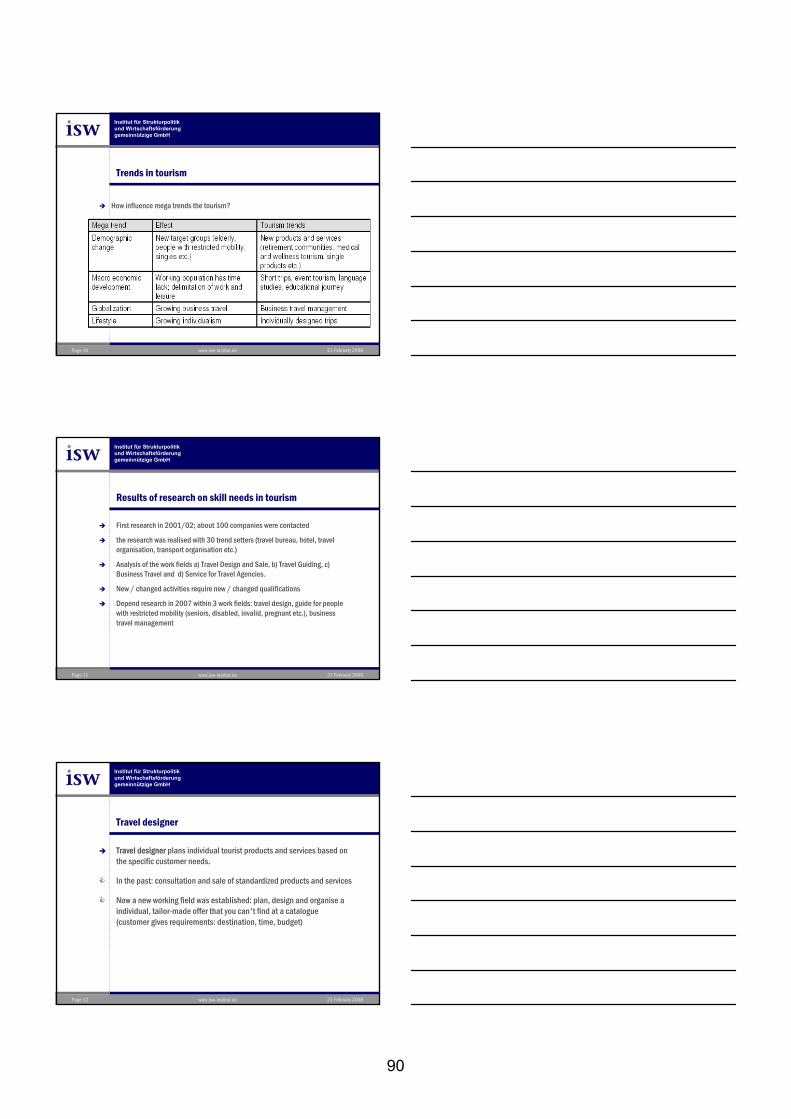
Page 10 www.isw-institut.de 21 February 2008
Institut für Strukturpolitik und Wirtschaftsförderunggemeinnützige GmbH
Trends in tourism
How influence mega trends the tourism?
Page 11 www.isw-institut.de 21 February 2008
Institut für Strukturpolitik und Wirtschaftsförderunggemeinnützige GmbH
Results of research on skill needs in tourism
First research in 2001/02; about 100 companies were contacted
the research was realised with 30 trend setters (travel bureau, hotel, travel organisation, transport organisation etc.)
Analysis of the work fields a) Travel Design and Sale, b) Travel Guiding, c) Business Travel and d) Service for Travel Agencies.
New / changed activities require new / changed qualifications
Depend research in 2007 within 3 work fields: travel design, guide for people with restricted mobility (seniors, disabled, invalid, pregnant etc.), business travel management
Page 12 www.isw-institut.de 21 February 2008
Institut für Strukturpolitik und Wirtschaftsförderunggemeinnützige GmbH
Travel designer
Travel designer plans individual tourist products and services based on the specific customer needs.
In the past: consultation and sale of standardized products and services
Now a new working field was established: plan, design and organise a individual, tailor-made offer that you can't find at a catalogue (customer gives requirements: destination, time, budget)
90
Page 13 www.isw-institut.de 21 February 2008
Institut für Strukturpolitik und Wirtschaftsförderunggemeinnützige GmbH
Travel designer
skill needs:
Individual requirements like communication skills, creativity, organisation ability, motivation, autonomy, ability to work under pressure
Basic knowledge / capability like customer consulting and sale, travel law, knowledge to destinations, products and services, planning and conception of products, presentation, ICT / internet, booking / reservation systems, coordination of cooperation with providers,marketing, calculation, controlling, statistics, negotiation strategies, foreign languages
Page 14 www.isw-institut.de 21 February 2008
Institut für Strukturpolitik und Wirtschaftsförderunggemeinnützige GmbH
Travel guide for individuals with restricted mobility
A Travel guide for persons with restricted mobility guides and cares for older as well as disabled tourists and is responsible for information and organisation during the journey.
Recherché of assessability of destinations, hotels, tours etc.
Individual (even medical) guidance
Page 15 www.isw-institut.de 21 February 2008
Institut für Strukturpolitik und Wirtschaftsförderunggemeinnützige GmbH
Travel guide for individuals with restricted mobility
skill needs:
Individual requirements like farsightedness, communication ability, empathy, patience, conflict ability, organisation ability, motivation, autonomy, ability to work under pressure
Basic knowledge / capability like customer consulting and sale, travel law, knowledge to destinations, products and services, pedagogic, psychology, medical and nursing basics, accessible tourism norms, ICT / internet, booking / reservation systems, calculation, controlling, statistics, negotiation strategies, foreign languages
91
Page 16 www.isw-institut.de 21 February 2008
Institut für Strukturpolitik und Wirtschaftsförderunggemeinnützige GmbH
Business travel manager
Business Travel Manager are responsible for organization and controlling of business travel for single customers as well as for whole businesses.
Organisation, handling and controlling of business travel
Strategies in order to optimise costs but ensure quality; development of travel guidelines, purchase of travel products and services, negotiation with providers etc.
Page 17 www.isw-institut.de 21 February 2008
Institut für Strukturpolitik und Wirtschaftsförderunggemeinnützige GmbH
Business travel manager
skill needs:
Individual requirements like communication skills, patience, organisation and coordination ability, flexibility, motivation, autonomy, reliability, ability to work under pressure, sovereignty
Basic knowledge / capability like requirement analysis, consulting, contracting, law, planning and conception of travel products, development and controlling of intern travel guidelines, presentation, ICT / internet, booking / reservation systems, coordination of cooperation with providers, marketing, calculation, controlling,statistics, negotiation strategies, foreign languages
Page 18 www.isw-institut.de 21 February 2008
Institut für Strukturpolitik und Wirtschaftsförderunggemeinnützige GmbH
Thank you for your attention!
Find the whole results on qualification development and skill needs in tourism sector in Germany under www.frequenz.net.
Thank you for your attention!
Do you have questions or comments?
www.isw-institut.de
92

Skill needs in an innovative area: nanotechnology Uwe Schumann
93
It is scheduled to give an overview on current research results to skill needs on basic, general and specific level in the field of nanotechnology. Moreover innovative qualification requirements, new occupations and courses of study will be picked out as a central theme.
Nanotechnology is a key technology of the 21st century, which is intensified through international competition. This technology represents a very inter-disciplinary field and refers to a wide range of scientific and technological activities. Furthermore it generates great opportunities for industrial productions. The world market sales volume of nanotechnology is predicted to reach one trillion US $ until 2015. Europe holds a significant share in the growth potential, which could create new jobs at different occupational levels: for researchers and scientists and also for a range of technicians and specialists. Because nanotechnology gets pushed through latest R & D-activities it causes novel qualification demands, especially in the following areas:
• Nanomaterials
• Nanoanalytics
• Nanobiotechnology
• Nanoelectronics
• Nanooptics
• Nanosystems, NEMS
Topical results from projects of the isw Institute with German nanotech-enterprises will be presented, providing detailed data.
Uwe Schumann is a Scientist (Diploma biologist) and works as project manager and researcher at the isw Institute in Berlin, Germany. The isw is member of the German network on early identification of skill needs ‘FreQueNz’ as well as the European Network ‘Skillsnet’, co-ordinated by Cedefop. Since 2002, he is a co-worker in the isw Institute area ‘Education, human resources, organisational development and technology oriented research’ under direction of Prof. Dr. Lothar Abicht.
He worked in different projects of the isw, like ‘Identification of Trend-qualifications in the area of Nanotechnology’ in Germany. As a result 18 new qualification profiles were identified, like Nanoanalyst, Specialist for Nanosurfaces or Nanoproduct-adviser.
On behalf of Cedefop, he was co-author of the study ‘Identification of skill needs in Nanotechnology’, which contains information on international level. The study presented a keynote for the workshop ‘Emerging technologies: new skill needs in the field of nanotechnology’, held in Stuttgart in 2005.
94
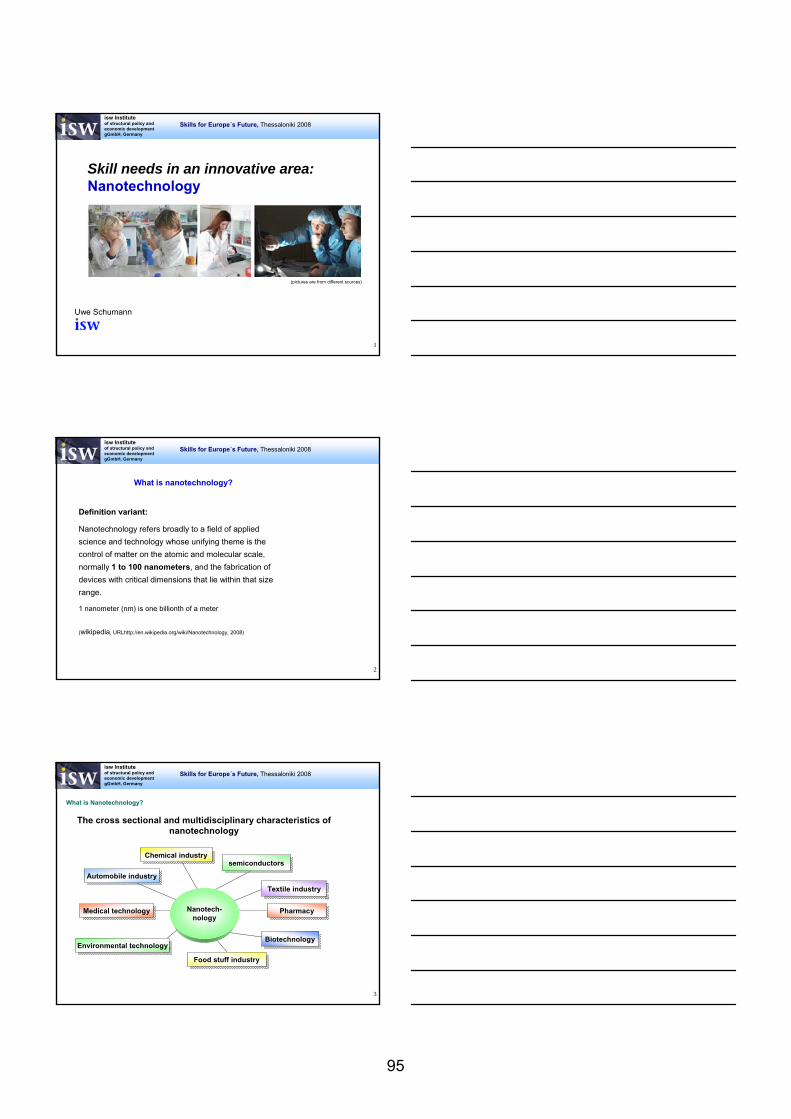
isw Institute of structural policy andeconomic developmentgGmbH, Germany
Skills for Europe´s Future, Thessaloniki 2008
1
Skill needs in an innovative area: Nanotechnology
Uwe Schumann
(pictures are from different sources)
isw Institute of structural policy andeconomic developmentgGmbH, Germany
Skills for Europe´s Future, Thessaloniki 2008
2
What is nanotechnology?
Definition variant:
Nanotechnology refers broadly to a field of applied
science and technology whose unifying theme is the
control of matter on the atomic and molecular scale,
normally 1 to 100 nanometers, and the fabrication of
devices with critical dimensions that lie within that size
range.
1 nanometer (nm) is one billionth of a meter
(wikipedia, URLhttp://en.wikipedia.org/wiki/Nanotechnology, 2008)
isw Institute of structural policy andeconomic developmentgGmbH, Germany
Skills for Europe´s Future, Thessaloniki 2008
3
The cross sectional and multidisciplinary characteristics of nanotechnology
Nanotech-nology
Chemical industryChemical industry
BiotechnologyBiotechnology
Textile industryTextile industry
Food stuff industryFood stuff industry
Automobile industryAutomobile industry
PharmacyPharmacyMedical technologyMedical technology
Environmental technologyEnvironmental technology
semiconductorssemiconductors
What is Nanotechnology?
95
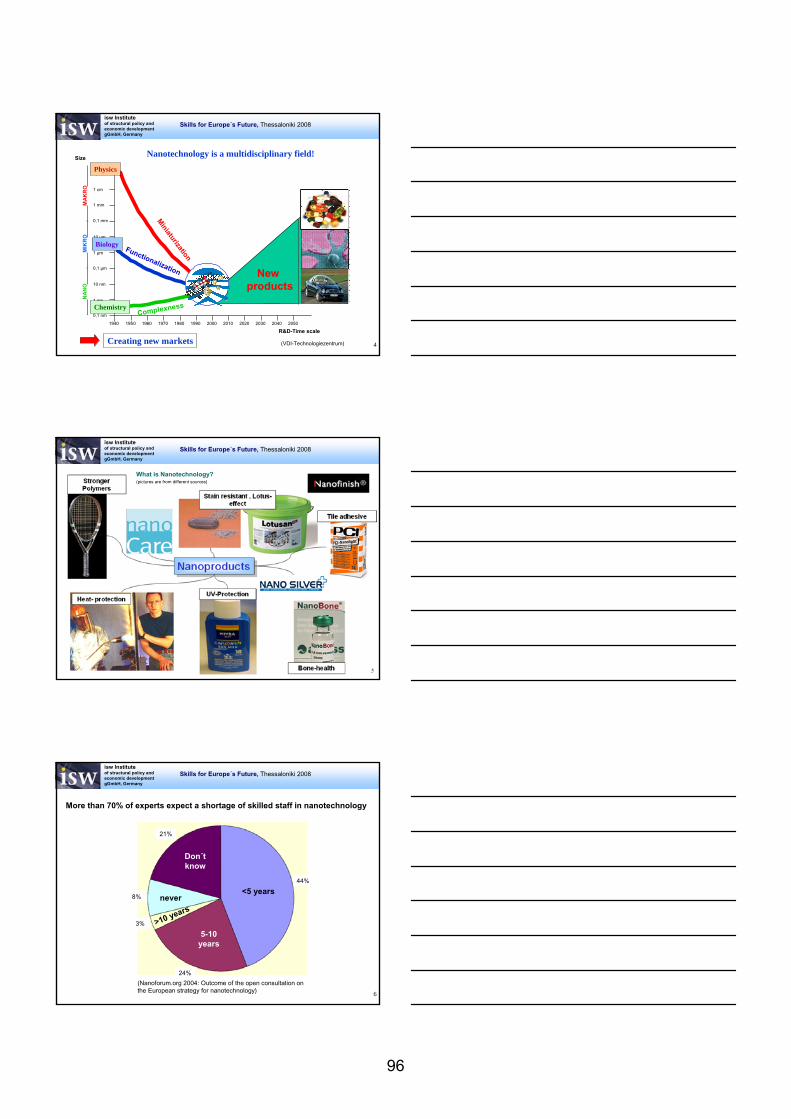
isw Institute of structural policy andeconomic developmentgGmbH, Germany
Skills for Europe´s Future, Thessaloniki 2008
4
Nanotechnology is a multidisciplinary field!
Creating new markets
1940 1950 1960 1970 1980 1990 2000 2010 2020 2030 2040 2050
0,1 nm
1 nm
10 nm
0,1 µm
1 µm
10 µm
0,1 mm
1 mm
1 cm
0,1 m
NA
NO
MIK
RO
Size
Miniaturization
Complexness
MA
KR
O
R&D-Time scale
Physics
Chemistry
New products
Functionalization
Biology
(VDI-Technologiezentrum)
isw Institute of structural policy andeconomic developmentgGmbH, Germany
Skills for Europe´s Future, Thessaloniki 2008
5
What is Nanotechnology? (pictures are from different sources)
isw Institute of structural policy andeconomic developmentgGmbH, Germany
Skills for Europe´s Future, Thessaloniki 2008
6
(Nanoforum.org 2004: Outcome of the open consultation on the European strategy for nanotechnology)
Don´tknow
<5 years
5-10 years
never
>10 years
44%
21%
8%
3%
24%
More than 70% of experts expect a shortage of skilled staff in nanotechnology
96
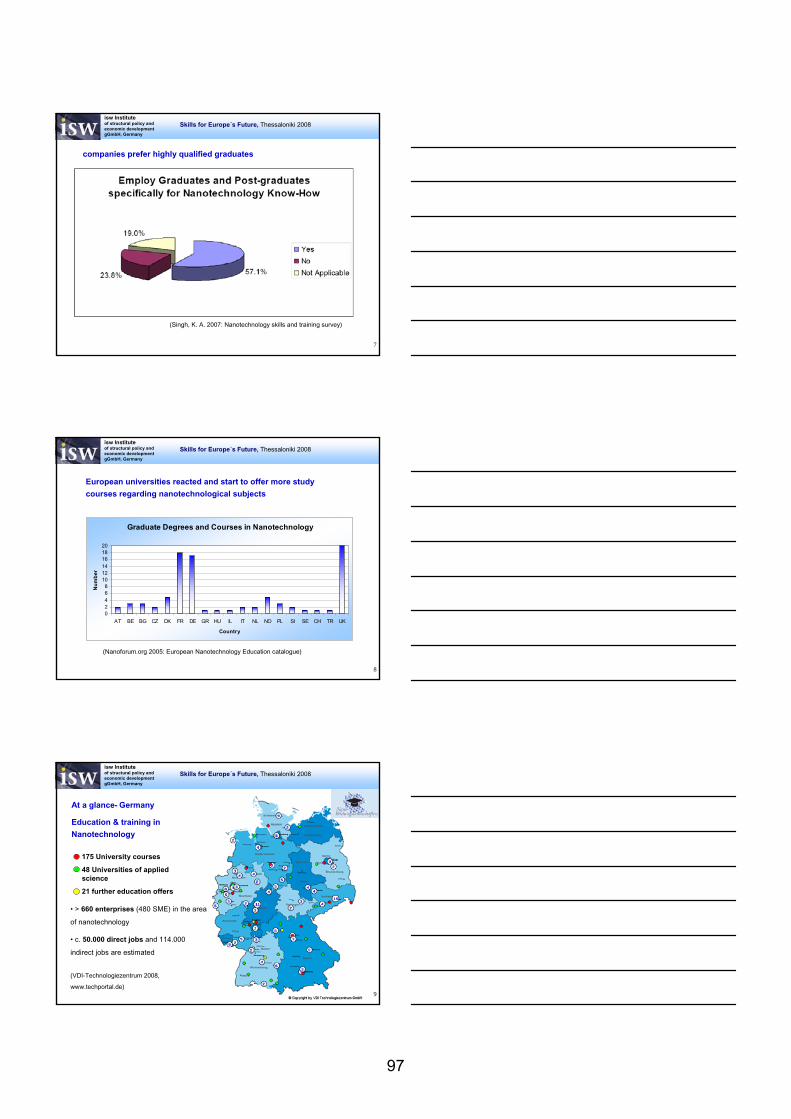
isw Institute of structural policy andeconomic developmentgGmbH, Germany
Skills for Europe´s Future, Thessaloniki 2008
7
(Singh, K. A. 2007: Nanotechnology skills and training survey)
companies prefer highly qualified graduates
isw Institute of structural policy andeconomic developmentgGmbH, Germany
Skills for Europe´s Future, Thessaloniki 2008
8
Graduate Degrees and Courses in Nanotechnology
02468
101214161820
AT BE BG CZ DK FR DE GR HU IL IT NL NO PL SI SE CH TR UK
Country
Nu
mb
er
(Nanoforum.org 2005: European Nanotechnology Education catalogue)
European universities reacted and start to offer more study
courses regarding nanotechnological subjects
isw Institute of structural policy andeconomic developmentgGmbH, Germany
Skills for Europe´s Future, Thessaloniki 2008
9
At a glance- Germany
Education & training in
Nanotechnology
175 University courses
48 Universities of appliedscience
21 further education offers
• > 660 enterprises (480 SME) in the area
of nanotechnology
• c. 50.000 direct jobs and 114.000
indirect jobs are estimated
(VDI-Technologiezentrum 2008,
www.techportal.de)
97
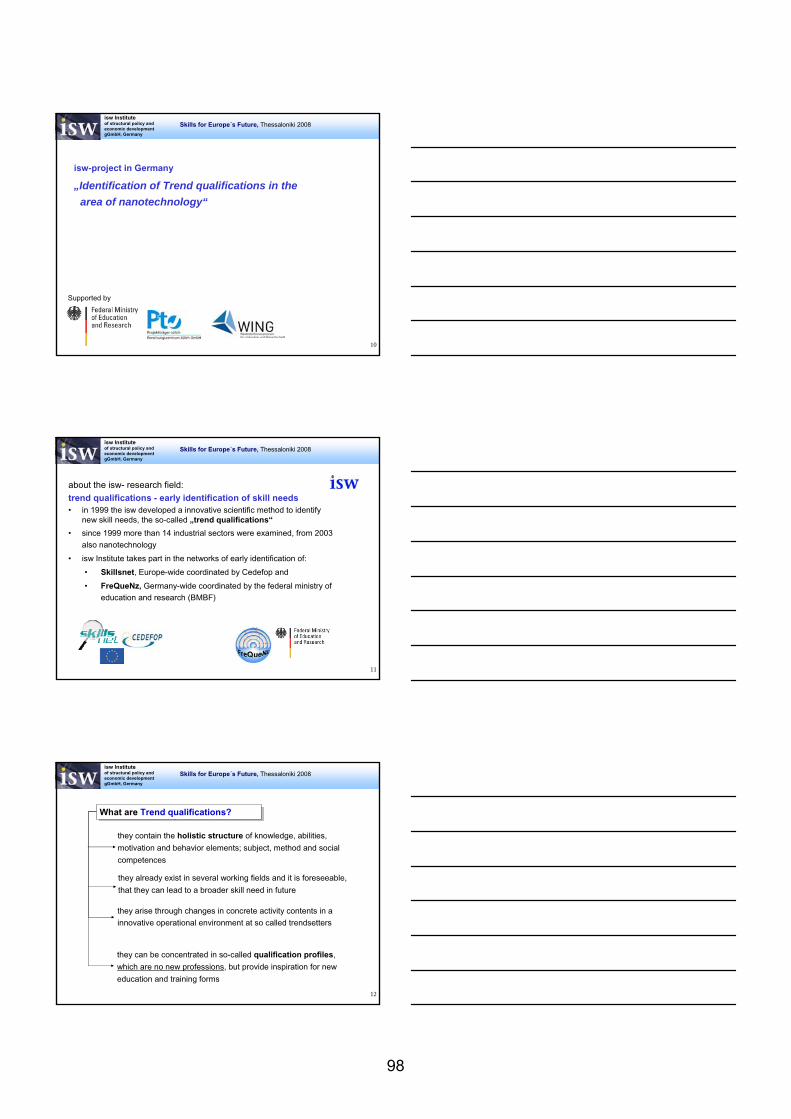
isw Institute of structural policy andeconomic developmentgGmbH, Germany
Skills for Europe´s Future, Thessaloniki 2008
10
isw-project in Germany
„Identification of Trend qualifications in thearea of nanotechnology“
Supported by
isw Institute of structural policy andeconomic developmentgGmbH, Germany
Skills for Europe´s Future, Thessaloniki 2008
11
about the isw- research field: trend qualifications - early identification of skill needs• in 1999 the isw developed a innovative scientific method to identify
new skill needs, the so-called „trend qualifications“
• since 1999 more than 14 industrial sectors were examined, from 2003 also nanotechnology
• isw Institute takes part in the networks of early identification of:
• Skillsnet, Europe-wide coordinated by Cedefop and
• FreQueNz, Germany-wide coordinated by the federal ministry of education and research (BMBF)
isw Institute of structural policy andeconomic developmentgGmbH, Germany
Skills for Europe´s Future, Thessaloniki 2008
12
they arise through changes in concrete activity contents in a innovative operational environment at so called trendsetters
they already exist in several working fields and it is foreseeable,
that they can lead to a broader skill need in future
What are Trend qualifications?What are Trend qualifications?
they contain the holistic structure of knowledge, abilities,
motivation and behavior elements; subject, method and social
competences
they can be concentrated in so-called qualification profiles,
which are no new professions, but provide inspiration for new
education and training forms
98
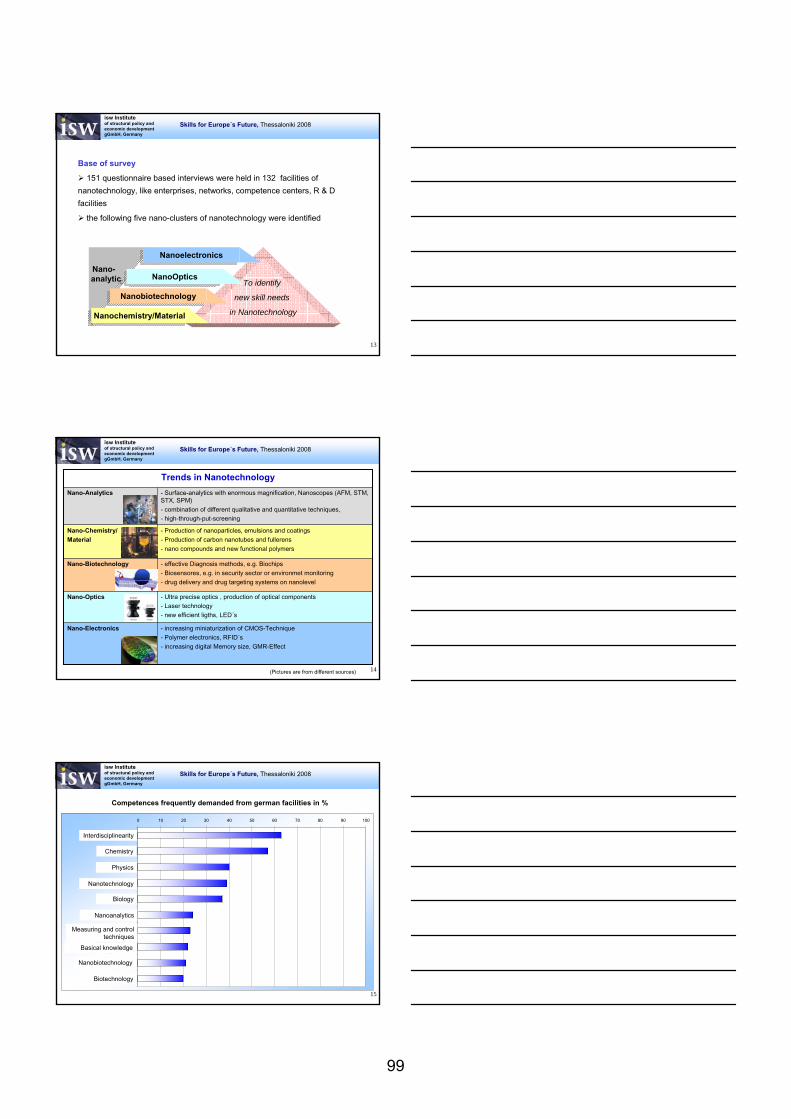
isw Institute of structural policy andeconomic developmentgGmbH, Germany
Skills for Europe´s Future, Thessaloniki 2008
13
Base of survey
151 questionnaire based interviews were held in 132 facilities of
nanotechnology, like enterprises, networks, competence centers, R & D
facilities
the following five nano-clusters of nanotechnology were identified
To identify
new skill needs
in Nanotechnology
Nano-analytic
Nano-analytic
Nanochemistry/MaterialNanochemistry/Material
NanobiotechnologyNanobiotechnology
NanoOpticsNanoOptics
NanoelectronicsNanoelectronics
isw Institute of structural policy andeconomic developmentgGmbH, Germany
Skills for Europe´s Future, Thessaloniki 2008
14
- increasing miniaturization of CMOS-Technique- Polymer electronics, RFID´s- increasing digital Memory size, GMR-Effect
Nano-Electronics
- Ultra precise optics , production of optical components- Laser technology- new efficient ligths, LED´s
Nano-Optics
- effective Diagnosis methods, e.g. Biochips- Biosensores, e.g. in security sector or environmet monitoring- drug delivery and drug targeting systems on nanolevel
Nano-Biotechnology
- Production of nanoparticles, emulsions and coatings- Production of carbon nanotubes and fullerens- nano compounds and new functional polymers
Nano-Chemistry/ Material
- Surface-analytics with enormous magnification, Nanoscopes (AFM, STM, STX, SPM) - combination of different qualitative and quantitative techniques, - high-through-put-screening
Nano-Analytics
Trends in Nanotechnology
(Pictures are from different sources)
isw Institute of structural policy andeconomic developmentgGmbH, Germany
Skills for Europe´s Future, Thessaloniki 2008
15
0 10 20 30 40 50 60 70 80 90 100
Interdisziplinarität
Chemie
Physik
Nanotechnologie
Biologie
Nanoanalytik
Mess- und Regelungstechnik
Basiswissen,Grundlagenwissen
Nanobiotechnologie
Biotechnologie
Competences frequently demanded from german facilities in %
Interdisciplinearity
Chemistry
Physics
Nanotechnology
Biology
Nanoanalytics
Measuring and controltechniques
Basical knowledge
Nanobiotechnology
Biotechnology
99
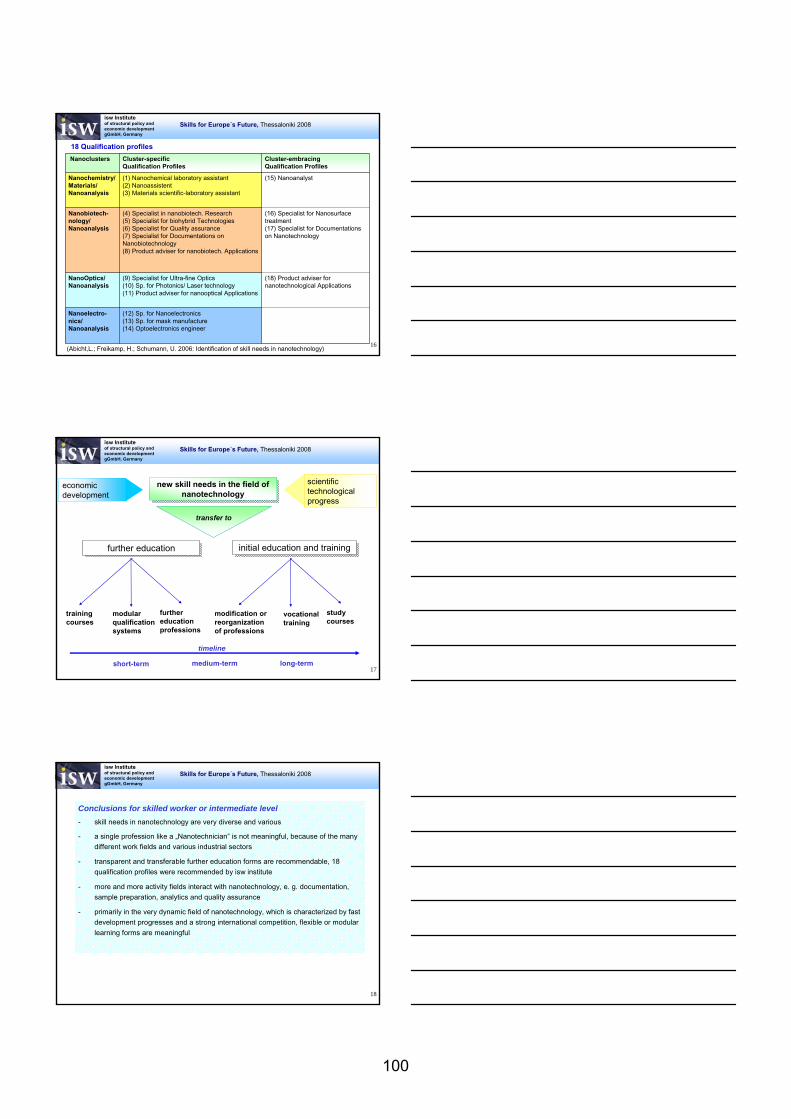
isw Institute of structural policy andeconomic developmentgGmbH, Germany
Skills for Europe´s Future, Thessaloniki 2008
16
(12) Sp. for Nanoelectronics(13) Sp. for mask manufacture(14) Optoelectronics engineer
Nanoelectro-nics/ Nanoanalysis
(18) Product adviser for nanotechnological Applications
(9) Specialist for Ultra-fine Optics(10) Sp. for Photonics/ Laser technology(11) Product adviser for nanooptical Applications
NanoOptics/Nanoanalysis
(16) Specialist for Nanosurfacetreatment(17) Specialist for Documentations on Nanotechnology
(4) Specialist in nanobiotech. Research(5) Specialist for biohybrid Technologies(6) Specialist for Quality assurance(7) Specialist for Documentations on Nanobiotechnology(8) Product adviser for nanobiotech. Applications
Nanobiotech-nology/Nanoanalysis
(15) Nanoanalyst(1) Nanochemical laboratory assistant(2) Nanoassistent(3) Materials scientific-laboratory assistant
Nanochemistry/ Materials/Nanoanalysis
Cluster-embracingQualification Profiles
Cluster-specificQualification Profiles
Nanoclusters
18 Qualification profiles
(Abicht,L.; Freikamp, H.; Schumann, U. 2006: Identification of skill needs in nanotechnology)
isw Institute of structural policy andeconomic developmentgGmbH, Germany
Skills for Europe´s Future, Thessaloniki 2008
17
new skill needs in the field of nanotechnology
new skill needs in the field of nanotechnology
further educationfurther education
economicdevelopment
scientifictechnologicalprogress
trainingcourses
transfer to
initial education and traininginitial education and training
furthereducationprofessions
modular qualificationsystems
modification orreorganizationof professions
studycourses
vocationaltraining
short-term medium-term long-term
timeline
isw Institute of structural policy andeconomic developmentgGmbH, Germany
Skills for Europe´s Future, Thessaloniki 2008
18
Conclusions for skilled worker or intermediate level- skill needs in nanotechnology are very diverse and various
- a single profession like a „Nanotechnician“ is not meaningful, because of the manydifferent work fields and various industrial sectors
- transparent and transferable further education forms are recommendable, 18 qualification profiles were recommended by isw institute
- more and more activity fields interact with nanotechnology, e. g. documentation, sample preparation, analytics and quality assurance
- primarily in the very dynamic field of nanotechnology, which is characterized by fast development progresses and a strong international competition, flexible or modular learning forms are meaningful
100

isw Institute of structural policy andeconomic developmentgGmbH, Germany
Skills for Europe´s Future, Thessaloniki 2008
19
isw- project in Brandenburg
„NANO TO BUSINESS - Supporting and strengthen the know-how-transfer from science to enterprises“
The Project "Nano to Business" is promoted by the European Social Fund (ESF) and theMinistry of labour, social, health and family in the Land Brandenburg
N an oBusiness
N an oBusiness
N an oBusiness
isw Institute of structural policy andeconomic developmentgGmbH, Germany
Skills for Europe´s Future, Thessaloniki 2008
20
The objectiveis to initiate, co-ordinate and support knowledge-transfer from science to enterprises
The main focuslies in the innovation management of newproducts and techniques in enterprises
The project comprisesindividual development of competences, throughvarious knowledge-transfer-forms
Pilot scheme „NANO to Business“
Know-how Transfer
Please visit us under www.isw-institut.de/nano-brandenburg
isw Institute of structural policy andeconomic developmentgGmbH, Germany
Skills for Europe´s Future, Thessaloniki 2008
21
NT Competencecenters
in Germany
NT Competencecenters
in Germany
Universities/-College
Universities/-College
R&D facilities, fraunhofer, max-
planck
R&D facilities, fraunhofer, max-
planck
German Nanotech-enterprises
German Nanotech-enterprises
“Nano to Business”Initiates, co-ordinates and supports
active know-how-transfer
10 Unternehmen (KMU) in Brandenburg
10 Unternehmen (KMU) in Brandenburg
Enterprises (SME) in Brandenburg
Enterprises (SME) in Brandenburg
New nanoproducts
New nanoproducts New techniquesNew techniques
101

isw Institute of structural policy andeconomic developmentgGmbH, Germany
Skills for Europe´s Future, Thessaloniki 2008
22
Outlook:
New isw-project to identify further education needs in German Nanotech-
enterprises
The study will be published in the second half-year of 2008
Research objectives:
- How big is the quantitative need of further education in the area of nanotechnology?
- What are the important technological, social and methodical competences, which
should be taught?
- What are the best ways for employees with an age of 50+ to use further education on
their specific occupational field in nanotechnology?
Supported by
isw Institute of structural policy andeconomic developmentgGmbH, Germany
Skills for Europe´s Future, Thessaloniki 2008
23
Thank you for your attention!
Uwe Schumann isw Institute of structural policy andeconomic developmentgGmbH
Branch office BerlinPetersburger Str. 94D-10247 BerlinTel: +49 30 42 02 47 25Fax: +49 30 42 02 47 [email protected]
102
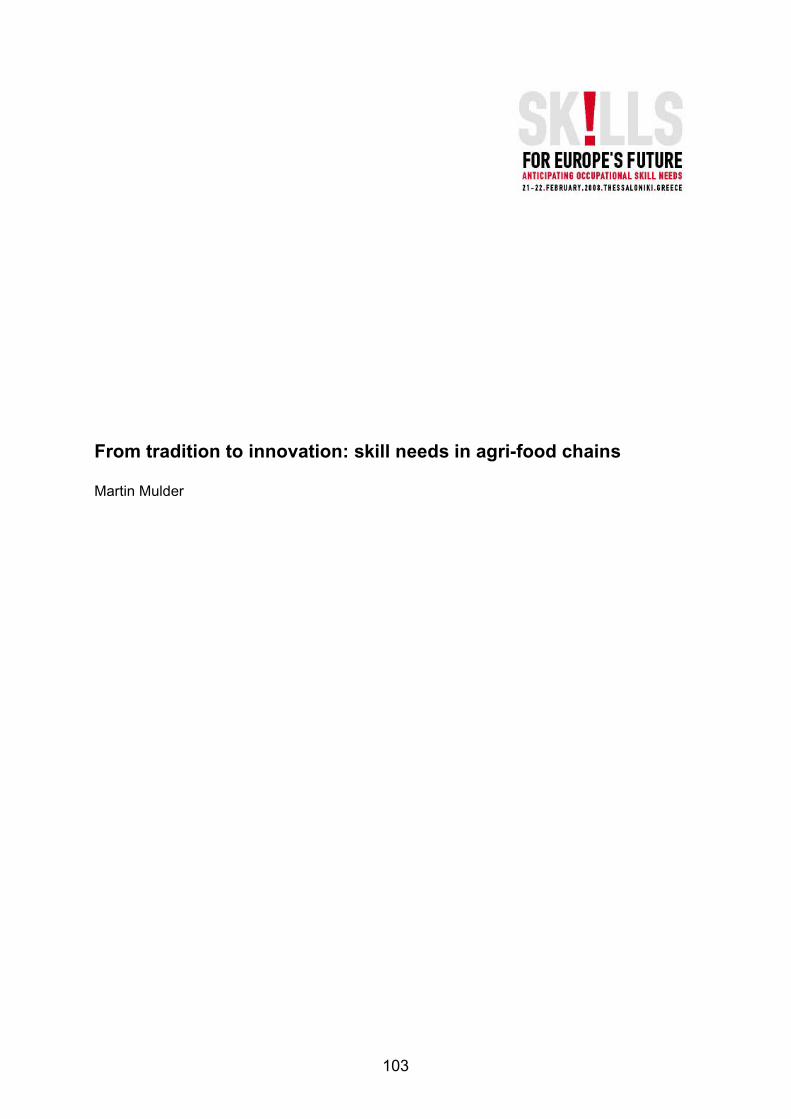
From tradition to innovation: skill needs in agri-food chains Martin Mulder
103
The agri-food sector faces dramatic change. Regulation of primary production, multifunctional land-use, measures regarding environmental care, licensing of production, supply chain management, chain certification, legislation about chain liability, backward and forward chain integration, innovation of products and processes, the introduction of ICT in logistics, public concern about food safety and animal welfare, competing claims on crops to fulfil differential needs of companies, consumers, and rural populations, poverty reduction, economic and labour market restructuring, international sourcing, scale enlargement, employee cost reduction, they all make the sector extremely complex. These changes, or rather, the transformation of the sector, creates many new skills needs, which were reviewed by studying literature and exchange of information and experience of various experts in the field of European policy, knowledge institutes and companies.
When we reflect on the transition of the agri-food sector, we have to take into account that the socio-economic structure and employment outlook is very diverse. On the one hand we have the individual small-holder who uses traditional production methods, and on the other hand there are the multinational food companies who employ tens of thousands of employees around the globe. Furthermore, the agri-sector is also referred to as the agri-food complex, indicating that it embraces primary production, trade, industry (such as food and feed manufacturers), private services (such as banks, insurance companies, sectoral organisations and associations) and public services (legislation and regulation regarding product quality and public health). And finally, the workers in this complex have very diverse occupations at very different levels, from the low educated subsistence farmer to the PhD in bio-nanotechnology.
Nevertheless, a series of generic and transversal skills can be discerned. New business models, entrepreneurship, co-operation, administration, sustainable energy, leisure, (eco-) tourism, country-side living, health care, regional products, nature conservation, persuasive communication, hospitality, product innovation, services, internal organisation and human resources management, international marketing, finance, logistics, finance and control, asset management (including skills with dealing with the construction and property consultancy sector), international law and regulations (trade tariffs and barriers, trade regulations regarding quantities and quality control), dealing with importing and exporting organisations, creating foreign establishments, communication with foreign authorities and market organisations (such as export associations), intercultural communication with local managers and employees, and national, regional and local labour relations, backward supply-chain integration, process innovation, co-operation, interdisciplinary understanding, collective cost reduction and quality improvement in alliances and innovation projects, political sensitivity, corporate social responsibility and integrity, Hazard Analysis and Critical Control Points, implementation, operating and maintenance of new production and harvesting devices, knowledge-sharing and together with that, knowledge-protection against hostile competition, and ensuring intellectual property, are rich fields of new skills needs.
Martin Mulder is professor and head of the Department of Education and Competence Studies at Wageningen University, the Netherlands. His research is about change processes and the resulting competence needs for entrepreneurs, managers, employees, students and pupils, for not only coping with change, but also to establish innovation. He conducted a project for Cedefop on the identification of future skills needs in the agri-food and forestry-wood sectors. He is currently chairman of the editorial committee of the peer reviewed European Journal of Vocational Training, which is published by Cedefop, and editor of the also peer reviewed Journal of Agricultural Education and Extension, published by Taylor and Francis. He has conducted various research projects and (co) authored and (co) edited over 300 academic and professional books, book chapters and articles in the field of initial and continuing vocational education and training, education in the professions, and human resource development and management.
E-mail: [email protected]; Internet: www.ecs.wur.nl and www.mmulder.nl
104
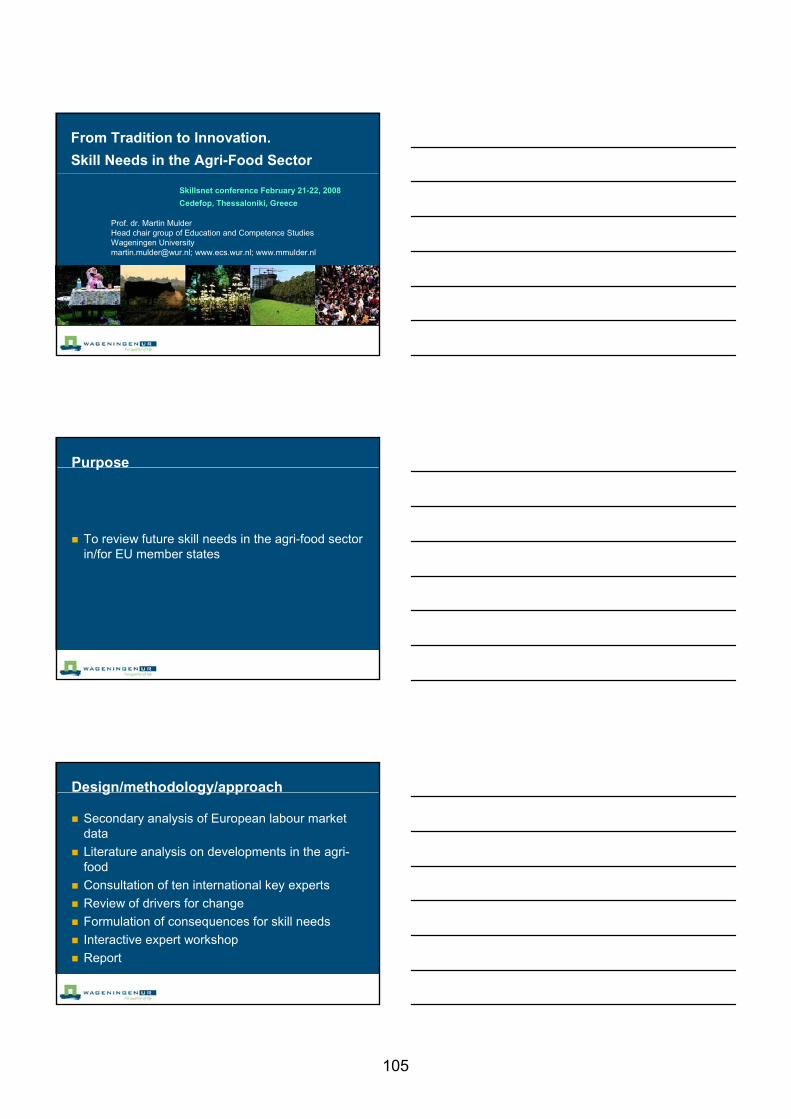
From Tradition to Innovation.
Skill Needs in the Agri-Food Sector
Prof. dr. Martin MulderHead chair group of Education and Competence StudiesWageningen [email protected]; www.ecs.wur.nl; www.mmulder.nl
Skillsnet conference February 21-22, 2008
Cedefop, Thessaloniki, Greece
Purpose
To review future skill needs in the agri-food sector in/for EU member states
Design/methodology/approach
Secondary analysis of European labour market data Literature analysis on developments in the agri-foodConsultation of ten international key expertsReview of drivers for changeFormulation of consequences for skill needsInteractive expert workshopReport
105
Experts from
EU level employers’ organisationsEU level employee organisationsDG Agriculture and Rural Development of the European CommissionIndustryAgricultural and food education
Expertise in
European agricultureRural developmentFood manufacturingFisheriesOrganic productionConsumer studiesFood riskManagement and economics
Skills observatories consultedAustria - Qualification barometerFinland - ‘Anticipating the Quantitative Educational Needs in Vocational Education and Training’ - National Board of EducationIreland - Expert Group on Future Skills NeedsThe Netherlands - sectoral knowledge centersThe UK - sector skills councils Czech Republic - The National Observatory of Employment and TrainingGermany - The FreQueNz Network on ‘Early identification of skills needs’France - The Observatoires prospectifs des métiers et des qualificationsNorway – Fafo + project Qualification, competence, and continuing - and vocational education
106
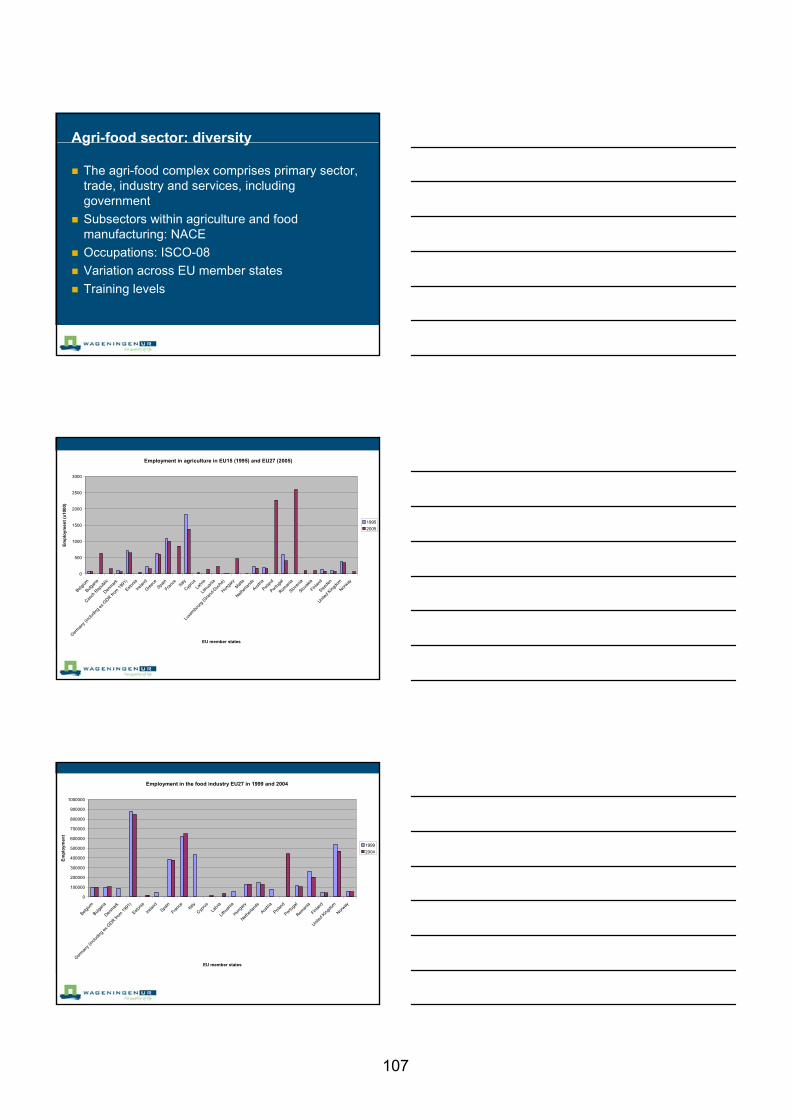
Agri-food sector: diversity
The agri-food complex comprises primary sector, trade, industry and services, including governmentSubsectors within agriculture and food manufacturing: NACEOccupations: ISCO-08Variation across EU member statesTraining levels
Employment in agriculture in EU15 (1995) and EU27 (2005)
0
500
1000
1500
2000
2500
3000
Belgium
Bulgar
ia
Czech
Rep
ublic
Denm
ark
Germ
any (
includ
ing e
x-GDR fr
om 19
91)
Estonia
Irelan
d
Greec
eSpa
in
Franc
eIta
ly
Cypru
s
Latvi
a
Lithu
ania
Luxe
mbour
g (G
rand
-Duc
hé)
Hunga
ryM
alta
Nethe
rland
s
Austri
a
Poland
Portu
gal
Roman
ia
Sloven
ia
Slovak
ia
Finlan
d
Sweden
United
King
dom
Norway
EU member states
Em
plo
ymen
t (x
1000
)
1995
2005
Employment in the food industry EU27 in 1999 and 2004
0
100000
200000
300000
400000
500000
600000
700000
800000
900000
1000000
Belgium
Bulgar
ia
Denm
ark
Germ
any (
includ
ing e
x-GDR fr
om 19
91)
Estonia
Irelan
dSpa
in
Franc
eIta
ly
Cypru
s
Latvi
a
Lithu
ania
Hunga
ry
Nethe
rland
s
Austri
a
Poland
Portu
gal
Roman
ia
Finlan
d
United
King
dom
Norway
EU member states
Em
plo
ymen
t
1999
2004
107
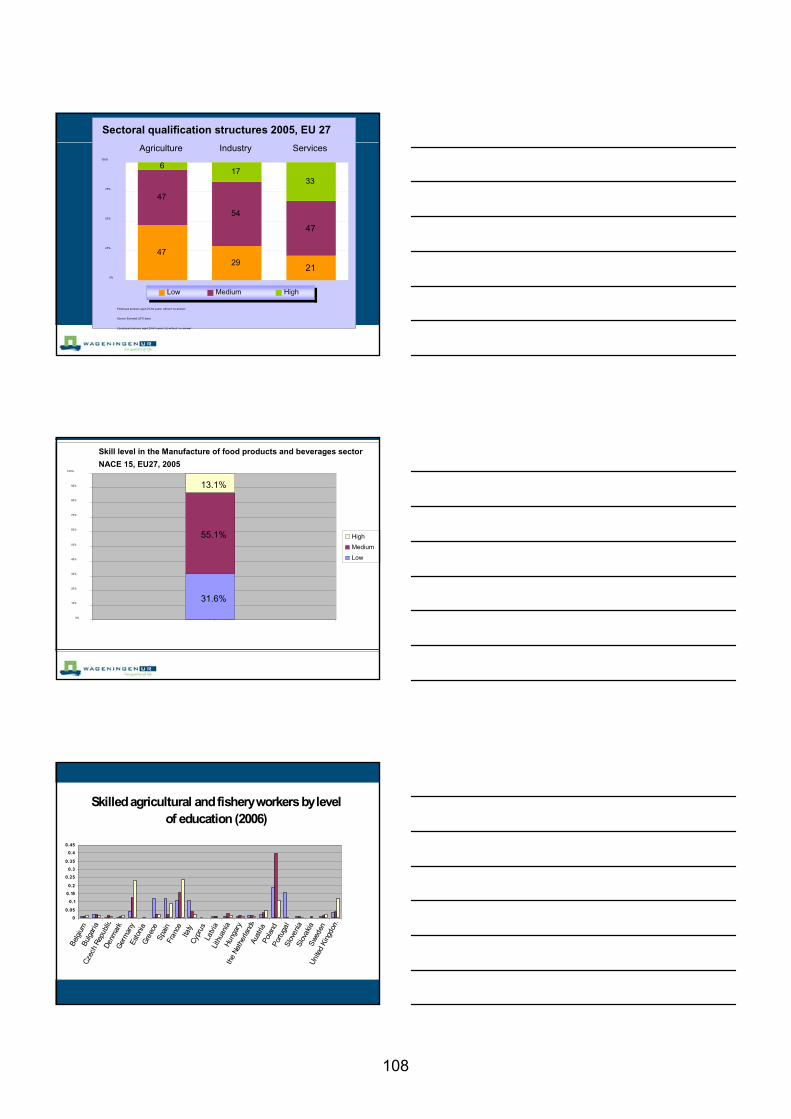
4729
21
47
54
47
617
33
0%
25%
50%
75%
100%
Agriculture Industry Services
Low Medium High
Sectoral qualification structures 2005, EU 27
Employed persons aged 25-64 years; without ‘no answer’.
Source: Eurostat (LFS data)
) Employed persons aged 25-64 years; (b) without ‘no answer’.
Skill level in the Manufacture of food products and beverages sector
NACE 15, EU27, 2005
31.6%
55.1%
13.1%
0%
10%
20%
30%
40%
50%
60%
70%
80%
90%
100%
High
Medium
Low
Skilled agricultural and fishery workers by level of education (2006)
0
0.05
0.1
0.15
0.2
0.25
0.3
0.35
0.4
0.45
Belg
ium
Bulg
aria
Czec
h Re
publ
icDe
nmar
kG
erm
any
Esto
nia
Gre
ece
Spai
nFr
ance
Italy
Cypr
usLa
tvia
Lith
uani
aHu
ngar
yth
e Ne
ther
land
sAu
stria
Pola
ndPo
rtuga
lSl
oven
iaSl
ovak
iaSw
eden
Unite
d Ki
ngdo
m
108
Major developments – future forces
Stronger regulationSustainabilityGlobalisationCompetitionClimate changeDealing with the public Chains and networksTechnological innovationAgeing workforce
Generic and transversal skill needs - 1
Implementing new business models; entrepreneurship; trustful co-operation in competitive areas; administration resulting from new regulations; implementing sustainable forms of energy use; realising provisions for rural leisure facilities; preserving the cultural countryside heritage and (eco-) tourism; country-side living; creating and maintaining health care services in refurbished farms; producing regional food specialties; realising nature conservation; using persuasive communication; creating rural hospitality services; realising product innovation; creating service businesses in rural areas; dealing with internal organisation and human resources management; dealing with international marketing; getting to know new and current ways offinancing the enterprise; working with advanced systems of logistics; implementing strategic systems of finance and control; getting to know and handle asset management, including skills with dealing with the construction and property consultancy sector
Generic and transversal skill needs - 2Acquiring knowledge about international law and regulations, such as trade tariffs and barriers, trade regulations regarding quantities and quality control; dealing with importing and exporting organisations; creating foreign establishments; communicating with foreign authorities and market organisations, such as export associations; intercultural communication with local managers and employees; effectively working on national, regional and local labour relations; dealing with the issues regarding backward supply-chain integration; creating and implementing process innovation; in-cluster co-operation and knowledge sharing; interdisciplinary understanding; searching for collective cost reduction and quality improvement in alliances and innovation projects, political sensitivity; corporate social responsibility and integrity; Hazard Analysis and Critical Control Points; implementation, operating and maintenance of new production and harvesting devices; knowledge-sharing and together with that, knowledge-protection against hostile competition; and ensuring intellectual property
109

Findings - 1
The labour market in the agri-food market is decreasing, but the complexity of the work is increasing. Transversal developments in the sectors are related to stronger regulation, sustainability, globalisation, competition, climate change, dealing with various publics, working in chains and networks, technological innovation and the ageing workforce.
Findings - 2
Examples of skills found are:the ability to learn from conflict, to realise innovation in
networks, to think out-of-the-box, to creatively find and use opportunities, having international market knowledge, the ability to deal with national and international trading systems, logistics, and intercultural communication, and many others.
The skills needs described vary significantly by business model.
Furthermore: skill needs in …
Entrepreneurship (Lans, Biemans, Verstegen & Mulder, 2007; Mulder, Lans, Verstegen, Biemans & Meijer, 2007),
Agricultural consultancy (Shim, 2006)
Open innovation teams (Du Chatenier, Biemans, Verstegen & Mulder, 2007)
Dealing with various expectations of the public(Mulder & Eernstman, op cit).
110
Practical implications
Educational institutions, but also organisations in the agri-food sector themselves, can use the overview of new skill needs to create new training and development programs.
Further research
Further empirical research is needed by using primary data collection regarding the skill needs by using a stratified sampling technique. This will yield more specific information from certain sectors
in certain local, regional, national or supra-national circumstances, for more specific job categories and educational fields and education levels.
Such research requires a long-term perspective to be able to assess gradual and revolutionary changes in skill needs.
111
Re-skilling and other measures for workers displaced at restructuring Donald Storrie
112
This paper highlights the methodological weaknesses of most evaluations of re-skilling and other policies for workers displaced at restructuring. Given the scarcity of reliable evaluations it draws upon the firmer based active labour market policy evaluation literature (targeted to the unemployed) to examine the lessons that may be applied to displaced workers. It argues that there are a number of reasons why job matching and counselling services may be particularly efficient. It is exceedingly difficult to generalise on the type of skills that should be provided as this depends on the state of the particular labour market. However, the few proper evaluations of labour market policies addressed to displaced workers suggests that the policy efforts must be extensive and include a significant amount of general schooling. It is emphasised that “crowding-out effects” i.e. when policy serves to secure a job to the programme participant, which would otherwise had gone to someone else, is particularly problematic when conducting policy for displaced workers.
Donald Storrie is acting Head of Unit of the European Monitoring Centre on Change (EMCC) at European Foundation for the Improvement of Living and Working Conditions in Dublin. Before joining the European Foundation, he was Director of the Centre for European Labour Market Studies at the University of Gothenburg. He has participated in many European research projects and was for many years a member of the European Employment Observatory. His has published research on a wide range of topics including; temporary work, the impact of job displacement on employee welfare, structural change in Europe and many evaluations of active labour market policy. The latter studies were largely performed while he was employed by the Swedish Ministry of Labour. He has also lectured mathematics in Norway and was editor of Business Survey, at Dagens Industri - the major Swedish business daily newspaper. He holds a BSc in Mathematics and a PhD in Economics.
113

Re-skilling and other measures for workers displaced at restructuring
Donald Storrie, European Foundation for the Improvement of Living and Working Conditions, Dublin, Ireland Paper prepared for Skillsnet Agora Conference 21-22 February 2008
Introduction The fundamental concept of economic efficiency is allocative efficiency, i.e. that resources (labour and capital) are allocated to the economic activities in which they yield the greatest economic welfare.1 Similarly GDP growth hinges crucially upon the resources being re-allocated in response to shifts in supply and demand. This reallocation can occur internally, within the firm, or externally between firms and sectors. Ideally, the required adjustment of labour resources would occur within the firm (and by aggregation within the sector) by the re-skilling of the existing workforce to speedily provide the firm with the new skills and avoid the unemployment that often accompanies external re-allocation. The identification of current and future skill needs in sectors in the European Union is the subject of a major study covering 17 sectors recently initiated by DG-Employment. Existing EU level studies of skills needs by sector include various CEDEFOP publications2 and those from the European Monitoring Centre for Change, though the latter have a broader sector orientation than just skill needs. However, one can assume that even with the best possible anticipation by either the firm or policy makers, structural change will continue to lead to jobs being lost and workers becoming unemployed. The purpose of this paper is to examine what type of policy should be applied when this occurs.
1 This paper draws extensively from the following research, which substantiates many of the arguments
in this paper and provides extensive references to evaluation of active labour market policy and the displaced workers research findings; • Eliason M. and D. Storrie (2008) “Does job loss shorten life” Forthcoming in Journal of Human
Resources • Ohlsson, H. and D. Storrie, (2007), ‘Long-term effects of public policy for displaced workers in
Sweden – shipyard workers in the West and miners in the North’, Working Paper Series No 2007:19, Department of Economics, Uppsala University.
• Storrie D. and Ward T. (2007) Restructuring and Employment in the EU: The Impact of Globalisation. ERM Report 2007. European Foundation for the Improvement of Living and Working Conditions.
• Eliason M. and D. Storrie (2006) “Lasting or Latent Scars? Swedish Evidence on the Long-Term Effects of Job Displacement” Journal of Labor Economics, 2006, vol. 24, no. 4.
• Ohlsson, H and D Storrie (2006) Friställd eller anställd? Strukturomvandling från individens perspektiv” ekonomisk debatt no 7
2 See for example, Zukersteinova Alena and Olga Strietska-Ilina (eds) Towards European skill needs forecasting, Cedefop Panorama series; 137, Luxembourg: Office for Official Publications of the European Communities, 2007.
114

1
It starts by explaining why most evaluations of training and other measures at restructuring lack the basis upon which evidence based policy conclusions can be made. Then, by drawing on the active labour market policy (ALMP) literature, it show how such evaluations can and should be conducted. The approach in this paper is then to examine what conclusions from the evaluations of ALMP in general that may be applicable to the particular circumstances of displaced workers. The main conclusions are that there should be a very important role for job matching services such as intensified job search and career counselling. It is exceedingly difficult to generalise on the type of skills that should be provided as this depends on the state of the particular labour market in which the restructuring occurs. However, the very few proper evaluations of labour market policies addressed to displaced workers suggests that the policy efforts must be extensive and include a significant amount of general schooling. When positive effects are found for participants in such programmes they are not immediate and thus suggest a longer follow up period than typically has been the case.
How to evaluate policy at restructuring: lessons from Active Labour Market Policy. A full and proper evaluation of the impact of policy requires three levels of analysis. Firstly, to measure the value added of policy interventions for the participants (a micro evaluation), then the impact of the measures on others (a macro evaluation) and finally a judgement of whether the cost of the measures was worth the money (a cost-benefit analysis). Micro evaluations require that one first identifies the labour market outcome for the policy participants (workers displaced at restructuring) and then to compare this with the (hypothetical) scenario of the labour market outcome for these people had policy not have been implemented. Obtaining a control group to represent the alternative scenario is the key issue in programme evaluation. Once the two samples are identified, multivariate analysis is used to control for differences in factors that influence the labour market outcome for the two groups. Ideally, this should ensure that the difference in labour market outcomes between the two groups is solely attributable to the policy measures and thus is the impact of policy on outcomes identified. The main methodological problem is that the selection process into a programme, either on the initiative of the participant or a policy administrator, may be due to factors that are very difficult to measure, such as motivation, health or capability, and thus difficult to control for. There are, of course, innumerable follow-up studies of workers displaced at restructuring where active policy measures have been applied. However, there are exceptionally few such studies that have any possibility, even in principle, of determining the added value of policy on labour market outcomes, due to the difficulty in identifying an appropriate control group. While there are registers or other sampling
115

2
frames of unemployed people from which to extract a control group of non-participants, there is no obvious and easily accessible such sampling frame for displaced workers. The selection problem is also typically more problematic. Moreover, measures at restructuring are applied very differently, by different actors and with widely varying degrees of support, thus making generalisations very difficult. However, even properly conducted micro evaluations are limited as they do not take account of how policy measures may affect other members of the local labour force. For example, if training measures led to a worker displaced at restructuring getting a job that otherwise would have gone to someone else, this negative “crowding-out effect” should be subtracted from the overall measure of policy outcome. In the case of ALMP addressed to specific groups of disadvantaged (handicapped, long-term unemployed etc), a rational policy maker might be able to accept such crowding out on the basis of equity. However, it is difficult to see how equity considerations can motivate priority given to workers displaced at restructuring over other job seekers, particularly if they are unemployed. It is important to stress the policy implications of “crowding out”. The most common measure of success of policy after restructuring is the re-employment rate of the displaced workers. 3 Expressed somewhat provocatively, one could state that the re-employment rate is simply a measure of the success that the displaced workers had in winning the competition with other members of the local force (in particular the unemployed) for the available vacancies. The extent to which policy gave them such an advantage is obviously of concern as compared to the targeting of disadvantaged groups there is no social motivation for this priority. This argument assumes, correctly I would argue, that ALMP does not create new job vacancies and implies that successful policy at restructuring requires regional and industrial policy initiatives. It also suggests that only examining the re-employment rate of the displaced workers and comparing this to that of a control group, is not a sufficient measure of overall policy success and requires the analysis of macro indicators such as the local employment and unemployment rates.
What type of Active Labour Market Policy works for the unemployed? This section examines the results of ALMP policy in general, i.e. mainly to the unemployed. Following sections examine how these general results could be applied to policies for workers displaced at restructuring.
3 The re-employment rate of displaced workers is the recommended measure for the measuring the
impact of ALMP measures by the European Commission. EU Commission, ‘Impact evaluation of the EES overview of technical analysis’,EMCO/21/060602/EN_REV 1, Brussels, EU Commission, 2002.
116
3
Most ALMP evaluations of training programmes find modest positive effects, particularly for those with better labour market prospects and adult women, though by no means all do.4 A particular weakness of the evaluations in general is the relatively short follow-up period. This may be expected to be particularly serious for training measures as it can take considerable time to reap the returns to the initial human capital investment. Probably the most positive and robust impacts are found for intensified matching or job search services (sometimes in combination with unemployment benefit sanctions). There is some indication that these measures work best for the higher-skilled. Moreover, as these are quite cheap measures, the cost-benefit results are also more likely to be positive. One very disappointing result of ALMP generally, including search measures, is the very poor results found for youths. The implementation of a temporary wage subsidy does per definition lead to a job, However, it is in many respects a problematic measure. For it to be a successful it requires that the worker still holds the job when the subsidy expires. Much research shows that to the extent that the person secures the job, either they would have secured the job anyway without the subsidy (“dead-weight loss”) or that had the employer not employed the displaced worker they would have employed someone else (“crowding-out”). Macro studies which examine the impact of measures on other members of the labour force are rarer.5 However, there is little doubt that crowding-out effects are empirically significant. Econometric studies indicate very high crowding-out effects, sometimes up to 100%. While research acknowledges concerns about the reliability of precise size of the crowding-out effects, it is reasonably confident as far as the ranking of the extent of crowding-out among different types of programmes. The conclusion is that the effects are appreciably larger the more ALMP measures ‘liken a job’. Thus, various types of temporary wage subsidies have the highest crowding-out effects. It would appear likely that ‘pure matching measures’ such as intensified job search measures and training have much lower crowding-out effects, as job search services and labour market training do address what is really feasible with ALMP, namely, increasing employment by reducing the mismatches on the labour market.
What is the human capital loss at job displacement that policy should address? Before drawing conclusions on the lessons to be learnt from ALMP for the unemployed that could be applied to displaced workers, it is first necessary to examine evidence on the nature
4 Note that some studies find negative impacts. This occurs due to the so called ‘locking-in’ effects which
imply that participants could have used the time they participated in the ALMP better by looking for a job instead.
5 Cost-benefit studies which examine the microeconomic impact in relation to the costs of the measures are even rarer.
117

4
of the loss incurred by displaced workers, as it differs somewhat from the situation of the unemployed. Research in the USA and Europe finds very convincing evidence of significant economic losses due to job displacement. This is hardly surprising as, at least in the short term, a period of adjustment is required. However, more significantly, there is also quite firm evidence of long term losses for displaced workers in terms of earnings and unemployment. Eliason and Storrie (2006) and others argue that this is largely due to displaced workers experiencing repeated job loss. We also argue that the vulnerability of the recently displaced to subsequent displacement is due to their relatively low level of firm-specific capital on the new job. When the new employer is to lay off workers, this low level of firm-specific capital means that they are of relatively less value to the firm and so more prone to being selected for displacement. Indeed, the economics literature attributes the destruction of firm-specific human capital at displacement as the main factor explaining the extent and distribution of the costs of displacement in the short run; it would appear that this is also behind the longer term effects. Thus the key difference between the situation of the displaced workers and the unemployed in general is the loss of firm-specific capital of the former. The four points below identify the nature of the loss incurred by the displaced worker; the first three can be viewed in terms of firm-specific capital.
• A job may be the outcome of a long process of searching for and trying out various jobs, before finding one that matches the workers competencies and personal preferences. Thus when this job is lost it may require another lengthy matching process.
• The competencies of the displaced workers may be linked to the lost job and be specific to that place of work which is not marketable on the external labour market. This firm-specific capital may be acquired by on-the-job training or experience at the work place and so is likely to be strongly correlated with the length of service at the firm.
• Employees with long service may have accrued seniority rights that will be lost upon losing the job. These include job security rights and seniority wages.
• The loss of a job can be a very stressful event both in financial and social terms. 6 This is a problem itself and may impact negatively on the chances of getting a new job. This may also be particularly serious for older workers with long seniority.
Appropriate types of re-skilling and other policy for displaced workers
6 There is a huge research literature on the impact of job loss and unemployment on physical and mental
health in many academic disciplines. The key problematic issue in this literature is distinguishing whether job loss causes bad health or whether those with bad health are more likely to lose their job. Eliason and Storrie (2008) provide strong evidence that there is a significant causality running from job loss to higher mortality.
118

5
What implications does the discussion above have for measures to be implemented at restructuring? The brief overview of the ALMP research based on the target group of all unemployed persons, mentioned that results were poor for young persons but better than average for women, higher-skilled and others with relatively good labour market prospects. Displaced workers obviously have some labour market experience. It is more difficult to generalise on their skills and labour market prospects, compared to the unemployed in general, but the fact that many do get a job immediately after displacement indicates that they probably do make a more promising target group in this respect Job search and counselling measures As job search, matching and counselling measures are probably the most effective of all ALMP measures, they should be provided as part of any policy package to address job loss at restructuring. Job search during the period of notice combines the positive features of on-the-job search and unemployed job search. While still employed they can utilise on-the-job contacts and do not suffer from the discouragement of long unemployed job search nor from the unemployment stigma that may be interpreted as a signal of low productivity by a prospective employer. On the other hand, the knowledge of impending job loss may provide the same incentive to search as intensively as the unemployed. While looking for a new job may be particularly efficient during notice it may not be very obvious to the employee that this is the case and surely there is a potential high return in encouraging and assisting job searches at this early stage of the restructuring process. Thus there are good reasons to not only allow a long period of notice with the possibility to obtain time off the job to search but also to provide intensified job search services, including occupational guidance, during this period. The discussion on the nature of loss incurred from job displacement reinforces the relevance of matching and counselling activities for displaced workers. The restructuring process is a very stressful time for workers and may diminish their ability to act in accordance with their long term interests. The need for a coherent and transparent restructuring process, is helpful in this respect but even an ever-so-well administered process may still lead to problems for individual workers which should be addressed with dedicated counselling services. As there is some evidence from research in both the USA and Europe that recurrent job separations explain much of the long run negative effects of the initial displacement, it suggests the importance of making concerted efforts to obtain a high quality match of the worker to a new job as opposed to just a ‘quick-fix’ match. This may entail something different to the services typically offered by public employment services to the unemployed, such as aptitude tests and career guidance and may imply that the provision of such services could be obtained from other, possibly private sector, actors.
119
6
Moreover, the addition of another actor, the social partners, may further enhance the efficiency of matching measures for displaced workers. They are well placed to start this work early in the restructuring process. The importance of an early start to job search may not be obvious to workers with long tenure at the firm due to their lack of recent experience of external job search suggests that assistance may be necessary. Moreover, as efficient matching requires very good knowledge of the capabilities of the job seeker, the social partners are very placed to conduct such activities. Thus all involved parties (the appropriate public administrations, the social partners and the workers themselves) should grasp the window of opportunity that the notice period offers. In order for this to function properly it is vital that clear and early information on the impending job loss is provided. Given the positive role that the social partners can play in this process, in terms of implementation efficiency, there is surely some logic that they take a lead in matching activities as early as possible in the restructuring process, either with own funding or possibly with contributions from public bodies. To some extent this approach is currently being applied in Sweden. Ohlsson and Storrie (2006) show that the state engages later on in the process, after the firm and the bipartite job security organisations have carried out a first round of intensified job search and other matching activities.7 This is partly motivated by wanting to avoid dead-weight losses. One could also argue for a division of responsibilities between the social partners and public bodies where the latter guarantees a certain level of funding for all displaced in order to attain a certain level of employability. The social partners could then devote further resources to those with firm-specific capital that is not marketable on the external labour market. Presumably it is just this category of worker, i.e. those with long tenure, that the social partners would be most inclined to adopt social responsibility for. Recuperating the loss of firm-specific capital The previous section emphasised that the distinctive nature of the loss to displaced workers was the loss of firm-specific capital. It is difficult to envisage how policy, at least in the short term, can help to recuperate some of these losses as seniority rights and benefits (including wages) are obtained only by long tenure on a job. It might appear that the most obvious way to promote the re-establishment of firm specific capital is to apply measures that directly and quickly get the displaced worker a job, and for this reason use temporary wage subsidies. I have argued very strongly against the use of temporary wage subsidies for displaced workers, due to the severity of dead-weight loss and crowding-out effects. If despite these arguments they are to be used, they should only be one element in a broader strategy to place individuals with particularly low employability and should include some commitment in return from the employer to provide training and thus to help guard against subsequent displacement. But arguably the only motivation for them at all is, as was argued 7 In many cases, these services are financed by bipartite job security funds as established by collective
agreements. They are increasingly being implemented by private sector outplacement agencies.
The role of social partners
120
7
above, when they are addressed to particularly disadvantaged groups of displaced workers and thus making the crowding-out effects acceptable for equity reasons. Given that this would appear very difficult to accept in the case of displaced workers, the package of measures implemented should be designed to minimise these effects. Thus, from this perspective, temporary wage subsidies should be avoided and more traditional ALMP matching measures such as mobility grants and training should be prioritised. The basic policy approach is self-evident, namely to provide the platform for the displaced worker to accumulate human capital that will be useful for jobs in other firms. In this context, the career guidance mentioned earlier is in many cases only a first step and training and education are the key policy tools. It is difficult to generalise about the orientation of this training as much depends upon the state of the local labour market. If there are skill mismatches in the local labour market then obviously customised training courses appropriate for such jobs should be made available. More generally, however, concerted efforts should be made to adapt the firm-specific skills of the displaced worker to become marketable on the external labour market. This may include the validation of skills learnt on the job but not documented. What must be avoided is job specific training for jobs that do not exist. The activating role of ALMP in general and training in particular, may be useful as such in ameliorating the permanent scars on individuals and society that may result from long-term unemployment. These active individuals may then be able to return to work when times improve. However, with no jobs in sight, participants may experience training as meaningless or even punitive and endless rounds of training for a job that will never appear can be just as demoralising as long-term unemployment. As it may often be the case that restructuring occurs in depressed local labour markets this scenario may be quite common. Again, some Swedish experiences may be instructive. In the mid 1990s, Sweden experienced mass unemployment for the first time since the 1930s, and it became obvious that training the unemployed to fill non-existent jobs did not make sense. The biggest single individually-oriented policy response was the Adult Education Initiative (kunskapslyftet) which at one point had as many participants as there were school children in upper secondary school. This provided formal school education for poorly educated adults and there was not even an implicit promise of subsequent job. It was presumably interesting and meaningful for participants, or at least more so than training that obviously would not lead to a job. Evaluations of this massive programme have shown somewhat mixed, but on balance, rather positive results.8
8 The most recent high quality research on this programme finds substantial increases in post program
annual earnings. According to their estimates, the social benefits of offering these individuals comprehensive education surpass the costs within five to seven years. See Stenberg Anders and Olle Westerlund (2008) “Does comprehensive education work for the long-term unemployed, Labour Economics Volume 15 Issue 1
121

8
Empirical evidence of what works for displaced workers9 A very extensive recent review of the recent ALMP literature10 cites only one study which examines the impact of ALMP on displaced workers.11 This study finds relatively large positive effects of a special ALMP programme for displaced steel workers in Austria. The policy intervention was intensive and expensive and included a contribution from the participants themselves. Retraining programmes focused on re-qualification and occupational reorientation (included personality and orientation training). It also included a significant amount of formal education and long training periods, rather than marginal skill upgrades. Evaluations showed that five years after the programme, employment was significantly higher for participants compared to non-participants. Ohlsson and Storrie (2007) compare the labour market outcome of workers displaced from the LKAB iron ore mines and the closure of the Uddevalla Shipyard, both of which were the object of extraordinary ALMP measures, with all other workers displaced due to a plant closure but who did not receive extraordinary measures. The follow-up period is 15 years. There was no evidence of the extraordinary measures having any significant effect until after five to seven years. It may not be immediately obvious why positive effects were found only in the long term. However, there was a large increase in the number of workers who had obtained upper secondary school education among those receiving extraordinary measures compared to the comparison group. Indeed, a distinguishing feature of these measures was a much broader orientation of the types of educational programmes available to these workers compared to more traditional narrow labour market training. We interpret the results as showing that it was the opportunity to avail of more general education that yielded the positive long-run results. These are two of the very few studies that evaluate intensified ALMP measures in Europe addressed at displaced workers that use an appropriate control group. Both show positive results and both included significant elements of intensified job search activities and general education measures. They were also very expensive. Ohlsson and Storrie (2007) argue that the lack of short-term effects of policy indicate that the quick fix of a limited set of new job skills is not sufficient to compensate for the loss of firm-specific human capital that may have been built up over many years. This is particularly the case in depressed labour markets with few available vacancies. General, non-specific human capital takes time to yield benefits both due to the duration of the education programme itself and to the time
9 Following the logic of the first section of this paper, I only mention research that addresses the issue of
establishing the counterfactual case, a control group, that is necessary for all impact evaluation. 10 Kluve Jochen, et al. (2007) Active Labour Market Policies in Europe: Performance and Perspectives
Springer Berlin, Heidelberg New York. Kluves selection on only one such case is also motivated by the lack of a control group in the vast majority of all other studies on policy for displaced workers.
11 Rudolf Winter-Ebmer (2006) “Coping with a structural crisis: evaluating an innovative redundancy-retraining project' in: International Journal of Manpower, 2006, 27 (8), 700 - 721)
122

9
required to find an appropriate match for skills that are not so obviously related to a particular occupation or match with a particular employer. Given that it was argued that the nature of the loss of the job is attributable to the loss of firm-specific capital it may appear paradoxical that two reasonably reliable studies suggest positive effects for more general human capital creation. One possible explanation is that public policy is seldom the appropriate means to address the creation of firm-specific capital. Public policy is more suited to the provision of general capital which in turn may provide a solid platform for the individual in re-establishing a secure position on the labour market.
Concluding remarks There is still not enough European research for policymakers to make an evidence-based decision to adopt the general education approach in order to improve the employability of displaced workers. Moreover, the positive results from the three cases cited resulted from very extensive policy interventions in combination with other measures, and were expensive. However, regardless of whether it does in fact have a significant impact on future earnings or not, at the very least the provision of, for example, upper secondary school education for those who lack it, does provide something of value to the individual in terms of self esteem, maintaining activity etc; and surely it is the preferable option when there are no jobs in short term in the local labour market to train for anyway. If this approach were to be adopted more generally for displaced workers, it probably should entail some re-organisation of the institutional framework for the implementation of ALMP for displaced workers. For example, responsibility for the adult vocational education and training system in Denmark which is addressed primarily to employed workers was recently transferred from the Ministry of Employment to the Ministry of Education. This was to allow a better coordination with other educational programmes including the provision of upper secondary schooling. To conclude: there are strong arguments for intensified job search measures including career orientation and counselling for displaced workers. There are very few reliable studies of the effects of training for displaced workers and as the type of training that should be implemented is so dependent upon the state of the local labour market, it is difficult to arrive at firm general conclusions. Some of the few existing European evaluations suggest that positive effects may be obtained from more general schooling measures. Only under exceptional circumstances should temporary wage subsidies be used. Apart from the well established dead-weight loss effects, the equally well documented crowding-out effects are unacceptable from an equity perspective.
123

EuroSkills 2008 Thom ter Stege
124

What is EuroSkills?
EuroSkills challenge European students and graduates in vocational education to perform at their best through competition and awards. At EuroSkills you can enjoy exciting skills competitions, innovative and traditional trades and lively debates on the European future in vocational education. EuroSkills is a showcase of modern craftsmanship and related educational pathways.
From 18-20 Spetember 2008 the first EuroSkills event will be held in Ahoy Rotterdam (the Netherlands). Euroskills 2008 is organised under the supervision of ESPO (the European Skills Promotion Organisation) in conjunction with WorldSkills. The actual organisation is carried out by Skills Netherlands.
EuroSkills forms an important stage on which Europe can profile itself to the world on the basis of a number of different skills. Innovation within European vocational skills and international cooperation are a major factor. To participate in EuroSkills is to participate in a total experience. Just as for Skills Masters, the EuroSkills event is structured according to the concept of seeing, doing and informing. The exciting vocational competitions are a source of inspiration and offer a clear overview of the state of affairs within the various skills areas. European trades that are qualified for the competitions and presentations at EuroSkills 2008 vary from natural resources to technology and from transport to commerce, service & administration.
Read all about the event EuroSkills 2008 on www.euroskills2008.eu.
125

1
CEDEFOP Agora Conference
Thessaloniki, February 2008
Presentation by
Mr. Thom ter StegeSecretary General ESPOProject Manager EuroSkills 2008
2
ESPO –European Skills Promotion Organisation
• Founded: in March 2007,
• Legal entity: Association (a members organization),
• Goal: to structure skills promotion activities in EU,
• Primary task: biannual organisation of EuroSkills event,
• Political and financial support from European Commission,
• Acknowledged by the EU’s LifeLongLearning Program ’07 –’13
• Board members from nine European countries, • Members: One recognized organisation per EU country,
the National Skills Organisations.
• Contact organisation for European Commission.
3
ESPO - Objectives
• To promote excellence in the field of skills, vocational education and training and craftsmanship.
• To raise awareness of the importance of professional excellence and of high quality VET for Europe.
• To increase and develop the cooperation and partnership between organisations active in promoting VET and excellence in skills development.
• To encourage world-class standards of skills and competence in Europe and enhance the status and attractiveness of VET.
• To support European policy in the context of lifelong learning.
126

4
ESPO - activities
• Organising a biennial European skills competition event called: EuroSkills.
– EuroSkills 2008 will have a follow up:» in 2010 to be decided in May 2008,» in 2012 to be decided after EuroSkills 2008.
– The concept of ES08 will be used in ES events in ’10 and ’12,– Member countries can express their interest for organizing future ES event.
• Support EU member states, EFTA and EU candidate countries in establishing and further developing a national skills competitions.
– Through the support program and with the financial support from the EC, ESPO will support countries in a way which best suit each country
5
ESPO - activities
• Supporting EU programmes and policy on vocational education and training throughout Europe (e.g. by disseminating and valorisingprojects and their results).
– By using results from EU-projects and link them to Skills competitions. E.g. EQF-projects, mobility projects, EU networking projects etc.
• Creating and maintaining international and national platforms for the collaboration of Industry and VET through Skills Competitions
– The working together between National Skills Organisations will improve through the working together in ESPO. It gives the members also the opportunity to benefit more from other VET, industry networks and European government involvement.
6
ESPO - activities
• Engaging with companies and social partners to promote quality of skills in trades, crafts and modern technical occupations.
– Promotionally, there can be gained a lot by organizing partnerships with companies. Existing EU-competitions can gain more from working together.
• Cooperating with European organisations in the field of VET in promoting skills excellence.
– Cedefop, ETF, Efvet and other European organisations who now more and more are aware of the existence of Skills competitions as a tool for raising the attractiveness of VET.
• Promoting European Skills on a global level in cooperation with WorldSkills International and other regional skills organisations.
– Europe is a strong participant in Worldskills. Over 50% of the candidates of WS in November 2007, Japan came from the EU. Working together benefits both organisations’ objectives.
127

7
EuroSkills- the event
• Frequency: Biannually (start new concept in 2008)• Target group:
Youngster attending pre and secondary vocational education and their decision makers.
• Short description:European event for skills competitions and demonstrations. Showing skills in a natural an business like environment, promoting team competitions and interaction between skills and skilled people.
• Expected results:400 competitors, 40.000 visitors, > 1,000,000 informed Europeans. Promotion of lower vocational education. Promotion of European trades. Across Europe knowledge exchange on vocational education.
8
EuroSkills - facts
• EuroSkills 2008 ~ 18-19-20 September 2008 ~ Rotterdam
• Ahoy’ Venue, Rotterdam: 35.000 m2 (expandable to 50.000m2)
• Participation through ESPO, of the majority of European countries(26-29 in 2008)
• Within six Skills domains representation of some 50 trades,
• A lot of new concepts with a focus on teamwork,
• Concept development through ESPO’s Competition Development Committee,
• broadcasting on TV and internet,
• Interact with the public: ‘Have a go’ or ‘Try a Trade’,
• EuroSkillsVillage organized in cooperation with NA Leonardo da Vinci.
• Financed by European Commission, Dutch Government, City of Rotterdam, Sector organizations & Sponsors.
9
ESPO Board
Mr.Jos de Goey(The Netherlands)
President
Mrs.EijaAlhojärvi
(Finland)
Strategic & European
Affairs
Mr. Antonio Caldeira(Portugal)
Mr. Stefan Praschl(Austria)
Competition &Quality
Development
Mr. Kevin Wood(UK)
Treasurer
Mr. Jean-MarieMéan
(Belgium)
Secretary
Mr.YvanValentinuzzi
(France)
Marketing &
Communications
Mrs. Ilze Brante(Latvia)
General Board Member
Mrs. Ewa Rudomino
(Poland)
General Board Member
128

10
ESPO Organisation
ESPO Member statesGeneral Assembly
ESPOBoard
Skills NetherlandsESPO Secretariat
Thom ter StegeSecretary General
Cleo VerplanckeAdministration & Secretary
Frans van MarisFinance
Angelie Kaag/Eric van GoorPR/Communications
CDCCompetition Development Committee
Representatives (TD’s) fromESPO Members
11
Actual ESPO Membership situation
12
Actual ESPO Membership status
• Full ESPO Members:Members with WorldSkills experience:
Croatia, Estonia, Finland, Sweden, Spain,The Netherlands, UK, Germany, Portugal, Austria, France, Belgium, Ireland, Italy, Hungary and Luxemburg
Non WorldSkills members:
Lithuania, Latvia, Malta, Poland, Czech Republic, Norway, Slovakia, Denmark and Turkey (Total member countries : 26)
• Other countries expressing commitment or interest:
Iceland, Slovenia, Switzerland, Liechtenstein and Greece
129

13
ESPO Membership
Category: Open to:
Full Member National Skills Organisation:an authorised, national organisation from an EU Member state, EU member candidate country or EFTA-state.
Associate Member as above.
Affiliate Partners European Sector or Social Partnerorganisations, Educational institutes and Industry.
14
ESPO – Development Support Program
EU- Workplan 2008 (3 major activities)
1. Organisation of EuroSkills event
2. Development of skills competition activities in member countries
3. Promotion of ESPO & EuroSkills activities
15
International Skills competitions
Nov 2007, Shizuoka, Japan 39-th WorldSkills Competition
Sep 2008, Rotterdam, NL 1-st EuroSkills competition
Sep 2009, Calgary, Canada 40-th WorldSkills Competition
Sep 2010, location TBD, May’08 2-nd EuroSkills competition
Oct 2011, London, UK 41-st WorldSkills Competition
Sep 2012, location TBD, after ES08 3-rd EuroSkills competition
130

16
WorldSkills & EuroSkills
• EuroSkills more team competitions then individual competitionsEuroSkills mainly Team Based competitions (technical and social skills assessed)
• EuroSkills, in total five day stay of international teamsEuroSkills is a 3 day competition, 6 day stay of country teams,WorldSkills is a 4 day competition with a 9 day stay of country teams
• WorldSkills event will not be in Europe in 2007 and 2009 Promotion of VET and craftsmanship in EU-countries is necessary and becoming more important to show the attractiveness of VET.
• WorldSkills, becomes big and costly to organize, need for regional approach on long term might be necessaryThe ES initiative can lead to more regional organisations which can be interesting for WorldSkills development, step-up-opportunity for new national skills organisations.
17
EuroSkills Competitions
Skills Promotions, consists of 3 elements: -Competitions,-Demonstrations-Try a Trade
All Skills Promotions are documented in a Technical Outline(See EuroSkills website)
All competitions based on Competence based qualificationprofiles
18
EuroSkills 2008 SKILLS PROMOTIONS
Skill Domains Skills prom.ID
Skills Competition reflecting a social and/or industrial process
Trade(s) trade ID Number Comp
Max. Teams
1010 Floristry Florist 1011 2 ?1020 Electronic Game Development Game designer -developer 1021 1 ?1030 Window display Visual Merchandiser 1031 2 ?1040 Hairdressing Hairdresser Women 1041 1 6
Hairdresser Men 1042 1 61050 Shoe maker Shoe maker 1051 2 ?1060 Fashion Fashion designer 1061 1 ?
Fashion product developer 1062 2 ?
2010 Office IT Team Office specialist / Project manager 2011 1 5Cisco specialist 2012 1 5Microsoft specialist 2013 1 5Open Source specialist 2014 1 5
2020 Cross Media Publishing Web-designer 2021 1 5Graphic designer 2022 1 5Print technician 2023 1 5
2030 Video / moving image Video/movie editor, special effects editor 2031 3 ?
3010 Manufacturing technologies CNC machine technician 3011 1 6(C)NC Metal Constructor 3012 1 6Maintenance technician 3013 1 6Traditional machine technician 3014 1 6CADD designer 3015 1 6Welder 3016 1 6Industrial Automation technician 3017 1 6
3090 Electronics Workshop Team Electrical technician 3091 2 ?
4010 Landscape Gardening & Design Landscape Designer 4011 1 6Landscape Gardener 4012 2 6
4020 Plumber 4021 1 8Electrician 4022 1 8Refrigeration technician 4023 1 8
4030 Building Construction Building carpenter 4031 1 6Brick layer 4032 1 6Joiner 4033 1 6Wall and Floor Tiler 4034 1 6Metal Roofer 4035 1 6Supervisor 4036 1 6
4040 Plastering Plasterer 4041 1 ?4050 Painting Painter 4051 1 ?4060 Road construction Road builder 4061 2 ?
5010 Transport Technology & Logistics Truck Driver 5012 3 ?5020 Automotive Technology Light Vehicle Light vehicles technician 5021 1 ?5030 Automotive Technology Heavy Vehicle Heavy vehicles technician 5031 1 ?5040 Mobility Sector Motorcycle Motorcycle technician 5041 1 ?5050 Mobility Sector bicycle Bicycle technician 5051 1 ?
6020 Caring Nurse 6021 2 ?6030 Farrier Farrier 6031 1 ?6040 Cleaning services Manager 6041 1 ?
supervisor 6042 1 ?cleaner operator 6043 2 ?
6060 Cook & Serve Chef 6061 1 10Waiter 6062 1 10
Construction & Building
Manufacturing & Engineering
Social, Personal & Hospitality Services
Transportation & Logistics
Installation Technology
Creative Arts & Fashion
Information & Communication Technology
131

19
20
21
PR/Communication Campaign 2008Schoolprograms
• International:European Student exchange program, schools from all over Europe to visitthe Netherlands. This in cooperation with the Dutch schools and the EU.
– Mobility– Improve the European network– Exchange knowledge on a international level
• National:A guided tour for visitors with the focus upon the competition and primarilyon skills per domain.
– Interactive– Skills specific– Especialy designed for the target group
132

22
EuroSkills campaign 2008
pictured
23
To the web…
24
EuroSkills Village
Site program, during event in Conference area:
- Conferences
- Seminars
- Information Market, for companies and organisationsto present their products and services (we offer standard booths)
133

25
EuroSkills Partner Program
26
EuroSkills Partner Program
Participation in the development of EuroSkills event
CashCompetition- materialsand machines
Other goods and services
Strategic partnershipFinancialValue in kind
27
EuroSkills Partner Program
XSupplier
XXPartner
XXXOfficial Partner
StrategicPartnership
FinancialValue in kindPartner category
134

28
ESPO (Official) Partner
EuroSkills Event
EuroSkillsDomain 1
EuroSkillsCompetition 1
EuroSkills Competition Team 1
EuroSkills Domain2
EuroSkills Competition Team 2
EuroSkills Competition 2
Sponsorpartner structure
29
EuroSkills Partnerplan
Sponsor products
A. Boarding & Signage
B. Printing
C. On Line Communication
D. Publicity Campaign
E. Events & Meetings
F. Facilities
G. School Program
H. International Student Exchange Program
30
Thank you
135


Working group III:
SKILL NEEDS IN ENTERPRISES

Working group III: SKILL NEEDS IN ENTERPRISES Chair: Torsten Dunkel, Cedefop Rapporteur: Mark Keese, OECD Presentations: Enterprise surveys as a tool for skill needs analysis
Olga Strietska-Ilina, Skillsnet Measuring recruitment difficulties in Europe Germana di Domenico, EC – DG Employment, and Jean-Louis Zanda, ANPE – Agence Nationale pour l’Emploi, France Skill needs in companies: CVTS3 results Friederike Behringer, BIBB - Bundesinstitut für Berufsbildung, Germany
The dynamics of change in the workplace imply the need for timely and reliable information on how skill needs develop. Such information is essential not only for employers but also for effective labour market policy making at national and European levels. But it cannot be obtained by purely quantitative forecasting methods alone; these need to be enriched with other sources of information. Enterprise-level surveys and studies may turn out to be one of them. For this reason, in parallel to quantitative measurement of skills demand presented earlier in the plenary, Cedefop´s Skillsnet is exploring the feasibility of using softer, qualitative, methods to measure development and demand for skills, skills gaps and shortages, and recruitment difficulties in the workplace. This initiative was discussed and supported by experts from 13 Member States at a workshop held in June 2007 in Bucharest. Skillsnet will now explore several possibilities, such as to enrich existing EU-level surveys by including common core questions, to adjust existing national surveys, or to launch a European-wide enterprise survey which could shed light on skill needs, gaps and shortages in Europe from the point of view of public and private companies. The workshop will address the following questions:
• Are enterprise surveys and analyses a relevant source of information and measure of skill needs?
• Which option is best for the Skillsnet project: to introduce changes into an existing European survey, such as CVTS; adjust existing national surveys; or organise a special survey on skill needs in the workplace in Europe?
• What system do employment services in the EU currently use to monitor vacancies? Which systems and methods are used to measure recruitment difficulties in Member States and initiatives at European level?
• What are the main findings in CVTS3 on skill and training needs? Is it possible to introduce additional questions or change the questionnaire to tackle skill needs? Would it be possible to construct a sample of those enterprises that evaluate skill needs systematically for the follow up survey?
138

Enterprise surveys as a tool for skill needs analysis Olga Strietska-Ilina
139
Technological development and innovation, globalisation and demographic development introduce important changes at workplace level. Such changes cause emergence of new skill requirements, alteration of skills and competence composition of occupations, emergence of new and hybrid occupations, incidence of skill shortages and gaps. These changes cannot be identified by purely quantitative approaches, such as forecasting. That is why Cedefop’s network Skillsnet started a new initiative which explores possibilities of company surveys as an analytical tool which may help to reveal such important changes. Surveys among businesses provide a first hand information on skill needs changes but have a number of limitations, such as subjectivity of information, inflated/deflated data, limited ability to look beyond presence, lack of broader contextual awareness among respondents, etc. These limitations can be overcome by means of regular surveys, additional focus groups, cautious treatment of results and holistic methods.
In the framework of the new initiative, Cedefop/Skillsnet organised an expert meeting in June 2007. MS’ experts were invited to submit short information on national enterprise surveys. The comparison revealed that all 16 MS, who filled in the template, conduct some kind of enterprise surveys relevant for the identification of skill and training needs. The surveys however differ greatly in their objectives, regularity, sample sizes and in a range of questions covered in questionnaires. Although methods and tools used for enterprise surveys differ across countries, a number of methodological similarities were identified. These, under certain conditions, provide good grounds for potential comparability. Skillsnet will examine different options on how to complement national surveys with comparable data at cross-country level. At the same time an extension of one of existing European surveys with questions on skill needs and/or organisation of a specific European survey will be discussed too. The Cedefop-Skillsnet coordination team will follow-up the interest and willingness of MS to agree on a common approach and will look at possible ways to proceed further.
Olga Strietska-Ilina holds degrees in History, Sociology, and Political and Economic Sciences. She works as an independent researcher and consultant with a number of organisations, universities and European institutions. Starting her career teaching at the Central European University in Prague, she was then a Director of the National Observatory for Employment and Training in the Czech Republic for several years. She has published extensively in the field of education and training, employment and labour market, social exclusion, cultural minorities, nationalism and European affairs. Most recent titles include ‘A clash of transitions: towards a learning society’ (Peter Lang, New-York, 2007) and ‘Systems, institutional frameworks and processes for early identification of skill needs’ (Cedefop, 2007) where she was an editor and a co-author. She has been actively involved in developing Cedefop’s international network of early identification of skill needs Skillsnet and continues to provide her expertise to the network.
140

Enterprise surveys as a tool for skill needs analysis
Working group III: SKILL NEEDS IN
ENTERPRISES
Olga Strietska-Ilina,SKILLSNET
Changes at workplace level influenced by:
Technological development and innovation
Europeanisation, internationalisation, globalisation
Competitiveness
Increased labour force mobility
Demographic development
New ways of management and work organisation
Increased corporate responsibility for social and environmental issues
Such changes cause
emergence of new skill requirements,
higher skill-level requirements,
alteration of skill and competence composition of occupations,
multiskilling / multitasking,
emergence of new and hybrid occupations,
generic / core / social skill requirements,
skill shortages,
skill gaps.
141
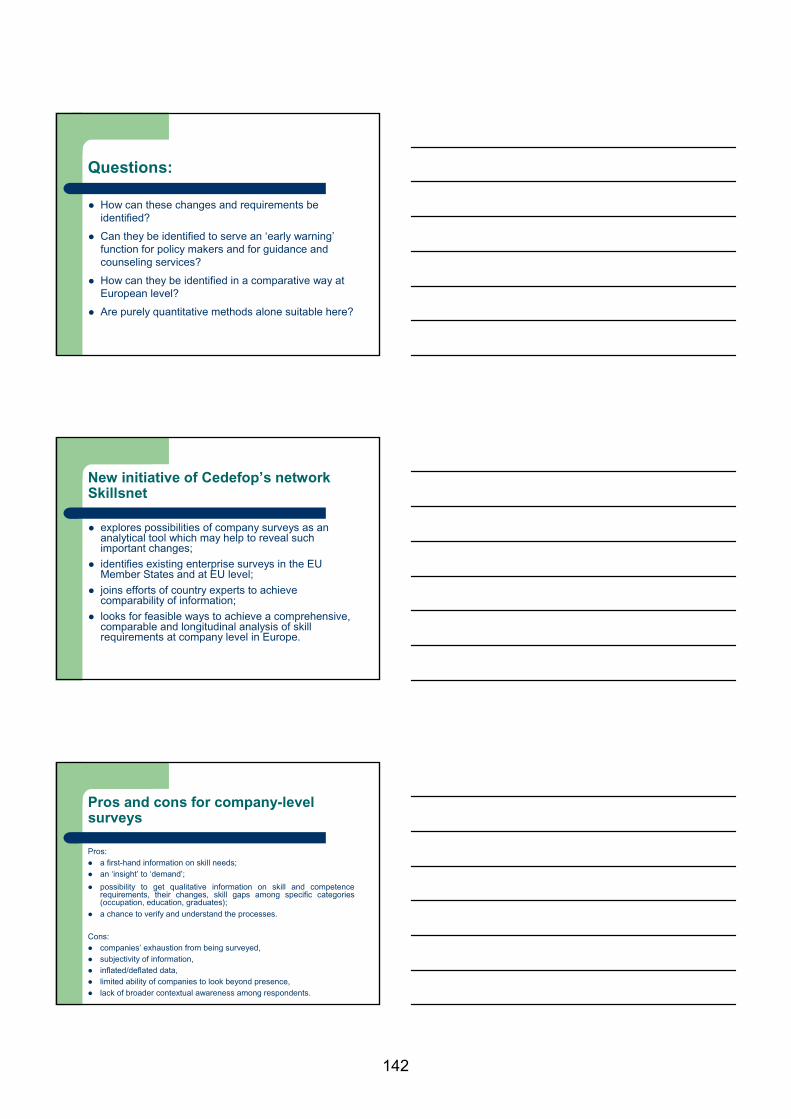
Questions:
How can these changes and requirements be identified?
Can they be identified to serve an ‘early warning’function for policy makers and for guidance and counseling services?
How can they be identified in a comparative way at European level?
Are purely quantitative methods alone suitable here?
New initiative of Cedefop’s network Skillsnet
explores possibilities of company surveys as an analytical tool which may help to reveal such important changes;identifies existing enterprise surveys in the EU Member States and at EU level;joins efforts of country experts to achieve comparability of information;looks for feasible ways to achieve a comprehensive, comparable and longitudinal analysis of skill requirements at company level in Europe.
Pros and cons for company-level surveys
Pros:a first-hand information on skill needs;an ‘insight’ to ‘demand’;
possibility to get qualitative information on skill and competence requirements, their changes, skill gaps among specific categories (occupation, education, graduates);a chance to verify and understand the processes.
Cons:companies’ exhaustion from being surveyed,subjectivity of information, inflated/deflated data, limited ability of companies to look beyond presence, lack of broader contextual awareness among respondents.
142

How to overcome such limitations?
By carefully selected questions and limited number of questions in the questionnaire,
additional focus groups,
regularity in surveying,
holistic methods,
cautious treatment of results,
combination of results with other sources for analysis.
Company surveys are not the alpha and omega but just one of tools, yet very useful!
Objectives of the first Skillsnet workshop on the enterprise surveys’ initiative (Bucharest, 21-22 June 2007)
to map existing surveys at European level with the view of their potential usage for skill needs analysis,to compare approaches in enterprise surveys among EU Member States (MS) with the view of their potential comparability and compatibility,to agree about future steps towards feasibility of a common approach to enterprise surveys to analyse skill needs at European cross-country level.
Surveys at European level
Eurostat surveys (CVTS, Eurostat vacancy survey, and Innovation survey),European PES Vacancy Monitor (DG Empl), Establishment survey, Eurofound, Dublin, Survey by European Agency for Safety and Health at Work, Bilbao, PIAAC survey (JRA module), OECD, Harmonised Skill Monitoring Survey in the UK and Ireland, others.
143
Comparison of enterprise surveys in 16 Member States:
Comparison of answers from country experts based on the template provided by CedefopMS participated: Belgium, Bulgaria, Czech Republic, Estonia, Finland, France, Germany, Greece, Ireland, Luxembourg, Netherlands, Poland, Portugal, Romania, Slovakia and UK (England only)
Some results
All (!) MS concerned conduct some kind of enterprise surveys relevant to a broader subject of identification of skill and training needs;But (!) surveys differ greatly in their objectives, regularity, sample sizes and in a range of questions covered in questionnaires.
Objectives of enterprise surveys:
1. Design of policies in the field of initial and continuing education and training;
2. Design of training programmes, vocational training standards;3. Identification of skill deficiencies according to level and type of
education/training;4. Work organization, operating environment, business and
technological changes and their impact on company’s skill and training needs;
5. HRM/HRD and recruitment practices and problems, skill gaps and labour shortages.
In practice surveys pursue more than one objective and in manycases it is a combination of several of above mentioned objectives.
144
Level / coverage
11 countries conduct surveys in specific sectors / industries / occupations or territories; Some surveys are particularly targeted at SMEs; Czech Republic, Estonia, Finland, France, Germany, Greece, Ireland, Portugal, Romania, Slovakia and England have conducted or conduct now national surveys.
Regularity / continuity
9 countries have regular enterprise surveys of varying periodicity (monthly, annual, biennial) 5 more countries plan repeating surveys in future (subject to support, interest and funding)13 countries aim at continuing enterprise surveys in future
Methods and tools
All countries use structured questionnaires.6 conduct face-to-face interviews;others use a combination of on-line, postal, email and telephone interviewing techniques.
145
Response rate
Depends on the surveying method: face-to-face interviewing enjoys around 80% response rate;postal, telephone and on-line interviewing brings between 20-50% of responses (in France telephone interviewing succeeds at 80%)
Unit of analysis and respondents
Unit of analysis:Establishment (9 surveys)Entire enterprise/organization (8 surveys)in Greece and Romania different surveys apply both approaches.
Respondents:HR managers/officers, in smaller companies - owners, directors or top managers,sometimes surveys are complemented by focus groups or additionalsurveys among social partners and other stakeholders (e.g. regional/local representatives),
Surveys among employees:only 6 MS cover in the same survey or run a complementary surveyamong respondents-employees, of which 4 have results matched with responses by employers.
Sample size and sampling method
Depends on objectives pursued and level of detail needed.In general seek to provide a good coverage of the segment under scrutiny (e.g. sector, profession, region etc.). Many MS survey a large number of enterprises (e.g. 27 thous in England, 16 thous in Germany, 15 thous in France) aiming at covering a large proportion of the labour force. Most MS use targeted or non-targeted sampling stratified / weighed by type and size, sector and region.
146

Classifications in use
MS widely use international classifications, such as NACE, ISCO-88 and ISCED. Only 3 MS use national classification systems either linked or not to the international ones. This, under certain conditions, provides some grounds for potential comparability.
Responsibility and funding
Responsibility:ministries and their research bodies,private or public research institutions, consulting companies,universities.
Funding mostly combines a number of resources:12 countries enjoy funding from ministries and public employment services, 4 countries (Finland, Luxembourg, Poland and Romania) report (co-) funding from EU sources (ESF, Leonardo da Vinci, Eures, Phare, ETF), 2 countries (Finland and the Netherlands) had support from social partner organizations and/or their training funds, Länder support in Germany.
Is a comparable approach to enterprise surveys needed? Countries’ opinions
All participating MS expressed their willingness and preparedness to discuss and to look for possibilities to make their results comparable to other similar surveys in other countries. Even countries with a long-established tradition of surveys expressed readiness to make some sacrifices of comparability over time for the sake of comparability over European space. The new initiative of Skillsnet aimed at finding a common European approach to enterprise surveys as a tool for identification of skill needs is timely and necessary.
147

What next ?
Subject to discussion and further collaboration with EU MS experts and EU institutions. Options:
– Modifying / enriching questionnaires and surveys already existing or planned at European level;
– Choosing core questions and adjusting national surveys in selected / volunteering countries to achieve comparability of results;
– European-wide enterprise survey.
Feasibility study by Cedefop-Skillsnet.
Putting together efforts of the network, national and EU authorities, research and data collection institutions to improve the situation on the transparency of skill needs in Europe and to add on the quantitative forecast results.
The European labour market requires European monitoring! The Council of the European Union in its Resolution of 15 November 2007 on the new skills for new jobs stresses the need to anticipate the skills needs — and also the skills gaps —which are emerging in the European labour markets.
148
Monitoring recruitment difficulties. The European Commission perspective Germana Di Domenico
149

In a globalised labour market a clear trend of jobs moving towards countries with lower labour costs can be observed. This increased competition highlights the importance of labour up-skilling in European economies. At the same time, demographic changes and the ageing population lead to a situation where fewer workers are supposed to support larger numbers of those who retire: on the one side older people must be prepared to stay in work longer and on the other side younger people need to have the proper qualifications and skills to meet labour market needs.
Although such challenges are common to all European Countries, labour demand and supply may significantly vary according to different contexts and variables at a national level. These features are systematically monitored through the European Commission analysis of the National Reform Programmes that each Member State draws up yearly on the basis of the Lisbon Strategy for Growth and Jobs to describe how the Employment Guidelines are put into practice at the national level.
At the same time, a significant effort is made by the European Commission to monitor and measure bottlenecks and recruitment difficulties in order to address labour market mismatches. From this point of view, the value that data on job vacancies (i.e. stock of unfilled job openings for which firms are actively trying to recruit new workers) would have for economic research and for operational purposes is very relevant; they indeed can contribute to business cycle analysis and also help to determine which actions should be more appropriately taken to tackle high unemployment: more public spending (insufficient aggregate demand) or job training and employment counselling (structural unemployment). Job vacancy data can also be used to improve the way in which labour markets function by pinpointing emerging shortages and gaps.
Against this background, we analyse the potential of the main sources of information on vacancies which are currently available at European level (i.e. the Eurostat job vacancy Survey, the European Public Employment Services (PES) Vacancy Monitoring dataset and the EURES portal), with a specific focus on the role that PES may play in processing and using administrative data to provide better tailored services both to job-seekers and employers and to anticipate their needs and recruitment difficulties.
Germana Di Domenico is Policy Officer in the DG Employment and Social Affairs of the European Commission, in the Unit in charge of Employment Services and Mobility.
She is Doctor in Public Economics. Before joining the Commission, she has been working for 7 years as research fellow in the Italian Institute for the Development of Workers' Vocational Training (ISFOL) based in Rome; more specifically she has dealt with: Quali-quantitative analysis of labour market dynamics and trends; Monitoring and Socio-economic impact assessment of reform processes and new regulatory frameworks concerning employment policies; Cross-countries studies with focus on Labour Market Institutions and Performance in a benchmarking key. Within the DG Employment of the European Commission, she is currently in charge of coordinating the Expert Working Group for Monitoring Vacancies of Public Employment Services, aiming at developing effective ways of processing data on vacancies to face labour market mismatches and recruitment difficulties in the Member States.
150
European Commission21-feb-08 Directorate-General for Employment, Social Affairs and Equal Opportunities ─ Unit D3 1
Monitoring Recruitment DifficultiesThe European Commission perspective
Germana Di Domenico
European CommissionDG Employment, Social Affairs and Equal [email protected]
CEDEFOP Skillsnet Agora ConferenceWorkshop on “Skill need in enterprises”Thessaloniki, 21st February 2008
European Commission21-feb-08 Directorate-General for Employment, Social Affairs and Equal Opportunities ─ Unit D3 2
Long-term challenges/1
• GlobalisationJobs moving to countries with lower
labour costs
Increased competition
Demographic changes and ageing population
European Commission21-feb-08 Directorate-General for Employment, Social Affairs and Equal Opportunities ─ Unit D3 3
Long-term challenges/2
• Labour MarketDemographic changes = labour market mismatches (skill gaps and labour shortage)
Labour mobility and immigration
Structural unemployment + increasing long-term unemployment = poverty, social exclusion, pressures on benefit systems
151

European Commission21-feb-08 Directorate-General for Employment, Social Affairs and Equal Opportunities ─ Unit D3 4
Country PatternsPattern 1 - Countries where:
– labour demand is/has been low– unemployment benefit receipt is more widespread than other
income support benefits. – levels of registered (long-term) unemployment are typically high in
these countries
E.g.: France, Finland, Germany, Italy
Pattern 2 - Countries where:
– labour demand is high– Inactivity related benefit receipt (disability, sickness, unconditional
social assistance) is more widespread – levels of registered unemployment are therefore lower
E.g.: Denmark, Sweden, Norway, Netherlands, United Kingdom
European Commission21-feb-08 Directorate-General for Employment, Social Affairs and Equal Opportunities ─ Unit D3 5
Labour market mismatches
(high) levels of unemployment can exist side-by side with (high) demand for labour
jobseeker’s employment readiness, occupation choice, skills/competencies or earning requirements do not match employers’ demands
Others (UK) - Internal skills gap: arising from lack of proficiency of existing staff
European Commission21-feb-08 Directorate-General for Employment, Social Affairs and Equal Opportunities ─ Unit D3 6
Job vacancy
Post (newly created, unoccupied or about to become vacant) for which the employer is taking active steps to find a suitable candidate from outside the enterprise concerned and which the employer intends to fill either immediately or in the near future
Source: Eurostat Reference Metadata, Summary methodology, job vacancy statistics
152
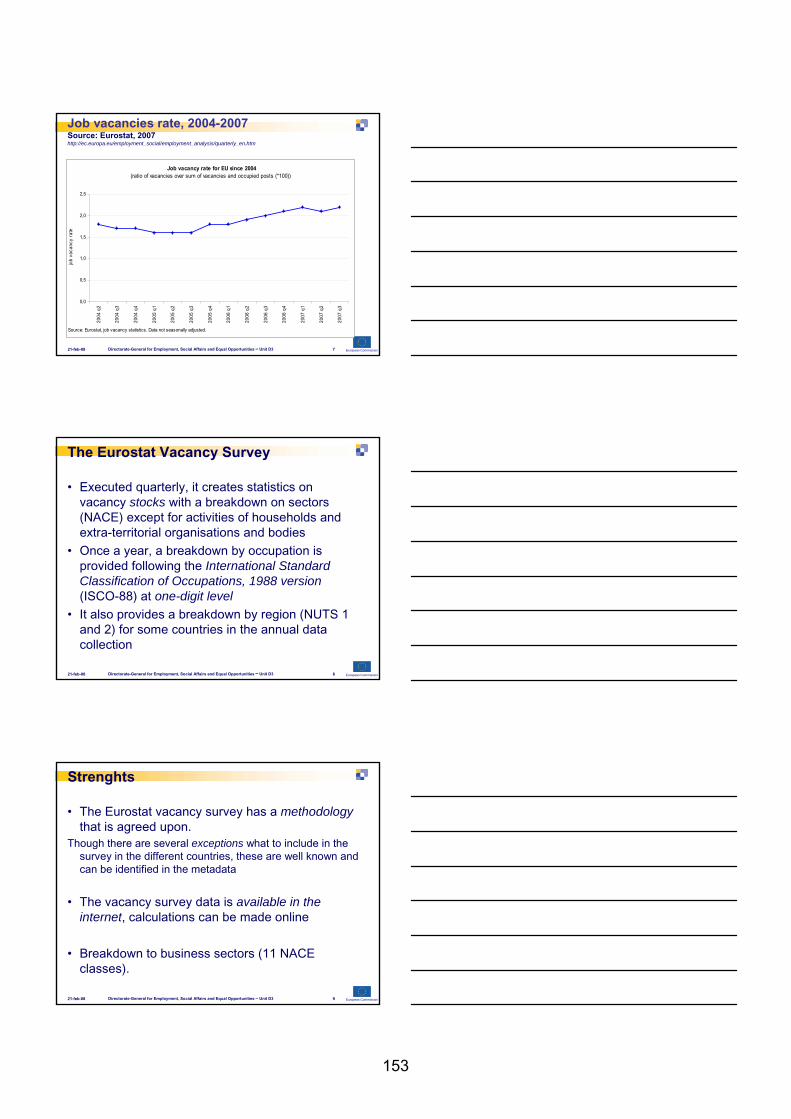
European Commission21-feb-08 Directorate-General for Employment, Social Affairs and Equal Opportunities ─ Unit D3 7
Job vacancies rate, 2004-2007Source: Eurostat, 2007 http://ec.europa.eu/employment_social/employment_analysis/quarterly_en.htm
Job vacancy rate for EU since 2004(ratio of vacancies over sum of vacancies and occupied posts (*100))
0,0
0,5
1,0
1,5
2,0
2,5
2004
q2
2004
q3
2004
q4
2005
q1
2005
q2
2005
q3
2005
q4
2006
q1
2006
q2
2006
q3
2006
q4
2007
q1
2007
q2
2007
q3
Source: Eurostat, job vacancy statistics. Data not seasonally adjusted.
job
vaca
ncy
rate
European Commission21-feb-08 Directorate-General for Employment, Social Affairs and Equal Opportunities ─ Unit D3 8
The Eurostat Vacancy Survey
• Executed quarterly, it creates statistics on vacancy stocks with a breakdown on sectors (NACE) except for activities of households and extra-territorial organisations and bodies
• Once a year, a breakdown by occupation is provided following the International Standard Classification of Occupations, 1988 version(ISCO-88) at one-digit level
• It also provides a breakdown by region (NUTS 1 and 2) for some countries in the annual data collection
European Commission21-feb-08 Directorate-General for Employment, Social Affairs and Equal Opportunities ─ Unit D3 9
Strenghts
• The Eurostat vacancy survey has a methodologythat is agreed upon.
Though there are several exceptions what to include in the survey in the different countries, these are well known and can be identified in the metadata
• The vacancy survey data is available in the internet, calculations can be made online
• Breakdown to business sectors (11 NACE classes).
153

European Commission21-feb-08 Directorate-General for Employment, Social Affairs and Equal Opportunities ─ Unit D3 10
Weaknesses• It is a survey (with “not obligatory” mandate on Member
States, so far) and data are not always (as rapidly) available (as needed).
• Time series should be provided since 2001 when the Eurostat survey programme started. However, up to now, the vacancy survey does not cover all Member states and for Countries that do participate quite some gaps in the time series exist
• Information on occupation is provided only on an annual basis and at one-digit-level, i.e. details on occupations are missing.
• For calculations/estimations of vacancy turnover (and vacancy duration) both stock and flow data would be needed, but in the survey only stock data is provided.
European Commission21-feb-08 Directorate-General for Employment, Social Affairs and Equal Opportunities ─ Unit D3 11
Which role for the Public Employment Services in processing job vacancies?
• Deliver a wide range of services (free of charge) to labour demand (unemployed, inactive and job changers) and supply
• Identify occupational segments suffering from recruitment difficulties
• Contribute to address “information asymmetries”and improve transparency in the labour market
European Commission21-feb-08 Directorate-General for Employment, Social Affairs and Equal Opportunities ─ Unit D3 12
European PES Vacancy Monitory (EPVM)
The EPVM is the first EUROPEAN MONITORING TOOL FOR PES VACANCIES
• It is a dataset of stocks and flows of PES vacancies on a quarterly basis, broken down to ISCO 3-digit level (breakdowns to occupations and, still to a lesser extent, sectors)
• PES are responsible for collecting and recoding their vacancy data in the agreed format
- Complete time series starting in 2003 are at present available for 17 countries (19 PES in total)
The Expert Working Group mission is to:• Improve the comparative transnational monitoring of developments
in labour demand• Contribute to the identification and diagnosis of market segments
suffering form recruitment difficulties
154

European Commission21-feb-08 Directorate-General for Employment, Social Affairs and Equal Opportunities ─ Unit D3 13
Strengths
1. The EPVM includes both stock and inflow of vacancies + breakdowns to ISCO 3-digit level
2. PES vacancies are administrative data, thus available regularly and almost immediately
3. Minor costs compared to a regular survey 4. Possibility to calculate time series backwards to start
from the beginning 5. In the EPVM today more countries are covered than in
the Eurostat vacancy survey6. Measure and explanation of PES market penetration
(coverage) 7. Tracing and diagnosing changes in the size of market
demand
European Commission21-feb-08 Directorate-General for Employment, Social Affairs and Equal Opportunities ─ Unit D3 14
Weaknesses
- PES vacancies are only part of the market- Data on sectors (NACE) are not (yet) part of the
EPVM - Double counting may be a problem in some PES• Heterogeneity of data (e.g. captured vacancies
may or not include the temporary work agencies ones)
• A precise and effective tool for identification of recruitment difficulties cannot be derived from simply observing developments in stocks and flows of notified vacancies
European Commission21-feb-08 Directorate-General for Employment, Social Affairs and Equal Opportunities ─ Unit D3 15
Example
PES A has a high market share in the low and medium qualified vacancies, but only a small market share in the higher qualifications
If vacancies in Country A rise for the higher qualifications, will this be visible in the EPVM?
It can be assumed that by occupation there will be an increase of the higher qualified vacancies, BUT in the total important developments are likely to remain not sufficiently visible.
155

European Commission21-feb-08 Directorate-General for Employment, Social Affairs and Equal Opportunities ─ Unit D3 16
EURES and the Job Mobility PortalSet up in 1993, EURES is a co-operation network between
the European Commission and the EU countries (plus Norway, Iceland and Liechtenstein) and other partner organisations
The purpose of EURES is to provide information, advice and recruitment/placement (job-matching) services for the benefit of workers and employers
The portal (http://europa.eu.int/eures) contains at present about 1.3 million vacancies daily and more than 100.000 CVs. Most of the vacancies are made available by the national PES providing (the majority of) their notified vacancies and sometimes also the vacancies collected via the PES vacancy portals. The internet site has about one million visitors a month.
European Commission21-feb-08 Directorate-General for Employment, Social Affairs and Equal Opportunities ─ Unit D3 17
Strengths
1. Member States are supposed to make all their PES vacancies available in EURES.
2. EURES has the same structure for all countries, so that statistics would be based on this (same) structure.
3. EURES has a breakdown of ISCO and often also of NACE. They can moreover also be broken down to NUTS regions.
4. There are several items saved with additional information for each vacancy, e.g. creation and closing date should make it possible to calculate inflow and duration
European Commission21-feb-08 Directorate-General for Employment, Social Affairs and Equal Opportunities ─ Unit D3 18
Weaknesses 1. Statistics that can presently be derived from the EURES
internet portal only entail some basic information like total daily stocks and a breakdown by country and region. These data are available only for the actual day, not yet for the previous day let alone as time series.
2. The quality of vacancies in the EURES internet portal varies from country to country, especially concerning the classification of vacancies to the harmonised ISCO system.
3. A lack of comparability also applies to quantity: Not yet all member states provide all their notified vacancies, and the exceptions are not the same for each country
4. Possible duplication of vacancies also seems to be a problem in some countries.
156

European Commission21-feb-08 Directorate-General for Employment, Social Affairs and Equal Opportunities ─ Unit D3 19
Challenges and learning points for PES (1)
The big challenge remains to create an observation instrument that is also capable of tracing changes in smaller segments of the labourmarket in order to have focused actions
LABOUR SHORTAGE: general tendency towards better tailored, targeted and individualised services
Towards:
• Job-seekers– strong start: segmentation, profiling and targeting
• Employers– anticipation of changes– re-inventing cooperation in recruitment and managing change
situations
European Commission21-feb-08 Directorate-General for Employment, Social Affairs and Equal Opportunities ─ Unit D3 20
Challenges and learning points for PES (2)
SKILL GAP: new PES models beyond the matching and activation function
Involve:• Innovative ways of
– responding to new challenges of recruitment – promoting age management and generation change – fostering work ability in organisations – supporting individually tailored life long learning
• Modernised organisational structure of PES, e.g. setting up of “One-Stop Shops” to deliver combined interventions and complementary active labour market programs (matching/vocational training); stronger cooperation with local partners and other stakeholders
European Commission21-feb-08 Directorate-General for Employment, Social Affairs and Equal Opportunities ─ Unit D3 21
Follow-up and Further InitiativesEPVM: Stronger focus on recruitment difficulties, country-specific analysis and exchange of good practices to deal with these difficulties; link to the wider issue of “PES services to Employers”EURES web services quality project: to standardise procedures in managing vacancies and CVs across Europe “New Skills for New Jobs” (December 2007): to ensure a better matching between labour market needs and human capital policies, by:
- Identifying new jobs and skill needs- Validating competencies, increasing transparency
and identifying training needs- Equipping people for new jobs
157
Measuring recruitment difficulties in Europe Jean-Louis Zanda
158

In the framework of a project for the European Commission aiming at improving the use of Public Employment services (Pes) data to monitor bottlenecks on the European labour market, an inventory of statistical sources available in about 15 Countries to measure recruitment difficulties has been completed in the last quarter of 2005.
This inventory shows that recruitment difficulties are considered as an important topic in most of these countries. Pes data is in most cases (but not always) used to measure these difficulties, with various methods, which may mainly rely on vacancy duration, or on the ratio between vacancies and registered jobseekers. This data, however, provides indirect information. It needs to be completed with other information, i.e. at least by other indicators and/or advice from experts or from counsellors of the Pes.
However, the most important link to establish is with survey results, which make it possible to observe recruitment difficulties as they are experienced by employers. Several types of results of this kind may be used, some being given by questions asked in the framework of general or cycle surveys (often realised by statistical institutes), others being surveys explicitly devoted to measure recruitment problems. In many cases, information on occupations or on skills are not produced, as it is quite costly to collect. Especially in these cases, but also in a more general approach, the link with Pes data may prove to be quite useful.
Jean-Louis ZANDA is a research manager and senior researcher in the French Public Employment Service (ANPE) since 1992. He works mainly on labour demand, and especially on recruitment. Among other things, he has carried out several quantitative and qualitative surveys with employers, and in particular built ANPE’s annual cycle survey.
For about 10 years, he has also focused on recruitment difficulties. On this subject, he has recently (2005-2007) headed a project for the European Commission, which aimed to improve the comparability of data available in different countries, including both survey results and data produced by Public Employment Services.
With a doctorate in Sociology, he has formerly worked as a researcher and training manager in the field of social welfare. He also worked as a teacher for several years at the University.
159
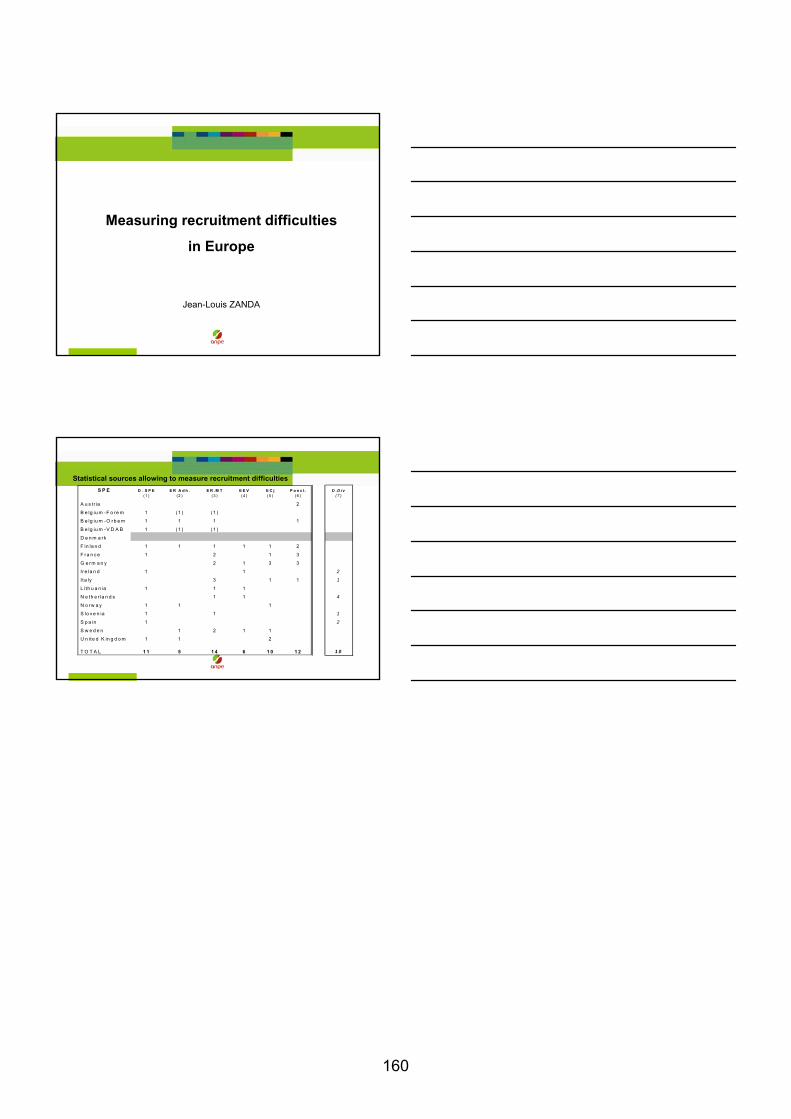
Measuring recruitment difficulties
in Europe
Jean-Louis ZANDA
S P E D . S P E E R A d h . E R .M T E E V E C j P o n c t . D .D iv(1 ) (2 ) (3 ) (4 ) (5 ) (6 ) (7 )
A u s t r ia 2
B e lg iu m -F o re m 1 (1 ) (1 )
B e lg iu m -O rb e m 1 1 1 1
B e lg iu m -V D A B 1 (1 ) (1 )
D e n m a rk
F in la n d 1 1 1 1 1 2
F ra n c e 1 2 1 3
G e rm a n y 2 1 3 3
Ire la n d 1 1 2
I ta ly 3 1 1 1
L ith u a n ia 1 1 1
N e th e r la n d s 1 1 4
N o rw a y 1 1 1
S lo v e n ia 1 1 1
S p a in 1 2
S w e d e n 1 2 1 1
U n ite d K in g d o m 1 1 2
T O T A L 1 1 5 1 4 6 1 0 1 2 1 0
Statistical sources allowing to measure recruitment difficulties
160

Skill needs in enterprises: CVTS3 results Friederike Behringer
161
The European Survey of Continuing Vocational Training in enterprises (CVTS) is the only data source that provides detailed internationally comparable data in the field of enterprise provided continuing training. CVTS3 took place in 2006 in the 27 EU member states and Norway, relating to training activities and training policies of enterprises in 2005. The presentation is partly based on tables published by Eurostat, flagged as provisional and not yet including all participating countries, however. Where results of CVTS3 are not yet published by Eurostat, the presentation is based on tables made available by national bodies in charge of CVTS3 in Bulgaria, the Czech Republic, Germany, France and Sweden.
The main findings of CVTS3 regarding enterprises’ training will be presented, constituting a background for discussion of some results regarding training policy. CVT is one of the strategies open to enterprises to cope with the skill needs they are facing. The probing questions are: How do enterprises respond regarding their skill needs, are they perceiving skill needs, are they evaluating future skill needs of the enterprise and assessing training needs of employees?
Friederike Behringer is head of the unit ‘Costs, Benefits, Financing’ of BIBB (Federal Institute of Vocational Education and Training, Bonn). This unit forms part of the department ‘Sociology and Economics of Vocational Education and Training’ and has a strong international profile. Her main field of research and policy advice is education and training, with a focus on continuing education and training. Among other activities, she was a co-author of the Maastricht Study and took a leading role in European projects analysing continuing vocational training. She has published widely in the field of continuing education.
Prior to joining BIBB in 2003, she has worked with private research organisations (like Infratest, Munich) and independent non-profit institutions involved in research and policy advice like DIW (German Institute for Economic Research, Berlin) and OECD (Paris).
She received her diploma in social sciences form the Friedrich-Alexander-University in Erlangen/Nuremberg. She has a doctoral degree (Dr. rer. soc.) from the Ruhr-University in Bochum.
162
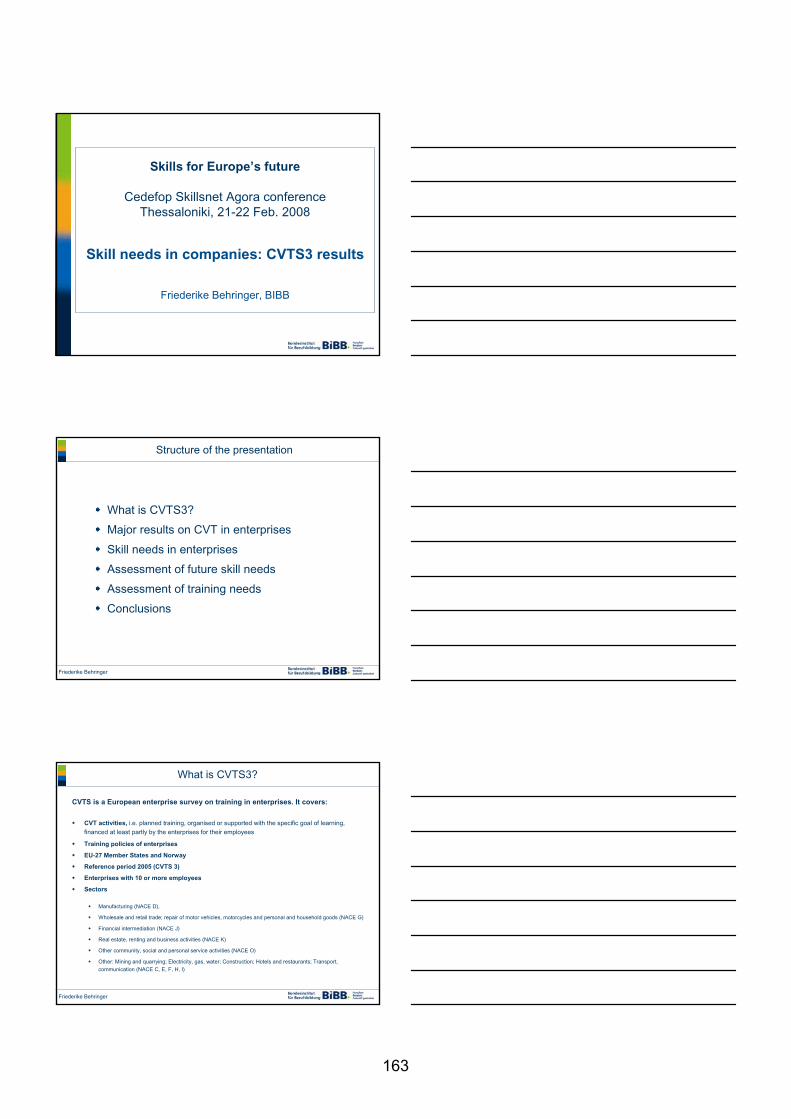
Skills for Europe’s future
Cedefop Skillsnet Agora conferenceThessaloniki, 21-22 Feb. 2008
Skill needs in companies: CVTS3 results
Friederike Behringer, BIBB
Friederike Behringer
Structure of the presentation
What is CVTS3?
Major results on CVT in enterprises
Skill needs in enterprises
Assessment of future skill needs
Assessment of training needs
Conclusions
Friederike Behringer
What is CVTS3?
CVTS is a European enterprise survey on training in enterprises. It covers:
CVT activities, i.e. planned training, organised or supported with the specific goal of learning, financed at least partly by the enterprises for their employees
Training policies of enterprises
EU-27 Member States and Norway
Reference period 2005 (CVTS 3)
Enterprises with 10 or more employees
Sectors
Manufacturing (NACE D),
Wholesale and retail trade; repair of motor vehicles, motorcycles and personal and household goods (NACE G)
Financial intermediation (NACE J)
Real estate, renting and business activities (NACE K)
Other community, social and personal service activities (NACE O)
Other: Mining and quarrying; Electricity, gas, water; Construction; Hotels and restaurants; Transport, communication (NACE C, E, F, H, I)
163
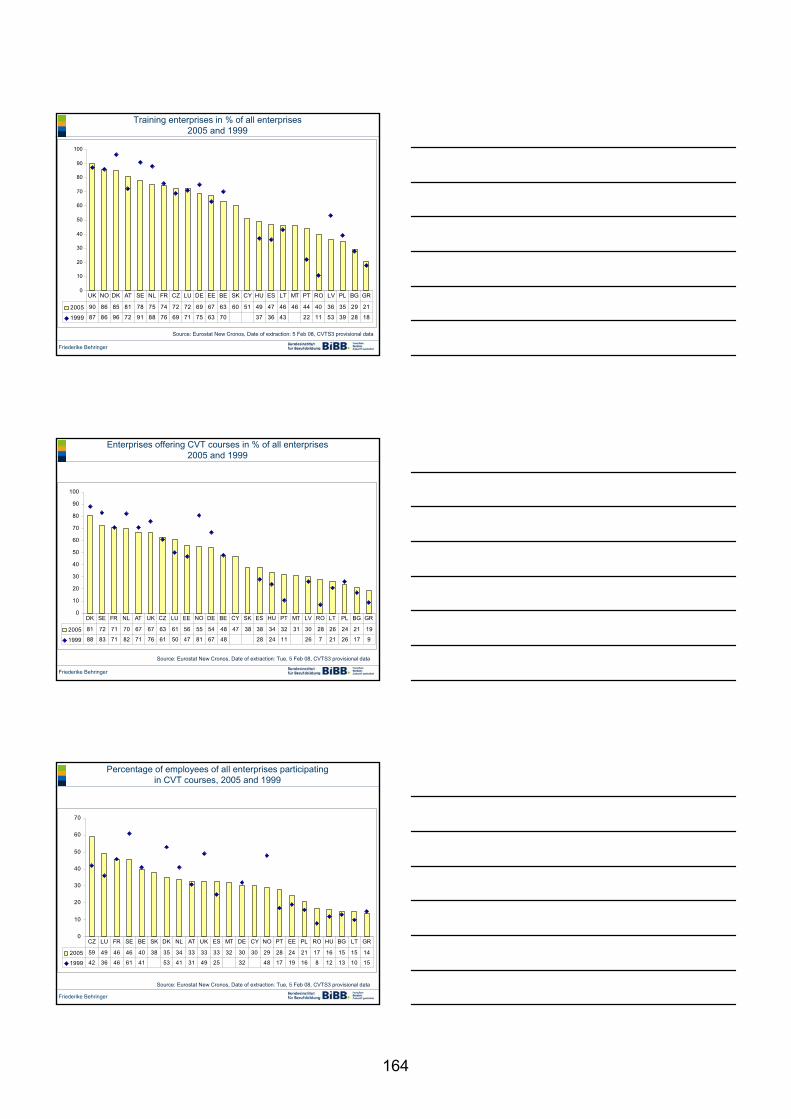
Friederike Behringer
Source: Eurostat New Cronos, Date of extraction: 5 Feb 08, CVTS3 provisional data
Training enterprises in % of all enterprises 2005 and 1999
0
10
20
30
40
50
60
70
80
90
100
2005 90 86 85 81 78 75 74 72 72 69 67 63 60 51 49 47 46 46 44 40 36 35 29 21
1999 87 86 96 72 91 88 76 69 71 75 63 70 37 36 43 22 11 53 39 28 18
UK NO DK AT SE NL FR CZ LU DE EE BE SK CY HU ES LT MT PT RO LV PL BG GR
Friederike Behringer
Enterprises offering CVT courses in % of all enterprises 2005 and 1999
Source: Eurostat New Cronos, Date of extraction: Tue, 5 Feb 08, CVTS3 provisional data
0
10
20
30
40
50
60
70
80
90
100
2005 81 72 71 70 67 67 63 61 56 55 54 48 47 38 38 34 32 31 30 28 26 24 21 19
1999 88 83 71 82 71 76 61 50 47 81 67 48 28 24 11 26 7 21 26 17 9
DK SE FR NL AT UK CZ LU EE NO DE BE CY SK ES HU PT MT LV RO LT PL BG GR
Friederike Behringer
Percentage of employees of all enterprises participating in CVT courses, 2005 and 1999
Source: Eurostat New Cronos, Date of extraction: Tue, 5 Feb 08, CVTS3 provisional data
0
10
20
30
40
50
60
70
2005 59 49 46 46 40 38 35 34 33 33 33 32 30 30 29 28 24 21 17 16 15 15 14
1999 42 36 46 61 41 53 41 31 49 25 32 48 17 19 16 8 12 13 10 15
CZ LU FR SE BE SK DK NL AT UK ES MT DE CY NO PT EE PL RO HU BG LT GR
164
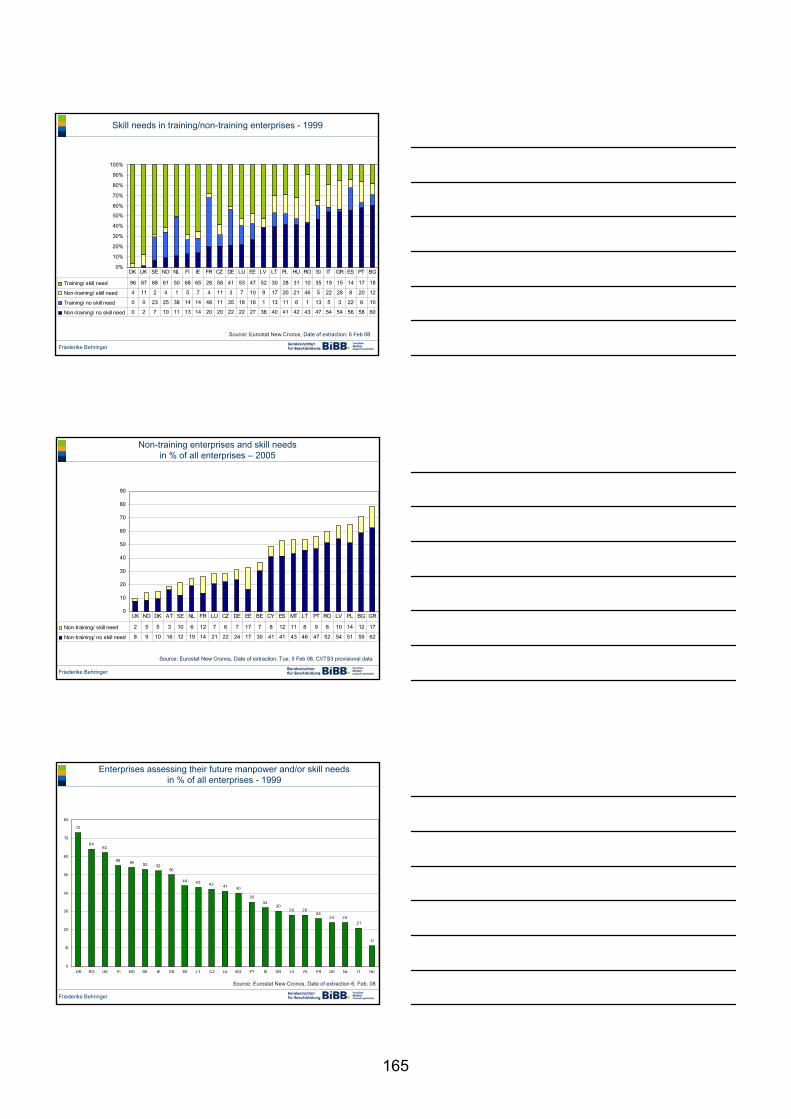
Friederike Behringer
Skill needs in training/non-training enterprises - 1999
Source: Eurostat New Cronos, Date of extraction: 6 Feb 08
0%
10%
20%
30%
40%
50%
60%
70%
80%
90%
100%
Training/ skill need 96 87 68 61 50 68 65 28 58 41 53 47 52 30 28 31 10 35 19 15 14 17 18
Non-training/ skill need 4 11 2 4 1 5 7 4 11 3 7 10 9 17 20 21 46 5 22 28 8 20 12
Training/ no skill need 0 0 23 25 38 14 14 48 11 35 18 16 1 13 11 6 1 13 5 3 22 6 10
Non-training/ no skill need 0 2 7 10 11 13 14 20 20 22 22 27 38 40 41 42 43 47 54 54 56 58 60
DK UK SE NO NL FI IE FR CZ DE LU EE LV LT PL HU RO SI IT GR ES PT BG
Friederike Behringer
Non-training enterprises and skill needs in % of all enterprises – 2005
Source: Eurostat New Cronos, Date of extraction: Tue, 5 Feb 08, CVTS3 provisional data
0
10
20
30
40
50
60
70
80
90
Non-training/ skill need 2 5 5 3 10 6 12 7 6 7 17 7 8 12 11 8 9 8 10 14 12 17
Non-training/ no skill need 8 9 10 16 12 19 14 21 22 24 17 30 41 41 43 46 47 52 54 51 59 62
UK NO DK AT SE NL FR LU CZ DE EE BE CY ES MT LT PT RO LV PL BG GR
Friederike Behringer
Enterprises assessing their future manpower and/or skill needs in % of all enterprises - 1999
Source: Eurostat New Cronos, Date of extraction 6. Feb. 08
73
6462
55 54 53 5250
44 43 42 41 40
3532
3028 28
2624 24
21
11
0
10
20
30
40
50
60
70
80
DK RO UK FI NO SE IE ES EE LT CZ LU BG PT SI GR LV PL FR DE NL IT HU
165

Friederike Behringer
Enterprises assessing their future manpower and/or skill needs in % of training/non-training enterprises - 1999
Source: Eurostat New Cronos, Date of extraction: 28. Feb 06
0
10
20
30
40
50
60
70
80
90
100
Training enterprises 74 88 68 61 60 57 63 67 56 61 52 48 68 71 56 65 43 45 30 30 27 45 20
Non-training enterprises 33 61 20 24 17 11 10 40 23 29 18 23 29 25 9 22 11 16 14 7 3 14 5
DK RO UK FI NO SE IE ES EE LT CZ LU BG PT SI GR LV PL FR DE NL IT HU
Friederike Behringer
Enterprises assessing future skill needs by formal procedures in % of training enterprises - 2005
Source: Eurostat New Cronos, CVTS3 provisional data (national data for CZ and DE)
0
10
20
30
40
50
60
70
80
90
100
Occasionally 8 9 29 42 40 35 53 35 40 42 24 42 6 22 45 28 31 37 35 32 29 14 3 12
Often 33 29 22 26 14 18 7 14 14 9 12 10 12 19 6 19 12 4 7 9 10 10 9 4
Always 55 51 24 7 9 9 2 12 6 8 22 6 38 14 3 6 8 8 3 3 2 16 24 16
CZ EE UK GR SE CY HU ES BG RO FR SK BE PT DK MT PL AT LT NL NO LU LV DE
Friederike Behringer
Enterprises assessing training needs of employees in % of training/non-training enterprises - 1999
Source: Eurostat New Cronos, CVTS3 provisional data
0
10
20
30
40
50
60
70
80
90
100
Training enterprises 86 86 82 76 75 74 71 70 66 65 64 63 62 60 59 57 56 54 52 50 50 39
Non-training enterprises 22 52 91 30 28 21 24 35 14 21 26 41 8 21 16 21 28 18 11 15 17 13
UK RO GR IE BG NO PT ES SE DK EE NL SI IT LU PL LT LV DE CZ HU FR
166
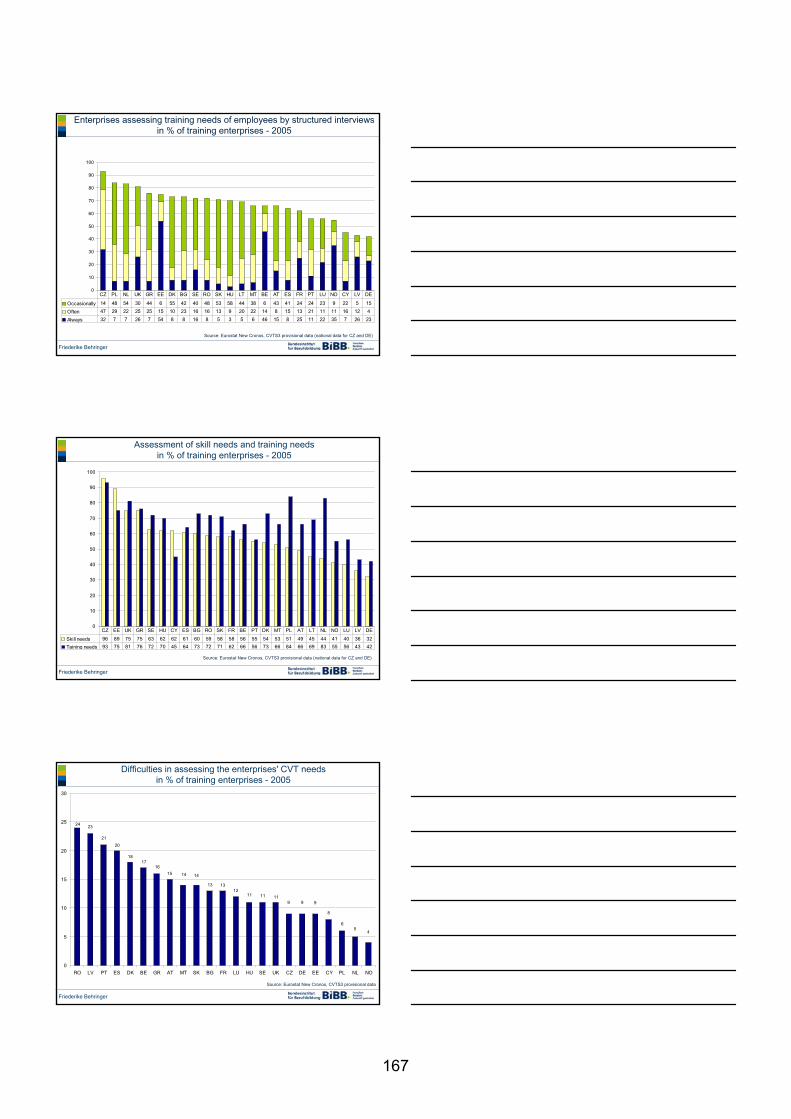
Friederike Behringer
Enterprises assessing training needs of employees by structured interviews in % of training enterprises - 2005
Source: Eurostat New Cronos, CVTS3 provisional data (national data for CZ and DE)
0
10
20
30
40
50
60
70
80
90
100
Occasionally 14 48 54 30 44 6 55 42 40 48 53 58 44 38 6 43 41 24 24 23 9 22 5 15
Often 47 29 22 25 25 15 10 23 16 16 13 9 20 22 14 8 15 13 21 11 11 16 12 4
Always 32 7 7 26 7 54 8 8 16 8 5 3 5 6 46 15 8 25 11 22 35 7 26 23
CZ PL NL UK GR EE DK BG SE RO SK HU LT MT BE AT ES FR PT LU NO CY LV DE
Friederike Behringer
Assessment of skill needs and training needs in % of training enterprises - 2005
Source: Eurostat New Cronos, CVTS3 provisional data (national data for CZ and DE)
0
10
20
30
40
50
60
70
80
90
100
Skill needs 96 89 75 75 63 62 62 61 60 59 58 58 56 55 54 53 51 49 45 44 41 40 36 32
Taining needs 93 75 81 76 72 70 45 64 73 72 71 62 66 56 73 66 84 66 69 83 55 56 43 42
CZ EE UK GR SE HU CY ES BG RO SK FR BE PT DK MT PL AT LT NL NO LU LV DE
Friederike Behringer
Difficulties in assessing the enterprises' CVT needs in % of training enterprises - 2005
Source: Eurostat New Cronos, CVTS3 provisional data
24 23
21
20
1817
16
15 14 14
13 1312
11
45
6
8
9991111
0
5
10
15
20
25
30
RO LV PT ES DK BE GR AT MT SK BG FR LU HU SE UK CZ DE EE CY PL NL NO
167


SKILLS FOR THE FUTURE: KEY POLICY CHALLENGES
Panel discussion

SKILLS FOR THE FUTURE: KEY POLICY CHALLENGES
Panel discussion Chair: Aviana Bulgarelli, Cedefop Panellists: David White, DG Education and Culture, European Commission
Xavier Prats-Monné, DG Employment, Social Affairs and Equal Opportunities, European Commission Mathew Higham, BusinessEurope Petri Lempinen, Finnish Confederation of Salaried Employees STTK, Finland European Parliament representative Maria João Rodrigues, Portuguese presidency Slava Pevec Grm, Slovenian presidency French presidency representative
Current employment trends show rising skill levels of the workforce, a polarised demand for skills (i.e. more high-level and elementary occupations), and skill shortages and gaps. These trends - influenced by demographic change, technological innovation, the shift toward knowledge-intensive services, the rise in educational attainment – clearly have policy implications for education and training, migration and mobility, guidance, active and passive labour market measures, and several other fields. It is therefore not surprising that anticipating occupational skill needs is a priority for European policy. As such, it is included in the Maastricht and Helsinki Communiqués (2004, 2006), the Integrated guidelines for employment for 2005-2008 and 2008-2010 (Guidelines Nos 19, 20 and 24), the Regulation (EC) on the European Social Fund, and the Social partners’ framework of actions for the lifelong learning development of competencies and qualifications (2002). In addition, in the recently proposed Community Lisbon Programme 2008-2010, the Commission included the objective of helping to address the skills gap through improved monitoring and forecasting of future skills; and on 15 November 2007, the EU Education, Youth Affairs and Culture Council adopted the Resolution on new skills for new job, which emphasises the practical steps to be taken to offer citizens better opportunities to succeed on the labour market. Among other issues, the resolution stressed the need for a better anticipation of skill needs and gaps on the labour market. The Council invited the Commission to strengthen the European network for the early identification of skills needs (Cedefop's Skillsnet) and the European forecasting system on employment trends. Clearly, there is a demand for reliable labour market information and intelligence. But to achieve such reliability, the deficiencies of European data need to be addressed. The panel discussion will address the following issues: • What do the predicted changes in employment patterns imply for policy? Which measures should be taken in
education and training, in the labour market, in guidance and counselling, for workforce mobility? What can the social partners do?
• How can we turn research findings into practice in these fields? How can the social partners contribute? • What could be done to improve the labour market information and intelligence system? How could we improve
current statistics collection and data coverage? What could be done at the EU level? How can individual Member States help?
170