Embed Size (px)
Citation preview

Third Quarterly Report of 2017
Qingdao Haier Co., Ltd.
1 / 34
Stock Code: 600690 Short Name: Qingdao Haier
Third Quarterly Report of
2017
Qingdao Haier Co., Ltd
Stock Code: 600690
INTELLIGENCE
CREATES SMART LIFE

Third Quarterly Report of 2017
Qingdao Haier Co., Ltd.
2 / 34
Contents
I. Important Notice ......................................................................................................................... 3
II. Company Profile ......................................................................................................................... 3
III. Important Events ......................................................................................................................... 8
IV. Appendix .....................................................................................................................................18

Third Quarterly Report of 2017
Qingdao Haier Co., Ltd.
3 / 34
I. Important Notice
1.1 The Board of Directors, the Board of Supervisors and directors, supervisors and senior
management of Qingdao Haier Co., Ltd. (the “Company”) hereby assure that the content set out in
the quarterly report is true, accurate and complete, and free from any false record, misleading
representation or material omission, and are individually and collectively responsible for the
content set out therein.
1.2 All directors of the Company have attended the Board meeting to consider and approve the quarterly report.
1.3 Liang Haishan (legal representative of the Company), Gong Wei (chief financial officer of the
Company) and Ying Ke (the person in charge of accounting department) hereby certify that the financial statement set out in the quarterly report is true, accurate and complete.
1.4 Third quarterly report of the Company has not been audited.
II. Company Profile
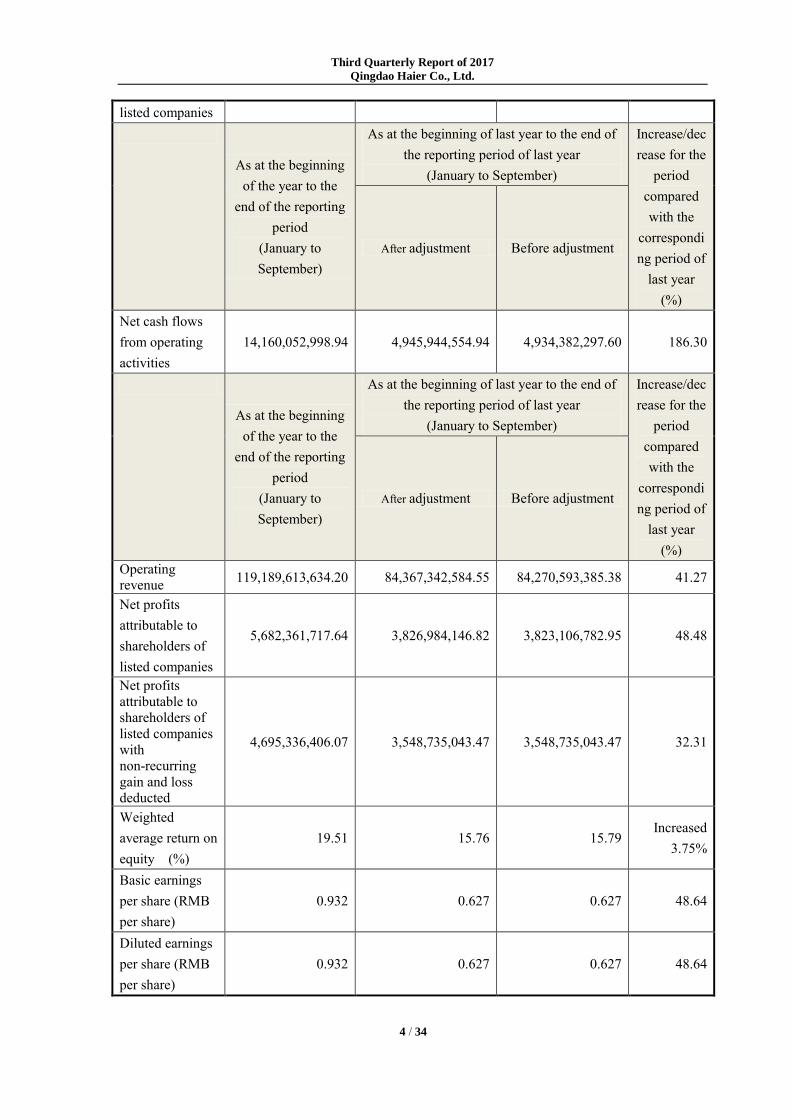
2.1 Major financial information
Unit and Currency: RMB
As at the end of the
reporting period
At the end of last year Increase/decrease at the end of the reporting
period compared
with the end of last year
(%)
After adjustment Before adjustment
Total assets 144,448,659,020.58 131,469,157,348.79 131,255,290,325.24 9.87 Net assets attributable to shareholders of
30,205,038,353.20 26,438,188,226.56 26,364,725,409.83 14.25
Third Quarterly Report of 2017
Qingdao Haier Co., Ltd.
4 / 34
listed companies
As at the beginning of the year to the
end of the reporting period
(January to September)
As at the beginning of last year to the end of the reporting period of last year
(January to September)
Increase/decrease for the
period compared with the
corresponding period of
last year (%)
After adjustment Before adjustment
Net cash flows from operating activities
14,160,052,998.94 4,945,944,554.94 4,934,382,297.60 186.30
As at the beginning of the year to the
end of the reporting period
(January to September)
As at the beginning of last year to the end of the reporting period of last year
(January to September)
Increase/decrease for the
period compared with the
corresponding period of
last year (%)
After adjustment Before adjustment
Operating revenue 119,189,613,634.20 84,367,342,584.55 84,270,593,385.38 41.27
Net profits attributable to shareholders of listed companies
5,682,361,717.64 3,826,984,146.82 3,823,106,782.95 48.48
Net profits attributable to shareholders of listed companies with non-recurring gain and loss deducted
4,695,336,406.07 3,548,735,043.47 3,548,735,043.47 32.31
Weighted average return on equity (%)
19.51 15.76 15.79 Increased
3.75%
Basic earnings per share (RMB per share)
0.932 0.627 0.627 48.64
Diluted earnings per share (RMB per share)
0.932 0.627 0.627 48.64

Third Quarterly Report of 2017
Qingdao Haier Co., Ltd.
5 / 34
Notes:
1. From January to September 2017, the Company’s revenue increased by 41% compared to the corresponding
period of last year, among which, revenue from refrigerator and freezer business increased by 34%, revenue from washing
machine business increased by 41%, revenue from air conditioner business increased by 61% and revenue from kitchen
products increased by 76%.
2. From January to September 2017, revenue from the original business of the Company (excluding GEA) increased
by 22%, and net profit attributable to the Parent Company with non-recurring gain and loss deducted increased by 22%.
3. The domestic market focuses on retail transformation, efficiency optimization and structure upgrading. Revenue
from domestic white appliances increased by 26% from January to September 2017; high-end brand Casarte continues to
grow rapidly with an increase of 41% in the first three quarters, maintaining the absolute leading position in the high-end
market.
4. The overseas market carries forward multi-brand and “R&D, manufacturing and marketing” integrated layout,
realizing comprehensive development. From January to September 2017, the overall overseas revenue amounted to
RMB50.74 billion, representing 43% of the total revenue, and approximately 100% of the revenue from self-owned brand:
①From January to September 2017, GEA’s contribution to revenue amounted to RMB34.2 billion, contribution to the net
profit attributable to the Parent Company amounted to RMB1.88 billion and contribution to net profits attributable to
shareholders of listed companies with non-recurring gain and loss deducted amounted to RMB1.02 billion. Among which
the third quarter alone recorded revenue of RMB11.7 billion, representing an increase of 7.7% compared with the
corresponding period of last year. ②Revenue from original overseas business (excluding GEA) increased by 20%, among
which revenue from the South-Asian market increased by 49%, revenue from the European market increased by 29%,
revenue from the Middle-Eastern and African market increased by 29% and revenue from the Australian market increased
by 19%.
5. U+ SmartLife platform focuses on intellectualization and user experience upgrading, accelerating
the pace of product intellectualization, and continuing the iteration of the U+ Home OS system. The sale
of white internet appliances (smart appliances) for the first three quarters amounted to 8.4 million units,
representing an increase of 222%. U+ platform users amounted to 50 million, representing an increase of
102%, compared with the corresponding period of last year.
6. Carrying forward the construction of COSMOPlat Industrial Internet Platform and promoting the transformation
of digital enterprises, mass customization of appliances amounted to 7.14 million units, representing an increase of 870%.
Third Quarterly Report of 2017
Qingdao Haier Co., Ltd.
6 / 34
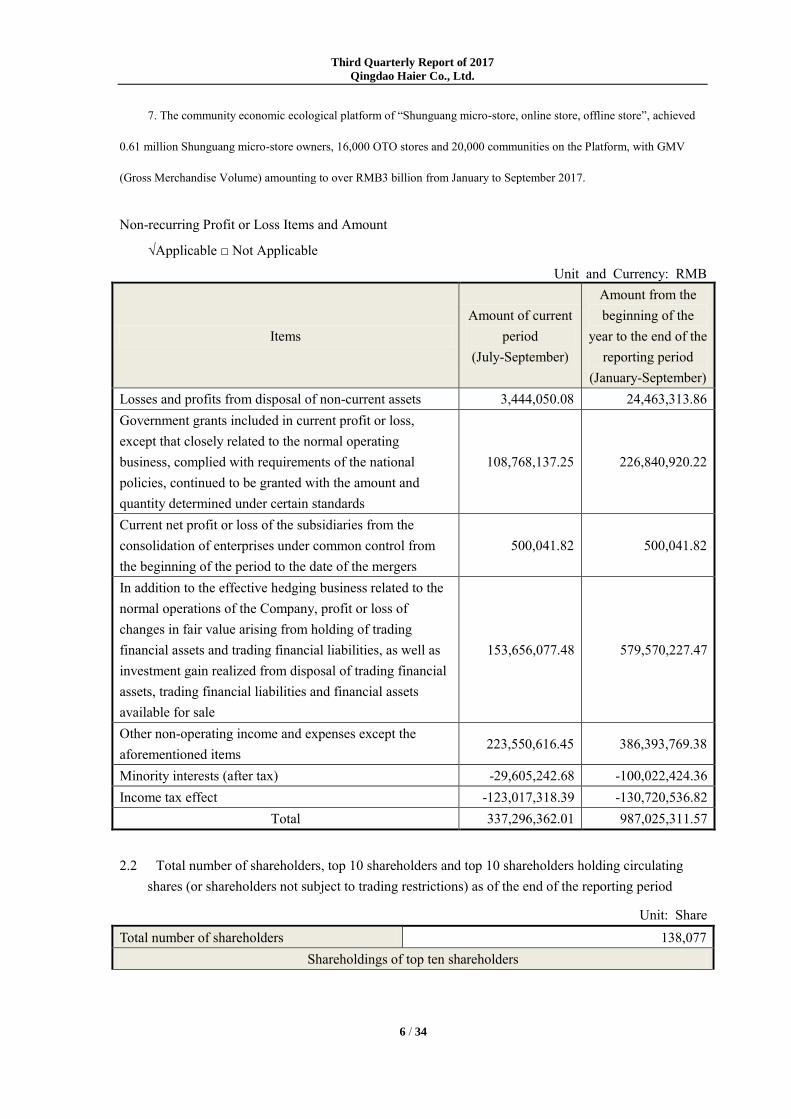
7. The community economic ecological platform of “Shunguang micro-store, online store, offline store”, achieved
0.61 million Shunguang micro-store owners, 16,000 OTO stores and 20,000 communities on the Platform, with GMV
(Gross Merchandise Volume) amounting to over RMB3 billion from January to September 2017.
Non-recurring Profit or Loss Items and Amount
√Applicable □ Not Applicable
Unit and Currency: RMB
Items Amount of current
period (July-September)
Amount from the beginning of the
year to the end of the reporting period
(January-September) Losses and profits from disposal of non-current assets 3,444,050.08 24,463,313.86 Government grants included in current profit or loss, except that closely related to the normal operating business, complied with requirements of the national policies, continued to be granted with the amount and quantity determined under certain standards
108,768,137.25 226,840,920.22
Current net profit or loss of the subsidiaries from the consolidation of enterprises under common control from the beginning of the period to the date of the mergers
500,041.82 500,041.82
In addition to the effective hedging business related to the normal operations of the Company, profit or loss of changes in fair value arising from holding of trading financial assets and trading financial liabilities, as well as investment gain realized from disposal of trading financial assets, trading financial liabilities and financial assets available for sale
153,656,077.48 579,570,227.47
Other non-operating income and expenses except the aforementioned items
223,550,616.45 386,393,769.38
Minority interests (after tax) -29,605,242.68 -100,022,424.36 Income tax effect -123,017,318.39 -130,720,536.82
Total 337,296,362.01 987,025,311.57
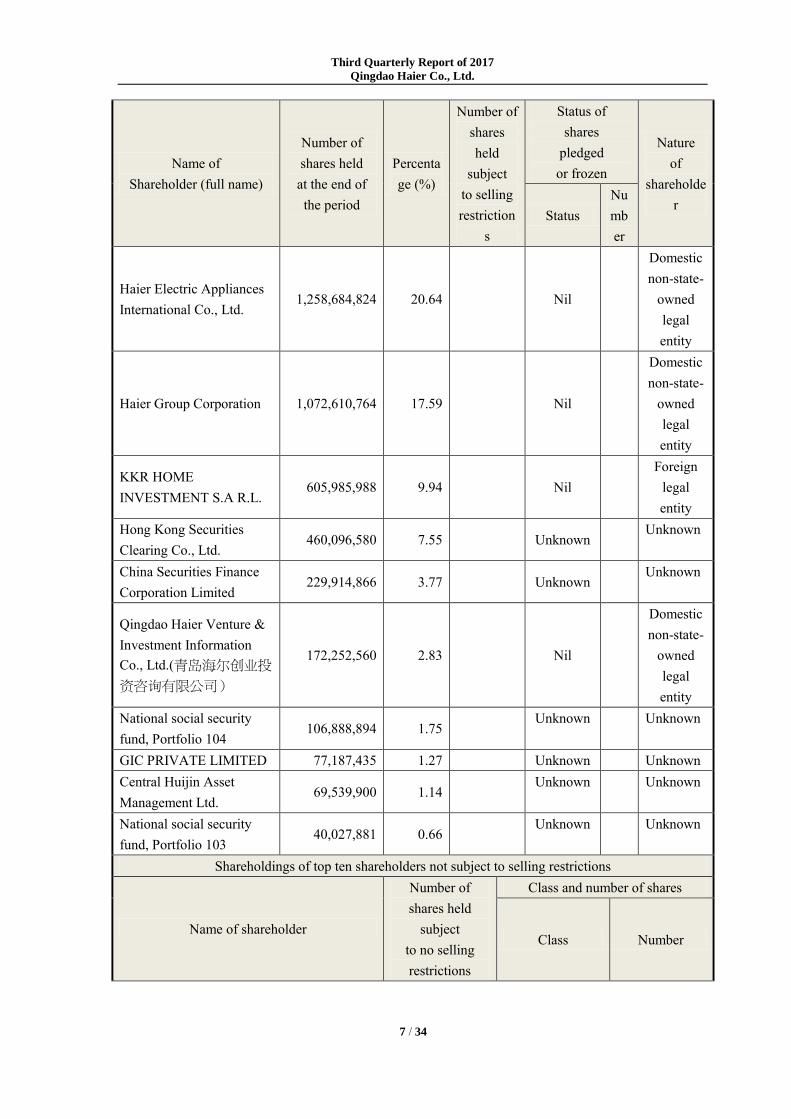
2.2 Total number of shareholders, top 10 shareholders and top 10 shareholders holding circulating shares (or shareholders not subject to trading restrictions) as of the end of the reporting period
Unit: Share Total number of shareholders 138,077
Shareholdings of top ten shareholders
Third Quarterly Report of 2017
Qingdao Haier Co., Ltd.
7 / 34
Name of Shareholder (full name)
Number of shares held at the end of the period
Percentage (%)
Number of shares held
subject to selling restriction
s
Status of shares
pledged or frozen
Nature of
shareholder
Status Number
Haier Electric Appliances International Co., Ltd.
1,258,684,824 20.64 Nil
Domestic non-state-
owned legal entity
Haier Group Corporation 1,072,610,764 17.59 Nil
Domestic non-state-
owned legal entity
KKR HOME INVESTMENT S.A R.L.
605,985,988 9.94 Nil Foreign
legal entity
Hong Kong Securities Clearing Co., Ltd.
460,096,580 7.55 Unknown Unknown
China Securities Finance Corporation Limited
229,914,866 3.77 Unknown Unknown
Qingdao Haier Venture & Investment Information Co., Ltd.(青岛海尔创业投
资咨询有限公司)
172,252,560 2.83 Nil
Domestic non-state-
owned legal entity
National social security fund, Portfolio 104
106,888,894 1.75 Unknown Unknown
GIC PRIVATE LIMITED 77,187,435 1.27 Unknown Unknown Central Huijin Asset Management Ltd.
69,539,900 1.14 Unknown Unknown
National social security fund, Portfolio 103
40,027,881 0.66 Unknown Unknown
Shareholdings of top ten shareholders not subject to selling restrictions
Name of shareholder
Number of shares held
subject to no selling restrictions
Class and number of shares
Class Number
Third Quarterly Report of 2017
Qingdao Haier Co., Ltd.
8 / 34
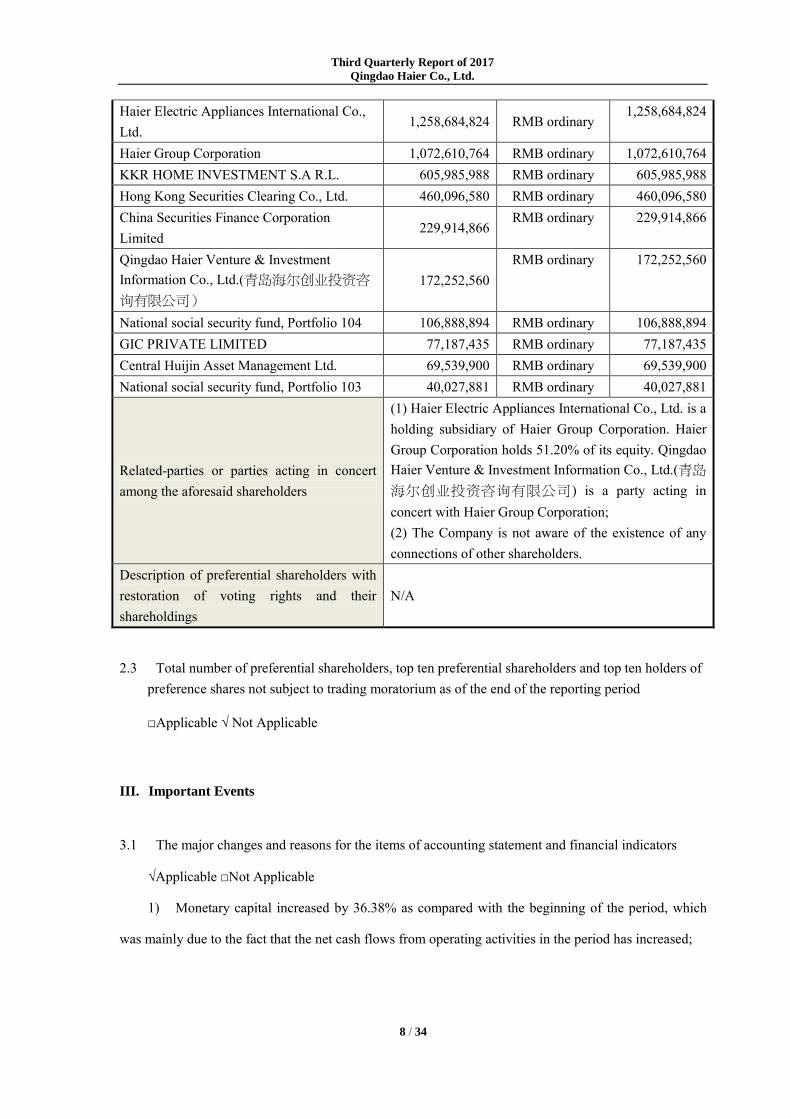
Haier Electric Appliances International Co., Ltd.
1,258,684,824 RMB ordinary 1,258,684,824
Haier Group Corporation 1,072,610,764 RMB ordinary 1,072,610,764 KKR HOME INVESTMENT S.A R.L. 605,985,988 RMB ordinary 605,985,988 Hong Kong Securities Clearing Co., Ltd. 460,096,580 RMB ordinary 460,096,580 China Securities Finance Corporation Limited
229,914,866 RMB ordinary 229,914,866
Qingdao Haier Venture & Investment Information Co., Ltd.(青岛海尔创业投资咨
询有限公司) 172,252,560
RMB ordinary 172,252,560
National social security fund, Portfolio 104 106,888,894 RMB ordinary 106,888,894 GIC PRIVATE LIMITED 77,187,435 RMB ordinary 77,187,435 Central Huijin Asset Management Ltd. 69,539,900 RMB ordinary 69,539,900 National social security fund, Portfolio 103 40,027,881 RMB ordinary 40,027,881
Related-parties or parties acting in concert among the aforesaid shareholders
(1) Haier Electric Appliances International Co., Ltd. is a holding subsidiary of Haier Group Corporation. Haier Group Corporation holds 51.20% of its equity. Qingdao Haier Venture & Investment Information Co., Ltd.(青岛
海尔创业投资咨询有限公司) is a party acting in concert with Haier Group Corporation; (2) The Company is not aware of the existence of any connections of other shareholders.
Description of preferential shareholders with restoration of voting rights and their shareholdings
N/A
2.3 Total number of preferential shareholders, top ten preferential shareholders and top ten holders of preference shares not subject to trading moratorium as of the end of the reporting period
□Applicable √ Not Applicable
III. Important Events
3.1 The major changes and reasons for the items of accounting statement and financial indicators
√Applicable □Not Applicable
1) Monetary capital increased by 36.38% as compared with the beginning of the period, which
was mainly due to the fact that the net cash flows from operating activities in the period has increased;
Third Quarterly Report of 2017
Qingdao Haier Co., Ltd.
9 / 34
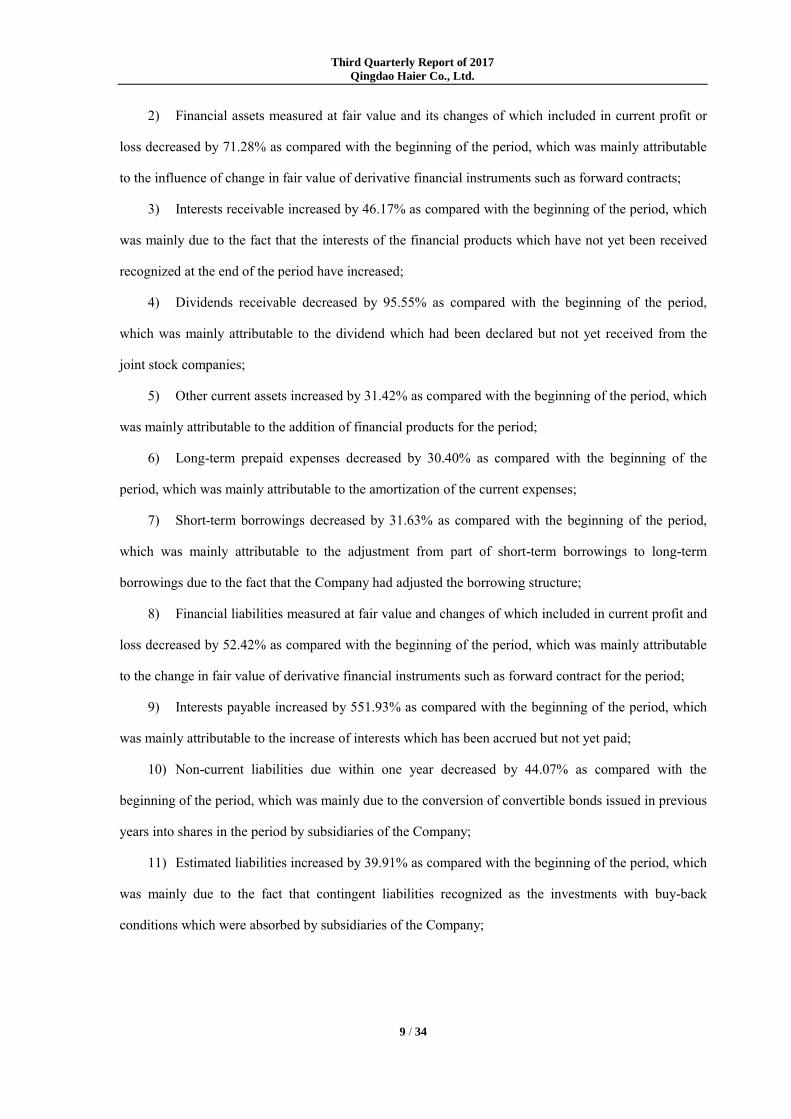
2) Financial assets measured at fair value and its changes of which included in current profit or
loss decreased by 71.28% as compared with the beginning of the period, which was mainly attributable
to the influence of change in fair value of derivative financial instruments such as forward contracts;
3) Interests receivable increased by 46.17% as compared with the beginning of the period, which
was mainly due to the fact that the interests of the financial products which have not yet been received
recognized at the end of the period have increased;
4) Dividends receivable decreased by 95.55% as compared with the beginning of the period,
which was mainly attributable to the dividend which had been declared but not yet received from the
joint stock companies;
5) Other current assets increased by 31.42% as compared with the beginning of the period, which
was mainly attributable to the addition of financial products for the period;
6) Long-term prepaid expenses decreased by 30.40% as compared with the beginning of the
period, which was mainly attributable to the amortization of the current expenses;
7) Short-term borrowings decreased by 31.63% as compared with the beginning of the period,
which was mainly attributable to the adjustment from part of short-term borrowings to long-term
borrowings due to the fact that the Company had adjusted the borrowing structure;
8) Financial liabilities measured at fair value and changes of which included in current profit and
loss decreased by 52.42% as compared with the beginning of the period, which was mainly attributable
to the change in fair value of derivative financial instruments such as forward contract for the period;
9) Interests payable increased by 551.93% as compared with the beginning of the period, which
was mainly attributable to the increase of interests which has been accrued but not yet paid;
10) Non-current liabilities due within one year decreased by 44.07% as compared with the
beginning of the period, which was mainly due to the conversion of convertible bonds issued in previous
years into shares in the period by subsidiaries of the Company;
11) Estimated liabilities increased by 39.91% as compared with the beginning of the period, which
was mainly due to the fact that contingent liabilities recognized as the investments with buy-back
conditions which were absorbed by subsidiaries of the Company;
Third Quarterly Report of 2017
Qingdao Haier Co., Ltd.
10 / 34
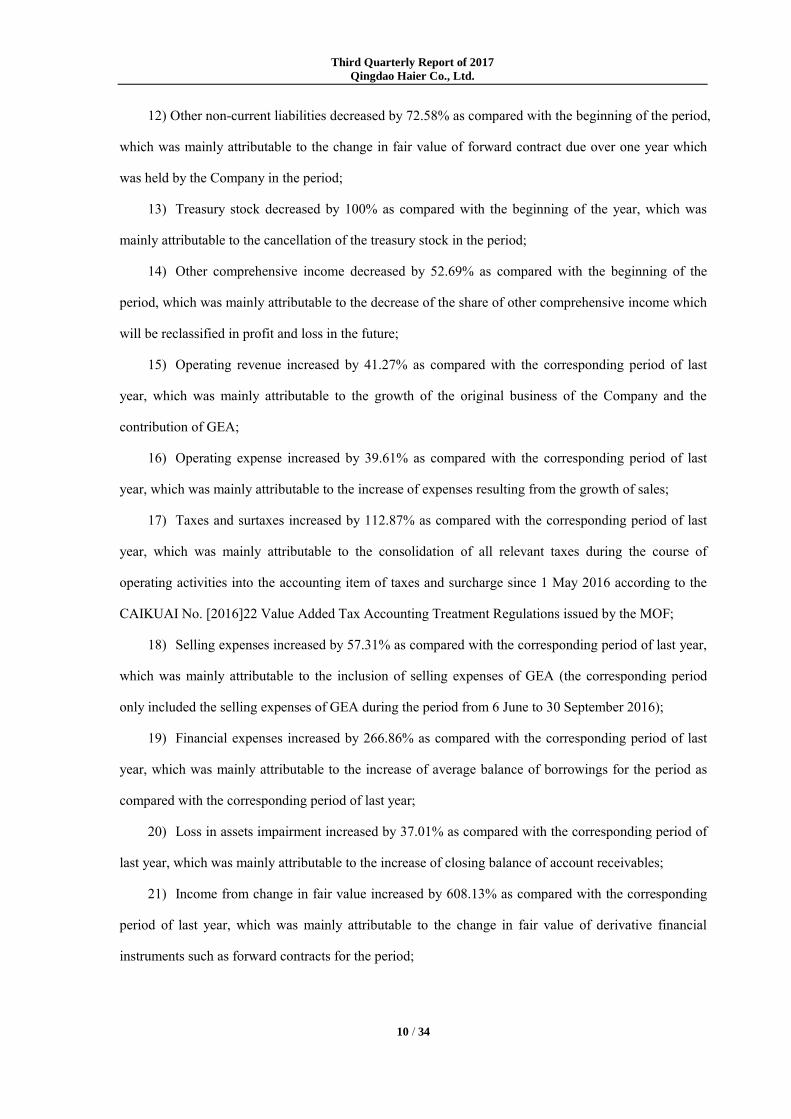
12) Other non-current liabilities decreased by 72.58% as compared with the beginning of the period,
which was mainly attributable to the change in fair value of forward contract due over one year which
was held by the Company in the period;
13) Treasury stock decreased by 100% as compared with the beginning of the year, which was
mainly attributable to the cancellation of the treasury stock in the period;
14) Other comprehensive income decreased by 52.69% as compared with the beginning of the
period, which was mainly attributable to the decrease of the share of other comprehensive income which
will be reclassified in profit and loss in the future;
15) Operating revenue increased by 41.27% as compared with the corresponding period of last
year, which was mainly attributable to the growth of the original business of the Company and the
contribution of GEA;
16) Operating expense increased by 39.61% as compared with the corresponding period of last
year, which was mainly attributable to the increase of expenses resulting from the growth of sales;
17) Taxes and surtaxes increased by 112.87% as compared with the corresponding period of last
year, which was mainly attributable to the consolidation of all relevant taxes during the course of
operating activities into the accounting item of taxes and surcharge since 1 May 2016 according to the
CAIKUAI No. [2016]22 Value Added Tax Accounting Treatment Regulations issued by the MOF;
18) Selling expenses increased by 57.31% as compared with the corresponding period of last year,
which was mainly attributable to the inclusion of selling expenses of GEA (the corresponding period
only included the selling expenses of GEA during the period from 6 June to 30 September 2016);
19) Financial expenses increased by 266.86% as compared with the corresponding period of last
year, which was mainly attributable to the increase of average balance of borrowings for the period as
compared with the corresponding period of last year;
20) Loss in assets impairment increased by 37.01% as compared with the corresponding period of
last year, which was mainly attributable to the increase of closing balance of account receivables;
21) Income from change in fair value increased by 608.13% as compared with the corresponding
period of last year, which was mainly attributable to the change in fair value of derivative financial
instruments such as forward contracts for the period;

Third Quarterly Report of 2017
Qingdao Haier Co., Ltd.
11 / 34
22) Other income increased by 100% as compared with the corresponding period of last year,
which was mainly attributable to the implementation of the Accounting Standards for Business
Enterprises No. 16 - Government grants (2017 Revision) at the time as requested by the MOF during the
period;
23) Non-operating expenses decreased by 57.48% as compared with the corresponding period of
last year, which was mainly attributable to the higher one off expense which was incurred from the
acquisition of GEA in the corresponding period of last year and there was no such factor in the current
period;
24) Net cash flows from operating activities increased by 186.30% as compared with the
corresponding period of last year, which was mainly due to the increase of revenue for the period and
the strengthening of management of supply chain;
25) Net cash flows from investing activities increased by 87.64% as compared with the
corresponding period of last year, which was mainly attributable to the higher payment for the
acquisition of GEA in the corresponding period of last year;
26) Net cash flows from financing activities decreased by 103.06% as compared with the
corresponding period of last year, which was mainly attributable to the substantial debt financing used
for the acquisition of GEA in the corresponding period of last year.
3.2 Note and analysis on the progress of significant events and their impact and solution
√ Applicable □Not Applicable
(1) As of the end of the reporting period, the external guarantees of the Company and its
subsidiaries are all guarantees among the Company and its subsidiaries, and the balance of the external
guarantees amounted to RMB23.757 billion, representing 78.7% of the net assets of the Company for the
latest period, and 16.4% of the total assets for the latest period.
(2) As of the end of the reporting period, the balance of the Company’s exchange transactions of
derivative products amounted to approximately US$2.9 billion.

Third Quarterly Report of 2017
Qingdao Haier Co., Ltd.
12 / 34
3.3 The undertakings that have been past due and not been completed during the reporting period.
□Applicable √Not applicable
During the reporting period, the Company has no undertakings that have past due but not performed.
The undertakings made by the actual controlling shareholders, shareholders, related parties, purchasers and the Company and others during or up to the
reporting period are as follows:
Background Type Covenanter Content Time and
term
Whether it has a
deadline for performance
Whether it is
performed in a
timely and strict
way
Undertaking related to significant assets reorganization
Eliminate the property right defects in land and etc.
Haier Group Corporation
During the period from September 2006 to May 2007, the Company issued shares to Haier Group Corporation (“Haier Group”) to purchase the controlling equity in its four subsidiaries, namely Qingdao Haier Air-Conditioner Electronics Co., Ltd. (青岛海尔空调电子有限公司), Hefei Haier Air-conditioning Co., Limited (合肥海尔空调器有限公司), Wuhan Haier Electronics Co., Ltd. ( 武 汉 海 尔 电 器 股 份 有 限 公 司 ), Guizhou Haier Electronics Co., Ltd. (贵州海尔电器有限公司). With regard to the land and property required in the operation of Qingdao Haier Air-Conditioner Electronics Co., Ltd. (青岛海尔空调电子有限公
司) , Hefei Haier Air-conditioning Co., Limited (合肥海尔空调器
有限公司), Wuhan Haier Electronics Co., Ltd. (武汉海尔电器股
份 有 限 公 司 ) (the “Covenantees”), Haier Group made an
27 September 2006, long term
YES YES
Third Quarterly Report of 2017
Qingdao Haier Co., Ltd.
13 / 34
undertaking (the “2006 Undertaking”). According to the content of 2006 Undertaking and current condition of each Covenantee, Haier Group will constantly assure that Covenantees will lease the land and property owned by Haier Group for free. Haier Group will make compensation in the event that the Covenantees suffer loss due to the unavailability of such land and property.
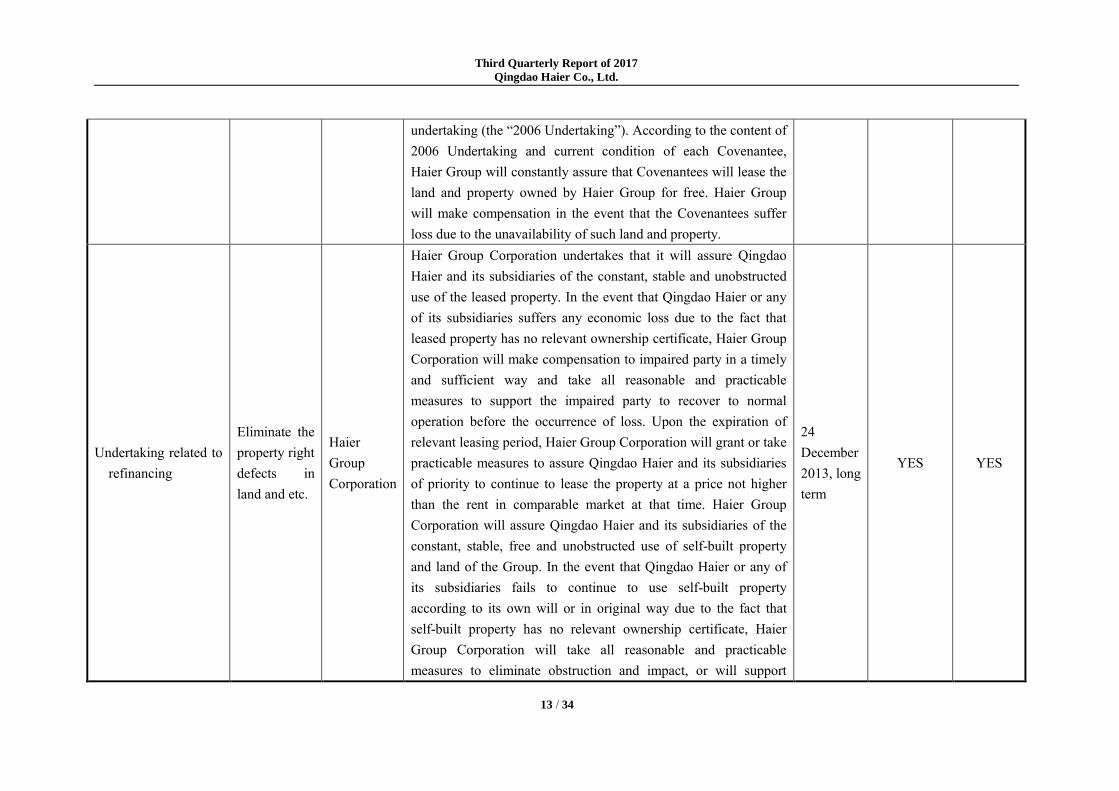
Undertaking related to refinancing
Eliminate the property right defects in land and etc.
Haier Group Corporation
Haier Group Corporation undertakes that it will assure Qingdao Haier and its subsidiaries of the constant, stable and unobstructed use of the leased property. In the event that Qingdao Haier or any of its subsidiaries suffers any economic loss due to the fact that leased property has no relevant ownership certificate, Haier Group Corporation will make compensation to impaired party in a timely and sufficient way and take all reasonable and practicable measures to support the impaired party to recover to normal operation before the occurrence of loss. Upon the expiration of relevant leasing period, Haier Group Corporation will grant or take practicable measures to assure Qingdao Haier and its subsidiaries of priority to continue to lease the property at a price not higher than the rent in comparable market at that time. Haier Group Corporation will assure Qingdao Haier and its subsidiaries of the constant, stable, free and unobstructed use of self-built property and land of the Group. In the event that Qingdao Haier or any of its subsidiaries fails to continue to use self-built property according to its own will or in original way due to the fact that self-built property has no relevant ownership certificate, Haier Group Corporation will take all reasonable and practicable measures to eliminate obstruction and impact, or will support
24 December 2013, long term
YES YES

Third Quarterly Report of 2017
Qingdao Haier Co., Ltd.
14 / 34
Qingdao Haier or its affected subsidiary to obtain alternative property as soon as possible, if Haier Group Corporation anticipates it is unable to cope with or eliminate the external obstruction and impact with its reasonable effort. For details, please refer to the Announcement of Qingdao Haier Co., Ltd. on the Formation, Current Situation of the Defective Property, the Influence on Operation of Issuer Caused by Uncertainty of Ownership, Solution for the Defect and Guarantee Measures (L 2014-005) published by the Company on the four major securities newspapers and the website of Shanghai Stock Exchange on 29 March 2014.
Eliminate the property right defects in land and etc.
Qingdao Haier Co., Ltd.
The Company undertakes that it will eliminate the property defects of the Company and main subsidiaries within five years with reasonable business effort since 24 December 2013, so as to achieve the legality and compliance of the Company and main subsidiaries in terms of land and property. For details, please refer to the Announcement of Qingdao Haier Co., Ltd. on the Formation, Current Situation of the Defective Property, the Influence on Operation of Issuer Caused by Uncertainty of Ownership, Solution for the Defect and Guarantee Measures (L 2014-005) published by the Company on the four major securities newspapers and the website of Shanghai Stock Exchange on 29 March 2014.
24 December 2013, five years
YES YES
Undertaking related to the share option incentive
Other Qingdao Haier Co., Ltd.
With regard to its Share Option Incentive Scheme, the Company has undertaken not to provide loan or any other kind of financial support to incentive object in exercising option under the Share Option Incentive Scheme or purchase of restricted shares,
11 April 2014, long term
YES YES

Third Quarterly Report of 2017
Qingdao Haier Co., Ltd.
15 / 34
including providing guarantee for its loan.
Other undertakings made to the medium and minority shareholders
Asset injection
Haier Group Corporation
Inject the assets of Fisher&Paykel to the Company or dispose such assets through other ways according to the requirements of the domestic supervision before June 2020. For more details, please refer to the Announcement of Qingdao Haier Co., Ltd. on the Changes of Funding Commitment of Haier Group Corporation (L 2015-015) published on the four major securities newspapers and the website of Shanghai Stock Exchange on 26 May 2015.
May 2015-June 2020
YES YES
Asset injection
Haier Group Corporation
Inject the assets of Haier Photoelectric to the Company or dispose such assets through other ways according to the requirements of the domestic supervision before June 2020. For more details, please refer to the Announcement of Qingdao Haier Co., Ltd. on the Changes of Funding Commitment of Haier Group Corporation (L 2015-063) published on the four major securities newspapers and the website of Shanghai Stock Exchange on 23 December 2015.
December 2015-June 2020
YES YES
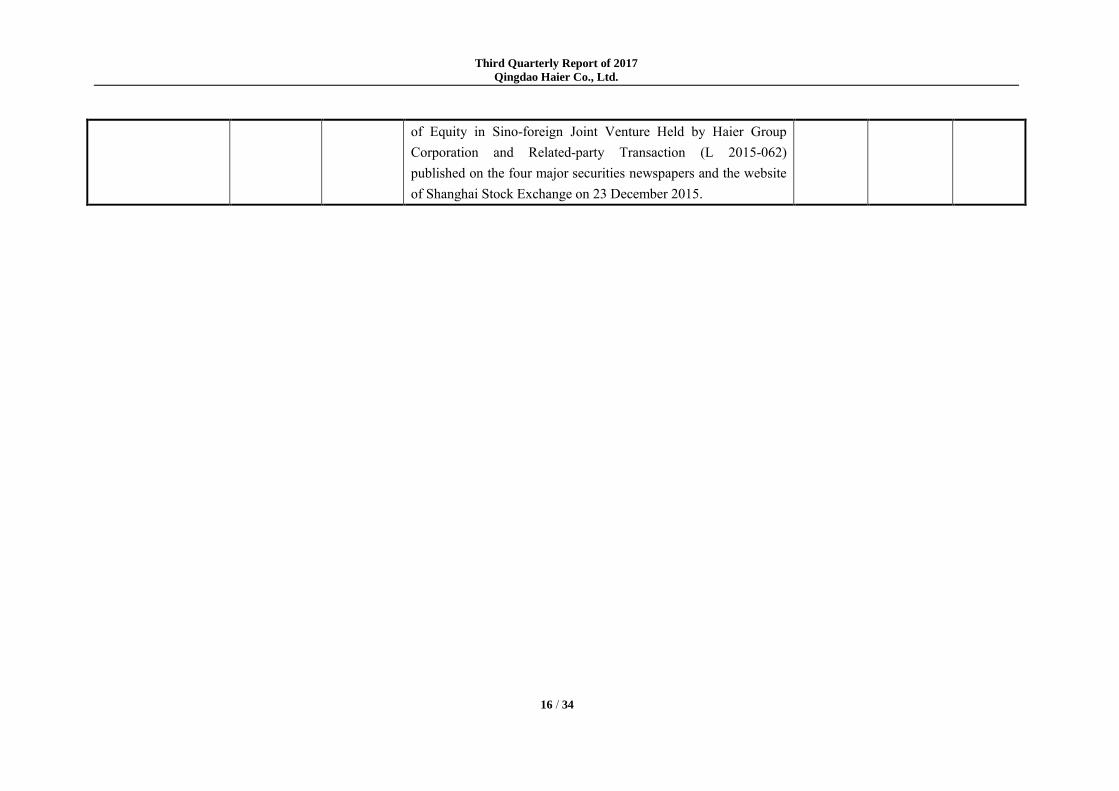
Profit forecast and compensation
Haier Group Corporation
In December 2015 and January 2016, the meeting of the Board of Directors and general meeting of the shareholders considered and approved the matters in relation to the acquisition of minority equity interest of Mitsubishi Heavy Industries Haier and Carrier Refrigeration Equipment held by Haier Group. The Company signed the Profit Compensation Agreement with Haier Group to forecast the profits achieved by the aforementioned two companies in 2015 - 2018. If the profits are not reached during the commitment period, the difference part will be made up to the Company by Haier Group in cash. For more details, please refer to the Announcement of Qingdao Haier Co., Ltd. on the Acquisition
December 2015- December 2018
YES YES
Third Quarterly Report of 2017
Qingdao Haier Co., Ltd.
16 / 34
of Equity in Sino-foreign Joint Venture Held by Haier Group Corporation and Related-party Transaction (L 2015-062) published on the four major securities newspapers and the website of Shanghai Stock Exchange on 23 December 2015.
Third Quarterly Report of 2017
Qingdao Haier Co., Ltd.
17 / 34
3.4 Warning and explanation on reasons for accumulated net profit for the period from the beginning
of the year to the end of the next reporting period to be at a loss or expected to have material
change as compared to those of the same period of last year
� Applicable √Not Applicable
Name of
company
Qingdao Haier Co., Ltd.
Legal
representatives
Liang Haishan
Date 30 October 2017

Third Quarterly Report of 2017
Qingdao Haier Co., Ltd.
18 / 34
IV. Appendix
4.1 Financial Statements
Consolidated Balance Sheet
30 September 2017
Prepared by: Qingdao Haier Co., Ltd.
Unit and Currency: RMB
Unaudited
Items Closing balance Opening balance
Current Assets:
Monetary Capital 32,161,405,575.63 23,582,239,011.20 Clearing settlement funds Placements with banks Financial assets measured at fair value
and changes of which included in current profit and loss
23,099,285.52 80,432,384.17
Derivative financial assets Bills receivables 13,613,608,437.38 13,796,561,238.05 Accounts receivables 14,080,769,417.93 12,265,195,443.40 Prepayments 636,516,972.75 592,510,116.61 Premiums receivable Reinsurance accounts receivables Reinsurance contract reserves receivable Interests receivables 197,782,711.00 135,319,774.41 Dividends receivables 4,524,472.84 101,648,913.10 Other receivables 1,162,772,967.81 1,180,418,052.75 Financial assets purchased under resale
agreements
Inventories 16,662,708,886.43 15,284,904,331.04 Assets classified as held for sale Non-current assets due within one year
Other current assets 3,492,482,010.38 2,657,462,188.89 Total current assets 82,035,670,737.67 69,676,691,453.62

Third Quarterly Report of 2017
Qingdao Haier Co., Ltd.
19 / 34
Non-current assets: Loans and advances granted Available-for-sale financial assets 1,529,297,430.03 1,555,878,717.05 Held-to-maturity investments Long-term receivables Long-term equity investments 12,199,579,035.51 11,057,819,628.14 Investment properties 31,829,109.66 34,600,393.37 Fixed assets 15,467,940,420.30 15,592,013,177.13 Construction in progress 1,938,163,487.98 1,769,875,050.35 Construction materials Disposals of fixed assets 55,839,366.07 55,808,808.81 Biological assets for production Fuel assets Intangible assets 7,005,667,558.19 7,242,818,792.38 Development expenses 964,265,409.64 913,283,796.32 Goodwill 20,118,185,407.90 21,004,123,145.39 Long-term amortization expenditures 80,576,820.58 115,773,592.78 Deferred income tax assets 1,929,302,431.06 1,592,009,404.59 Other non-current assets 1,092,341,805.99 858,461,388.86
Total non-current assets 62,412,988,282.91 61,792,465,895.17 Total assets 144,448,659,020.58 131,469,157,348.79
Current liabilities: Short-term borrowings 12,418,891,006.63 18,165,531,879.15 Borrowings from central bank Absorbing deposit and deposit in inter-bank market
Placements from banks Financial liabilities measured at fair value
and changes of which included in current profit and loss
1,113,469.99 2,340,213.20
Derivative financial liabilities Bills payable 16,103,545,239.34 12,404,889,760.05 Accounts payables 24,883,347,557.94 20,601,681,120.03 Payments received in advance 5,699,883,655.56 5,737,348,712.97 Disposal of repurchased financial assets
Handling charges and commissions payable
Staff remuneration payable 2,034,170,759.85 2,408,525,656.48 Taxes payable 1,821,564,136.55 1,620,588,401.27 Interests payable 199,296,599.98 30,570,328.66 Dividends payable 171,494,413.64 148,690,489.01

Third Quarterly Report of 2017
Qingdao Haier Co., Ltd.
20 / 34
Other payables 11,188,265,516.60 9,459,636,746.05 Reinsurance accounts payable Deposits for insurance contracts Customer deposits for trading in
securities
Amounts due to issuer for securities underwriting
Liabilities classified as held for sale Non-current liabilities due within one year
1,659,225,902.64 2,966,808,509.55
Other current liabilities 12,730,995.55 17,228,645.29 Total current liabilities 76,193,529,254.27 73,563,840,461.71
Non-current liabilities: Long-term borrowings 19,300,470,189.58 15,530,801,311.80 Debentures payable Including: preference Shares
Perpetual bonds Long-term payable 113,567,759.83 115,783,382.28 Long-term payables for staff’s
remuneration 892,334,688.34 1,209,218,564.79
Special payable Estimated liabilities 3,232,008,708.04 2,310,119,430.60 Deferred income 394,639,154.50 342,825,593.35 Deferred income tax liabilities 158,956,064.31 133,243,146.68 Other non-current liabilities 159,823,992.08 582,785,069.86
Total non-current liabilities 24,251,800,556.68 20,224,776,499.36 Total liabilities 100,445,329,810.95 93,788,616,961.07
Owners’ equity Share capital 6,097,402,727.00 6,097,630,727.00 Other equity instruments Including: preference shares
Perpetual bonds Capital reserve 83,462,866.62 106,798,262.17 Less: Treasury stock 1,041,960.00 Other comprehensive income 268,226,696.49 566,987,435.57 Special reserve Surplus reserve 2,065,911,217.00 2,074,118,571.01 General risk provisions Undistributed profits 21,690,034,846.09 17,593,695,190.81 Total equity attributable to owners of the
parent company 30,205,038,353.20 26,438,188,226.56
Minority interests 13,798,290,856.43 11,242,352,161.16

Third Quarterly Report of 2017
Qingdao Haier Co., Ltd.
21 / 34
Total owners’ equity 44,003,329,209.63 37,680,540,387.72 Total liabilities and owners’ equities 144,448,659,020.58 131,469,157,348.79
Legal representative: Liang Haishan Chief accountant: Gong Wei Person in charge of
accounting department: Ying Ke (应珂)
Balance Sheet of the Parent Company
30 September 2017
Prepared by: Qingdao Haier Co., Ltd.
Unit and Currency: RMB
Unaudited
Items Closing balance Opening balance
Current Assets: Monetary Capital 4,563,406,578.43 3,888,623,400.28 Financial assets measured at fair value
and changes of which included in current profit and loss
Derivative financial assets Bills receivables Accounts receivables 211,862,728.36 265,438,220.39 Prepayments 40,174,115.51 10,000,000.00 Interests receivables 186,711,026.24 85,452,583.16 Dividends receivables 200,000.00 329,713,897.32 Other receivables 38,971,830.93 322,953,279.90 Inventories 38,472,023.53 69,799,065.47 Assets classified as held for sale Non-current assets due within one year
Other current assets 165,012,831.51 94,935,174.83 Total current assets 5,244,811,134.51 5,066,915,621.35
Non-current assets: Available-for-sale financial assets 5,978,414.52 5,478,235.84 Held-to-maturity investments Long-term receivables 8,600,000,000.00 8,600,000,000.00 Long-term equity investments 23,068,844,965.51 22,342,078,877.07 Investment properties Fixed assets 122,757,304.80 116,840,195.32 Construction in progress 16,806,600.17 22,611,979.50 Construction materials Disposals of fixed assets

Third Quarterly Report of 2017
Qingdao Haier Co., Ltd.
22 / 34
Biological assets for production Fuel assets Intangible assets 7,953,498.86 8,578,922.84 Development expenses Goodwill Long-term amortization expenditures Deferred income tax assets 62,346,256.82 62,346,256.82 Other non-current assets
Total non-current assets 31,884,687,040.68 31,157,934,467.39 Total assets 37,129,498,175.19 36,224,850,088.74
Current liabilities: Short-term borrowings
Financial liabilities measured at fair value and changes of which included in current profit and loss
Derivative financial liabilities Bills payable Accounts payables 302,548,109.26 1,142,008,704.07 Payments received in advance 633,678,127.81 1,844,082,827.50 Staff remuneration payable 33,607,763.18 39,919,748.55 Taxes payable 12,712,709.52 57,218,867.86 Interests payable 93,254,821.05 117,705,327.18 Dividends payable Other payables 25,394,674,517.86 21,170,550,089.69 Liabilities classified as held for sale Non-current liabilities due within one year
Other current liabilities 10,402,345.83 4,841,867.91 Total current liabilities 26,480,878,394.51 24,376,327,432.76
Non-current liabilities: Long-term borrowings Debentures payable Including: preference shares
Perpetual bonds Long-term payable 20,000,000.00 20,000,000.00 Long-term payables for staff’s
remuneration
Special payable Estimated liabilities Deferred income 27,700,000.00 17,700,000.00 Deferred income tax liabilities 15,644,327.91 15,569,301.11

Third Quarterly Report of 2017
Qingdao Haier Co., Ltd.
23 / 34
Other non-current liabilities Total non-current liabilities 63,344,327.91 53,269,301.11
Total liabilities 26,544,222,722.42 24,429,596,733.87 Owners’ equity:
Share capital 6,097,402,727.00 6,097,630,727.00 Other equity instruments Including: preference shares
Perpetual bonds Capital reserve 2,060,812,960.17 2,061,597,739.78 Less: Treasury stock 1,041,960.00 Other comprehensive income -24,405,467.75 -10,881,603.15 Special reserve Surplus reserve 1,389,846,284.51 1,389,846,284.51 Undistributed profits 1,061,618,948.84 2,258,102,166.73 Total owners’ equity
10,585,275,452.77 11,795,253,354.87
Total liabilities and owners’ equities 37,129,498,175.19 36,224,850,088.74
Legal representative: Liang Haishan Chief accountant: Gong Wei Person in charge of accounting department: Ying Ke (应珂)
Consolidated Income Statement January-September 2017
Prepared by: Qingdao Haier Co., Ltd. Unit and Currency: RMB
Unaudited
Items Current amount
(July-September)
Prior amount
(July-September)
Amount as at the
beginning of the
year to the end of
the reporting
period
(January-Septemb
er)
Amount as at the
beginning of last
year to the end of
the reporting
period
(January-Septem
ber)
I. Total operating revenue
41,613,863,654.10 35,580,735,659.68 119,189,613,634.20 84,367,342,584.55
Including: operating revenue
41,613,863,654.10 35,580,735,659.68 119,189,613,634.20 84,367,342,584.55
Interest income Insurance
premiums earned

Third Quarterly Report of 2017
Qingdao Haier Co., Ltd.
24 / 34
Fee and commission income
II. Total cost of operations
40,468,513,665.59 34,713,999,575.68 113,364,284,425.92 80,118,843,110.38
Including: operating cost
29,397,273,551.20 25,171,204,780.30 83,552,179,384.59 59,846,936,854.72
Interest expenses Fee and commission expenses
Insurance withdrawal payment
Net payment from indemnity
Net provisions for insurance contract
Insurance policy dividend paid
Reinsurance cost Business taxes and surcharge
269,212,903.89 117,023,348.43 614,599,237.19 288,720,266.70
Selling expenses 8,086,931,744.23 6,671,957,919.30 21,024,447,698.61 13,365,034,255.10 Administrative expenses
2,324,987,511.75 2,634,371,111.57 6,948,695,908.26 6,177,453,643.25
Financial expenses 378,794,177.81 144,920,254.93 990,471,459.74 269,989,263.40 Loss in assets
impairment 11,313,776.71 -25,477,838.85 233,890,737.53 170,708,827.21
Add: income from change in fair value (losses are represented by “-”)
114,188,419.25 78,690,919.90 526,252,264.40 -103,567,238.94
Investment income (losses are represented by “-”)
318,580,844.17 308,359,351.21 972,423,558.52 1,337,553,151.05
Including: investment income of associates and joint ventures
Exchange gain (losses are represented by “-”)
Other incomes 191,577,886.70 264,319,732.74 III. Operating profit (losses are represented by “-”)
1,769,697,138.63 1,253,786,355.11 7,588,324,763.94 5,482,485,386.28

Third Quarterly Report of 2017
Qingdao Haier Co., Ltd.
25 / 34
Add: non-operating income
314,205,463.92 129,603,563.04 623,209,532.54 589,928,436.18
Including: gain from disposal of non-current assets
Less: non-operating expenses
39,369,015.51 234,988,996.29 123,948,038.66 291,472,316.41
Including: Loss from disposal of non-current assets
IV. Total profit (total losses are represented by “-”)
2,044,533,587.04 1,148,400,921.86 8,087,586,257.82 5,780,941,506.05
Less: income tax expense
218,094,249.60 202,370,445.05 976,116,407.83 863,068,827.03
V. Net profit (net losses are represented by “-”)
1,826,439,337.44 946,030,476.81 7,111,469,849.99 4,917,872,679.02
Net profit attributable to owners of the Company
1,255,293,313.13 511,810,975.12 5,682,361,717.64 3,826,984,146.82
Profit or loss attributable to minority shareholders
571,146,024.31 434,219,501.69 1,429,108,132.35 1,090,888,532.20
VI. Other comprehensive income, net of tax
-144,121,187.22 318,820,472.39 -345,254,600.46 -57,829,623.37
Other comprehensive income attributable to
owners of the Company, net of tax
-130,145,366.38 316,020,122.26 -298,760,739.08 -70,651,292.41
(I) Other comprehensive income that will not be reclassified subsequently to profit or loss
1. Changes in net liabilities or net assets arising from re-measurement of

Third Quarterly Report of 2017
Qingdao Haier Co., Ltd.
26 / 34
defined benefit plans 2. Share of other comprehensive income of investees that cannot be reclassified to profit or loss under equity method
(II) Other comprehensive income to be reclassified subsequently to profit or loss
-130,145,366.38 316,020,122.26 -298,760,739.08 -70,651,292.41
1. Share of other comprehensive income of investees that will be reclassified subsequently to profit or loss under equity method
40,693,511.60 10,147,015.47 -81,346,664.65 -34,869,817.75
2. Gain or loss from change in fair value of available-for-sale financial assets
2,843,778.27 -1,569,310.30 496,754.29 -449,875,102.32
3. Gain or loss arising from reclassification from held-to-maturity investments to available-for-sale financial assets
4. Effective portion of gain or loss arising from cash flow hedging instruments
4,628,209.01 -1,139,401.61
5. Exchange differences on translation of financial statements denominated in foreign currencies
-178,310,865.26 307,442,417.09 -216,771,427.11 414,093,627.66
6. Other
Third Quarterly Report of 2017
Qingdao Haier Co., Ltd.
27 / 34
Other comprehensive income attributable to
minority shareholders, net of tax
-13,975,820.84 2,800,350.13 -46,493,861.38 12,821,669.04
VII. Total comprehensive income
1,682,318,150.22 1,264,850,949.20 6,766,215,249.53 4,860,043,055.65
Total comprehensive income attributable to the shareholders of parent company
1,125,147,946.75 827,831,097.38 5,383,600,978.56 3,756,332,854.41
Total comprehensive income attributable to the minority shareholders
557,170,203.47 437,019,851.82 1,382,614,270.97 1,103,710,201.24
VIII . Earnings per share:
(I) Basic earnings per share (RMB/share)
0.206 0.084 0.932 0.627
(II) Diluted earnings per share (RMB/share)
0.206 0.084 0.932 0.627
The net profit realized by the acquiree prior to its merger with the Company, which turned the
acquiree into a jointly controlled entity of the Company, was RMB 500,041.82 during the period.
Legal representative: Liang Haishan Chief accountant: Gong Wei Person in charge of
accounting department: Ying Ke (应珂)
Income Statement of the Parent Company
January-September 2017 Prepared by: Qingdao Haier Co., Ltd.
Unit and Currency: RMB Unaudited

Third Quarterly Report of 2017
Qingdao Haier Co., Ltd.
28 / 34
Items
Current
amount
(July-Septemb
er)
Prior amount
(July-Septemb
er)
Amount as at
the beginning of
the year to the
end of
the reporting
period
(January-Septe
mber)
Amount as at
the beginning of
last
year to the end
of the
reporting
period
(January-Septe
mber) I. Operating revenue 885,928,248.69 827,929,968.02 2,429,040,574.34 2,343,801,453.23
Less: Operation cost 599,578,352.66 599,133,201.64 1,724,678,093.73 1,663,108,069.07 Taxes and surcharge 8,873,954.31 2,251,251.96 17,998,106.78 8,696,651.40 Selling expenses 65,814,107.53 30,872,977.31 150,349,127.54 172,551,891.19 Administrative expenses 205,554,320.29 202,054,309.20 497,356,040.18 424,068,353.18 Financial expenses 32,401,366.94 13,315,728.36 77,833,579.73 13,236,150.33 Loss in assets impairment -67,084,496.59 -1,722,245.56 -17,843,951.04 -3,616,902.23
Add: income from change in fair value (losses are represented by “-”)
Investment income (losses are represented by “-”)
108,081,882.92 56,992,467.02 259,975,650.65 200,457,104.98
Including: investment income of associates and joint ventures
Other incomes 17,166,899.75 17,166,899.75 II. Operating profit (losses are represented by “-”)
166,039,426.22 39,017,212.13 255,812,127.82 266,214,345.27
Add: non-operating income 7,140,206.67 5,619,768.40 59,966,161.35 81,560,399.04 Including: gain from
disposal of non-current assets
Less: non-operating expenses 852,535.19 891,618.63 861,948.86 911,949.33 Including: Loss from
disposal of non-current assets
III. Total Profit (losses are represented by “-”)
172,327,097.70 43,745,361.90 314,916,340.31 346,862,794.98
Less: income tax expense 9,633,872.86 -1,987,065.76 -756,318.10 5,807,852.78 IV. Net Profit (net losses are represented by “-”)
162,693,224.84 45,732,427.66 315,672,658.41 341,054,942.20
V. Other comprehensive income, net of tax
79,633.31 6,110,062.02 -13,523,864.60 -14,597,453.12
(I) Other comprehensive income will not be reclassified subsequently to profit or loss

Third Quarterly Report of 2017
Qingdao Haier Co., Ltd.
29 / 34
1. Changes in net liabilities or net assets arising from re-measurement of defined benefit
plans
2. Share of other comprehensive income of investees that cannot be reclassified to profit or loss under equity method
(II) Other comprehensive income to be reclassified subsequently to profit or loss
79,633.31 6,110,062.02 -13,523,864.60 -14,597,453.12
1. Share of other comprehensive income of investees that will be reclassified subsequently to profit or loss under equity method
14,374,168.36 6,169,709.37 425,151.88 915,175.04
2. Gain or loss from change in fair value of available-for-sale financial assets
-14,294,535.05 -59,647.35 -13,949,016.48 -15,512,628.16
3. Gain or loss arising from reclassification from held-to-maturity investments to available-for-sale financial assets
4. Effective portion of gain or loss arising from cash flow hedging instruments
5. Exchange differences on translation of financial statements denominated in foreign currencies
6. Other VI. Total comprehensive income 162,772,858.15 51,842,489.68 302,148,793.81 326,457,489.08 VII. Earnings per share:
(I) Basic earnings per share (RMB/ share)
(II) Diluted earnings per share (RMB/share)
Legal representative: Liang Haishan Chief accountant: Gong Wei Person in charge of
accounting department: Ying Ke (应珂)
Consolidated Cash Flow Statement
January-September 2017
Prepared by: Qingdao Haier Co., Ltd.

Third Quarterly Report of 2017
Qingdao Haier Co., Ltd.
30 / 34
Unit and Currency: RMB
Unaudited
Items
Amount as at the
beginning of
the year to the end of
the reporting period
(January-September)
Amount as at the
beginning of last
year to the end of the
reporting period
(January-September) I. Cash flows from operating activities:
Cash received from the sale of goods and rendering of services
139,498,787,397.46 90,110,978,075.44
Net increase in customer and interbank deposits
Net increase in borrowing from PBOC Net cash increase in borrowing from other financial institutes
Cash received from premiums under original insurance contract
Net cash received from reinsurance business
Net increase in deposits of policy holders and investment
Net increase from the disposal of financial assets measured at fair value and changes of which included in current
profit and loss
Cash paid for interest, bank charges and commissions
Net increase in cash borrowed Net increase in cash received from repurchase operation
Refunds of taxes 933,453,763.81 499,360,330.52 Cash received from other related operating activities
641,640,968.26 671,981,686.17
Sub-total of cash inflows from operating activities
141,073,882,129.53 91,282,320,092.13
Cash paid on purchase of goods and services
99,997,320,327.27 64,518,763,975.56
Net increase in loans and advances Net increase in deposits in PBOC and interbank
Cash paid for compensation payments under original insurance contract
Third Quarterly Report of 2017
Qingdao Haier Co., Ltd.
31 / 34
Cash paid for interest, bank charges and commissions
Cash paid for insurance policy dividend Cash paid to and on behalf of employees 11,219,814,215.75 7,808,375,565.15 Cash paid for all types of taxes 5,736,748,757.22 5,149,863,599.32 Cash paid to other operation related activities
9,959,945,830.35 8,859,372,397.16
Sub-total of cash outflows from operating activities
126,913,829,130.59 86,336,375,537.19
Net cash flows from operating activities
14,160,052,998.94 4,945,944,554.94
II. Cash flows from investing activities: Cash received from disposal of investments
52,073,162.58 580,469,201.21
Cash received from return on investments
240,271,551.96 132,888,904.12
Net cash received from the disposal of fixed assets, intangible assets and other
long term assets 44,493,426.47 26,085,548.94
Net cash received from disposal of subsidiaries and other operating entities
155,037,270.54
Cash received from other investment related activities
3,693,847.50
Sub-total of cash inflows from investing activities
491,875,411.55 743,137,501.77
Cash paid on purchase of fixed assets, intangible assets and other long term
assets 2,614,123,880.97 2,050,472,227.16
Cash paid for investments 2,597,591,667.47 1,201,539,611.53 Net increase in secured loans Net cash paid on acquisition of subsidiaries and other operating entities
88,429,231.46 36,398,588,501.66
Cash paid on other investment related activities
3,861,165.47
Sub-total of cash outflows from investing activities
5,300,144,779.90 39,654,461,505.82
Net cash flows from investing activities
-4,808,269,368.35 -38,911,324,004.05
III. Cash flows from financing activities: Cash received from investment 1,347,292,085.10 10,839,764.43 Including: cash received by subsidiaries from minority shareholders’ investment

Third Quarterly Report of 2017
Qingdao Haier Co., Ltd.
32 / 34
Cash received from borrowings 16,802,698,248.06 37,147,302,314.09 Cash received from issuing bonds Cash received from other financing related activities
1,731,609.42
Sub-total of cash inflows from financing activities
18,151,721,942.58 37,158,142,078.52
Cash paid on repayment of borrowings 16,985,670,538.25 6,080,035,623.81 Cash paid on distribution of dividends, profits, or interest expenses
2,010,741,534.99 1,767,259,255.68
Including: dividend, profit paid to minority shareholders by subsidiaries
Cash paid on other financing activities 47,799,254.84 168,740,536.91 Sub-total of cash outflows from financing activities
19,044,211,328.08 8,016,035,416.40
Net cash flows from financing activities
-892,489,385.50 29,142,106,662.12
IV. Effect of fluctuations in exchange
rates on cash and cash equivalents -184,484,131.52 -56,520,198.96
V. Net increase in cash and cash
equivalents 8,274,810,113.57 -4,879,792,985.95
Add: balance of cash and cash equivalents at the beginning of the period
23,510,900,890.49 24,725,880,770.59
VI. Balance of cash and cash equivalents
at the end of the period 31,785,711,004.06 19,846,087,784.64
Legal representative: Liang Haishan Chief accountant: Gong Wei Person in charge of
accounting department: Ying Ke (应珂)
Cash Flow Statement of the Parent Company
January-September 2017
Prepared by: Qingdao Haier Co., Ltd.
Unit and Currency: RMB
Unaudited
Items
Amount as at the
beginning of
the year to the end of
the reporting period
(January-September)
Amount as at the
beginning of last
year to the end of the
reporting period
(January-September) I. Cash flows from operating activities:
Cash received from the sale of goods and rendering of services
427,739,667.35 314,712,571.18
Refunds of taxes 55,711,962.27 12,451,222.14

Third Quarterly Report of 2017
Qingdao Haier Co., Ltd.
33 / 34
Cash received from other related operating activities
54,115,058.79 46,880,078.85
Sub-total of cash inflows from operating activities
537,566,688.41 374,043,872.17
Cash paid on purchase of goods and services
1,452,092,842.51 431,718,199.28
Cash paid to and on behalf of employees 564,703,136.34 241,922,703.85 Cash paid for all types of taxes 137,011,406.78 116,783,336.85 Cash paid to other operation related activities
321,211,786.90 422,365,565.20
Sub-total of cash outflows from operating activities
2,475,019,172.53 1,212,789,805.18
Net cash flows from operating activities
-1,937,452,484.12 -838,745,933.01
II. Cash flows from investing activities: Cash received from disposal of investments
Cash received from return on investments
429,548,610.50 249,905,293.86
Net cash received from the disposal of fixed assets, intangible assets and other long term assets
Net cash received from disposal of subsidiaries and other operating entities
Cash received from other investment related activities
Sub-total of cash inflows from investing activities
429,548,610.50 249,905,293.86
Cash paid on purchase of fixed assets, intangible assets and other long term
assets 28,348,785.40 8,959,725.03
Cash paid for investments 793,311,762.50 15,748,337,507.50 Net cash paid on acquisition of subsidiaries and other operating entities
Cash paid on other investment related activities
Sub-total of cash outflows from investing activities
821,660,547.90 15,757,297,232.53
Net cash flows from investing activities
-392,111,937.40 -15,507,391,938.67
III. Cash flows from financing activities: Cash received from investment Cash received from borrowings

Third Quarterly Report of 2017
Qingdao Haier Co., Ltd.
34 / 34
Cash received from issuing bonds Cash received from other financing related activities
4,517,547,537.12 20,809,717,585.98
Sub-total of cash inflows from financing activities
4,517,547,537.12 20,809,717,585.98
Cash paid on repayment of borrowings Cash paid on distribution of dividends, profits, or interest expenses
1,512,155,876.29 1,279,850,811.18
Cash paid on other financing activities 1,041,960.00 139,903,557.84 Sub-total of cash outflows from financing activities
1,513,197,836.29 1,419,754,369.02
Net cash flows from financing activities
3,004,349,700.83 19,389,963,216.96
IV. Effect of fluctuations in exchange
rates on cash and cash equivalents -2,101.16
V. Net increase in cash and cash
equivalents 674,783,178.15 3,043,825,345.28
Add: balance of cash and cash equivalents at the beginning of the period
3,888,623,400.28 562,827,007.96
VI. Balance of cash and cash equivalents
at the end of the period 4,563,406,578.43 3,606,652,353.24
Legal representative: Liang Haishan Chief accountant: Gong Wei Person in charge of
accounting department: Ying Ke (应珂)
4.2 Audit Report □Applicable √Not Applicable