Embed Size (px)
Citation preview
Third quarter results for the period ended June 2019
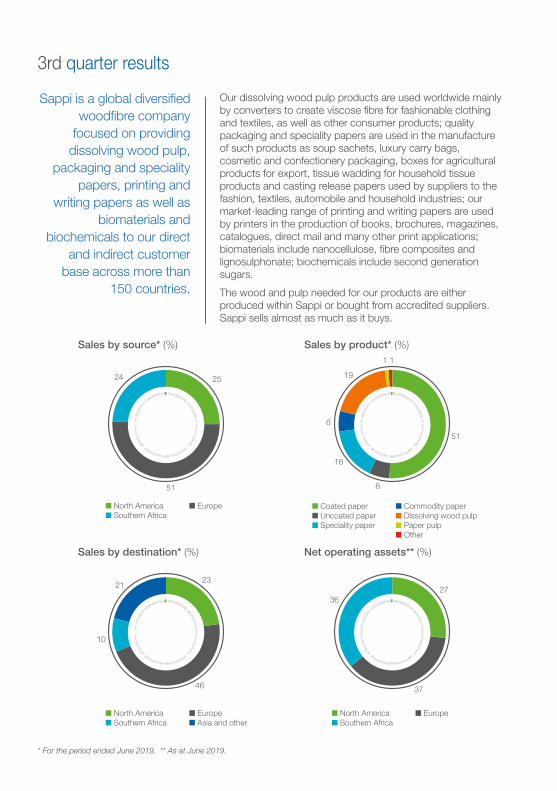
* For the period ended June 2019. ** As at June 2019.
3rd quarter results
Sappi is a global diversified woodfibre company
focused on providing dissolving wood pulp,
packaging and speciality papers, printing and
writing papers as well as biomaterials and
biochemicals to our direct and indirect customer
base across more than 150 countries.
Our dissolving wood pulp products are used worldwide mainly by converters to create viscose fibre for fashionable clothing and textiles, as well as other consumer products; quality packaging and speciality papers are used in the manufacture of such products as soup sachets, luxury carry bags, cosmetic and confectionery packaging, boxes for agricultural products for export, tissue wadding for household tissue products and casting release papers used by suppliers to the fashion, textiles, automobile and household industries; our market-leading range of printing and writing papers are used by printers in the production of books, brochures, magazines, catalogues, direct mail and many other print applications; biomaterials include nanocellulose, fibre composites and lignosulphonate; biochemicals include second generation sugars.
The wood and pulp needed for our products are either produced within Sappi or bought from accredited suppliers. Sappi sells almost as much as it buys.
51
24 25
■ North America■ Southern Africa
■ Europe
Sales by source* (%)
23
10
21
46
■ North America■ Southern Africa
■ Europe■ Asia and other
Sales by destination* (%)
19
11
6
16
6
51
■ Coated paper■ Uncoated paper■ Speciality paper
■ Commodity paper■ Dissolving wood pulp■ Paper pulp■ Other
Sales by product* (%)
37
3627
■ North America■ Southern Africa
■ Europe
Net operating assets** (%)
1
sappi 3rd quarter results
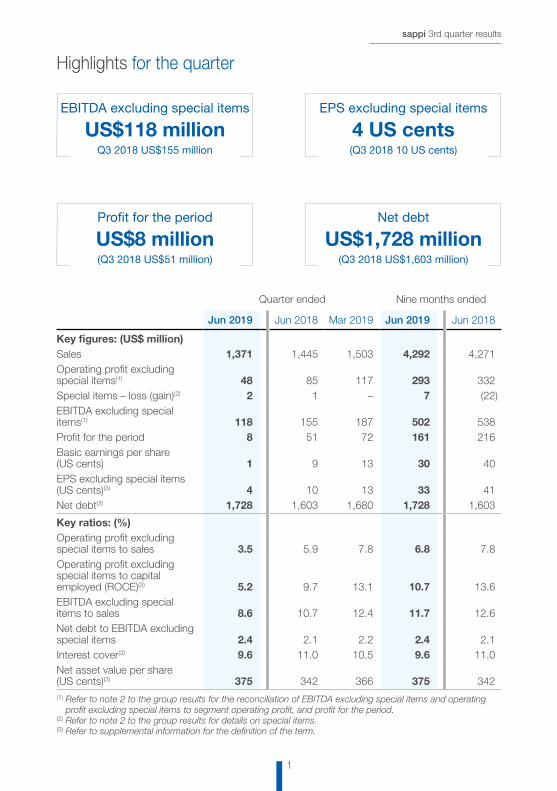
Highlights for the quarter
Quarter ended Nine months ended
Jun 2019 Jun 2018 Mar 2019 Jun 2019 Jun 2018
Key figures: (US$ million)Sales 1,371 1,445 1,503 4,292 4,271 Operating profit excluding special items(1) 48 85 117 293 332 Special items – loss (gain)(2) 2 1 – 7 (22)EBITDA excluding special items(1) 118 155 187 502 538 Profit for the period 8 51 72 161 216 Basic earnings per share (US cents) 1 9 13 30 40 EPS excluding special items (US cents)(3) 4 10 13 33 41 Net debt(3) 1,728 1,603 1,680 1,728 1,603
Key ratios: (%)Operating profit excluding special items to sales 3.5 5.9 7.8 6.8 7.8 Operating profit excluding special items to capital employed (ROCE)(3) 5.2 9.7 13.1 10.7 13.6 EBITDA excluding special items to sales 8.6 10.7 12.4 11.7 12.6 Net debt to EBITDA excluding special items 2.4 2.1 2.2 2.4 2.1 Interest cover(3) 9.6 11.0 10.5 9.6 11.0 Net asset value per share (US cents)(3) 375 342 366 375 342 (1) Refer to note 2 to the group results for the reconciliation of EBITDA excluding special items and operating
profit excluding special items to segment operating profit, and profit for the period.(2) Refer to note 2 to the group results for details on special items.(3) Refer to supplemental information for the definition of the term.
EBITDA excluding special items
US$118 million Q3 2018 US$155 million
Profit for the period
US$8 million (Q3 2018 US$51 million)
EPS excluding special items
4 US cents (Q3 2018 10 US cents)
Net debt
US$1,728 million (Q3 2018 US$1,603 million)
sappi 3rd quarter results
2
Market conditions across Sappi’s major product categories were challenging during the quarter. The principal factors affecting results were sluggish graphic paper demand, resulting in 89,000 tons of production downtime scheduled across our European and North American paper operations and dissolving wood pulp (DWP) prices that weakened significantly due to soft viscose staple fibre (VSF) markets. Due to the seasonality of the business we also scheduled much of our maintenance activity during this period, including annual shuts at Ngodwana, Saiccor and Cloquet Mills.
The company continued to take action to diversify its product portfolio into higher margin segments and position the company for future growth. The recent projects to increase capacity at each of the DWP mills and convert capacity at Somerset and Maastricht towards packaging boosted sales volumes in each of these segments during the quarter, thereby lessening the impact of particularly weak graphic paper markets.
The group generated EBITDA excluding special items of US$118 million, 24% below that of last year. Profit for the period decreased from US$51 million to US$8 million due to the lower operating profit and a US$9 million once-off finance costs charge to the income statement for the refinancing of the 2022 bonds.
VSF markets were under significant pressure due to excess capacity and weak textile exports from China. The margins for VSF producers were squeezed which also impacted DWP demand. The situation was exacerbated by the low paper pulp prices, which removed any incentive for swing producers to move away from DWP. Consequently, prices for DWP followed VSF downwards and dropped to US$786/ton by quarter end, the lowest level in a decade. The weaker Rand/US Dollar exchange rate and the quarter lag in contracted pricing benefited the South African business somewhat.
Packaging and speciality markets were mixed across our regions, with demand for packaging offsetting weakness in the consumer speciality grades. A late start to
the citrus season in South Africa also lowered volumes. The ramp-up of commercial volumes from both Somerset and Maastricht proceeded according to plan, however, profitability remains constrained in both cases by the product qualification process as well as lower average pricing during this period.
Higher average net selling prices and purchased pulp prices that declined throughout the quarter partially offset the impact of weak graphic paper sales into the publishing sector in Europe. The conversion of Lanaken PM8 from coated mechanical to coated woodfree was completed during the quarter, with some impact on fixed costs and production volumes.
The North American business remained under pressure, with weak graphic paper markets, lower dissolving wood pulp prices, the annual maintenance shut at Cloquet and the continued ramp-up of Somerset PM1 all weighing on margins.
Earnings per share excluding special items was 4 US cents, a decrease from the 10 US cents generated in the equivalent quarter last year. Special items and once-off finance costs reduced earnings by US$14 million.
Cash flow and debtNet cash utilised was US$17 million, compared to the US$41 million utilised in the equivalent quarter last year, as a result of lower capital expenditure and a reduction in cash finance costs.
Cash taxes for the quarter were US$5 million, a slight decrease on that of the prior year. Once-off cash costs of US$4 million related to the refinancing of the 2022 bonds were also incurred in the quarter.
Net debt increased by US$48 million from the prior quarter to US$1,728 million as a result of the cash utilised in the quarter and the weaker Euro/Dollar exchange rate which increased the US Dollar translation of Euro denominated debt.
Liquidity comprised cash on hand of US$226 million and US$668 million available from the group’s undrawn committed revolving credit facilities.
Commentary on the quarter
3
sappi 3rd quarter results
Operating review for the quarter
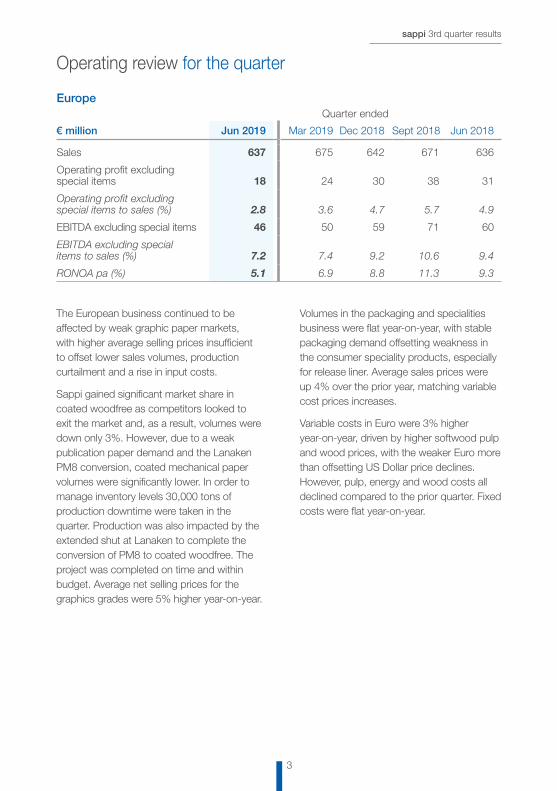
The European business continued to be affected by weak graphic paper markets, with higher average selling prices insufficient to offset lower sales volumes, production curtailment and a rise in input costs.
Sappi gained significant market share in coated woodfree as competitors looked to exit the market and, as a result, volumes were down only 3%. However, due to a weak publication paper demand and the Lanaken PM8 conversion, coated mechanical paper volumes were significantly lower. In order to manage inventory levels 30,000 tons of production downtime were taken in the quarter. Production was also impacted by the extended shut at Lanaken to complete the conversion of PM8 to coated woodfree. The project was completed on time and within budget. Average net selling prices for the graphics grades were 5% higher year-on-year.
Volumes in the packaging and specialities business were flat year-on-year, with stable packaging demand offsetting weakness in the consumer speciality products, especially for release liner. Average sales prices were up 4% over the prior year, matching variable cost prices increases.
Variable costs in Euro were 3% higher year-on-year, driven by higher softwood pulp and wood prices, with the weaker Euro more than offsetting US Dollar price declines. However, pulp, energy and wood costs all declined compared to the prior quarter. Fixed costs were flat year-on-year.
EuropeQuarter ended
€ million Jun 2019 Mar 2019 Dec 2018 Sept 2018 Jun 2018
Sales 637 675 642 671 636
Operating profit excluding special items 18 24 30 38 31
Operating profit excluding special items to sales (%) 2.8 3.6 4.7 5.7 4.9
EBITDA excluding special items 46 50 59 71 60
EBITDA excluding special items to sales (%) 7.2 7.4 9.2 10.6 9.4
RONOA pa (%) 5.1 6.9 8.8 11.3 9.3
sappi 3rd quarter results
4
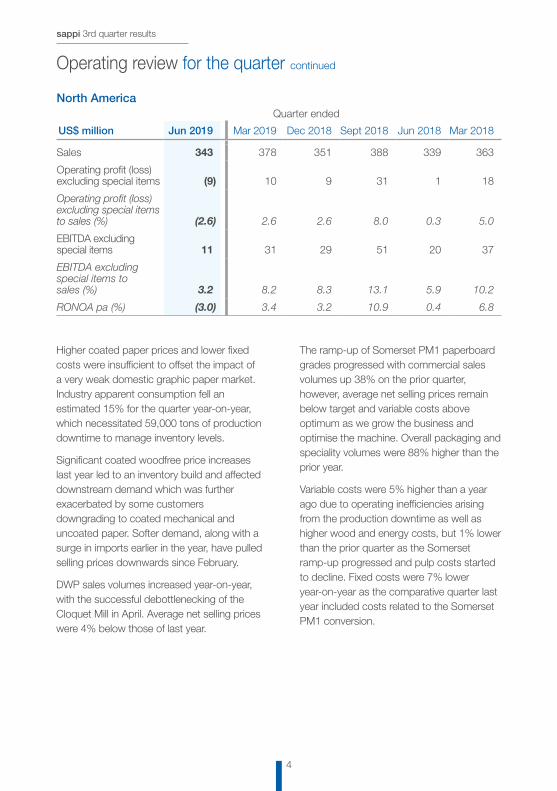
Higher coated paper prices and lower fixed costs were insufficient to offset the impact of a very weak domestic graphic paper market. Industry apparent consumption fell an estimated 15% for the quarter year-on-year, which necessitated 59,000 tons of production downtime to manage inventory levels.
Significant coated woodfree price increases last year led to an inventory build and affected downstream demand which was further exacerbated by some customers downgrading to coated mechanical and uncoated paper. Softer demand, along with a surge in imports earlier in the year, have pulled selling prices downwards since February.
DWP sales volumes increased year-on-year, with the successful debottlenecking of the Cloquet Mill in April. Average net selling prices were 4% below those of last year.
The ramp-up of Somerset PM1 paperboard grades progressed with commercial sales volumes up 38% on the prior quarter, however, average net selling prices remain below target and variable costs above optimum as we grow the business and optimise the machine. Overall packaging and speciality volumes were 88% higher than the prior year.
Variable costs were 5% higher than a year ago due to operating inefficiencies arising from the production downtime as well as higher wood and energy costs, but 1% lower than the prior quarter as the Somerset ramp-up progressed and pulp costs started to decline. Fixed costs were 7% lower year-on-year as the comparative quarter last year included costs related to the Somerset PM1 conversion.
North AmericaQuarter ended
US$ million Jun 2019 Mar 2019 Dec 2018 Sept 2018 Jun 2018 Mar 2018
Sales 343 378 351 388 339 363
Operating profit (loss) excluding special items (9) 10 9 31 1 18
Operating profit (loss) excluding special items to sales (%) (2.6) 2.6 2.6 8.0 0.3 5.0
EBITDA excluding special items 11 31 29 51 20 37
EBITDA excluding special items to sales (%) 3.2 8.2 8.3 13.1 5.9 10.2
RONOA pa (%) (3.0) 3.4 3.2 10.9 0.4 6.8
Operating review for the quarter continued
5
sappi 3rd quarter results
The Southern African results were impacted by lower average US Dollar pricing for DWP and a delayed start to the citrus season which impacted containerboard sales volumes. A weaker Rand/US Dollar exchange rate only partially offset these factors.
US Dollar DWP sales prices declined as continued pressure from excess VSF capacity impacted textile fibre prices and VSF producers lowered their demand for DWP. Sales volumes were marginally up year-on-year, but some 20% below those of the prior quarter as scheduled maintenance shuts were completed at both Saiccor and Ngodwana Mills during the quarter.
Packaging sales volumes were below those of the prior year due to the timing differences on citrus exports, while local sales prices increased to match variable cost rises. Newsprint sales volumes were negatively impacted by low stock volumes post the annual maintenance shut.
Fixed costs rose in line with inflation, while variable costs were 14% higher as a result of a higher proportion of DWP production and by increases in energy and wood costs.
Southern AfricaQuarter ended
ZAR million Jun 2019 Mar 2019 Dec 2018 Sept 2018 Jun 2018
Sales 4,720 5,234 4,981 5,103 4,383
Operating profit excluding special items 496 1,121 1,217 1,081 553
Operating profit excluding special items to sales (%) 10.5 21.4 24.4 21.2 12.6
EBITDA excluding special items 754 1,374 1,446 1,344 742
EBITDA excluding special items to sales (%) 16.0 26.3 29.0 26.3 16.9
RONOA pa (%) 9.0 21.1 24.0 22.4 11.9
sappi 3rd quarter results
6
On 13 May 2019 the board announced the appointment of Ms Janice E Stipp as independent non-executive director with effect from 1 June 2019.
Post balance sheet event
On 31 July 2019, Sappi signed an agreement to acquire, subject to conditions precedent including the prerequisite approvals of certain anti-trust authorities, the 270,000 ton Matane high yield hardwood pulp mill, in Quebec, Canada, from Rayonier Advanced Materials Inc for US$175 million. The acquisition will increase Sappi’s pulp integration for both its North American and European packaging businesses and lower Sappi’s costs of pulp, reduce its volatility of earnings throughout the pulp cycle and provide certainty of supply. The acquisition will be financed from internal resources and is expected to be concluded in the fourth calendar quarter of 2019. A separate JSE SENS announcement will be made in this regard.
Outlook
DWP pricing is expected to continue to be under pressure while VSF producers are impacted by low margins, paper pulp prices remain low and uncertainty exists in textile markets as a result of the US/China trade tensions. Our DWP sales volumes are expected to stay healthy and the expanded production capacity at Saiccor, Ngodwana and Cloquet will be utilised to meet customer demand.
Packaging and speciality markets show good growth prospects, however, growth has slowed in some segments due to general economic conditions. Raw material prices, particularly paper pulp, are declining and offer some relief for margins. Demand for South African packaging products is expected to be strong going into the local spring. The ramp-up and product mix
optimisation process continues at Somerset and Maastricht as qualification and customer acceptance is completed. As mentioned above, the acquisition of Matane Mill will increase the pulp integration for our North American and European packaging businesses, and lower costs going forward.
Persistent weakness in graphic paper markets will require further production downtime in the coming quarter. Sufficient capacity is expected to be shut or converted within the industry, thereby allowing operating rates and margins to recover in future periods. Lower paper pulp prices are offering some relief, however, paper prices in both US and Europe have declined due to current market conditions.
Capital expenditure for the remainder of the year is expected to be approximately US$200 million as we continue the transition to growing and higher margin segments. Major projects currently underway include the 110,000 ton expansion at Saiccor Mill and the final commissioning of Lanaken PM8 after the conversion from coated mechanical to coated woodfree paper. No other major projects are currently committed and therefore we expect annual capex levels to reduce over the next two years.
Given the current weak market conditions for graphic paper, DWP pricing pressure from oversupplied VSF markets and global economic uncertainty related to trade wars, our fourth quarter profitability will likely be below that of the prior year.
On behalf of the board
S R BinnieDirector
G T PearceDirector
1 August 2019
Directorate
7
sappi 3rd quarter results
Certain statements in this release that are neither reported financial results nor other historical information, are forward-looking statements, including but not limited to statements that are predictions of or indicate future earnings, savings, synergies, events, trends, plans or objectives. The words “believe”, “anticipate”, “expect”, “intend”, “estimate”, “plan”, “assume”, “positioned”, “will”, “may”, “should”, “risk” and other similar expressions, which are predictions of or indicate future events and future trends and which do not relate to historical matters, and may be used to identify forward-looking statements. You should not rely on forward-looking statements because they involve known and unknown risks, uncertainties and other factors which are in some cases beyond our control and may cause our actual results, performance or achievements to differ materially from anticipated future results, performance or achievements expressed or implied by such forward-looking statements (and from past results, performance or achievements). Certain factors that may cause such differences include but are not limited to:• the highly cyclical nature of the pulp and
paper industry (and the factors that contribute to such cyclicality, such as levels of demand, production capacity, production, input costs including raw material, energy and employee costs, and pricing);
• the impact on our business of a global economic downturn;
• unanticipated production disruptions (including as a result of planned or unexpected power outages);
• changes in environmental, tax and other laws and regulations;
• adverse changes in the markets for our products;
• the emergence of new technologies and changes in consumer trends including increased preferences for digital media;
• consequences of our leverage, including as a result of adverse changes in credit markets that affect our ability to raise capital when needed;
• adverse changes in the political situation and economy in the countries in which we operate or the effect of governmental efforts to address present or future economic or social problems;
• the impact of restructurings, investments, acquisitions, dispositions and other strategic initiatives (including related financing), any delays, unexpected costs or other problems experienced in connection with dispositions or with integrating acquisitions or implementing restructuring and other strategic initiatives and achieving expected savings and synergies; and
• currency fluctuations.
We undertake no obligation to publicly update or revise any of these forward-looking statements, whether to reflect new information or future events or circumstances or otherwise.
Forward-looking statements
sappi 3rd quarter results
8
Quarter ended Nine months ended
US$ million Note Jun 2019 Jun 2018 Jun 2019 Jun 2018
Sales 1,371 1,445 4,292 4,271 Cost of sales 1,236 1,270 3,722 3,635
Gross profit 135 175 570 636 Selling, general and administrative expenses 86 93 273 293 Other operating expenses 4 (2) 14 (8)Share of profit from equity investments (1) – (3) (3)
Operating profit 3 46 84 286 354 Net finance costs 28 18 65 54
Net interest expense 30 19 70 58 Interest capitalised – (1) – (2)Net foreign exchange gain (2) – (5) (2)
Profit before taxation 18 66 221 300 Taxation(1) 10 15 60 84
Profit for the period 8 51 161 216
Basic earnings per share (US cents) 4 1 9 30 40 Weighted average number of shares in issue (millions) 542.7 538.9 541.7 537.8 Diluted earnings per share (US cents) 4 1 9 29 39 Weighted average number of shares on fully diluted basis (millions) 546.4 550.0 547.9 549.5
(1) For the nine months ended June 2018, there were tax rate changes in various countries resulting in a US$17 million taxation charge recorded through the income statement and US$19 million through other comprehensive income.
Condensed group income statement
9
sappi 3rd quarter results
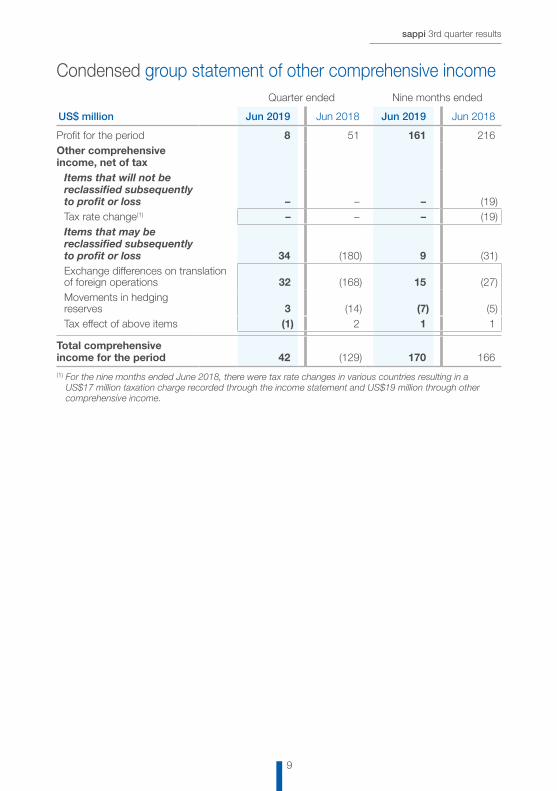
Condensed group statement of other comprehensive incomeQuarter ended Nine months ended
US$ million Jun 2019 Jun 2018 Jun 2019 Jun 2018
Profit for the period 8 51 161 216 Other comprehensive income, net of tax
Items that will not be reclassified subsequently to profit or loss – – – (19)Tax rate change(1) – – – (19)Items that may be reclassified subsequently to profit or loss 34 (180) 9 (31)Exchange differences on translation of foreign operations 32 (168) 15 (27)Movements in hedging reserves 3 (14) (7) (5)Tax effect of above items (1) 2 1 1
Total comprehensive income for the period 42 (129) 170 166
(1) For the nine months ended June 2018, there were tax rate changes in various countries resulting in a US$17 million taxation charge recorded through the income statement and US$19 million through other comprehensive income.
sappi 3rd quarter results
10
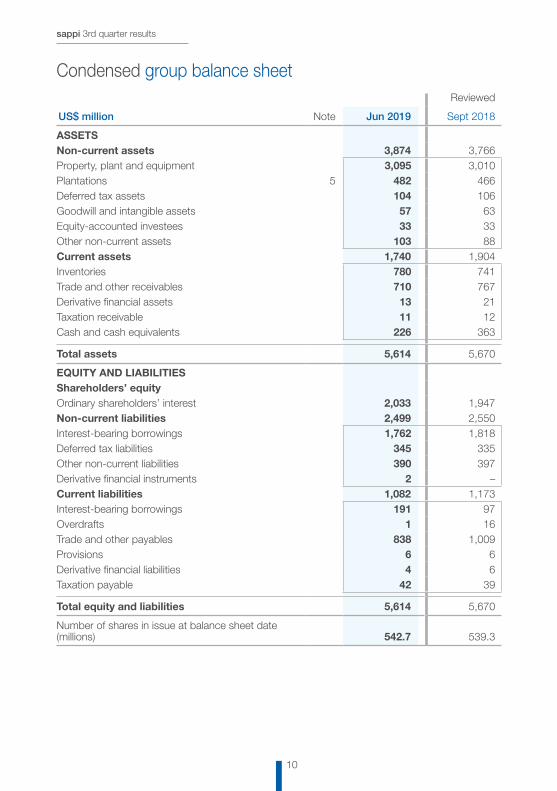
Condensed group balance sheetReviewed
US$ million Note Jun 2019 Sept 2018
ASSETSNon-current assets 3,874 3,766 Property, plant and equipment 3,095 3,010 Plantations 5 482 466 Deferred tax assets 104 106 Goodwill and intangible assets 57 63 Equity-accounted investees 33 33 Other non-current assets 103 88 Current assets 1,740 1,904 Inventories 780 741 Trade and other receivables 710 767 Derivative financial assets 13 21 Taxation receivable 11 12 Cash and cash equivalents 226 363
Total assets 5,614 5,670
EQUITY AND LIABILITIESShareholders’ equityOrdinary shareholders’ interest 2,033 1,947 Non-current liabilities 2,499 2,550 Interest-bearing borrowings 1,762 1,818 Deferred tax liabilities 345 335 Other non-current liabilities 390 397 Derivative financial instruments 2 –Current liabilities 1,082 1,173 Interest-bearing borrowings 191 97 Overdrafts 1 16 Trade and other payables 838 1,009 Provisions 6 6 Derivative financial liabilities 4 6 Taxation payable 42 39
Total equity and liabilities 5,614 5,670
Number of shares in issue at balance sheet date (millions) 542.7 539.3
11
sappi 3rd quarter results
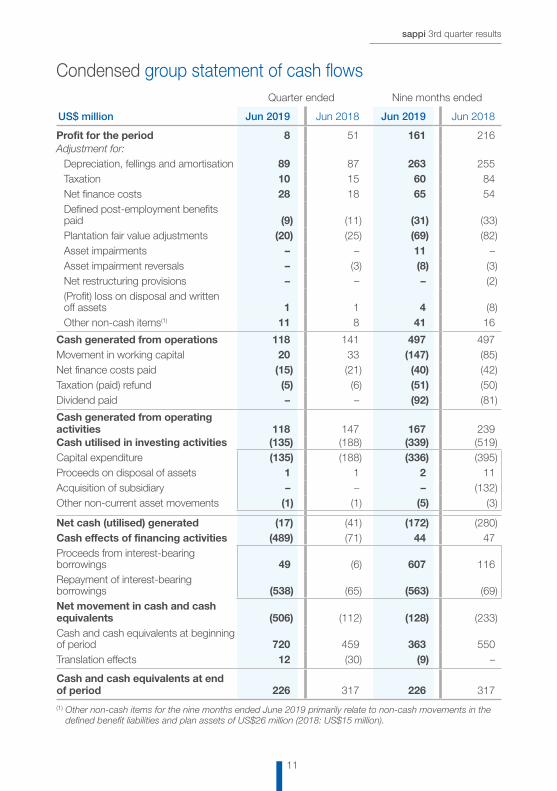
Condensed group statement of cash flowsQuarter ended Nine months ended
US$ million Jun 2019 Jun 2018 Jun 2019 Jun 2018
Profit for the period 8 51 161 216 Adjustment for:
Depreciation, fellings and amortisation 89 87 263 255 Taxation 10 15 60 84 Net finance costs 28 18 65 54 Defined post-employment benefits paid (9) (11) (31) (33)Plantation fair value adjustments (20) (25) (69) (82)Asset impairments – – 11 –Asset impairment reversals – (3) (8) (3)Net restructuring provisions – – – (2)(Profit) loss on disposal and written off assets 1 1 4 (8)Other non-cash items(1) 11 8 41 16
Cash generated from operations 118 141 497 497 Movement in working capital 20 33 (147) (85)Net finance costs paid (15) (21) (40) (42)Taxation (paid) refund (5) (6) (51) (50)Dividend paid – – (92) (81)
Cash generated from operating activities 118 147 167 239 Cash utilised in investing activities (135) (188) (339) (519)Capital expenditure (135) (188) (336) (395)Proceeds on disposal of assets 1 1 2 11 Acquisition of subsidiary – – – (132)Other non-current asset movements (1) (1) (5) (3)
Net cash (utilised) generated (17) (41) (172) (280)Cash effects of financing activities (489) (71) 44 47 Proceeds from interest-bearing borrowings 49 (6) 607 116 Repayment of interest-bearing borrowings (538) (65) (563) (69)Net movement in cash and cash equivalents (506) (112) (128) (233)Cash and cash equivalents at beginning of period 720 459 363 550 Translation effects 12 (30) (9) –
Cash and cash equivalents at end of period 226 317 226 317
(1) Other non-cash items for the nine months ended June 2019 primarily relate to non-cash movements in the defined benefit liabilities and plan assets of US$26 million (2018: US$15 million).
sappi 3rd quarter results
12
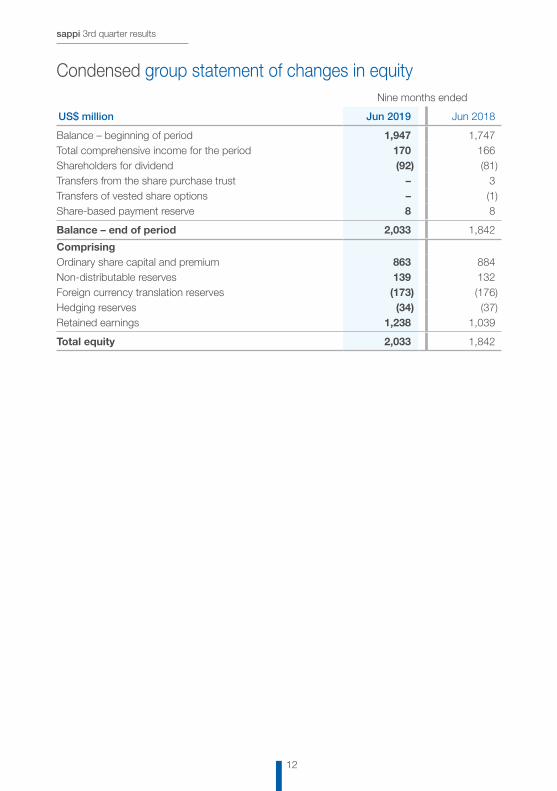
Condensed group statement of changes in equityNine months ended
US$ million Jun 2019 Jun 2018
Balance – beginning of period 1,947 1,747 Total comprehensive income for the period 170 166 Shareholders for dividend (92) (81)Transfers from the share purchase trust – 3 Transfers of vested share options – (1)Share-based payment reserve 8 8
Balance – end of period 2,033 1,842
ComprisingOrdinary share capital and premium 863 884 Non-distributable reserves 139 132 Foreign currency translation reserves (173) (176)Hedging reserves (34) (37)Retained earnings 1,238 1,039
Total equity 2,033 1,842
13
sappi 3rd quarter results
Notes to the condensed group results1. Basis of preparation
The condensed consolidated interim financial statements for the quarter and nine months ended June 2019 are prepared in accordance with the International Financial Reporting Standards, IAS 34 Interim Financial Reporting, the SAICA Financial Reporting Guides as issued by the Accounting Practices Committee and Financial Pronouncements as issued by Financial Reporting Standards Council and the requirements of the Companies Act of South Africa. The accounting policies applied in the preparation of these interim financial statements are in terms of International Financial Reporting Standards as issued by the IASB and are consistent with those applied in the previous annual financial statements except those new standards adopted and set out below under “Adoption of accounting standards in the current year”.The preparation of these condensed consolidated interim financial statements was supervised by the Chief Financial Officer, G T Pearce, CA(SA) and were authorised for issue on 1 August 2019.The results are unaudited.Adoption of accounting standards in the current yearThe group has adopted the following standards and amendments to standards during the current year, all of which had no material impact on the groups reported results or financial position:IFRS 9 Financial InstrumentsIFRS 9 set out a new classification and measurement approach for financial assets that reflects the business model in which the assets are managed and their cash flow characteristics. The three principal classification categories for financial assets are: measured at amortised cost, fair value through profit or loss and fair value through other comprehensive income. The new classification did not have a significant impact compared to the previous accounting for financial assets under IAS 39. IFRS 9 replaced the ‘incurred loss’ model in IAS 39 with a forward-looking ‘expected credit loss’ (ECL) model. The group applied the practical expedient in IFRS 9 to calculate the ECL on trade receivables using a provision matrix. The application of the ECL model did not result in a material impact compared to the previous accounting under IAS 39. With respect to hedging, a new non-distributable equity reserve was created called cost of hedging reserve. This reserve is used to separate all time value of money and forward point valuations on hedged instruments, as required per IFRS 9. This resulted in an increase to retained earnings and a decrease to this ‘cost of hedging reserve’ of US$4 million on adoption of IFRS 9.IFRS 15 Revenue from Contracts with CustomersRevenue is derived principally from the sale of goods to customers and is measured at the fair value of the amount received or receivable after the deduction of trade and settlement discounts, rebates and customer returns. For the majority of local and regional sales, transfer occurs at the point of offloading the shipment into the customer’s warehouse whereas for the majority of export sales, transfer occurs when the goods have been loaded onto the relevant carrier unless the contract of sale specifies different terms.
The adoption of IFRS 15 resulted in the group recognising revenue from delivery activities as a separate performance obligation when control of the goods pass to customers at the point when the goods have been loaded onto the relevant carrier for export sales. Given that the group is acting as an agent in these activities, revenue is recognised when the delivery is arranged which is considered to be at the point of loading of the goods resulting in no significant timing differences compared to revenue recognition under IAS 18. The related delivery costs have been set off against this revenue based on agent accounting principles whereas these were previously included in cost of sales. Refer to note 2 for the quantitative impact of this adjustment. The group elected to adopt IFRS 15 on a cumulative effect method.
sappi 3rd quarter results
14
2. Segment informationQuarter ended Nine months ended
Metric tons (000’s) Jun 2019 Jun 2018 Jun 2019 Jun 2018
Sales volumeNorth America 320 318 991 1,008 Europe 789 833 2,440 2,502 Southern Africa – Pulp and paper 375 383 1,189 1,179
Forestry 369 380 992 882
Total 1,853 1,914 5,612 5,571
Which consists of:Dissolving wood pulp 285 277 932 866 Packaging and specialities papers 295 289 820 718 Printing and writing papers 904 968 2,868 3,105 Forestry 369 380 992 882
Quarter ended Nine months ended
US$ million Jun 2019 Jun 2018 Jun 2019 Jun 2018
SalesNorth America 343 339 1,072 1,044 Europe 715 759 2,214 2,188 Southern Africa – Pulp and paper 307 325 991 983
Forestry 21 22 58 56 Delivery costs revenue adjustment(2) (15) – (43) –
Total 1,371 1,445 4,292 4,271
Which consists of:Dissolving wood pulp 244 245 815 765 Packaging and specialities papers 326 327 920 777 Printing and writing papers 795 851 2,542 2,673 Forestry 21 22 58 56 Delivery costs revenue adjustment(2) (15) – (43) –
(2) Relates to delivery costs netted off against revenue. Refer to note 1, IFRS 15 adoption.
Notes to the condensed group results continued
15
sappi 3rd quarter results
2. Segment information continuedQuarter ended Nine months ended
US$ million Jun 2019 Jun 2018 Jun 2019 Jun 2018
Operating profit (loss) excluding special itemsNorth America (9) 1 10 18 Europe 20 37 81 119 Southern Africa 34 44 199 192
Unallocated and eliminations(1) 3 3 3 3
Total 48 85 293 332
Which consists of:Dissolving wood pulp 35 46 189 177 Packaging and specialities papers 3 18 26 59 Printing and writing papers 7 18 75 93
Unallocated and eliminations(1) 3 3 3 3
Special items – (gains) lossesNorth America – 1 13 3 Europe (3) (2) 2 (1)Southern Africa 1 (6) (16) (35)
Unallocated and eliminations(1) 4 8 8 11
Total 2 1 7 (22)
Segment operating profit (loss)North America (9) – (3) 15 Europe 23 39 79 120 Southern Africa 33 50 215 227
Unallocated and eliminations(1) (1) (5) (5) (8)
Total 46 84 286 354
EBITDA excluding special itemsNorth America 11 20 71 75 Europe 52 71 176 218 Southern Africa 52 59 251 240
Unallocated and eliminations(1) 3 5 4 5
Total 118 155 502 538
Which consists of:Dissolving wood pulp 49 60 232 218 Packaging and specialities papers 22 33 81 98 Printing and writing papers 44 57 185 217
Unallocated and eliminations(1) 3 5 4 5 (1) Includes the group’s treasury operations and our insurance captive.
sappi 3rd quarter results
16
2. Segment information continued
Reconciliation of EBITDA excluding special items and operating profit excluding special items to segment operating profit and profit for the period
Special items cover those items which management believe are material by nature or amount to the operating results and require separate disclosure.
Quarter ended Nine months ended
US$ million Jun 2019 Jun 2018 Jun 2019 Jun 2018
EBITDA excluding special items 118 155 502 538 Depreciation and amortisation (70) (70) (209) (206)
Operating profit excluding special items 48 85 293 332 Special items – gains (losses) (2) (1) (7) 22
Plantation price fair value adjustment 1 8 14 30 Acquisition costs – – – (2)Net restructuring provisions – – – 2 Profit (loss) on disposal and written off assets (1) (1) (4) 8 Asset impairments – – (11) –Asset impairment reversals – 3 8 3 Black Economic Empowerment charge – – – (1)Fire, flood, storm and other events (2) (11) (14) (18)
Segment operating profit 46 84 286 354 Net finance costs (28) (18) (65) (54)
Profit before taxation 18 66 221 300 Taxation (10) (15) (60) (84)
Profit for the period 8 51 161 216
Notes to the condensed group results continued
17
sappi 3rd quarter results
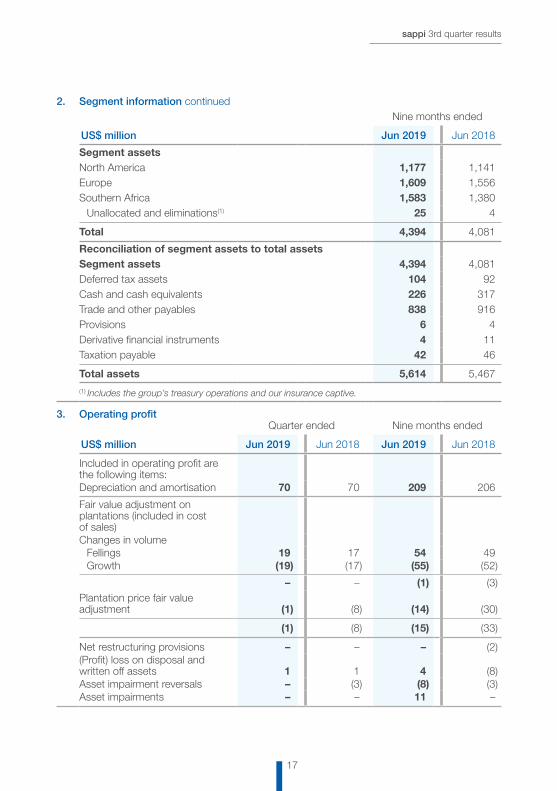
2. Segment information continuedNine months ended
US$ million Jun 2019 Jun 2018
Segment assetsNorth America 1,177 1,141 Europe 1,609 1,556 Southern Africa 1,583 1,380
Unallocated and eliminations(1) 25 4
Total 4,394 4,081
Reconciliation of segment assets to total assetsSegment assets 4,394 4,081 Deferred tax assets 104 92 Cash and cash equivalents 226 317 Trade and other payables 838 916 Provisions 6 4 Derivative financial instruments 4 11 Taxation payable 42 46
Total assets 5,614 5,467
(1) Includes the group’s treasury operations and our insurance captive.
3. Operating profitQuarter ended Nine months ended
US$ million Jun 2019 Jun 2018 Jun 2019 Jun 2018
Included in operating profit are the following items:Depreciation and amortisation 70 70 209 206
Fair value adjustment on plantations (included in cost of sales)Changes in volume
Fellings 19 17 54 49 Growth (19) (17) (55) (52)
– – (1) (3)Plantation price fair value adjustment (1) (8) (14) (30)
(1) (8) (15) (33)
Net restructuring provisions – – – (2)(Profit) loss on disposal and written off assets 1 1 4 (8)Asset impairment reversals – (3) (8) (3)Asset impairments – – 11 –
sappi 3rd quarter results
18
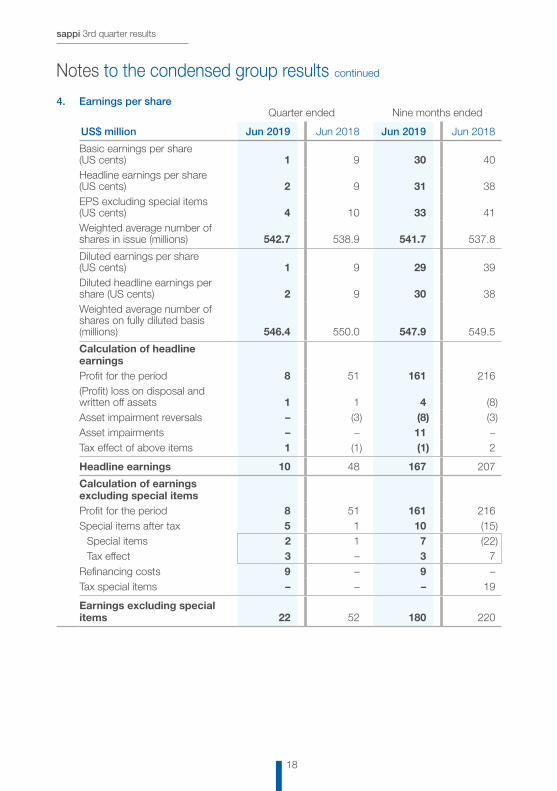
4. Earnings per shareQuarter ended Nine months ended
US$ million Jun 2019 Jun 2018 Jun 2019 Jun 2018
Basic earnings per share (US cents) 1 9 30 40 Headline earnings per share (US cents) 2 9 31 38 EPS excluding special items (US cents) 4 10 33 41 Weighted average number of shares in issue (millions) 542.7 538.9 541.7 537.8
Diluted earnings per share (US cents) 1 9 29 39 Diluted headline earnings per share (US cents) 2 9 30 38 Weighted average number of shares on fully diluted basis (millions) 546.4 550.0 547.9 549.5
Calculation of headline earningsProfit for the period 8 51 161 216 (Profit) loss on disposal and written off assets 1 1 4 (8)Asset impairment reversals – (3) (8) (3)Asset impairments – – 11 –Tax effect of above items 1 (1) (1) 2
Headline earnings 10 48 167 207
Calculation of earnings excluding special itemsProfit for the period 8 51 161 216 Special items after tax 5 1 10 (15)
Special items 2 1 7 (22)Tax effect 3 – 3 7
Refinancing costs 9 – 9 –Tax special items – – – 19
Earnings excluding special items 22 52 180 220
Notes to the condensed group results continued
19
sappi 3rd quarter results
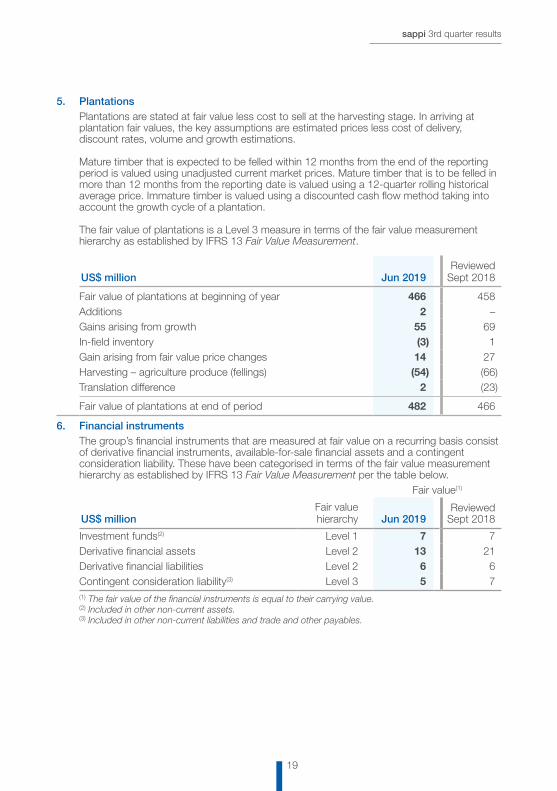
5. PlantationsPlantations are stated at fair value less cost to sell at the harvesting stage. In arriving atplantation fair values, the key assumptions are estimated prices less cost of delivery,discount rates, volume and growth estimations.
Mature timber that is expected to be felled within 12 months from the end of the reportingperiod is valued using unadjusted current market prices. Mature timber that is to be felled inmore than 12 months from the reporting date is valued using a 12-quarter rolling historicalaverage price. Immature timber is valued using a discounted cash flow method taking intoaccount the growth cycle of a plantation.
The fair value of plantations is a Level 3 measure in terms of the fair value measurementhierarchy as established by IFRS 13 Fair Value Measurement.
US$ million Jun 2019Reviewed
Sept 2018
Fair value of plantations at beginning of year 466 458 Additions 2 –Gains arising from growth 55 69 In-field inventory (3) 1 Gain arising from fair value price changes 14 27 Harvesting – agriculture produce (fellings) (54) (66)Translation difference 2 (23)
Fair value of plantations at end of period 482 466
6. Financial instrumentsThe group’s financial instruments that are measured at fair value on a recurring basis consist of derivative financial instruments, available-for-sale financial assets and a contingent consideration liability. These have been categorised in terms of the fair value measurement hierarchy as established by IFRS 13 Fair Value Measurement per the table below.
Fair value(1)
US$ millionFair value hierarchy
Jun 2019
Reviewed Sept 2018
Investment funds(2) Level 1 7 7 Derivative financial assets Level 2 13 21 Derivative financial liabilities Level 2 6 6 Contingent consideration liability(3) Level 3 5 7 (1) The fair value of the financial instruments is equal to their carrying value.(2) Included in other non-current assets.(3) Included in other non-current liabilities and trade and other payables.
sappi 3rd quarter results
20
6. Financial instruments continuedThere have been no transfers of financial assets or financial liabilities between the categories of the fair value hierarchy.
The fair value of all external over-the-counter derivatives is calculated based on the discount rate adjustment technique. The discount rate used is derived from observable rates of return for comparable assets or liabilities traded in the market. The credit risk of the external counterparty is incorporated into the calculation of fair values of financial assets and own credit risk is incorporated in the measurement of financial liabilities. The change in fair value is therefore impacted by the movement of the interest rate curves, by the volatility of the applied credit spreads, and by any changes to the credit profile of the involved parties.
The contingent consideration is based on a multiple of targeted future earnings, of which a weighted average outcome has been considered.
There are no financial assets and liabilities that have been remeasured to fair value on a non-recurring basis.
The carrying amounts of other financial instruments which include cash and cash equivalents, accounts receivable, certain investments, accounts payable, bank overdrafts and current interest-bearing borrowings approximate their fair values.
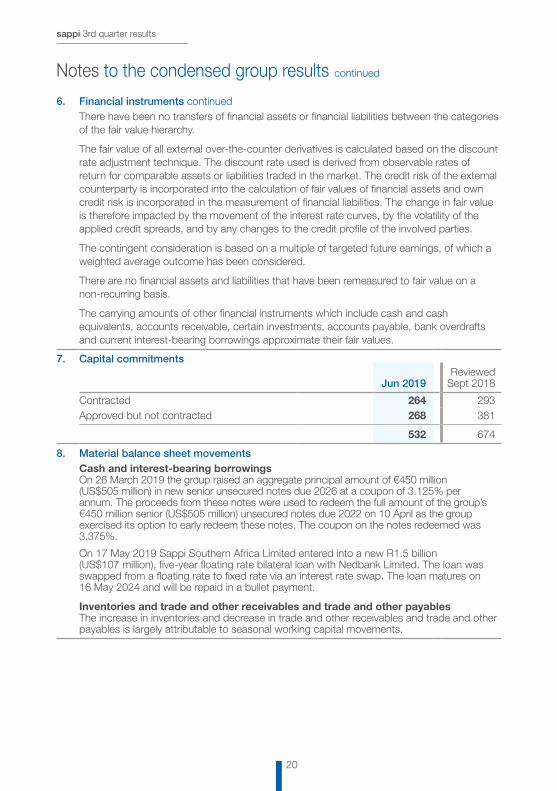
7. Capital commitments
Jun 2019Reviewed
Sept 2018
Contracted 264 293 Approved but not contracted 268 381
532 674
8. Material balance sheet movementsCash and interest-bearing borrowingsOn 26 March 2019 the group raised an aggregate principal amount of €450 million (US$505 million) in new senior unsecured notes due 2026 at a coupon of 3.125% per annum. The proceeds from these notes were used to redeem the full amount of the group’s €450 million senior (US$505 million) unsecured notes due 2022 on 10 April as the group exercised its option to early redeem these notes. The coupon on the notes redeemed was 3.375%.
On 17 May 2019 Sappi Southern Africa Limited entered into a new R1.5 billion (US$107 million), five-year floating rate bilateral loan with Nedbank Limited. The loan was swapped from a floating rate to fixed rate via an interest rate swap. The loan matures on 16 May 2024 and will be repaid in a bullet payment.
Inventories and trade and other receivables and trade and other payablesThe increase in inventories and decrease in trade and other receivables and trade and other payables is largely attributable to seasonal working capital movements.
Notes to the condensed group results continued
21
sappi 3rd quarter results
9. Related partiesThere has been no material change, by nature or amount, in transactions with related parties since the 2018 financial year-end except for The Boldt Company which is no longer considered a related party.
10. Accounting standards, interpretations and amendments to existing standards that are not yet effectiveThere has been no significant change to managements estimates in respect of new accounting standards, amendments and interpretations to existing standards that have been published which are not yet effective and which have not yet been adopted by the group. Management is in the process of completing their assessment of IFRS 16 Leases.
11. Events after the balance sheet dateOn 31 July 2019, Sappi signed an agreement to acquire, subject to conditions precedent including the prerequisite approvals of certain anti-trust authorities, the 270,000 ton Matane high yield hardwood pulp mill, in Quebec, Canada, from Rayonier Advanced Materials Inc for US$175 million. The acquisition will increase Sappi’s pulp integration for both its North American and European packaging businesses and lower Sappi’s costs of pulp, reduce its volatility of earnings throughout the pulp cycle and provide certainty of supply. The acquisition will be financed from internal resources and is expected to be concluded in the fourth calendar quarter of 2019.
sappi 3rd quarter results
22
General definitionsAverage – averages are calculated as the sum of the opening and closing balances for the relevant period divided by twoBroad-based Black Economic Empowerment (BBBEE) charge – represents the IFRS 2 non-cash charge associated with the BBBEE transaction implemented in fiscal 2010 in terms of BBBEE legislation in South AfricaCapital employed – shareholders’ equity plus net debtEBITDA excluding special items – earnings before interest (net finance costs), taxation, depreciation, amortisation and special itemsEPS excluding special items – earnings per share excluding special items and certain once-off finance and tax itemsFellings – the amount charged against the income statement representing the standing value of the plantations harvestedHeadline earnings – as defined in circular 4/2018, issued by the South African Institute of Chartered Accountants in April 2018, which separates from earnings all separately identifiable remeasurements. It is not necessarily a measure of sustainable earnings. It is a Listings Requirement of the JSE Limited to disclose headline earnings per shareInterest cover – last 12 months EBITDA excluding special items to net interest adjusted for refinancing costsNBSK – Northern Bleached Softwood Kraft pulp. One of the main varieties of market pulp, produced from coniferous trees (ie spruce, pine) in Scandinavia, Canada and northern USA. The price of NBSK is a benchmark widely used in the pulp and paper industry for comparative purposesNet assets – total assets less total liabilitiesNet asset value per share – net assets divided by the number of shares in issue at balance sheet dateNet debt – current and non-current interest-bearing borrowings, bank overdrafts less cash and cash equivalentsNet debt to EBITDA excluding special items – net debt divided by the last 12 months EBITDA excluding special items
Net operating assets – total assets (excluding deferred tax assets and cash) less current liabilities (excluding interest-bearing borrowings and overdraft). Net operating assets equate to segment assetsOperating profit – A profit from business operations before deduction of net finance costs and taxesNon-GAAP measures – the group believes that it is useful to report certain non-GAAP measures for the following reasons:– these measures are used by the group for
internal performance analysis;– the presentation by the group’s reported
business segments of these measures facilitates comparability with other companies in our industry, although the group’s measures may not be comparable with similarly titled profit measurements reported by other companies; and
– it is useful in connection with discussion with the investment analyst community and debt rating agencies
These non-GAAP measures should not be considered in isolation or construed as a substitute for GAAP measures in accordance with IFRSROCE – annualised return on average capital employed. Operating profit excluding special items divided by average capital employedRONOA – return on average net operating assets. Operating profit excluding special items divided by average net operating assetsSpecial items – special items cover those items which management believes are material by nature or amount to the operating results and require separate disclosure. Such items would generally include profit or loss on disposal of property, investments and businesses, asset impairments, restructuring charges, non-recurring integration costs related to acquisitions, financial impacts of natural disasters, non-cash gains or losses on the price fair value adjustment of plantations and alternative fuel tax credits receivable in cash
The above financial measures are presented to assist our shareholders and the investment community in interpreting our financial results. These financial measures are regularly used and compared between companies in our industry.
Supplemental information (this information has not been audited or reviewed)
23
sappi 3rd quarter results
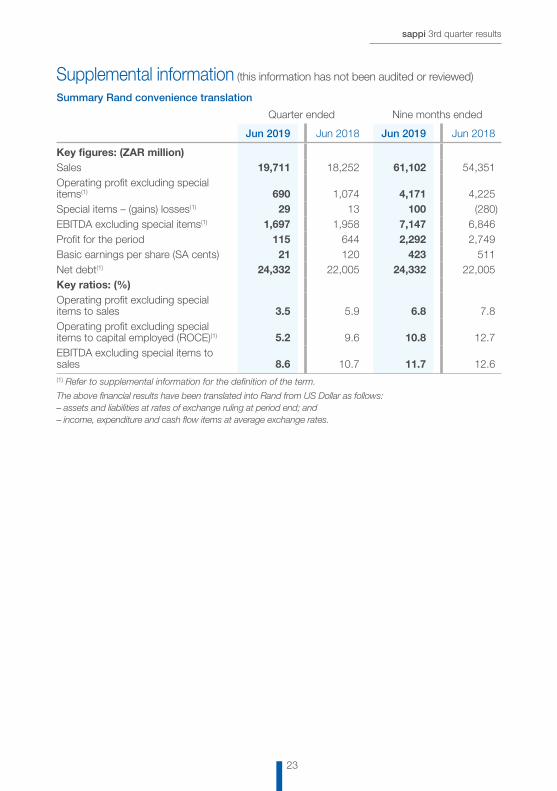
Summary Rand convenience translation
Quarter ended Nine months ended
Jun 2019 Jun 2018 Jun 2019 Jun 2018
Key figures: (ZAR million)Sales 19,711 18,252 61,102 54,351 Operating profit excluding special items(1) 690 1,074 4,171 4,225 Special items – (gains) losses(1) 29 13 100 (280)EBITDA excluding special items(1) 1,697 1,958 7,147 6,846 Profit for the period 115 644 2,292 2,749 Basic earnings per share (SA cents) 21 120 423 511 Net debt(1) 24,332 22,005 24,332 22,005 Key ratios: (%)Operating profit excluding special items to sales 3.5 5.9 6.8 7.8 Operating profit excluding special items to capital employed (ROCE)(1) 5.2 9.6 10.8 12.7 EBITDA excluding special items to sales 8.6 10.7 11.7 12.6 (1) Refer to supplemental information for the definition of the term.
The above financial results have been translated into Rand from US Dollar as follows:– assets and liabilities at rates of exchange ruling at period end; and– income, expenditure and cash flow items at average exchange rates.
Supplemental information (this information has not been audited or reviewed)
sappi 3rd quarter results
24
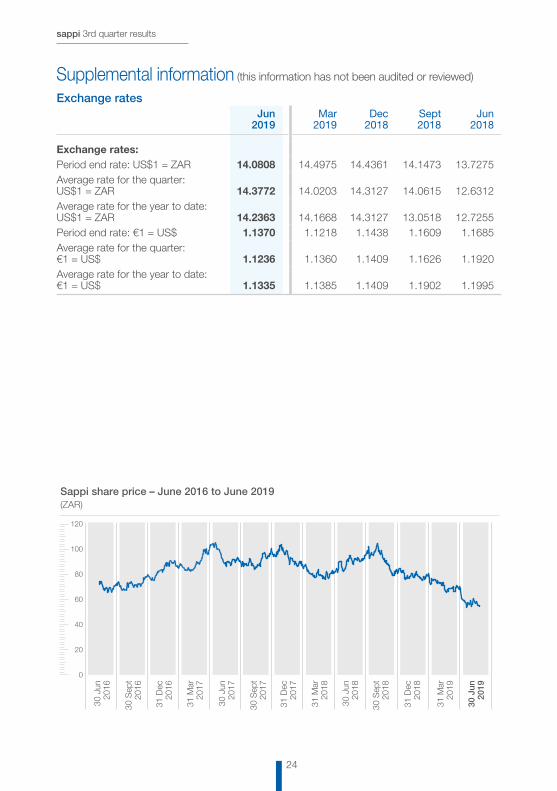
Exchange ratesJun
2019Mar
2019Dec
2018Sept2018
Jun2018
Exchange rates:Period end rate: US$1 = ZAR 14.0808 14.4975 14.4361 14.1473 13.7275Average rate for the quarter: US$1 = ZAR 14.3772 14.0203 14.3127 14.0615 12.6312Average rate for the year to date: US$1 = ZAR 14.2363 14.1668 14.3127 13.0518 12.7255Period end rate: €1 = US$ 1.1370 1.1218 1.1438 1.1609 1.1685Average rate for the quarter: €1 = US$ 1.1236 1.1360 1.1409 1.1626 1.1920Average rate for the year to date: €1 = US$ 1.1335 1.1385 1.1409 1.1902 1.1995
Sappi share price – June 2016 to June 2019 (ZAR)
120
100
80
60
40
20
0
30 J
un20
16
30 S
ept
2016
31 D
ec20
16
31 M
ar
2017
30 J
un20
17
30 S
ept
2017
31 D
ec20
17
31 M
ar
2018
30 J
un20
18
30 S
ept
2018
31 D
ec20
18
31 M
ar20
19
30 J
un20
19
Supplemental information (this information has not been audited or reviewed)
Sappi Limited (Incorporated in the Republic of South Africa) Registration number: 1936/008963/06JSE code: SAPISIN code: ZAE000006284Issuer code: SAVVI
Sappi has a primary listing on the JSE Limited and a Level 1 ADR programme that trades in the over-the-counter market in the United States
Computershare Investor Services (Pty) Ltd Rosebank Towers, 15 Biermann Avenue Rosebank 2196, South AfricaPO Box 61051, Marshalltown 2107, South Africawww.computershare.com
South Africa
The Bank of New York MellonInvestor RelationsPO Box 11258Church Street StationNew York, NY 10286-1258Tel +1 610 382 7836
United States ADR Depositary
JSE Sponsor:UBS South Africa (Pty) Ltd
This report is available on the Sappi website: www.sappi.com

www.sappi.com