Embed Size (px)
Citation preview

Third Quarter Report
2021
1) Excluding M&A-related, transformation and share-based compensation costs as well as results from sale of business and equity investments
2) Earnings per share in CHF were converted using the average currency exchange rate for the respective periods
Key figures
USD millions (except earnings per share)
Q3 2021 Q3 2020 Q2 2021 9 months 2021 9 months 2020
Revenues 1,521 1,440 1,463 4,498 2,471
Gross margin in % (adjusted - see footnote 1)
34% 27% 33% 34% 32%
Result from operations (EBIT) (adjusted – see footnote 1) 157 63 128 454 268
EBIT margin in % (adjusted – see footnote 1) 10% 4% 9% 10% 11%
Net result (adjusted – see footnote 1) 12 12 82 182 102
Basic / diluted earnings per share in CHF 2)
(adjusted – see footnote 1)
0.02 / 0.02 0.08 / 0.05 0.29 / 0.29 0.66 / 0.65 0.51 / 0.48
Basic / diluted earnings per share in USD
(adjusted – see footnote 1)
0.02 / 0.02 0.09 / 0.05 0.31 / 0.31 0.71 / 0.71 0.56 / 0.53
Net debt 2,194 2,483 2,252 2,194 2,483

Third Quarter Report 2021
ams-osram.com page 2/16
Robust third quarter results delivering strong profitability and
operating cash flow amid demanding supply chain environment and
continuing market imbalances
Report to shareholders on the third quarter 2021
Portfolio re-alignment continues with smaller-scale disposal of building-related systems
completed and larger-scale disposal at late stage of process
Synergy creation and integration programs progressing to plan
Delisting of OSRAM Licht AG (“OSRAM”) share completed
Ladies and Gentlemen
Our business performed well in the third quarter and delivered results clearly above the midpoint or
near the upper end of our guidance. Despite continuing supply chain imbalances, our automotive
business was strong while our consumer business contributed attractively in line with previous
expectations. At the same time, we continue to move ahead in re-aligning and shaping our future
portfolio. We closed a smaller-scale disposal for building-related systems in October and are in the late
stage of a larger-scale disposal. Moreover, the joint venture between OSRAM and Continental has
been dissolved which is another important step to streamline our business profile. These successes
demonstrate our full focus on implementing portfolio alignments timely and as communicated. We
completed the delisting of the OSRAM share at the end of the quarter which further simplifies our
corporate structure. We are also pleased with the development of our integration and synergy creation
programs which are progressing in line with plans and towards our targets.
We see ongoing tightness in chip supply and imbalances in supply chains, particularly in the
automotive market. This is introducing revenue volatility into automotive supply chains as component
shortages trigger lower production volumes at automotive OEMs. We expect that these imbalances will
persist well into the coming year and continue to be accompanied by tighter availability of certain
materials and supplies. Where possible we aim to factor higher sourcing costs into future customer
pricing. We continue to see revenue drivers in automotive and industrial lighting and consumer optical
solutions in areas like display management and camera enhancement in the coming quarters. At the
same time, we invest into our technology roadmaps for mid- and long-term growth markets in display
and visualization, differentiated illumination and advanced sensing. This includes focused equipment
investments to improve capacity and enable new products.
Financial results
Third quarter group revenues were USD 1,521 million, up 4% sequentially compared to the second
quarter 2021 and up 6% comparted to same quarter 2020. Adjusted1 group gross margin for the third
quarter 2021 was 34%, up from 33% for the second quarter 2021 and up from 27% for the same
quarter 2020.
1 Excluding M&A-related, transformation and share-based compensation costs as well as results from sale of business and equity investments

Third Quarter Report 2021
ams-osram.com page 3/16
The adjusted1 group result from operations (EBIT) was USD 157 million or 10% of revenues for the
third quarter compared up from USD 128 million or 9% for the second quarter and USD 63 million or
4% of revenues for the same period 2020 (unadjusted: USD 97 million or 6% of revenues for the third
quarter). Adjusted1 group net income was USD 12 million for the third quarter compared to USD 82
million for the second quarter and unchanged compared to USD 12 million for the same quarter 2020
(unadjusted: USD -48 million for the third quarter). Adjusted1 diluted earnings per share2 for the third
quarter were USD 0.02 or CHF 0.02 (unadjusted: USD -0.21 or CHF -0.19).
The group operating cash flow for the third quarter was robust at USD 255 million while group free
cash flow reached USD 147 million. Group net debt was USD 2,194 million on 30 September 2021,
translating into a group leverage of 1.7x net debt/adjusted1 EBITDA. Cash and cash equivalents stood
at USD 1,533 million on 30 September 2021.
Business development
Our Semiconductors segment contributed strongly to group performance generating 67% of revenues
in the third quarter, combined with a healthy adjusted operating margin of 13%. In this segment, the
automotive market area recorded very positive results driven by available backlog. The consumer
market area showed a solid development in line with expectations driven by optical sensing solutions
for multiple applications. The industrial and medical market areas performed well as the attractive
demand momentum in industrial lighting continues across established and emerging markets. Medical
and other imaging product lines developed positively in the quarter. We pursue development activities
for future optical solutions including light sensing, new LED technologies and 3D technologies such as
camera enhancement, display management, AR and 3D applications, LED-based visualization, UV-C
LED and advanced LED front lighting.
Our Lamps & Systems (L&S) segment showed an overall positive development in the third quarter
contributing 33% of revenues. The L&S automotive business including traditional markets performed
well, reflecting typical seasonality and robust demand across channels. Market traction for LED retrofit
solutions continues to increase. The other areas of the L&S business recorded good demand for
industrial, building-related and medical applications while demand in lagging industrial markets is
showing first signs of improvement.
We have discontinued using the advisory services of former ams CFO Michael Wachsler as we have
very recently been informed of an ongoing investigation of Mr. Wachsler conducted by Austrian
authorities. This is related to private securities transactions allegedly assigned to Mr. Wachsler and
two former employees of ams. The Supervisory Board of ams AG has acknowledged Mr. Wachsler’s
decision not to stand as a candidate for this Supervisory Board. Mr. Wachsler stepped down as CFO
of ams effective May 2020. The company itself is not a subject of this investigation or related
allegations. We are fully cooperating with the relevant authorities and have initiated an internal
investigation into the matter. We are not able to comment further on ongoing investigations.
Outlook
For the fourth quarter 2021, we expect group revenues of USD 1,360-1,460 million - which exclude the
disposed revenues of the DS North America and connected building applications businesses and
1 Excluding M&A-related, transformation and share-based compensation costs as well as results from sale of business and equity investments 2 Based on 261,215,988 basic / 261,489,566 diluted shares

Third Quarter Report 2021
ams-osram.com page 4/16
deconsolidated revenues from the dissolved joint venture - and an expected adjusted operating (EBIT)
margin of 8-11%, based on currently available information and exchange rates. The outlook reflects
the above-mentioned disposal and deconsolidation effects as well as near term supply chain volatilities
in the automotive market due to constrained end-to-end supply situations and lower production
volumes at multiple OEMs, irrespective of an overall positive backlog situation. The outlook also
reflects an unfavorable exchange rate development and a decreased year-on-year contribution from
the consumer market in line with previous comments and expectations. On a like-for-like revenue
basis to the third quarter without deconsolidation effects, expected fourth quarter group revenues
would be USD 1,405-1,505 million.
Third Quarter Report 2021
ams-osram.com page 5/16
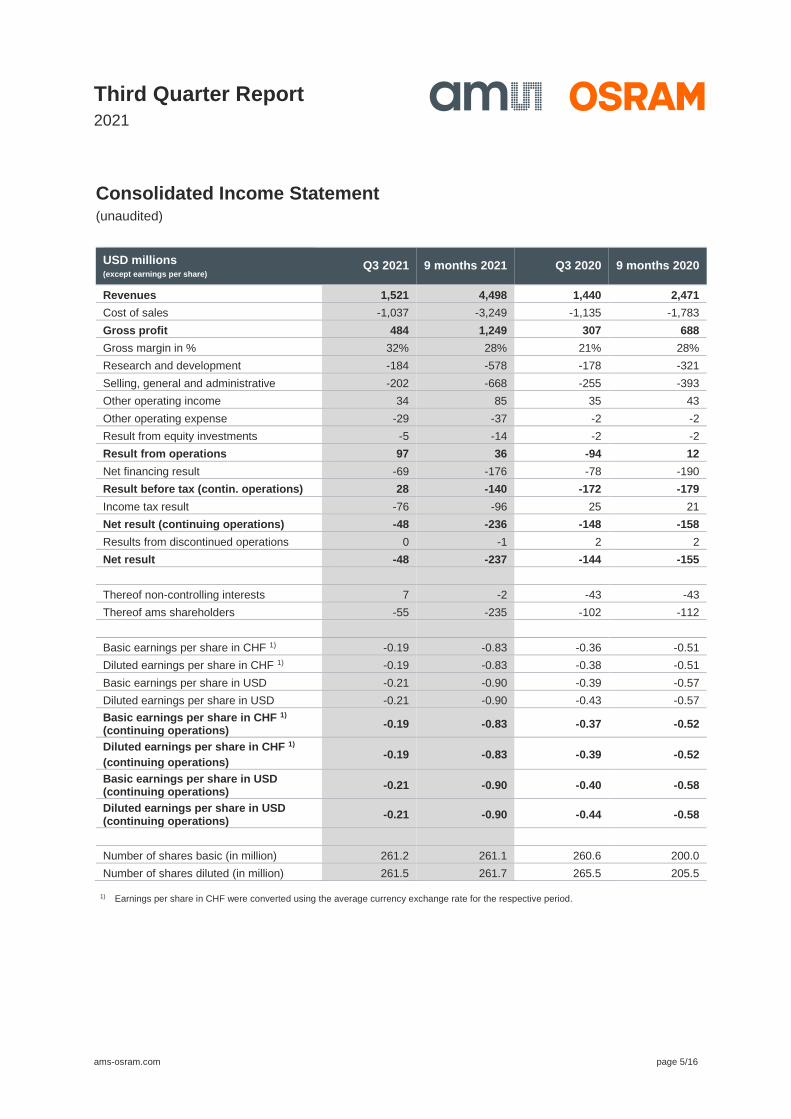
Consolidated Income Statement (unaudited)
USD millions (except earnings per share)
Q3 2021 9 months 2021 Q3 2020 9 months 2020
Revenues 1,521 4,498 1,440 2,471
Cost of sales -1,037 -3,249 -1,135 -1,783
Gross profit 484 1,249 307 688
Gross margin in % 32% 28% 21% 28%
Research and development -184 -578 -178 -321
Selling, general and administrative -202 -668 -255 -393
Other operating income 34 85 35 43
Other operating expense -29 -37 -2 -2
Result from equity investments -5 -14 -2 -2
Result from operations 97 36 -94 12
Net financing result -69 -176 -78 -190
Result before tax (contin. operations) 28 -140 -172 -179
Income tax result -76 -96 25 21
Net result (continuing operations) -48 -236 -148 -158
Results from discontinued operations 0 -1 2 2
Net result -48 -237 -144 -155
Thereof non-controlling interests 7 -2 -43 -43
Thereof ams shareholders -55 -235 -102 -112
Basic earnings per share in CHF 1) -0.19 -0.83 -0.36 -0.51
Diluted earnings per share in CHF 1) -0.19 -0.83 -0.38 -0.51
Basic earnings per share in USD -0.21 -0.90 -0.39 -0.57
Diluted earnings per share in USD -0.21 -0.90 -0.43 -0.57
Basic earnings per share in CHF 1) (continuing operations)
-0.19 -0.83 -0.37 -0.52
Diluted earnings per share in CHF 1)
(continuing operations) -0.19 -0.83 -0.39 -0.52
Basic earnings per share in USD (continuing operations)
-0.21 -0.90 -0.40 -0.58
Diluted earnings per share in USD (continuing operations)
-0.21 -0.90 -0.44 -0.58
Number of shares basic (in million) 261.2 261.1 260.6 200.0
Number of shares diluted (in million) 261.5 261.7 265.5 205.5
1) Earnings per share in CHF were converted using the average currency exchange rate for the respective period.

Third Quarter Report 2021
ams-osram.com page 6/16
Consolidated Balance Sheet (unaudited)
USD millions September 30, 2021 December 31, 2020
Assets
Cash and cash equivalents 1,533 1,886
Trade receivables 826 733
Inventories 978 1,013
Other receivables and assets 271 200
Short-term investments 19 22
Assets held for sale 232 57
Total current assets 3,860 3,911
Property, plant and equipment 1,881 2,288
Intangible assets 4,733 4,783
Right of use assets 298 341
Investments in associates 81 89
Deferred tax assets 157 195
Other long term assets 147 128
Financial assets 37 30
Total non-current assets 7,333 7,854
Total assets 11,192 11,763
Liabilities and Equity
Current liabilities
Short-term interest-bearing loans and borrowings 565 280
Trade payables 791 643
Income tax payables 136 123
Current Provisions 424 404
Other current liabilities 1,538 2,002
Liabilities associated with assets held for sale 182 150
Total current liabilities 3,635 3,603
Interest-bearing loans and borrowings 3,162 3,620
Employee benefits 217 257
Deferred tax liabilities 243 268
Provisions 52 52
Other liabilities 531 387
Total non-current liabilities 4,205 4,586
Equity
Issued capital 324 324
Additional paid-in capital 2,313 2,569
Treasury shares -145 -150
Retained earnings 18 1,092
Other components of equity 900 -190
Total equity attributable to shareholders of ams AG 3,410 3,646
Non-controlling interests -59 -72
Total equity 3,352 3,574
Total liabilities and equity 11,192 11,763

Third Quarter Report 2021
ams-osram.com page 7/16
Consolidated Statement of Cash Flows (unaudited)
USD millions Q3 2021 9 months
2021 Q3 2020
9 months 2020
Operating activities
Net income (loss) -48 -237 -144 -155
Adjustments to reconcile net income (loss) to cash provided/used 0 0 0 0
Income (loss) from discontinued operations, net of tax 0 1 -3 -3
Amortization, depreciation, and impairment 148 693 277 455
Expenses from stock option plans (acc. to IFRS 2) 12 38 21 60
Income taxes 76 96 -25 -21
Net financial result 69 176 78 190
Other non-cash (income) expenses -3 -1 13 13
(Gains) losses on sales and disposals of businesses, intangible assets, and property, plant, and equipment, net
-2 -31 1 1
Result from sale of financial assets 0 0 0 0
(Gains) losses on investments accounted for using the equity method
3 9 2 3
Change in current assets and liabilities 0 0 0 0
(Increase) decrease in inventories 20 -38 74 59
(Increase) decrease in trade receivables -13 -64 -53 55
(Increase) decrease in other current assets -37 -41 23 -42
Increase (decrease) in trade payables 8 150 -124 -113
Increase (decrease) in current provisions -9 -29 12 -4
Increase (decrease) in other current liabilities 60 79 4 24
Change in other assets and liabilities -11 -1 -61 -62
Income taxes paid -20 -81 -9 -9
Dividends received 0 0 0 0
Interest received 1 3 1 4
Cash flows from operating activities (continuing operations)
255 723 86 454
Cash flows from operating activities discontinued operations 0 0 -2 -2
Cash flows operating activities 255 723 84 452
Investing activities
Additions to intangible assets and property, plant, and equipment -108 -255 -84 -145
Acquisitions, net of cash and cash equivalents acquired -10 -532 -1,386 -1,386
Purchases of investments -1 -12 -1 -214
Proceeds and payments from sales of investments, intangible assets, and property, plant, and equipment
2 12 2 2
Proceeds and payments from sales of business activities, net of cash and cash equivalents disposed of
45 136 0 49
Cash flows from investing activities (continuing operations) -73 -652 -1,469 -1,694
Cash flows from investing activities discontinued operations 0 0 0 0
Cash flows from investing activities -73 -652 -1,469 -1,694

Third Quarter Report 2021
ams-osram.com page 8/16
Financing activities
Payments from capital increases in subsidiaries with minority interests
0 15 0 0
Purchase of common stock of company 0 -1 0 -150
Proceeds from issuance of long-term debt 0 0 1,465 1,465
Proceeds from loans 1 114 103 213
Repayment of convertible notes 0 -20 0 0
Repayment of loans -137 -337 -1,085 -1,248
Repayment of lease liabilities -23 -63 -17 -29
Sale of treasury shares 1 6 1 167
Interest paid -59 -146 -14 -36
Transaction costs from loans and borrowing 0 0 -51 -177
Dividends paid 0 -1 -2 -2
Changes resulting from capital increase 0 0 0 1,947
Cash flows from financing activities (continuing operations) -218 -432 401 2,149
Cash flows from financing activities (discontinued operations) 0 0 0 0
Cash flows from financing activities -218 -432 401 2,149
Effects of changes in foreign exchange rates on cash and cash equivalents
9 31 -47 -48
Change in cash and cash equivalents -27 -330 -1,032 859
Cash and cash equivalents at the begin of period 1,597 1,899 2,482 591
Cash and cash equivalents at end of period 1,570 1,570 1,450 1,450
Less: Cash and cash equivalent of assets held for sale at the end of reporting period
37 37 11 11
Cash and cash equivalents at end of period (continuing operations)
1,533 1,533 1,439 1,439
Third Quarter Report 2021
ams-osram.com page 9/16
Reconciliation from adjusted figures to reported figures
USD millions Q3 2021 9 months 2021 Q3 2020 9 months 2020
Gross profit – adjusted 514 1,526 384 792
M&A related costs (information - see footnote 1)
-24 -72 -32 -55
Share-based compensation -1 -2 -4 -7
Transformation costs -5 -25 -42 -42
Asset restructuring 0 -179 0 0
Gross profit – IFRS reported 484 1,249 306 688
Gross margin in % – adjusted 34% 34% 27% 32%
Gross margin in % – IFRS reported 32% 28% 21% 28%
Operating expenses – adjusted -357 -1,072 -322 -524
M&A related costs (information - see footnote 1)
-38 -94 -49 -86
Share-based compensation -11 -37 -17 -53
Result from the sale of a business 19 43 0 0
Transformation costs 6 -39 -11 -11
Result from equity investments -5 -14 -2 -3
Operating expenses – reported -387 -1,213 -401 -677
Result from operations – adjusted 157 454 63 268
M&A related costs (information - see footnote 1)
-62 -166 -81 -140
Share-based compensation -12 -39 -21 -60
Transformation costs 0 -64 -54 -54
Asset restructuring 0 -179 0 0
Result from the sale of a business 19 43 0 0
Result from equity investments -5 -14 -2 -3
Result from operations – IFRS reported 97 36 -95 11
Operating margin in % – adjusted 10% 10% 4% 11%
Operating margin in % – reported 6% 1% -7% 0%
Result from operations – adjusted 157 454 63 268
Net financing result -69 -176 -78 -190
Income tax result -76 -96 25 21
Net result adjusted (continuing operations) 12 182 10 99
Results from discontinued operations 0 -1 2 2
Net result - adjusted 12 182 12 102
Basic adjusted earnings per share (in USD)
0.02 0.71 0.11 0.58
1) M&A related costs includes depreciation and amortization of purchase price allocated assets, integration, carve-out and acquisition related costs
Third Quarter Report 2021
ams-osram.com page 10/16
Financial statements in EUR

Third Quarter Report 2021
ams-osram.com page 11/16
Consolidated Income Statement (unaudited)
EUR millions (except earnings per share)
Q3 2021 9 months 2021 Q3 2020 9 months 2020
Revenues 1,288 3,809 1,220 2,093
Cost of sales -878 -2,752 -961 -1,510
Gross profit 410 1,057 260 583
Gross margin in % 32% 28% 21% 28%
Research and development -156 -490 -151 -272
Selling, general and administrative -171 -566 -216 -333
Other operating income 28 72 30 36
Other operating expense -24 -32 -2 -2
Result from equity investments -5 -12 -2 -2
Result from operations 83 30 -80 10
Net financing result -59 -149 -66 -161
Result before tax (contin. operations) 24 -119 -146 -152
Income tax result -64 -81 21 18
Net result (continuing operations) -40 -200 -125 -134
Results from discontinued operations 0 0 2 2
Net result -40 -200 -122 -131
Thereof non-controlling interests 6 -2 -36 -36
Thereof ams shareholders -46 -199 -86 -95
Basic earnings per share in CHF 1) -0.19 -0.83 -0.36 -0.51
Diluted earnings per share in CHF 1) -0.19 -0.83 -0.38 -0.51
Basic earnings per share in EUR -0.18 -0.76 -0.33 -0.48
Diluted earnings per share in EUR -0.18 -0.76 -0.36 -0.48
Basic earnings per share in CHF 1) (continuing operations)
-0.19 -0.83 -0.37 -0.52
Diluted earnings per share in CHF 1)
(continuing operations) -0.19 -0.83 -0.39 -0.52
Basic earnings per share in EUR (continuing operations)
-0.18 -0.76 -0.34 -0.49
Diluted earnings per share in EUR (continuing operations)
-0.18 -0.76 -0.37 -0.49
Number of shares basic (in million) 261.2 261.1 260.6 200.0
Number of shares diluted (in million) 261.5 261.7 265.5 205.5
1) Earnings per share in CHF were converted using the average currency exchange rate for the respective periods.
Third Quarter Report 2021
ams-osram.com page 12/16
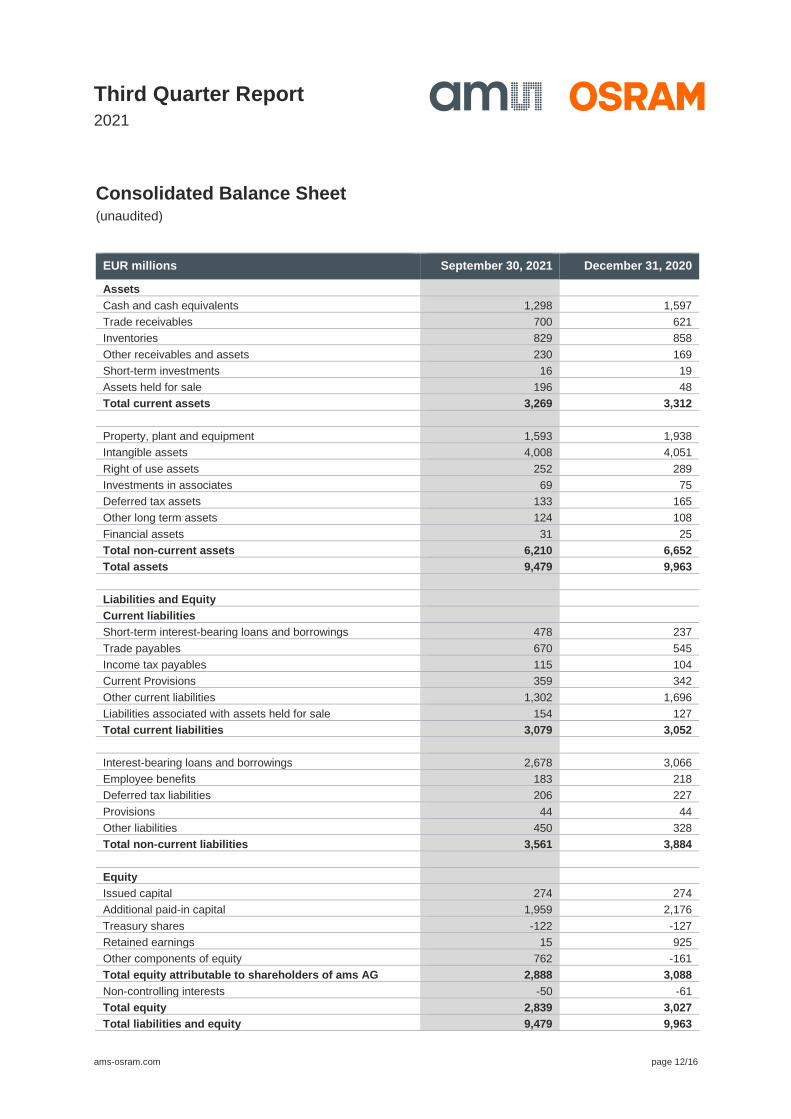
Consolidated Balance Sheet (unaudited)
EUR millions September 30, 2021 December 31, 2020
Assets
Cash and cash equivalents 1,298 1,597
Trade receivables 700 621
Inventories 829 858
Other receivables and assets 230 169
Short-term investments 16 19
Assets held for sale 196 48
Total current assets 3,269 3,312
Property, plant and equipment 1,593 1,938
Intangible assets 4,008 4,051
Right of use assets 252 289
Investments in associates 69 75
Deferred tax assets 133 165
Other long term assets 124 108
Financial assets 31 25
Total non-current assets 6,210 6,652
Total assets 9,479 9,963
Liabilities and Equity
Current liabilities
Short-term interest-bearing loans and borrowings 478 237
Trade payables 670 545
Income tax payables 115 104
Current Provisions 359 342
Other current liabilities 1,302 1,696
Liabilities associated with assets held for sale 154 127
Total current liabilities 3,079 3,052
Interest-bearing loans and borrowings 2,678 3,066
Employee benefits 183 218
Deferred tax liabilities 206 227
Provisions 44 44
Other liabilities 450 328
Total non-current liabilities 3,561 3,884
Equity
Issued capital 274 274
Additional paid-in capital 1,959 2,176
Treasury shares -122 -127
Retained earnings 15 925
Other components of equity 762 -161
Total equity attributable to shareholders of ams AG 2,888 3,088
Non-controlling interests -50 -61
Total equity 2,839 3,027
Total liabilities and equity 9,479 9,963

Third Quarter Report 2021
ams-osram.com page 13/16
Consolidated Statement of Cash Flows (unaudited)
EUR millions Q3 2021 9 months
2021 Q3 2020
9 months 2020
Operating activities
Net income (loss) -40 -200 -122 -131
Adjustments to reconcile net income (loss) to cash provided/used
Income (loss) from discontinued operations, net of tax 0 0 -2 -2
Amortization, depreciation, and impairment 126 587 235 386
Expenses from stock option plans (acc. to IFRS 2) 10 32 18 51
Income taxes 64 81 -21 -18
Net financial result 59 149 66 161
Other non-cash (income) expenses -2 -1 11 11
(Gains) losses on sales and disposals of businesses, intangible assets, and property, plant, and equipment, net
-2 -26 1 0
Result from sale of financial assets 0 0 0 0
(Gains) losses on investments accounted for using the equity method
2 7 2 2
Change in current assets and liabilities
(Increase) decrease in inventories 17 -32 63 50
(Increase) decrease in trade receivables -11 -54 -45 47
(Increase) decrease in other current assets -32 -34 19 -36
Increase (decrease) in trade payables 7 127 -105 -96
Increase (decrease) in current provisions -8 -24 10 -3
Increase (decrease) in other current liabilities 51 67 3 20
Change in other assets and liabilities -9 -1 -52 -53
Income taxes paid -17 -69 -7 -8
Dividends received 0 0 0 0
Interest received 1 2 1 4
Cash flows from operating activities (continuing operations)
216 612 73 385
Cash flows from operating activities discontinued operations 0 0 -2 -2
Cash flows operating activities 216 612 71 383
Investing activities
Additions to intangible assets and property, plant, and equipment -92 -216 -71 -123
Acquisitions, net of cash and cash equivalents acquired -9 -451 -1,174 -1,174
Purchases of investments -1 -10 0 -181
Proceeds and payments from sales of investments, intangible assets, and property, plant, and equipment
2 10 2 2
Proceeds and payments from sales of business activities, net of cash and cash equivalents disposed of
38 115 0 41
Cash flows from investing activities (continuing operations) -62 -552 -1,244 -1,435
Cash flows from investing activities discontinued operations 0 0 0 0
Cash flows from investing activities -62 -552 -1,244 -1,435

Third Quarter Report 2021
ams-osram.com page 14/16
Financing activities
Payments from capital increases in subsidiaries with minority interests
0 13 0 0
Purchase of common stock of company 0 -1 0 -127
Proceeds from issuance of long-term debt 0 0 1,241 1,241
Proceeds from loans 1 97 88 180
Repayment of convertible notes 0 -17 0 0
Repayment of loans -116 -285 -919 -1,057
Repayment of lease liabilities -20 -53 -14 -25
Sale of treasury shares 1 5 1 141
Interest paid -50 -123 -12 -30
Transaction costs from loans and borrowing 0 0 -43 -150
Dividends paid 0 -1 -2 -2
Changes resulting from capital increase 0 0 0 1,649
Cash flows from financing activities (continuing operations) -184 -366 340 1,820
Cash flows from financing activities (discontinued operations) 0 0 0 0
Cash flows from financing activities -184 -366 340 1,820
Effects of changes in foreign exchange rates on cash and cash equivalents
7 26 -40 -41
Change in cash and cash equivalents -23 -279 -874 728
Cash and cash equivalents at the begin of period 1,352 1,609 2,102 500
Cash and cash equivalents at end of period 1,329 1,329 1,228 1,228
Less: Cash and cash equivalent of assets held for sale at the end of reporting period
31 31 9 9
Cash and cash equivalents at end of period (continuing operations)
1,298 1,298 1,219 1,219

Third Quarter Report 2021
ams-osram.com page 15/16
Reconciliation from adjusted figures to reported figures according
to IFRS
EUR millions Q3 2021 9 months 2021 Q3 2020 9 months 2020
Gross profit – adjusted 436 1,293 326 671
M&A related costs (information - see footnote 1) -21 -61 -27 -46
Share-based compensation -1 -1 -3 -6
Transformation costs -4 -21 -36 -36
Asset restructuring 0 -152 0 0
Gross profit – IFRS reported 410 1,057 260 583
Gross margin in % – adjusted 34% 34% 27% 32%
Gross margin in % – IFRS reported 32% 28% 21% 28%
Operating expenses – adjusted -303 -908 -273 -444
M&A related costs (information - see footnote 1)
-32 -80 -41 -73
Share-based compensation -9 -32 -15 -45
Result from the sale of a business 16 37 0 0
Transformation costs 5 -33 -10 -10
Result from equity investments -5 -12 -2 -2
Operating expenses – reported -327 -1,027 -340 -573
Result from operations – adjusted 133 384 53 227
M&A related costs (information - see footnote 1)
-53 -141 -68 -119
Share-based compensation -10 -33 -18 -51
Transformation costs 0 -54 -45 -45
Asset restructuring 0 -152 0 0
Result from the sale of a business 16 37 0 0
Result from equity investments -5 -12 -2 -2
Result from operations – IFRS reported 83 30 -80 10
Operating margin in % – adjusted 10% 10% 4% 11%
Operating margin in % – reported 6% 1% -7% 0%
Result from operations – adjusted 133 384 53 227
Net financing result -59 -149 -66 -161
Income tax result -64 -81 21 18
Net result adjusted (continuing operations) 10 154 8 84
Results from discontinued operations 0 0 2 2
Net result - adjusted 10 154 10 86
Basic adjusted earnings per share (in EUR)
0,02 0,60 0,09 0,49
1) M&A related costs includes depreciation and amortization of purchase price allocated assets, integration, carve-out and acquisition related costs

Third Quarter Report 2021
ams-osram.com page 16/16
ams AG
Tobelbader Strasse 30
8141 Premstaetten, Austria
T +43 3136 500-0
ams-osram.com
This report is also available in German. All figures are unaudited.