Embed Size (px)
Citation preview

Third Quarter Of Fiscal Year 2013
Report
13 ‐ and 39 ‐ week periods ended December 1st, 2012


TABLE OF CONTENTS
MESSAGE TO SHAREHOLDERS ........................................................................................................................................ 4
MANAGEMENT’S DISCUSSION AND ANALYSIS ................................................................................................................ 6
1. GENERAL INFORMATION .................................................................................................................................6
2. DEFINITIONS ..................................................................................................................................................6
3. QUARTERLY RESULTS ....................................................................................................................................7
4. INFORMATION ON THE PJC NETWORK OF FRANCHISED STORES ......................................................................11
5. INVESTMENT IN RITE AID ..............................................................................................................................12
6. LIQUIDITY AND CAPITAL RESOURCES .............................................................................................................13
7. FINANCIAL INSTRUMENTS AND OFF-BALANCE SHEET ARRANGEMENTS ............................................................15
8. RELATED PARTY TRANSACTIONS ..................................................................................................................16
9. CRITICAL ACCOUNTING ESTIMATES ...............................................................................................................16
10. CHANGE IN ACCOUNTING POLICIES ................................................................................................................16
11. NON-IFRS FINANCIAL MEASURE ...................................................................................................................17
12. RISKS AND UNCERTAINTIES ..........................................................................................................................17
13. CHANGES IN INTERNAL CONTROL OVER FINANCIAL REPORTING ......................................................................17
14. STRATEGIES AND OUTLOOK ..........................................................................................................................18
15. FORWARD LOOKING STATEMENTS ................................................................................................................18
UNAUDITED CONDENSED CONSOLIDATED INTERIM FINANCIAL STATEMENTS .............................................................. 19
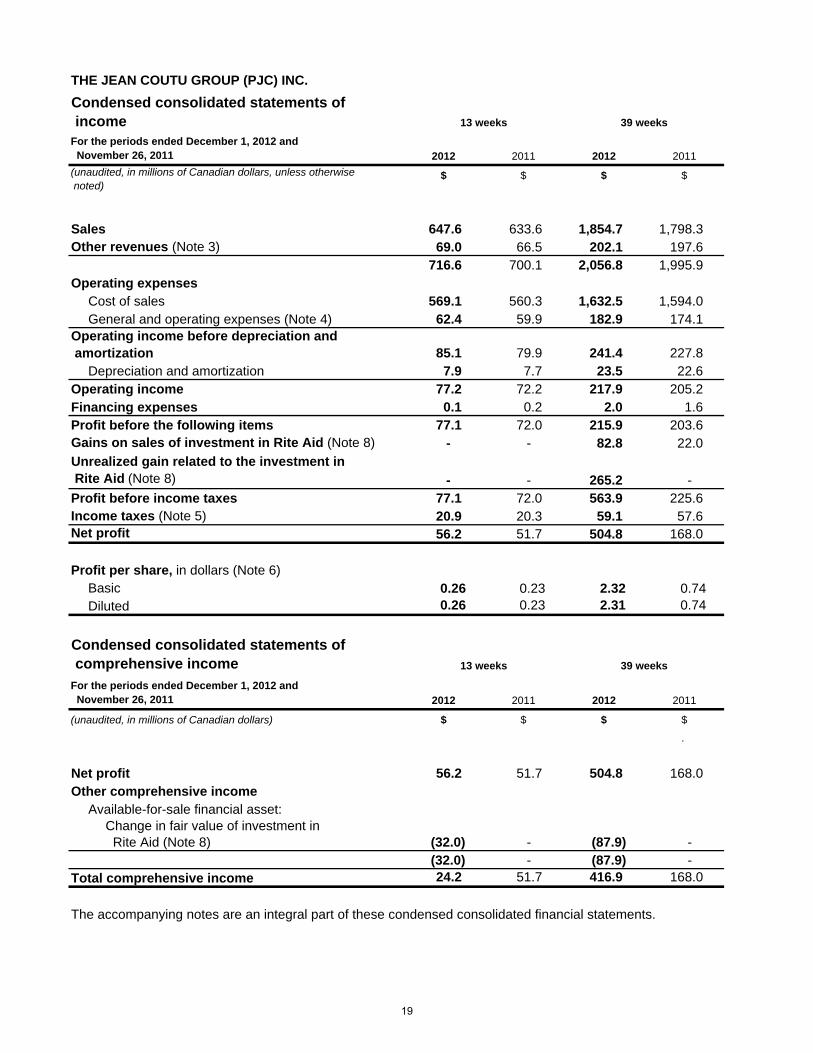
CONDENSED CONSOLIDATED STATEMENTS OF INCOME ............................................................................................19
CONDENSED CONSOLIDATED STATEMENTS OF CHANGES IN EQUITY .........................................................................20
CONDENSED CONSOLIDATED STATEMENTS OF FINANCIAL POSITION .........................................................................21
CONDENSED CONSOLIDATED STATEMENTS OF CASH FLOWS ....................................................................................22
NOTES TO THE CONDENSED CONSOLIDATED FINANCIAL STATEMENTS ....................................................................23
Throughout this document, The Jean Coutu Group (PJC) Inc. and its subsidiaries, unless otherwise indicated, are referred to as "Corporation", "Jean Coutu Group", "we" or "our". The Jean Coutu Group is one of the most trusted names in Canadian pharmacy retailing. The Corporation operates a network of 405 franchised stores located in the provinces of Québec, New Brunswick and Ontario under the banners of PJC Jean Coutu, PJC Clinique, PJC Jean Coutu Santé and PJC Jean Coutu Santé Beauté, and employs close to 19,000 people. Furthermore, the Jean Coutu Group owns Pro Doc Ltd ("Pro Doc"), a Québec-based subsidiary and manufacturer of generic drugs.
3

MESSAGE TO SHAREHOLDERS For the 13- and 39-week periods ended December 1st, 2012
To our shareholders: The Jean Coutu Group is pleased to report its financial results for the third quarter of fiscal year 2013 and the 39-week period ended December 1st, 2012. Revenues increased by 2.4% to $716.6 million during the third quarter of fiscal year 2013 compared with $700.1 million for the quarter ended November 26, 2011. During the 39-week period ended December 1st, 2012, revenues amounted to $2,056.8 million compared with $1,995.9 million during the comparable period of the previous fiscal year, a 3.1% increase. Operating income before depreciation and amortization ("OIBA") amounted to $85.1 million during the third quarter of fiscal year 2013 compared with $79.9 million for the same period of fiscal year 2012. Contribution of the generic drugs segment to the consolidated OIBA amounted to $16.1 million during the quarter ended December 1st, 2012, compared with $15.4 million for the comparable period of fiscal year 2012. During the 39-week period ended December 1st, 2012, OIBA amounted to $241.4 million compared with $227.8 million for the comparable period of fiscal year 2012. Contribution of the generic drugs segment to the consolidated OIBA amounted to $46.7 million for the 39-week period ended December 1st, 2012 compared with $41.2 million for the comparable period of fiscal year 2012. Net profit for the third quarter of fiscal year 2013 amounted to $56.2 million ($0.26 per share) compared with $51.7 million ($0.23 per share) for the quarter ended November 26, 2011. This increase is mainly attributable to the solid operational performance of the generic drugs segment as well as the franchising activities. Net profit for the 39-week period ended December 1st, 2012 amounted to $504.8 million ($2.32 per share) compared with $168.0 million ($0.74 per share) for the comparable period of fiscal year 2012. This increase in net profit is mainly attributable to gains of $348.0 million related to the investment in Rite Aid compared with a gain of $22.0 million for the comparable period of fiscal year 2012. As at December 1st, 2012, there were 405 stores in the PJC network of franchised stores. During the third quarter of fiscal year 2013, retail sales for the PJC network of franchised stores increased by 3.5% while on a same-store basis, sales gained 2.6%. During the 39-week period ended December 1st, 2012, retail sales for the PJC network of franchised stores increased by 3.7% while on a same-store basis, sales increased by 2.8% compared with the 39-week period ended November 26, 2011. The Board of the Jean Coutu Group declared a quarterly dividend of $0.07 per share. This dividend will be paid on February 8, 2013, to all holders of Class "A" subordinate voting shares and holders of Class "B" shares listed in the Corporation’s shareholder ledger as of January 25, 2013.
4

"We are very satisfied with the results of the third quarter of fiscal 2013 and with the excellent performance of our network whose sales have reached over one billion dollars during this period. The contribution of our affiliated pharmacists and their employees is essential to the success of our organization" said the President and Chief Executive Officer, Mr. François J. Coutu. "In addition, the notable positive results of Rite Aid during the quarter ended December 1st, 2012 allow us to look forward to next year with optimism." Yours truly, /s/ François J. Coutu François J. Coutu President and Chief Executive Officer
5

MANAGEMENT’S DISCUSSION AND ANALYSIS 1. GENERAL INFORMATION
Throughout this document, The Jean Coutu Group (PJC) Inc. and its subsidiaries, unless otherwise indicated, are referred to as "Corporation", "Jean Coutu Group", "we" or "our". The Jean Coutu Group is one of the most trusted names in Canadian pharmacy retailing. As at December 1st, 2012, the Corporation operates a network of 405 franchised stores located in the provinces of Québec, New Brunswick and Ontario under the banners of PJC Jean Coutu, PJC Clinique, PJC Jean Coutu Santé and PJC Jean Coutu Santé Beauté and employs close to 19,000 people. Furthermore, the Jean Coutu Group owns Pro Doc Ltd ("Pro Doc"), a Québec-based subsidiary and manufacturer of generic drugs. The Corporation also holds a 19.7% interest in Rite Aid Corporation ("Rite Aid") a national chain of drugstores in the United States with more than 4,600 stores in 31 states and the District of Columbia. This management’s discussion and analysis (“MD&A”) provides the reader with a review and analysis, from the perspective of management, of the Corporation's financial results for the third quarter of fiscal year 2013. This MD&A should be read in conjunction with the Corporation's unaudited condensed consolidated interim financial statements for the third quarter of fiscal year 2013, its annual audited Consolidated Financial Statements and its annual MD&A for fiscal year 2012. All financial information has been prepared in accordance with Canadian generally accepted accounting principles ("GAAP"), as set out in the Handbook of the Canadian Institute of Chartered Accountants – Part 1, which incorporates International Financial Reporting Standards ("IFRS") as issued by the International Accounting Standards Board ("IASB"). The Corporation’s reporting calendar is based on the US National Retail Federation 4-5-4 merchandising calendar. Accordingly, the Corporation’s fiscal year is usually 52 weeks in duration but includes a 53rd week every 5 or 6 years. The fiscal year ending March 2, 2013 will contain 52 weeks while the fiscal year ended March 3, 2012 contained 53 weeks. The quarters ended December 1st, 2012 and November 26, 2011 each contained 13 weeks. Unless otherwise indicated, all amounts are in Canadian dollars. 2. DEFINITIONS Segmented information Until April 20, 2012, the Corporation had three reportable operating segments: franchising, generic drugs and an investment in Rite Aid, an investment in an associate, which operates in the United States. On April 20, 2012, following the loss of significant influence over Rite Aid, the investment in Rite Aid ceased to be a reportable operating segment. Readers are referred to section 5 "Investment in Rite Aid" of this MD&A for further information on the Corporation's loss of significant influence over Rite Aid. Consequently, since that date, the Corporation has two reportable operating segments: franchising and generic drugs. Within the franchising segment, the Corporation carries on the franchising activity under the banners of PJC Jean Coutu, PJC Clinique, PJC Jean Coutu Santé and PJC Jean Coutu Santé Beauté, operates two distribution centres and coordinates several other services for the benefit of its franchisees. Within the generic drugs segment, the Corporation owns Pro Doc, a Canadian manufacturer of generic drugs whose revenues come from the sale of generic drugs to wholesalers and pharmacists. Both reportable operating segments of the Corporation are in the Canadian geographic area. Revenues – Franchising Revenues consist of sales and other revenues derived from franchising activities. Merchandise sales to PJC franchisees, mostly through our distribution centres, account for the major part of our revenues. Retail sales of the PJC franchised stores are not included in our revenues. However, any change in their retail sales directly affects our revenues since PJC franchisees purchase most of their inventory from our distribution centres. Other revenues consist of royalties from franchisees based on a percentage of their retail sales, rental revenues and revenues from certain services rendered to franchisees.
6

Revenues – Generic drugs Revenues consist of generic drugs’ sale of the subsidiary Pro Doc. 3. QUARTERLY RESULTS QUARTERLY CONSOLIDATED FINANCIAL INFORMATION – UNAUDITED The following table presents selected data and operating results for the quarters and for the 39-week periods ended December 1st, 2012 (Q3-2013) and November 26, 2011 (Q3-2012). 13 weeks 39 weeks
(unaudited, in millions of dollars, except per share amounts) Q3-2013 Q3-2012 2013 2012
$ $ $ $Sales 647.6 633.6 1,854.7 1,798.3
Other revenues 69.0 66.5 202.1 197.6
Revenues (1) 716.6 700.1 2,056.8 1,995.9
Gross profit 78.5 73.3 222.2 204.3
Operating income before amortization ("OIBA"):
Franchising 69.0 64.5 194.7 186.6
Generic drugs 19.7 17.2 51.4 40.9
Intersegment eliminations (3.6) (1.8) (4.7) 0.3
85.1 79.9 241.4 227.8
Financing expenses 0.1 0.2 2.0 1.6
Gains on sales of investment in Rite Aid - - 82.8 22.0
Unrealized gain related to the investment in Rite Aid - - 265.2 -
Income tax 20.9 20.3 59.1 57.6Net profit
Per share: Basic Diluted
56.2
0.260.26
51.7
0.23 0.23
504.8
2.322.31
168.0
0.740.74
Net profit before gains related to the investment in Rite Aid and change in fair value of other financial assets (2) 56.2 51.2 157.9 145.4
Per share, basic(2) 0.26 0.23 0.72 0.64(1) Revenues include sales and other revenues. (2) Readers are referred to section 11 "Non-IFRS financial measure" of this MD&A for further information on this measure. COMPARISON OF THE CONSOLIDATED QUARTERLY AND YEAR TO DATE RESULTS FOR THE PERIODS ENDED
DECEMBER 1ST, 2012 (Q3-2013) AND NOVEMBER 26, 2011 (Q3-2012) Readers are referred to the "Modifications decreed by competent authorities with respect to drug pricing" at the end of this section for details on the changes in drug pricing. Revenues Revenues amounted to $716.6 million during the quarter ended December 1st, 2012 compared with $700.1 million during the quarter ended November 26, 2011, a 2.4% increase. During the 39-week period ended December 1st, 2012, revenues amounted to $2,056.8 million compared with $1,995.9 million during the comparable period of the previous fiscal year, a 3.1% increase. This increase is attributable to the market's general growth and the expansion of the PJC network of franchised stores despite the deflationary impact of the introduction of generic version of some drugs and the price reductions of generic drugs previously decreed by the Québec Government.
7

Gross profit In the third quarter of fiscal year 2013, gross profit amounted to $78.5 million compared with $73.3 million during the third quarter of the previous fiscal year, an increase of 7.1%. For the quarter ended December 1st, 2012, gross profit calculated as percentage of sales was 12.1% compared with 11.6% during the same quarter of the previous fiscal year. Gross profit calculated as percentage of sales for the 39-week period ended December 1st, 2012 was 12.0% compared with 11.4% for the comparable period of the previous fiscal year. The increase of the gross profit is attributable to the additional gross profit generated by generic drugs segment's operations, despite the price reductions of generic drugs decreed by the Québec Government. Furthermore, this increase in gross profit is attributable to the increase in the maximum rate of the drug wholesalers’ margin from 6.0% to 6.25% in April 2011 and from 6.25% to 6.5% in April 2012 as well as to the solid performance of the franchising activities. Consolidated OIBA As a percentage of revenues, OIBA amounted to 11.9% for the third quarter of fiscal year 2013, compared to 11.4% for the same quarter of the previous fiscal year. See below for details by operating segments. OIBA – franchising segment OIBA of the franchising segment increased by $4.5 million to $69.0 million during the third quarter of fiscal year 2013 compared with $64.5 million during the same quarter of fiscal year 2012. For the 39-week period ended December 1st, 2012, OIBA of the franchising segment increased by $8.1 million and amounted to $194.7 million compared with $186.6 million for the comparable period of fiscal year 2012. This increase is attributable to the overall market growth and to the expansion of the PJC network of franchised stores. OIBA – generic drugs segment OIBA of the generic drugs segment, net of intersegment eliminations, increased by $0.7 million and amounted to $16.1 million for the third quarter of fiscal year 2013, compared with $15.4 million for the same quarter of fiscal year 2012. For the 39-week period ended December 1st, 2012, OIBA of the generic drugs segment, net of intersegment eliminations, increased by $5.5 million and amounted to $46.7 million, compared with $41.2 million for the comparable period of fiscal year 2012. This increase is mostly attributable to the introduction of generic version of some drugs despite the price reductions of generic drugs decreed by the Québec Government. Financing expenses Financing expenses amounted to $0.1 million during the third quarter of fiscal year 2013, compared with $0.2 million during the same quarter of fiscal year 2012. This change is basically attributable to two factors. First, the recording of a $0.5 million increase in the fair value of third party asset backed commercial paper during the quarter ended November 26, 2011 whereas the Corporation no longer held any third party asset backed commercial paper during the quarter ended December 1st, 2012. Furthermore, following the reduction of the long-term debt level, interest expense decreased from $0.7 million for the quarter ended November 26, 2011 to $0.1 million for the quarter ended December 1st, 2012. For the 39-week period ended December 1st, 2012, the financing expenses amounted to $2.0 million compared with $1.6 million during the comparable period of fiscal year 2012. This change is mainly attributable to two factors. First, the recording of a decrease in value of third party asset backed commercial paper of $1.1 million during the 39-week period ended December 1st, 2012 compared with a $0.6 million increase in value of other financial assets recorded during the comparable period for fiscal year 2012. Furthermore, following the reduction of the long-term debt level, interest expense decreased from $2.0 million for the 39-week period ended November 26, 2011 to $0.7 million for the 39-week period ended December 1st, 2012. Gains related to the investment in Rite Aid During quarter ended December 1st, 2012, the Corporation has not sold any common shares of Rite Aid. During the 39-week period ended December 1st, 2012, the Corporation sold 56,000,000 common shares of Rite Aid compared with 17,574,100 shares during the comparable period of the previous fiscal year. The 56,000,000 shares sold during the 39-week period ended December 1st, 2012 were sold for a total consideration of $82.8 million, net of related costs. The 17,574,100 shares sold during the 39-week period ended November 26, 2011 were sold for a total consideration of $22.0 million, net of related costs. These sales generated a gain equal to the consideration received for each of the mentioned periods since the carrying value of the investment in Rite Aid had previously been written off. The sale of Rite Aid shares that occurred in the first quarter of fiscal year 2013 resulted in the loss of significant influence of the Corporation over Rite Aid. Consequently, this investment, which was previously considered as
8

an investment in an associate and accounted for under the equity method, is now considered as an available-for-sale investment and is accounted for at fair value. This change generated a non-cash gain of $265.2 million in the Corporation’s consolidated statement of income for the 39-week period ended December 1st, 2012, which was the fair value of the 178,401,162 common shares that the Corporation owned at the date of its loss of significant influence. The sale of shares and the loss of significant influence together generated a total gain on investment in Rite Aid of $348.0 million for the 39-week period ended December 1st, 2012. Since the loss of significant influence, changes in the fair value of the investment in Rite Aid are accounted for in the Corporation’s consolidated statement of comprehensive income. Income tax Income tax expense amounted to $20.9 million for the third quarter of fiscal year 2013, compared with $20.3 million for the same quarter of fiscal year 2012. For the quarter ended December 1st, 2012, the effective income tax rate was 27.1% compared to 28.2% for the comparable period of the previous fiscal year. Income tax expense amounted to $59.1 million for the 39-week period ended December 1st, 2012, compared with $57.6 million for the comparable period of fiscal year 2012, representing effective income tax rates of 10.5% and 25.5%, respectively. For the 39-week periods ended December 1st, 2012 and November 26, 2011, the difference between the statutory income tax rate and the effective tax rate as well as the change in effective tax rates are mainly attributable to the impact of the difference between the carrying and the tax base amounts of the investment in Rite Aid for which no deferred tax asset had been recorded. Therefore no income taxes were recorded in respect to the gains related to the investment in Rite Aid during the 39-week periods ended December 1st, 2012 and November 26, 2011. Also, the decrease in the Federal statutory income tax rate contributed to reduce the effective tax rate during the 39-week period ended December 1st, 2012. Net profit Net profit during the quarter ended December 1st, 2012 amounted to $56.2 million ($0.26 per share) compared with $51.7 million ($0.23 per share) during the same quarter of fiscal year 2012. Net profit before gains related to the investment in Rite Aid and change in fair value of other financial assets amounted to $56.2 million ($0.26 per share) for the third quarter of fiscal year 2013 compared with $51.2 million ($0.23 per share) for the same period of the previous fiscal year. This $5.0 million increase is mainly attributable to the solid operational performance of generic drugs segment and of franchising activities. Readers are referred to section 11 "Non-IFRS financial measure" of this MD&A for further detail on the net profit before gains related to the investment in Rite Aid and change in fair value of other financial assets. Net profit during the 39-week period ended December 1st, 2012 amounted to $504.8 million ($2.32 per share) compared with $168.0 million ($0.74 per share) during the comparable period of fiscal year 2012. The increase in net profit is mainly attributable to the recording of $348.0 million gains related to Rite Aid during the 39-week period ended December 1st, 2012 compared with $22.0 million gains related to Rite Aid during the 39-week period ended November 26, 2011. Net profit before gains related to the investment in Rite Aid and change in fair value of other financial assets amounted to $157.9 million ($0.72 per share) for the 39-week period ended December 1st, 2012, compared with $145.4 million ($0.64 per share) for the comparable period of the previous fiscal year. This $12.5 million increase is mainly attributable to the solid operational performance of generic drugs segment and franchising activities. Readers are referred to section 11 "Non-IFRS financial measure" of this MD&A for further detail on the net profit before gains related to the investment in Rite Aid and change in fair value of other financial assets.
9

SELECTED CONSOLIDATED QUARTERLY FINANCIAL INFORMATION – UNAUDITED (unaudited, in millions of dollars,
except per share amounts) Q3-2013 Q2-2013 Q1-2013 Q4-2012(1) Q3-2012 Q2-2012 Q1-2012 Q4-2011 $ $ $ $ $ $ $ $
Revenues Franchising 715.7 657.4 680.4 736.2 698.7 634.6 659.5 657.9Generic drugs 42.1 33.5 34.0 35.5 34.2 24.9 29.4 23.5Intersegment sales (41.2) (32.2) (32.9) (34.5) (32.8) (24.3) (28.3) (21.6)
716.6 658.7 681.5 737.2 700.1 635.2 660.6 659.8Operating income before
depreciation and amortization ("OIBA")
Franchising 69.0 61.5 64.2 66.1 64.5 58.5 63.6 60.5Generic drugs 19.7 15.7 16.0 17.2 17.2 10.2 13.5 11.4Intersegment eliminations (3.6) (0.3) (0.8) 0.1 (1.8) 2.1 - 2.7
85.1 76.9 79.4 83.4 79.9 70.8 77.1 74.6
Net profit 56.2 51.2 397.4 62.0 51.7 66.4 49.9 46.5
Per share, basic and diluted 0.26 0.23 1.81 0.28 0.23 0.29 0.22 0.20
(1) Q4-2012 was a 14-week period.
There has been a progression in the Corporation’s revenues and OIBA for each comparable quarter shown above, which is mainly attributable to overall market growth and the expansion of the PJC network of franchised stores, despite the deflationary impact on revenues from the introduction of the generic version of some drugs, and the price reductions of generic drugs decreed by the Québec Government (see below). The Corporation's net profit for Q1-2013 included gains related to the investment in Rite Aid of $348.0 million. Readers are referred to section 5 "Investment in Rite Aid" for more information on these gains. The Corporation's net profit for Q4-2012 included a reversal of $8.1 million of tax provisions. The Corporation's net profit for Q2-2012 included a gain on sale of shares of Rite Aid of $22.0 million. Modifications decreed by competent authorities with respect to drug pricing During the last quarters, several changes were made to drug pricing. First, in November 2010, the ''Conseil du Médicament du Québec'' published a notice to generic drugs manufacturers regarding transition measures to respect Canada’s best price established in the context of the price reduction of generic drugs in 2010 in Ontario. This notice stated future transition measures to help manufacturers adapt to this new regulatory environment, which are summarized as follows:
From December 17, 2010 to April 19, 2011, if Canada’s best price established for a generic product was equal to or less than 37.5% of the price of the brand name drug in Québec, it was allowed that the generic product price reached 37.5% of the price of the brand name drug.
From April 19, 2011 until April 19, 2012, if Canada’s best price established for a generic product was equal to or less than 30% of the price of the brand name drug in Québec, it was allowed that the generic product price reached 30% of the price of the brand name drug.
Since April 20, 2012, generic product prices cannot be higher than any selling price granted to other provincial drug insurance programs.
Also, a Regulation on benefits authorized for pharmacists was modified on March 23, 2011 by the Government of Québec, to lower the maximum rate of the authorized professional allowance, which was 20% of the total value of sales of generic drugs by the manufacturer before April 2011 to 16.5% from April 2011 until April 2012, and, to 15% since April 2012. Furthermore, a Regulation on the conditions on which manufacturers and wholesalers of medications shall be recognized was modified on March 7, 2011 by the Minister of Health and Social Services of Québec, to increase the maximum rate of the drug wholesalers’ margin which was at 6% of the manufacturer's guaranteed selling
10

price in relation to the package size purchased before April 2011 to 6.25% in April 2011 and to 6.5% in April 2012. 4. INFORMATION ON THE PJC NETWORK OF FRANCHISED STORES Within the franchising segment, the Corporation carries on the franchising activity under the banners of PJC Jean Coutu, PJC Clinique, PJC Jean Coutu Santé and PJC Jean Coutu Santé Beauté, operates two distribution centres and coordinates several other services for the benefit of its franchisees. These services comprise centralized purchasing, distribution, marketing, training, human resources, management, operational consulting and information systems, as well as a private label program. The PJC franchisees manage their store and are responsible for merchandising and financing their inventory. They must provision their store from our distribution centres, providing that products ordered are available. The PJC franchised stores' financial results are not included in the Corporation's Consolidated Financial Statements. Expansion of the PJC network of franchised stores As at December 1st, 2012, there were 405 franchised stores in the PJC network compared with 402 as at September 1st, 2012 and 399 as at March 3, 2012. During the third quarter of fiscal year 2013, there were 5 store openings in the PJC network of franchised stores, including 1 relocation, and the closing of 1 store, compared with 2 openings including 1 relocation for the third quarter of the previous fiscal year. During the 39-week period ended December 1st, 2012, there were 13 store openings in the PJC network of franchised stores, including 5 relocations, and the closing of 2 stores, compared with 14 openings, including 7 relocations, and the closing of 1 store for the comparable period last year. NETWORK PERFORMANCE - UNAUDITED
(unaudited) 13 weeks 39 weeks
Q3-2013 Q3-2012 2013 2012
Retail sales (in millions of dollars) $1,018.7 $984.3 $2,992.5 $2,884.6 Retail sales per square foot (in dollars) (1) $1,315 $1,308
Retail sales per sector (in percentage) Pharmacy, prescription drugs 63.7% 63.6% 63.6% 63.3% Front-end, non-prescription drugs 8.9% 9.0% 8.6% 8.8% Front-end, general merchandise 27.4% 27.4% 27.8% 27.9%
Retail sales growth (in percentage)
Total stores Total 3.5% 4.1% 3.7% 3.4% Pharmacy 3.7% 4.2% 4.2% 3.2% Front-end 2.8% 3.5% 2.8% 3.5%
Same store (2) Total 2.6% 2.6% 2.8% 1.5% Pharmacy 2.7% 2.6% 3.2% 1.2% Front-end 2.0% 2.3% 2.1% 2.0%
Prescriptions growth (in percentage) Total stores 5.9% 7.0% 6.2% 7.6% Same store (2) 4.8% 5.4% 5.1% 5.4%
(1) The last 12-month store sales are divided by the weighted average square footage for this period. (2) Same store means a store that operated throughout the current fiscal year as well as the previous fiscal year.
Retail sales increase reflects overall market growth and openings, renovations and relocations of franchised stores of the PJC network. During the third quarter of fiscal year 2013, on a same-store basis, PJC network retail sales grew by 2.6%, pharmacy sales gained 2.7% and front-end sales increased by 2.0% compared with the same period of last year. During the quarter ended December 1st, 2012, sales of non-prescription drugs, which represented 8.9% of
11

total retail sales, increased by 2.2%. These sales had increased by 1.6% during the third quarter of the previous fiscal year. During the 39-week ended December 1st, 2012, on a same-store basis, PJC network retail sales grew by 2.8%, pharmacy sales gained 3.2% and front-end sales increased by 2.1% compared with the comparable period of last year. During the 39-week period ended December 1st, 2012, sales of non-prescription drugs, which represented 8.6% of total retail sales, increased by 2.2%. These sales had increased by 3.6% during the comparable period last year. Generic drugs reached 61.8% of prescriptions during the third quarter of fiscal year 2013 compared with 57.2% during the third quarter of the previous fiscal year. The increase in the number of generic drugs’ prescriptions with lower selling prices than branded drugs had a deflationary impact on the pharmacy’s retail sales. Therefore, the introduction of new generic drugs reduced pharmacy’s retail sales growth by 2.3% and the price reduction of generic drugs decreed by the Québec Government reduced pharmacy’s retail sales growth by 1.0% during the third quarter of fiscal year 2013. 5. INVESTMENT IN RITE AID In accordance with the provisions of Rule 144 under the Securities Act of 1933, on July 5, 2011, the Corporation filed a notice confirming its intent to dispose approximately 25,000,000 common shares of Rite Aid. For the 39-week period ended November 26, 2011, the Corporation sold 17,574,100 common shares of Rite Aid for a total consideration of $22.0 million (US$22.9 million), net of related costs. Consequently, for the 39-week period ended November 26, 2011, a $22.0 million gain was recorded in the Corporation’s consolidated statement of income since the carrying value of the investment in Rite Aid was previously written-off. No shares of Rite Aid were sold by the Corporation during the third quarter of fiscal year 2012. In accordance with the provisions of Rule 144 under the Securities Act of 1933, the Corporation filed on April 17, 2012 a notice confirming its intent to dispose up to 56,000,000 of its 234,401,162 common shares of Rite Aid held at that date. On April 20, 2012, the Corporation completed the sale of these 56,000,000 common shares. These shares were sold at an average price of US$1.51 per share for a total proceed of $82.8 million (US$83.6 million), net of related costs. Consequently, a gain of $82.8 million was recorded in the Corporation’s consolidated statement of income for the 39-week period ended December 1st, 2012 since the carrying value of the investment in Rite Aid was previously written-off. No shares of Rite Aid were sold by the Corporation during the third quarter of fiscal year 2013. On April 20, 2012, following the sale of the 56,000,000 shares of Rite Aid, the Corporation's interest in Rite Aid's outstanding common shares has decreased to 19.85% (26.1% as at March 3, 2012) and, as stipulated in the stockholder agreement between the Corporation and Rite Aid, the number of the Corporation’s representatives on Rite Aid’s Board of Directors was reduced from 3 to 2 members and the Corporation lost its representation on the Executive Committee of Rite Aid. The Corporation concluded that this generated a loss of significant influence of the Corporation over Rite Aid and, according to the IFRS, changed the accounting of the investment in Rite Aid. This investment, which was previously considered as an investment in an associate and accounted for under the equity method, is now considered as an available-for-sale investment and is accounted for at fair value. This change generated a non-cash gain of $265.2 million (US$267.6 million) in the Corporation’s consolidated statement of income for the 39-week period ended December 1st, 2012, which was the fair value of the 178,401,162 common shares that the Corporation owned at the date of its loss of significant influence. Subsequent changes in the fair value of the investment in Rite Aid are accounted for in the Corporation’s consolidated statement of comprehensive income. As a result, for the 13- and 39-week periods ended December 1st, 2012, the Corporation recorded losses of $32.0 and $87.9 million in fair value in the consolidated statement of comprehensive income, respectively. As at December 1st, 2012, the Corporation held 178,401,162 common shares of Rite Aid (an interest of 19.7%) and the fair value of the investment was $177.3 million.
12

6. LIQUIDITY AND CAPITAL RESOURCES LIQUIDITY The Corporation’s cash flows are generated by: i) merchandise sales and rental revenues from PJC franchised stores, ii) royalties paid by PJC franchisees and iii) rent from properties leased to third parties other than franchisees. These cash flows are used: i) to purchase products for resale and to pay services, ii) to finance operating expenses, iii) for real estate investments, iv) to finance capital expenditures incurred to renovate and open stores and replace equipment and v) for debt service. The Corporation has typically financed capital expenditures and working capital requirements through cash flows from operating activities. SELECTED CONSOLIDATED INFORMATION ON LIQUIDITY – UNAUDITED The following table presents selected information from the consolidated statements of cash flows for the 13- and 39-week periods ended December 1st, 2012 and November 26, 2011. 13 weeks 39 weeks (unaudited, in millions of dollars) Q3-2013 Q3-2012 2013 2012
$ $ $ $Cash flow generated by operating activities 72.5 62.3 166.7 171.3Cash flow related to investing activities (9.2) (7.5) 69.1 (0.5)Cash flow related to financing activities (68.7) (62.8) (249.8) (174.2) COMPARISON OF THE CONSOLIDATED INFORMATION ON LIQUIDITY FOR QUARTERS ENDED DECEMBER 1ST, 2012 AND
NOVEMBER 26, 2011 Cash flow related to operating activities Cash provided by operating activities amounted to $72.5 million during the third quarter of fiscal year 2013 compared with $62.3 million during the same period of fiscal year 2012. This $10.2 million increase is essentially due to the increase of the Corporation’s OIBA and a smaller income tax amount paid. Readers are referred to Note 10 of the Corporation's unaudited condensed consolidated interim financial statements for the quarter ended December 1st, 2012, for a listing of the net changes in non-cash asset and liability items. Cash flow related to investing activities Cash used by investing activities during the third quarter of fiscal year 2013 amounted to $9.2 million compared with $7.5 million during the same period of fiscal year 2012. During the third quarter of fiscal year 2013, $6.8 million were used to acquire property and equipment and $3.3 million were used for intangible assets, whereas, during the comparable quarter of fiscal year 2012, $4.8 million were used to acquire property and equipment and $0.6 million for intangible assets. During the third quarter of fiscal year 2013, 5 stores were opened in the PJC franchised stores network, including 1 relocation and 5 stores were expanded or significantly renovated, compared with 2 openings, including 1 relocation and 8 stores expanded or significantly renovated during the third quarter of the previous fiscal year. Cash flow related to financing activities Cash used for financing activities during the third quarter of fiscal year 2013 amounted to $68.7 million compared with $62.8 million during the same period of fiscal year 2012. During the third quarter of fiscal year 2013, $35.0 million were used to repay the Corporation’s revolving credit facility compared with $19.9 million during the third quarter of fiscal year 2012. Furthermore, during the third quarter of fiscal year 2013, $18.8 million were used to repurchase Class "A" subordinate voting shares compared with $28.8 million during the same quarter of fiscal year 2012. The Corporation paid a quarterly dividend of $0.07 per Class "A" subordinate voting share and Class "B" share during the third quarter of fiscal year 2013 for a total of $15.2 million (annualized dividend of $0.28 per share). During the third quarter of fiscal year 2012, the Corporation paid a quarterly dividend of $0.06 per Class "A" subordinate voting share and Class "B" share, totaling $13.3 million (annualized dividend of $0.24 per share).
13

THIRD PARTY ASSET-BACKED COMMERCIAL PAPER (“ABCP”) On July 24, 2012, the Corporation sold all of its ABCP for a total consideration of $17.8 million. The nominal value of these ABCP amounted to $23.4 million. Since ABCP were accounted for at fair value through the consolidated profit or loss, a $1.1 million loss in value related to these notes was recorded during the 39-week period ended December 1st, 2012, compared with a $0.5 million increase in value for the comparable period of fiscal year 2012. INVESTMENT IN A JOINT VENTURE On November 30, 2012, the Corporation acquired a 50% interest in Le Groupe Médicus Inc., a corporation specialized in orthotic and prosthetic devices. This investment is recognized as a joint venture being a jointly controlled entity accounted for using the equity method. LONG-TERM DEBT On December 1st, 2012, the Corporation was engaged in a $500.0 million unsecured revolving credit facility maturing on November 10, 2017. As at December 1st, 2012, the long-term debt was unused except for $0.3 million of letters of credit compared with a long-term debt (including the short term portion) of $149.9 million as at March 3, 2012 (of the $700.0 million available as at March 3, 2012). As at December 1st, 2012, an amount of $0.3 million of the $500.0 million available through the credit facility maturing November 10, 2017 was used ($150.3 million of the $700.0 million available on the credit facilities as at March 3, 2012 was used.) The Corporation does not expect any liquidity issues. The Corporation's has cash flows generated by its operating activities and has access to a credit facility in order to finance its projects. As at December 1st, 2012, all of its bank covenants were respected. OPERATING LEASE OBLIGATIONS The Corporation leases a substantial portion of its buildings using conventional operating leases. Generally, the Corporation’s real estate leases are for primary terms of 5 to 20 years with renewing options. For further details, readers are referred to Note 27 of the Corporation's Consolidated Financial Statements of fiscal year 2012. CAPITAL STOCK On May 3, 2012, the Corporation announced its intention to repurchase for cancellation, when it is considered advisable, up to 9,398,000 of its outstanding Class "A" subordinate voting shares, representing approximately 10% of the current public float of such shares, over a 12-month period ending no later than May 6, 2013. The shares were or will be repurchased through the facilities of the Toronto Stock Exchange and in accordance with its requirements. On May 2, 2011, the Corporation announced its intention to repurchase for cancellation, up to 10,400,000 of its outstanding Class "A" subordinate voting shares, representing approximately 10% of the current public float of such shares, over a 12-month period ending no later than May 3, 2012. The shares were repurchased through the facilities of the Toronto Stock Exchange and in accordance with its requirements. On April 29, 2010, the Corporation announced its intention to repurchase for cancellation, up to 11,110,000 of its outstanding Class "A" subordinate voting shares, representing approximately 10% of the current public float of such shares, over a 12-month period ending no later than May 3, 2011. During the term of this repurchase program, 6,819,900 shares have been repurchased through the facilities of the Toronto Stock Exchange and in accordance with its requirements. These 6,819,900 shares were all repurchased and cancelled during fiscal year 2011 except for 287,200 shares that were cancelled during the first quarter of fiscal year 2012. For the 13- and 39-week periods ended December 1st, 2012, the Corporation repurchased 1,291,700 and 3,878,800 Class "A" subordinate voting shares at average prices of $14.75 and $14.89 per share for total considerations of $19.0 million and $57.7 million including related costs, respectively. Amounts of $12.1 million
14

and $37.0 million representing the excess of the purchase price over the carrying value of the repurchased shares were included in retained earnings for the 13- and 39-week periods ended December 1st, 2012, respectively. The shares repurchased during the 39-week period ended December 1st, 2012 were cancelled during that period, except for 133,400 shares that were cancelled after December 1st, 2012. For the 13- and 39-week periods ended November 26, 2011, the Corporation repurchased 1,546,100 and 9,465,550 Class "A" subordinate voting shares at an average price of $12.58 and $11.80 per share for a total consideration of $19.4 million and $111.7 million including related costs, respectively. Amounts of $11.2 million and $61.2 million representing the excess of the purchase price over the carrying value of the repurchased shares were included in retained earnings for the 13- and 39-week periods ended November 26, 2011, respectively. The shares repurchased during the 39-week period ended November 26, 2011 were cancelled during that period, except for 86,600 shares that were cancelled after November 26, 2011. For the 13- and 39-week periods ended December 1st, 2012, 64,900 and 204,500 Class "A" subordinate voting shares, respectively, were issued following stock option exercises compared with 57,800 shares issued following stock option exercises for the 13- and 39- week periods ended November 26, 2011. At the Corporation’s Annual General Meeting of Shareholders that was held on July 10, 2012, the shareholders approved an amendment to the Corporation’s stock option plan that increased by 2,000,000 the total number of Class "A" subordinate voting shares authorized for issuance under the stock option plan, bringing this number to 10,000,000 shares. As at December 1st, 2012, the total number of Class "A" subordinate voting shares (TSX: PJC.A.) issued and outstanding was 101.2 million (104.8 million as at March 3, 2012), and the number of Class "B" shares was 114.4 million (114.4 million as at March 3, 2012). Thus, the total number of outstanding shares was 215.6 million as at December 1st, 2012, compared with 219.2 million as at March 3, 2012. CONTRACTUAL OBLIGATIONS AND COMMERCIAL COMMITMENTS Readers are referred to the table of the Corporation's main contractual cash obligations under its long-term debt, leases, services and capital assets commitments included in the Corporation’s annual MD&A of the fiscal year 2012. 7. FINANCIAL INSTRUMENTS AND OFF-BALANCE SHEET ARRANGEMENTS The Corporation does not use any off-balance sheet arrangements that currently have, or are reasonably likely expected to have, a material effect on its financial condition, financial performance or cash flow. The Corporation uses operating leases for many of its properties, and, from time to time, engages in sale-leaseback transactions for financing purposes. In its normal course of business, the Corporation is exposed to a certain interest rate fluctuation risk, due to its variable rate financial obligations. Depending on the surrounding market's interest rate, the Corporation may, in the future, use derivative financial instruments or other interest rate management vehicles. Readers are referred to Note 30 of the Corporation's Consolidated Financial Statements for fiscal year 2012 for further information on other risks related to financial instruments to which the Corporation is exposed to. Guarantees and buyback agreements On June 4, 2007, the Corporation sold its US Operations to Rite Aid. As part of this transaction, the Corporation agreed to enter into certain customary indemnification obligations in favour of the purchaser in case of eventual breach of representations or warranties stipulated in the stock purchase agreement. Those representations or warranties refer to issues such as taxes and other indemnification obligations related to facts, circumstances or conditions in existence prior to June 4, 2007 with respect to the stock purchase agreement and other related agreements entered into with J.C. Penney Corporation, Inc. on July 31, 2004. Some of the indemnification guarantees are not limited in time. In addition, certain portions of the Corporation's indemnification guarantees are capped at US$450 million, while other provisions are not subject for such a limit.
15

As at December 1st, 2012, there were no ongoing tax audits regarding the US operations sold to Rite Aid. The tax audits that were underway at March 3, 2012 have resulted in settlements whose amounts are not significantly different from the Corporation’s provisions for potential tax indemnification at that date. The Corporation is unable to estimate potential liability for other types of indemnification guarantees as these amounts are dependent upon the outcome of future contingent events, for which the nature and likelihood cannot be determined at this time. As at December 1st, 2012, the Corporation had guaranteed the reimbursement of certain bank loans contracted by franchisees for a maximum amount of $0.5 million. Most of those guarantees apply to loans with a maximum maturity of one year. These loans are also personally guaranteed by the franchisees. The Corporation has also entered into commitments with financial institutions to buy back the equipment and inventories of some of its franchisees under certain conditions. As at December 1st, 2012, financing related to the equipment and inventories buyback agreements were $78.8 million and $140.2 million, respectively. Historically, the Corporation has not made any indemnification payments under such agreements and no amounts have been accrued with respect to these guarantees in its December 1st, 2012 Consolidated Financial Statements. 8. RELATED PARTY TRANSACTIONS Franchising activities include transactions with franchised stores controlled by executives with significant influence over the Corporation or close member of these executives’ family. The transactions between the Corporation and these enterprises are carried out in the normal course of business and are made under the same terms and conditions as those made with other franchisees. Readers are referred to Note 29 of the Corporation’s Consolidated Financial Statements for fiscal year 2012 for further information on related party transactions and for the detail on the key management personnel compensation. As at December 1st, 2012, Mr. Jean Coutu held the ultimate control of the Jean Coutu Group (PJC) Inc. 9. CRITICAL ACCOUNTING ESTIMATES This MD&A is based on the Corporation's Consolidated Financial Statement prepared according to IFRS. The preparation of the Consolidated Financial Statements requires management to make certain judgments, estimates and assumptions, which may affect the reported amounts of assets and liabilities and the disclosure of contingent assets and liabilities at the date of the Consolidated Financial Statements. They may also affect the reported amounts of revenues and expenses during the reporting period. Actual results could differ from those estimates. Estimates and underlying assumptions are reviewed on an ongoing basis. Changes to accounting estimates are recognized in the period in which the estimates are revised and in any future period affected. Detailed information on these significant estimates is presented in the "Critical accounting estimates" section of the Corporation's MD&A for fiscal year ended March 3, 2012. There were no significant changes in the critical accounting estimates since fiscal year 2012. 10. CHANGE IN ACCOUNTING POLICIES CHANGE FOR FISCAL YEAR 2013 Available-for-sale financial asset — Following the Corporation's loss of influence over Rite Aid, the Corporation classifies the investment in Rite Aid as an available-for-sale financial asset. The financial instruments classified as available-for-sale are measured at fair value with changes in fair value recognized in other comprehensive income. If the financial asset is sold or impaired, the cumulative gain or loss accounted for in the other comprehensive income will be reclassified to profit or loss. Joint venture — In November 2012, the Corporation acquired an investment in a joint venture which is accounted for using the equity method.
16
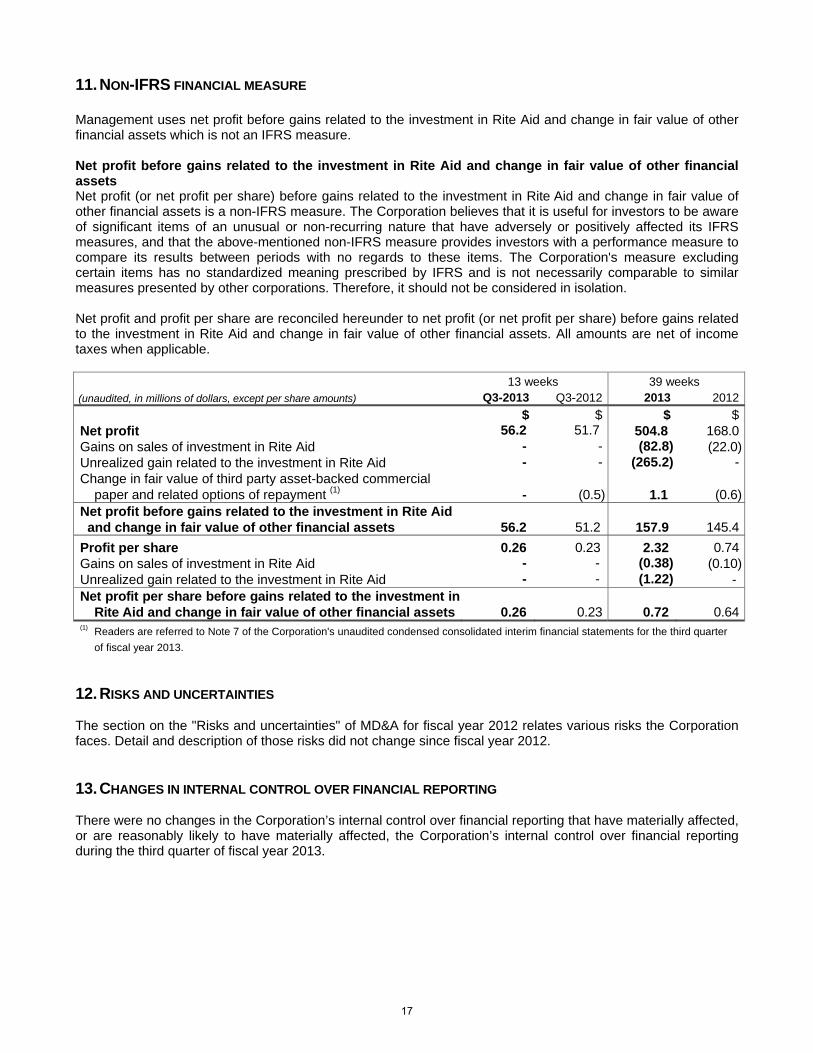
11. NON-IFRS FINANCIAL MEASURE Management uses net profit before gains related to the investment in Rite Aid and change in fair value of other financial assets which is not an IFRS measure. Net profit before gains related to the investment in Rite Aid and change in fair value of other financial assets Net profit (or net profit per share) before gains related to the investment in Rite Aid and change in fair value of other financial assets is a non-IFRS measure. The Corporation believes that it is useful for investors to be aware of significant items of an unusual or non-recurring nature that have adversely or positively affected its IFRS measures, and that the above-mentioned non-IFRS measure provides investors with a performance measure to compare its results between periods with no regards to these items. The Corporation's measure excluding certain items has no standardized meaning prescribed by IFRS and is not necessarily comparable to similar measures presented by other corporations. Therefore, it should not be considered in isolation. Net profit and profit per share are reconciled hereunder to net profit (or net profit per share) before gains related to the investment in Rite Aid and change in fair value of other financial assets. All amounts are net of income taxes when applicable. 13 weeks 39 weeks (unaudited, in millions of dollars, except per share amounts) Q3-2013 Q3-2012 2013 2012
$ $ $ $Net profit 56.2 51.7 504.8 168.0Gains on sales of investment in Rite Aid - - (82.8) (22.0)Unrealized gain related to the investment in Rite Aid - - (265.2) -Change in fair value of third party asset-backed commercial
paper and related options of repayment (1) - (0.5) 1.1 (0.6)Net profit before gains related to the investment in Rite Aid and change in fair value of other financial assets 56.2 51.2 157.9 145.4
Profit per share 0.26 0.23 2.32 0.74Gains on sales of investment in Rite Aid - - (0.38) (0.10)Unrealized gain related to the investment in Rite Aid - - (1.22) - Net profit per share before gains related to the investment in
Rite Aid and change in fair value of other financial assets 0.26 0.23 0.72 0.64(1) Readers are referred to Note 7 of the Corporation's unaudited condensed consolidated interim financial statements for the third quarter
of fiscal year 2013. 12. RISKS AND UNCERTAINTIES The section on the "Risks and uncertainties" of MD&A for fiscal year 2012 relates various risks the Corporation faces. Detail and description of those risks did not change since fiscal year 2012. 13. CHANGES IN INTERNAL CONTROL OVER FINANCIAL REPORTING There were no changes in the Corporation’s internal control over financial reporting that have materially affected, or are reasonably likely to have materially affected, the Corporation’s internal control over financial reporting during the third quarter of fiscal year 2013.
17

14. STRATEGIES AND OUTLOOK The section 15 "Forward looking statements" applies to this section. With its operations and financial flexibility, the Corporation is very well positioned to capitalize on the growth in the drugstore retail industry. Demographic trends are expected to contribute to growth in the prescription drugs’ consumption and to the increased use of pharmaceuticals as the primary intervention in individual healthcare. Management believes that these trends will continue and that the Corporation will maintain its growth in revenues through differentiation and quality of offering and service levels to its network of franchised stores, with a focus on sales growth, its real estate program and operating efficiency. The growth in the number of generic drugs’ prescriptions, with lower selling prices than the branded drugs, will however have a deflationary impact on retail sales in the pharmacy section but our integration in generic drugs with Pro Doc will have a positive impact on the consolidated margins. 15. FORWARD LOOKING STATEMENTS This MD&A contains forward-looking statements that involve risks and uncertainties, and which are based on the Corporation’s current expectations, estimates, projections and assumptions made by the Corporation in light of its experience and its perception of historical trends. All statements that address expectations or projections about the future, including statements about the Corporation’s strategy for growth, costs, operating or financial results, are forward-looking statements. All statements other than statements of historical facts included in this MD&A, including statements regarding the prospects of the Corporation’s industry and the Corporation’s prospects, plans, financial position and business strategy may constitute forward-looking statements within the meaning of the Canadian securities legislation and regulations. Some of the forward-looking statements may be identified by the use of forward-looking terminology such as "may", "will", "expect", "intend", "estimate", "project", "could", "anticipate", "plan", "foresee", "believe" or "continue", the negatives of these terms, the variations of them or the use of other similar terms. Although the Corporation believes that the expectations reflected in these forward-looking statements are reasonable, it can give no assurance that these expectations will prove to have been correct. These statements are not guarantees of future performance and involve a number of risks, uncertainties and assumptions. These statements do not reflect the potential impact of any non-recurring items or of any mergers, acquisitions, dispositions, asset write-downs or other transactions or charges that may be announced or that may occur after the date hereof. While the list below of cautionary statements is not exhaustive, some important factors that could affect our future operating results, financial position and cash flows and could cause our actual results to differ materially from those expressed in these forward-looking statements, namely changes in the legislation or the regulatory environment as it relates to the sale of prescription drugs and the pharmacy exercise, the success of the Corporation’s business model, changes in laws and regulations, or in their interpretations, changes to tax regulations and accounting pronouncements, the cyclical and seasonal variations in the industry in which the Corporation operate, the intensity of competitive activity in the industry in which the Corporation operates, the supplier and brand reputations, the Corporation's interest in Rite Aid Corporation, the Corporation's ability to attract and retain pharmacists, labour disruptions, including possibly strikes and labour protests, the accuracy of management’s assumptions and other factors that are beyond the Corporation's control. These and other factors could cause the Corporation's actual performance and financial results in future periods to differ materially from any estimates or projections of future performance or results expressed or implied by such forward-looking statements. Investors and others are cautioned that undue reliance should not be placed on any forward-looking statements. For more information on the risks, uncertainties and assumptions that would cause the Corporation’s actual results to differ from current expectations, please also refer to the Corporation’s public filings available at www.sedar.com and www.jeancoutu.com. In particular, further details and descriptions of these and other factors are disclosed in the Corporation’s Annual Information Form under "Risk Factors" and also in the "Critical accounting estimates", "Risks and uncertainties" and "Strategies and outlook" sections of annual MD&A. The Corporation expressly disclaims any obligation or intention to update or revise any forward-looking statements, whether as a result of new information, future events or any other reason, unless required by the applicable securities laws. January 9, 2013
18
THE JEAN COUTU GROUP (PJC) INC.
2012 2011 2012 2011
$ $ $ $
Sales 647.6 633.6 1,854.7 1,798.3 Other revenues (Note 3) 69.0 66.5 202.1 197.6
716.6 700.1 2,056.8 1,995.9 Operating expenses
Cost of sales 569.1 560.3 1,632.5 1,594.0 General and operating expenses (Note 4) 62.4 59.9 182.9 174.1
85.1 79.9 241.4 227.8 Depreciation and amortization 7.9 7.7 23.5 22.6
Operating income 77.2 72.2 217.9 205.2 0.1 0.2 2.0 1.6
Profit before the following items 77.1 72.0 215.9 203.6 - - 82.8 22.0
- - 265.2 - Profit before income taxes 77.1 72.0 563.9 225.6 Income taxes (Note 5) 20.9 20.3 59.1 57.6 Net profit 56.2 51.7 504.8 168.0
Profit per share, in dollars (Note 6)Basic 0.26 0.23 2.32 0.74Diluted 0.26 0.23 2.31 0.74
2012 2011 2012 2011
(unaudited, in millions of Canadian dollars) $ $ $ $
.
Net profit 56.2 51.7 504.8 168.0 Other comprehensive income
(32.0) - (87.9) - (32.0) - (87.9) -
Total comprehensive income 24.2 51.7 416.9 168.0
For the periods ended December 1, 2012 and November 26, 2011
Financing expenses
Condensed consolidated statements of comprehensive income
(unaudited, in millions of Canadian dollars, unless otherwise noted)
Available-for-sale financial asset:
The accompanying notes are an integral part of these condensed consolidated financial statements.
Operating income before depreciation and amortization
Unrealized gain related to the investment in Rite Aid (Note 8)
13 weeks
Change in fair value of investment in Rite Aid (Note 8)
39 weeks
39 weeks
Gains on sales of investment in Rite Aid (Note 8)
For the periods ended December 1, 2012 and November 26, 2011
Condensed consolidated statements of income 13 weeks
19

THE JEAN COUTU GROUP (PJC) INC.
Condensed consolidated statements of changes in equity
(in millions of Canadian dollars)
Capital stockTreasury
stockContributed
surplus
Change in fair value of the
investment in Rite Aid
Retained earnings (deficit) Total equity
$ $ $ $ $ $
Balance at March 3, 2012 559.7 (1.0) 1.9 - 88.6 649.2
Net profit - - - - 504.8 504.8 Other comprehensive income - - - (87.9) - (87.9)
Total comprehensive income - - - (87.9) 504.8 416.9 Redemption of capital stock (Note 9) (20.7) - - - (37.0) (57.7)Dividends - - - - (45.8) (45.8)
Share-based compensation cost - - 0.5 - - 0.5 Options exercised 2.2 - (0.3) - - 1.9
Balance at December 1, 2012 541.2 (1.0) 2.1 (87.9) 510.6 965.0
Balance at February 26, 2011 614.4 - 1.4 - (17.5) 598.3
Net profit - - - - 168.0 168.0 Other comprehensive income - - - - - -
Total comprehensive income - - - - 168.0 168.0 Redemption of capital stock (Note 9) (50.5) - - - (61.2) (111.7)Dividends - - - - (40.7) (40.7)Share-based compensation cost - - 0.5 - - 0.5 Options exercised 0.6 - (0.1) - - 0.5
Balance at November 26, 2011 564.5 - 1.8 - 48.6 614.9 The accompanying notes are an integral part of these condensed consolidated financial statements.
For the periods ended December 1, 2012 and November 26, 2011
20

THE JEAN COUTU GROUP (PJC) INC.
(in millions of Canadian dollars) $ $
(unaudited) (audited)
Current assetsTrade and other receivables 218.8 206.5 Inventories 176.7 166.2 Income taxes recoverable 0.1 0.2 Prepaid expenses 4.9 12.9
400.5 385.8 Non-current assets
Long-term receivables from franchisees 27.7 33.4 Other financial assets (Note 7) - 19.0 Investment in Rite Aid (Note 8) 177.3 - Investment in associates and joint venture 8.4 6.9 Property and equipment 360.4 361.1 Investment property 18.0 20.5 Intangible assets 197.8 186.9 Goodwill 36.0 36.0 Deferred tax 10.9 12.6 Other long-term assets 11.1 10.6
Total assets 1,248.1 1,072.8
Current liabilitiesBank overdraft 19.0 5.0 Trade and other payables 226.2 230.6 Income taxes payable 21.4 23.2 Short-term portion of long-term debt - 149.9
266.6 408.7 Non-current liabilities
Deferred tax 1.0 1.0 Other long-term liabilities 15.5 13.9
Total liabilities 283.1 423.6
Equity 965.0 649.2 Total liabilities and equity 1,248.1 1,072.8
As at December 1,
2012
As at March 3,
2012
Condensed consolidated statements of financial position
The accompanying notes are an integral part of these condensed consolidated financial statements.
21

THE JEAN COUTU GROUP (PJC) INC.
2012 2011 2012 2011
(unaudited, in millions of Canadian dollars) $ $ $ $
Operating activitiesNet profit 56.2 51.7 504.8 168.0 Adjustments for:
Depreciation and amortization 7.9 7.7 23.5 22.6 - (0.5) 1.1 (0.6)- - (82.8) (22.0)
- - (265.2) - Interest on long-term debt 0.1 0.7 0.7 2.2 Income taxes 20.9 20.3 59.1 57.6 Others 1.7 1.0 3.5 1.3
86.8 80.9 244.7 229.1
(0.8) 0.9 (18.1) 7.9 Interest paid (0.1) (0.7) (0.8) (2.2)Income taxes paid (13.4) (18.8) (59.1) (63.5)Cash flow related to operating activities 72.5 62.3 166.7 171.3
Investing activitiesReceipts from other financial assets - - 17.9 5.9
- - 82.8 22.0 Purchase of property and equipment (6.8) (4.8) (16.6) (16.8)Proceeds from disposal of property and equipment - 0.2 1.1 2.2 Purchase of investment property - (0.3) (0.1) (0.3)Proceeds from disposal of investment property 3.0 - 3.6 2.3
0.6 (2.0) (0.8) (3.1)Purchase of intangible assets (3.3) (0.6) (16.1) (14.7)Others (2.7) - (2.7) 2.0
Cash flow related to investing activities (9.2) (7.5) 69.1 (0.5)
Financing activitiesNet change in revolving credit facility (35.0) (19.9) (149.8) (19.9)Financing fees (0.3) (1.3) (0.3) (1.3)Issuance of capital stock 0.6 0.5 1.9 0.5 Redemption of capital stock (18.8) (28.8) (55.8) (112.8)Dividends paid (15.2) (13.3) (45.8) (40.7)
Cash flow related to financing activities (68.7) (62.8) (249.8) (174.2)Net change in cash and cash equivalents (5.4) (8.0) (14.0) (3.4)Bank overdraft, beginning of period (13.6) (11.9) (5.0) (16.5)Bank overdraft, end of period (19.0) (19.9) (19.0) (19.9)
The accompanying notes are an integral part of these condensed consolidated financial statements. Seesupplemental cash flow information in Note 10.
39 weeks
Condensed consolidated statements of cash flows
For the periods ended December 1, 2012 and November 26, 2011
Change in fair value of other financial assetsGains on sales of investment in Rite Aid (Note 8)
13 weeks
Unrealized gain related to the investment in Rite Aid (Note 8)
Net change in non-cash asset and liability items (Note 10)
Proceeds from disposal of the investment in Rite Aid
Net change in long-term receivables from franchisees
22

THE JEAN COUTU GROUP (PJC) INC.
Notes to the unaudited condensed consolidated financial statements
For the periods ended December 1, 2012 and November 26, 2011
(Unaudited, tabular amounts are in millions of Canadian dollars, unless otherwise noted)
1. General information
The Jean Coutu Group (PJC) Inc. (the "parent corporation") is governed by the Business Corporations Act(Québec). The address of the parent corporation's registered office is 530, Bériault Street, Longueuil, Québec.The parent corporation and its subsidiaries ("the Corporation") operate 2 operating segments which are thefranchising segment with a network of 405 franchised stores as at December 1, 2012 (March 3, 2012 - 399)under the banners of "PJC Jean Coutu", "PJC Clinique", "PJC Jean Coutu Santé" and "PJC Jean Coutu SantéBeauté", and the generic drugs segment through Pro Doc Ltd (''Pro Doc''), a Quebec-based subsidiary, whichmanufactures generic drugs. These segments are detailed in Note 11.
2. Statement of compliance
These unaudited condensed consolidated interim financial statements have been prepared in accordance withInternational Accounting Standard ("IAS") 34, Interim Financial Reporting, as issued by the InternationalAccounting Standards Board ("IASB"). These unaudited condensed consolidated interim financial statementsshould be read in conjunction with the Corporation's consolidated annual financial statements for fiscal yearended March 3, 2012 prepared in accordance with International Financial Reporting Standards ("IFRS").
These unaudited condensed consolidated interim financial statements have been prepared based on
Fiscal year end of the Corporation is the saturday closest to February 29 or March 1 and usually comprises 52weeks in duration but includes a 53rd week every 5 or 6 years. The fiscal year ended March 3, 2012 included53 weeks while the fiscal year ending March 2, 2013 will include 52 weeks.
3. Other revenues
2012 2011 2012 2011
$ $ $ $
Royalties 29.9 29.2 87.8 86.8
Rent 22.6 21.6 66.9 64.1
Sundry 16.5 15.7 47.4 46.7
69.0 66.5 202.1 197.6
The unaudited condensed consolidated interim financial statements were authorised for issue by the Board ofDirectors on January 9, 2013.
13 weeks 39 weeks
These unaudited condensed consolidated interim financial statements have been prepared based onaccounting policies and methods of application consistent with those used in the preparation of the mostrecently prepared audited annual consolidated financial statements except for the classification of theinvestment in Rite Aid Corporation (''Rite Aid'') as available-for-sale financial asset following the loss ofsignificant influence of the Corporation over Rite Aid. In addition, in November 2012, an interest in a jointventure was acquired and is accounted for using the equity method.
23
THE JEAN COUTU GROUP (PJC) INC.
Notes to the unaudited condensed consolidated financial statements
For the periods ended December 1, 2012 and November 26, 2011
(Unaudited, tabular amounts are in millions of Canadian dollars, unless otherwise noted)
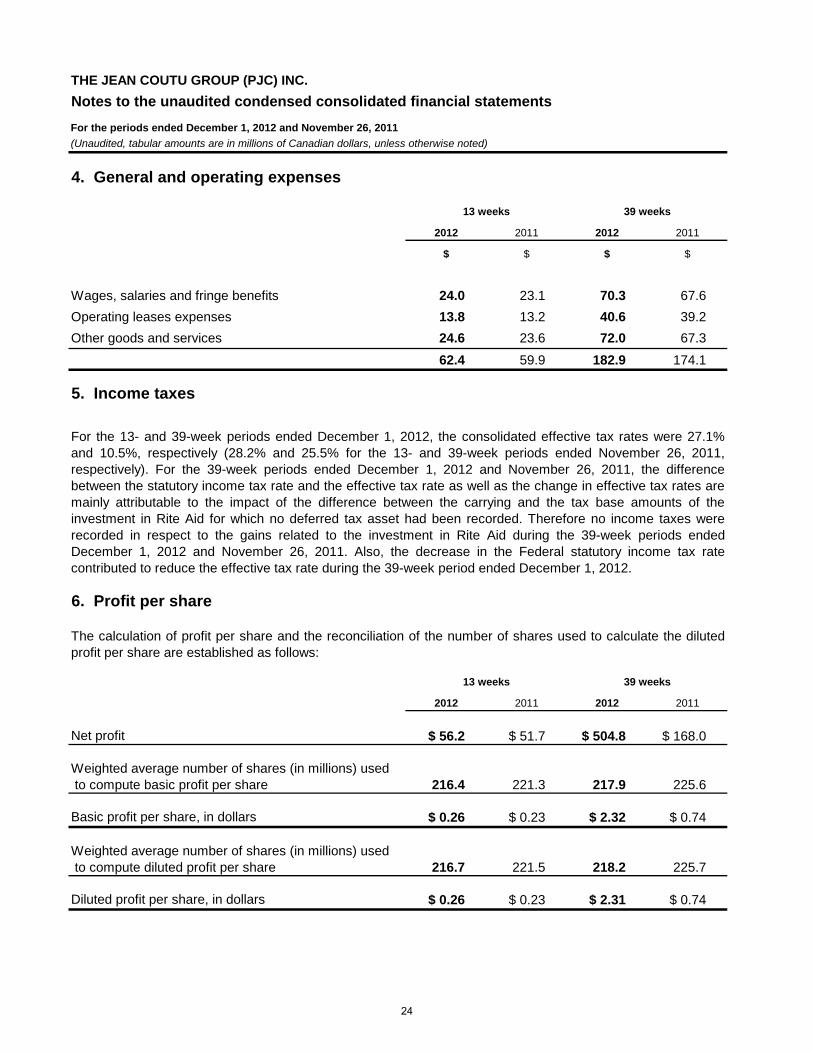
4. General and operating expenses
2012 2011 2012 2011
$ $ $ $
24.0 23.1 70.3 67.6
13.8 13.2 40.6 39.2
Other goods and services 24.6 23.6 72.0 67.3
62.4 59.9 182.9 174.1
5. Income taxes
13 weeks 39 weeks
Operating leases expenses
For the 13- and 39-week periods ended December 1, 2012, the consolidated effective tax rates were 27.1%and 10.5%, respectively (28.2% and 25.5% for the 13- and 39-week periods ended November 26, 2011,respectively). For the 39-week periods ended December 1, 2012 and November 26, 2011, the differencebetween the statutory income tax rate and the effective tax rate as well as the change in effective tax rates aremainly attributable to the impact of the difference between the carrying and the tax base amounts of theinvestment in Rite Aid for which no deferred tax asset had been recorded. Therefore no income taxes wererecorded in respect to the gains related to the investment in Rite Aid during the 39-week periods endedDecember 1, 2012 and November 26, 2011. Also, the decrease in the Federal statutory income tax rate
t ib t d t d th ff ti t t d i th 39 k i d d d D b 1 2012
Wages, salaries and fringe benefits
6. Profit per share
2012 2011 2012 2011
Net profit $ 56.2 $ 51.7 $ 504.8 $ 168.0
216.4 221.3 217.9 225.6
$ 0.26 $ 0.23 $ 2.32 $ 0.74
216.7 221.5 218.2 225.7
$ 0.26 $ 0.23 $ 2.31 $ 0.74
Weighted average number of shares (in millions) used to compute basic profit per share
Basic profit per share, in dollars
Weighted average number of shares (in millions) used to compute diluted profit per share
Diluted profit per share, in dollars
13 weeks 39 weeks
contributed to reduce the effective tax rate during the 39-week period ended December 1, 2012.
The calculation of profit per share and the reconciliation of the number of shares used to calculate the dilutedprofit per share are established as follows:
24

THE JEAN COUTU GROUP (PJC) INC.
Notes to the unaudited condensed consolidated financial statements
For the periods ended December 1, 2012 and November 26, 2011
(Unaudited, tabular amounts are in millions of Canadian dollars, unless otherwise noted)
6. Profit per share (continued)
7. Other financial assets
2012 2011 2012 2011
$ $ $ $
Fair value of ABCP, beginning of period - 17.2 19.0 20.2
- 0.5 (1.1) 0.5
(0 1) (0 3)
The details in the changes in balances in the consolidated statement of financial position, and the impact in theconsolidated statement of income are presented as follows:
For the 13- and 39-week periods ended December 1, 2012, 615,000 and 807,000 of antidilutive share-basedpayments instruments have been, respectively, excluded from the computation of diluted profit per share(732,000 and 762,000 for the 13- and 39-week periods ended November 26, 2011, respectively).
Other financial assets are third party asset-backed commercial paper ("ABCP") and options to repaydrawdowns of credit facilities with restructured notes. Both were assessed as level 3 instruments as of March 3,2012 because significant unobservable market inputs are used in their valuation.
Change in fair value recognized in the consolidated profit or loss
Principal repayments
13 weeks 39 weeks
- - (0.1) (0.3)
- - (17.8) -
Exercise of options of repayment - - - (2.7)
Fair value of ABCP, end of period - 17.7 - 17.7
- - - 2.8
- - - 0.1
Exercise of options of repayment - - - (2.9)
- - - -
- 17.7 - 17.7
a) ABCP
Proceeds from disposal
Principal repayments
On July 24, 2012, the Corporation sold all of its ABCP for a total consideration of $17.8 million. The nominalvalue of these ABCP amounted to $23.4 million.
Options of repayment, beginning of periodChange in fair value recognized in the consolidated profit or loss
Options of repayment, end of period
25

THE JEAN COUTU GROUP (PJC) INC.
Notes to the unaudited condensed consolidated financial statements
For the periods ended December 1, 2012 and November 26, 2011
(Unaudited, tabular amounts are in millions of Canadian dollars, unless otherwise noted)
7. Other financial assets (continued)
b) Options to repay drawdowns of credit facilities with restructured notes
8. Investment in Rite Aid
On May 27, 2011, the Corporation exercised the options to repay drawdowns of credit facilities with restructurednotes for the ineligible assets tracking notes category.
Since the ABCP sold on July 24, 2012 were given as a first ranking security on the Corporation's revolvingcredit facilities that included options allowing the use of the restructured notes to repay the drawdowns as theywere due, the Corporation canceled, prior to the sale of ABCP, all of these credit facilities.
The sale of these shares brought the Corporation’s interest in Rite Aid’s outstanding common shares down to19.85% as at April 20, 2012 (26.1% as of March 3, 2012) and, as stipulated in the stockholder agreement
In accordance with the provisions of Rule 144 under the Securities Act of 1933, the Corporation filed on April17, 2012 a notice confirming its intent to dispose up to 56,000,000 of its 234,401,162 common shares of RiteAid held at that date. On April 20, 2012, the Corporation completed the sale of these 56,000,000 commonshares. These shares were sold at an average price of US$1.51 per share for a total proceed of $82.8 million(US$83.6 million), net of related costs. Consequently, a gain of $82.8 million was recorded in the Corporation’sconsolidated statement of income for the 39-week period ended December 1, 2012 since the carrying value ofthe investment in Rite Aid was previously written-off.
( ) gbetween the Corporation and Rite Aid, the number of the Corporation’s representatives on Rite Aid’s Board ofDirectors was reduced from 3 to 2 members and the Corporation lost its representation on the ExecutiveCommittee of Rite Aid. The Corporation concluded that this generated a loss of significant influence of theCorporation over Rite Aid and, according to the IFRS, changed the accounting of the investment in Rite Aid.This investment, which was previously considered as an investment in an associate and accounted for underthe equity method, is now considered as an available-for-sale investment and is accounted for at fair value. This change generated a non-cash gain of $265.2 million (US$267.6 million) in the Corporation’s consolidatedstatement of income for the 39-week period ended December 1, 2012, which was the fair value of the178,401,162 common shares that the Corporation owned at the date of its loss of significant influence.Subsequent changes in the fair value of the investment in Rite Aid are accounted for in the Corporation’sconsolidated statement of comprehensive income. As a result, for the 13- and 39-week periods endedDecember 1, 2012, the Corporation recorded $32.0 million and $87.9 million losses in fair value in theconsolidated statement of comprehensive income, respectively. As at December 1, 2012, the Corporation held178,401,162 common shares of Rite Aid (an interest of 19.7%) and the fair value of the investment was $177.3million.
26

THE JEAN COUTU GROUP (PJC) INC.
Notes to the unaudited condensed consolidated financial statements
For the periods ended December 1, 2012 and November 26, 2011
(Unaudited, tabular amounts are in millions of Canadian dollars, unless otherwise noted)
9. Capital stock
Normal course issuer bid
As at December 1, 2012, the total number of Class "A" subordinate voting shares issued and outstanding was101.2 million (104.8 million as of March 3, 2012) and the number of Class "B" shares was 114.4 million (114.4million as of March 3, 2012) for a total of 215.6 million shares outstanding (219.2 million as of March 3, 2012).
On May 3, 2012, the Corporation announced its intention to repurchase for cancellation, if it is consideredadvisable, up to 9,398,000 of its outstanding Class "A" subordinate voting shares, representing approximately10% of the current public float of such shares, over a 12-month period ending no later than May 6, 2013. Theshares were or will be repurchased through the facilities of the Toronto Stock Exchange and in accordance withits requirements.
On May 2, 2011, the Corporation had announced its intention to repurchase for cancellation up to 10,400,000 ofits outstanding Class "A" subordinate voting shares, representing approximately 10% of public float of suchshares, over a 12-month period ending no later than May 3, 2012. During the term of this repurchase program,10,400,000 shares have been repurchased and cancelled through the facilities of the Toronto Stock Exchangeand in accordance with its requirements.
On April 29, 2010, the Corporation had announced its intention to repurchase for cancellation up to 11,110,000of its outstanding Class "A" subordinate voting shares, representing approximately 10% of the current publicfloat of such shares, over a 12-month period ending no later than May 3, 2011. During the term of this
For the 13- and 39-week periods ended December 1, 2012, the Corporation repurchased 1,291,700 and3,878,800 Class "A" subordinate voting shares at the average prices of $14.75 and $14.89 per share for a totalconsideration of $19.0 million and $57.7 million including related costs, respectively. Amounts of $12.1 millionand $37.0 million representing the excess of the purchase price over the carrying value of the repurchasedshares were included in retained earnings for the 13- and 39-week periods ended December 1, 2012,respectively. The shares repurchased during the 39-week period ended December 1, 2012 were cancelledduring that period, except for 133,400 shares that were cancelled after December 1, 2012.
repurchase program, 6,819,900 shares have been repurchased through the facilities of the Toronto StockExchange and in accordance with its requirements. These 6,819,900 shares were all repurchased andcancelled during fiscal year 2011 except for 287,200 shares that were cancelled during the first quarter of fiscalyear 2012.
For the 13- and 39-week periods ended November 26, 2011, the Corporation repurchased 1,546,100 and9,465,550 Class "A" subordinate voting shares at the average prices of $12.58 and $11.80 per share for a totalconsideration of $19.4 million and $111.7 million including related costs, respectively. Amounts of $11.2 millionand $61.2 million representing the excess of the purchase price over the carrying value of the repurchasedshares were included in retained earnings for the 13- and 39-week periods ended November 26, 2011,respectively. The shares repurchased during the 39-week period ended November 26, 2011 were cancelledduring that period, except for 86,600 shares that were cancelled after November 26, 2011.
27

THE JEAN COUTU GROUP (PJC) INC.
Notes to the unaudited condensed consolidated financial statements
For the periods ended December 1, 2012 and November 26, 2011
(Unaudited, tabular amounts are in millions of Canadian dollars, unless otherwise noted)
2012 2011 2012 2011
$ $ $ $
Net change in non-cash asset and liability items
(28.4) (35.3) (4.3) (26.8)
Change in inventories 3.5 9.6 (10.5) 15.7
Change in trade and other payables 22.4 28.2 (4.8) 20.5
Change in other long-term assets (0.8) (1.0) (0.8) (0.9)
Change in other long-term liabilities 2.5 (0.6) 2.3 (0.6)
(0.8) 0.9 (18.1) 7.9
Other informationAs at
December 1, 2012
As at March 3,
2012
$ $
Change in trade and other receivables and prepaid expenses
39 weeks13 weeks
Net change in non-cash asset and liability items
10. Supplemental cash flow information
2.2 2.4
1.9 -
Property and equipment, investment property and and intangible assets acquired included in trade and other payables
Redemption of capital stock included in trade and other payables
28

THE JEAN COUTU GROUP (PJC) INC.
Notes to the unaudited condensed consolidated financial statements
For the periods ended December 1, 2012 and November 26, 2011
(Unaudited, tabular amounts are in millions of Canadian dollars, unless otherwise noted)
11. Segmented information
2012 2011 2012 2011
$ $ $ $
Revenues (1)
Franchising 715.7 698.7 2,053.5 1,992.8
Generic drugs 42.1 34.2 109.6 88.5
Intersegment sales (41.2) (32.8) (106.3) (85.4)
716.6 700.1 2,056.8 1,995.9
Until April 20, 2012, the Corporation had three reportable operating segments: franchising, generic drugs andan investment in Rite Aid, an investment in an associate, which operates in the United States. On April 20,2012, following the loss of significant influence over Rite Aid, the investment in Rite Aid ceased to be areportable operating segment. Consequently, since that date, the Corporation has two reportable operatingsegments: franchising and generic drugs. Within the franchising segment, the Corporation carries on thefranchising activity under the banners of PJC Jean Coutu, PJC Clinique, PJC Jean Coutu Santé and PJC JeanCoutu Santé Beauté, operates two distribution centres and coordinates several other services for the benefit ofits franchisees. Within the generic drugs segment, the Corporation owns Pro Doc, a Canadian manufacturer ofgeneric drugs, whose revenues come from the sale of generic drugs to wholesalers and pharmacists. Bothreportable operating segments of the Corporation are in the Canadian geographic area.
39 weeks13 weeks
Franchising 69.0 64.5 194.7 186.6
Generic drugs 19.7 17.2 51.4 40.9
Intersegment eliminations (3.6) (1.8) (4.7) 0.3
85.1 79.9 241.4 227.8
Depreciation and amortization
Franchising 7.9 7.7 23.4 22.5
Generic drugs - - 0.1 0.1
7.9 7.7 23.5 22.6
Operating income
Franchising 61.1 56.8 171.3 164.1
Generic drugs 19.7 17.2 51.3 40.8
Intersegment eliminations (3.6) (1.8) (4.7) 0.3
77.2 72.2 217.9 205.2
(1) Revenues include sales and other revenues.
Operating income before depreciation and amortization
29

THE JEAN COUTU GROUP (PJC) INC.
Notes to the unaudited condensed consolidated financial statements
For the periods ended December 1, 2012 and November 26, 2011
(Unaudited, tabular amounts are in millions of Canadian dollars, unless otherwise noted)
11. Segmented information (continued)
2012 2011 2012 2011
$ $ $ $
Franchising 9.2 5.9 34.2 31.5
Generic drugs 0.7 - 0.8 0.2
9.9 5.9 35.0 31.7
As at December 1,
2012
As at March 3,
2012
$ $
Total assets
Franchising 1,077.1 1,078.5
Generic drugs 43.9 42.6
Acquisition of property and equipment, investment property and intangible assets
13 weeks 39 weeks
Other asset - Investment in Rite Aid 177.3 -
Intersegment eliminations (50.2) (48.3)
1,248.1 1,072.8
Total liabilities
Franchising 292.2 439.1
Generic drugs 20.9 16.0
Intersegment eliminations (30.0) (31.5)
283.1 423.6
30


530 Bériault Street, Longueuil, Québec J4G 1S8 (450) 646‐9760 www.jeancoutu.com