Embed Size (px)
Citation preview
Third QuarterFiscal 2017
February 7, 2017 8:00 a.m. CDT
Agenda
2
Introduction Kathy Powers VP, Treasurer and Investor Relations
Third Quarter Highlights Tom Burke and Segment Review President and Chief Executive Officer
Financial Overview Mick Lucareliand Outlook VP, Finance and Chief Financial Officer
Summary Tom Burke
Q & A Tom Burke and Mick Lucareli
Forward-Looking Statements
3
This presentation contains statements, including information about future financial performance and market conditions, accompanied by phrases such as “believes,” “estimates,” “expects,” “plans,” “anticipates,” “intends,” and other similar “forward-looking” statements, as defined in the Private Securities Litigation Reform Act of 1995. Modine's actual results, performance or achievements may differ materially from those expressed or implied in these statements because of certain risks and uncertainties, including, but not limited to, those described under “Risk Factors” in Item 1A of Part I of the Company's Annual Report on Form 10-K for the year ended March 31, 2016 and under Forward-Looking Statements in Item 7 of Part II of that same report and in the Company’s Quarterly Report on Form 10-Q for the quarters ended June 30, 2016 and September 30, 2016. Other risks and uncertainties include, but are not limited to, the following: Modine’s ability to integrate the former Luvata HTS operations into Modine, to harness the anticipated synergies associated with the transaction, and to achieve projected cash flows sufficient to enable Modine to maintain a desirable leverage ratio; the overall health and price-down focus of Modine’s customers, particularly in light of economic and market-specific challenges; the ability of the Company to successfully implement its Strengthen, Diversify and Grow strategic transformation; uncertainties regarding the costs and benefits of Modine’s restructuring activities, including the activities associated with the closure of Modine’s facility in Washington, Iowa; operational inefficiencies as a result of program launches, unexpected volume increases and product transfers; economic, social and political conditions, changes and challenges in the markets where Modine operates and competes, including foreign currency exchange rate fluctuations (particularly the value of the euro, Brazilian real and British pound relative to the U.S. dollar), tariffs, inflation, changes in interest rates, recession, restrictions associated with importing and exporting and foreign ownership, and in particular the economic and market conditions in Brazil and China, the remaining economic uncertainties in certain markets in North America, and the general uncertainties about the impact of potential regulatory and/or policy changes in the U.S. and continuing uncertainty regarding“Brexit”; the impact on Modine of any significant increases in commodity prices, particularly aluminum and copper, and our ability to pass these prices on to customers; Modine's ability to successfully execute its strategic and operational plans; the nature of and Modine’s significant exposure to the vehicular industry and the dependence of this industry on the health of the economy; costs and other effects of environmental investigation, remediation or litigation; and other risks and uncertaintiesidentified by the Company in public filings with the U.S. Securities and Exchange Commission. The Company does not assume any obligation to update any forward-looking statements.
Third Quarter Highlightsand Segment Review
Tom BurkePresident and Chief Executive Officer
FY2017 ‒ Third Quarter Highlights
5
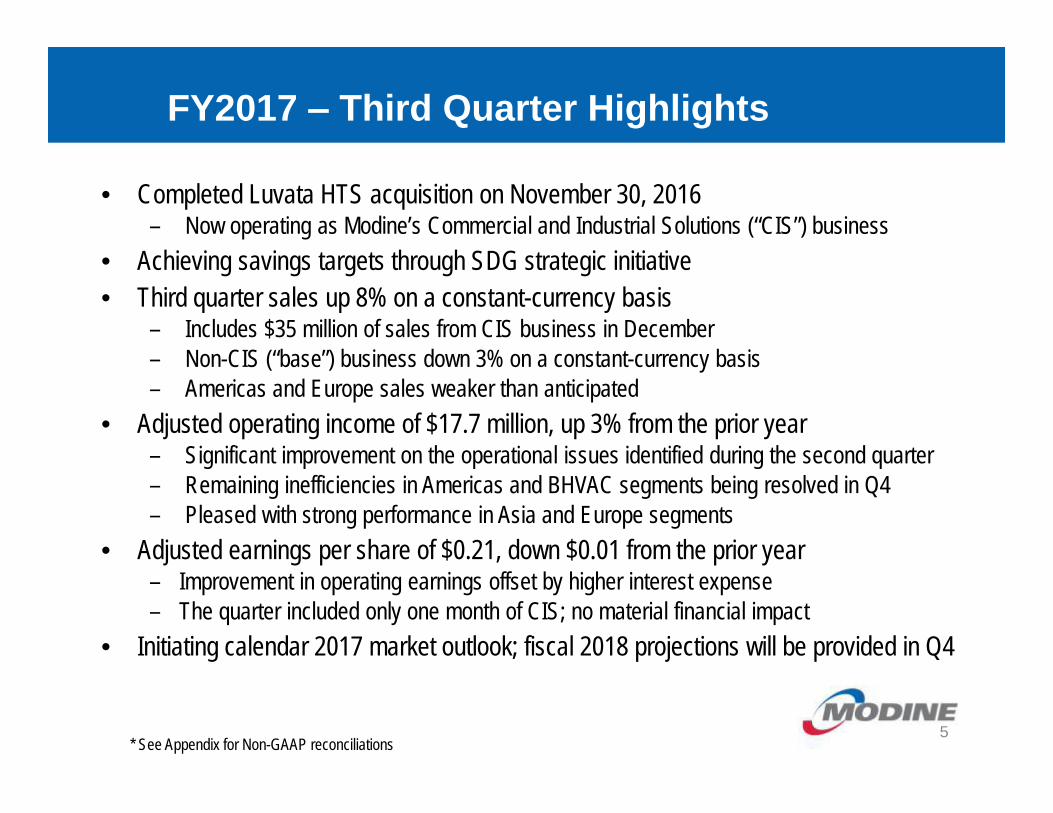
• Completed Luvata HTS acquisition on November 30, 2016– Now operating as Modine’s Commercial and Industrial Solutions (“CIS”) business
• Achieving savings targets through SDG strategic initiative• Third quarter sales up 8% on a constant-currency basis
– Includes $35 million of sales from CIS business in December– Non-CIS (“base”) business down 3% on a constant-currency basis– Americas and Europe sales weaker than anticipated
• Adjusted operating income of $17.7 million, up 3% from the prior year – Significant improvement on the operational issues identified during the second quarter– Remaining inefficiencies in Americas and BHVAC segments being resolved in Q4– Pleased with strong performance in Asia and Europe segments
• Adjusted earnings per share of $0.21, down $0.01 from the prior year– Improvement in operating earnings offset by higher interest expense– The quarter included only one month of CIS; no material financial impact
• Initiating calendar 2017 market outlook; fiscal 2018 projections will be provided in Q4
* See Appendix for Non-GAAP reconciliations
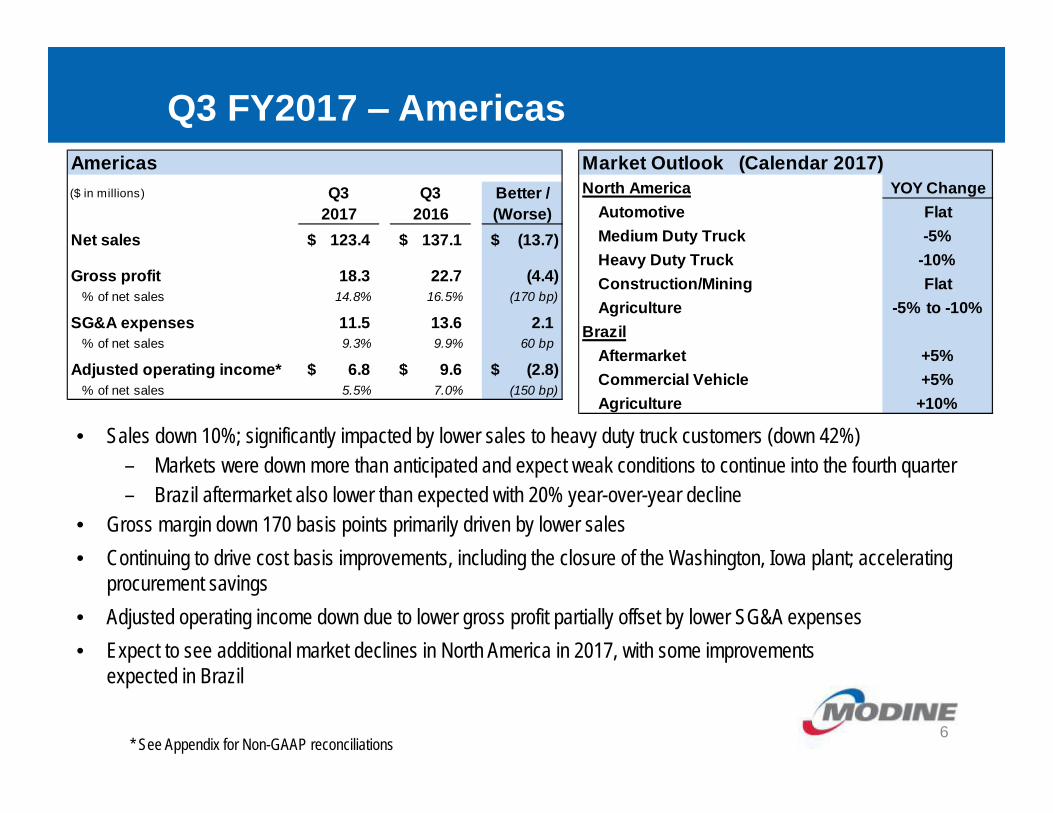
North America YOY Change Automotive Flat Medium Duty Truck -5% Heavy Duty Truck -10% Construction/Mining Flat Agriculture -5% to -10%Brazil Aftermarket +5% Commercial Vehicle +5% Agriculture +10%
Market Outlook (Calendar 2017)($ in millions) Q3 Q3 Better /
2017 2016 (Worse)Net sales 123.4$ 137.1$ (13.7)$
Gross profit 18.3 22.7 (4.4) % of net sales 14.8% 16.5% (170 bp)
SG&A expenses 11.5 13.6 2.1 % of net sales 9.3% 9.9% 60 bp
Adjusted operating income* 6.8$ 9.6$ (2.8)$ % of net sales 5.5% 7.0% (150 bp)
Americas
Q3 FY2017 ‒ Americas
6* See Appendix for Non-GAAP reconciliations
• Sales down 10%; significantly impacted by lower sales to heavy duty truck customers (down 42%)– Markets were down more than anticipated and expect weak conditions to continue into the fourth quarter– Brazil aftermarket also lower than expected with 20% year-over-year decline
• Gross margin down 170 basis points primarily driven by lower sales • Continuing to drive cost basis improvements, including the closure of the Washington, Iowa plant; accelerating
procurement savings• Adjusted operating income down due to lower gross profit partially offset by lower SG&A expenses• Expect to see additional market declines in North America in 2017, with some improvements
expected in Brazil
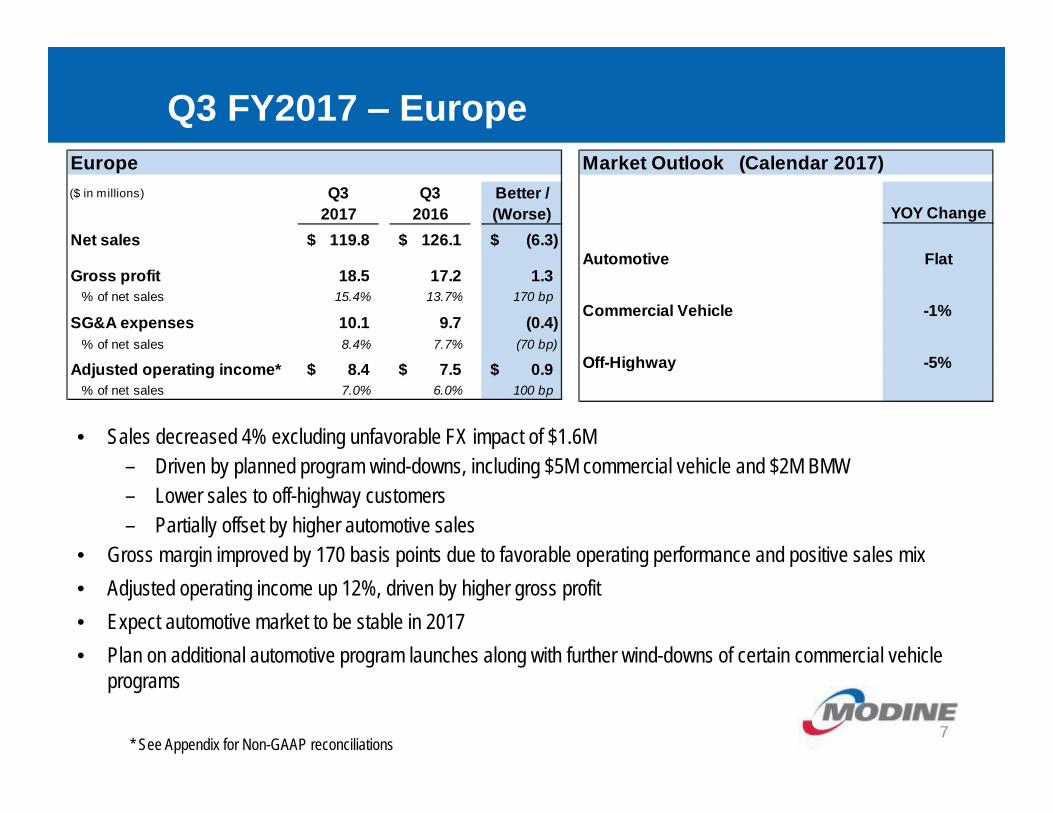
YOY Change
Automotive Flat
Commercial Vehicle -1%
Off-Highway -5%
Market Outlook (Calendar 2017)($ in millions) Q3 Q3 Better /
2017 2016 (Worse)Net sales 119.8$ 126.1$ (6.3)$
Gross profit 18.5 17.2 1.3 % of net sales 15.4% 13.7% 170 bp
SG&A expenses 10.1 9.7 (0.4) % of net sales 8.4% 7.7% (70 bp)
Adjusted operating income* 8.4$ 7.5$ 0.9$ % of net sales 7.0% 6.0% 100 bp
Europe
Q3 FY2017 ‒ Europe
7* See Appendix for Non-GAAP reconciliations
• Sales decreased 4% excluding unfavorable FX impact of $1.6M– Driven by planned program wind-downs, including $5M commercial vehicle and $2M BMW– Lower sales to off-highway customers– Partially offset by higher automotive sales
• Gross margin improved by 170 basis points due to favorable operating performance and positive sales mix• Adjusted operating income up 12%, driven by higher gross profit• Expect automotive market to be stable in 2017• Plan on additional automotive program launches along with further wind-downs of certain commercial vehicle
programs
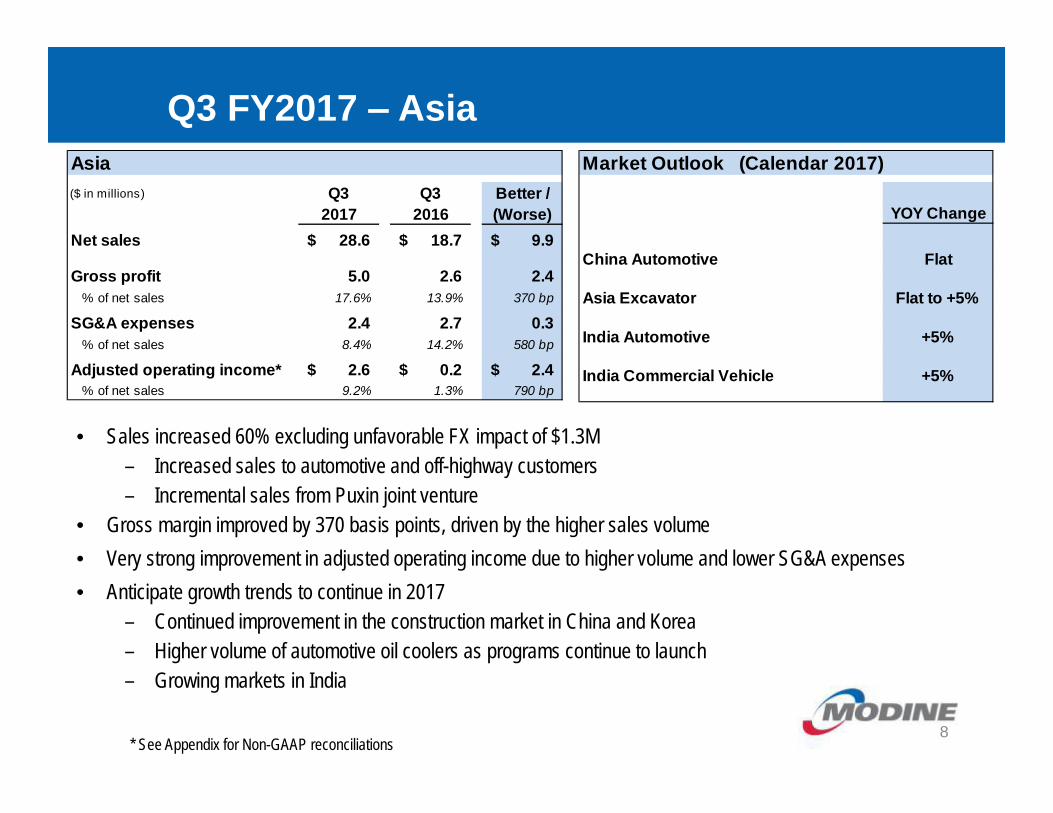
($ in millions) Q3 Q3 Better /2017 2016 (Worse)
Net sales 28.6$ 18.7$ 9.9$
Gross profit 5.0 2.6 2.4 % of net sales 17.6% 13.9% 370 bp
SG&A expenses 2.4 2.7 0.3 % of net sales 8.4% 14.2% 580 bp
Adjusted operating income* 2.6$ 0.2$ 2.4$ % of net sales 9.2% 1.3% 790 bp
Asia
YOY Change
China Automotive Flat
Asia Excavator Flat to +5%
India Automotive +5%
India Commercial Vehicle +5%
Market Outlook (Calendar 2017)
Q3 FY2017 ‒ Asia
8
• Sales increased 60% excluding unfavorable FX impact of $1.3M– Increased sales to automotive and off-highway customers– Incremental sales from Puxin joint venture
• Gross margin improved by 370 basis points, driven by the higher sales volume• Very strong improvement in adjusted operating income due to higher volume and lower SG&A expenses• Anticipate growth trends to continue in 2017
– Continued improvement in the construction market in China and Korea– Higher volume of automotive oil coolers as programs continue to launch– Growing markets in India
* See Appendix for Non-GAAP reconciliations
YOY Change
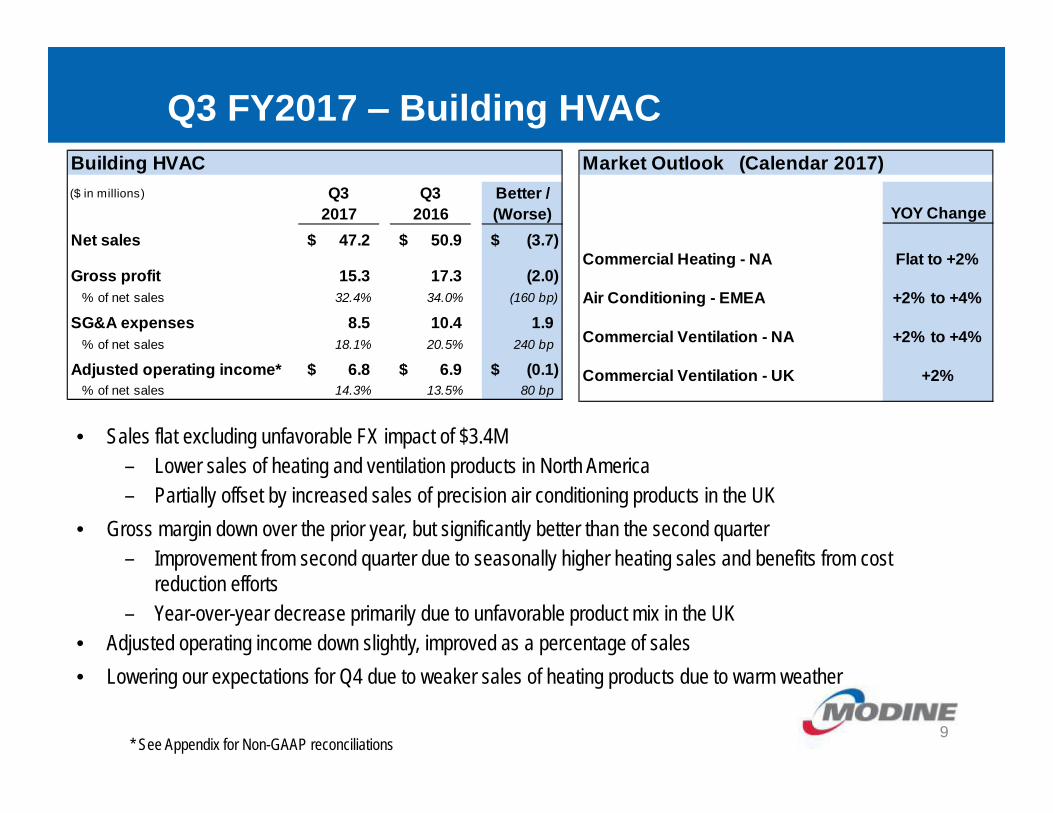
Commercial Heating - NA Flat to +2%
Air Conditioning - EMEA +2% to +4%
Commercial Ventilation - NA +2% to +4%
Commercial Ventilation - UK +2%
Market Outlook (Calendar 2017)($ in millions) Q3 Q3 Better /
2017 2016 (Worse)Net sales 47.2$ 50.9$ (3.7)$
Gross profit 15.3 17.3 (2.0) % of net sales 32.4% 34.0% (160 bp)
SG&A expenses 8.5 10.4 1.9 % of net sales 18.1% 20.5% 240 bp
Adjusted operating income* 6.8$ 6.9$ (0.1)$ % of net sales 14.3% 13.5% 80 bp
Building HVAC
Q3 FY2017 ‒ Building HVAC
9* See Appendix for Non-GAAP reconciliations
• Sales flat excluding unfavorable FX impact of $3.4M– Lower sales of heating and ventilation products in North America– Partially offset by increased sales of precision air conditioning products in the UK
• Gross margin down over the prior year, but significantly better than the second quarter– Improvement from second quarter due to seasonally higher heating sales and benefits from cost
reduction efforts– Year-over-year decrease primarily due to unfavorable product mix in the UK
• Adjusted operating income down slightly, improved as a percentage of sales• Lowering our expectations for Q4 due to weaker sales of heating products due to warm weather
Strengthen, Diversify and Grow
• Acquisition of Luvata HTS– Actively working on integration; see many opportunities to create future value– Driving cost synergies throughout the organization, with confidence in initial target of
$15 million of savings over 3 to 4 years– Cost synergies will come from procurement savings, operational improvements and
organizational efficiencies– Addressing known challenges from a large data center customer that has impacted
volumes and margins– Using Modine Operating System (“MOS”) to create culture of continuous improvement
throughout CIS• Actions taken to strengthen our business have led to the identification of over
$50 million in annual run-rate savings– Of this amount, approximately $20 million of savings will be achieved in fiscal 2018,
including benefit from the closure of the Washington, Iowa plant – Absent market recoveries, the cost savings are critical to offset increased costs from
wage inflation, material costs and contractual price-down commitments
10
Financial Overview and Outlook
Mick LucareliVice President, Finance and Chief Financial Officer
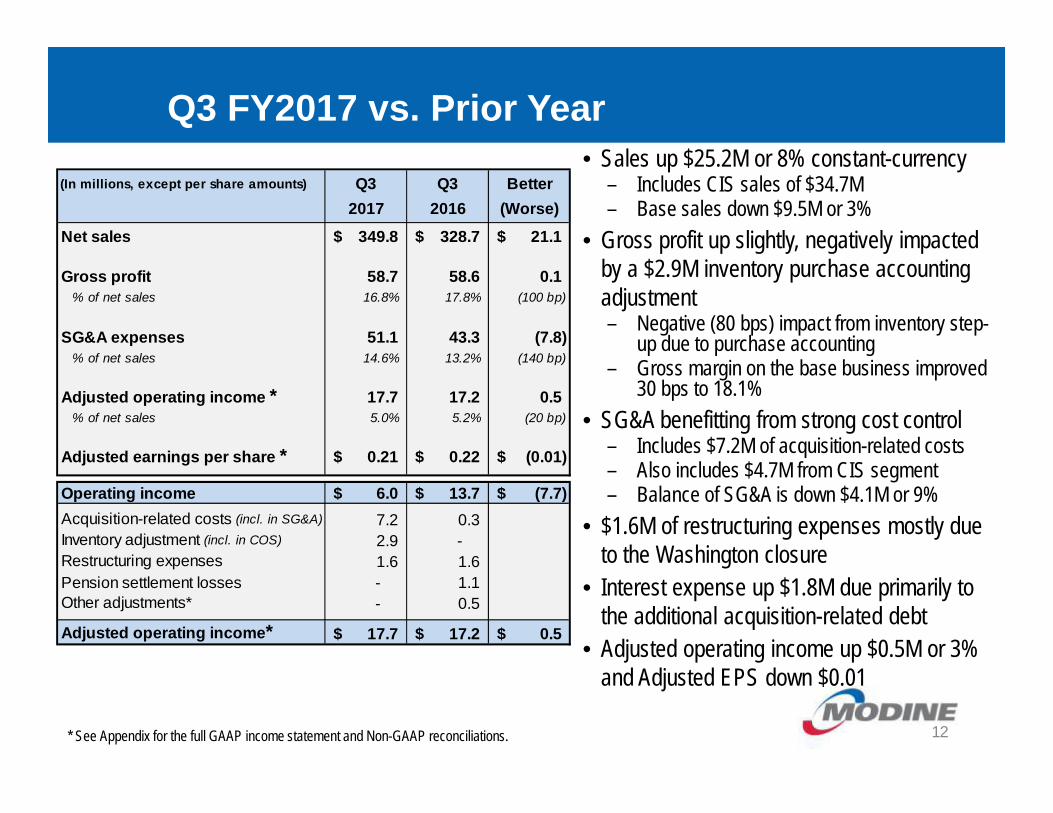
Operating income 6.0$ 13.7$ (7.7)$ Acquisition-related costs (incl. in SG&A) 7.2 0.3 Inventory adjustment (incl. in COS) 2.9 - Restructuring expenses 1.6 1.6 Pension settlement losses - 1.1 Other adjustments* - 0.5
Adjusted operating income* 17.7$ 17.2$ 0.5$
(In millions, except per share amounts) Q3 Q3 Better2017 2016 (Worse)
Net sales 349.8$ 328.7$ 21.1$
Gross profit 58.7 58.6 0.1 % of net sales 16.8% 17.8% (100 bp)
SG&A expenses 51.1 43.3 (7.8) % of net sales 14.6% 13.2% (140 bp)
Adjusted operating income * 17.7 17.2 0.5 % of net sales 5.0% 5.2% (20 bp)
Adjusted earnings per share * 0.21$ 0.22$ (0.01)$
Q3 FY2017 vs. Prior Year
12* See Appendix for the full GAAP income statement and Non-GAAP reconciliations.
• Sales up $25.2M or 8% constant-currency– Includes CIS sales of $34.7M– Base sales down $9.5M or 3%
• Gross profit up slightly, negatively impacted by a $2.9M inventory purchase accounting adjustment– Negative (80 bps) impact from inventory step-
up due to purchase accounting– Gross margin on the base business improved
30 bps to 18.1%• SG&A benefitting from strong cost control
– Includes $7.2M of acquisition-related costs– Also includes $4.7M from CIS segment– Balance of SG&A is down $4.1M or 9%
• $1.6M of restructuring expenses mostly due to the Washington closure
• Interest expense up $1.8M due primarily to the additional acquisition-related debt
• Adjusted operating income up $0.5M or 3% and Adjusted EPS down $0.01
Cash Flow
13
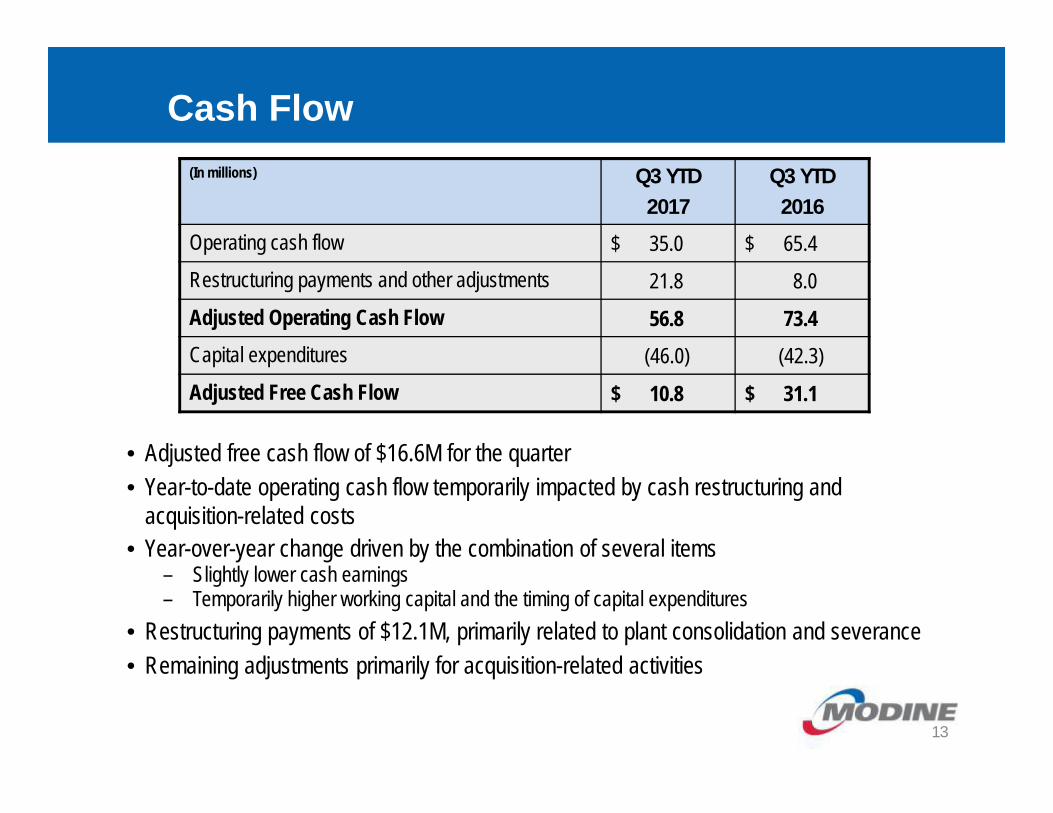
• Adjusted free cash flow of $16.6M for the quarter• Year-to-date operating cash flow temporarily impacted by cash restructuring and
acquisition-related costs• Year-over-year change driven by the combination of several items
– Slightly lower cash earnings – Temporarily higher working capital and the timing of capital expenditures
• Restructuring payments of $12.1M, primarily related to plant consolidation and severance• Remaining adjustments primarily for acquisition-related activities
(In millions) Q3 YTD2017
Q3 YTD2016
Operating cash flow $ 35.0 $ 65.4 Restructuring payments and other adjustments 21.8 8.0Adjusted Operating Cash Flow 56.8 73.4Capital expenditures (46.0) (42.3)Adjusted Free Cash Flow $ 10.8 $ 31.1
Capital Structure
14
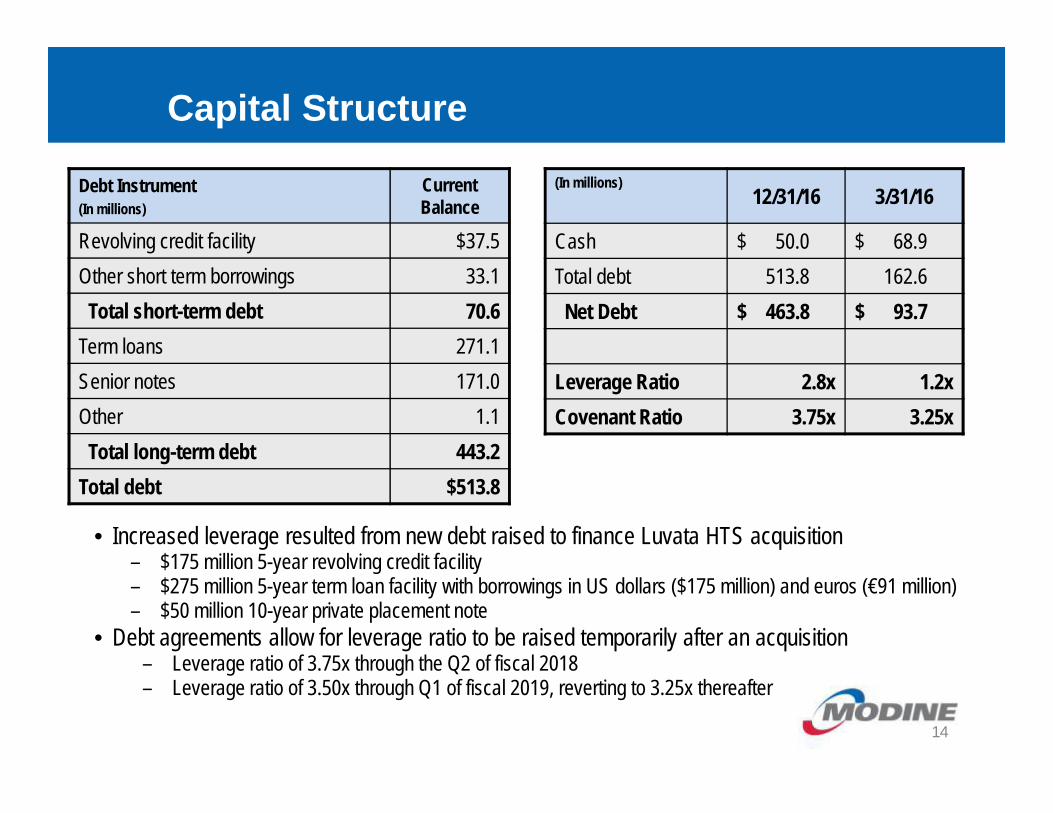
• Increased leverage resulted from new debt raised to finance Luvata HTS acquisition– $175 million 5-year revolving credit facility– $275 million 5-year term loan facility with borrowings in US dollars ($175 million) and euros (€91 million)– $50 million 10-year private placement note
• Debt agreements allow for leverage ratio to be raised temporarily after an acquisition– Leverage ratio of 3.75x through the Q2 of fiscal 2018– Leverage ratio of 3.50x through Q1 of fiscal 2019, reverting to 3.25x thereafter
(In millions)12/31/16 3/31/16
Cash $ 50.0 $ 68.9 Total debt 513.8 162.6Net Debt $ 463.8 $ 93.7
Leverage Ratio 2.8x 1.2xCovenant Ratio 3.75x 3.25x
Debt Instrument(In millions)
Current Balance
Revolving credit facility $37.5Other short term borrowings 33.1Total short-term debt 70.6
Term loans 271.1Senior notes 171.0Other 1.1Total long-term debt 443.2
Total debt $513.8
Acquisition – CIS Update
15
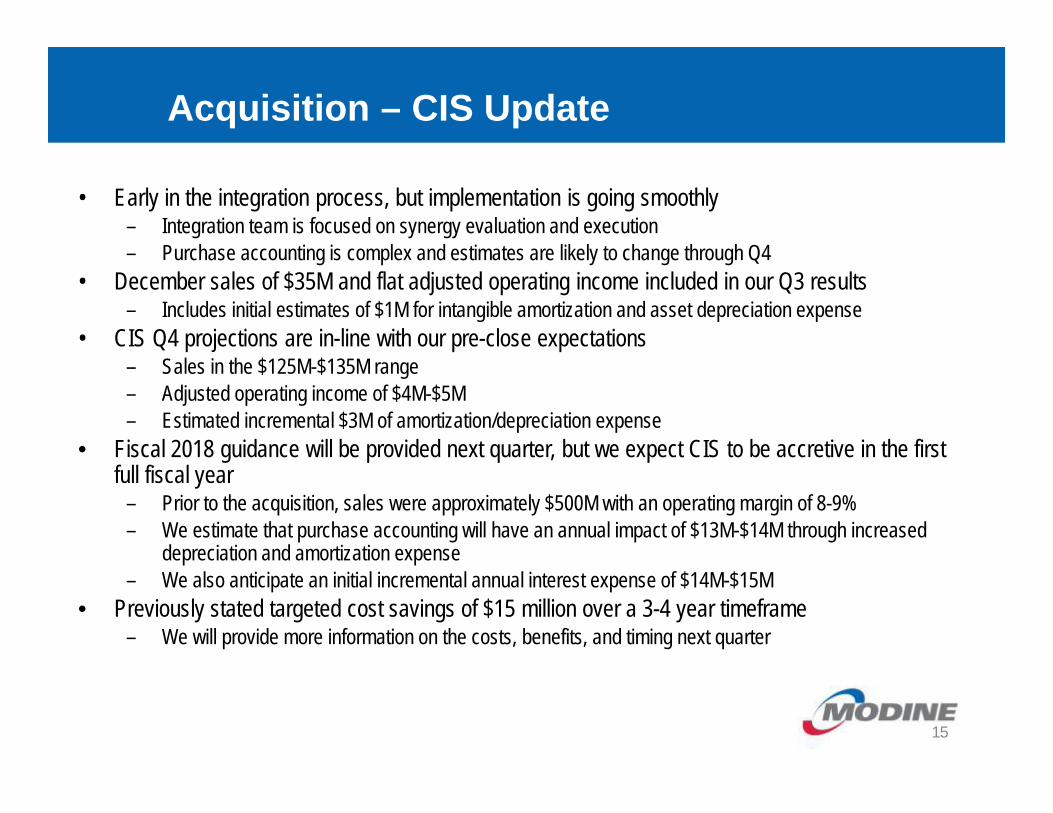
• Early in the integration process, but implementation is going smoothly– Integration team is focused on synergy evaluation and execution– Purchase accounting is complex and estimates are likely to change through Q4
• December sales of $35M and flat adjusted operating income included in our Q3 results– Includes initial estimates of $1M for intangible amortization and asset depreciation expense
• CIS Q4 projections are in-line with our pre-close expectations– Sales in the $125M-$135M range– Adjusted operating income of $4M-$5M– Estimated incremental $3M of amortization/depreciation expense
• Fiscal 2018 guidance will be provided next quarter, but we expect CIS to be accretive in the first full fiscal year
– Prior to the acquisition, sales were approximately $500M with an operating margin of 8-9%– We estimate that purchase accounting will have an annual impact of $13M-$14M through increased
depreciation and amortization expense– We also anticipate an initial incremental annual interest expense of $14M-$15M
• Previously stated targeted cost savings of $15 million over a 3-4 year timeframe– We will provide more information on the costs, benefits, and timing next quarter
FY2017 Guidance
16
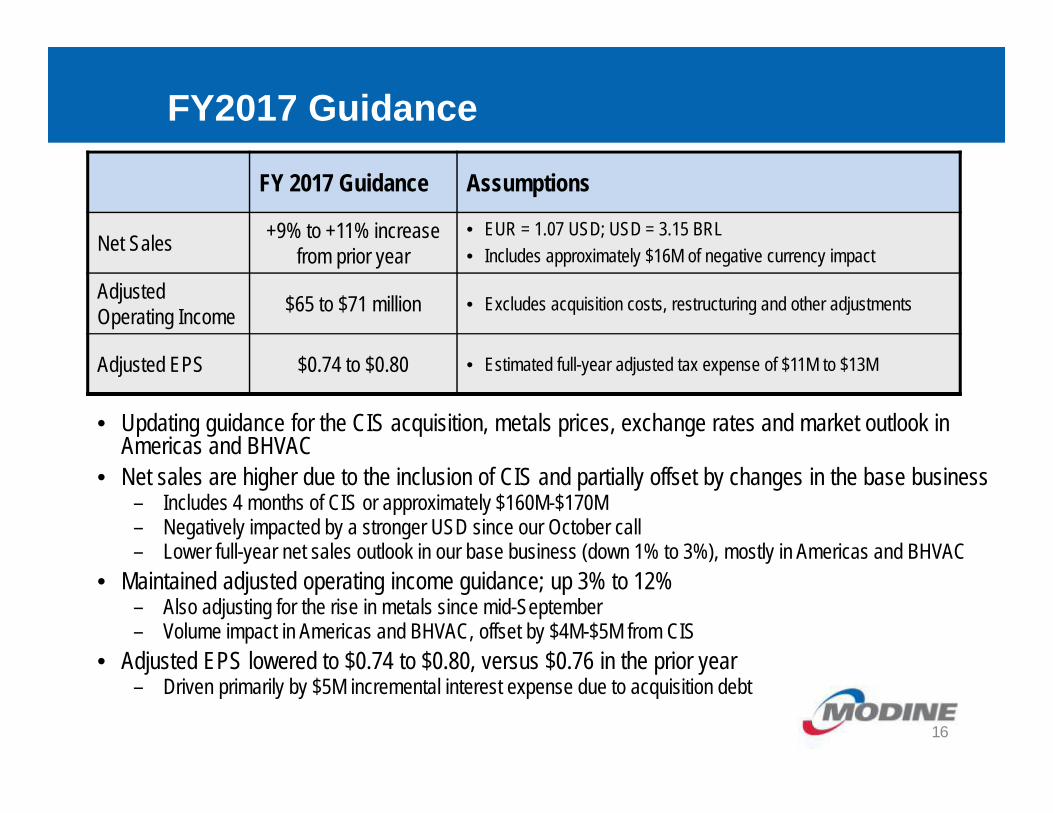
FY 2017 Guidance Assumptions
Net Sales +9% to +11% increase from prior year
• EUR = 1.07 USD; USD = 3.15 BRL• Includes approximately $16M of negative currency impact
Adjusted Operating Income $65 to $71 million • Excludes acquisition costs, restructuring and other adjustments
Adjusted EPS $0.74 to $0.80 • Estimated full-year adjusted tax expense of $11M to $13M
• Updating guidance for the CIS acquisition, metals prices, exchange rates and market outlook in Americas and BHVAC
• Net sales are higher due to the inclusion of CIS and partially offset by changes in the base business– Includes 4 months of CIS or approximately $160M-$170M– Negatively impacted by a stronger USD since our October call– Lower full-year net sales outlook in our base business (down 1% to 3%), mostly in Americas and BHVAC
• Maintained adjusted operating income guidance; up 3% to 12%– Also adjusting for the rise in metals since mid-September – Volume impact in Americas and BHVAC, offset by $4M-$5M from CIS
• Adjusted EPS lowered to $0.74 to $0.80, versus $0.76 in the prior year– Driven primarily by $5M incremental interest expense due to acquisition debt
Q3 FY2017 – Conclusion
17
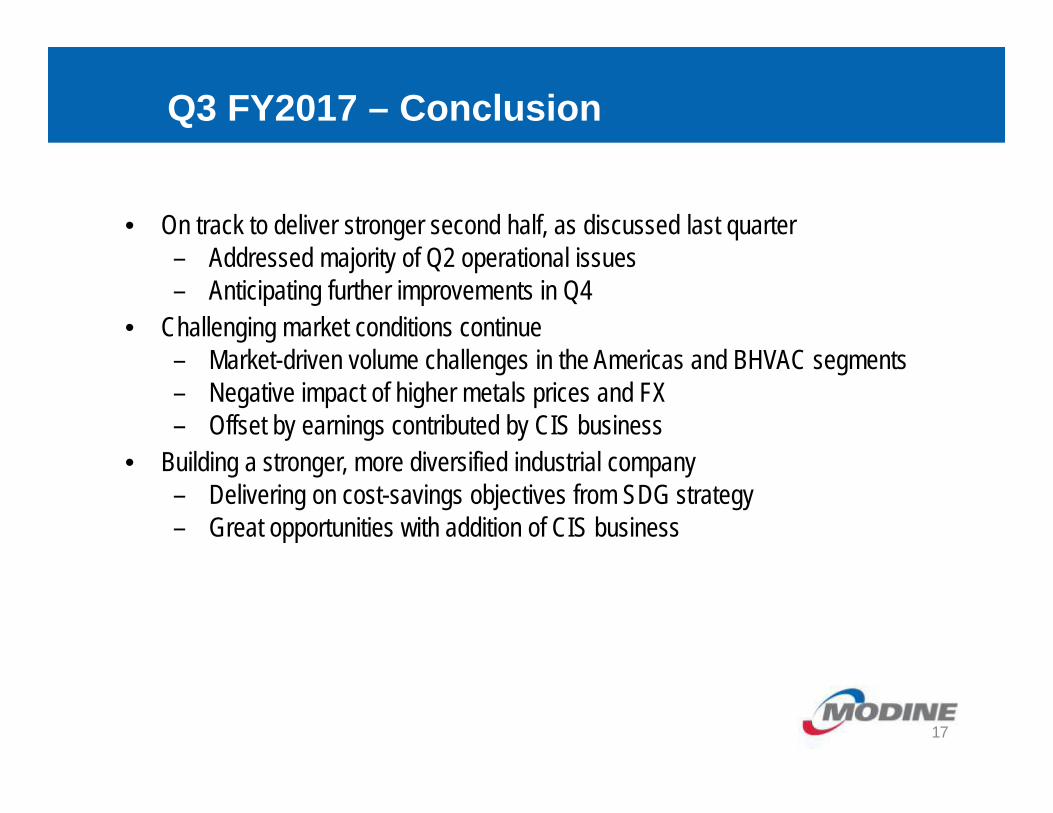
• On track to deliver stronger second half, as discussed last quarter– Addressed majority of Q2 operational issues– Anticipating further improvements in Q4
• Challenging market conditions continue– Market-driven volume challenges in the Americas and BHVAC segments– Negative impact of higher metals prices and FX– Offset by earnings contributed by CIS business
• Building a stronger, more diversified industrial company– Delivering on cost-savings objectives from SDG strategy– Great opportunities with addition of CIS business
Q&A
Appendix
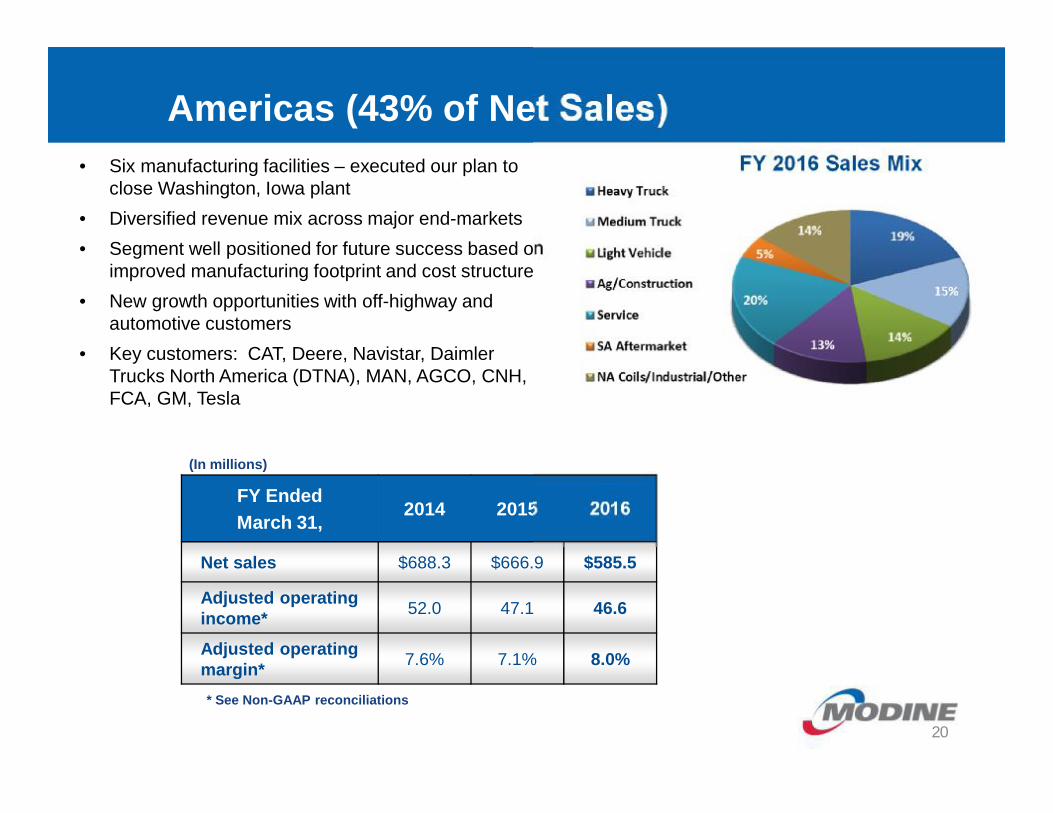
Americas (43% of Net Sales)
FY Ended March 31,
2014 2015 2016
Net sales $688.3 $666.9 $585.5
Adjusted operating income* 52.0 47.1 46.6
Adjusted operating margin* 7.6% 7.1% 8.0%
(In millions)
* See Non-GAAP reconciliations
• Six manufacturing facilities – executed our plan to close Washington, Iowa plant
• Diversified revenue mix across major end-markets• Segment well positioned for future success based on
improved manufacturing footprint and cost structure• New growth opportunities with off-highway and
automotive customers• Key customers: CAT, Deere, Navistar, Daimler
Trucks North America (DTNA), MAN, AGCO, CNH, FCA, GM, Tesla
FY 2016 Sales Mix
20
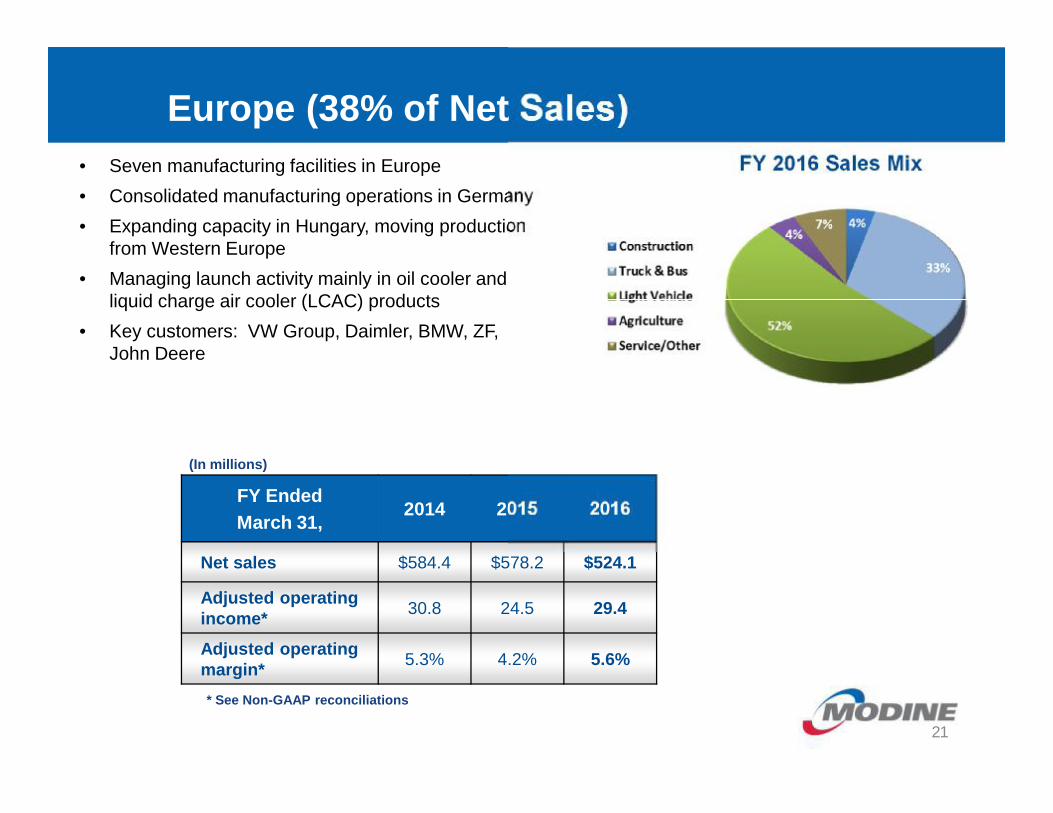
Europe (38% of Net Sales)
FY Ended March 31,
2014 2015 2016
Net sales $584.4 $578.2 $524.1
Adjusted operating income* 30.8 24.5 29.4
Adjusted operating margin* 5.3% 4.2% 5.6%
(In millions)
* See Non-GAAP reconciliations
• Seven manufacturing facilities in Europe • Consolidated manufacturing operations in Germany• Expanding capacity in Hungary, moving production
from Western Europe• Managing launch activity mainly in oil cooler and
liquid charge air cooler (LCAC) products• Key customers: VW Group, Daimler, BMW, ZF,
John Deere
FY 2016 Sales Mix
21
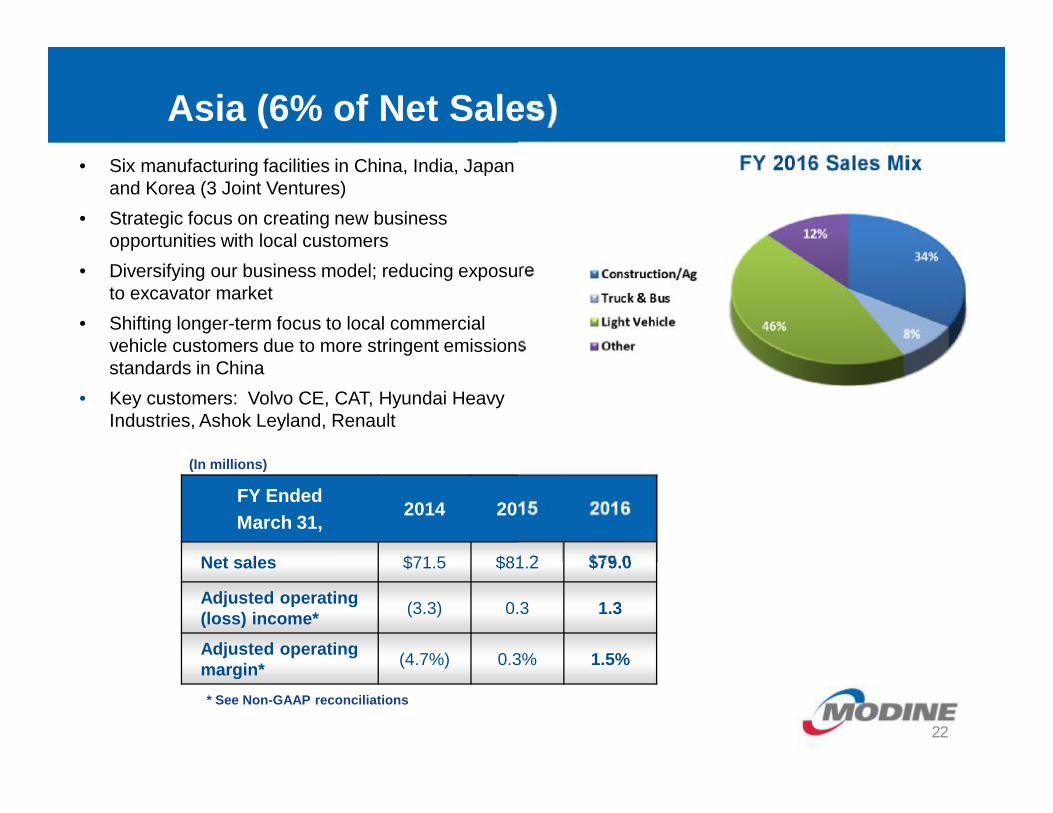
Asia (6% of Net Sales)
FY Ended March 31,
2014 2015 2016
Net sales $71.5 $81.2 $79.0
Adjusted operating (loss) income* (3.3) 0.3 1.3
Adjusted operating margin* (4.7%) 0.3% 1.5%
(In millions)
* See Non-GAAP reconciliations
FY 2016 Sales Mix• Six manufacturing facilities in China, India, Japan and Korea (3 Joint Ventures)
• Strategic focus on creating new business opportunities with local customers
• Diversifying our business model; reducing exposure to excavator market
• Shifting longer-term focus to local commercial vehicle customers due to more stringent emissions standards in China
• Key customers: Volvo CE, CAT, Hyundai Heavy Industries, Ashok Leyland, Renault
22
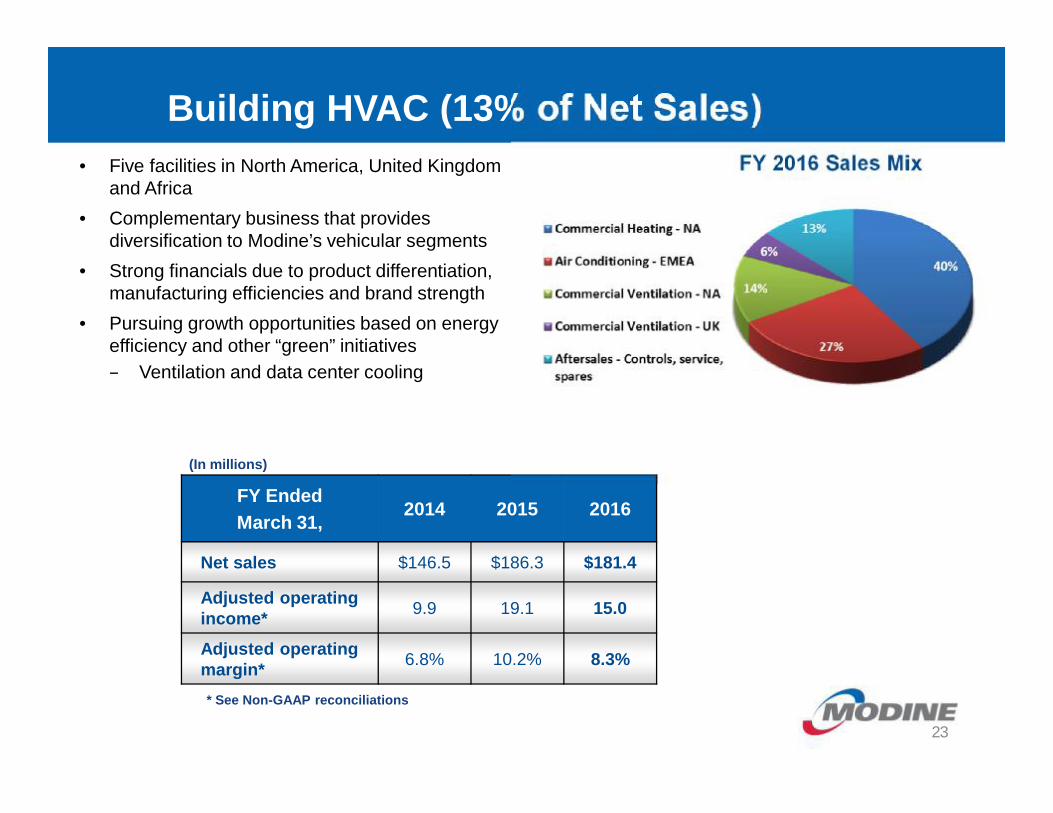
Building HVAC (13% of Net Sales)
FY Ended March 31,
2014 2015 2016
Net sales $146.5 $186.3 $181.4
Adjusted operating income* 9.9 19.1 15.0
Adjusted operating margin* 6.8% 10.2% 8.3%
(In millions)
* See Non-GAAP reconciliations
FY 2016 Sales Mix• Five facilities in North America, United Kingdom and Africa
• Complementary business that provides diversification to Modine’s vehicular segments
• Strong financials due to product differentiation, manufacturing efficiencies and brand strength
• Pursuing growth opportunities based on energy efficiency and other “green” initiatives– Ventilation and data center cooling
23
Precision cooling
CIS Product and End-market overview
Commercial AC
Industrial cooling
Mobile AC
Refrigeration
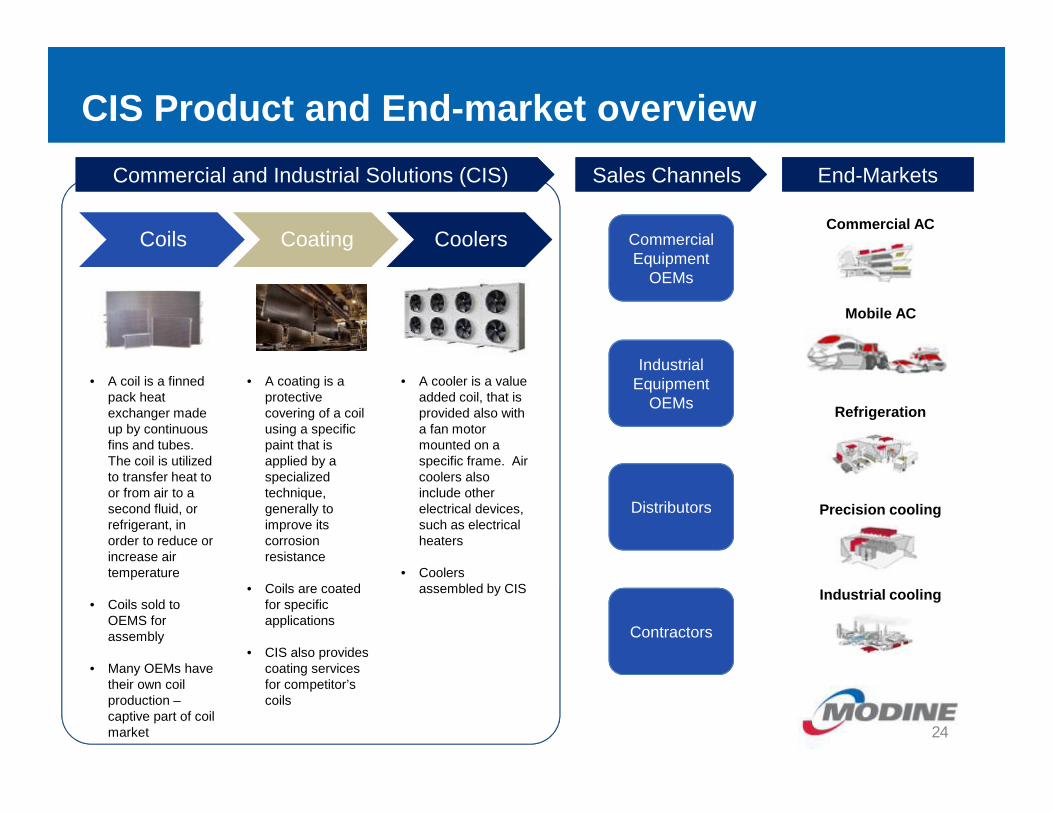
Commercial and Industrial Solutions (CIS)Commercial and Industrial Solutions (CIS) Sales ChannelsSales Channels End-MarketsEnd-Markets
Commercial Equipment
OEMs
Industrial Equipment
OEMs
Distributors
Contractors
• A coil is a finned pack heat exchanger made up by continuous fins and tubes. The coil is utilized to transfer heat to or from air to a second fluid, or refrigerant, in order to reduce or increase air temperature
• Coils sold to OEMS for assembly
• Many OEMs have their own coil production –captive part of coil market
• A coating is a protective covering of a coil using a specific paint that is applied by a specialized technique, generally to improve its corrosion resistance
• Coils are coated for specific applications
• CIS also provides coating services for competitor’s coils
• A cooler is a value added coil, that is provided also with a fan motor mounted on a specific frame. Air coolers also include other electrical devices, such as electrical heaters
• Coolers assembled by CIS
Coils Coating Coolers
24
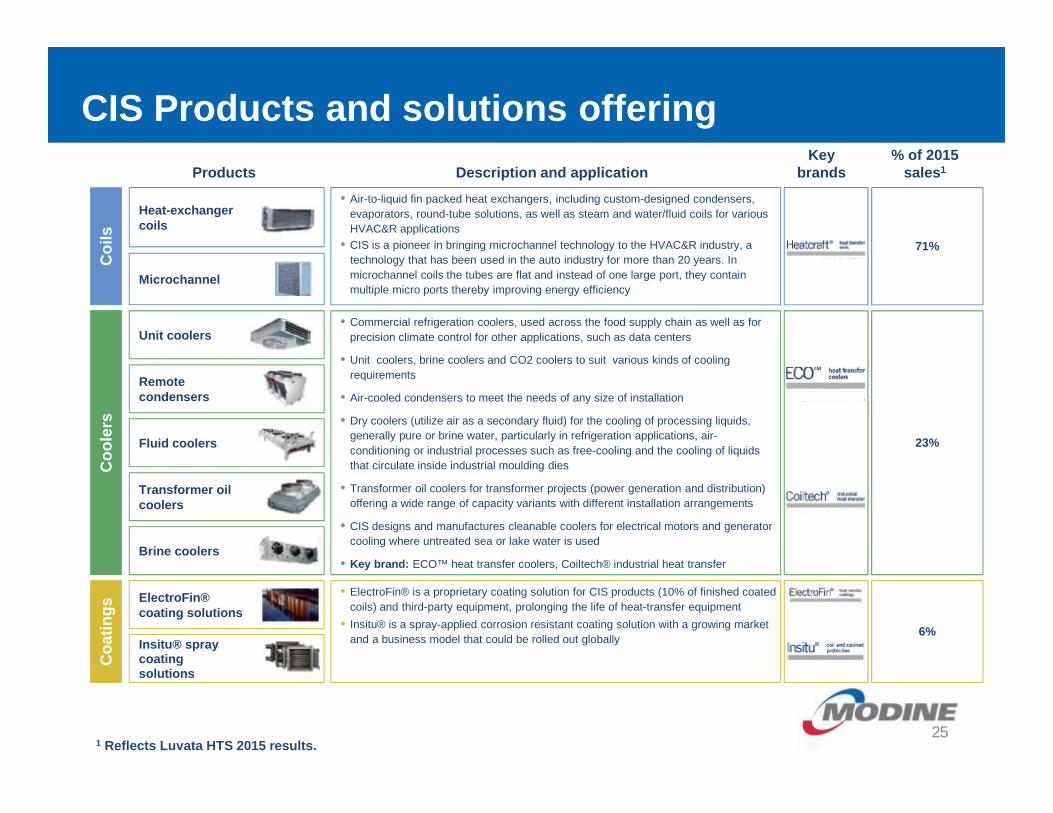
CIS Products and solutions offeringC
oils
Coo
lers
Coa
tings
Products
Heat-exchanger coils
Microchannel
Unit coolers
Remote condensers
Fluid coolers
Transformer oil coolers
Brine coolers
ElectroFin® coating solutions
Insitu® spray coating solutions
Description and application% of 2015
sales1
• Air-to-liquid fin packed heat exchangers, including custom-designed condensers, evaporators, round-tube solutions, as well as steam and water/fluid coils for various HVAC&R applications
• CIS is a pioneer in bringing microchannel technology to the HVAC&R industry, a technology that has been used in the auto industry for more than 20 years. In microchannel coils the tubes are flat and instead of one large port, they contain multiple micro ports thereby improving energy efficiency
• Commercial refrigeration coolers, used across the food supply chain as well as for precision climate control for other applications, such as data centers
• Unit coolers, brine coolers and CO2 coolers to suit various kinds of cooling requirements
• Air-cooled condensers to meet the needs of any size of installation
• Dry coolers (utilize air as a secondary fluid) for the cooling of processing liquids, generally pure or brine water, particularly in refrigeration applications, air-conditioning or industrial processes such as free-cooling and the cooling of liquids that circulate inside industrial moulding dies
• Transformer oil coolers for transformer projects (power generation and distribution) offering a wide range of capacity variants with different installation arrangements
• CIS designs and manufactures cleanable coolers for electrical motors and generator cooling where untreated sea or lake water is used
• Key brand: ECO™ heat transfer coolers, Coiltech® industrial heat transfer
• ElectroFin® is a proprietary coating solution for CIS products (10% of finished coated coils) and third-party equipment, prolonging the life of heat-transfer equipment
• Insitu® is a spray-applied corrosion resistant coating solution with a growing market and a business model that could be rolled out globally
71%
23%
6%
Keybrands
1 Reflects Luvata HTS 2015 results.25
Q3 GAAP Income Statement
26
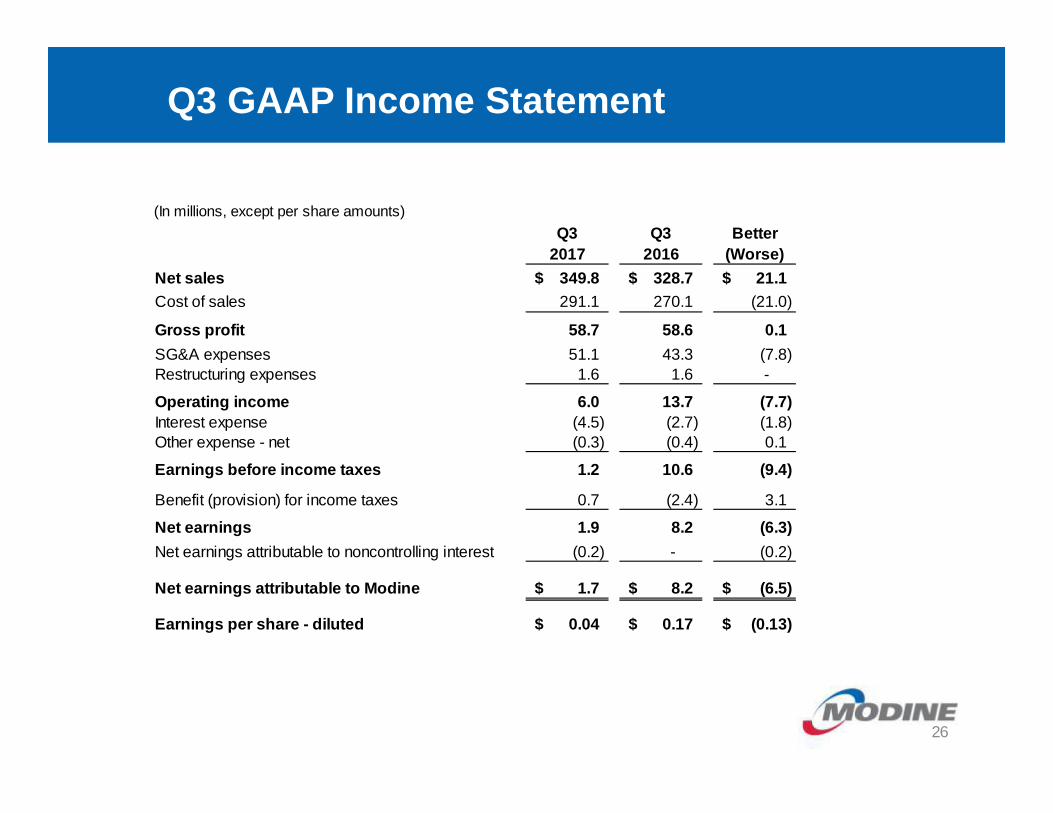
(In millions, except per share amounts)Q3 Q3 Better
2017 2016 (Worse)Net sales 349.8$ 328.7$ 21.1$ Cost of sales 291.1 270.1 (21.0)
Gross profit 58.7 58.6 0.1SG&A expenses 51.1 43.3 (7.8) Restructuring expenses 1.6 1.6 -
Operating income 6.0 13.7 (7.7)Interest expense (4.5) (2.7) (1.8) Other expense - net (0.3) (0.4) 0.1
Earnings before income taxes 1.2 10.6 (9.4)
Benefit (provision) for income taxes 0.7 (2.4) 3.1
Net earnings 1.9 8.2 (6.3)Net earnings attributable to noncontrolling interest (0.2) - (0.2)
Net earnings attributable to Modine 1.7$ 8.2$ (6.5)$
Earnings per share - diluted 0.04$ 0.17$ (0.13)$
Non-GAAP Reconciliations
27
Modine Manufacturing CompanyAdjusted operating income and earnings per share (unaudited)
(In millions, except per share amounts)
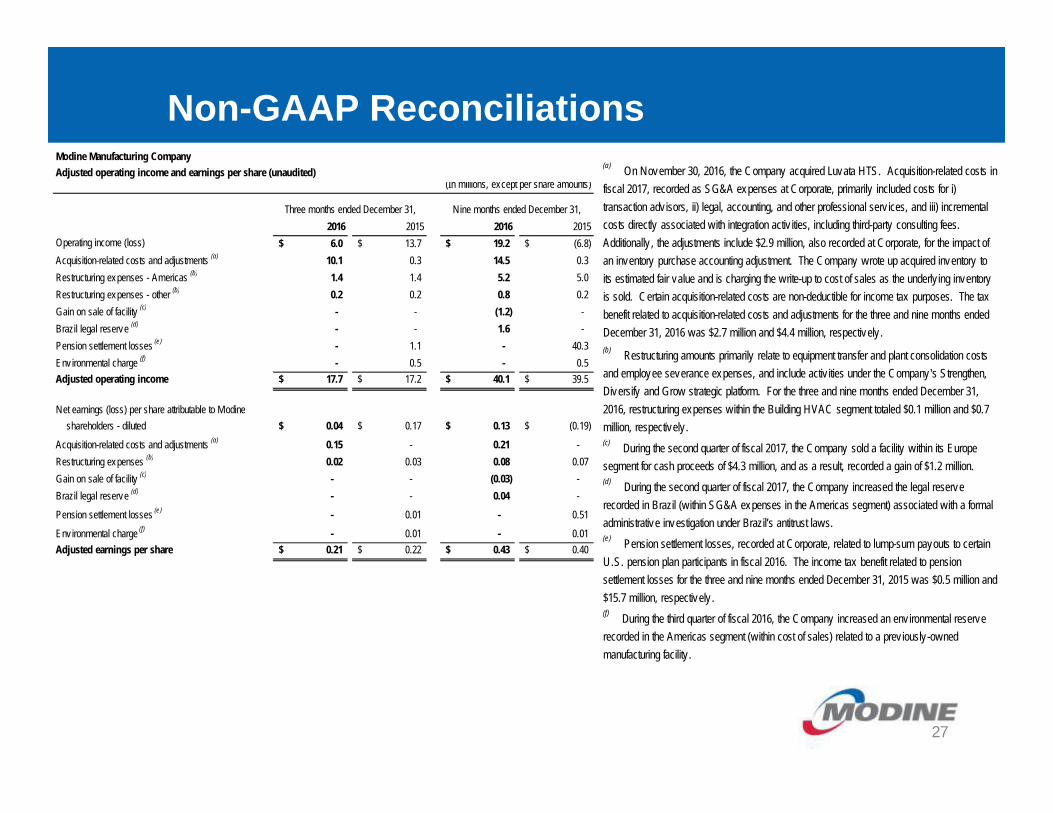
2016 2015 2016 2015Operating income (loss) 6.0$ 13.7$ 19.2$ (6.8)$ Acquisition-related costs and adjustments (a) 10.1 0.3 14.5 0.3 Restructuring expenses - Americas (b) 1.4 1.4 5.2 5.0 Restructuring expenses - other (b) 0.2 0.2 0.8 0.2 Gain on sale of facility (c) - - (1.2) - Brazil legal reserve (d) - - 1.6 - Pension settlement losses (e) - 1.1 - 40.3 Env ironmental charge (f) - 0.5 - 0.5 Adjusted operating income 17.7$ 17.2$ 40.1$ 39.5$
Net earnings (loss) per share attributable to Modine shareholders - diluted 0.04$ 0.17$ 0.13$ (0.19)$
Acquisition-related costs and adjustments (a) 0.15 - 0.21 - Restructuring expenses (b) 0.02 0.03 0.08 0.07 Gain on sale of facility (c) - - (0.03) - Brazil legal reserve (d) - - 0.04 -
Pension settlement losses (e) - 0.01 - 0.51
Env ironmental charge (f) - 0.01 - 0.01 Adjusted earnings per share 0.21$ 0.22$ 0.43$ 0.40$
Three months ended December 31, Nine months ended December 31,
(a) On November 30, 2016, the Company acquired Luvata HTS. Acquisition-related costs in fiscal 2017, recorded as SG&A expenses at Corporate, primarily included costs for i) transaction advisors, ii) legal, accounting, and other professional serv ices, and iii) incremental costs directly associated with integration activ ities, including third-party consulting fees. Additionally , the adjustments include $2.9 million, also recorded at Corporate, for the impact of an inventory purchase accounting adjustment. The Company wrote up acquired inventory to its estimated fair value and is charging the write-up to cost of sales as the underly ing inventory is sold. Certain acquisition-related costs are non-deductible for income tax purposes. The tax benefit related to acquisition-related costs and adjustments for the three and nine months ended December 31, 2016 was $2.7 million and $4.4 million, respectively . (b) Restructuring amounts primarily relate to equipment transfer and plant consolidation costs and employee severance expenses, and include activ ities under the Company's Strengthen, Diversify and Grow strategic platform. For the three and nine months ended December 31, 2016, restructuring expenses within the Building HVAC segment totaled $0.1 million and $0.7 million, respectively. (c) During the second quarter of fiscal 2017, the Company sold a facility within its Europe segment for cash proceeds of $4.3 million, and as a result, recorded a gain of $1.2 million.(d) During the second quarter of fiscal 2017, the Company increased the legal reserve recorded in Brazil (within SG&A expenses in the Americas segment) associated with a formal administrative investigation under Brazil’s antitrust laws.(e) Pension settlement losses, recorded at Corporate, related to lump-sum payouts to certain U.S. pension plan participants in fiscal 2016. The income tax benefit related to pension settlement losses for the three and nine months ended December 31, 2015 was $0.5 million and $15.7 million, respectively .(f) During the third quarter of fiscal 2016, the Company increased an environmental reserve recorded in the Americas segment (within cost of sales) related to a previously -owned manufacturing facility .
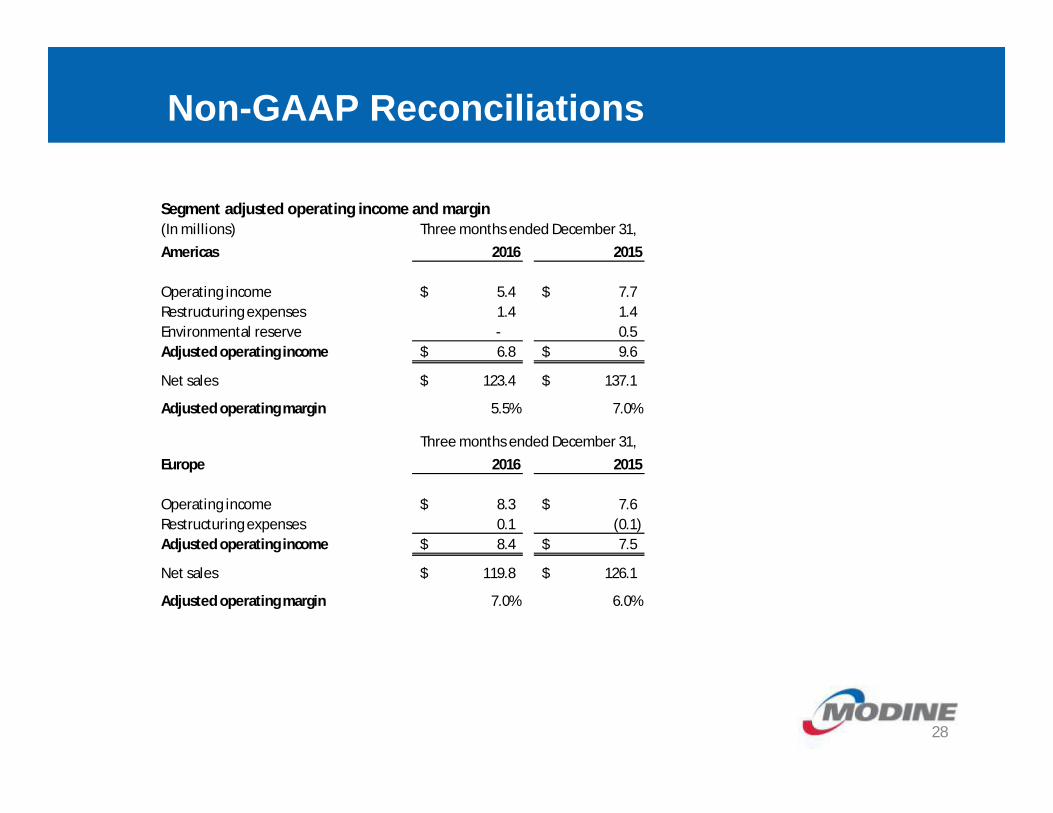
Segment adjusted operating income and margin(In millions)Americas 2016 2015
Operating income 5.4$ 7.7$ Restructuring expenses 1.4 1.4 Environmental reserve - 0.5 Adjusted operating income 6.8$ 9.6$
Net sales 123.4$ 137.1$
Adjusted operating margin 5.5% 7.0%
Three months ended December 31,
Non-GAAP Reconciliations
28
Europe 2016 2015
Operating income 8.3$ 7.6$ Restructuring expenses 0.1 (0.1) Adjusted operating income 8.4$ 7.5$
Net sales 119.8$ 126.1$
Adjusted operating margin 7.0% 6.0%
Three months ended December 31,
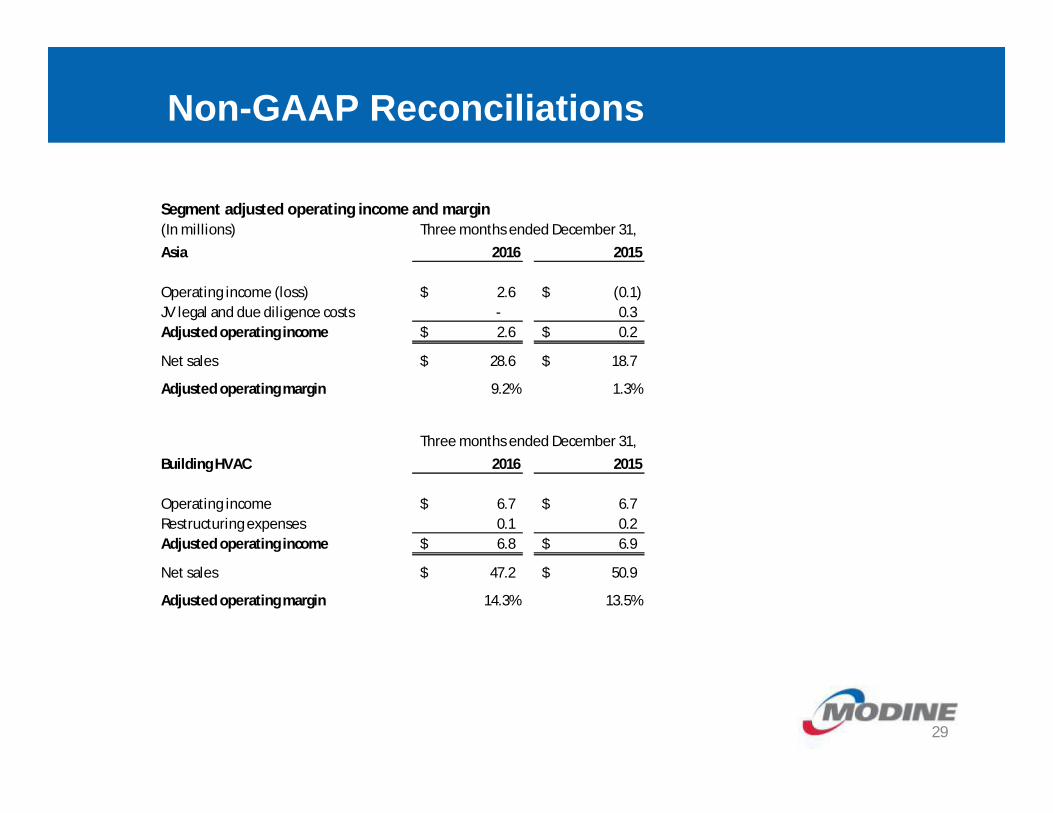
Segment adjusted operating income and margin(In millions)Asia 2016 2015
Operating income (loss) 2.6$ (0.1)$ JV legal and due diligence costs - 0.3 Adjusted operating income 2.6$ 0.2$
Net sales 28.6$ 18.7$
Adjusted operating margin 9.2% 1.3%
Three months ended December 31,
Building HVAC 2016 2015
Operating income 6.7$ 6.7$ Restructuring expenses 0.1 0.2 Adjusted operating income 6.8$ 6.9$
Net sales 47.2$ 50.9$
Adjusted operating margin 14.3% 13.5%
Three months ended December 31,
Non-GAAP Reconciliations
29
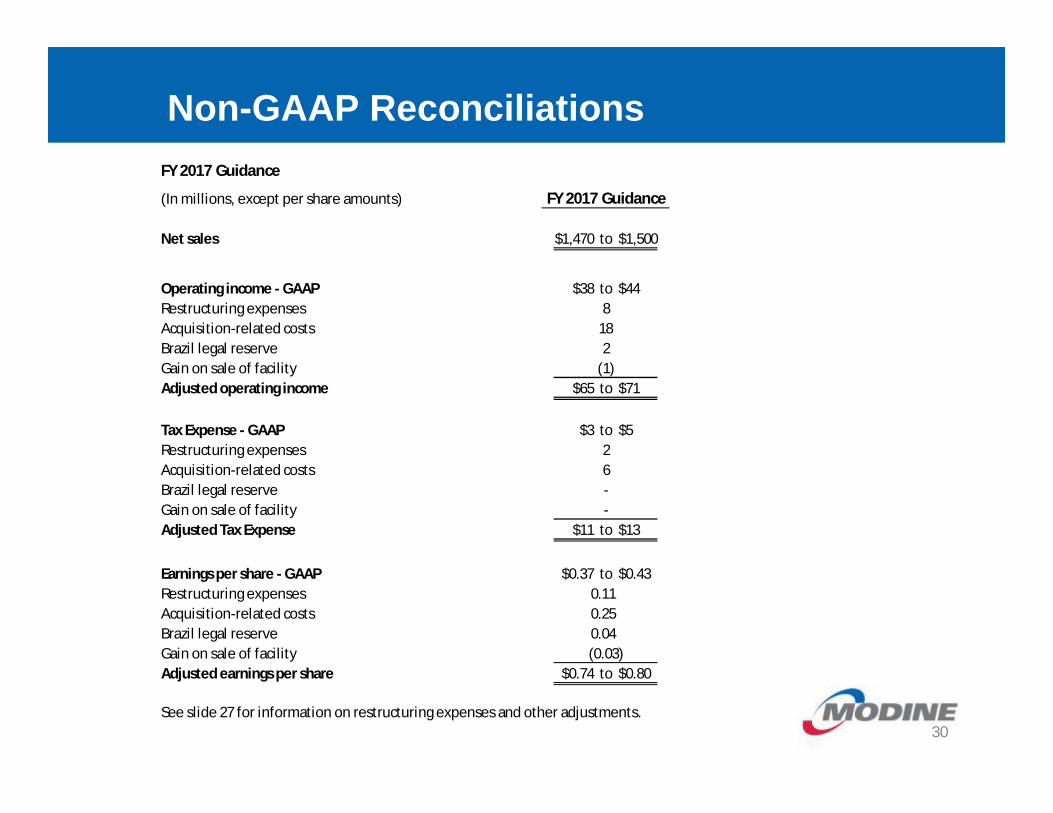
FY 2017 Guidance
(In millions, except per share amounts) FY 2017 Guidance
Net sales $1,470 to $1,500
Operating income - GAAP $38 to $44Restructuring expenses 8Acquisition-related costs 18Brazil legal reserve 2Gain on sale of facility (1)Adjusted operating income $65 to $71
Tax Expense - GAAP $3 to $5Restructuring expenses 2Acquisition-related costs 6Brazil legal reserve -Gain on sale of facility -Adjusted Tax Expense $11 to $13
Earnings per share - GAAP $0.37 to $0.43Restructuring expenses 0.11Acquisition-related costs 0.25Brazil legal reserve 0.04Gain on sale of facility (0.03)Adjusted earnings per share $0.74 to $0.80
See slide 27 for information on restructuring expenses and other adjustments.
Non-GAAP Reconciliations
30
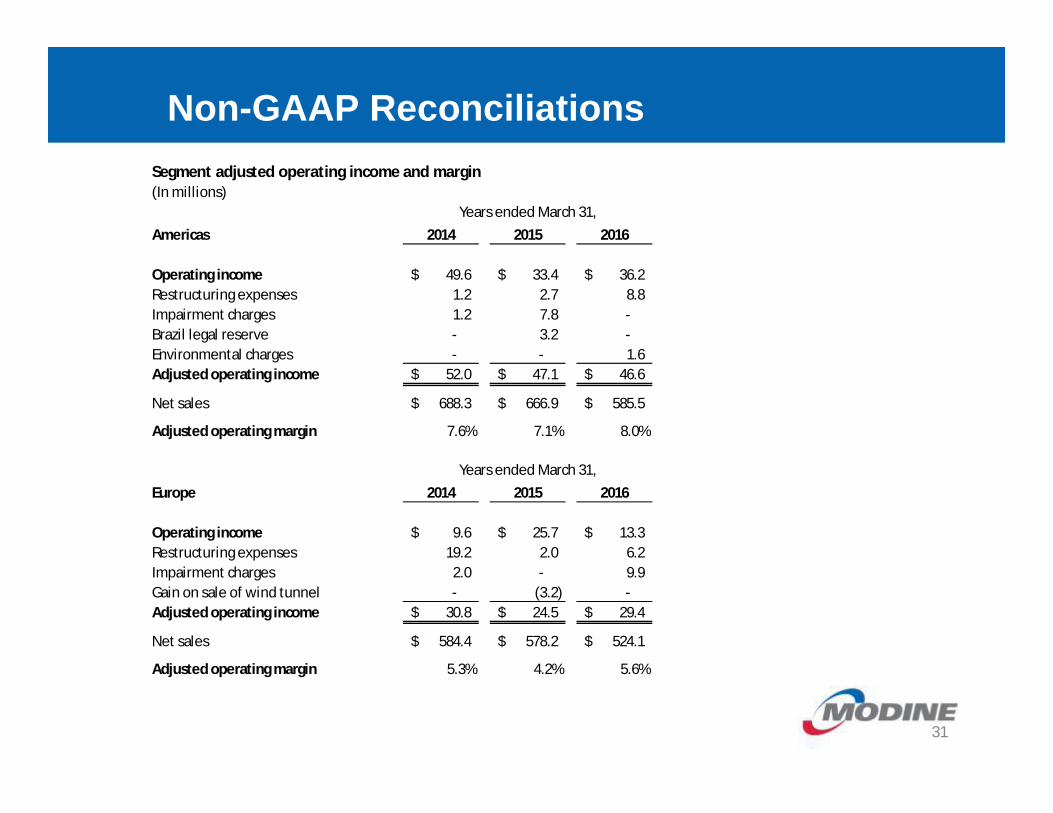
Segment adjusted operating income and margin(In millions)
Americas 2014 2015 2016
Operating income 49.6$ 33.4$ 36.2$ Restructuring expenses 1.2 2.7 8.8 Impairment charges 1.2 7.8 - Brazil legal reserve - 3.2 - Environmental charges - - 1.6 Adjusted operating income 52.0$ 47.1$ 46.6$
Net sales 688.3$ 666.9$ 585.5$
Adjusted operating margin 7.6% 7.1% 8.0%
Years ended March 31,
Non-GAAP Reconciliations
31
Europe 2014 2015 2016
Operating income 9.6$ 25.7$ 13.3$ Restructuring expenses 19.2 2.0 6.2 Impairment charges 2.0 - 9.9 Gain on sale of wind tunnel - (3.2) - Adjusted operating income 30.8$ 24.5$ 29.4$
Net sales 584.4$ 578.2$ 524.1$
Adjusted operating margin 5.3% 4.2% 5.6%
Years ended March 31,
(In millions)
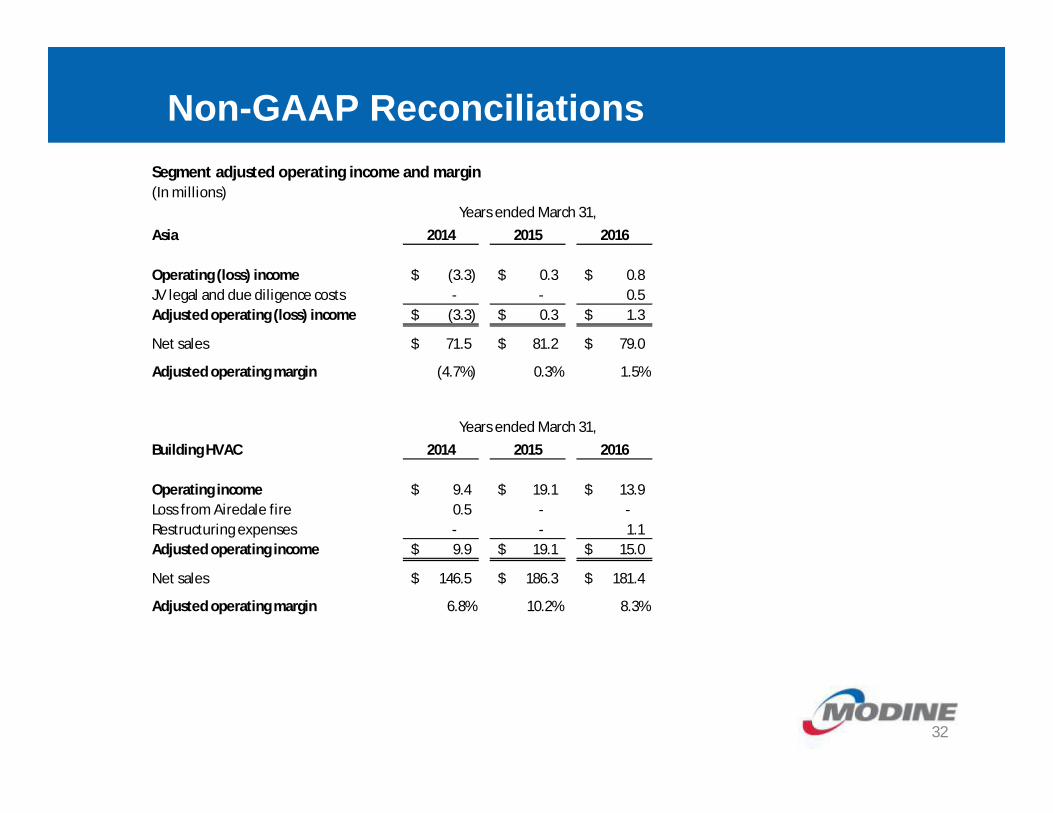
Asia 2014 2015 2016
Operating (loss) income (3.3)$ 0.3$ 0.8$ JV legal and due diligence costs - - 0.5 Adjusted operating (loss) income (3.3)$ 0.3$ 1.3$
Net sales 71.5$ 81.2$ 79.0$
Adjusted operating margin (4.7%) 0.3% 1.5%
Segment adjusted operating income and margin
Years ended March 31,
Non-GAAP Reconciliations
32
Building HVAC 2014 2015 2016
Operating income 9.4$ 19.1$ 13.9$ Loss from Airedale fire 0.5 - - Restructuring expenses - - 1.1 Adjusted operating income 9.9$ 19.1$ 15.0$
Net sales 146.5$ 186.3$ 181.4$
Adjusted operating margin 6.8% 10.2% 8.3%
Years ended March 31,