Embed Size (px)
Citation preview


Third Quarter – Fiscal 2014
Table of Contents Interim Management’s Discussion and Analysis .................................. Page 2
Interim Consolidated Financial Statements ....................................... Page 24

Postmedia Network Canada Corp. Third Quarter – Fiscal 2014 Page 2
POSTMEDIA NETWORK CANADA CORP. INTERIM MANAGEMENT’S DISCUSSION AND ANALYSIS FOR THE THREE AND NINE MONTHS ENDED MAY 31, 2014 AND 2013 Issued: July 10, 2014

Postmedia Network Canada Corp. Third Quarter – Fiscal 2014 Page 3
JULY 10, 2014
MANAGEMENT’S DISCUSSION AND ANALYSIS This management’s discussion and analysis of financial condition and results of operations of Postmedia Network Canada Corp. and its subsidiary Postmedia Network Inc. (collectively, “we”, “our”, “us”, or “Postmedia”) should be read in conjunction with the interim condensed consolidated financial statements and related notes of Postmedia for the three and nine months ended May 31, 2014 and 2013 and the annual audited consolidated financial statements and related notes for the years ended August 31, 2013, 2012 and 2011. The interim condensed consolidated financial statements of Postmedia for the three and nine months ended May 31, 2014 and 2013 and the annual audited consolidated financial statements for the years ended August 31, 2013, 2012 and 2011 are available on SEDAR at www.sedar.com and on the EDGAR system maintained by the U.S. Securities and Exchange Commission at www.sec.gov. This discussion contains statements that are not historical facts and are forward-looking statements. These statements are subject to a number of risks described in the section entitled “Risk Factors” contained in our annual management’s discussion and analysis for the years ended August 31, 2013, 2012 and 2011. Risks and uncertainties may cause actual results to differ materially from those contained in such forward-looking statements. Such statements reflect management’s current views and are based on certain assumptions. They are only estimates of future developments, and actual developments may differ materially from these statements due to a number of factors. Investors are cautioned not to place undue reliance on such forward-looking statements. No forward-looking statement is a guarantee of future results. We have tried, where possible, to identify such statements by using words such as “believe”, “expect”, “estimate”, “anticipate”, “will”, “could” and similar expressions in connection with any discussion of future operating or financial performance. Except as required by law, we undertake no obligation to publicly update or revise any forward-looking statements or information, whether written or oral, that may be as a result of new information, future events or otherwise. All amounts are expressed in Canadian dollars unless otherwise noted. The interim condensed consolidated financial statements of Postmedia for the three and nine months ended May 31, 2014 and 2013 have been prepared in accordance with International Financial Reporting Standards (“IFRS”) and International Accounting Standard (“IAS”) 34 – Interim Financial Reporting. This management’s discussion and analysis is dated July 10, 2014 and does not reflect changes or information subsequent to this date. Additional information in respect of Postmedia is available on SEDAR at www.sedar.com and EDGAR at www.sec.gov.

Postmedia Network Canada Corp. Third Quarter – Fiscal 2014 Page 4
Overview and Background
We are the largest publisher by circulation of paid English-language daily newspapers in Canada, according to Newspapers Canada’s 2013 Circulation Data Report. We have the highest weekly print readership of paid English-language daily newspapers in Canada, based on the NADbank 2013 survey data. Our business consists of news and information gathering and dissemination operations, with products offered in major Canadian markets and a number of regional and local markets in Canada through a variety of print, web, tablet and smartphone platforms. The combination of these distribution platforms provides readers with a variety of mediums through which to access and interact with our content. The breadth of our reach and the diversity of our content enable advertisers to reach their target audiences on a local, regional or national scale through the convenience of a single provider.
For financial reporting purposes we have one operating segment, the Newspaper segment, which publishes daily and non-daily newspapers and operates digital media and online assets including the canada.com website, each newspaper’s online website and Infomart, our media monitoring service. Recent Developments
In August 2013, we outsourced the production of the Edmonton Journal and entered into a print outsourcing agreement for the production of the Calgary Herald, which began in November 2013. On September 9, 2013, we announced our intention to sell two of our real estate holdings. The net proceeds from these potential sales will be used to make an offer to redeem an equal amount of our 8.25% Senior Secured Notes due 2017 (“First-Lien Notes”). In addition, in November 2013 and May 2014, we committed to third party outsourcing contracts for the production of our Vancouver newspapers, which includes both The Vancouver Sun and The Province, and The Gazette (Montreal), respectively. The print outsourcing agreement for the production of The Gazette will begin August, 2014. On July 9, 2014 we signed a commitment letter for a new senior secured asset-based revolving credit facility (the “New ABL Facility”) for an aggregate amount of up to $20.0 million subject to completion of definitive documentation. The New ABL Facility will replace our existing facility that will terminate on July 13, 2014. The New ABL Facility will mature one year from the closing date and will be secured on a first-priority basis by accounts receivable, cash and inventory of Postmedia Network Inc. and any related assets of the Company and on a third priority basis by the First-Lien Notes collateral.
Key Factors Affecting Operating Results Revenue is earned primarily from advertising, circulation and digital sources. Print advertising revenue is a function of the volume, or linage, of advertising sold and rates charged. Print circulation revenue is derived from home-delivery subscriptions for newspapers, single copy sales at retail outlets and vending machines and is a function of the number of newspapers sold and the price per copy. Digital revenue consists of revenue from national and local display advertising on our newspaper and other websites, including canada.com, revenue from e-Papers and digital access subscriptions, as well as subscription revenue generated through Infomart, our media monitoring service.

Postmedia Network Canada Corp. Third Quarter – Fiscal 2014 Page 5
Print advertising revenue was $94.7 million for the three months ended May 31, 2014, representing 55.4% of total revenue. The following chart summarizes our print advertising revenue by category for the three months ended May 31, 2014 ($ in millions):
Print advertising revenue was $301.3 million for the nine months ended May 31, 2014, representing 57.1% of total revenue. The following chart summarizes our print advertising revenue by category for the nine months ended May 31, 2014 ($ in millions):
Print advertising is influenced by both the overall strength of the economy and significant structural changes in the newspaper industry and media in general. In recent years and continuing to date, economic uncertainty and structural changes in the industry have resulted in significant declines in print advertising as well as a continuing shift in advertising dollars from print advertising to advertising in other formats, particularly online and other digital platforms such as search and social media websites. This shift is expected to continue and may be permanent. We anticipate the print advertising market to remain challenging and expect current trends to continue throughout the remainder of fiscal 2014. During the three and nine months ended May 31, 2014, we experienced print advertising revenue declines of 16.5% and 14.3%, respectively, as compared to the same periods in the prior year. The decline in print advertising revenue in the three and nine months ended May 31, 2014 relates to weakness in all major advertising categories including classified, retail and national.

Postmedia Network Canada Corp. Third Quarter – Fiscal 2014 Page 6
Print circulation revenue was $49.0 million and $146.2 million for the three and nine months ended May 31, 2014, representing 28.7% and 27.7% of total revenue for such periods, respectively. Declines in circulation volumes have been experienced over the last few years and this trend continued in the three and nine months ended May 31, 2014 however volume declines have been offset by price increases which include strategic pricing for new subscription bundles. During the three and nine months ended May 31, 2014, we experienced circulation revenue declines of 0.8% and 0.3%, respectively, as compared to the same period in the prior year. We expect print circulation revenue to remain stable throughout the remainder of fiscal 2014.
Digital revenue was $23.1 million and $67.8 million for the three and nine months ended May 31, 2014, representing 13.5% and 12.8% of total revenue for such periods, respectively. Digital revenues decreased 4.3% and 3.5% in the three and nine months ended May 31, 2014, respectively, as compared to the same periods in the prior year as a result of decreases in local digital advertising revenue and digital classified revenue. We continue to believe digital revenue represents a future growth opportunity for Postmedia and as a result we are focused on various new products and initiatives in this area.
Our principal expenses consist of compensation, newsprint, and distribution. These composed 49.9%, 5.2% and 17.9%, respectively, of total operating expenses excluding depreciation, amortization and restructuring for the three months ended May 31, 2014 and 50.4%, 5.6% and 17.8%, respectively, of total operating expenses excluding depreciation, amortization and restructuring for the nine months ended May 31, 2014. We experienced declines in compensation, newsprint and distribution expenses of 12.7%, 25.2% and 5.7%, respectively, in the three months ended May 31, 2014 and 11.7%, 24.9% and 6.2%, respectively, in the nine months ended May 31, 2014, as compared to the same periods in the prior year.
We are in the process of implementing a three year business transformation program which was announced in July 2012 (“Transformation Program”) that will focus on the development of our digital products and is targeted to result in operating cost savings of 15% to 20%. During the three months ended May 31, 2014 as part of our Transformation Program we implemented initiatives which are expected to result in an additional $8 million of net annualized cost savings. In total, we have implemented net annualized cost savings of approximately $106 million, or 15% of operating costs, since the Transformation Program was announced.
Our operating results are affected by variations in the cost and availability of newsprint. Newsprint is the principal raw material used in the production of our daily newspapers and other print publications. It is a commodity that is generally subject to price volatility. We take advantage of the purchasing power that comes with the large volume of newsprint we purchase, as well as our proximity to paper mills across Canada, to minimize our total newsprint expense. Changes in newsprint prices can significantly affect our operating results. A $50 per tonne increase or decrease in the price of newsprint would be expected to affect our newsprint expense by approximately $2.7 million on an annualized basis. We don’t expect a material change in newsprint prices throughout the remainder of fiscal 2014.
Our distribution is primarily outsourced to third party suppliers. The key drivers of our distribution expenses are fuel costs and circulation and insert volumes. Our distribution expenses have decreased during the three and nine months ended May 31, 2014 primarily as a result of a reduction in newspaper circulation volumes and cost reduction initiatives.

Postmedia Network Canada Corp. Third Quarter – Fiscal 2014 Page 7
Additional IFRS Measures We use operating income before depreciation, amortization, impairment and restructuring, as presented in the condensed consolidated statements of operations for the three and nine months ended May 31, 2014 and 2013 and described in note 3 thereto, to assist in assessing our financial performance. Management and the Board of Directors of Postmedia use this measure to evaluate consolidated operating results and to assess Postmedia’s ability to incur and service debt. In addition, this measure is used to make operating decisions as it is an indicator of how much cash is being generated by Postmedia and assists in determining the need for additional cost reductions, evaluation of personnel and resource allocation decisions. Operating income before depreciation, amortization, impairment and restructuring is referred to as an additional IFRS measure and may not be comparable to similar measures presented by other companies. Other Factors
Seasonality
Revenue has experienced, and is expected to continue to experience, significant seasonality due to seasonal advertising patterns and seasonal influences on media consumption habits. Typically, our advertising revenue is highest in the first and third fiscal quarters, while expenses are relatively constant throughout the fiscal year. These seasonal variations may lead to increased borrowing needs at certain points within the fiscal year.
Critical accounting estimates
The preparation of financial statements in accordance with IFRS requires management to make estimates, assumptions and judgements that affect the reported amounts of assets and liabilities, related amounts of revenues and expenses, and disclosure of contingent assets and liabilities. Although these estimates, assumptions and judgements are based upon management’s best knowledge of the amount, event or actions; actual results could differ from those estimates, assumptions and judgements. The critical accounting estimates used in our interim condensed consolidated financial statements for the three and nine months ended May 31, 2014 and 2013 are not materially different from those disclosed in our annual management’s discussion and analysis and annual audited consolidated financial statements for the years ended August 31, 2013, 2012 and 2011 except as described below:
Employee future benefits
The cost of defined benefit pension benefit plans, post-retirement benefit plans and other long-term employee benefit plans and the present value of the defined benefit obligation are determined using actuarial valuations. An actuarial valuation involves making various assumptions including mortality rates. In July 2013, the Canadian Institute of Actuaries (“CIA”) issued a draft report proposing new mortality tables for use in the valuation of Canadian pension and benefit plans. On October 31, 2013 the CIA announced that the use of current mortality tables without adjustment would only be appropriate if supported by credible experience, the characteristics of the specific plan, or other quantifiable experience. As a result, during the three months ended November 30, 2013, we modified the mortality tables used to value the defined benefit pension benefit and post-retirement benefit obligations which resulted in an actuarial loss of $15.6 million recorded in other comprehensive income with an offsetting increase in other non-current liabilities. In February 2014, the CIA issued final mortality tables and we assessed the impact of the revisions and determined that no further adjustments were required. The change in mortality rate assumptions is expected to result in increased funding valuation obligations as well as increased defined benefit plan expense in future years.

Postmedia Network Canada Corp. Third Quarter – Fiscal 2014 Page 8
Changes in accounting policies
We have adopted the following new and amended standards effective September 1, 2013. The comparative interim condensed consolidated financial statements have been revised as applicable to reflect the adopted standards as described below.
(i) IFRS 13 – Fair Value Measurement
IFRS 13 – Fair Value Measurement establishes a single source of guidance for fair value measurement across all IFRS standards. IFRS 13 defines fair value, provides guidance on measurement and introduces certain disclosure requirements. We adopted IFRS 13 on September 1, 2013 on a prospective basis. The adoption of IFRS 13 did not result in any measurement adjustments or changes to the valuation techniques used. We have included the required interim disclosures in note 12 of our interim condensed consolidated financial statements for the three and nine months ended May 31, 2014 and 2013. (ii) IAS 19 – Employee Benefits (Amended) IAS 19 – Employee Benefits (Amended) includes a number of changes related to the recognition and measurement of defined benefit employee benefit plans and termination benefits. The amendments introduce a net interest approach that replaces the expected return on plan assets and interest costs on the defined benefit obligation with a single net interest component which will be determined based on the application of the discount rate on the net defined benefit obligation. As a result the discount rate previously used to calculate the interest costs on plan obligations is now also being used to calculate the expected return on plan assets. The amendments also require the recognition of all past service costs in profit or loss when the employee benefit plan is amended. We adopted IAS 19 on September 1, 2013 on a retrospective basis back to September 1, 2011. The adoption of IAS 19 has resulted in an adjustment to the opening deficit as at September 1, 2011 to reflect previously unrecognized past service costs. Additionally, the comparative figures in the interim condensed consolidated financial statements for the three and nine months ended May 31, 2014 and 2013 have been revised as illustrated in the tables below to reflect the new standard. The amended standard also clarifies when an employer offers voluntary termination benefits that the obligating event under such termination benefits is deemed to have occurred when an entity can no longer withdraw the offer. This resulted in a decrease to restructuring and other items of $10.5 million in the three months ended May 31, 2013 and a corresponding increase to restructuring and other items of $10.5 million in the three months ended August 31, 2013.

Postmedia Network Canada Corp. Third Quarter – Fiscal 2014 Page 9
The following tables provide the impact of the IAS 19 changes described above on the comparative financial information in the interim condensed consolidated financial statements for the three and nine months ended May 31, 2014 and 2013. Effect on comprehensive income attributable to equity holders of the Company
Three months ended May 31, 2013
Nine months ended May 31, 2013
Net loss attributable to equity holders of the Company as previously reported (112,166) (118,024)
IAS 19 amendments (increasing) decreasing reported net loss Compensation……………………………………………………..…………………………………………… (119) (357) Restructuring and other items……………………………………………………..………………………… 10,509 10,509 Net financing expense relating to employee benefit plans……………………………………………… (1,480) (4,441) Total IAS 19 amendments decreasing reported net loss 8,910 5,711 Net loss attributable to equity holders of the Company revised (1) (103,256) (112,313)
Comprehensive loss attributable to equity holders of the Company as previously reported (116,439) (107,099)
IAS 19 amendments decreasing reported comprehensive income Impact of IAS 19 amendments to net loss………………………………………………………………… 8,910 5,711 Net actuarial gains on employee benefits………………………………………………………………… 1,661 4,984 Total IAS 19 amendments decreasing reported comprehensive loss 10,571 10,695 Comprehensive loss attributable to equity holders of the Company revised (105,868) (96,404)
(1) These adjustments decreased basic and diluted net loss per share attributable to equity holders of the Company for the three and
nine months ended May 31, 2013 by $0.14 per share and $0.22 per share, respectively.
Effect on the consolidated statements of financial position
Increase August 31,
2013August 31,
2012September 1,
2011
Other non-current liabilities…………………………………………………… 1,675 1,923 2,171 Deficit…………………………………………………………….………………… 1,675 1,923 2,171
(iii) IFRS 10 – Consolidated Financial Statements IFRS 10 – Consolidated Financial Statements replaces SIC-12 Consolidation – Special Purpose Entities and parts of IAS 27 – Consolidated and Separate Financial Statements and introduces a new definition of control that is intended to provide more consistent guidance in the determination of whether control exists and whether or not an entity should be included within the consolidated financial statements. The adoption of this standard did not have an impact on our interim condensed consolidated financial statements.

Postmedia Network Canada Corp. Third Quarter – Fiscal 2014 Page 10
The following table provides our fiscal 2013 quarterly and full year consolidated statements of operations, revised for the adoption of IAS 19:
Q1 Q2 Q3 Q4 Total
Revenues Print advertising………………………………………………...……………………………………….. 132,741 105,443 113,395 93,968 445,547 Print circulation…………………………...……………………………………………………………… 49,276 47,863 49,401 49,359 195,899 Digital………………………………………………………..……………………………………………… 24,813 21,292 24,093 21,408 91,606 Other…………………………………………...……………...…………………………………………… 4,842 4,220 4,895 4,574 18,531 Total revenues 211,672 178,818 191,784 169,309 751,583 Expenses Compensation……………………………………...…………………………………………………….. 83,067 81,291 83,075 73,791 321,224 New sprint……………………………………………….………………………………………………… 12,108 9,856 10,147 8,791 40,902 Distribution………………………………………………..………………………………………………… 28,192 26,365 27,542 25,806 107,905 Other operating……………………………………….…………………………………………………… 39,318 36,240 38,268 37,800 151,626 Operating income before depreciation, amortization, impairment and restructuring 48,987 25,066 32,752 23,121 129,926 Depreciation……………………………………………….………………………………………………… 6,890 6,740 6,706 9,613 29,949 Amortization……………………………………………….………………………………………………… 10,734 10,834 11,111 10,646 43,325 Impairments…………………………………………………………...…………………………………… - - 93,883 6,100 99,983 Restructuring and other items………..……………………………………………...…………………… 4,797 1,814 6,305 21,255 34,171 Operating income (loss) 26,566 5,678 (85,253) (24,493) (77,502) Interest expense………………………………………………….………………………………………… 16,167 15,606 14,994 15,133 61,900 Net f inancing expense relating to employee benefit plans…………………………….……………… 1,864 1,863 1,863 1,868 7,458 (Gain) loss on disposal of property and equipment and intangible assets…………………………… 268 (1,055) (202) (16) (1,005) Loss on derivative f inancial instruments………………………...…………………………………….. 697 1,193 760 4,656 7,306 Foreign currency exchange losses………………………….…………………………………………. 866 3,832 588 1,779 7,065 Earnings (loss) before income taxes 6,704 (15,761) (103,256) (47,913) (160,226) Provision for income taxes……………………………………………………………………………….. - - - - - Net earnings (loss) attributable to equity holders of the Company 6,704 (15,761) (103,256) (47,913) (160,226)
Fiscal 2013 (revised)

Postmedia Network Canada Corp. Third Quarter – Fiscal 2014 Page 11
Operating Results
Postmedia’s operating results for the three months ended May 31, 2014 as compared to the three months ended May 31, 2013
2014 2013(revised) (1)
Revenues94,716 113,395 49,029 49,401 23,067 24,093
4,177 4,895 170,989 191,784
Expenses72,492 83,075
7,588 10,147 25,978 27,542 39,264 38,268 25,667 32,752 15,918 6,706
9,542 11,111 - 93,883
5,813 6,305 Operating loss (5,606) (85,253)
15,799 14,994 1,405 1,863
Gain on disposal of property and equipment……………………………..…………………… (244) (202) 691 760
(2,652) 588 Loss before income taxes (20,605) (103,256)
- - Net loss attributable to equity holders of the Company (20,605) (103,256)
Depreciation…………………………………………………………………………………………Amortization…………………………………………………………………………………………
Restructuring and other items……………………………………………………………………
Interest expense……………………………………………………………………………………Net financing expense relating to employee benefit plans……………………………….…
Impairments…………………………………..……………………………….……………………
Loss on derivative financial instruments……….……………………………………………… Foreign currency exchange (gains) losses …………..………………………………………
Provision for income taxes………………………………………………………………………
Operating income before depreciation, amortization, impairment and restructuring
Print advertising…………………………………………………………………………………… Print circulation…………………………………………………………………………………… Digital……………………………………………………………………………………………… Other………………………………………………………………………………………………
Distribution…………………………………………………………………………………………
Total revenues
Newsprint………………………………………………………………………………………… Compensation ……………………………………………………………………………………
Other operating……………………………………………………………………………………
(1) See “Other Factors – Changes in accounting policies”.
Revenue
Print advertising
Print advertising revenue decreased $18.7 million, or 16.5%, to $94.7 million for the three months ended May 31, 2014, as compared to the same period in the prior year. A decrease was experienced in all of our major categories of print advertising revenue, including decreases from national advertising of 18.6%, retail advertising of 17.7%, classified advertising of 20.5%, and insert advertising of 4.8%. The total print advertising linage and average line rate decreased 17.5% and 1.5%, respectively, during the three months ended May 31, 2014, as compared to the same period in the prior year.
Print circulation
Print circulation revenue decreased $0.4 million, or 0.8%, to $49.0 million for the three months ended May 31, 2014 as compared to the same period in the prior year. Paid circulation volume decreased 8.6% during this period, as compared to the same period in the prior year, but this volume decrease was largely offset by price increases which include strategic pricing for new subscription bundles.

Postmedia Network Canada Corp. Third Quarter – Fiscal 2014 Page 12
Digital
Digital revenue decreased $1.0 million, or 4.3% to $23.1 million for the three months ended May 31, 2014, as compared to the same period in the prior year. The decline in digital revenue is primarily a result of decreases in local digital advertising revenue of $0.9 million and digital classified revenue of $0.5 million, partially offset by an increase in digital circulation revenue of $0.4 million.
Other
Other revenue decreased $0.7 million, or 14.7%, to $4.2 million for the three months ended May 31, 2014, as compared to the same period in the prior year. The decline in other revenue is primarily a result of declines in commercial printing revenue.
Expenses
Compensation
Compensation expenses decreased $10.6 million, or 12.7%, to $72.5 million for the three months ended May 31, 2014, as compared to the same period in the prior year. The decrease is primarily due to lower salary and benefits expense of $10.4 million as a result of a reduction in employees due to the Transformation Program initiatives. Newsprint Newsprint expenses decreased $2.6 million, or 25.2%, to $7.6 million for the three months ended May 31, 2014, as compared to the same period in the prior year. Newsprint expense decreases are primarily a result of consumption decreases of 21.9% due to continued usage reduction efforts including reduced newspaper sizes and lower newspaper circulation volumes, combined with a decrease in newsprint cost per tonne of 4.2%. Newsprint expenses include newsprint purchased for production at both our owned and outsourced production facilities.
Distribution
Distribution expenses decreased $1.6 million, or 5.7%, to $26.0 million for the three months ended May 31, 2014, as compared to the same period in the prior year. Decreases in distribution expenses are primarily a result of a reduction in newspaper circulation volumes and cost reduction initiatives.
Other operating
Other operating expenses increased $1.0 million, or 2.6%, to $39.3 million for the three months ended May 31, 2014, as compared to the same period in the prior year. Other operating expense increases are due to an increase in production costs of $2.3 million as a result of the outsourced newspaper production described earlier in “Recent Developments”, partially offset by decreases realized as a result of ongoing cost savings initiatives.

Postmedia Network Canada Corp. Third Quarter – Fiscal 2014 Page 13
Operating income before depreciation, amortization, impairment and restructuring
Operating income before depreciation, amortization, impairment and restructuring decreased $7.1 million, or 21.6%, to $25.7 million for the three months ended May 31, 2014, as compared to the same period in the prior year. The decrease relates primarily to decreases in revenue, partially offset by decreases in expenses as discussed above.
Depreciation
Depreciation expense increased $9.2 million to $15.9 million for the three months ended May 31, 2014, as compared to the same period in the prior year. The increase relates primarily to a change in the estimate of the useful lives of certain production assets as a result of outsourced newspaper production.
Amortization
Amortization expense decreased $1.6 million to $9.5 million for the three months ended May 31, 2014, as compared to the same period in the prior year. The decrease relates primarily to software that has been fully amortized.
Impairments
During the three months ended May 31, 2014, we completed our annual impairment testing and there were no impairments recorded. During the three months ended May 31, 2013, we updated our long-term financial forecast. As a result of lower than anticipated long-term revenue projections due to economic and structural factors including the uncertainty of the print advertising market and the rapidly evolving digital advertising market, we concluded our assets may be impaired and as a result performed an impairment analysis. As a result of the impairment analysis as at May 31, 2013, we recorded an impairment charge relating to our goodwill and indefinite life intangible assets of $73.9 million and $13.9 million, respectively. In addition, during the three months ended May 31, 2013, we recorded an impairment loss of $6.1 million with respect to a production facility upon reclassification of the asset from property and equipment to asset held-for-sale.
Restructuring and other items
Restructuring and other items expense decreased $0.5 million to $5.8 million for the three months ended May 31, 2014 as compared to the same period in the prior year. Restructuring and other items expense for the three months ended May 31, 2014 consists of severance costs, which include both involuntary terminations and voluntary buyouts. Restructuring and other items expense for the three months ended May 31, 2013 consisted of $6.3 million of severance costs, which included both involuntary terminations and voluntary buyouts. Operating loss Operating loss was $5.6 million for the three months ended May 31, 2014, as compared to $85.3 million for the same period in the prior year. The decrease relates primarily to impairments recorded in the three months ended May 31, 2013, partially offset by decreased operating income before depreciation, amortization, impairment and restructuring, and increased depreciation expense, all as discussed above.

Postmedia Network Canada Corp. Third Quarter – Fiscal 2014 Page 14
Interest expense Interest expense increased $0.8 million to $15.8 million for the three months ended May 31, 2014, as compared to the same period in the prior year. Interest expense primarily relates to interest on our long-term debt that is recognized using the effective interest rate method, which amortizes the initial debt issuance costs and includes both cash and non-cash interest. The increase in interest expense relates to an increase in non-cash interest expense of $0.9 million during the three months ended May 31, 2014, as compared to the same period in the prior year, partially offset by a decrease in cash interest of $0.1 million due to lower outstanding First-Lien Notes. Net financing expense relating to employee benefit plans
Net financing expense relating to employee benefit plans decreased $0.5 million to $1.4 million for the three months ended May 31, 2014, as compared to the same period in the prior year. The decrease relates primarily to a reduction in our employee benefit plan liabilities.
Gain on disposal of property and equipment
During the three months ended May 31, 2014 and May 31, 2013, we disposed of property and equipment and realized a gain of $0.2 million in each period.
Loss on derivative financial instruments
Loss on derivative financial instruments for the three months ended May 31, 2014 was $0.7 million as compared to $0.8 million during the same period in the prior year. The losses relate to the change in fair value of our variable prepayment option embedded derivatives on the First-Lien Notes and 12.5% Senior Secured Notes due 2017 (“Second-Lien Notes”).
Foreign currency exchange (gains) losses
Foreign currency exchange gains for the three months ended May 31, 2014 were $2.7 million as compared to a loss of $0.6 million during the same period in the prior year. Foreign currency exchange gains and losses consist primarily of unrealized gains and losses related to the non-swapped portion of the Second-Lien Notes. Loss before income taxes
Loss before income taxes for the three months ended May 31, 2014 was $20.6 million, as compared to $103.3 million for the same period in the prior year. The decrease in loss before income taxes is primarily the result of decreased operating loss discussed above.
Provision for income taxes
We have not recorded a current or deferred tax expense or recovery for the three months ended May 31, 2014 or 2013. Current taxes payable or recoverable result in a decrease or increase, respectively, to our tax loss carryforward balances. The cumulative tax loss carryforward balances have not been recognized as a net deferred tax asset on the consolidated statement of financial position. Net loss attributable to equity holders of the Company
Net loss for the three months ended May 31, 2014 was $20.6 million as compared to $103.3 million for the same period in the prior year, as a result of the factors described above in loss before income taxes.

Postmedia Network Canada Corp. Third Quarter – Fiscal 2014 Page 15
Operating Results
Postmedia’s operating results for the nine months ended May 31, 2014 as compared to the nine months ended May 31, 2013
2014 2013(revised) (1)
Revenues301,265 351,579 146,167 146,540
67,757 70,198 12,262 13,957
527,451 582,274 Expenses
218,498 247,433 24,110 32,111 76,990 82,099
114,049 113,826 93,804 106,805 40,314 20,336 29,553 32,679
- 93,883 31,351 12,916
Operating loss (7,414) (53,009) 47,137 46,767
4,213 5,590 Gain on disposal of property and equipment…………………………….…………………… (231) (989)
(4,010) 2,650 3,177 5,286
Loss before income taxes (57,700) (112,313) - -
Net loss attributable to equity holders of the Company (57,700) (112,313)
Print advertising…………………………………………………………………………………… Print circulation…………………………………………………………………………………… Digital……………………………………………………………………………………………… Other………………………………………………………………………………………………
Restructuring and other items……………………………………………………………………
Total revenues
Compensation …………………………………………………………………………………… Newsprint………………………………………………………………………………………… Distribution………………………………………………………………………………………… Other operating……………………………………………………………………………………
Impairments…………………………………..……………………………….……………………
Operating income before depreciation, amortization, impairment and restructuring Depreciation…………………………………………………………………………………………Amortization…………………………………………………………………………………………
Provision for income taxes………………………………………………………………………
Interest expense……………………………………………………………………………………Net financing expense relating to employee benefit plans……………………………….…
(Gain) loss on derivative financial instruments………………………………………………… Foreign currency exchange losses………………………………………………………………
(1) See “Other Factors – Changes in accounting policies”.
Revenue
Print advertising
Print advertising revenue decreased $50.3 million, or 14.3%, to $301.3 million for the nine months ended May 31, 2014, as compared to the same period in the prior year. A decrease was experienced in all of our major categories of print advertising revenue, including decreases from national advertising of 14.5%, retail advertising of 17.5%, classified advertising of 21.9%, and insert advertising of 0.4%. The total print advertising linage and average line rate decreased 14.0% and 3.4%, respectively, during the nine months ended May 31, 2014, as compared to the same period in the prior year.
Print circulation
Print circulation revenue decreased $0.4 million, or 0.3%, to $146.2 million for the nine months ended May 31, 2014 as compared to the same period in the prior year. Paid circulation volume decreased 11.2% during this period, as compared to the same period in the prior year, but this volume decrease was largely offset by price increases which include strategic pricing for new subscription bundles.

Postmedia Network Canada Corp. Third Quarter – Fiscal 2014 Page 16
Digital
Digital revenue decreased $2.4 million, or 3.5%, to $67.8 million for the nine months ended May 31, 2014, as compared to the same period in the prior year. The decline in digital revenue is primarily a result of decreases in local digital advertising revenue of $1.7 million and digital classified revenue of $1.7 million, partially offset by an increase in digital circulation revenue of $1.2 million.
Other
Other revenue decreased $1.7 million, or 12.1%, to $12.3 million for the nine months ended May 31, 2014, as compared to the same period in the prior year. The decline in other revenue is primarily a result of declines in commercial printing revenue.
Expenses
Compensation
Compensation expenses decreased $28.9 million, or 11.7%, to $218.5 million for the nine months ended May 31, 2014, as compared to the same period in the prior year. The decrease is primarily due to lower salary and benefits expense of $28.1 million as a result of a reduction in employees due to the Transformation Program initiatives and a decrease in employee benefit plan expense of $0.4 million.
Newsprint
Newsprint expenses decreased $8.0 million, or 24.9%, to $24.1 million for the nine months ended May 31, 2014, as compared to the same period in the prior year. Newsprint expense decreases are primarily a result of consumption decreases of 22.7% due to continued usage reduction efforts including reduced newspaper sizes and lower newspaper circulation volumes, combined with a decrease in newsprint cost per tonne of 2.9%. Newsprint expenses include newsprint purchased for production at both our owned and outsourced production facilities.
Distribution
Distribution expenses decreased $5.1 million, or 6.2%, to $77.0 million for the nine months ended May 31, 2014, as compared to the same period in the prior year. Decreases in distribution expenses are primarily a result of a reduction in newspaper circulation volumes and cost reduction initiatives.
Other operating
Other operating expenses increased $0.2 million to $114.0 million for the nine months ended May 31, 2014, as compared to the same period in the prior year. Other operating expense increases are due to an increase in production costs as a result of the outsourced newspaper production of $6.1 million described earlier in `Recent Developments`, partially offset by decreases realized as a result of ongoing cost savings initiatives.

Postmedia Network Canada Corp. Third Quarter – Fiscal 2014 Page 17
Operating income before depreciation, amortization, impairment and restructuring
Operating income before depreciation, amortization, impairment and restructuring decreased $13.0 million, or 12.2%, to $93.8 million for the nine months ended May 31, 2014, as compared to the same period in the prior year. The decrease relates primarily to decreases in revenue, partially offset by decreases in expenses as discussed above.
Depreciation
Depreciation expense increased $20.0 million to $40.3 million for the nine months ended May 31, 2014, as compared to the same period in the prior year. The increase relates primarily to a change in the estimate of the useful lives of certain production assets as a result of outsourced newspaper production.
Amortization
Amortization expense decreased $3.1 million to $29.6 million for the nine months ended May 31, 2014, as compared to the same period in the prior year. The decrease relates primarily to software that has been fully amortized.
Impairments
During the nine months ended May 31, 2014, we completed our annual impairment testing and there were no impairments recorded. During the nine months ended May 31, 2013, we updated our long-term financial forecast. As a result of lower than anticipated long-term revenue projections due to economic and structural factors including the uncertainty of the print advertising market and the rapidly evolving digital advertising market, we concluded our assets may be impaired and as a result performed an impairment analysis. As a result of the impairment analysis as at May 31, 2013, we recorded an impairment charge relating to our goodwill and indefinite life intangible assets of $73.9 million and $13.9 million, respectively. In addition, during the nine months ended May 31, 2013, we recorded an impairment loss of $6.1 million with respect to a production facility upon reclassification of the asset from property and equipment to asset held-for-sale.
Restructuring and other items
Restructuring and other items expense increased $18.4 million to $31.4 million for the nine months ended May 31, 2014 as compared to the same period in the prior year. Restructuring and other items expense for the nine months ended May 31, 2014 consists of severance costs, which include both involuntary terminations and voluntary buyouts. Restructuring and other items expense for the nine months ended May 31, 2013 included an estimated expense of $2.3 million related to changes made to an employee benefit plan as a result of an arbitrator’s ruling as well as $10.6 million of severance costs, which included both involuntary terminations and voluntary buyouts. Operating loss Operating loss was $7.4 million for the nine months ended May 31, 2014, as compared to $53.0 million for the same period in the prior year. The decrease relates primarily to impairments recorded in the three months ended May 31, 2013, partially offset by decreased operating income before depreciation, amortization, impairment and restructuring, and increased depreciation and restructuring expenses, all as discussed above.

Postmedia Network Canada Corp. Third Quarter – Fiscal 2014 Page 18
Interest expense Interest expense increased $0.4 million, or 0.8%, to $47.1 million for the nine months ended May 31, 2014, as compared to the same period in the prior year. Interest expense primarily relates to interest on our long-term debt that is recognized using the effective interest rate method, which amortizes the initial debt issuance costs and includes both cash and non-cash interest. The increase in interest expense relates to an increase in non-cash interest expense of $1.0 million during the nine months ended May 31, 2014, as compared to the same period in the prior year, partially offset by a decrease in cash interest of $0.6 million due to lower outstanding First-Lien Notes. Net financing expense relating to employee benefit plans
Net financing expense relating to employee benefit plans decreased $1.4 million to $4.2 million for the nine months ended May 31, 2014, as compared to the same period in the prior year. The decrease relates primarily to a reduction in the employee benefit plan liabilities.
Gain on disposal of property and equipment
During the nine months ended May 31, 2014 and May 31, 2013, we disposed of property and equipment and realized a gain of $0.2 million and $1.0 million, respectively.
(Gain) loss on derivative financial instruments
Gain on derivative financial instruments for the nine months ended May 31, 2014 was $4.0 million as compared to a loss of $2.7 million during the same period in the prior year. The gain and loss both relate to the change in fair value of our variable prepayment option embedded derivatives on the First-Lien Notes and Second-Lien Notes.
Foreign currency exchange losses
Foreign currency exchange losses for the nine months ended May 31, 2014 were $3.2 million as compared to $5.3 million during the same period in the prior year. Foreign currency exchange losses consist primarily of unrealized losses related to the non-swapped portion of the Second-Lien Notes. Loss before income taxes
Loss before income taxes for the nine months ended May 31, 2014 was $57.7 million, as compared to $112.3 million for the same period in the prior year. The decrease in loss before income taxes is primarily the result of decreased operating loss and a gain on derivative financial instruments in the nine months ended May 31, 2014, both as discussed above.
Provision for income taxes
We have not recorded a current or deferred tax expense or recovery for the nine months ended May 31, 2014 or 2013. Current taxes payable or recoverable result in a decrease or increase, respectively, to our tax loss carryforward balances. The cumulative tax loss carryforward balances have not been recognized as a net deferred tax asset on the consolidated statement of financial position. Net loss attributable to equity holders of the Company
Net loss for the nine months ended May 31, 2014 was $57.7 million as compared to $112.3 million for the same period in the prior year, as a result of the factors described above in loss before income taxes.
Postmedia Network Canada Corp. Third Quarter – Fiscal 2014 Page 19
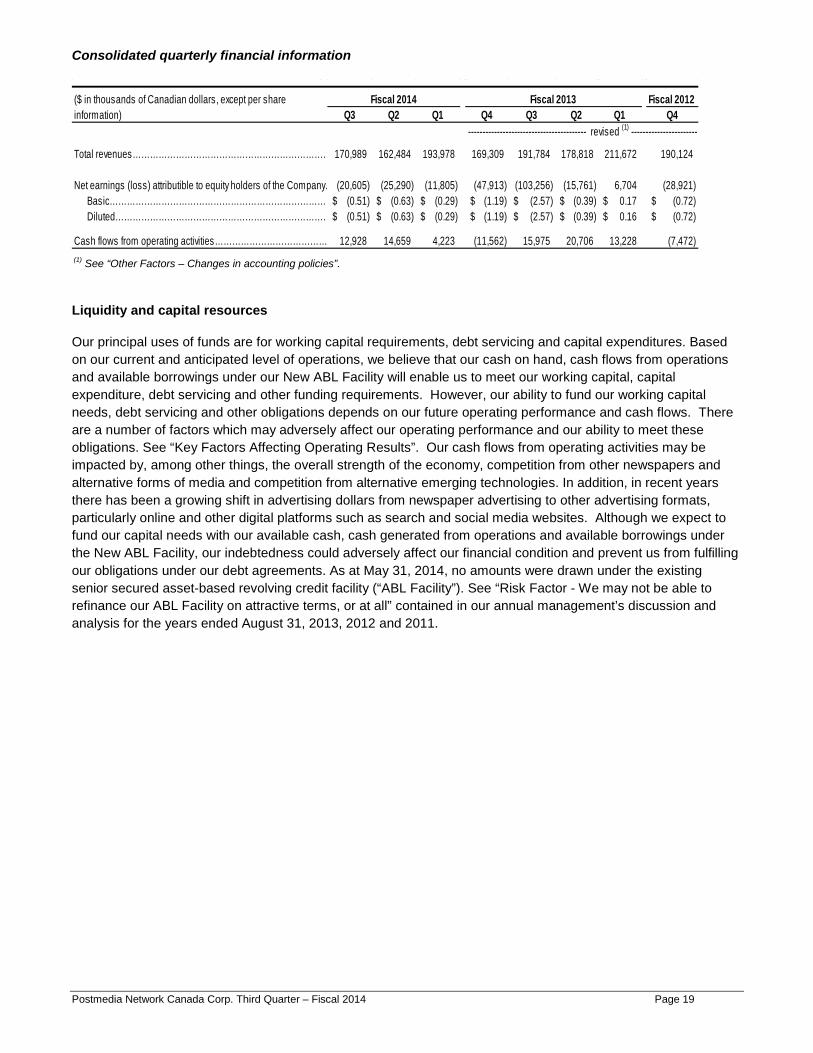
Consolidated quarterly financial information
Fiscal 2012Q3 Q2 Q1 Q4 Q3 Q2 Q1 Q4
Total revenues…………………………………………………………… 170,989 162,484 193,978 169,309 191,784 178,818 211,672 190,124
Net earnings (loss) attributible to equity holders of the Company… (20,605) (25,290) (11,805) (47,913) (103,256) (15,761) 6,704 (28,921) Basic…………………………………………………………………… (0.51)$ (0.63)$ (0.29)$ (1.19)$ (2.57)$ (0.39)$ 0.17$ (0.72)$ Diluted………………………………………………………………… (0.51)$ (0.63)$ (0.29)$ (1.19)$ (2.57)$ (0.39)$ 0.16$ (0.72)$
Cash flows from operating activities………………………………… 12,928 14,659 4,223 (11,562) 15,975 20,706 13,228 (7,472)
($ in thousands of Canadian dollars, except per share information)
Fiscal 2013
----------------------------------------- revised (1) -----------------------
Fiscal 2014
(1) See “Other Factors – Changes in accounting policies”.
Liquidity and capital resources
Our principal uses of funds are for working capital requirements, debt servicing and capital expenditures. Based on our current and anticipated level of operations, we believe that our cash on hand, cash flows from operations and available borrowings under our New ABL Facility will enable us to meet our working capital, capital expenditure, debt servicing and other funding requirements. However, our ability to fund our working capital needs, debt servicing and other obligations depends on our future operating performance and cash flows. There are a number of factors which may adversely affect our operating performance and our ability to meet these obligations. See “Key Factors Affecting Operating Results”. Our cash flows from operating activities may be impacted by, among other things, the overall strength of the economy, competition from other newspapers and alternative forms of media and competition from alternative emerging technologies. In addition, in recent years there has been a growing shift in advertising dollars from newspaper advertising to other advertising formats, particularly online and other digital platforms such as search and social media websites. Although we expect to fund our capital needs with our available cash, cash generated from operations and available borrowings under the New ABL Facility, our indebtedness could adversely affect our financial condition and prevent us from fulfilling our obligations under our debt agreements. As at May 31, 2014, no amounts were drawn under the existing senior secured asset-based revolving credit facility (“ABL Facility”). See “Risk Factor - We may not be able to refinance our ABL Facility on attractive terms, or at all” contained in our annual management’s discussion and analysis for the years ended August 31, 2013, 2012 and 2011.

Postmedia Network Canada Corp. Third Quarter – Fiscal 2014 Page 20
Sources of Cash
Cash flows from operating activities
Our principal sources of liquidity are cash flows from operating activities. For the three and nine months ended May 31, 2014, our cash flows from operating activities were inflows of $12.9 million and $31.8 million, respectively (2013 – $16.0 million and $49.9 million, respectively). Cash flows from operating activities decreased $3.1 million for the three months ended May 31, 2014, as compared to the same period in the prior year due to a decrease in operating income before depreciation, amortization, impairment and restructuring partially offset by a decrease in interest payments. Cash flows from operating activities decreased $18.1 million for the nine months ended May 31, 2014, as compared to the same period in the prior year due to a decrease in operating income before depreciation, amortization, impairment and restructuring as well as increased interest and restructuring payments. Partially offsetting these items was the absence of a settlement of a foreign currency interest rate swap designated as a cash flow hedge in the nine months ended May 31, 2014.
As at May 31, 2014 we had cash of $48.6 million (August 31, 2013 - $40.8 million) and our ABL Facility remained undrawn (August 31, 2013 – nil). Availability under the ABL Facility as at May 31, 2014 was $21.1 million (August 31, 2013 - $20.7 million). The ABL Facility will terminate on July 13, 2014 (See “Recent Developments”).
Uses of Cash
Cash flows from investing activities
For the three and nine months ended May 31, 2014, our cash flows from investing activities were outflows of $3.4 million and $11.5 million, respectively (2013 – outflows of $2.2 million and inflows of $16.5 million, respectively). The net cash outflows from investing activities during the three months ended May 31, 2014 include the net proceeds received on the sale of property and equipment of $0.2 million, offset by outflows on capital expenditures related to property and equipment of $2.8 million and intangible assets of $0.9 million. The net cash outflows from investing activities during the three months ended May 31, 2013 included the net proceeds received on the sale of property and equipment and asset held-for-sale of $0.3 million, offset by outflows on capital expenditures related to property and equipment of $1.1 million and intangible assets of $1.3 million. The net cash outflows from investing activities during the nine months ended May 31, 2014 include the net proceeds received on the sale of property and equipment of $0.3 million, offset by outflows on capital expenditures related to property and equipment of $9.0 million and intangible assets of $2.8 million. The net cash inflows from investing activities during the nine months ended May 31, 2013, included the net proceeds received on the sale of property and equipment, intangible assets and asset held-for-sale of $25.9 million, offset by outflows on capital expenditures related to property and equipment of $5.4 million and intangible assets of $3.9 million. Cash flows from financing activities
Cash outflows from financing activities for the three and nine months ended May 31, 2014, were $6.3 and $12.5 million, respectively (2013 – $8.9 and $32.2 million, respectively), and were related to our indebtedness as discussed below.
Indebtedness
As of May 31, 2014, we have $205.5 million First-Lien Notes and US$268.6 million Second-Lien Notes outstanding (August 31, 2013 - $218.0 million and US$268.6 million, respectively). During the three and nine months ended May 31, 2014, we made contractual redemptions of $6.3 million and $12.5 million, respectively (2013 – $8.9 and $32.0 million, respectively), of aggregate principal amount of First-Lien Notes at par in accordance with the terms and conditions of the First-Lien Notes indenture.

Postmedia Network Canada Corp. Third Quarter – Fiscal 2014 Page 21
The following tables set out the principal and carrying amount of our long-term debt outstanding as at May 31, 2014 and August 31, 2013. The first column of the table translates, where applicable, our US dollar debt to the Canadian equivalent based on foreign exchange rates specified in our foreign currency swap agreements for swapped debt and at the closing foreign exchange rate on May 31, 2014 and August 31, 2013, respectively, for our non-swapped debt.
First-Lien Notes (CDN$205.5M)………………………… 205,460 205,460 4,822 200,638 Second-Lien Notes (swapped) (US$167.5M)………… 173,363 181,604 4,440 177,164 Second-Lien Notes (non-swapped) (US$101.1M)…… 109,650 109,650 2,681 106,969
488,473 496,714 11,943 484,771
First-Lien Notes (CDN$218.0M)………………………… 217,960 217,960 5,927 212,033 Second-Lien Notes (swapped) (US$167.5M)………… 173,363 176,378 5,005 171,373 Second-Lien Notes (non-swapped) (US$101.1M)…… 106,495 106,495 3,021 103,474
497,818 500,833 13,953 486,880
($ in thousands of Canadian dollars)As at August 31, 2013
Principal Outstanding
(US$ Debt translated at sw apped or period end
rates)
Principal Outstanding
(US$ Debt translated at period end exchange
rates)
Financing fees,
discounts and other
Carrying Value
As at May 31, 2014($ in thousands of Canadian dollars) Principal
Outstanding (US$ Debt
translated at sw apped or period end
rates)
Principal Outstanding
(US$ Debt translated at period end exchange
rates)
Financing fees,
discounts and other
Carrying Value
Postmedia Network Canada Corp. Third Quarter – Fiscal 2014 Page 22
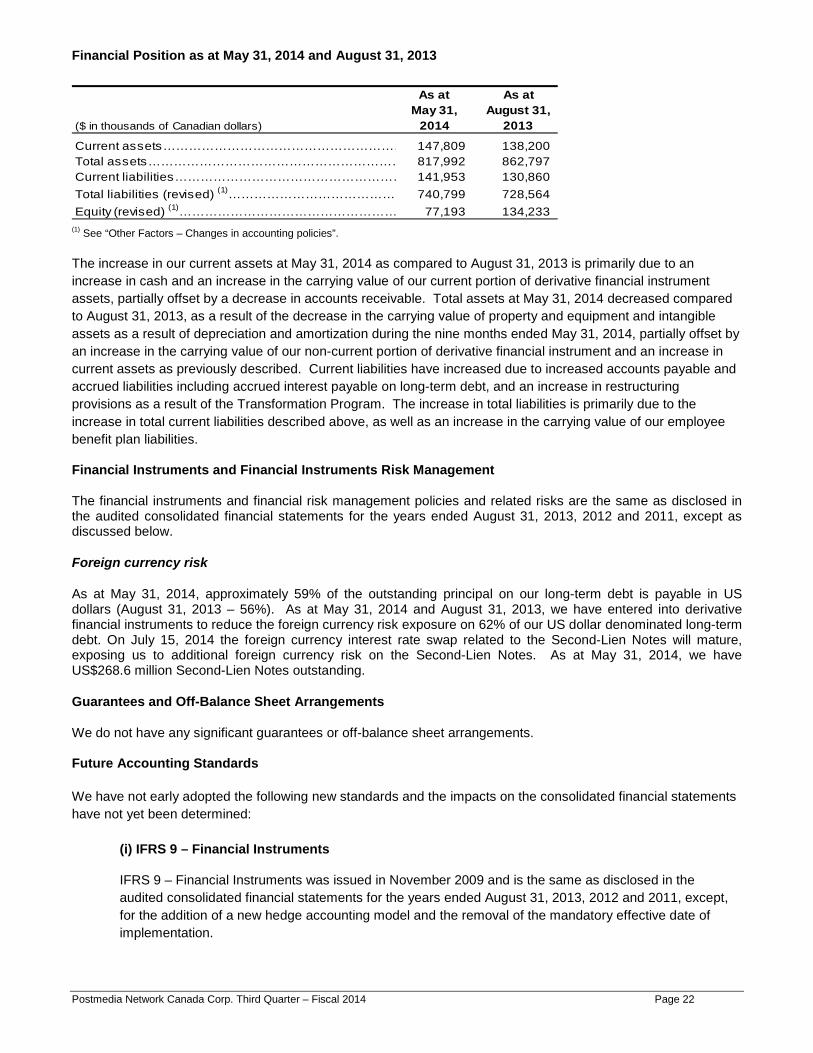
Financial Position as at May 31, 2014 and August 31, 2013
($ in thousands of Canadian dollars)
As at May 31,
2014
As at August 31,
2013
Current assets………………………………………………… 147,809 138,200 Total assets…………………………………………………… 817,992 862,797 Current liabilities……………………………………………… 141,953 130,860 Total liabilities (revised) (1)…………………………………… 740,799 728,564 Equity (revised) (1)…………………………………………… 77,193 134,233
(1) See “Other Factors – Changes in accounting policies”.
The increase in our current assets at May 31, 2014 as compared to August 31, 2013 is primarily due to an increase in cash and an increase in the carrying value of our current portion of derivative financial instrument assets, partially offset by a decrease in accounts receivable. Total assets at May 31, 2014 decreased compared to August 31, 2013, as a result of the decrease in the carrying value of property and equipment and intangible assets as a result of depreciation and amortization during the nine months ended May 31, 2014, partially offset by an increase in the carrying value of our non-current portion of derivative financial instrument and an increase in current assets as previously described. Current liabilities have increased due to increased accounts payable and accrued liabilities including accrued interest payable on long-term debt, and an increase in restructuring provisions as a result of the Transformation Program. The increase in total liabilities is primarily due to the increase in total current liabilities described above, as well as an increase in the carrying value of our employee benefit plan liabilities.
Financial Instruments and Financial Instruments Risk Management
The financial instruments and financial risk management policies and related risks are the same as disclosed in the audited consolidated financial statements for the years ended August 31, 2013, 2012 and 2011, except as discussed below.
Foreign currency risk
As at May 31, 2014, approximately 59% of the outstanding principal on our long-term debt is payable in US dollars (August 31, 2013 – 56%). As at May 31, 2014 and August 31, 2013, we have entered into derivative financial instruments to reduce the foreign currency risk exposure on 62% of our US dollar denominated long-term debt. On July 15, 2014 the foreign currency interest rate swap related to the Second-Lien Notes will mature, exposing us to additional foreign currency risk on the Second-Lien Notes. As at May 31, 2014, we have US$268.6 million Second-Lien Notes outstanding.
Guarantees and Off-Balance Sheet Arrangements
We do not have any significant guarantees or off-balance sheet arrangements.
Future Accounting Standards We have not early adopted the following new standards and the impacts on the consolidated financial statements have not yet been determined:
(i) IFRS 9 – Financial Instruments
IFRS 9 – Financial Instruments was issued in November 2009 and is the same as disclosed in the audited consolidated financial statements for the years ended August 31, 2013, 2012 and 2011, except, for the addition of a new hedge accounting model and the removal of the mandatory effective date of implementation.

Postmedia Network Canada Corp. Third Quarter – Fiscal 2014 Page 23
(ii) IFRS 15 – Revenue from Contracts with Customers
IFRS 15 – Revenue from Contracts with Customers was issued in May 2014 and is a new standard that specifies the steps and timing for entities to recognize revenue as well as requiring them to provide more informative, relevant disclosures. IFRS 15 replaces IAS 11 - Construction Contracts and IAS 18 - Revenue, as well as various IFRIC and SIC interpretations regarding revenue. The standard is required to be applied for annual periods beginning on or after January 1, 2017, with earlier adoption permitted.
(iii) IFRIC 21 – Levies IFRIC 21 - Levies clarifies the timing for the accounting of a liability that is imposed by governments should be based on the activity in the legislation that triggers the payment. This standard is required to be applied retrospectively for annual periods beginning on or after January 1, 2014, with earlier adoption permitted.
Risk Factors
The risks relating to our business are described in the section entitled “Risk Factors” included in our annual management’s discussion and analysis for the years ended August 31, 2013, 2012 and 2011, which section is incorporated by reference herein.
Internal Controls
Disclosure controls and procedures within the Company have been designed to provide reasonable assurance that all relevant information is identified to its management, including the President and Chief Executive Officer (“CEO”) and the Executive Vice President and Chief Financial Officer (“CFO”), as appropriate, to allow required disclosures to be made in a timely fashion.
Internal controls over financial reporting have been designed by management, under the supervision of and with the participation of the CEO and CFO, to provide reasonable assurance regarding the reliability of the Company’s financial reporting and the preparation of financial statements for external purposes in accordance with IFRS.
The CEO and CFO have evaluated whether there were changes to Postmedia's internal control over financial reporting during the three months ended May 31, 2014, that have materially affected, or are reasonably likely to materially affect, internal control over financial reporting. There were no changes identified during their evaluation.
Share Capital
As at July 7, 2014 we had the following number of shares and options outstanding:
Class C voting shares 945,561 Class NC variable voting shares 39,264,058 Total shares outstanding 40,209,619 Total options and restricted share units outstanding (1)
2,325,000
(1) The total options and restricted share units outstanding are convertible into 1,722,000 Class C voting shares and 603,000 Class NC variable voting shares. The total options and restricted share units outstanding include 1,469,000 options that are vested and 856,000 options that are unvested.

Postmedia Network Canada Corp. Third Quarter – Fiscal 2014 Page 24
POSTMEDIA NETWORK CANADA CORP. INTERIM CONDENSED CONSOLIDATED FINANCIAL STATEMENTS FOR THE THREE AND NINE MONTHS ENDED MAY 31, 2014 AND 2013 (UNAUDITED) Issued: July 10, 2014

Postmedia Network Canada Corp. Third Quarter – Fiscal 2014 Page 25
POSTMEDIA NETWORK CANADA CORP. CONDENSED CONSOLIDATED STATEMENTS OF OPERATIONS (UNAUDITED) (In thousands of Canadian dollars, except per share amounts)
2014 2013 2014 2013(revised -
note 2)(revised -
note 2)Revenues Print advertising 94,716 113,395 301,265 351,579 Print circulation 49,029 49,401 146,167 146,540 Digital 23,067 24,093 67,757 70,198 Other 4,177 4,895 12,262 13,957 Total revenues 170,989 191,784 527,451 582,274 Expenses Compensation 72,492 83,075 218,498 247,433 Newsprint 7,588 10,147 24,110 32,111 Distribution 25,978 27,542 76,990 82,099 Other operating 39,264 38,268 114,049 113,826 Operating income before depreciation, amortization, impairment and restructuring (note 3) 25,667 32,752 93,804 106,805 Depreciation 15,918 6,706 40,314 20,336 Amortization 9,542 11,111 29,553 32,679 Impairments (note 4) - 93,883 - 93,883 Restructuring and other items (notes 7 and 9) 5,813 6,305 31,351 12,916 Operating loss (5,606) (85,253) (7,414) (53,009) Interest expense 15,799 14,994 47,137 46,767 Net financing expense relating to employee benefit plans (note 9) 1,405 1,863 4,213 5,590 Gain on disposal of property and equipment (244) (202) (231) (989) (Gain) loss on derivative financial instruments 691 760 (4,010) 2,650 Foreign currency exchange (gains) losses (2,652) 588 3,177 5,286 Loss before income taxes (20,605) (103,256) (57,700) (112,313) Provision for income taxes - - - - Net loss attributable to equity holders of the Company (20,605) (103,256) (57,700) (112,313)
Loss per share attributable to equity holders of the Company (note 10):Basic (0.51)$ (2.57)$ (1.43)$ (2.79)$ Diluted (0.51)$ (2.57)$ (1.43)$ (2.79)$
For the three months ended May 31,
For the nine months ended May 31,
The notes constitute an integral part of the interim condensed consolidated financial statements.

Postmedia Network Canada Corp. Third Quarter – Fiscal 2014 Page 26
POSTMEDIA NETWORK CANADA CORP. CONDENSED CONSOLIDATED STATEMENTS OF COMPREHENSIVE LOSS (UNAUDITED) (In thousands of Canadian dollars)
2014 2013 2014 2013(revised -
note 2)(revised -
note 2)
Net loss attributable to equity holders of the Company (20,605) (103,256) (57,700) (112,313)
Amounts subsequently reclassified to the statement of operationsGain on valuation of derivative financial instruments, net of tax of nil 628 1,416 3,299 319
Amounts not subsequently reclassified to the statement of operationsNet actuarial gains (losses) on employee benefits, net of tax of nil (note 9) (627) (4,028) (3,376) 15,590
Other comprehensive income (loss) 1 (2,612) (77) 15,909
Comprehensive loss attributable to equity holders of the Company (20,604) (105,868) (57,777) (96,404)
For the three months endedMay 31,
For the nine months endedMay 31,
The notes constitute an integral part of the interim condensed consolidated financial statements.

Postmedia Network Canada Corp. Third Quarter – Fiscal 2014 Page 27
POSTMEDIA NETWORK CANADA CORP. CONDENSED CONSOLIDATED STATEMENTS OF FINANCIAL POSITION (UNAUDITED) (In thousands of Canadian dollars)
As at May 31,
2014
As at August 31,
2013(revised - note 2)
ASSETSCurrent Assets Cash 48,583 40,812 Accounts receivable 80,304 82,615 Inventory 2,473 3,234 Current portion of derivative financial instruments (notes 5 and 12) 8,078 1,411 Prepaid expenses and other assets 8,371 10,128 Total current assets 147,809 138,200
Non-Current AssetsProperty and equipment 191,809 223,173 Asset held-for-sale 10,530 10,530 Derivative financial instruments (note 5) 20,812 16,802 Other assets 405 732 Intangible assets 297,027 323,760 Goodwill 149,600 149,600
Total assets 817,992 862,797
LIABILITIES AND EQUITYCurrent Liabilities Accounts payable and accrued liabilities (note 6) 72,610 67,618 Provisions (note 7) 31,559 26,097 Deferred revenue 25,284 24,645 Current portion of long-term debt (note 8) 12,500 12,500 Total current liabilities 141,953 130,860
Non-Current LiabilitiesLong-term debt (note 8) 472,271 474,380 Other non-current liabilities (notes 9 and 11) 125,212 121,817 Provisions (note 7) 682 826 Deferred income taxes 681 681
Total liabilities 740,799 728,564
Equity Capital stock 371,132 371,132 Contributed surplus (note 11) 9,757 9,020 Deficit (303,001) (241,925) Accumulated other comprehensive loss (695) (3,994) Total equity 77,193 134,233 Total liabilities and equity 817,992 862,797
Subsequent event (note 13) The notes constitute an integral part of the interim condensed consolidated financial statements.

Postmedia Network Canada Corp. Third Quarter – Fiscal 2014 Page 28
POSTMEDIA NETWORK CANADA CORP. CONDENSED CONSOLIDATED STATEMENTS OF CHANGES IN EQUITY (UNAUDITED) (In thousands of Canadian dollars)
Balance as at August 31, 2013 (revised - note 2) 371,132 9,020 (241,925) (3,994) 134,233 Net loss attributable to equity holders of the Company - - (57,700) - (57,700) Other comprehensive income (loss) - - (3,376) 3,299 (77) Comprehensive income (loss) attributable to equity holders of the Company - - (61,076) 3,299 (57,777) Share-based compensation plans (note 11) - 737 - - 737 Balance as at May 31, 2014 371,132 9,757 (303,001) (695) 77,193
Balance as at August 31, 2012 371,132 7,888 (141,280) (5,908) 231,832 Net loss attributable to equity holders of the Company - - (112,313) - (112,313) Other comprehensive income (loss) - - 15,590 319 15,909 Comprehensive income (loss) attributable to equity holders of the Company - - (96,723) 319 (96,404) Share-based compensation plans (note 11) - 807 - - 807 Balance as at May 31, 2013 371,132 8,695 (238,003) (5,589) 136,235
For the nine months ended May 31, 2013
Capital stock
Contributed surplus Deficit
Accumulated other
comprehensive loss
Total Equity
(revised - note 2)
For the nine months ended May 31, 2014
Capital stock
Contributed surplus Deficit
Accumulated other
comprehensive loss
Total Equity
The notes constitute an integral part of the interim condensed consolidated financial statements.

Postmedia Network Canada Corp. Third Quarter – Fiscal 2014 Page 29
POSTMEDIA NETWORK CANADA CORP. CONDENSED CONSOLIDATED STATEMENTS OF CASH FLOWS (UNAUDITED) (In thousands of Canadian dollars)
2014 2013 2014 2013(revised -
note 2)(revised -
note 2)CASH GENERATED (UTILIZED) BY:
OPERATING ACTIVITIESNet loss attributable to equity holders of the Company (20,605) (103,256) (57,700) (112,313) Items not affecting cash: Depreciation 15,918 6,706 40,314 20,336 Amortization 9,542 11,111 29,553 32,679 Impairments (note 4) - 93,883 - 93,883 (Gain) loss on derivative financial instruments 691 760 (4,010) 2,650 Non-cash interest 1,511 672 4,476 3,470 Gain on disposal of property and equipment (244) (202) (231) (989) Non-cash foreign currency exchange (gains) losses (2,363) 550 3,179 5,228 Share-based compensation plans and other long-term incentive plan expense (note 11) 306 214 1,052 1,149 Net financing expense relating to employee benefit plans (note 9) 1,405 1,863 4,213 5,590 Non-cash compensation expense of employee benefit plans (note 9) - 1,197 - 2,487 Employee benefit funding in excess of compensation expense (note 9) (2,194) - (4,711) - Settlement of foreign currency interest rate swap designated as a cash flow hedge - - - (8,976) Net change in non-cash operating accounts 8,961 2,477 15,675 4,715 Cash flows from operating activities 12,928 15,975 31,810 49,909
INVESTING ACTIVITIESNet proceeds from the sale of property and equipment, intangible assets and asset held-for-sale 245 262 279 25,884 Additions to property and equipment (2,823) (1,108) (8,998) (5,414) Additions to intangible assets (864) (1,314) (2,820) (3,937) Cash flows from investing activities (3,442) (2,160) (11,539) 16,533
FINANCING ACTIVITIESRepayment of long-term debt (6,250) (8,853) (12,500) (32,040) Debt issuance costs - - - (111) Cash flows from financing activities (6,250) (8,853) (12,500) (32,151)
Net change in cash 3,236 4,962 7,771 34,291 Cash at beginning of period 45,347 51,518 40,812 22,189 Cash at end of period 48,583 56,480 48,583 56,480
Supplemental disclosure of operating cash flows Interest paid 8,879 13,399 37,987 33,895 Income taxes paid - - - -
For the three months ended For the nine months endedMay 31, May 31,
The notes constitute an integral part of the interim condensed consolidated financial statements.
Postmedia Network Canada Corp. Third Quarter – Fiscal 2014 Page 30
POSTMEDIA NETWORK CANADA CORP. NOTES TO INTERIM CONDENSED CONSOLIDATED FINANCIAL STATEMENTS (UNAUDITED) FOR THE THREE AND NINE MONTHS ENDED MAY 31, 2014 AND 2013 (In thousands of Canadian dollars, except as otherwise noted) 1. DESCRIPTION OF BUSINESS
Postmedia Network Canada Corp. (“Postmedia” or the “Company”) is a holding company that has a 100% interest in its subsidiary Postmedia Network Inc. (“Postmedia Network”). The Company was incorporated on April 26, 2010, pursuant to the Canada Business Corporations Act. The Company’s head office and registered office is 365 Bloor Street East, 12th Floor, Toronto, Ontario. The Company’s operations consist of both news and information gathering and dissemination operations, with products offered in major Canadian markets and a number of regional and local markets in Canada through a variety of print, web, tablet and smartphone platforms, and digital media and online assets including the canada.com website, each newspaper’s online website and Infomart, the Company’s media monitoring service. The Company supports these operations through a variety of centralized shared services. The Company has one operating segment for financial reporting purposes, the Newspaper segment. The Newspaper segment’s revenue is primarily from advertising and circulation/subscription revenue. The Company’s advertising revenue is seasonal. Historically, advertising revenue and accounts receivable are typically highest in the first and third fiscal quarters, while expenses are relatively constant throughout the fiscal year.
2. BASIS OF PRESENTATION These interim condensed consolidated financial statements have been prepared in accordance with International Financial Reporting Standards (“IFRS”) as issued by the International Accounting Standards Board (“IASB”) and International Accounting Standard (“IAS”) 34 – Interim Financial Reporting. The accounting policies applied in the preparation of these interim condensed consolidated financial statements are the same as those used in the Company’s annual audited consolidated financial statements except for the changes in accounting policies noted below. In addition, these interim condensed consolidated financial statements do not include all the information and disclosures required in the annual audited consolidated financial statements and accordingly should be read in conjunction with the Company’s audited consolidated financial statements for the years ended August 31, 2013, 2012 and 2011. These interim condensed consolidated financial statements were approved by the Board of Directors (the “Board”) on July 10, 2014.
Postmedia Network Canada Corp. Third Quarter – Fiscal 2014 Page 31
Critical accounting estimates The preparation of financial statements in accordance with IFRS requires management to make estimates, assumptions and judgements that affect the reported amounts of assets and liabilities, related amounts of revenues and expenses, and disclosure of contingent assets and liabilities. Although these estimates, assumptions and judgements are based upon management’s best knowledge of the amount, event or actions; actual results could differ from those estimates, assumptions and judgements. The critical accounting estimates are not materially different from those disclosed in the Company’s audited consolidated financial statements for the years ended August 31, 2013, 2012 and 2011, except as described below:
Employee future benefits The cost of defined benefit pension benefit plans, post-retirement benefit plans and other long-term employee benefit plans and the present value of the defined benefit obligation are determined using actuarial valuations. An actuarial valuation involves making various assumptions including mortality rates. In July 2013, the Canadian Institute of Actuaries (“CIA”) issued a draft report proposing new mortality tables for use in the valuation of Canadian pension and benefit plans. On October 31, 2013 the CIA announced that the use of current mortality tables without adjustment would only be appropriate if supported by credible experience, the characteristics of the specific plan, or other quantifiable experience. As a result, during the three months ended November 30, 2013, the Company modified the mortality tables used to value the defined benefit pension benefit and post-retirement benefit obligations which resulted in an actuarial loss of $15.6 million recorded in other comprehensive income with an offsetting increase in other non-current liabilities. In February 2014, the CIA issued final mortality tables and the Company assessed the impact of the revisions and determined that no further adjustments were required. The change in mortality rate assumptions is expected to result in increased funding valuation obligations as well as increased defined benefit plan expense in future years.
Changes in accounting policies The Company has adopted the following new and amended standards effective September 1, 2013. The comparative interim condensed consolidated financial statements have been revised as applicable to reflect the adopted standards as described below.
(i) IFRS 13 – Fair Value Measurement IFRS 13 – Fair Value Measurement establishes a single source of guidance for fair value measurement across all IFRS standards. IFRS 13 defines fair value, provides guidance on measurement and introduces certain disclosure requirements. The Company adopted IFRS 13 on September 1, 2013 on a prospective basis. The adoption of IFRS 13 did not result in any measurement adjustments or changes to the valuation techniques used by the Company. The Company has included the required interim disclosures in note 12 of these interim condensed consolidated financial statements.

Postmedia Network Canada Corp. Third Quarter – Fiscal 2014 Page 32
(ii) IAS 19 – Employee Benefits (Amended) IAS 19 – Employee Benefits (Amended) includes a number of changes related to the recognition and measurement of defined benefit employee benefit plans. The amendments introduce a net interest approach that replaces the expected return on plan assets and interest costs on the defined benefit obligation with a single net interest component which will be determined based on the application of the discount rate on the net defined benefit obligation. The amendments also require the recognition of all past service costs in profit or loss when the employee benefit plan is amended. The Company adopted IAS 19 on September 1, 2013 on a retrospective basis back to September 1, 2011. The adoption of IAS 19 has resulted in an adjustment to the opening deficit as at September 1, 2011 to reflect previously unrecognized past service costs. Additionally, the comparative figures in these interim condensed consolidated financial statements have been revised as illustrated in the tables below to reflect the amended standard. The amended standard also clarifies when an employer offers voluntary termination benefits that the obligating event under such termination benefits is deemed to have occurred when an entity can no longer withdraw the offer. This resulted in a decrease to restructuring and other items of $10.5 million in the three months ended May 31, 2013 and a corresponding increase to restructuring and other items of $10.5 million in the three months ended August 31, 2013. The following tables provide the impact on the comparative financial information in the interim condensed consolidated financial statements for the three and nine months ended May 31, 2014 and 2013:
Effect on comprehensive income attributable to equity holders of the Company
Three months ended May 31,
2013
Nine months ended May 31,
2013
Net loss attributable to equity holders of the Company as previously reported (112,166) (118,024)
IAS 19 amendments (increasing) decreasing reported net loss Compensation (119) (357) Restructuring and other items 10,509 10,509 Net financing expense relating to employee benefit plans (1,480) (4,441) Total IAS 19 amendments decreasing reported net loss 8,910 5,711
Net loss attributable to equity holders of the Company revised (1) (103,256) (112,313)
Comprehensive loss attributable to equity holders of the Company as previously reported (116,439) (107,099)
IAS 19 amendments decreasing reported comprehensive loss Impact of IAS 19 amendments to net loss 8,910 5,711 Net actuarial gains on employee benefits 1,661 4,984 Total IAS 19 amendments decreasing reported comprehensive loss 10,571 10,695 Comprehensive loss attributable to equity holders of the Company revised (105,868) (96,404)
(1) These adjustments decreased basic and diluted net loss per share attributable to equity holders of the Company for the three
and nine months ended May 31, 2013 by $0.14 per share and $0.22 per share, respectively.

Postmedia Network Canada Corp. Third Quarter – Fiscal 2014 Page 33
Effect on the consolidated statements of financial position
Increase August 31,
2013August 31,
2012September 1,
2011Other non-current liabilities 1,675 1,923 2,171 Deficit 1,675 1,923 2,171
(iii) IFRS 10 – Consolidated Financial Statements IFRS 10 – Consolidated Financial Statements replaces SIC-12 Consolidation – Special Purpose Entities and parts of IAS 27 – Consolidated and Separate Financial Statements and introduces a new definition of control that is intended to provide more consistent guidance in the determination of whether control exists and whether or not an entity should be included within the consolidated financial statements. The adoption of this standard did not have an impact on the interim condensed consolidated financial statements.
Accounting standards issued but not yet effective
The Company has not early adopted the following new standards and the impacts on the consolidated financial statements have not yet been determined: (i) IFRS 9 – Financial Instruments IFRS 9 – Financial Instruments was issued in November 2009 and is the same as disclosed in the audited consolidated financial statements for the years ended August 31, 2013, 2012 and 2011, except, for the addition of a new hedge accounting model and the removal of the mandatory effective date of implementation. (ii) IFRS 15 – Revenue from Contracts with Customers IFRS 15 – Revenue from Contracts with Customers was issued in May 2014 and is a new standard that specifies the steps and timing for entities to recognize revenue as well as requiring them to provide more informative, relevant disclosures. IFRS 15 replaces IAS 11 - Construction Contracts and IAS 18 - Revenue, as well as various IFRIC and SIC interpretations regarding revenue. The standard is required to be applied for annual periods beginning on or after January 1, 2017, with earlier adoption permitted. (iii) IFRIC 21 – Levies IFRIC 21 – Levies clarifies the timing for the accounting of a liability that is imposed by governments should be based on the activity in the legislation that triggers the payment. This standard is required to be applied retrospectively for annual periods beginning on or after January 1, 2014, with earlier adoption permitted.

Postmedia Network Canada Corp. Third Quarter – Fiscal 2014 Page 34
3. OPERATING INCOME BEFORE DEPRECIATION, AMORTIZATION, IMPAIRMENT AND RESTRUCTURING
The Company presents operating income before depreciation, amortization, impairment and restructuring, in the condensed consolidated statement of operations, to assist users in assessing financial performance. The Company’s management and Board use this measure to evaluate consolidated operating results and to assess the ability of the Company to incur and service debt. In addition, this measure is used to make operating decisions as it is an indicator of how much cash is being generated by the Company and assists in determining the need for additional cost reductions, evaluation of personnel and resource allocation decisions. Operating income before depreciation, amortization, impairment and restructuring is referred to as an additional IFRS measure and may not be comparable to similar measures presented by other companies.
4. IMPAIRMENTS
The Company’s impairments for the three and nine months ended May 31, 2014 and 2013 consist of the following:
2014 2013 2014 2013
Impairment testing of goodwill and indefinite life intangible assetsGoodwill - 73,900 - 73,900 Intangible assets - mastheads 13,900 13,900 Other impairmentsProperty and equipment - land and building - 6,083 - 6,083 Impairments - 93,883 - 93,883
For the three months ended For the nine months endedMay 31, May 31,
Impairment testing of goodwill and indefinite life intangible assets During the three months ended May 31, 2014, the Company completed its annual impairment testing for goodwill and indefinite life intangible assets as at May 31, 2014 (the “Annual Impairment Test”) based on management's best estimates of market participant assumptions including weighted average cost of capital (“WACC”). The recoverable amounts, determined based on fair value less costs of disposal, of the goodwill cash generating unit (“Goodwill CGU”) and individual cash generating units ("CGU" or "CGUs"), which are primarily individual newspapers, were determined by utilizing a discounted cash flow approach using cash flow projections based upon financial forecasts prepared by management covering a three year period. The future cash flows are based on management’s best estimate using market participant assumptions considering historical and expected operating plans, current strategies, economic conditions, and the general outlook for the industry and markets in which the Goodwill CGU and individual CGUs operate. Cash flows beyond the three year period are extrapolated using estimated growth rates.

Postmedia Network Canada Corp. Third Quarter – Fiscal 2014 Page 35
The after tax discount rate and terminal growth rate used by the Company for the purpose of the Annual Impairment Test for the Goodwill CGU and each of the individual CGUs was 13.2% and 0.0%, respectively (June 30, 2013 - 13.4% and 0.0%, respectively). The after tax discount rate represents a WACC for comparable companies operating in the Company’s industry, based on publicly available information. The WACC is a market participant estimate of the overall required rate of return on an investment for both debt and equity owners and serves as the basis for developing an appropriate discount rate. Determination of the WACC requires separate analysis of the cost of equity and debt, and considers a market participant risk premium based on an assessment of risks related to the projected cash flows of the Company’s CGUs. The terminal growth rate does not exceed the long-term terminal growth rate for the business in which the Company’s CGUs operate. Based on the Annual Impairment Test the Company concluded there was no impairment of the Goodwill CGU and the reasonable range of recoverable amounts for the Goodwill CGU, based on the high end of the range, was greater than its carrying value by an excess of $67.6 million (or 9.8%). For the Goodwill CGU, a 0.5% increase in the discount rate and 0.5% reduction in the terminal growth rate, assuming a constant cash flow margin, would result in the carrying amount exceeding the reasonable range for the recoverable amount. In addition, based on the Annual Impairment Test, the Company concluded there were no impairments of its individual CGU’s and the reasonable range of recoverable amounts for the individual CGUs, based on the high end of the range, were greater than their carrying values. However, for two CGUs, if the discount rate were to increase by 0.5% or if the terminal growth rate declined by 0.5%, assuming a constant cash flow margin, the carrying amount of the CGUs would exceed the reasonable range for the recoverable amount. For all other CGUs, no reasonably possible change in assumption would cause the recoverable amount to fall below the carrying value. The Company considered the reasonability of the fair value less costs of disposal results, calculated using the discounted cash flow approach, by comparing them to transaction multiples with other companies in the industry and found the results under the discounted cash flow approach to be reasonable. Management has developed certain cost saving initiatives which have been incorporated in the financial forecasts noted above. If these initiatives are not successful the forecasted operating cash flows may be reduced which may result in an impairment and such impairment, if any, may be material. As at May 31, 2013, as a result of lower than anticipated long-term revenue projections due to economic and structural factors including the uncertainty of the print advertising market and the rapidly evolving digital advertising market the Company performed an interim impairment analysis (the “Interim Impairment Analysis”), which utilized the same market participant assumptions as those disclosed for the June 30, 2013 annual impairment test, and concluded certain of its assets were impaired. Based on the Interim Impairment Analysis the Company concluded the carrying value of the Goodwill CGU was less than its recoverable amount and recorded an impairment charge relating to its goodwill of $73.9 million for the three and nine months ended May 31, 2013. In addition, as a result of the Interim Impairment Analysis, the Company concluded the carrying value of two of its individual CGU’s were less than their recoverable amounts and recorded an impairment charge of $13.9 million pertaining to certain indefinite life intangible assets of the two individual CGU’s for the three and nine months ended May 31, 2013. There were no tax impacts as a result of the impairment charges. Other impairments During the three months ended May 31, 2013 the Company recorded an impairment loss of $6.1 million with respect to a production facility upon reclassification of the facility from property and equipment to asset held-for-sale. The production facility is no longer required due to the outsourcing of certain functions and the Company has engaged a third party to market it for sale. As at May 31, 2014 and August 31, 2013 the production facility has an estimated fair value less costs to sell of $10.5 million and is recorded in the consolidated statement of financial position as an asset held-for-sale.

Postmedia Network Canada Corp. Third Quarter – Fiscal 2014 Page 36
5. DERIVATIVE FINANCIAL INSTRUMENTS As at
May 31, 2014
As at August 31,
2013
AssetsEmbedded derivatives 20,812 16,802 Foreign currency interest rate swap - designated as a cash flow hedge (1) 8,078 1,411
28,890 18,213 Current portion (8,078) (1,411) Non-current derivative financial instruments 20,812 16,802
(1) The notional principal amount outstanding on the foreign currency interest rate swap designated as a cash flow hedge as at May
31, 2014 was US$167.5 million (August 31, 2013 - US$167.5 million). During the three and nine months ended May 31, 2014 foreign currency exchange losses of $3.9 million and gains of $5.2 million, respectively (2013 – gains of $0.9 million and $8.5 million, respectively) were reclassified to the condensed consolidated statements of operations from accumulated other comprehensive loss, representing foreign currency exchange losses and gains on the notional amount of the cash flow hedging derivatives. These amounts were offset by foreign currency exchange gains and losses recognized on the US dollar denominated 12.50% Senior Secured Notes due 2018 (“Second-Lien Notes”) for the three and nine months ended May 31, 2014 and 2013. During the three and nine months ended May 31, 2014 no ineffectiveness was recognized in the condensed consolidated statements of operations related to the Company’s cash flow hedges. During the three and nine months ended May 31, 2014 losses of $1.3 million and $4.1 million, respectively (2013 - $1.7 million and $5.3 million, respectively) were reclassified from accumulated other comprehensive loss to interest expense in the condensed consolidated statements of operations related to the effect of the derivative financial instruments on the Company’s interest expense. The foreign currency interest rate swap designated as a cash flow hedge matures on July 15, 2014 and the remaining unrealized loss on valuation of derivative financial instruments that will be reclassified from accumulated other comprehensive loss to interest expense in the consolidated statement of operations is approximately $0.6 million.
6. ACCOUNTS PAYABLE AND ACCRUED LIABILITIES
As at May 31,
2014
As at August 31,
2013 Trade accounts payable 11,244 10,332 Accrued liabilities 45,225 46,281 Accrued interest on long-term debt 16,141 11,005 Accounts payable and accrued liabilities 72,610 67,618

Postmedia Network Canada Corp. Third Quarter – Fiscal 2014 Page 37
7. PROVISIONS
Restructuring (a)Other
provisions (b) Total Provisions as at August 31, 2013 25,680 1,243 26,923 Net charges (recoveries) 31,351 (227) 31,124 Payments (25,685) (121) (25,806) Provisions as at May 31, 2014 31,346 895 32,241 Portion due within one year (31,346) (213) (31,559) Non-current provisions - 682 682
(a) Restructuring During the year ended August 31, 2012, the Company began implementing a three year business transformation program aimed at significantly reducing legacy newspaper infrastructure costs. The restructuring expense consists of a series of involuntary and voluntary buyouts and includes initiatives such as the outsourcing of the Company’s production at certain newspapers. (b) Other provisions Other provisions include unfavorable lease contracts, equipment removal costs, as well as provisions for certain claims and grievances which have been asserted against the Company.
8. LONG-TERM DEBT
As at May 31,
2014
As at August 31,
2013
Maturity Principal
Financing fees,
discounts and other
Carrying value of debt
Carrying value of debt
8.25% Senior Secured Notes August 2017 205,460 4,822 200,638 212,033 12.5% Senior Secured Notes (US$268.6M) (**) July 2018 291,254 7,121 284,133 274,847 Senior Secured Asset-Based Revolving Credit Facility July 2014 - - - - Total long-term debt 484,771 486,880 Portion due within one year (12,500) (12,500) Non-current long-term debt 472,271 474,380
(**) - US$ principal translated at May 31, 2014 exchange rates.
The terms and conditions of long-term debt are the same as disclosed in the audited consolidated financial statements for the years ended August 31, 2013, 2012 and 2011, except the senior secured asset-based revolving credit facility (“ABL Facility”) had availability as at May 31, 2014 of $21.1 million (August 31, 2013 - $20.7 million).

Postmedia Network Canada Corp. Third Quarter – Fiscal 2014 Page 38
9. EMPLOYEE BENEFIT PLANS
The Company has a number of funded and unfunded defined benefit plans that include pension benefits, post-retirement benefits, and other long-term employee benefits. The net employee benefit plan costs related to the Company’s pension benefit plans, post-retirement benefit plans and other long-term employee benefit plans reported in net loss in the condensed consolidated statements of operations for the three and nine months ended May 31, 2014 and 2013 are as follows:
2014 2013 2014 2013 2014 2013 2014 2013(revised -
note 2)(revised -
note 2)(revised -
note 2)
Current service cost 2,676 3,024 304 448 755 582 3,735 4,054 Administration costs 181 181 - - - - 181 181 Net actuarial losses - - - - 275 64 275 64 Net financing expense 543 1,046 649 667 213 150 1,405 1,863 Net defined benefit plan expense (1) 3,400 4,251 953 1,115 1,243 796 5,596 6,162
2014 2013 2014 2013 2014 2013 2014 2013(revised -
note 2)(revised -
note 2)(revised -
note 2)
Current service cost 8,028 9,072 912 1,344 2,265 1,746 11,205 12,162 Administration costs 543 543 - - - - 543 543 Net actuarial losses - - - - 665 2,190 665 2,190 Net financing expense 1,627 3,139 1,947 2,001 639 450 4,213 5,590 Net defined benefit plan expense (1) 10,198 12,754 2,859 3,345 3,569 4,386 16,626 20,485
For the nine months ended May 31,
Pension benefitsPost-retirement
benefitsOther long-term
employee benefits Total
For the three months ended May 31,
Pension benefitsPost-retirement
benefitsOther long-term
employee benefits Total
(1) During the three months ended November 30, 2012, there was an arbitrator’s ruling against the Company that resulted in a change to benefits provided under an other long-term employee benefit plan. During the three months ended February 28, 2013, the Company received a final arbitrator’s ruling and accordingly revised the estimate related to this change in benefits by reducing net defined benefit plan expense by $1.6 million and increasing an expense for cash costs of $0.1 million, which resulted in a total expense for the nine months ended May 31, 2013 of $2.3 million, which includes actuarial losses of $1.8 million and cash costs of $0.5 million. The expense related to this estimate is recorded in restructuring and other items in the condensed consolidated statement of operations. All other current service costs, administration costs and net actuarial losses related to other long-term employee benefits are included in compensation expense in the condensed consolidated statement of operations. Net financing expense is included in net financing expense relating to employee benefit plans in the condensed consolidated statement of operations.
Actuarial gains and losses related to the Company’s pension benefit plans and post-retirement benefit plans recognized in the condensed consolidated statements of comprehensive loss for the three and nine months ended May 31, 2014 and 2013 are as follows:
2014 2013 2014 2013 2014 2013(revised -
note 2)(revised -
note 2)
Net actuarial gains (losses) on employee benefits 2,019 (3,214) (2,646) (814) (627) (4,028) Net actuarial gains (losses) recognized in other comprehensive income (loss) 2,019 (3,214) (2,646) (814) (627) (4,028)
For the three months ended May 31,
Pension benefitsPost-retirement
benefits Total

Postmedia Network Canada Corp. Third Quarter – Fiscal 2014 Page 39
2014 2013 2014 2013 2014 2013(revised -
note 2)(revised -
note 2)
Net actuarial gains (losses) on employee benefits 5,917 17,223 (9,293) (1,633) (3,376) 15,590 Net actuarial gains (losses) recognized in other comprehensive income (loss) 5,917 17,223 (9,293) (1,633) (3,376) 15,590
Pension benefitsPost-retirement
benefits Total
For the nine months ended May 31,
Changes to the net defined benefit plan obligations related to the Company’s pension benefit plans, post-retirement benefit plans and other long-term employee benefit plans for the nine months ended May 31, 2014 are as follows:
Total (1)
Net defined benefit plan obligation as at August 31, 2013 (revised - note 2) 44,066 55,691 20,632 120,389 Amounts recognized in the statement of operations 10,198 2,859 3,569 16,626 Amounts recognized in other comprehensive income (loss) (5,917) 9,293 - 3,376 Contributions to the plans (14,016) (1,542) (1,566) (17,124) Net defined benefit plan obligation as at May 31, 2014 34,331 66,301 22,635 123,267
Pension benefits
Post-retirement
benefits
Other long-term
employee benefits
(1) As at August 31, 2013 and May 31, 2014, the net defined benefit plan obligations are recorded in other non-current liabilities on the
condensed consolidated statements of financial position.
10. LOSS PER SHARE
The following table provides a reconciliation of the denominators, which are presented in whole numbers, used in computing basic and diluted loss per share for the three and nine months ended May 31, 2014 and 2013. No reconciling items in the computation of net loss exist.
2014 2013Basic weighted average shares outstanding during the period 40,209,619 40,209,619 Dilutive effect of RSUs - - Diluted weighted average shares outstanding during the period 40,209,619 40,209,619
Options and RSUs outstanding which are anti-dilutive 1,472,000 1,032,000
2014 2013Basic weighted average shares outstanding during the period 40,209,619 40,249,965 Dilutive effect of RSUs - - Diluted weighted average shares outstanding during the period 40,209,619 40,249,965
Options and RSUs outstanding which are anti-dilutive 1,472,000 1,032,000
For the three months ended
For the nine months ended
May 31,
May 31,

Postmedia Network Canada Corp. Third Quarter – Fiscal 2014 Page 40
11. SHARE-BASED COMPENSATION PLANS AND OTHER LONG-TERM INCENTIVE PLANS
Share option plan The Company has a share option plan (the “Option Plan”) for its employees and officers to assist in attracting, retaining and motivating officers and employees. The Option Plan is administered by the Board. During the nine months ended May 31, 2014, the Company granted 0.6 million options under the Option Plan. The fair value of the underlying options was estimated using the Black-Scholes option pricing model. The fair value of the issued options and key assumptions used in applying the Black-Scholes option pricing model were as follows:
2014Fair value 0.94$
Key assumptionsExercise Price 2.02$ Risk-free interest rate (1) 1.38%Dividend yield - Volatility factor (2) 52.73%Expected life of options (3) 5 years
(1) Based on Bank of Canada five year benchmark bond yield in effect on the date of grant.
(3) Based on contractual terms and a published academic study.
(2) Based in part on the volatility of the Company's shares and the volatility of similar companies in the publishing and media industries.
The following table provides details on the changes to the issued options, which are presented in whole numbers, for the nine months ended May 31, 2014:
Options
Weighted average exercise
priceBalance, August 31, 2013 1,208,000 8.69$ Issued 560,000 2.02$ Forfeited (32,000) 3.12$ Cancelled (8,000) 6.43$ Balance, May 31, 2014 1,728,000 6.65$
During the three and nine months ended May 31, 2014, the Company recorded compensation expense related to the Option Plan of $0.1 million and $0.5 million, respectively (2013 – $0.1 and $0.3 million, respectively), with an offsetting credit to contributed surplus.

Postmedia Network Canada Corp. Third Quarter – Fiscal 2014 Page 41
Restricted share unit plan The Company has a restricted share unit plan (the “RSU Plan”). The RSU Plan provides for the grant of restricted share units (“RSUs”) to participants, being current, part-time or full-time officers, employees or consultants of the Company. The RSU Plan is administered by the Board. The Company granted no RSU’s during the three and nine months ended May 31, 2014 and 2013. During the three and nine months ended May 31, 2014, the Company recorded compensation expense related to the RSU Plan of $0.1 million and $0.2 million, respectively (2013 - $0.2 million and $0.5 million, respectively), with an offsetting credit to contributed surplus. Deferred share unit plan The Company has a deferred share unit plan (the “DSU Plan”) for the benefit of its non-employee directors. The DSU Plan is administered by the Board. During the three and nine months ended May 31, 2014, the Company granted 93,980 and 234,523 deferred share units (“DSUs”), respectively, under the DSU Plan (2013 – nil). During the three and nine months ended May 31, 2014, the Company recorded an expense of $0.1 million and $0.3 million, respectively (2013 – recovery of $0.1 million and expense of $0.3 million, respectively) to compensation expense, with an offset to other non-current liabilities. All DSUs issued in the three and nine months ended May 31, 2014 vested immediately. Future changes in the fair value of the DSUs will be reflected through adjustments to compensation expense until such a date as the DSUs are settled in cash. During the nine months ended May 31, 2014, the Company settled 19,797 DSUs for nominal consideration and cancelled 113,198 DSUs for no consideration. During the three and nine months ended May 31, 2013, the Company settled 21,320 DSUs for nominal consideration and cancelled 14,213 DSUs for no consideration. The aggregate carrying value of the DSU Plan liability was $0.7 million as at May 31, 2014 (August 31, 2013 - $0.4 million) and is based on a fair value per share of $1.78 (August 31, 2013 - $1.48). The DSU Plan liability is recorded in other non-current liabilities on the condensed consolidated statement of financial position.
12. FINANCIAL INSTRUMENTS
Financial instruments measured at fair value The financial instruments measured at fair value in the condensed consolidated statement of financial position, categorized by level according to the fair value hierarchy that reflects the significance of the inputs used in making the measurements, as at May 31, 2014 are as follows:
As at May 31,
2014
Quoted prices in active markets
for identical assets (Level 1)
Significant other observable
inputs (Level 2)
Significant unobservable
inputs (Level 3)Financial assets Foreign currency interest rate swap 8,078 - - 8,078 Embedded derivatives 20,812 - - 20,812
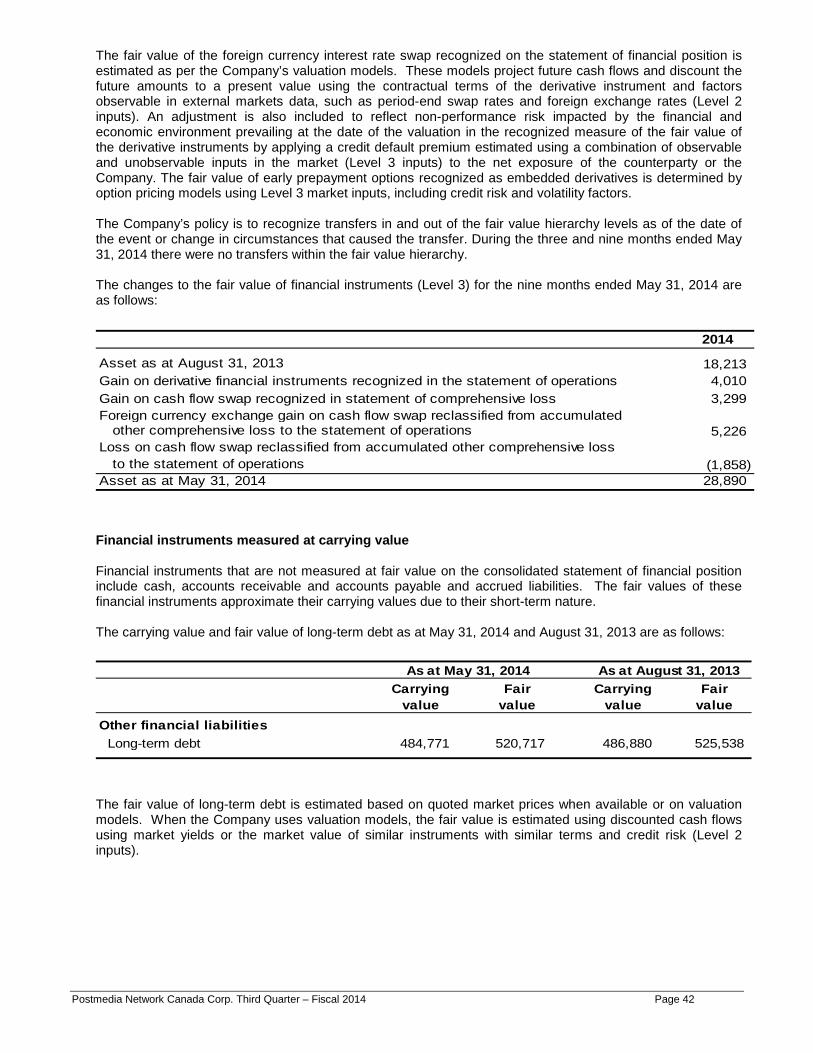
Postmedia Network Canada Corp. Third Quarter – Fiscal 2014 Page 42
The fair value of the foreign currency interest rate swap recognized on the statement of financial position is estimated as per the Company’s valuation models. These models project future cash flows and discount the future amounts to a present value using the contractual terms of the derivative instrument and factors observable in external markets data, such as period-end swap rates and foreign exchange rates (Level 2 inputs). An adjustment is also included to reflect non-performance risk impacted by the financial and economic environment prevailing at the date of the valuation in the recognized measure of the fair value of the derivative instruments by applying a credit default premium estimated using a combination of observable and unobservable inputs in the market (Level 3 inputs) to the net exposure of the counterparty or the Company. The fair value of early prepayment options recognized as embedded derivatives is determined by option pricing models using Level 3 market inputs, including credit risk and volatility factors. The Company’s policy is to recognize transfers in and out of the fair value hierarchy levels as of the date of the event or change in circumstances that caused the transfer. During the three and nine months ended May 31, 2014 there were no transfers within the fair value hierarchy. The changes to the fair value of financial instruments (Level 3) for the nine months ended May 31, 2014 are as follows:
2014
Asset as at August 31, 2013 18,213 Gain on derivative financial instruments recognized in the statement of operations 4,010 Gain on cash flow swap recognized in statement of comprehensive loss 3,299 Foreign currency exchange gain on cash flow swap reclassified from accumulated other comprehensive loss to the statement of operations 5,226 Loss on cash flow swap reclassified from accumulated other comprehensive loss to the statement of operations (1,858) Asset as at May 31, 2014 28,890
Financial instruments measured at carrying value Financial instruments that are not measured at fair value on the consolidated statement of financial position include cash, accounts receivable and accounts payable and accrued liabilities. The fair values of these financial instruments approximate their carrying values due to their short-term nature. The carrying value and fair value of long-term debt as at May 31, 2014 and August 31, 2013 are as follows:
Carrying value
Fair value
Carrying value
Fair value
Other financial liabilities Long-term debt 484,771 520,717 486,880 525,538
As at May 31, 2014 As at August 31, 2013
The fair value of long-term debt is estimated based on quoted market prices when available or on valuation models. When the Company uses valuation models, the fair value is estimated using discounted cash flows using market yields or the market value of similar instruments with similar terms and credit risk (Level 2 inputs).

Postmedia Network Canada Corp. Third Quarter – Fiscal 2014 Page 43
Foreign currency risk As at May 31, 2014, approximately 59% of the outstanding principal on the Company’s long-term debt is payable in US dollars (August 31, 2013 – 56%). As at May 31, 2014 and August 31, 2013, the Company has entered into derivative financial instruments to reduce the foreign currency risk exposure on 62% of its US dollar denominated long-term debt. On July 15, 2014 the foreign currency interest rate swap related to the Second-Lien Notes will mature, exposing the Company to additional foreign currency risk on the Second-Lien Notes. As at May 31, 2014, the Company has US$268.6 million Second-Lien Notes outstanding.
13. SUBSEQUENT EVENT
On July 9, 2014 the Company signed a commitment letter for a new senior secured asset-based revolving credit facility (the “New ABL Facility”) for an aggregate amount of up to $20.0 million subject to completion of definitive documentation. The New ABL Facility will replace the Company’s existing ABL Facility that will terminate on July 13, 2014. The New ABL Facility will mature one year from the closing date and will be secured on a first-priority basis by accounts receivable, cash and inventory of Postmedia Network and any related assets of the Company and on a third priority basis by the First-Lien Notes collateral.