Embed Size (px)
Citation preview

THIRD QUARTER BRIEF REPORT OF FINANCIAL RESULTS〔IFRS〕(Consolidated) (Year ending March 31, 2021)
February 5, 2021 Registered Company Name: MINEBEA MITSUMI Inc. Common Stock Listings: Tokyo and Nagoya Code No: 6479 URL: https://www.minebeamitsumi.com/ Representative: Yoshihisa Kainuma Representative Director, CEO & COO Contact: Mitsunobu Yamamoto General Manager of Accounting Department Quarterly report filing date: February 15, 2021 Phone: (03) 6758-6711 Expected date of payment for dividends: ― Preparation of supplementary explanation material for quarterly financial results : Yes Holding of presentation meeting for quarterly financial results : Yes( For Analyst)
(Amounts less than one million yen have been rounded.) 1. Business Performance (April 1, 2020 through December 31, 2020)(1) Consolidated Results of Operations (Year-to-date) (%: Changes from corresponding period of previous fiscal year)
Net sales (millions of yen)
% Change
Operating income (millions of yen)
% Change
Profit before income taxes (millions of yen)
% Change
Nine months ended Dec. 31, 2020 737,439 (1.9) 42,516 (8.1) 41,641 (9.9) Nine months ended Dec. 31, 2019 751,548 7.5 46,246 (28.9) 46,219 (28.5)
Profit for the period
(millions of yen)
% Change
Profit for the period attributable to
owners of the parent (millions of yen)
% Change
Comprehensive income
for the period (millions of yen)
% Change
Nine months ended Dec. 31, 2020 33,014 (9.3) 32,984 (7.2) 40,381 10.0 Nine months ended Dec. 31, 2019 36,380 (29.2) 35,547 (30.3) 36,694 (24.8)
Earnings per share, basic
(yen)
Earnings per share, diluted
(yen)Nine months ended Dec. 31, 2020 80.76 78.98 Nine months ended Dec. 31, 2019 85.64 83.77
(Notes) At March 31, 2020, provisional accounting treatments for business combinations through acquisition of U-Shin Ltd. was finalized, and the contents of finalization of the provisional accounting treatments are reflected on the figures for the year ended March 31, 2020.
(2) Consolidated Financial Position
Total assets (millions of yen)
Total equity (millions of yen)
Total equity attributable to
owners of the parent (millions of yen)
Equity ratio attributable to
owners of the parent (%)
As of Dec. 31, 2020 954,715 430,418 427,845 44.8 As of Mar. 31, 2020 864,481 402,276 394,372 45.6
2. DividendsAnnual dividends
End of first quarter
(yen)
End of second quarter
(yen)
End of third quarter
(yen)
Year-end (yen)
For the year (yen)
Year ended Mar. 31, 2020 ― 14.00 ― 14.00 28.00 Year ending Mar. 31, 2021 ― 14.00 ― Year ending Mar. 31, 2021
(Forecast) 14.00 28.00
(Notes) Changes from the latest dividend forecast: Yes
- 1 -
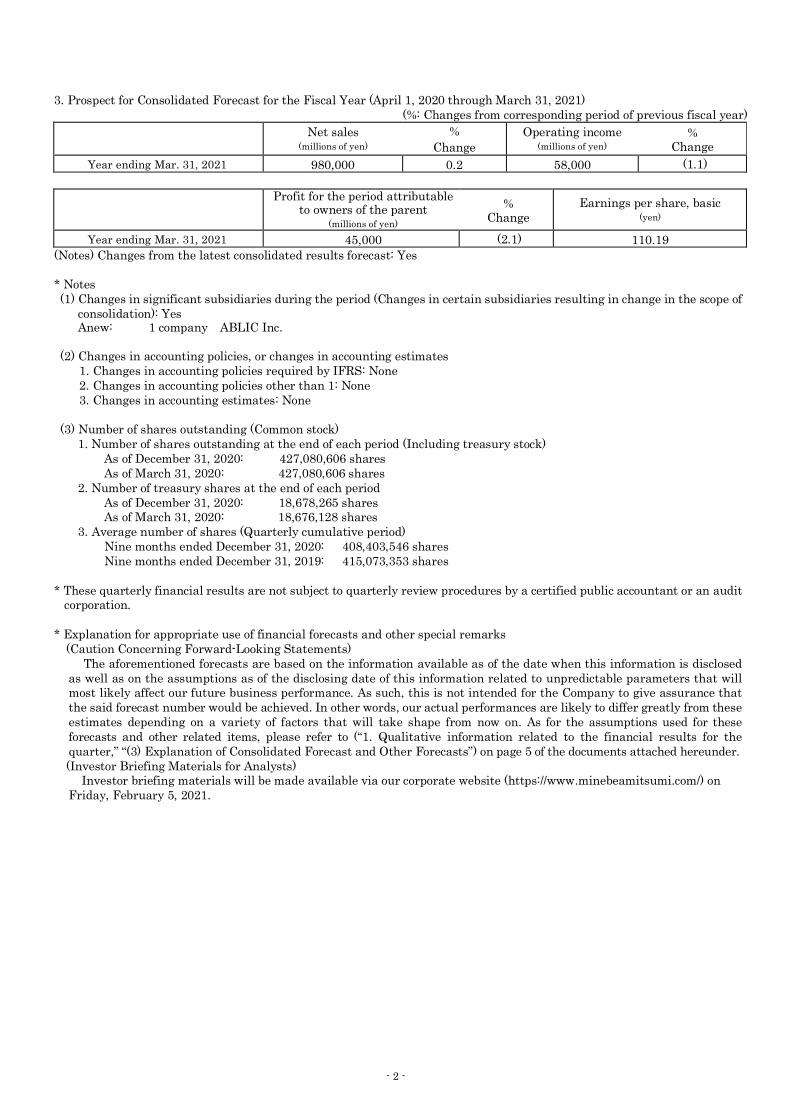
3. Prospect for Consolidated Forecast for the Fiscal Year (April 1, 2020 through March 31, 2021)(%: Changes from corresponding period of previous fiscal year)
Net sales (millions of yen)
% Change
Operating income (millions of yen)
% Change
Year ending Mar. 31, 2021 980,000 0.2 58,000 (1.1)
Profit for the period attributableto owners of the parent
(millions of yen)
% Change
Earnings per share, basic (yen)
Year ending Mar. 31, 2021 45,000 (2.1) 110.19 (Notes) Changes from the latest consolidated results forecast: Yes
* Notes(1) Changes in significant subsidiaries during the period (Changes in certain subsidiaries resulting in change in the scope of
consolidation): YesAnew: 1 company ABLIC Inc.
(2) Changes in accounting policies, or changes in accounting estimates1. Changes in accounting policies required by IFRS: None2. Changes in accounting policies other than 1: None3. Changes in accounting estimates: None
(3) Number of shares outstanding (Common stock)1. Number of shares outstanding at the end of each period (Including treasury stock)
As of December 31, 2020: 427,080,606 shares As of March 31, 2020: 427,080,606 shares
2. Number of treasury shares at the end of each periodAs of December 31, 2020: 18,678,265 sharesAs of March 31, 2020: 18,676,128 shares
3. Average number of shares (Quarterly cumulative period)Nine months ended December 31, 2020: 408,403,546 sharesNine months ended December 31, 2019: 415,073,353 shares
* These quarterly financial results are not subject to quarterly review procedures by a certified public accountant or an auditcorporation.
* Explanation for appropriate use of financial forecasts and other special remarks(Caution Concerning Forward-Looking Statements)
The aforementioned forecasts are based on the information available as of the date when this information is disclosedas well as on the assumptions as of the disclosing date of this information related to unpredictable parameters that willmost likely affect our future business performance. As such, this is not intended for the Company to give assurance thatthe said forecast number would be achieved. In other words, our actual performances are likely to differ greatly from theseestimates depending on a variety of factors that will take shape from now on. As for the assumptions used for theseforecasts and other related items, please refer to (“1. Qualitative information related to the financial results for thequarter,” “(3) Explanation of Consolidated Forecast and Other Forecasts”) on page 5 of the documents attached hereunder.(Investor Briefing Materials for Analysts)
Investor briefing materials will be made available via our corporate website (https://www.minebeamitsumi.com/) onFriday, February 5, 2021.
- 2 -

Index
1. Qualitative information related to the financial results for the quarter ............................................. 4 (1) Explanation of Operating Results ................................................................................................. 4 (2) Explanation of Financial Position.................................................................................................. 5 (3) Explanation of Consolidated Forecast and Other Forecasts .......................................................... 5(4) Basic Policy for Profit Sharing and Dividend for the Current Fiscal Year ..................................... 5
2. Condensed Quarterly Consolidated Financial Statements and Major Notes ...................................... 6 (1) Condensed Quarterly Consolidated Statements of Financial Position ........................................... 6 (2) Condensed Quarterly Consolidated Statements of Income
and Condensed Quarterly Consolidated Statements of Comprehensive Income ........................ 8 Condensed Quarterly Consolidated Statements of Income ............................................................ 8 Condensed Quarterly Consolidated Statements of Comprehensive Income................................... 9
(3) Condensed Quarterly Consolidated Statements of Changes in Equity .......................................... 10 (4) Condensed Quarterly Consolidated Statements of Cash Flows ..................................................... 12 (5) Notes on Condensed Quarterly Consolidated Financial Statements ............................................. 13
(Notes on Going Concern Assumptions) ....................................................................................... 13 (Segment Information) ................................................................................................................. 13
- 3 -
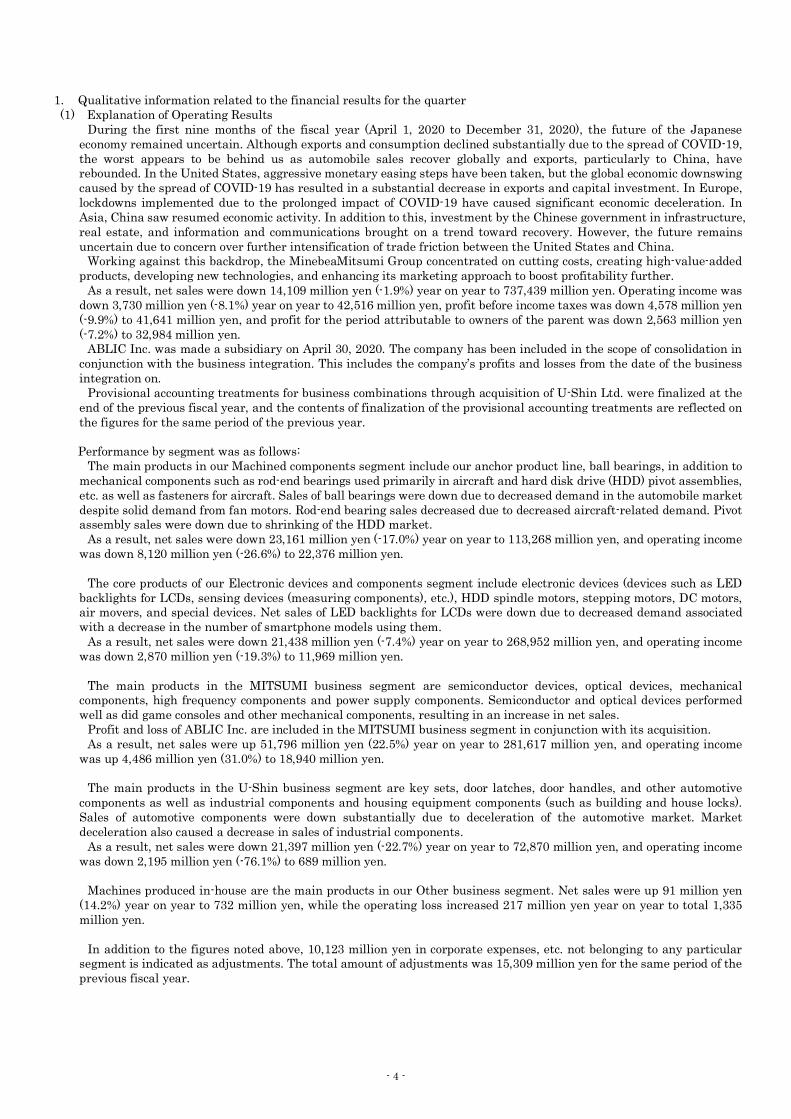
1. Qualitative information related to the financial results for the quarter (1) Explanation of Operating Results
During the first nine months of the fiscal year (April 1, 2020 to December 31, 2020), the future of the Japanese economy remained uncertain. Although exports and consumption declined substantially due to the spread of COVID-19, the worst appears to be behind us as automobile sales recover globally and exports, particularly to China, have rebounded. In the United States, aggressive monetary easing steps have been taken, but the global economic downswing caused by the spread of COVID-19 has resulted in a substantial decrease in exports and capital investment. In Europe, lockdowns implemented due to the prolonged impact of COVID-19 have caused significant economic deceleration. In Asia, China saw resumed economic activity. In addition to this, investment by the Chinese government in infrastructure, real estate, and information and communications brought on a trend toward recovery. However, the future remains uncertain due to concern over further intensification of trade friction between the United States and China.
Working against this backdrop, the MinebeaMitsumi Group concentrated on cutting costs, creating high-value-added products, developing new technologies, and enhancing its marketing approach to boost profitability further.
As a result, net sales were down 14,109 million yen (-1.9%) year on year to 737,439 million yen. Operating income was down 3,730 million yen (-8.1%) year on year to 42,516 million yen, profit before income taxes was down 4,578 million yen (-9.9%) to 41,641 million yen, and profit for the period attributable to owners of the parent was down 2,563 million yen (-7.2%) to 32,984 million yen.
ABLIC Inc. was made a subsidiary on April 30, 2020. The company has been included in the scope of consolidation in conjunction with the business integration. This includes the company’s profits and losses from the date of the business integration on.
Provisional accounting treatments for business combinations through acquisition of U-Shin Ltd. were finalized at the end of the previous fiscal year, and the contents of finalization of the provisional accounting treatments are reflected on the figures for the same period of the previous year.
Performance by segment was as follows:
The main products in our Machined components segment include our anchor product line, ball bearings, in addition to mechanical components such as rod-end bearings used primarily in aircraft and hard disk drive (HDD) pivot assemblies, etc. as well as fasteners for aircraft. Sales of ball bearings were down due to decreased demand in the automobile market despite solid demand from fan motors. Rod-end bearing sales decreased due to decreased aircraft-related demand. Pivot assembly sales were down due to shrinking of the HDD market.
As a result, net sales were down 23,161 million yen (-17.0%) year on year to 113,268 million yen, and operating income was down 8,120 million yen (-26.6%) to 22,376 million yen.
The core products of our Electronic devices and components segment include electronic devices (devices such as LED
backlights for LCDs, sensing devices (measuring components), etc.), HDD spindle motors, stepping motors, DC motors, air movers, and special devices. Net sales of LED backlights for LCDs were down due to decreased demand associated with a decrease in the number of smartphone models using them.
As a result, net sales were down 21,438 million yen (-7.4%) year on year to 268,952 million yen, and operating income was down 2,870 million yen (-19.3%) to 11,969 million yen.
The main products in the MITSUMI business segment are semiconductor devices, optical devices, mechanical
components, high frequency components and power supply components. Semiconductor and optical devices performed well as did game consoles and other mechanical components, resulting in an increase in net sales.
Profit and loss of ABLIC Inc. are included in the MITSUMI business segment in conjunction with its acquisition. As a result, net sales were up 51,796 million yen (22.5%) year on year to 281,617 million yen, and operating income
was up 4,486 million yen (31.0%) to 18,940 million yen. The main products in the U-Shin business segment are key sets, door latches, door handles, and other automotive
components as well as industrial components and housing equipment components (such as building and house locks). Sales of automotive components were down substantially due to deceleration of the automotive market. Market deceleration also caused a decrease in sales of industrial components.
As a result, net sales were down 21,397 million yen (-22.7%) year on year to 72,870 million yen, and operating income was down 2,195 million yen (-76.1%) to 689 million yen.
Machines produced in-house are the main products in our Other business segment. Net sales were up 91 million yen
(14.2%) year on year to 732 million yen, while the operating loss increased 217 million yen year on year to total 1,335 million yen.
In addition to the figures noted above, 10,123 million yen in corporate expenses, etc. not belonging to any particular
segment is indicated as adjustments. The total amount of adjustments was 15,309 million yen for the same period of the previous fiscal year.
- 4 -
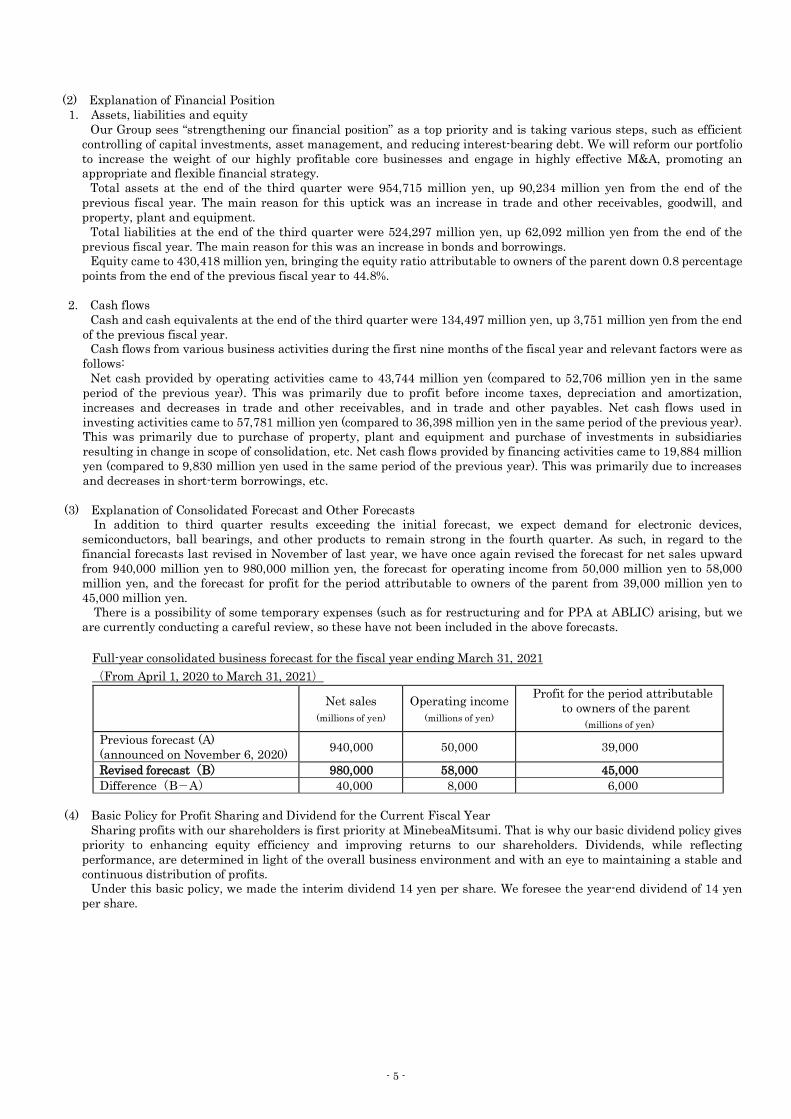
(2) Explanation of Financial Position 1. Assets, liabilities and equity
Our Group sees “strengthening our financial position” as a top priority and is taking various steps, such as efficient controlling of capital investments, asset management, and reducing interest-bearing debt. We will reform our portfolio to increase the weight of our highly profitable core businesses and engage in highly effective M&A, promoting an appropriate and flexible financial strategy.
Total assets at the end of the third quarter were 954,715 million yen, up 90,234 million yen from the end of the previous fiscal year. The main reason for this uptick was an increase in trade and other receivables, goodwill, and property, plant and equipment.
Total liabilities at the end of the third quarter were 524,297 million yen, up 62,092 million yen from the end of the previous fiscal year. The main reason for this was an increase in bonds and borrowings.
Equity came to 430,418 million yen, bringing the equity ratio attributable to owners of the parent down 0.8 percentage points from the end of the previous fiscal year to 44.8%.
2. Cash flows Cash and cash equivalents at the end of the third quarter were 134,497 million yen, up 3,751 million yen from the end
of the previous fiscal year. Cash flows from various business activities during the first nine months of the fiscal year and relevant factors were as
follows: Net cash provided by operating activities came to 43,744 million yen (compared to 52,706 million yen in the same
period of the previous year). This was primarily due to profit before income taxes, depreciation and amortization, increases and decreases in trade and other receivables, and in trade and other payables. Net cash flows used in investing activities came to 57,781 million yen (compared to 36,398 million yen in the same period of the previous year). This was primarily due to purchase of property, plant and equipment and purchase of investments in subsidiaries resulting in change in scope of consolidation, etc. Net cash flows provided by financing activities came to 19,884 million yen (compared to 9,830 million yen used in the same period of the previous year). This was primarily due to increases and decreases in short-term borrowings, etc.
(3) Explanation of Consolidated Forecast and Other Forecasts In addition to third quarter results exceeding the initial forecast, we expect demand for electronic devices,
semiconductors, ball bearings, and other products to remain strong in the fourth quarter. As such, in regard to the financial forecasts last revised in November of last year, we have once again revised the forecast for net sales upward from 940,000 million yen to 980,000 million yen, the forecast for operating income from 50,000 million yen to 58,000 million yen, and the forecast for profit for the period attributable to owners of the parent from 39,000 million yen to 45,000 million yen.
There is a possibility of some temporary expenses (such as for restructuring and for PPA at ABLIC) arising, but we are currently conducting a careful review, so these have not been included in the above forecasts.
Full-year consolidated business forecast for the fiscal year ending March 31, 2021 (From April 1, 2020 to March 31, 2021)
Net sales (millions of yen)
Operating income (millions of yen)
Profit for the period attributable to owners of the parent
(millions of yen) Previous forecast (A) (announced on November 6, 2020) 940,000 50,000 39,000
Revised forecast(B) 980,000 58,000 45,000 Difference(B-A) 40,000 8,000 6,000
(4) Basic Policy for Profit Sharing and Dividend for the Current Fiscal Year
Sharing profits with our shareholders is first priority at MinebeaMitsumi. That is why our basic dividend policy gives priority to enhancing equity efficiency and improving returns to our shareholders. Dividends, while reflecting performance, are determined in light of the overall business environment and with an eye to maintaining a stable and continuous distribution of profits.
Under this basic policy, we made the interim dividend 14 yen per share. We foresee the year-end dividend of 14 yen per share.
- 5 -
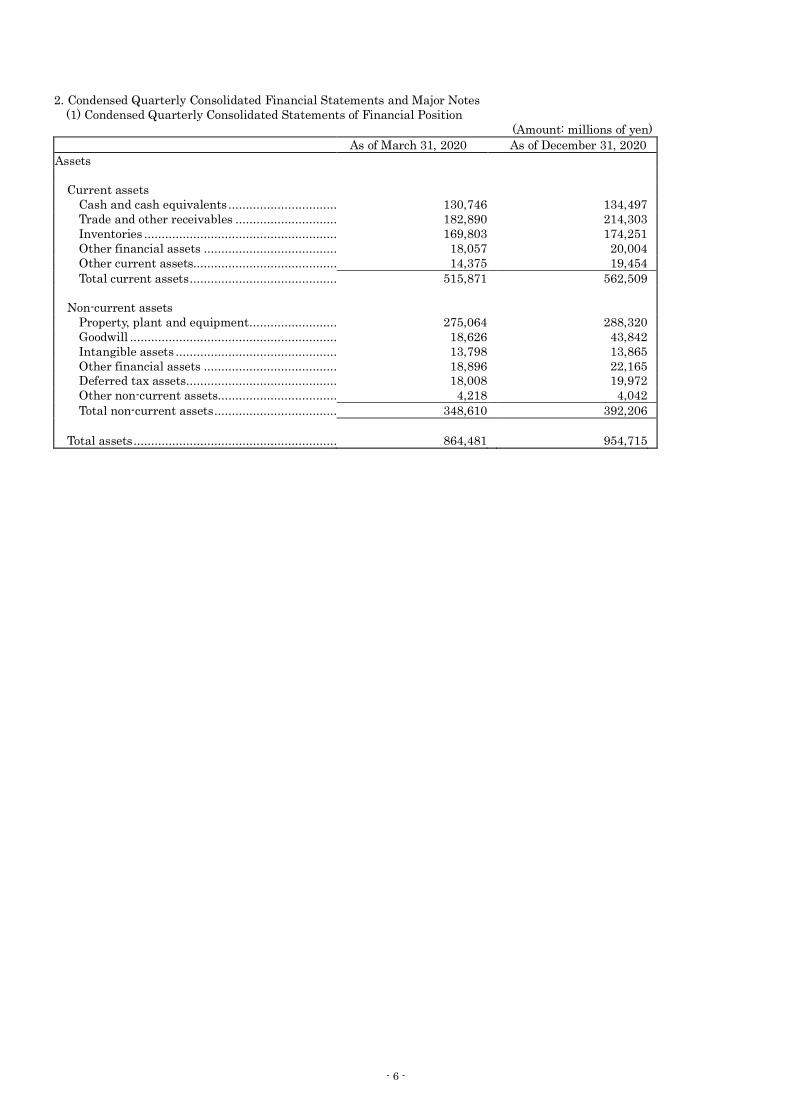
2. Condensed Quarterly Consolidated Financial Statements and Major Notes (1) Condensed Quarterly Consolidated Statements of Financial Position
(Amount: millions of yen) As of March 31, 2020 As of December 31, 2020
Assets
Current assets Cash and cash equivalents ............................... 130,746 134,497 Trade and other receivables ............................. 182,890 214,303 Inventories ....................................................... 169,803 174,251 Other financial assets ...................................... 18,057 20,004 Other current assets......................................... 14,375 19,454 Total current assets .......................................... 515,871 562,509
Non-current assets Property, plant and equipment ......................... 275,064 288,320 Goodwill ........................................................... 18,626 43,842 Intangible assets .............................................. 13,798 13,865 Other financial assets ...................................... 18,896 22,165 Deferred tax assets ........................................... 18,008 19,972 Other non-current assets.................................. 4,218 4,042 Total non-current assets ................................... 348,610 392,206
Total assets .......................................................... 864,481 954,715
- 6 -

(Amount: millions of yen) As of March 31, 2020 As of December 31, 2020
Liabilities and equity
Liabilities Current liabilities
Trade and other payables ................................. 143,964 147,749 Bonds and borrowings ...................................... 95,268 141,251 Other financial liabilities ................................. 6,984 8,629 Income taxes payable ....................................... 2,905 7,512 Provisions ......................................................... 4,353 4,399 Other current liabilities ................................... 42,209 40,717 Total current liabilities ..................................... 295,683 350,257
Non-current liabilities Bonds and borrowings ...................................... 126,444 132,134 Other financial liabilities ................................. 13,639 14,774 Net defined benefit liabilities ........................... 22,482 23,203 Provisions ......................................................... 579 568 Deferred tax liabilities ..................................... 1,702 1,668 Other non-current liabilities ............................ 1,676 1,693 Total non-current liabilities .............................. 166,522 174,040
Total liabilities ..................................................... 462,205 524,297
Equity
Common stock .................................................. 68,259 68,259 Capital surplus ................................................. 134,707 139,318 Treasury stock .................................................. (34,455 ) (34,470 ) Retained earnings ............................................ 234,667 256,216 Other components of equity.............................. (8,806 ) (1,478 ) Total equity attributable to owners of the parent ....................................................... 394,372 427,845 Non-controlling interests.................................. 7,904 2,573 Total equity ...................................................... 402,276 430,418
Total liabilities and equity ................................... 864,481 954,715
- 7 -

(2) Condensed Quarterly Consolidated Statements of Income and Condensed Quarterly Consolidated Statements of Comprehensive Income
(Condensed Quarterly Consolidated Statements of Income) Nine months ended December 31
(Amount: millions of yen) Nine months ended
December 31, 2019 Nine months ended December 31, 2020
Net sales .............................................................. 751,548 737,439 Cost of sales ......................................................... 626,654 613,357 Gross profit .......................................................... 124,894 124,082 Selling, general and administrative expenses ..... 80,674 78,818 Other income............................................................... 2,913 4,065 Other expenses............................................................ 887 6,813 Operating income ........................................................ 46,246 42,516 Finance income ......................................................... 1,423 1,164 Finance expenses ...................................................... 1,450 2,039 Profit before income taxes ........................................... 46,219 41,641 Income taxes................................................................ 9,839 8,627 Profit for the period ................................................ 36,380 33,014 Profit for the period attributable to:
Owners of the parent ............................................... 35,547 32,984 Non-controlling interests ......................................... 833 30 Profit for the period .................................................. 36,380 33,014
Earnings per share (EPS)
Basic (Yen) ............................................................... 85.64 80.76 Diluted (Yen) ............................................................ 83.77 78.98 Three months ended December 31
(Amount: millions of yen) Three months ended
December 31, 2019 Three months ended December 31, 2020
Net sales .............................................................. 267,650 275,709 Cost of sales ......................................................... 218,121 228,378 Gross profit .......................................................... 49,529 47,331 Selling, general and administrative expenses ..... 26,644 27,549 Other income............................................................... 553 763 Other expenses............................................................ 139 950 Operating income ........................................................ 23,299 19,595 Finance income ......................................................... 462 363 Finance expenses ...................................................... 515 566 Profit before income taxes ........................................... 23,246 19,392 Income taxes................................................................ 3,880 3,227 Profit for the period ................................................ 19,366 16,165 Profit for the period attributable to:
Owners of the parent ............................................... 19,232 16,172 Non-controlling interests ......................................... 134 (7 ) Profit for the period .................................................. 19,366 16,165
Earnings per share (EPS)
Basic (Yen) ............................................................... 46.35 39.60 Diluted (Yen) ............................................................ 45.32 38.71
- 8 -

(Condensed Quarterly Consolidated Statements of Comprehensive Income)
Nine months ended December 31 (Amount: millions of yen)
Nine months ended December 31, 2019
Nine months ended December 31, 2020
Profit for the period.................................................. 36,380 33,014 Other comprehensive income
Components of other comprehensive income that will not be reclassified to profit or loss, net of tax: Net changes in revaluation of equity
instruments measured at fair value through other comprehensive income .......... 994 1,911
Remeasurement of defined benefit plans ........ (197 ) - Sub-total 797 1,911
Components of other comprehensive income that will be reclassified to profit or loss, net of tax: Foreign exchange differences on translation of foreign operations ..................................... (499 ) 3,926
Cash flow hedges ............................................ 16 1,530 Sub-total (483 ) 5,456
Other comprehensive income, net of tax ............ 314 7,367 Comprehensive income for the period ..................... 36,694 40,381
Comprehensive income attributable to: Owners of the parent ............................................ 36,126 40,312 Non-controlling interests ........................................... 568 69 Comprehensive income for the period .................... 36,694 40,381
Three months ended December 31 (Amount: millions of yen)
Three months ended December 31, 2019
Three months ended December 31, 2020
Profit for the period.................................................. 19,366 16,165 Other comprehensive income
Components of other comprehensive income that will not be reclassified to profit or loss, net of tax: Net changes in revaluation of equity
instruments measured at fair value through other comprehensive income .......... 1,542 961
Remeasurement of defined benefit plans ........ (197 ) - Sub-total 1,345 961
Components of other comprehensive income that will be reclassified to profit or loss, net of tax: Foreign exchange differences on translation of foreign operations ..................................... 10,468 4,059
Cash flow hedges ............................................ (3 ) 603 Sub-total 10,465 4,662
Other comprehensive income, net of tax ............ 11,810 5,623 Comprehensive income for the period ..................... 31,176 21,788
Comprehensive income attributable to: Owners of the parent ............................................ 30,860 21,793 Non-controlling interests ........................................... 316 (5 ) Comprehensive income for the period .................... 31,176 21,788
- 9 -
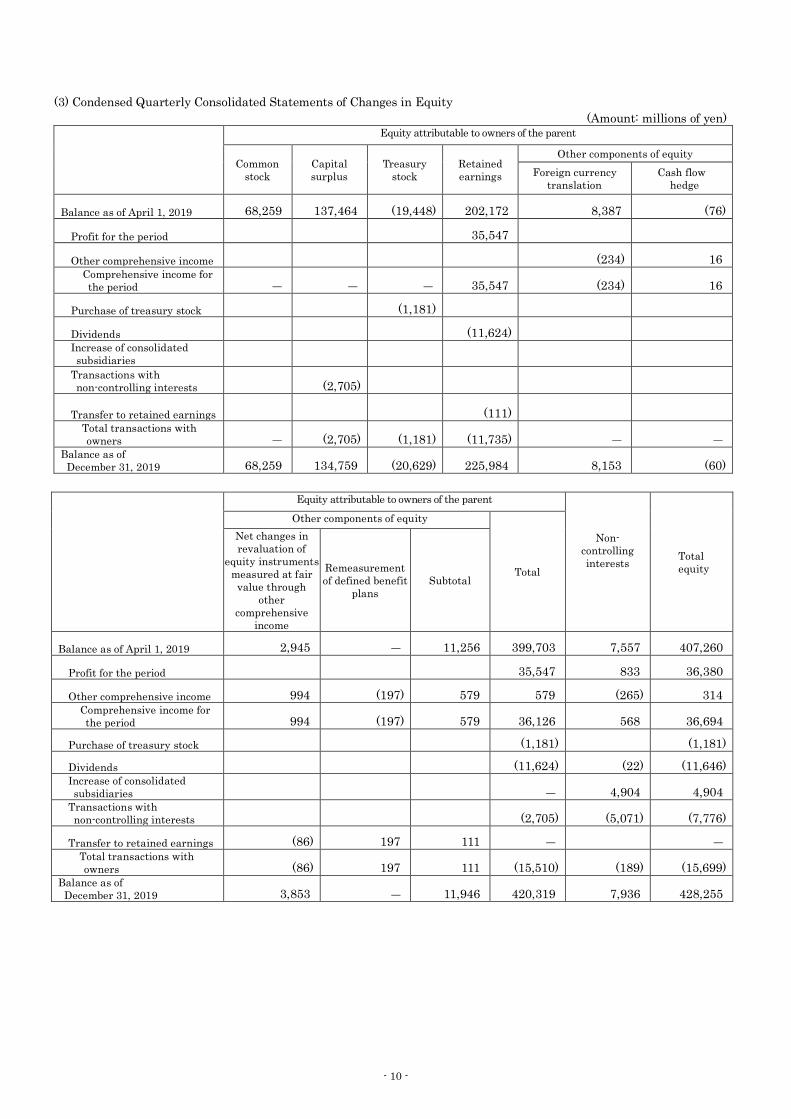
(3) Condensed Quarterly Consolidated Statements of Changes in Equity (Amount: millions of yen)
Equity attributable to owners of the parent
Common stock
Capital surplus
Treasury stock
Retained earnings
Other components of equity
Foreign currency
translation Cash flow
hedge
Balance as of April 1, 2019 68,259 137,464 (19,448) 202,172 8,387 (76)
Profit for the period 35,547
Other comprehensive income (234) 16
Comprehensive income for the period ― ― ― 35,547 (234) 16
Purchase of treasury stock (1,181)
Dividends (11,624)
Increase of consolidated subsidiaries
Transactions with non-controlling interests
(2,705)
Transfer to retained earnings
(111) Total transactions with
owners ― (2,705) (1,181) (11,735) ― ― Balance as of
December 31, 2019 68,259 134,759 (20,629) 225,984 8,153 (60) Equity attributable to owners of the parent
Non- controlling interests Total
equity
Other components of equity
Total
Net changes in revaluation of
equity instruments measured at fair
value through other
comprehensive income
Remeasurement of defined benefit
plans Subtotal
Balance as of April 1, 2019 2,945 ― 11,256 399,703 7,557 407,260
Profit for the period 35,547 833 36,380
Other comprehensive income 994 (197) 579 579 (265) 314 Comprehensive income for the period 994 (197) 579 36,126 568 36,694
Purchase of treasury stock (1,181) (1,181)
Dividends (11,624) (22) (11,646) Increase of consolidated subsidiaries
― 4,904 4,904
Transactions with non-controlling interests
(2,705) (5,071) (7,776)
Transfer to retained earnings (86) 197 111 ― ― Total transactions with
owners (86) 197 111 (15,510) (189) (15,699) Balance as of
December 31, 2019 3,853 ― 11,946 420,319 7,936 428,255
- 10 -

(Amount: millions of yen) Equity attributable to owners of the parent
Common stock
Capital surplus
Treasury stock
Retained earnings
Other components of equity
Foreign currency
translation Cash flow
hedge
Balance as of April 1, 2020 68,259 134,707 (34,455) 234,667 (8,807) (1,007)
Profit for the period 32,984
Other comprehensive income 3,887 1,530
Comprehensive income for the period ― ― ― 32,984 3,887 1,530
Purchase of treasury stock (244)
Disposal of treasury stock 11 229
Dividends (11,435)
Transactions with non-controlling interests
4,600
Total transactions with owners ― 4,611 (15) (11,435) ― ―
Balance as of December 31, 2020 68,259 139,318 (34,470) 256,216 (4,920) 523
Equity attributable to owners of the parent
Non- controlling interests
Total Equity
Other components of equity
Total
Net changes in revaluation of equity
instruments measured at fair value through other comprehensive
income
Subtotal
Balance as of April 1, 2020 1,008 (8,806) 394,372 7,904 402,276
Profit for the period 32,984 30 33,014
Other comprehensive income 1,911 7,328 7,328 39 7,367 Comprehensive income for the period 1,911 7,328 40,312 69 40,381
Purchase of treasury stock (244) (244)
Disposal of treasury stock 240 240
Dividends (11,435) (43) (11,478) Transactions with non-controlling interests 4,600 (5,357) (757) Total transactions with
owners ― ― (6,839) (5,400) (12,239) Balance as of
December 31, 2020 2,919 (1,478) 427,845 2,573 430,418
- 11 -

(4) Condensed Quarterly Consolidated Statements of Cash Flows (Amount: millions of yen)
Nine months ended December 31, 2019
Nine months ended December 31, 2020
Cash flows from operating activities: Profit before income taxes ........................................................ 46,219 41,641 Depreciation and amortization ................................................. 34,622 35,965 Interest income and dividends income ..................................... (1,314 ) (927 ) Interest expenses ..................................................................... 1,168 1,195 Loss (gain) on sale and disposal of property, plant and
equipment ................................................................................ (584 ) (238 ) Decrease (increase) in trade and other receivables................... (24,157 ) (27,469 ) Decrease (increase) in inventories ............................................ (16,823 ) 3,404 Increase (decrease) in trade and other payables....................... 22,031 (8,036 ) Other ........................................................................................ 1,502 4,760
Subtotal 62,664 50,295 Interest received....................................................................... 990 684 Dividends received ................................................................... 301 253 Interest paid ............................................................................. (902 ) (1,169 ) Income taxes paid..................................................................... (10,347 ) (6,319 )
Net cash flows provided by operating activities 52,706 43,744
Cash flows from investing activities: Decrease (increase) in time deposits......................................... (2,117 ) (608 ) Purchase of property, plant and equipment .................................. (36,999 ) (33,192 ) Proceeds from sales of property, plant and equipment ................... 5,038 1,204 Purchase of intangible assets ....................................................... (838 ) (1,005 ) Purchase of securities ................................................................. (1,655 ) (1,257 ) Proceeds from sale and redemption of securities......................... 1,548 1,219 Proceeds from purchase of investments in subsidiaries resulting in change in scope of consolidation.................................................. 47 -
Purchase of investments in subsidiaries resulting in change in scope of consolidation................................................................. (1,822 ) (24,160 )
Other ........................................................................................ 400 18 Net cash flows used in investing activities (36,398 ) (57,781 )
Cash flows from financing activities:
Increase (decrease) in short-term borrowings .......................... (8,025 ) 44,671 Proceeds from long-term borrowings ........................................ 50,220 - Repayments of long-term borrowings ....................................... (29,253 ) (4,416 ) Redemption of bonds ................................................................ (100 ) - Acquisition of non-controlling interests .................................... (7,693 ) (5,377 ) Proceeds from disposal of treasury stock .................................. - 240 Purchase of treasury stock.......................................................... (1,181 ) (244 ) Dividends paid ......................................................................... (11,624 ) (11,435 ) Dividends paid to non-controlling interests .............................. (22 ) (43 ) Repayments of lease liabilities ................................................. (2,152 ) (3,512 )
Net cash flows used in financing activities (9,830 ) 19,884
Effect of exchange rate changes on cash and cash equivalents (4,884 ) (2,096 ) Increase (decrease) in cash and cash equivalents 1,594 3,751 Cash and cash equivalents at beginning of period 122,432 130,746 Cash and cash equivalents at end of period 124,026 134,497
- 12 -
(5) Notes on Condensed Quarterly Consolidated Financial Statements (Notes on Going Concern Assumptions)
Not applicable.
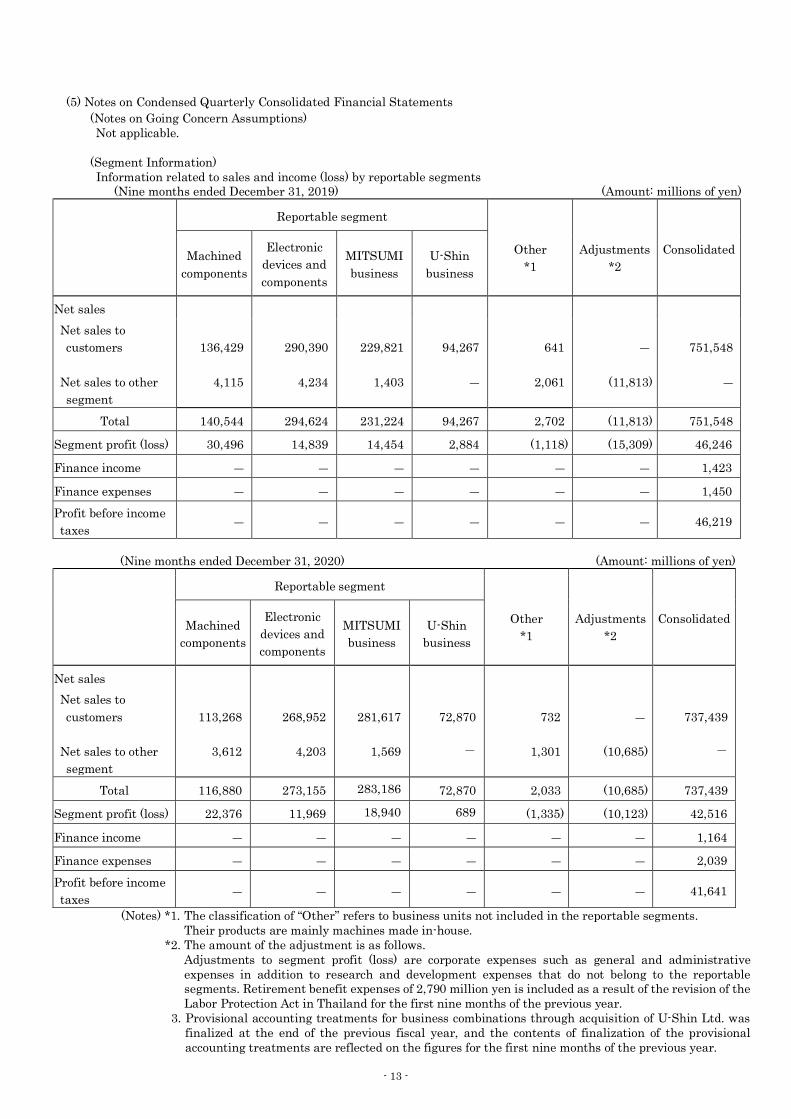
(Segment Information) Information related to sales and income (loss) by reportable segments
(Nine months ended December 31, 2019) (Amount: millions of yen)
Reportable segment
Other *1
Adjustments
*2 Consolidated Machined
components
Electronic devices and components
MITSUMI business
U-Shin business
Net sales
Net sales to customers Net sales to other segment
136,429
4,115
290,390
4,234
229,821
1,403
94,267
―
641
2,061
―
(11,813)
751,548
―
Total 140,544 294,624 231,224 94,267 2,702 (11,813) 751,548
Segment profit (loss) 30,496 14,839 14,454 2,884 (1,118) (15,309) 46,246
Finance income ― ― ― ― ― ― 1,423
Finance expenses ― ― ― ― ― ― 1,450 Profit before income taxes ― ― ― ― ― ― 46,219
(Nine months ended December 31, 2020) (Amount: millions of yen)
Reportable segment
Other *1
Adjustments
*2 Consolidated Machined
components
Electronic devices and components
MITSUMI business
U-Shin business
Net sales
Net sales to customers Net sales to other segment
113,268
3,612
268,952
4,203
281,617
1,569
72,870
-
732
1,301
―
(10,685)
737,439
-
Total 116,880 273,155 283,186 72,870 2,033 (10,685) 737,439
Segment profit (loss) 22,376 11,969 18,940 689 (1,335) (10,123) 42,516
Finance income ― ― ― ― ― ― 1,164
Finance expenses ― ― ― ― ― ― 2,039 Profit before income taxes ― ― ― ― ― ― 41,641
(Notes) *1. The classification of “Other” refers to business units not included in the reportable segments. Their products are mainly machines made in-house.
*2. The amount of the adjustment is as follows. Adjustments to segment profit (loss) are corporate expenses such as general and administrative expenses in addition to research and development expenses that do not belong to the reportable segments. Retirement benefit expenses of 2,790 million yen is included as a result of the revision of the Labor Protection Act in Thailand for the first nine months of the previous year.
3. Provisional accounting treatments for business combinations through acquisition of U-Shin Ltd. was finalized at the end of the previous fiscal year, and the contents of finalization of the provisional accounting treatments are reflected on the figures for the first nine months of the previous year.
- 13 -


![FY16 3rd Quarter Financial Results [IFRS] · FY16 3rd Quarter Financial Results [IFRS] Hitachi High-Technologies Corporation January 27, 2017 ... FY15/Q1 FY15/Q2 FY15/Q3 FY15/Q4 FY16/Q1](https://img.pdfslide.us/doc/110x75/5ec630f9034f80098f725dcb/fy16-3rd-quarter-financial-results-ifrs-fy16-3rd-quarter-financial-results-ifrs.jpg)


![2019 September October IFRS Brief · 2020. 12. 11. · ifrs brief ifrs 뉴스레터 2019년 9ㆍ10월호 최근 국제회계기준 정보 1 i. [공개초안] ias 12 ‘법인세’](https://img.pdfslide.us/doc/110x75/609f063d3d3c16764b4731ba/2019-september-october-ifrs-brief-2020-12-11-ifrs-brief-ifrs-ee-2019e.jpg)