Embed Size (px)
Citation preview
Media enquiries
Daniela Ritorto
+61 8 8116 5167 / +61 (0) 455 319 770
Third Quarter Activities Report For period ending 30 September 2019
ASX: STO | ADR: SSLZY
Investor enquiries
Andrew Nairn
+61 8 8116 5314 / +61 (0) 437 166 497
Santos Limited ABN 80 007 550 923
GPO Box 2455, Adelaide SA 5001
T +61 8 8116 5000 F +61 8 8116 5131
www.santos.com
17 October 2019
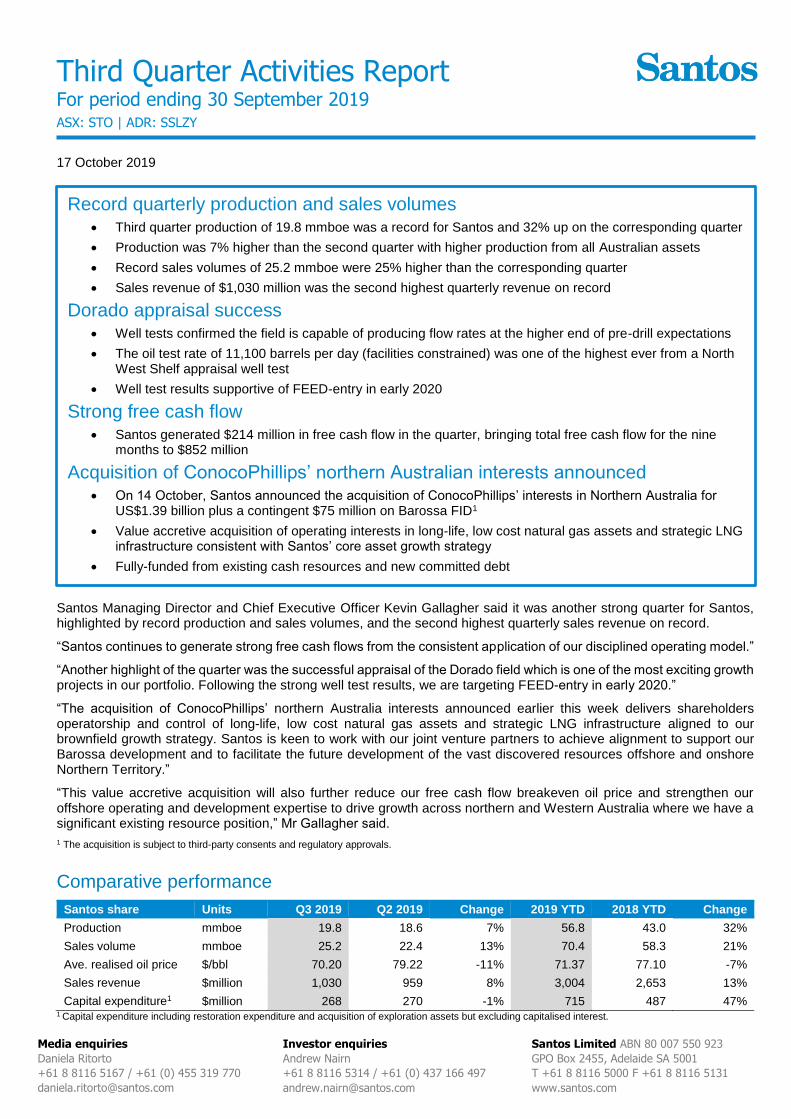
Santos Managing Director and Chief Executive Officer Kevin Gallagher said it was another strong quarter for Santos, highlighted by record production and sales volumes, and the second highest quarterly sales revenue on record.
“Santos continues to generate strong free cash flows from the consistent application of our disciplined operating model.”
“Another highlight of the quarter was the successful appraisal of the Dorado field which is one of the most exciting growth projects in our portfolio. Following the strong well test results, we are targeting FEED-entry in early 2020.”
“The acquisition of ConocoPhillips’ northern Australia interests announced earlier this week delivers shareholders operatorship and control of long-life, low cost natural gas assets and strategic LNG infrastructure aligned to our brownfield growth strategy. Santos is keen to work with our joint venture partners to achieve alignment to support our Barossa development and to facilitate the future development of the vast discovered resources offshore and onshore Northern Territory.”
“This value accretive acquisition will also further reduce our free cash flow breakeven oil price and strengthen our offshore operating and development expertise to drive growth across northern and Western Australia where we have a significant existing resource position,” Mr Gallagher said.
1 The acquisition is subject to third-party consents and regulatory approvals.
Comparative performance
Santos share Units Q3 2019 Q2 2019 Change 2019 YTD 2018 YTD Change
Production mmboe 19.8 18.6 7% 56.8 43.0 32%
Sales volume mmboe 25.2 22.4 13% 70.4 58.3 21%
Ave. realised oil price $/bbl 70.20 79.22 -11% 71.37 77.10 -7%
Sales revenue $million 1,030 959 8% 3,004 2,653 13%
Capital expenditure1 $million 268 270 -1% 715 487 47% 1 Capital expenditure including restoration expenditure and acquisition of exploration assets but excluding capitalised interest.
Record quarterly production and sales volumes Third quarter production of 19.8 mmboe was a record for Santos and 32% up on the corresponding quarter
Production was 7% higher than the second quarter with higher production from all Australian assets
Record sales volumes of 25.2 mmboe were 25% higher than the corresponding quarter
Sales revenue of $1,030 million was the second highest quarterly revenue on record
Dorado appraisal success Well tests confirmed the field is capable of producing flow rates at the higher end of pre-drill expectations
The oil test rate of 11,100 barrels per day (facilities constrained) was one of the highest ever from a North West Shelf appraisal well test
Well test results supportive of FEED-entry in early 2020
Strong free cash flow Santos generated $214 million in free cash flow in the quarter, bringing total free cash flow for the nine
months to $852 million
Acquisition of ConocoPhillips’ northern Australian interests announced On 14 October, Santos announced the acquisition of ConocoPhillips’ interests in Northern Australia for
US$1.39 billion plus a contingent $75 million on Barossa FID1
Value accretive acquisition of operating interests in long-life, low cost natural gas assets and strategic LNG infrastructure consistent with Santos’ core asset growth strategy
Fully-funded from existing cash resources and new committed debt

Page 2 of 14 Santos Ltd l Third Quarter Activities Report l 17 October 2019
Sales volumes (Santos share)
Product Unit Q3 2019 Q2 2019 Q3 2018 2019 YTD 2018 YTD
LNG 000 t 731.9 714.6 738.6 2,214.5 2,011.8
Domestic sales gas & ethane PJ 77.5 64.3 55.7 207.3 161.9
Crude oil 000 bbls 3,553.4 2,666.2 2,296.7 9,117.2 7,594.5
Condensate 000 bbls 1,127.2 1,261.7 1,063.3 3,687.6 2,952.9
LPG 000 t 37.8 77.5 41.3 132.6 106.6
Sales
Own product mmboe 19.8 17.9 15.0 55.1 42.4
Third-party mmboe 5.4 4.5 5.2 15.3 15.9
Total sales volume mmboe 25.2 22.4 20.2 70.4 58.3
Third quarter sales volumes were higher than the prior quarter primarily due to higher domestic gas volumes and the timing of LNG and liquids shipments. LPG sales volumes were lower due to the timing of liftings.
Sales revenues (Santos share)
Product Unit Q3 2019 Q2 2019 Q3 2018 2019 YTD 2018 YTD
LNG $m 387 341 405 1,163 1,004
Domestic sales gas & ethane $m 314 285 272 902 787
Crude oil $m 250 211 1872 651 587
Condensate $m 64 83 84 226 216
LPG $m 15 39 25 62 59
Sales
Own product $m 792 712 724 2,291 1,881
Third-party $m 238 247 249 713 772
Total sales revenue $m 1,030 959 973 3,004 2,653
Third-party purchase costs $m 218 196 197 621 605
Third quarter sales revenues were higher than the prior quarter primarily due to higher average oil-linked LNG prices, higher domestic gas sales, and the timing of LNG and liquids shipments.
Average realised prices
Product Unit Q3 2019 Q2 2019 Q3 2018 2019 YTD 2018 YTD
LNG price US$/mmBtu 10.04 9.09 10.43 10.00 9.50
Domestic gas price US$/GJ 4.07 4.44 4.89 4.35 4.86
Oil price US$/bbl 70.20 79.22 81.09 71.37 77.10
Condensate price US$/bbl 57.27 66.17 78.78 61.27 73.02
LPG price US$/t 386.92 505.92 616.89 467.06 561.57
The average realised LNG price was higher than the prior quarter reflecting the linkage of sales contracts to a lagged Japan Customs-cleared Crude (JCC) price. The average domestic gas price was lower than the prior quarter due the sales mix and FX movements on AUD-denominated domestic gas contracts.

Page 3 of 14 Santos Ltd l Third Quarter Activities Report l 17 October 2019
Production by asset (Santos share)
Asset Unit Q3 2019 Q2 2019 Q3 2018 2019 YTD 2018 YTD
Western Australia mmboe 8.6 7.7 2.5 23.5 8.1
Cooper Basin mmboe 4.0 3.9 4.0 11.7 11.5
Queensland & NSW mmboe 3.3 3.2 3.1 9.6 9.0
PNG mmboe 3.1 3.2 3.4 9.5 8.0
Northern Australia mmboe 0.8 0.6 1.0 2.4 2.7
Asia1 mmboe - - 1.0 - 3.7
Total production mmboe 19.8 18.6 15.0 56.8 43.0 1 Asian assets sold effective September 2018.
Production by product (Santos share)
Product Unit Q3 2019 Q2 2019 Q3 2018 2019 YTD 2018 YTD
Sales gas to LNG plant PJ 32.3 31.6 32.4 96.9 86.0
Domestic sales gas & ethane PJ 64.0 56.5 40.2 175.5 119.4
Crude oil 000 bbls 1,857.2 2,071.2 1,457.8 5,975.7 4,648.2
Condensate 000 bbls 1,069.1 1,088.6 865.9 3,202.2 2,279.1
LPG 000 t 39.0 36.6 34.5 110.9 106.8
Total production mmboe 19.8 18.6 15.0 56.8 43.0
Third quarter production was higher than the prior quarter primarily due to higher domestic gas production volumes in Western Australia and higher volumes across the onshore assets and Northern Australia.
2019 Guidance
All 2019 guidance is maintained as shown in the table below.
2019 guidance item Guidance
Sales volumes 90-97 mmboe
Production 73-77 mmboe
Upstream production costs1 $7.25-7.75/boe
Capital expenditure $950-1,050 million 1 Production cost guidance includes all planned shutdown activity and PNG LNG earthquake recovery costs.
Further detail of 2019 year-to-date capital expenditure, including exploration and evaluation expenditure, is reported in the table on page 10 of this report.

Page 4 of 14 Santos Ltd l Third Quarter Activities Report l 17 October 2019
Oil price hedging
2.7 million barrels of oil hedging expired in the third quarter.
The following oil price portfolio hedging positions were in place as at 30 September 2019.
Open oil price positions 2019 2020
Swaps (barrels) 225,000
Brent fixed swap price ($/bbl) US$63.23
Re-participating swaps (barrels)1 120,000
Brent fixed swap price ($/bbl) US$67.39
Brent long call price ($/bbl) US$76.00
Zero-cost collars (barrels)2 2,366,000
Ceiling ($/bbl) US$79.83
Floor ($/bbl) US$51.35
Re-participating 3-Ways (barrels)3 4,180,000
Brent long call price ($/bbl) US$77.64
Brent short call price ($/bbl) US$70.00
Brent long put price ($/bbl) US$55.00
1 When Brent price is below the weighted average long call price, Santos realises fixed swap price. When Brent price is above the call strike price, Santos realises Brent price less the difference between the long call price and the fixed swap price.
2 When Brent price is above the weighted average ceiling price, Santos realises ceiling price. When Brent price is between the floor and ceiling price, Santos realises Brent price. When Brent price is below the floor price, Santos realises floor price.
3 When Brent price is above the weighted average long call price, Santos realises Brent price less the difference between the long call price and the short call price. When Brent price is between the short call price and long call price, Santos realises short call price. When Brent price is below the long put price, Santos realises long put price.

Page 5 of 14 Santos Ltd l Third Quarter Activities Report l 17 October 2019
Western Australia
Santos share Units Q3 2019 Q2 2019 Q3 2018 2019 YTD 2018 YTD
Sales volume
Sales gas PJ 40.3 34.4 13.5 107.3 42.3
Condensate 000 bbls 333.6 290.9 193.8 799.9 517.6
Crude oil 000 bbls 1,564.8 897.2 110.0 3,417.5 549.8
Total sales volume mmboe 9.1 7.1 2.6 22.9 8.3
Total sales revenue $million 262 219 82 679 250
Production
Sales gas PJ 41.3 35.5 12.9 110.1 40.9
Condensate 000 bbls 399.9 421.2 165.8 1,173.0 473.4
Crude oil 000 bbls 1,073.7 1,208.9 118.3 3,469.6 594.0
Total production mmboe 8.6 7.7 2.5 23.5 8.1
Capital expenditure $million 84 79 11 206 29
Third quarter sales gas production rose to a record 41.3 PJ, up 16% driven by new sales to domestic customers. Condensate sales volumes were higher than the prior quarter due to higher volumes lifted from the liquids-rich Varanus Island gas fields. Crude sales volumes were higher than the prior quarter due primarily to the timing of liftings. Production was lower due to natural field decline. The successful Dorado-3 appraisal campaign concluded in early October with flow tests from the Caley and Baxter reservoirs indicating potential for field production flow rates to be at the higher end of expectations and strongly supportive of progress towards FEED-entry in early 2020. The test of the Caley oil reservoir was conducted over a 12-hour period and achieved a maximum measured rate of approximately 11,100 barrels of oil per day and 21 million standard cubic feet of associated gas through a 68/64” choke. Production was limited by surface equipment restraints indicating the reservoir has the capacity to flow at significantly higher rates. The oil rate was one of the highest ever from a North West Shelf appraisal well test. The results are very encouraging for development of the shallow-water Dorado field, with the test indicating very high potential flow rates of around 30,000 barrels per day from each single production well in the Caley reservoir. For further information, refer to Santos’ ASX release of 8 October 2019. The test conducted over the Baxter gas and condensate reservoir confirmed excellent productivity and fluid quality. A maximum rate of approximately 48 million standard cubic feet per day of gas and 4,500 barrels per day of associated condensate was achieved through a 60/64” choke, which surpassed initial expectations. As with the Caley test, production was limited by surface equipment restraints indicating the reservoir has the capacity to flow at significantly higher rates. For further information, refer to Santos’ ASX release of 23 September 2019. During the quarter, Santos (50% and operator, BP 50%) was awarded gazettal licence W18-4 (designated WA-541-P) located directly to the west of its existing acreage position in the Bedout Basin.

Page 6 of 14 Santos Ltd l Third Quarter Activities Report l 17 October 2019
Cooper Basin
Santos share Units Q3 2019 Q2 2019 Q3 2018 2019 YTD 2018 YTD
Sales volume
Sales gas and ethane
Own product PJ 17.4 15.0 18.0 48.2 47.7
Third-party PJ 1.3 1.0 1.0 3.1 2.5
Total PJ 18.7 16.0 19.1 51.3 50.2
Condensate
Own product 000 bbls 352.0 549.0 429.3 1,391.5 1,184.8
Third-party 000 bbls 36.6 33.0 58.0 153.8 209.9
Total 000 bbls 388.6 582.0 487.3 1,545.3 1,394.7
LPG
Own product 000 t 27.3 69.5 33.8 103.8 81.7
Third-party 000 t 7.3 1.6 4.2 11.8 13.1
Total 000 t 34.6 71.1 38.0 115.6 94.8
Crude oil
Own product 000 bbls 853.7 972.5 558.2 2,377.2 1,634.9
Third-party 000 bbls 1,131.8 792.9 1,205.2 3,312.5 3,750.7
Total 000 bbls 1,985.5 1,765.4 1,763.4 5,689.7 5,385.6
Total sales volume mmboe 5.8 5.7 5.8 16.9 16.1
Total sales revenue $million 251 289 306 785 808
Production
Sales gas and ethane PJ 15.7 15.0 15.3 45.3 45.0
Condensate 000 bbls 236.7 244.9 253.1 704.0 701.8
LPG 000 t 33.0 30.3 30.2 92.0 93.1
Crude oil 000 bbls 791.2 859.1 901.9 2,497.2 2,329.8
Total production mmboe 4.0 3.9 4.0 11.7 11.5
Capital expenditure $million 78 71 57 208 165
Third quarter gas production in the Cooper Basin was 5% higher than the prior quarter due to a strong operating performance and new gas wells being brought online.
Crude oil production in the third quarter was lower than the prior quarter due to the expected decline from the Watkins field development and fewer oil wells being brought online as a result of planned program phasing.
Thirty-two wells were spudded during the quarter: 16 gas development wells and 16 appraisal wells (12 gas, three oil and one water injector). Of the appraisal wells, eight gas wells and two oil wells were cased and suspended as future producers.
A total of 78 wells were drilled to the end of the third quarter and the Cooper Basin remains on track to drill ~105 wells in 2019.
Studies on horizontal well opportunities were held during the quarter and are ongoing. Execution-ready projects have already been identified, adding to the well inventory list for execution in 2020.
The Moomba South project Phase 1 was successfully completed and is expected to provide a reserve booking at the end of 2019. The final investment decision for Phase 2 is on track, with plans to commence an eight-well development program by year-end.

Page 7 of 14 Santos Ltd l Third Quarter Activities Report l 17 October 2019
Queensland & NSW
Santos share Units Q3 2019 Q2 2019 Q3 2018 2019 YTD 2018 YTD
Sales volume
GLNG Joint Venture
LNG 000 t 380.1 377.5 343.5 1,168.5 1,074.1
Domestic contracts PJ 7.5 4.7 7.0 16.8 20.0
Eastern Qld (non-GLNG)1 PJ 5.2 4.6 6.1 14.7 17.6
Total sales volume2 mmboe 5.8 5.1 5.5 16.4 16.5
Total sales revenue2 $million 267 227 259 783 722
Production
GLNG Joint Venture
Sales gas to LNG PJ 12.1 12.5 9.6 35.6 30.7
Domestic contracts PJ 0.9 0.4 2.6 2.7 4.5
Eastern Qld (non-GLNG)1 PJ 5.8 5.4 5.8 16.7 16.9
NSW PJ 0.3 0.2 0.2 0.7 0.6
Total production2 mmboe 3.3 3.2 3.1 9.6 9.1
Capital expenditure $million 64 76 64 197 174 1 Combabula, Scotia (Santos legacy domestic volumes), Spring Gully and Denison. 2 Total sales volume, sales revenue and production include sales gas from NSW assets.
GLNG operational data (gross)
Units Q3 2019 Q2 2019 Q3 2018 2019 YTD 2018 YTD
Sales gas to domestic market PJ 30 22 29 70 77
LNG produced1 000 t 1,196 1,270 1,171 3,772 3,627
Sales gas to LNG plant
GLNG equity gas PJ 40.5 40.5 37.0 118.5 107.2
Santos portfolio gas PJ 15.0 14.4 15.4 43.5 44.9
Third-party PJ 19.1 22.3 18.4 69.1 67.7
Total sales gas to LNG plant PJ 74.6 77.2 70.8 231.0 219.9
LNG cargoes shipped 21 21 20 65 60 1 Includes LNG produced from GLNG equity gas, Santos portfolio gas and third-party quantities.
LNG production was slightly lower than the prior quarter primarily due to the planned one-month statutory shutdown of LNG train 1 conducted during the third quarter. Gross GLNG-operated upstream sales gas production increased to 616 TJ/d at the end of the quarter and daily LNG-equivalent run-rates of 6 mtpa continued to be achieved. GLNG remains on track to meet ~6 mtpa annualised sales run-rate including volumes redirected to the domestic market by the end of 2019. Gross daily production from Fairview was stable at 410 TJ/day at the end of the quarter. Production continues to be supported by a focussed program of development and well optimisation projects. Continued steady production growth from Roma resulted in gross daily production increasing to 122 TJ/day at the end of the quarter. Production continues to build, supported by growth in both legacy and new development areas of the field. Drilling continues in the Roma East project with 274 wells drilled and 223 wells online. Gross daily production from the Scotia field was 74 TJ/d at the end of the quarter. Production from the field is projected to remain stable. Production from the Arcadia field grew to 10 TJ/d by the end of the quarter. First gas from the new Arcadia compression facility commenced during the quarter, with completion of the facility ahead of schedule. Production is now building, with

Page 8 of 14 Santos Ltd l Third Quarter Activities Report l 17 October 2019
growing contribution from the new Arcadia Valley wells. Drilling continues in the Arcadia Valley project with 104 wells drilled and 58 wells online to date. Santos’ share of production from the non-operated Combabula and Spring Gully fields was 44 TJ/day. Ninety-seven wells were drilled across the GLNG acreage in the third quarter. A total of 286 wells have been drilled to the end of Q3 and the drilling pace remains on track to deliver 350-400 wells by year end. Fifty-one development wells were drilled across Santos’ non-operated Eastern Queensland acreage in the quarter. In Eastern Queensland, two exploration coreholes in ATP 685 (Yoorooga East 1 and Tardrum 5) were cased and suspended for further evaluation. Two further appraisal wells, Wodonga 1 in ATP 868 and Warrinilla 9 in PL 451 were cased and suspended for further testing.
PNG
Santos share Units Q3 2019 Q2 2019 Q3 2018 2019 YTD 2018 YTD
Sales volume
PNG LNG
LNG1 000 t 287.6 284.0 303.5 837.4 687.8
Condensate 000 bbls 325.3 297.2 327.3 1,011.9 829.4
Crude oil 000 bbls 3.0 3.6 2.7 9.9 8.0
Total sales volume mmboe 3.0 3.0 3.2 8.9 7.3
Total sales revenue $million 159 150 191 484 406
Production
PNG LNG
Sales gas to LNG1 PJ 16.5 16.5 17.8 50.0 41.5
Condensate 000 bbls 327.3 330.1 378.9 999.9 887.0
Crude oil 000 bbls 2.6 3.1 3.7 9.0 8.7
Total production mmboe 3.1 3.2 3.4 9.5 8.0
Capital expenditure $million 8 13 16 28 31 1 Includes SE Gobe
PNG LNG operational data (gross)
Units Q3 2019 Q2 2019 Q3 2018 2019 YTD 2018 YTD
Production
LNG mt 2.1 2.1 2.2 6.3 5.2
Sales gas to LNG plant PJ 123 124 133 375 310
Condensate1 000 bbls 2,429 2,428 2,819 7,396 6,579
Sales gas (SE Gobe)2 PJ 1 2 2 6 5
LNG cargoes shipped 27 27 30 83 68 1 Measured at the Kutubu entry point. 2 Purchased by PNG LNG.
Third quarter production was lower than the corresponding period primarily due to damage of the loading buoy at the Kumul Marine Terminal in late August. As a result, PNG LNG production was managed at reduced rates to prevent a potential shut-down should liquids storage capacity be reached. A return to near full production rates was achieved in mid-September due to modified liquid lifting procedures and repairs to the loading buoy were completed mid-October.
Notwithstanding the reduced production rates, the PNG LNG plant still operated at an annualised rate of 8.3 mtpa during the third quarter.
Long term pressure build-up monitoring continues at the Muruk-2 appraisal well. As previously reported, results from the drill stem test confirmed the presence of gas in the Toro A reservoir with pressure data and gas composition informing volumetric estimates and establishing a likely connection to the Muruk-1 discovery.

Page 9 of 14 Santos Ltd l Third Quarter Activities Report l 17 October 2019
Northern Australia
Santos share Units Q3 2019 Q2 2019 Q3 2018 2019 YTD 2018 YTD
Sales volume
Darwin LNG
LNG 000 t 64.2 53.1 91.6 208.6 249.9
Bayu Undan
Condensate 000 bbls 95.8 77.1 54.3 333.1 207.1
LPG 000 t 3.4 6.6 3.6 17.4 12.0
Total sales volume mmboe 0.7 0.6 1.0 2.4 2.7
Total sales revenue $million 42 33 51 127 126
Production
Darwin LNG
Sales gas to LNG PJ 3.5 2.7 5.1 11.3 13.8
Bayu Undan
Condensate 000 bbls 105.2 92.5 66.3 325.3 210.0
LPG 000 t 6.0 6.3 4.4 18.9 13.7
Total production mmboe 0.8 0.6 1.0 2.4 2.7
Capital expenditure $million 11 12 24 29 53
Darwin LNG / Bayu-Undan operational data (gross)
Units Q3 2019 Q2 2019 Q3 2018 2019 YTD 2018 YTD
Production
LNG 000 t 727 620 934 2,287 2,422
Sales gas to LNG plant PJ 44 38 57 138 148
Condensate 000 bbls 1,492 1,652 808 4,673 2,347
LPG 000 t 76 81 52 235 147
LNG cargoes shipped 12 9 14 35 38
Sales and production volumes were higher than the prior quarter due to timing of the LNG shipping schedule and the completion of planned maintenance activities at Darwin LNG in the second quarter.
On 14 October, Santos announced the acquisition of ConocoPhillips’ interests in Northern Australia for US$1.39 billion plus a contingent $75 million on Barossa FID. This is a value accretive acquisition of operating interests in long-life, low cost natural gas assets and strategic LNG infrastructure consistent with Santos’ core asset growth strategy. The acquisition is fully-funded from existing cash resources and new committed debt. Completion is subject to third-party consents and regulatory approvals. For more information on the acquisition, refer to Santos’ ASX release of 14 October 2019.
The Barossa project continues to make excellent progress towards a final investment decision in early 2020. On 26 September, Santos announced the award of the Barossa gas export pipeline contract to Allseas Group. This follows the award of the Subsea Production System (SPS) contract earlier in the year to Technip Oceania Pty Ltd. Evaluation of tenders for the FPSO, SURF (subsea umbilical riser and flowline package) and drilling rig are progressing well.
In the onshore Amadeus Basin in the Northern Territory, the Dukas-1ST1 wildcat was plugged and suspended in August. The well was targeting a conventional sub-salt play and was suspended at a depth of 3,704 metres after encountering higher than expected pressures.
Approvals from Northern Territory regulatory authorities for the planned McArthur Basin 2020 drilling campaign are progressing. The 2019 program is likely to comprise the hydraulic fracture stimulation and testing of the Tanumbirini 1 well, which was cased and suspended in 2014. Subject to regulatory approvals, this activity is scheduled for the fourth quarter.

Page 10 of 14 Santos Ltd l Third Quarter Activities Report l 17 October 2019
Corporate, exploration and eliminations
Santos share Units Q3 2019 Q2 2019 Q3 2018 2019 YTD 2018 YTD
Total sales volume mmboe 1.0 0.9 1.2 3.1 3.7
Total sales revenue $million 49 42 37 146 160
Capital expenditure $million 24 19 6 47 29
Sales volumes and revenues in the corporate segment primarily represent gas trading activities.
Capital expenditure was higher than the prior quarter primarily due to the drilling of the Dukas-1 exploration well in the Amadeus Basin, onshore Northern Territory and progressing approvals for the planned McArthur Basin drilling campaign.
Capital expenditure
Total exploration, evaluation and development expenditure is summarised in the table below.
$million Q3 2019 Q2 2019 Q3 2018 2019 YTD 2018 YTD
Capital expenditure
Exploration1 59 13 14 90 52
Evaluation 46 86 34 147 57
Development and other capex (inc restoration) 163 172 132 478 378
Capital expenditure excl capitalised interest 267 271 180 715 487
Capitalised interest 1 3 1 6 3
Total capital expenditure1 268 274 180 721 490
Exploration and evaluation expensed
Exploration 54 17 13 78 49
Evaluation 3 0 4 6 13
Total current year expenditure 57 17 17 84 62
Write-off of amounts capitalised in prior years - - - - -
Total expensed 57 17 17 84 62 1 Includes acquisition of exploration assets
Seismic activity
The table below details seismic activity during the quarter and status.
Permit Basin/area Survey Type km/km2 Status
WA437P, WA438P Bedout, WA Keraudren 3D 2,140 km2 100% complete
ATP2017 Bowen, Qld Tinowon 2D 30 km 100% complete
EP161 McArthur, NT McArthur 2D 10 km 100% complete

Page 11 of 14 Santos Ltd l Third Quarter Activities Report l 17 October 2019
Drilling summary
Exploration activity
Eastern Queensland gas
Well name Basin/area Santos Well status
Yoorooga East 1
Scotia 100% C&S, successful
Northern Australia gas
Well name Basin/area Santos Well status
Dukus 1ST1* Amadeus 40% P&S
Near-field exploration (NFE) / Appraisal wells
Cooper Basin oil
Well name Basin/area Santos Well status
Tennaperra 7 QLD 70% C&S, successful
Tennaperra 8 QLD 70% C&S, water injector
Tennaperra 9 QLD 70% C&S, successful
Tennaperra 10 QLD 70% P&A
Cooper Basin gas
Well name Basin/area Santos Well status
Coolah 5 QLD 60.06% C&S, successful
Coolah 6 QLD 60.06% C&S, successful
Coolah 7 QLD 60.06% C&S, successful
Coolah 12 QLD 60.06% Drilling
Roti North 1 QLD 60.06% C&S, successful
Roti North 2 QLD 60.06% C&S, successful
Wackett East 1 QLD 60.06% Drilling
Wackett South 1 QLD 60.06% C&S, successful
Cascade 1 SA 66.6% Drilling
Napowie 4 SA 66.6% C&S, successful
Napowie 5 SA 66.6% P&A
Napowie 6 SA 66.6% C&S, successful
Eastern Queensland gas
Well name Basin/area Santos Well status
Brumby Plains 1 Arcadia 22.85% C&S, successful
Tardrum 5 Scotia 100% C&S, successful
Warrinilla 9 Denison 50% C&S, successful
Wodonga 1 Scotia 30% C&S, successful
Western Australia gas
Well name Basin/area Santos Well status
Dorado 3 Bedout 80% Drilling/Testing
Roc South 1* Bedout 80% P&A
* Spud in Q2, completed in Q3.
Development wells
Cooper Basin gas
Well name Basin/
area Santos Well status
Barrolka North East 3
QLD 60.06% C&S, successful
Coolah 8 QLD 60.06% C&S, successful
Juno 7 QLD 60.06% C&S, successful
Juno 8 QLD 60.06% C&S, successful
Vega 6 QLD 60.06% Drilling
Vega North 2ST1 QLD 60.06% C&S, successful
Gooranie 12 SA 66.6% C&S, successful
Gooranie 13 SA 66.6% Drilling
Marana 2 SA 66.6% C&S, successful
Mudera 23 SA 66.6% C&S, successful
Mudera 24 SA 66.6% C&C, successful
Mudera 25 SA 66.6% C&C, successful
Mudera 26 SA 66.6% C&C, successful
Mudera 27 SA 66.6% C&C, successful
Napowie 7 SA 66.6% C&S, successful
Napowie 8 SA 66.6% C&S, successful
Queensland - GLNG gas
Well name Basin/
area Santos Well status
Castle Hill 7 Arcadia 30% C&S, successful
Castle Hill 8 Arcadia 30% C&S, successful
Castle Hill 12 Arcadia 30% C&S, successful
Castle Hill 13 Arcadia 30% C&S, successful
Castle Hill 14 Arcadia 30% C&S, successful
Castle Hill 18 Arcadia 30% C&S, successful
Castle Hill 19 Arcadia 30% C&S, successful
Castle Hill 22 Arcadia 30% C&S, successful
Castle Hill 23 Arcadia 30% C&S, successful
FV07-06-4 Fairview 23.85% C&S successful

Page 12 of 14 Santos Ltd l Third Quarter Activities Report l 17 October 2019
FV07-33-1 Fairview 23.85% C&S, successful
FV07-34-1 Fairview 23.85% C&S, successful
FV12-73-1 Fairview 23.85% C&S, successful
FV12-75-1 Fairview 23.85% C&S, successful
FV12-88-1 Fairview 23.85% C&S, successful
FV17-07-4 Fairview 23.85% C&S, successful
FV17-43-1 Fairview 23.85% C&S, successful
FV17-44-1 Fairview 23.85% C&S, successful
FV17-47-1 Fairview 23.85% C&S, successful
FV17-49-1 Fairview 23.85% C&S, successful
FV17-51-1 Fairview 23.85% C&S, successful
FV17-52-1 Fairview 23.85% C&S, successful
FV17-53-1 Fairview 23.85% C&S, successful
RM02-62-1 Roma 30% C&S, successful
RM02-63-1 Roma 30% C&C, successful
RM02-64-1 Roma 30% C&C, successful
RM07-96-1 Roma 30% C&C, successful
RM07-104-1 Roma 30% C&C, successful
RM07-105-1 Roma 30% C&C, successful
RM07-106-1 Roma 30% C&S, successful
RM08-83-1 Roma 30% C&S, successful
RM08-87-1 Roma 30% C&S, successful
RM08-97-1 Roma 30% C&S, successful
RM08-100-1 Roma 30% C&S, successful
RM08-101-1 Roma 30% C&S, successful
RM09-05-5 Roma 30% C&S, successful
RM09-10-5 Roma 30% C&S, successful
RM09-12-2 Roma 30% C&C, successful
RM49-78-1 Roma 30% C&C, successful
RM49-79-1 Roma 30% C&C, successful
RM49-90-1 Roma 30% C&C, successful
RM49-97-1 Roma 30% C&S, successful
RM49-100-1 Roma 30% C&C, successful
RM49-101-1 Roma 30% C&C, successful
RM49-109-1 Roma 30% C&S, successful
RM49-112-1 Roma 30% C&S successful
RM49-121-1 Roma 30% C&S, successful
RM49-123-1 Roma 30% C&S, successful
RM49-124-1 Roma 30% C&S, successful
RM49-133-1 Roma 30% C&S, successful
RM49-134-1 Roma 30% C&S, successful
RM49-135-1 Roma 30% C&S, successful
RM50-63-1 Roma 30% C&C, successful
RM50-73-1 Roma 30% C&C, successful
RM50-74-1 Roma 30% C&C, successful
RM50-83-1 Roma 30% C&C, successful
RM50-84-1 Roma 30% C&C, successful
RM50-92-1 Roma 30% C&S, successful
RM50-93-1 Roma 30% C&C, successful
RM50-94-1 Roma 30% C&C, successful
RM50-103-1 Roma 30% C&S, successful
RM50-104-1 Roma 30% C&S, successful
RM50-106-1 Roma 30% C&C, successful
RM50-107-1 Roma 30% C&C, successful
RM50-113-1 Roma 30% C&S, successful
RM50-114-1 Roma 30% C&S, successful
RM50-116-1 Roma 30% C&S, successful
RM50-117-1 Roma 30% C&S, successful
RM50-118-1 Roma 30% C&C, successful
RM68-09-1 Roma 30% C&C, successful
RM68-09-2 Roma 30% C&S, successful
RM68-10-1 Roma 30% C&C, successful
RM68-11-1 Roma 30% C&C, successful
RM68-12-1 Roma 30% C&C, successful
RM68-12-2 Roma 30% C&S, successful
RM68-15-1 Roma 30% C&C, successful
RM68-16-1 Roma 30% C&S, successful
RM68-17-1 Roma 30% C&S, successful
RM68-20-1 Roma 30% C&S, successful
RM68-21-1 Roma 30% C&C, successful
RM68-22-1 Roma 30% C&C, successful
RM68-27-1 Roma 30% C&C, successful
RM68-28-1 Roma 30% C&C, successful
RM68-31-1 Roma 30% C&C, successful
RM68-32-1 Roma 30% C&C, successful
RM68-42-1 Roma 30% C&C, successful
RM68-43-1 Roma 30% C&C, successful
RM68-152-1 Roma 30% C&S, successful
RM68-152-2 Roma 30% C&S, successful
RM90-110-1 Roma 30% C&S, successful
Page 13 of 14 Santos Ltd l Third Quarter Activities Report l 17 October 2019
RM90-113-1 Roma 30% C&S, successful
RM90-114-1 Roma 30% Drilling
RM90-115-1 Roma 30% C&S, successful
Queensland - Eastern Queensland gas (EQ)
Well name Basin/area Santos Well status
Combabula 434# Combabula 7.28% C&S, successful
Lucky Gully 14# Combabula 7.28% C&S, successful
Lucky Gully 15# Combabula 7.28% C&S, successful
Lucky Gully 29# Combabula 7.28% Drilling
Lucky Gully 30# Combabula 7.28% C&S, successful
Reedy Creek 78# Combabula 7.28% C&S, successful
Reedy Creek 79# Combabula 7.28% C&S, successful
Reedy Creek 80# Combabula 7.28% C&S, successful
Reedy Creek 81# Combabula 7.28% C&S, successful
Reedy Creek 82# Combabula 7.28% C&S, successful
Reedy Creek 83# Combabula 7.28% C&S, successful
Reedy Creek 84# Combabula 7.28% C&S, successful
Reedy Creek 85# Combabula 7.28% C&S, successful
Reedy Creek 109# Combabula 7.28% C&S, successful
Reedy Creek 110# Combabula 7.28% C&S, successful
Reedy Creek 112# Combabula 7.28% C&S, successful
Reedy Creek 113# Combabula 7.28% C&S, successful
Reedy Creek 114# Combabula 7.28% C&S, successful
Reedy Creek 144# Combabula 7.28% C&S, successful
Reedy Creek 168#* Combabula 7.28% C&S, successful
Reedy Creek 170# Combabula 7.28% C&S, successful
Reedy Creek 171# Combabula 7.28% C&S, successful
Reedy Creek 172# Combabula 7.28% C&S, successful
Reedy Creek 173# Combabula 7.28% C&S, successful
Reedy Creek 195# Combabula 7.28% C&S, successful
Reedy Creek 198# Combabula 7.28% C&S, successful
Reedy Creek 199# Combabula 7.28% C&S, successful
Reedy Creek 200# Combabula 7.28% C&S, successful
Reedy Creek 202# Combabula 7.28% C&S, successful
Reedy Creek 203# Combabula 7.28% C&S, successful
Reedy Creek 225# Combabula 7.28% C&S, successful
Reedy Creek 228# Combabula 7.28% C&S, successful
Reedy Creek 230# Combabula 7.28% Drilling
Reedy Creek 233# Combabula 7.28% C&S, successful
Reedy Creek 234# Combabula 7.28% C&S, successful
Reedy Creek 235# Combabula 7.28% C&S, successful
Reedy Creek 236# Combabula 7.28% C&S, successful
Reedy Creek 255# Combabula 7.28% C&S, successful
Reedy Creek 257# Combabula 7.28% C&S, successful
Reedy Creek 259# Combabula 7.28% C&S, successful
Reedy Creek 260# Combabula 7.28% C&S, successful
Reedy Creek 265# Combabula 7.28% C&S, successful
Reedy Creek 290# Combabula 7.28% C&S, successful
Reedy Creek 291# Combabula 7.28% C&S, successful
Reedy Creek 292# Combabula 7.28% C&S, successful
Durham Ranch 769#
Spring Gully 4% C&S, successful
Durham Ranch 773#
Spring Gully 4% C&S, successful
Durham Ranch 776#
Spring Gully 4% Drilling
Durham Ranch 869#
Spring Gully 4% Drilling
Durham Ranch 901#*
Spring Gully 4% C&S, successful
Durham Ranch 903#
Spring Gully 4% C&S, successful
Durham Ranch 909#
Spring Gully 4% C&S, successful
Durham Ranch 940#
Spring Gully 4% C&S, successful
# Not operated by Santos * Spud in Q2, completed in Q3

Page 14 of 14 Santos Ltd l Third Quarter Activities Report l 17 October 2019
Abbreviations and conversion factors
Abbreviations Conversion factors
C&C cased and completed Sales gas and ethane, 1 PJ 171.937 boe x 10³
C&S cased and suspended Crude oil, 1 barrel 1 boe
gas coal seam gas Condensate, 1 barrel 0.935 boe
DES delivered ex ship LPG, 1 tonne 8.458 boe
FPSO floating production, storage and offloading LNG, 1 PJ 18,040 tonnes
GJ Gigajoules LNG, 1 tonne 52.54 mmBtu
kbbls thousand barrels
kt thousand tonnes
LNG liquefied natural gas
LPG liquefied petroleum gas
m Million
mmbbl million barrels
mmboe million barrels of oil equivalent
mmBtu million British thermal units
mmscf million standard cubic feet
mt million tonnes
mtpa million tonnes per annum
NFE near-field exploration
P&A plugged and abandoned
pa per annum
PJ petajoules
PSC production sharing contract
t tonnes
TJ terajoules
Disclaimer This report contains forward looking statements that are subject to risk factors associated with the oil and gas industry. It is believed that the expectations reflected in these statements are reasonable, but they may be affected by a range of variables which could cause actual results or trends to differ materially, including but not limited to: price fluctuations, actual demand, currency fluctuations, geotechnical factors, drilling and production results, gas commercialisation, development progress, operating results, engineering estimates, reserve estimates, loss of market, industry competition, environmental risks, physical risks, legislative, fiscal and regulatory developments, economic and financial markets conditions in various countries, approvals and cost estimates. All references to dollars, cents or $ in this document are to United States currency, unless otherwise stated.