Embed Size (px)
Citation preview
Q3 2020 Financial Results // 1
EXHIBIT 99.2
Third Quarter 2020 Earnings
Prepared Remarks
We are providing a copy of our prepared remarks in connection with our earnings announcement. These remarks are offered to provide additional detail for analyzing our Q3 2020 results in advance of our quarterly conference
call. These prepared remarks will not be read on the call.
Conference call details:
November 5, 2020
8:30 a.m. Eastern Time
• To access the live broadcast, please visit the Investor Relations section of our website at https://investors.ansys.com and
click on Events & Presentations, then Events Calendar.
• The call can also be heard by dialing (855) 239-2942 (US) or (412) 542-4124 (CAN & INT’L) at least five minutes prior to
the call and asking the operator to connect you to our conference call.
• A replay will be available within two hours of the call's completion at https://investors.ansys.com/events-and-
presentations/events-calendar or by dialing (877) 344-7529 (US), (855) 669-9658 (CAN) or (412) 317-0088 (INT’L) and
referencing the access code 10149085.
/ Supplemental Information
In addition to our GAAP information, we have historically provided non-GAAP supplemental information. Our reasons for providing this information are described later in this document, as well as in our Q3 2020 earnings press release, which can be found on our website in the "About Ansys - News Center" section. Reconciliations of GAAP to non-GAAP information are also provided.
Constant currency amounts exclude the effects of foreign currency fluctuations on the reported results. To present this information, the 2020 results for entities whose functional currency is a currency other than the U.S. Dollar were converted to U.S. Dollars at rates that were in effect for 2019, rather than the actual exchange rates in effect for 2020. The constant currency growth rates are calculated by adjusting the 2020 reported results to exclude the 2020 currency fluctuation impacts and comparing them to the 2019 reported results. We have provided this non-GAAP financial information to aid investors in better understanding our performance.
Q3 2020 Financial Results // 2
/ Third Quarter 2020 Overview and COVID-19 Update
We reported third quarter consolidated GAAP revenue of $367.0 million, an increase of 7% and 5% in reported and constant
currency, respectively, when compared to the prior year quarter. We reported year-to-date (YTD) consolidated GAAP revenue
of $1,057.6 million, an increase of 3% in both reported and constant currency when compared to YTD 2019. We reported
GAAP EPS of $0.87 and $2.50 in the third quarter and YTD 2020, respectively, compared to $1.04 and $3.34 for the third
quarter and YTD 2019, respectively. Our financial results included operating cash flows of $94.5 million for the third quarter
and $373.5 million for YTD 2020.
We reported third quarter consolidated non-GAAP revenue of $369.1 million, an increase of 7% and 5% in reported and constant currency, respectively. We reported YTD consolidated non-GAAP revenue of $1,067.7 million, an increase of 3% in both reported and constant currency. We reported non-GAAP EPS of $1.36 and $3.73 in the third quarter and YTD 2020, respectively, compared to $1.42 and $4.33 for the third quarter and YTD 2019, respectively. Update on the Impact of COVID-19:
We are continuing to closely monitor the spread of COVID-19 and assess its potential effects on our business. The COVID-19
pandemic has had, and is expected to continue to have, an adverse impact on our business, employees, liquidity, financial
condition, results of operations and cash flows. See below for the operational, financial and liquidity impacts of the COVID-19
outbreak:
Operational Impacts
• The health and safety of our employees and their families, our partners and our broad Ansys community around the
world continues to be our first responsibility. At the onset of the crisis, we closed our offices, transitioned to a remote
work environment, and implemented certain travel restrictions, each of which has disrupted how we operate our
business. We are continuing to monitor the situation, but as of now remote access remains the primary means of work
for a majority of our workforce.
• Our direct and indirect sales and support teams are using collaboration technology to access both Ansys’ data centers and the public cloud, and to meet virtually with customers to help ensure their needs are being met while working to mitigate disruptions to our sales pipeline. Our sales teams continue to close contracts, despite the purchasing process being slowed and particularly impacted at those customers with lower levels of remote working sophistication. In September, we hosted our inaugural IDEAS Forum, which was a two-day virtual event featuring thought leadership keynotes and presentations from industry leaders at Arm, TSMC, Ericsson and more, along with technology sessions and product updates. We also held the virtual Ansys Innovation Conference in China with over 11,000 attendees, 180+ sessions and 17 keynote speakers. We have been able to maintain our financial operations, including our financial systems, internal controls over financial reporting and disclosure controls and procedures. We expect to continue to maintain effective financial operations, systems and internal controls as we work remotely during the pandemic.
• We continued to hire during the third quarter using our remote on-boarding process. Our 2020 hiring has been below the level that we originally planned due to a more difficult recruiting environment and our decision to slow our hiring pace for some positions due to COVID-19.
Financial Impact
• While the COVID-19 pandemic did have an adverse financial impact on the updated guidance we provided in May and on
our actual Q3 results, the resilience of our business contributed to our delivery of revenue, operating margin and
earnings that either exceeded the mid-point or the high end of our financial guidance. Due to our diverse customer base,
both from an industry vertical and geographic perspective, as well as the close relationships with customers that enabled
us to close a large amount of business remotely, we successfully mitigated additional significant impacts in Q3 as
compared to the assumptions made in our financial guidance, most notably our continued lack of ability to visit
customers during the quarter. The Q4 and full year guidance, and the related assumptions, are detailed later in this
document.
Liquidity Impact
Q3 2020 Financial Results // 3
• We saw an increase in our cash and cash equivalents during the third quarter with a balance of $844.7 million as of
September 30, 2020 compared to $744.5 million as of June 30, 2020. We believe that this balance, together with cash
generated from operations and access to our $500.0 million revolving credit facility, are well in excess of the cash
required for our ongoing operations over the next twelve months.
• We have an unsecured term loan with an outstanding principal balance of $425.0 million as of September 30, 2020 and
are compliant with our debt covenants. Our debt agreement currently requires no principal payments until 2024.
Accordingly, our only debt service requirements are interest payments in the current low-rate environment. We believe
we will have adequate liquidity to service this debt over the next twelve months.
• Our cash flows from operations in the third quarter and YTD 2020 totaled $94.5 million and $373.5 million, respectively.
The YTD cash flow growth was driven by the ability to delay certain income, employment and indirect tax payments.
However, these positive cash flows were partially offset by delays in some customer payments on existing contracts and
longer payment terms requested for new contracts, particularly related to larger contract commitments. These requests
have increased the uncertainty of cash collections and resulted in an increase in our reserves for bad debt during 2020.
They also have affected our outlook for cash flows from operations in 2020, which is provided later in this document.
• We continued to delay our spending on certain facilities and infrastructure projects; however, we did not reduce our
spending on critical digital transformation projects, such as customer relationship management (CRM), for which we
recently onboarded our partner community, and our human resources information system (HRIS), for which phase one
that captures our global employee data went live in Q3.
Other Recent Highlights
• On October 23, 2020, we entered into a definitive agreement to acquire 100% of the shares of Analytical Graphics, Inc.
(AGI), a premier provider of mission-simulation, modeling, testing and analysis software for aerospace, defense and
intelligence applications. Once closed, the acquisition will expand the scope of our offerings, empowering users to solve
challenges by simulating from the chip level all the way to a customer's entire mission. The transaction is expected to
close with a purchase price of $700.0 million, of which the AGI shareholders will receive 67% in cash and 33% in Ansys
common stock. We anticipate obtaining new debt financing to fund a significant portion of the cash component of the
purchase price.
• Ansys was named the winner of a Gold Stevie® Award in the Achievement in Extended Enterprise Learning Programs
category in the fifth annual Stevie Awards for Great Employers. The award recognized our Simulation World, one of the
world's largest virtual events for research and development leaders, engineering simulation thought leaders, and users
across industries. Simulation World registered more than 54,000 people from 160 countries and featured 300 sessions
and 200 speakers. The Stevie Awards for Great Employers recognize the world's best employers and the human resources
professionals, teams, achievements and HR-related products and suppliers who help to create and drive great places to
work. More than 700 nominations from organizations of all sizes were submitted this year for consideration in a wide
range of HR-related categories.
• Fast Company announced its second annual Best Workplaces for Innovators list, honoring businesses and organizations
that demonstrate a deep commitment to encouraging innovation at all levels. We were named to the list for adding
Accelerated Doppler processing to Ansys® HFSS™ SBR+, enabling engineers to expedite the modeling of complex radar
scenarios related to autonomous vehicles and other near-field radar systems by 100X. The award also noted our
innovative work culture, close collaborations with industry and academia and focus on R&D spending.
• From 3D printing rockets to building electric motorcycles to reinventing how produce is grown, more than 1,000 startup
companies from around the world are employing our simulation solutions to design next-generation products and
processes. Launched in 2016, the rapidly expanding Ansys Startup Program has doubled in size over the last two years,
supporting startups from 44 countries across a range of industries including aerospace and defense, high tech, energy,
automotive and many more.
• We are reshaping how engineering students learn physics principles through the launch of free, online Ansys Innovation
Courses, a new addition to the Ansys Academic Program. Accelerating the future of engineering education, the on-

Q3 2020 Financial Results // 4
demand program integrates real-world simulation case studies within physics theory short courses to teach complicated
physics concepts and phenomena.
• We are collaborating with the University of Texas at Arlington to develop an advanced design and analysis workflow for
validating system models in the U.S. government's current and next-generation hypersonic vehicles. The workflow will
fast-track certification of simulation software codes, help decrease hypersonic technology development spending and
increase engineering productivity.
• Compal Electronics is using our software to automate simulation data processing to accelerate research and development
cycles for its 5G laptops. Eliminating the gap between simulation and data analysis through automation, Compal and
Ansys are minimizing reporting time required for critical certifications to swiftly bring 5G laptops to consumers. We
empowered Compal to obtain a first-of-its-kind certification from the Federal Communications Commission for its 5G
millimeter-wave laptop this year. The certification enables clients of Compal to market and sell its laptop in the U.S. and
bolsters Compal's position as a leader in the 5G sector.
• We are collaborating with EOS to deliver an enhanced, streamlined workflow for developing additive manufacturing
parts. The new workflow teams EOS' metal systems for additive manufacturing (AM) with our simulation solutions —
equipping AM engineers to develop highly-precise parts, improve productivity, reduce production time and deliver new
products faster.
• Cummins is using our software in its research related to improving emissions profiles, performance and other attributes
of diesel and alternative fuel engines. Through a multi-year agreement, we will aid Cummins engineers in their
development of new engine designs, empower enterprise-wide collaboration and support initiatives related to PLANET
2050 — Cummins' ambitious environmental sustainability strategy that aims to reduce greenhouse gas and air emissions.
• Our multiphysics solutions achieved certification by TSMC for its most advanced 3nm process technology and its high-
speed next-generation 3D-IC packaging technologies. These certifications enable mutual customers to satisfy key power,
thermal and reliability requirements for artificial intelligence/machine learning, 5G, high-performance computing,
networking, autonomous vehicle chips and silicon systems.
• Total headcount on September 30, 2020 was approximately 4,500 employees.
DEFERRED REVENUE AND BACKLOG
(in thousands) September 30,
2020 June 30, 2020 September 30,
2019 June 30, 2019
Current Deferred Revenue $ 326,491 $ 325,098 $ 291,385 $ 321,060 Current Backlog 243,745 226,995 154,549 175,837
Total Current Deferred Revenue and Backlog 570,236 552,093 445,934 496,897
Long-Term Deferred Revenue 11,941 11,090 11,930 14,324 Long-Term Backlog 297,735 283,287 192,523 206,093
Total Long-Term Deferred Revenue and Backlog 309,676
294,377
204,453
220,417
Total Deferred Revenue and Backlog $ 879,912 $ 846,470 $ 650,387 $ 717,314
The table above represents GAAP deferred revenue and backlog. As a result of the fair value provisions applicable to the
accounting for business combinations, we typically record acquired deferred revenue at an amount that is lower than the
historical carrying value. This results in expected reductions in reported revenue of $1.2 million and $11.3 million for the
quarter and the year ending December 31, 2020, respectively. The expected impacts on reported revenue include only the
impacts for acquisitions that closed before September 30, 2020.
Q3 2020 Financial Results // 5
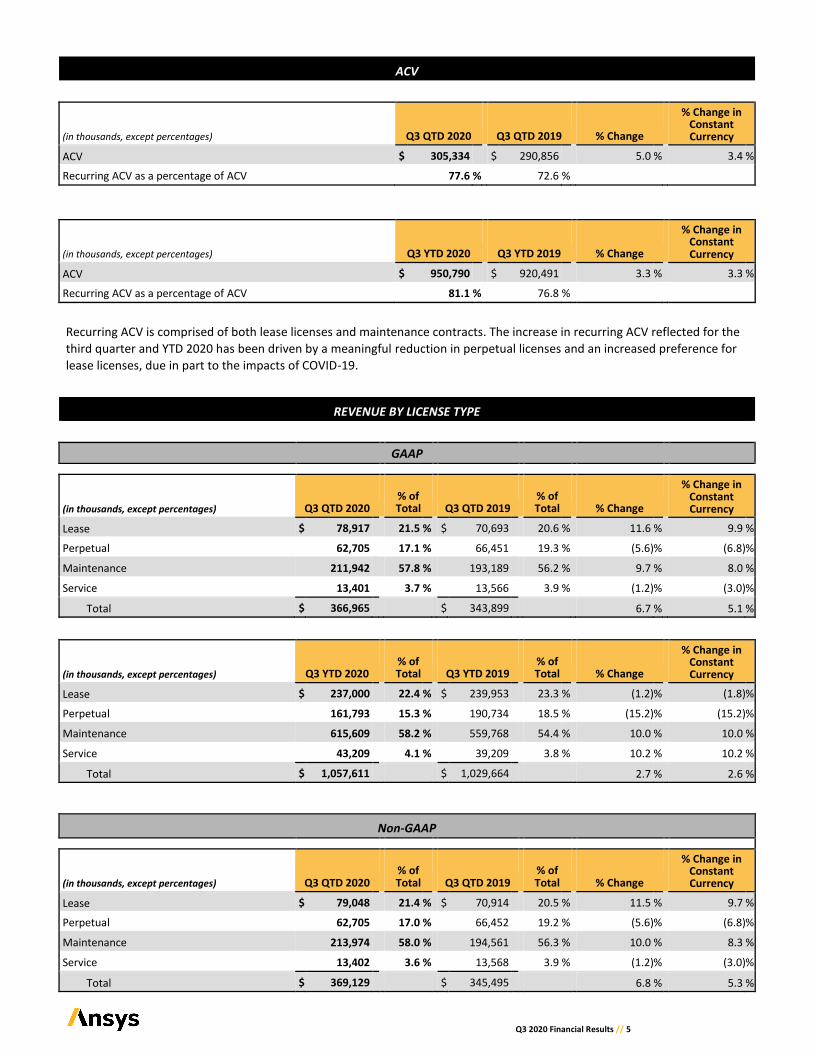
ACV
(in thousands, except percentages) Q3 QTD 2020 Q3 QTD 2019 % Change
% Change in Constant Currency
ACV $ 305,334 $ 290,856 5.0 % 3.4 %
Recurring ACV as a percentage of ACV 77.6 % 72.6 %
(in thousands, except percentages) Q3 YTD 2020 Q3 YTD 2019 % Change
% Change in Constant Currency
ACV $ 950,790 $ 920,491 3.3 % 3.3 %
Recurring ACV as a percentage of ACV 81.1 % 76.8 %
Recurring ACV is comprised of both lease licenses and maintenance contracts. The increase in recurring ACV reflected for the
third quarter and YTD 2020 has been driven by a meaningful reduction in perpetual licenses and an increased preference for
lease licenses, due in part to the impacts of COVID-19.
REVENUE BY LICENSE TYPE
GAAP
(in thousands, except percentages) Q3 QTD 2020 % of Total Q3 QTD 2019
% of Total % Change
% Change in Constant Currency
Lease $ 78,917 21.5 % $ 70,693 20.6 % 11.6 % 9.9 %
Perpetual 62,705 17.1 % 66,451 19.3 % (5.6) % (6.8) %
Maintenance 211,942 57.8 % 193,189 56.2 % 9.7 % 8.0 %
Service 13,401 3.7 % 13,566 3.9 % (1.2) % (3.0) %
Total $ 366,965 $ 343,899 6.7 % 5.1 %
(in thousands, except percentages) Q3 YTD 2020 % of Total Q3 YTD 2019
% of Total % Change
% Change in Constant Currency
Lease $ 237,000 22.4 % $ 239,953 23.3 % (1.2) % (1.8) %
Perpetual 161,793 15.3 % 190,734 18.5 % (15.2) % (15.2) %
Maintenance 615,609 58.2 % 559,768 54.4 % 10.0 % 10.0 %
Service 43,209 4.1 % 39,209 3.8 % 10.2 % 10.2 %
Total $ 1,057,611 $ 1,029,664 2.7 % 2.6 %
Non-GAAP
(in thousands, except percentages) Q3 QTD 2020 % of Total Q3 QTD 2019
% of Total % Change
% Change in Constant Currency
Lease $ 79,048 21.4 % $ 70,914 20.5 % 11.5 % 9.7 %
Perpetual 62,705 17.0 % 66,452 19.2 % (5.6) % (6.8) %
Maintenance 213,974 58.0 % 194,561 56.3 % 10.0 % 8.3 %
Service 13,402 3.6 % 13,568 3.9 % (1.2) % (3.0) %
Total $ 369,129 $ 345,495 6.8 % 5.3 %

Q3 2020 Financial Results // 6
(in thousands, except percentages) Q3 YTD 2020 % of Total Q3 YTD 2019
% of Total % Change
% Change in Constant Currency
Lease $ 237,852 22.3 % $ 240,335 23.2 % (1.0) % (1.6) %
Perpetual 161,833 15.2 % 190,960 18.4 % (15.3) % (15.3) %
Maintenance 624,824 58.5 % 565,401 54.6 % 10.5 % 10.5 %
Service 43,218 4.0 % 39,217 3.8 % 10.2 % 10.2 %
Total $ 1,067,727 $ 1,035,913 3.1 % 2.9 %
The difference between the GAAP and non-GAAP revenue values presented above is a result of the application of the fair
value provisions applicable to the accounting for business combinations.
We continue to experience increased interest by some of our larger customers in enterprise agreements that often include longer-term, time-based licenses involving a larger number of our software products. While these arrangements typically involve a higher overall transaction price, the upfront recognition of license revenue related to these larger, multi-year transactions can result in significantly higher lease license revenue volatility. As software products, across a large variety of applications and industries, become increasingly distributed in software-as-a-service, cloud and other subscription environments in which the licensing approach is time-based rather than perpetual, we are also experiencing a shifting preference from perpetual licenses to time-based licenses across a broader spectrum of our customers. This shifting preference was elevated in the first three quarters of 2020 as a result of the economic impacts of COVID-19, and we expect it to continue into the foreseeable future. Under current accounting guidance, the value and duration of multi-year lease contracts entered into during the period
significantly impact the recognition of revenue. As a result, revenue may fluctuate significantly, particularly on a quarterly
basis, due to the timing of such contracts. Large swings in revenue growth rates are not necessarily indicative of customers'
software usage changes or cash flows during the periods presented.
Service revenue growth was inhibited by our inability to perform on-site services during the pandemic.
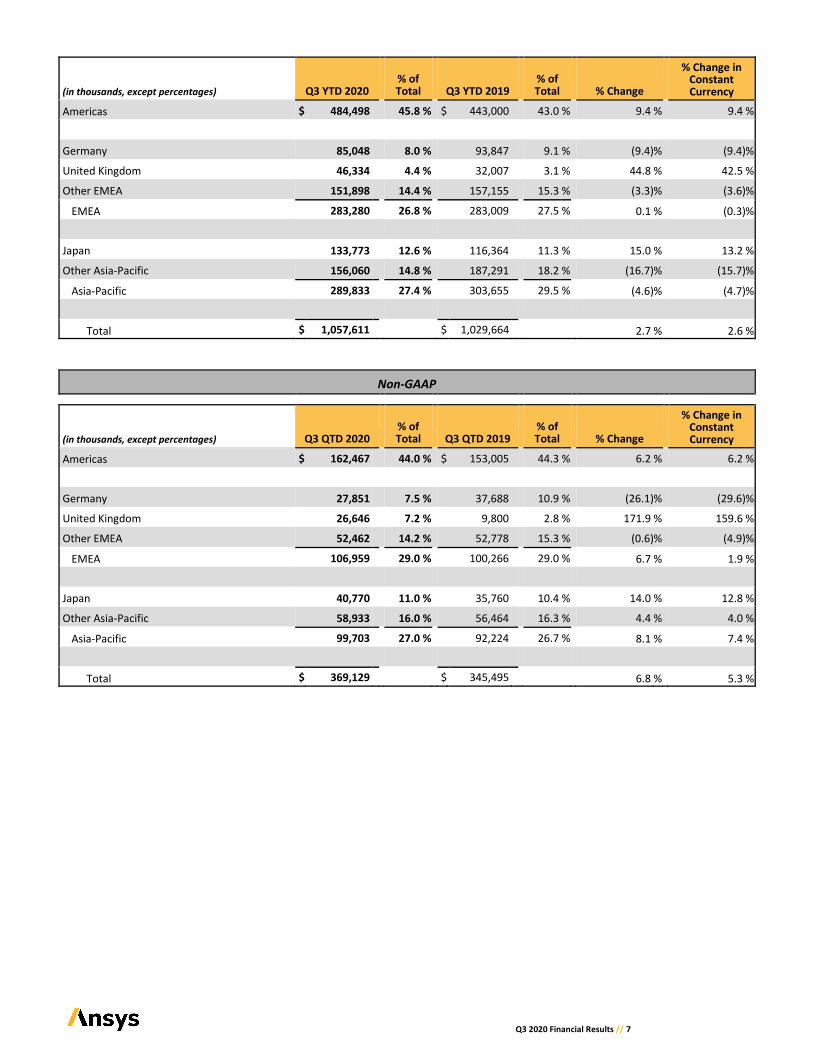
REVENUE BY GEOGRAPHY
GAAP
(in thousands, except percentages) Q3 QTD 2020 % of Total Q3 QTD 2019
% of Total % Change
% Change in Constant Currency
Americas $ 161,544 44.0 % $ 152,164 44.2 % 6.2 % 6.1 %
Germany 27,677 7.5 % 37,541 10.9 % (26.3) % (29.8) %
United Kingdom 26,595 7.2 % 9,619 2.8 % 176.5 % 164.0 %
Other EMEA 52,244 14.2 % 52,467 15.3 % (0.4) % (4.7) %
EMEA 106,516 29.0 % 99,627 29.0 % 6.9 % 2.1 %
Japan 40,565 11.1 % 35,749 10.4 % 13.5 % 12.2 %
Other Asia-Pacific 58,340 15.9 % 56,359 16.4 % 3.5 % 3.1 %
Asia-Pacific 98,905 27.0 % 92,108 26.8 % 7.4 % 6.7 %
Total $ 366,965 $ 343,899 6.7 % 5.1 %
Q3 2020 Financial Results // 7
(in thousands, except percentages) Q3 YTD 2020 % of Total Q3 YTD 2019
% of Total % Change
% Change in Constant Currency
Americas $ 484,498 45.8 % $ 443,000 43.0 % 9.4 % 9.4 %
Germany 85,048 8.0 % 93,847 9.1 % (9.4) % (9.4) %
United Kingdom 46,334 4.4 % 32,007 3.1 % 44.8 % 42.5 %
Other EMEA 151,898 14.4 % 157,155 15.3 % (3.3) % (3.6) %
EMEA 283,280 26.8 % 283,009 27.5 % 0.1 % (0.3) %
Japan 133,773 12.6 % 116,364 11.3 % 15.0 % 13.2 %
Other Asia-Pacific 156,060 14.8 % 187,291 18.2 % (16.7) % (15.7) %
Asia-Pacific 289,833 27.4 % 303,655 29.5 % (4.6) % (4.7) %
Total $ 1,057,611 $ 1,029,664 2.7 % 2.6 %
Non-GAAP
(in thousands, except percentages) Q3 QTD 2020 % of Total Q3 QTD 2019
% of Total % Change
% Change in Constant Currency
Americas $ 162,467 44.0 % $ 153,005 44.3 % 6.2 % 6.2 %
Germany 27,851 7.5 % 37,688 10.9 % (26.1) % (29.6) %
United Kingdom 26,646 7.2 % 9,800 2.8 % 171.9 % 159.6 %
Other EMEA 52,462 14.2 % 52,778 15.3 % (0.6) % (4.9) %
EMEA 106,959 29.0 % 100,266 29.0 % 6.7 % 1.9 %
Japan 40,770 11.0 % 35,760 10.4 % 14.0 % 12.8 %
Other Asia-Pacific 58,933 16.0 % 56,464 16.3 % 4.4 % 4.0 %
Asia-Pacific 99,703 27.0 % 92,224 26.7 % 8.1 % 7.4 %
Total $ 369,129 $ 345,495 6.8 % 5.3 %

Q3 2020 Financial Results // 8
(in thousands, except percentages) Q3 YTD 2020 % of Total Q3 YTD 2019
% of Total % Change
% Change in Constant Currency
Americas $ 488,853 45.8 % $ 445,944 43.0 % 9.6 % 9.7 %
Germany 85,691 8.0 % 94,404 9.1 % (9.2) % (9.2) %
United Kingdom 46,666 4.4 % 32,611 3.1 % 43.1 % 40.8 %
Other EMEA 152,665 14.3 % 158,270 15.3 % (3.5) % (3.8) %
EMEA 285,022 26.7 % 285,285 27.5 % (0.1) % (0.5) %
Japan 135,501 12.7 % 116,772 11.3 % 16.0 % 14.3 %
Other Asia-Pacific 158,351 14.8 % 187,912 18.1 % (15.7) % (14.8) %
Asia-Pacific 293,852 27.5 % 304,684 29.4 % (3.6) % (3.7) %
Total $ 1,067,727 $ 1,035,913 3.1 % 2.9 %
Regional and Industry Commentary
As explained under Revenue by License Type, under the current accounting for revenue, the value and duration of multi-year
leases entered into during the period significantly impact revenue recognition. As a result, regional revenues may fluctuate
significantly on a quarterly basis and are not necessarily indicative of customer usage changes or our cash flows for such
regions during the periods presented.
Global
While the commercial aviation sector continues to be significantly impacted by the dramatic reduction in demand for global
air travel, the continued needs of national security ensure that the defense segment has remained strong; this strength
buoyed our overall performance in the federal aerospace and defense industry in the third quarter. Our ability to drive cost
out of operations, accelerate innovation and reduce risk, combined with the megatrends of 5G, electrification and autonomy,
continue to position us strongly in the high-tech, semiconductor and automotive industries. In addition, our strategic
acquisitions continue to positively impact our business in these industries. For example, in the third quarter, a leading North
American automotive original equipment manufacturer invested in our materials intelligence solution to reduce warranty risk
and increase product quality.
Regional Our strong performance in the federal aerospace and defense industry was particularly evident in EMEA and North America,
with significant sales to a European aircraft engine manufacturer, a European national defense agency and US international
prime contractors.
The energy industry continues its transition to a lower carbon balance while being significantly impacted by the global
pandemic and the continued subdued oil price. Despite this, the industry remains committed to simulation-led digital
transformation as a way to reduce costs, improve productivity and innovate its way to a new energy future. In North America
during the third quarter, a seven-figure sale to an international energy technology company reaffirmed the critical role our
simulation solutions will play in shaping the innovations the industry needs.
In APAC, the high-tech and semiconductor industries remain strong as companies seek to capitalize on the market
opportunities presented by the complexity of technology required to support 5G and autonomy. As an example in the third
quarter, we continued to grow significant business in our flagship high-frequency electronics products at a leading global high-
tech company. In addition, recent acquisitions to our portfolio, such as Livermore Software Technology, are strengthening our
position in the growing regional automotive market.

Q3 2020 Financial Results // 9
REVENUE BY CHANNEL
GAAP
Q3 QTD 2020 Q3 QTD 2019 Q3 YTD 2020 Q3 YTD 2019
Direct revenue, as a percentage of total revenue 74.9 % 76.8 % 75.7 % 75.9 %
Indirect revenue, as a percentage of total revenue 25.1 % 23.2 % 24.3 % 24.1 %
Non-GAAP
Q3 QTD 2020 Q3 QTD 2019 Q3 YTD 2020 Q3 YTD 2019
Direct revenue, as a percentage of total revenue 74.8 % 76.9 % 75.5 % 76.0 %
Indirect revenue, as a percentage of total revenue 25.2 % 23.1 % 24.5 % 24.0 %
INCOME STATEMENT HIGHLIGHTS
GAAP
Q3 QTD 2020 Q3 QTD 2019 Q3 YTD 2020 Q3 YTD 2019
Gross margin 85.5 % 88.0 % 85.1 % 88.7 %
Operating margin 24.5 % 30.5 % 22.4 % 32.0 %
Effective tax rate 16.1 % 17.8 % 7.5 % 15.4 %
Non-GAAP
Q3 QTD 2020 Q3 QTD 2019 Q3 YTD 2020 Q3 YTD 2019
Gross margin 89.2 % 90.1 % 89.0 % 90.7 %
Operating margin 39.8 % 43.3 % 37.9 % 44.0 %
Effective tax rate 19.5 % 20.7 % 19.5 % 20.2 %
BALANCE SHEET AND CASH FLOW HIGHLIGHTS
• Cash and short-term investments totaled $845.2 million as of September 30, 2020, of which 59% was held domestically.
• Deferred revenue and backlog was $879.9 million at September 30, 2020, an increase of 35% over September 30, 2019.
• Operating cash flows were $94.5 million for the third quarter of 2020 as compared to $120.4 million for the third quarter of 2019. Operating cash flows were $373.5 million for YTD 2020 as compared to $360.5 million for YTD 2019.
• On October 23, 2020, we entered into a definitive agreement to acquire 100% of the shares of AGI. The transaction is
expected to close with a purchase price of $700.0 million, of which the AGI shareholders will receive 67% in cash and 33%
Q3 2020 Financial Results // 10
in Ansys common stock. We anticipate obtaining new debt financing to fund a significant portion of the cash component of the purchase price.
• Capital expenditures totaled $7.2 million and $24.2 million for the third quarter and YTD 2020, respectively. We are
currently planning total 2020 capital expenditures in the range of $40.0 - $50.0 million.
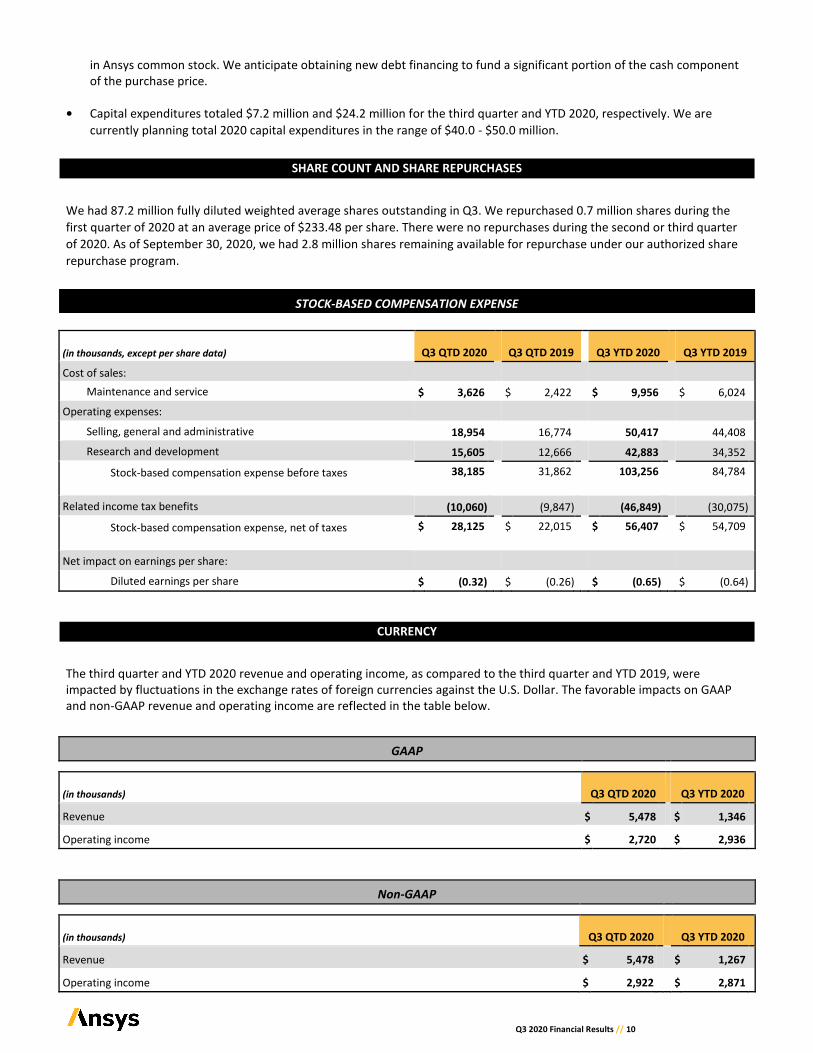
SHARE COUNT AND SHARE REPURCHASES
We had 87.2 million fully diluted weighted average shares outstanding in Q3. We repurchased 0.7 million shares during the
first quarter of 2020 at an average price of $233.48 per share. There were no repurchases during the second or third quarter
of 2020. As of September 30, 2020, we had 2.8 million shares remaining available for repurchase under our authorized share
repurchase program.
STOCK-BASED COMPENSATION EXPENSE
(in thousands, except per share data) Q3 QTD 2020 Q3 QTD 2019 Q3 YTD 2020 Q3 YTD 2019
Cost of sales: Maintenance and service $ 3,626 $ 2,422 $ 9,956 $ 6,024
Operating expenses: Selling, general and administrative 18,954 16,774 50,417 44,408 Research and development 15,605 12,666 42,883 34,352
Stock-based compensation expense before taxes 38,185
31,862
103,256
84,784
Related income tax benefits (10,060) (9,847) (46,849) (30,075)
Stock-based compensation expense, net of taxes $ 28,125
$ 22,015
$ 56,407
$ 54,709
Net impact on earnings per share: Diluted earnings per share $ (0.32) $ (0.26) $ (0.65) $ (0.64)
CURRENCY
The third quarter and YTD 2020 revenue and operating income, as compared to the third quarter and YTD 2019, were impacted by fluctuations in the exchange rates of foreign currencies against the U.S. Dollar. The favorable impacts on GAAP and non-GAAP revenue and operating income are reflected in the table below.
GAAP
(in thousands) Q3 QTD 2020 Q3 YTD 2020
Revenue $ 5,478 $ 1,346
Operating income $ 2,720 $ 2,936
Non-GAAP
(in thousands) Q3 QTD 2020 Q3 YTD 2020
Revenue $ 5,478 $ 1,267
Operating income $ 2,922 $ 2,871
Q3 2020 Financial Results // 11
The favorable foreign exchange impacts on deferred revenue and backlog were $10.7 million and $7.7 million for the third quarter and YTD 2020, respectively.
/ Outlook
Guidance Commentary on COVID-19 Outbreak and China Trade Restrictions:
The economic impacts of the COVID-19 outbreak are uncertain, but have disrupted the business of our customers and
partners, and will affect our future business and consolidated results of operations. While our current expectation, and that
reflected in our financial guidance, is that the impact will be a delay in business with an adverse impact on our full year
results, this expectation is subject to significant uncertainty and dependent upon how widespread the virus becomes, the
frequency and intensity of recurrence rates in geographic areas that have already experienced an outbreak, the duration and
severity of the impact of the virus, the geographic markets affected, the actions taken by governmental authorities, the
availability and reliability of any vaccine and other factors. Further spreading of the virus or economic deterioration caused by
the direct and indirect impacts of the virus could have a material adverse impact on our business, employees, liquidity,
financial condition, results of operations and cash flows, as well as on our ability to achieve our financial guidance.
During 2019, trade discussions between the U.S. and China led to certain entities being placed on a restricted entity list. These
restrictions limited our ability to deliver products and services to these customers. While our 2019 results were adversely
impacted by these restrictions for a portion of the year, the 2019 operating results include approximately $20 million each of
ACV and revenue related to transactions that occurred prior to the placement of the restrictions. The guidance provided
below assumes that the existing trade restrictions related to these entities will remain throughout 2020. Additional
restrictions or a further deterioration in the trade environment could have a material adverse impact on our business, as well
as on our ability to achieve our financial guidance.
Our fourth quarter and full year financial guidance estimates are provided below. Because of the very significant market and
economic uncertainty associated with the COVID-19 outbreak, these ranges are wider than those that we have historically
provided. They are also based on significant assumptions that may or may not be realized as we close out the year.
Those assumptions, and certain related management actions, include the following, among others:
• When updated financial guidance was provided in May, we expected a modest recovery in the business environment
during the third quarter with the hope of an even stronger recovery in the fourth quarter. However, businesses have not
resumed operations to the extent originally anticipated and many employees continue to work from home globally. As a
result, we expect a similar business environment in the fourth quarter to that of the third quarter. Despite the absence of
the expected economic recovery, we have increased our fiscal year 2020 guidance for ACV, revenue and diluted earnings
per share. Additional waves of COVID-19, such as the recent surge in Europe and the United States, could result in
renewed shutdowns that stop or regress economic recovery.
• The up-front recognition of revenue on large, multi-year lease contracts has a significant impact on our operating results.
While we were able to close certain large multi-year contracts through the third quarter, other customers in the fourth
quarter may be less willing to commit to such large-magnitude contracts in this environment and the sales cycles for
many customers who are willing to commit to these contracts will be extended. As a result, our full-year guidance
continues to reflect a reduction in such deals as compared to our original plans.
• While our expectations for the larger enterprise contracts are reduced, we continue to expect that our larger customer
accounts will perform more strongly than the small- and medium-sized businesses. The R&D cycles with the larger
customers remain largely unaffected, and their stronger liquidity and capital positions allow them to maintain normal
procurement patterns or return to those patterns more quickly.
• Our blended renewal rates have historically been approximately 90%, with the renewal rates on maintenance
agreements being even higher. Our renewal rates have remained high, with only a slight reduction as compared to our
historical experience, and our assumptions are that they will continue to remain so for the majority of our business. Our
assumptions include the expectation for some deterioration in renewal rates, primarily among our smaller customers,
particularly the small- and medium-sized businesses that are not as well capitalized and may be experiencing cash flow
issues.

Q3 2020 Financial Results // 12
• As was evidenced in the first three quarters of 2020, we continue to expect a disproportionate reduction in sales of our
perpetual licenses, as customers continue to work from home and find the flexibility of lease licensing and operating on
the cloud more appealing. The reduced capital outlay associated with the leasing model is also more appealing to certain
customers during a time of economic distress.
• While we successfully held the IDEAS Semiconductor Summit and the China Innovation Conference in Q3, a number of
our demand generation events and those of our channel partners have been cancelled due to social distancing
requirements. We continue to adjust to a stronger digital focus for demand generation. However, we expect the absence
of certain demand generation activities to have an adverse impact on our fourth quarter results, particularly for certain
channel partners.
• Government stimulus programs continue to evolve as global economies recover. Our guidance continues to assume that
such stimulus is not targeted to a single segment of our customer base, but is more broad and supportive in helping
countries to avoid prolonged recessions. However, the timing of government stimulus loans and other stimulus activities
could adversely impact our customers' ability to remit timely payment.
• We continue to adjust our spending to reflect our expectations for the pace at which economic recovery will occur. These
adjustments include slowing the pace of our hiring and reducing non-headcount-related discretionary spending, as well
as spending less on certain facilities and infrastructure projects. However, we have maintained and intend to maintain
our commitment to certain digital transformation projects, in particular CRM and HRIS, as those projects are critical to
our ability to operate efficiently and scale the business for future growth.
• Our operating cash flow guidance is provided for the full year. The guidance reflects an adverse impact estimated at
$15.0 - $25.0 million for customer payments that would have otherwise been made in 2020 that will be delayed to 2021
as a result of extended payment term requests on new contracts and delayed payments on existing contracts. In addition,
the fourth quarter cash flow will be adversely impacted by $10.2 million related to an unfavorable foreign tax
assessment, of which $8.7 million is expected to be recaptured in the 2021 cash flow.
The financial guidance below is not adjusted for the impacts of our recently announced agreement to acquire AGI. The
acquisition closing date is unknown as it is subject to the receipt of regulatory clearance and the satisfaction of customary
closing conditions. The transaction is not expected to have a meaningful impact on our 2020 results.
We are currently forecasting the following:
Q4 2020 OUTLOOK
(in millions, except percentages and per share data) GAAP non-GAAP
Revenue $541.1 - $581.1 $542.3 - $582.3
Operating margin 37.0% - 41.0% 47.5% - 49.5%
Effective tax rate 15.5% - 16.5% 19.5%
Diluted earnings per share $1.93 - $2.29 $2.36 - $2.67
FY 2020 OUTLOOK
(in millions, except percentages and per share data) GAAP non-GAAP
Revenue $1,598.7 - $1,638.7 $1,610.0 - $1,650.0
Operating margin 27.5% - 29.0% 41.0% - 42.0%
Effective tax rate 11.0% - 12.0% 19.5%
Diluted earnings per share $4.43 - $4.79 $6.09 - $6.40

Q3 2020 Financial Results // 13
In addition, we are currently forecasting the following for FY 2020:
(in millions) Other Financial Metrics
ACV $1,555.0 - $1,590.0
Operating cash flows $435.0 - $475.0
We are currently expecting approximately 87.4 million and 87.2 million fully diluted shares outstanding for Q4 2020 and FY 2020,
respectively.
CURRENCY OUTLOOK
Our results have been, and will continue to be, impacted by currency fluctuations, particularly by rate movements in the Euro and Japanese
Yen. Our currency rate assumptions are as follows:
Euro Japanese Yen
Q4 2020 1.16 - 1.19 104 - 107
FY 2020 1.13 - 1.16 105 - 108
The outlook presented above factors in actual and planned increases in sales and channel capacity, our current visibility
around major account activity, sales pipelines and forecasts. However, as we have said in the past, and will continue to
reiterate, there are many factors over which we have no control, including the macro-economic environment, customer
procurement patterns, government and tax policies, and currency rate volatility. We do, however, have the benefit of a solid,
repeatable business base; a diversified geographic and industry footprint; and a world-class customer base that have helped
us to succeed and to deliver on our commitments.
Please see the section entitled “Forward-Looking Statements and Risk Factors” for a discussion of risks, uncertainties and
factors that could cause actual results to differ materially from those implied by forward-looking statements.
/ Glossary of Terms
Annual Contract Value (ACV): ACV is composed of the following:
• the annualized value of maintenance and lease contracts with start dates or anniversary dates during the period, plus
• the value of perpetual license contracts with start dates during the period, plus
• the annualized value of fixed-term services contracts with start dates or anniversary dates during the period, plus
• the value of work performed during the period on fixed-deliverable services contracts.
Example 1: A $300,000 lease or maintenance contract with a term of January 1, 2020 - December 31, 2022 would contribute
$100,000 to ACV in each of fiscal years 2020, 2021 and 2022.
Example 2: A perpetual license valued at $200,000 with a contract start date of March 1, 2020 sold in connection with three
years of annual maintenance valued at a total of $120,000 would contribute to ACV as follows: fiscal year 2020: $240,000
($200,000 + $40,000); fiscal years 2021 and 2022: $40,000 in each year.
Backlog: Installment billings for periods beyond the current quarterly billing cycle.
Deferred Revenue: Billings made or payments received in advance of revenue recognition.
Lease or Time-Based License: A license of a stated product of our software that is granted to a customer for use over a
specified time period, which can be months or years in length. In addition to the use of the software, the customer is provided
with access to maintenance (unspecified version upgrades and technical support) without additional charge. The revenue
Q3 2020 Financial Results // 14
related to these contracts is recognized ratably over the contract period for the maintenance portion and up front for the
license portion.
Perpetual / Paid-Up License: A license of a stated product and version of our software that is granted to a customer for use in
perpetuity. The revenue related to this type of license is typically recognized up front.
Maintenance: A contract, typically one year in duration, that is purchased by the owner of a perpetual license and that
provides access to unspecified version upgrades and technical support during the duration of the contract. The revenue from
these contracts is recognized ratably over the contract period.
/ Forward-Looking Statements and Risk Factors
This document contains forward-looking statements within the meaning of the Private Securities Litigation Reform Act of
1995. Forward-looking statements are statements that provide current expectations or forecasts of future events based on
certain assumptions. Forward-looking statements are subject to risks, uncertainties, and factors relating to our business which
could cause our actual results to differ materially from the expectations expressed in or implied by such forward-looking
statements. Many of these risks, uncertainties, and factors are currently amplified by, and may continue to be amplified by,
the COVID-19 pandemic. Forward-looking statements use words such as “anticipate,” “believe,” “could,” “estimate,”
“expect,” “forecast,” “intend,” “likely,” “may,” “outlook,” “plan,” “predict,” “project,” “should,” “target,” or other words of
similar meaning. Forward-looking statements include those about market opportunity, including our total addressable
market. Risks, uncertainties, and factors that could cause actual results to differ materially from those implied by these
forward-looking statements include: current and potential future impacts of the COVID-19 pandemic on the global economy
and our business, financial position, results of operations and cash flows; adverse changes in global economic and/or political
conditions; declines in our customers’ businesses resulting in adverse changes in customer procurement patterns; disruptions
in accounts receivable and cash flow due to customers’ liquidity challenges and commercial deterioration; uncertainties
regarding demand for our products and services in the future and our customers’ acceptance of new products, including
those arising from the need of customers to utilize our products from remote locations; plans for future capital spending;
delays or declines in anticipated sales due to reduced or altered sales and marketing interactions with customers; disruptions
in the global economy and financial markets that may limit or delay availability of credit under existing or new credit facilities,
or that may limit our ability to obtain credit or financing on acceptable terms or at all; investments in complementary
companies, products, services and technologies; our ability to complete and successfully integrate our acquisitions and realize
the financial and business benefits of the transactions; political, economic, regulatory and public health and safety risks and
uncertainties in the countries and regions in which we operate; impacts from tariffs, trade sanctions, export license
requirements or other trade barriers; the effect of changes in currency exchange rates and changes in interest rates; potential
variations in our sales forecasts compared to actual sales; the volatility of our stock price; failures or errors in our products
and services; our industry’s rapidly changing technology; the quality of our products, including the strength of features,
functionality and integrated multi-physics capabilities; lease license volatility; higher than anticipated costs for research and
development or slowdown in our research and development activities; increased pricing pressure as a result of the
competitive environment in which we operate; our ability to recruit and retain key personnel including any delays in
recruitment caused by restrictions on travel and in person interactions and the absence of key personnel or teams due to
illness or recuperation; our ability to protect our proprietary technology; cybersecurity threats or other security breaches,
including in relation to an increased level of our activity that is occurring from remote global off-site locations; disclosure and
misuse of employee or customer data whether as a result of a cybersecurity incident or otherwise; implementation of our
new IT systems; investments in global sales and marketing organizations and global business infrastructure; dependence on
our channel partners for the distribution of our products; increased volatility in our revenue due to the timing, duration and
value of multi-year lease contracts; our reliance on high renewal rates for annual lease and maintenance contracts;
operational disruptions generally or specifically in connection with transitions to and from remote work environments, or the
failure of our technological infrastructure; the outcome of contingencies, including legal proceedings and government or
regulatory investigations and service tax audit cases; uncertainty regarding income tax estimates in the jurisdictions in which
we operate; changes in accounting principles or standards; the effect of changes in tax laws and regulations in the
jurisdictions in which we operate; the uncertainty of estimates relating to the impact on reported revenue related to the
acquisition accounting treatment of deferred revenue; and other risks and uncertainties described in our reports filed from
time to time with the Securities and Exchange Commission. We caution readers not to place undue reliance upon any such
forward-looking statements, which speak only as of the date they are made. We undertake no obligation to publicly update
forward-looking statements, whether as a result of new information, future events or otherwise, except as required by law.

Q3 2020 Financial Results // 15
/ Reconciliations of GAAP to Non-GAAP Measures (Unaudited)
Three Months Ended
September 30, 2020
(in thousands, except percentages and per share data) Revenue Gross Profit %
Operating Income % Net Income EPS - Diluted1
Total GAAP $ 366,965 $ 313,580 85.5 % $ 90,085 24.5 % $ 75,627 $ 0.87 Acquisition accounting for deferred revenue 2,164 2,164 — % 2,164 0.5 % 2,164 0.02
Stock-based compensation expense — 3,626 0.9 % 38,185 10.4 % 38,185 0.44
Excess payroll taxes related to stock-based awards — 85 — % 732 0.2 % 732 0.01
Amortization of intangible assets from acquisitions — 9,911 2.8 % 14,148 3.8 % 14,148 0.16
Transaction expenses related to business combinations — — — % 1,549 0.4 % 1,549 0.02
Adjustment for income tax effect — — — % — — % (14,133) (0.16)
Total non-GAAP $ 369,129 $ 329,366 89.2 % $ 146,863 39.8 % $ 118,272 $ 1.36
1 Diluted weighted average shares were 87,224.
Three Months Ended
September 30, 2019
(in thousands, except percentages and per share data) Revenue Gross Profit %
Operating Income % Net Income EPS - Diluted1
Total GAAP $ 343,899 $ 302,534 88.0 % $ 105,047 30.5 % $ 89,463 $ 1.04 Acquisition accounting for deferred revenue 1,596 1,596 — % 1,596 0.4 % 1,596 0.02
Stock-based compensation expense — 2,422 0.7 % 31,862 9.2 % 31,862 0.37
Excess payroll taxes related to stock-based awards — — — % 137 0.1 % 137 —
Amortization of intangible assets from acquisitions — 4,762 1.4 % 8,549 2.4 % 8,549 0.10
Transaction expenses related to business combinations — — — % 2,531 0.7 % 2,531 0.03
Rabbi trust (income) / expense — — — % — — % (45) —
Adjustment for income tax effect — — — % — — % (12,385) (0.14)
Total non-GAAP $ 345,495 $ 311,314 90.1 % $ 149,722 43.3 % $ 121,708 $ 1.42
1 Diluted weighted average shares were 85,733.

Q3 2020 Financial Results // 16
Nine Months Ended
September 30, 2020
(in thousands, except percentages and per share data) Revenue Gross Profit %
Operating Income % Net Income EPS - Diluted1
Total GAAP $ 1,057,611 $ 900,250 85.1 % $ 236,965 22.4 % $ 218,255 $ 2.50 Acquisition accounting for deferred revenue 10,116 10,116 0.2 % 10,116 0.7 % 10,116 0.12
Stock-based compensation expense — 9,956 0.9 % 103,256 9.7 % 103,256 1.19
Excess payroll taxes related to stock-based awards — 774 0.1 % 9,591 0.9 % 9,591 0.11
Amortization of intangible assets from acquisitions — 29,227 2.7 % 41,789 3.9 % 41,789 0.48
Transaction expenses related to business combinations — — — % 2,808 0.3 % 2,808 0.03
Rabbi trust (income) / expense — — — % — — % (5) —
Adjustment for income tax effect — — — % — — % (60,906) (0.70)
Total non-GAAP $ 1,067,727 $ 950,323 89.0 % $ 404,525 37.9 % $ 324,904 $ 3.73
1 Diluted weighted average shares were 87,176.
Nine Months Ended
September 30, 2019
(in thousands, except percentages and per share data) Revenue Gross Profit %
Operating Income % Net Income EPS - Diluted1
Total GAAP $ 1,029,664 $ 912,987 88.7 % $ 329,324 32.0 % $ 285,443 $ 3.34 Acquisition accounting for deferred revenue 6,249 6,249 — % 6,249 0.4 % 6,249 0.07
Stock-based compensation expense — 6,024 0.6 % 84,784 8.2 % 84,784 0.98
Excess payroll taxes related to stock-based awards — 476 — % 4,516 0.4 % 4,516 0.05
Amortization of intangible assets from acquisitions — 14,064 1.4 % 25,406 2.5 % 25,406 0.30
Transaction expenses related to business combinations — — — % 5,642 0.5 % 5,642 0.07
Rabbi trust (income) / expense — — — % — — % (268) —
Adjustment related to the Tax Cuts and Jobs Act — — — % — — % (1,834) (0.02)
Adjustment for income tax effect — — — % — — % (39,654) (0.46)
Total non-GAAP $ 1,035,913 $ 939,800 90.7 % $ 455,921 44.0 % $ 370,284 $ 4.33
1 Diluted weighted average shares were 85,570.
Q3 2020 Financial Results // 17
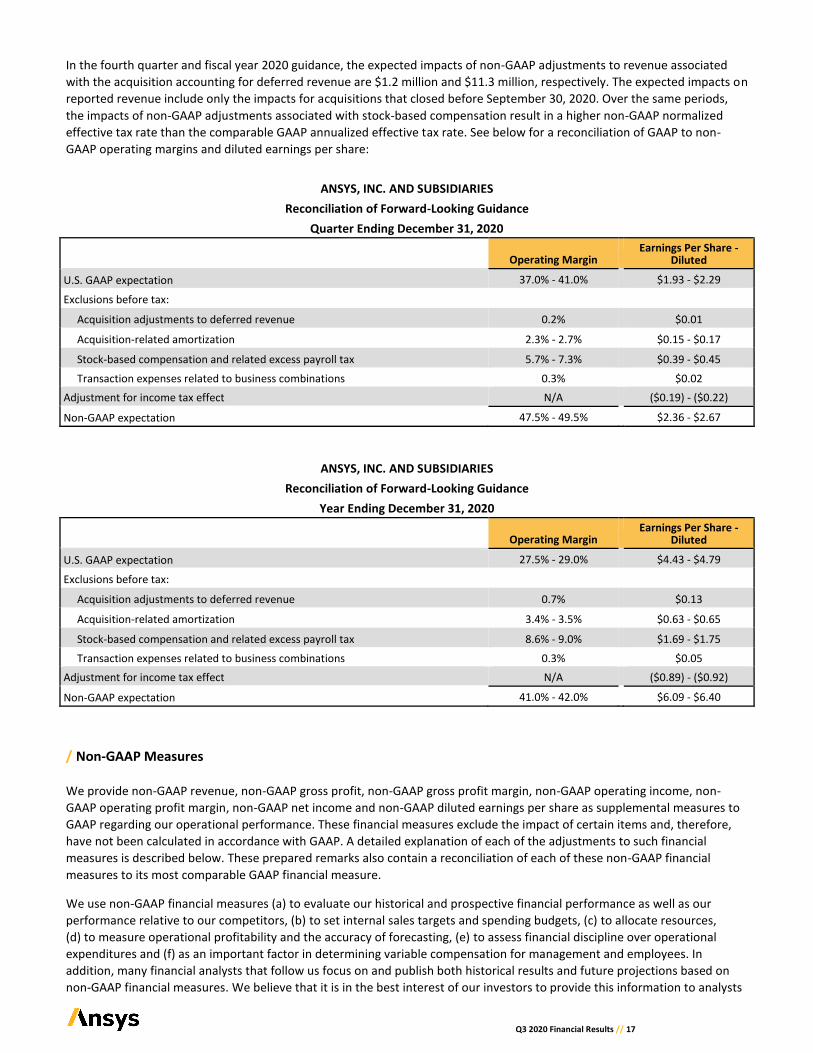
In the fourth quarter and fiscal year 2020 guidance, the expected impacts of non-GAAP adjustments to revenue associated
with the acquisition accounting for deferred revenue are $1.2 million and $11.3 million, respectively. The expected impacts on
reported revenue include only the impacts for acquisitions that closed before September 30, 2020. Over the same periods,
the impacts of non-GAAP adjustments associated with stock-based compensation result in a higher non-GAAP normalized
effective tax rate than the comparable GAAP annualized effective tax rate. See below for a reconciliation of GAAP to non-
GAAP operating margins and diluted earnings per share:
ANSYS, INC. AND SUBSIDIARIES
Reconciliation of Forward-Looking Guidance
Quarter Ending December 31, 2020
Operating Margin Earnings Per Share -
Diluted
U.S. GAAP expectation 37.0% - 41.0% $1.93 - $2.29
Exclusions before tax:
Acquisition adjustments to deferred revenue 0.2% $0.01
Acquisition-related amortization 2.3% - 2.7% $0.15 - $0.17
Stock-based compensation and related excess payroll tax 5.7% - 7.3% $0.39 - $0.45
Transaction expenses related to business combinations 0.3% $0.02
Adjustment for income tax effect N/A ($0.19) - ($0.22)
Non-GAAP expectation 47.5% - 49.5% $2.36 - $2.67
ANSYS, INC. AND SUBSIDIARIES
Reconciliation of Forward-Looking Guidance
Year Ending December 31, 2020
Operating Margin Earnings Per Share -
Diluted
U.S. GAAP expectation 27.5% - 29.0% $4.43 - $4.79
Exclusions before tax:
Acquisition adjustments to deferred revenue 0.7% $0.13
Acquisition-related amortization 3.4% - 3.5% $0.63 - $0.65
Stock-based compensation and related excess payroll tax 8.6% - 9.0% $1.69 - $1.75
Transaction expenses related to business combinations 0.3% $0.05
Adjustment for income tax effect N/A ($0.89) - ($0.92)
Non-GAAP expectation 41.0% - 42.0% $6.09 - $6.40
/ Non-GAAP Measures
We provide non-GAAP revenue, non-GAAP gross profit, non-GAAP gross profit margin, non-GAAP operating income, non-
GAAP operating profit margin, non-GAAP net income and non-GAAP diluted earnings per share as supplemental measures to
GAAP regarding our operational performance. These financial measures exclude the impact of certain items and, therefore,
have not been calculated in accordance with GAAP. A detailed explanation of each of the adjustments to such financial
measures is described below. These prepared remarks also contain a reconciliation of each of these non-GAAP financial
measures to its most comparable GAAP financial measure.
We use non-GAAP financial measures (a) to evaluate our historical and prospective financial performance as well as our
performance relative to our competitors, (b) to set internal sales targets and spending budgets, (c) to allocate resources,
(d) to measure operational profitability and the accuracy of forecasting, (e) to assess financial discipline over operational
expenditures and (f) as an important factor in determining variable compensation for management and employees. In
addition, many financial analysts that follow us focus on and publish both historical results and future projections based on
non-GAAP financial measures. We believe that it is in the best interest of our investors to provide this information to analysts
Q3 2020 Financial Results // 18
so that they accurately report the non-GAAP financial information. Moreover, investors have historically requested, and we
have historically reported, these non-GAAP financial measures as a means of providing consistent and comparable
information with past reports of financial results.
While we believe that these non-GAAP financial measures provide useful supplemental information to investors, there are
limitations associated with the use of these non-GAAP financial measures. These non-GAAP financial measures are not
prepared in accordance with GAAP, are not reported by all our competitors and may not be directly comparable to similarly
titled measures of our competitors due to potential differences in the exact method of calculation. We compensate for these
limitations by using these non-GAAP financial measures as supplements to GAAP financial measures and by reviewing the
reconciliations of the non-GAAP financial measures to their most comparable GAAP financial measures.
The adjustments to these non-GAAP financial measures, and the basis for such adjustments, are outlined below:
Acquisition accounting for deferred revenue. Historically, we have consummated acquisitions in order to support our
strategic and other business objectives. In accordance with the fair value provisions applicable to the accounting for business
combinations, acquired deferred revenue is often recorded on the opening balance sheet at an amount that is lower than the
historical carrying value. Although this acquisition accounting requirement has no impact on our business or cash flow, it
adversely impacts our reported GAAP revenue in the reporting periods following an acquisition. In order to provide investors
with financial information that facilitates comparison of both historical and future results, we provide non-GAAP financial
measures which exclude the impact of the acquisition accounting adjustment. We believe that this non-GAAP financial
adjustment is useful to investors because it allows investors to (a) evaluate the effectiveness of the methodology and
information used by us in our financial and operational decision-making, and (b) compare our past and future reports of
financial results as the revenue reduction related to acquired deferred revenue will not recur when related lease licenses and
software maintenance contracts are renewed in future periods.
Amortization of intangible assets from acquisitions. We incur amortization of intangible assets, included in our GAAP
presentation of amortization expense, related to various acquisitions we have made. We exclude these expenses for the
purpose of calculating non-GAAP gross profit, non-GAAP gross profit margin, non-GAAP operating income, non-GAAP
operating profit margin, non-GAAP net income and non-GAAP diluted earnings per share when we evaluate our continuing
operational performance because these costs are fixed at the time of an acquisition, are then amortized over a period of
several years after the acquisition and generally cannot be changed or influenced by us after the acquisition. Accordingly, we
do not consider these expenses for purposes of evaluating our performance during the applicable time period after the
acquisition, and we exclude such expenses when making decisions to allocate resources. We believe that these non-GAAP
financial measures are useful to investors because they allow investors to (a) evaluate the effectiveness of the methodology
and information used by us in our financial and operational decision-making, and (b) compare our past reports of financial
results as we have historically reported these non-GAAP financial measures.
Stock-based compensation expense. We incur expense related to stock-based compensation included in our GAAP
presentation of cost of maintenance and service; research and development expense; and selling, general and administrative
expense. This non-GAAP adjustment also includes excess payroll tax expense related to stock-based compensation. Stock-
based compensation expense (benefit) incurred in connection with our deferred compensation plan held in a rabbi trust
includes an offsetting benefit (charge) recorded in other income (expense). Although stock-based compensation is an expense
and viewed as a form of compensation, we exclude these expenses for the purpose of calculating non-GAAP gross profit, non-
GAAP gross profit margin, non-GAAP operating income, non-GAAP operating profit margin, non-GAAP net income and non-
GAAP diluted earnings per share when we evaluate our continuing operational performance. We similarly exclude income
(expense) related to assets held in a rabbi trust in connection with our deferred compensation plan. Specifically, we exclude
stock-based compensation and income (expense) related to assets held in the deferred compensation plan rabbi trust during
our annual budgeting process and our quarterly and annual assessments of our performance. The annual budgeting process is
the primary mechanism whereby we allocate resources to various initiatives and operational requirements. Additionally, the
annual review by our board of directors during which it compares our historical business model and profitability to the
planned business model and profitability for the forthcoming year excludes the impact of stock-based compensation. In
evaluating the performance of our senior management and department managers, charges related to stock-based
compensation are excluded from expenditure and profitability results. In fact, we record stock-based compensation expense
into a stand-alone cost center for which no single operational manager is responsible or accountable. In this way, we can
review, on a period-to-period basis, each manager's performance and assess financial discipline over operational
expenditures without the effect of stock-based compensation. We believe that these non-GAAP financial measures are useful
to investors because they allow investors to (a) evaluate our operating results and the effectiveness of the methodology used
Q3 2020 Financial Results // 19
by us to review our operating results, and (b) review historical comparability in our financial reporting as well as comparability
with competitors' operating results.
Transaction expenses related to business combinations. We incur expenses for professional services rendered in connection
with business combinations, which are included in our GAAP presentation of selling, general and administrative expense.
These expenses are generally not tax-deductible. We exclude these acquisition-related transaction expenses, derived from
announced acquisitions, for the purpose of calculating non-GAAP operating income, non-GAAP operating profit margin, non-
GAAP net income and non-GAAP diluted earnings per share when we evaluate our continuing operational performance, as we
generally would not have otherwise incurred these expenses in the periods presented as a part of our operations. We believe
that these non-GAAP financial measures are useful to investors because they allow investors to (a) evaluate our operating
results and the effectiveness of the methodology used by us to review our operating results, and (b) review historical
comparability in our financial reporting as well as comparability with competitors' operating results.
Tax Cuts and Jobs Act. We recorded impacts to our income tax provision related to the enactment of the Tax Cuts and Jobs Act
of 2017, specifically for the transition tax related to unrepatriated cash and the impacts of the tax rate change on net deferred
tax assets. We exclude these impacts for the purpose of calculating non-GAAP net income and non-GAAP diluted earnings per
share when we evaluate our continuing operational performance, as (i) the charges are not expected to recur as part of our
normal operations and (ii) the charges resulted from the extremely infrequent event of major U.S. tax reform, the last such
reform having occurred in 1986. We believe that these non-GAAP financial measures are useful to investors because they allow
investors to (a) evaluate our operating results and the effectiveness of the methodology used by us to review our operating
results, and (b) review historical comparability in our financial reporting.
Non-GAAP tax provision. We utilize a normalized non-GAAP annual effective tax rate (AETR) to calculate non-GAAP
measures. This methodology provides better consistency across interim reporting periods by eliminating the effects of non-
recurring items and aligning the non-GAAP tax rate with our expected geographic earnings mix. To project this rate, we analyzed
our historic and projected non-GAAP earnings mix by geography along with other factors such as our current tax structure,
recurring tax credits and incentives, and expected tax positions. On an annual basis we will re-evaluate this rate for significant
items that may materially affect our projections.
Non-GAAP financial measures are not in accordance with, or an alternative for, GAAP. Our non-GAAP financial measures are
not meant to be considered in isolation or as a substitute for comparable GAAP financial measures and should be read only in
conjunction with our consolidated financial statements prepared in accordance with GAAP.
We have provided a reconciliation of the non-GAAP financial measures to the most directly comparable GAAP financial
measures as listed below:
GAAP Reporting Measure Non-GAAP Reporting Measure
Revenue Non-GAAP Revenue
Gross Profit Non-GAAP Gross Profit
Gross Profit Margin Non-GAAP Gross Profit Margin
Operating Income Non-GAAP Operating Income
Operating Profit Margin Non-GAAP Operating Profit Margin
Net Income Non-GAAP Net Income
Diluted Earnings Per Share Non-GAAP Diluted Earnings Per Share
IR Contacts:
Annette N. Arribas, IRC
Senior Director, Global Investor Relations
724.820.3700
Virginea Gibson
Investor Relations Manager
724.820.4225