Embed Size (px)
Citation preview
Free translation into English for convenience only – French version prevails
1
3rd of November 2017
THIRD QUARTER 2017 RESULTS STRONG OPERATING RESULT DRIVEN BY SOLID TRAFFIC AND
INCREASE IN UNIT REVENUE
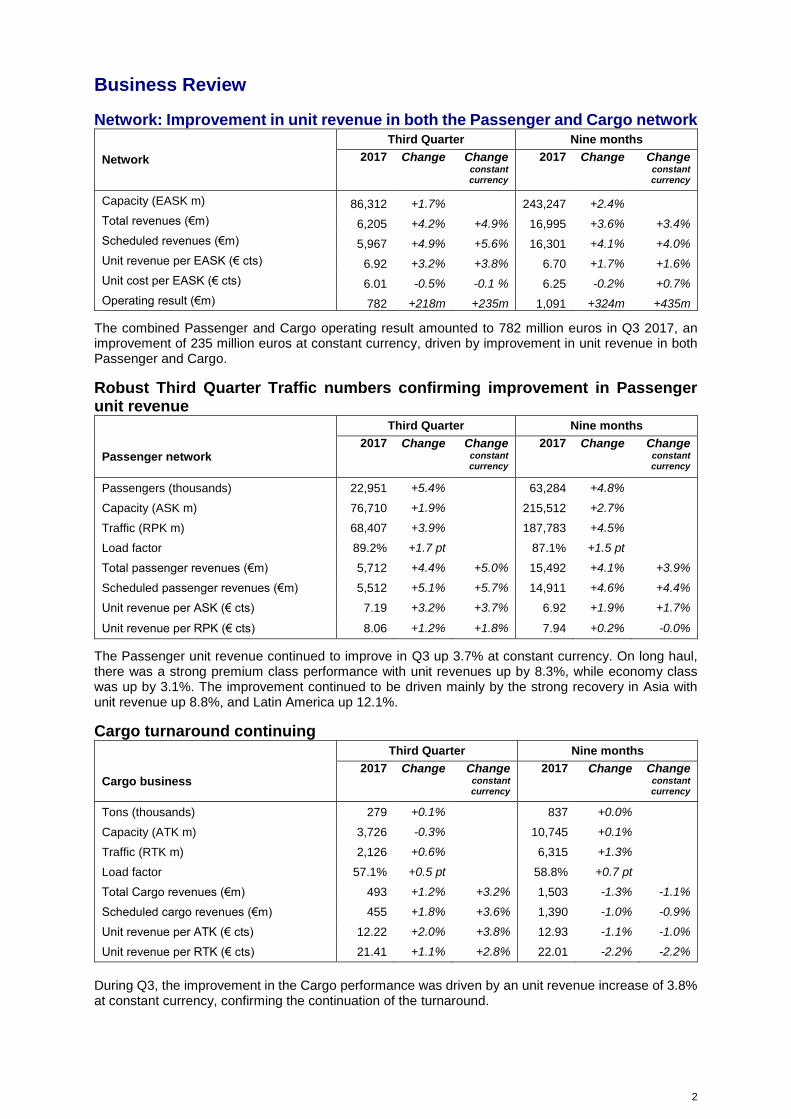
THIRD QUARTER 2017 The operating result stands at 1,022 million euros, up 38.7% compared to Q3 2016 Robust traffic resulting in an improved load factor, up 1.6 pt
Confirmation of the positive trend in Group (Passenger + Transavia) unit revenue per available seat kilometer (RASK) at constant currency: +4.1%
GOOD STRATEGIC AND COMMERCIAL MOMENTUM
Implementation of a new distribution strategy by adopting NDC Upcoming launch of revamped Flying Blue program
FURTHER STRENGTHENING THE FINANCIAL STRUCTURE
Soft call exercise of the OCEANE 2023 bond leading to deleverage by up to 520 million euros
Finalizing the implementation of de-risked pension schemes for pilots and cabin crew in KLM
OUTLOOK Based on current outlook, Q4 2017 unit revenues at constant currency compared to last year
expected to be positive Q4 2017 fuel bill in euros forecasted stable
Full year 2017 unit cost evolution at constant currency, fuel and pension charges expected slightly negative, and between -1.0 to -1.5% excluding load factor and profit sharing effect
Operating free cash flow 2017 above last year, with capex at € 2.2bn Adjusted net debt to EBITDAR expected between 2.2x and 2.3x end 2017 (before acquisition in
2018 of a 31% stake in Virgin Atlantic)
On track to implement IFRS16 in 2018 The Board of Directors of Air France-KLM, chaired by Jean-Marc Janaillac, met on 2nd of November 2017 to approve the accounts for the Third Quarter 2017. Jean-Marc Janaillac made the following comments: "The strong operating performance achieved by the Group in the third quarter reflects a sustained execution on our strategic priorities, as well as a robust business environment translated into solid traffic and unit revenue trends. We continued to move forward notably with the expansion of our network of strategic alliances and the implementation of a new distribution model. At the same time, we relentlessly pursued our efforts to strengthen our financial structure. All of these accomplishments demonstrate that Air France-KLM is well on track to deliver on Trust Together strategic priorities of growing revenues and improve competitiveness.”
Air France-KLM Group Third Quarter Nine months
2017 Change 2017 Change
Passengers (thousands) 27,911 +5.1% 75,056 +6.0%
Unit revenue per ASK (€ cts) 7.03 +4.1% 6.75 +1.8%
Operating result (€m) 1,022 +38.7% 1,375 +44.0%
Net result – group (€m) 552 +1.5% 703 +63.5%
Operating free cash flow (€m) 125 +248 793 +543
Net debt at end of period (€m) 2,796 -859
2
Business Review
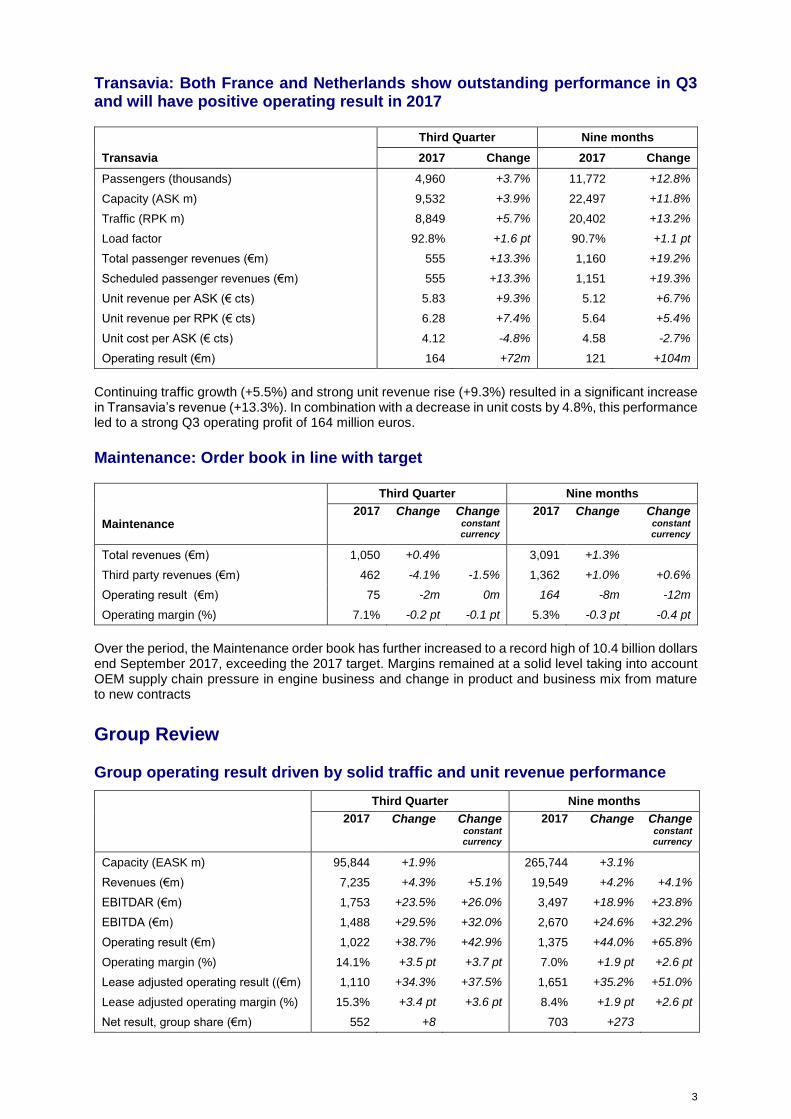
Network: Improvement in unit revenue in both the Passenger and Cargo network
Network
Third Quarter Nine months
2017 Change Change constant currency
2017 Change Change constant currency
Capacity (EASK m) 86,312 +1.7% 243,247 +2.4%
Total revenues (€m) 6,205 +4.2% +4.9% 16,995 +3.6% +3.4%
Scheduled revenues (€m) 5,967 +4.9% +5.6% 16,301 +4.1% +4.0%
Unit revenue per EASK (€ cts) 6.92 +3.2% +3.8% 6.70 +1.7% +1.6%
Unit cost per EASK (€ cts) 6.01 -0.5% -0.1 % 6.25 -0.2% +0.7%
Operating result (€m) 782 +218m +235m 1,091 +324m +435m
The combined Passenger and Cargo operating result amounted to 782 million euros in Q3 2017, an improvement of 235 million euros at constant currency, driven by improvement in unit revenue in both Passenger and Cargo.
Robust Third Quarter Traffic numbers confirming improvement in Passenger unit revenue
Third Quarter Nine months
Passenger network 2017 Change Change
constant currency
2017 Change Change constant currency
Passengers (thousands) 22,951 +5.4% 63,284 +4.8%
Capacity (ASK m) 76,710 +1.9% 215,512 +2.7%
Traffic (RPK m) 68,407 +3.9% 187,783 +4.5%
Load factor 89.2% +1.7 pt 87.1% +1.5 pt
Total passenger revenues (€m) 5,712 +4.4% +5.0% 15,492 +4.1% +3.9%
Scheduled passenger revenues (€m) 5,512 +5.1% +5.7% 14,911 +4.6% +4.4%
Unit revenue per ASK (€ cts) 7.19 +3.2% +3.7% 6.92 +1.9% +1.7%
Unit revenue per RPK (€ cts) 8.06 +1.2% +1.8% 7.94 +0.2% -0.0%
The Passenger unit revenue continued to improve in Q3 up 3.7% at constant currency. On long haul, there was a strong premium class performance with unit revenues up by 8.3%, while economy class was up by 3.1%. The improvement continued to be driven mainly by the strong recovery in Asia with unit revenue up 8.8%, and Latin America up 12.1%.
Cargo turnaround continuing Third Quarter Nine months
Cargo business 2017 Change Change
constant currency
2017 Change Change constant currency
Tons (thousands) 279 +0.1% 837 +0.0%
Capacity (ATK m) 3,726 -0.3% 10,745 +0.1%
Traffic (RTK m) 2,126 +0.6% 6,315 +1.3%
Load factor 57.1% +0.5 pt 58.8% +0.7 pt
Total Cargo revenues (€m) 493 +1.2% +3.2% 1,503 -1.3% -1.1%
Scheduled cargo revenues (€m) 455 +1.8% +3.6% 1,390 -1.0% -0.9%
Unit revenue per ATK (€ cts) 12.22 +2.0% +3.8% 12.93 -1.1% -1.0%
Unit revenue per RTK (€ cts) 21.41 +1.1% +2.8% 22.01 -2.2% -2.2%
During Q3, the improvement in the Cargo performance was driven by an unit revenue increase of 3.8% at constant currency, confirming the continuation of the turnaround.
3
Transavia: Both France and Netherlands show outstanding performance in Q3 and will have positive operating result in 2017
Third Quarter Nine months
Transavia 2017 Change 2017 Change
Passengers (thousands) 4,960 +3.7% 11,772 +12.8%
Capacity (ASK m) 9,532 +3.9% 22,497 +11.8%
Traffic (RPK m) 8,849 +5.7% 20,402 +13.2%
Load factor 92.8% +1.6 pt 90.7% +1.1 pt
Total passenger revenues (€m) 555 +13.3% 1,160 +19.2%
Scheduled passenger revenues (€m) 555 +13.3% 1,151 +19.3%
Unit revenue per ASK (€ cts) 5.83 +9.3% 5.12 +6.7%
Unit revenue per RPK (€ cts) 6.28 +7.4% 5.64 +5.4%
Unit cost per ASK (€ cts) 4.12 -4.8% 4.58 -2.7%
Operating result (€m) 164 +72m 121 +104m
Continuing traffic growth (+5.5%) and strong unit revenue rise (+9.3%) resulted in a significant increase in Transavia’s revenue (+13.3%). In combination with a decrease in unit costs by 4.8%, this performance led to a strong Q3 operating profit of 164 million euros.
Maintenance: Order book in line with target
Third Quarter Nine months
Maintenance 2017 Change Change
constant currency
2017 Change Change constant currency
Total revenues (€m) 1,050 +0.4% 3,091 +1.3%
Third party revenues (€m) 462 -4.1% -1.5% 1,362 +1.0% +0.6%
Operating result (€m) 75 -2m 0m 164 -8m -12m
Operating margin (%) 7.1% -0.2 pt -0.1 pt 5.3% -0.3 pt -0.4 pt
Over the period, the Maintenance order book has further increased to a record high of 10.4 billion dollars end September 2017, exceeding the 2017 target. Margins remained at a solid level taking into account OEM supply chain pressure in engine business and change in product and business mix from mature to new contracts
Group Review Group operating result driven by solid traffic and unit revenue performance
Third Quarter Nine months
2017 Change Change
constant currency
2017 Change Change constant currency
Capacity (EASK m) 95,844 +1.9% 265,744 +3.1%
Revenues (€m) 7,235 +4.3% +5.1% 19,549 +4.2% +4.1%
EBITDAR (€m) 1,753 +23.5% +26.0% 3,497 +18.9% +23.8%
EBITDA (€m) 1,488 +29.5% +32.0% 2,670 +24.6% +32.2%
Operating result (€m) 1,022 +38.7% +42.9% 1,375 +44.0% +65.8%
Operating margin (%) 14.1% +3.5 pt +3.7 pt 7.0% +1.9 pt +2.6 pt
Lease adjusted operating result ((€m) 1,110 +34.3% +37.5% 1,651 +35.2% +51.0%
Lease adjusted operating margin (%) 15.3% +3.4 pt +3.6 pt 8.4% +1.9 pt +2.6 pt
Net result, group share (€m) 552 +8 703 +273
4
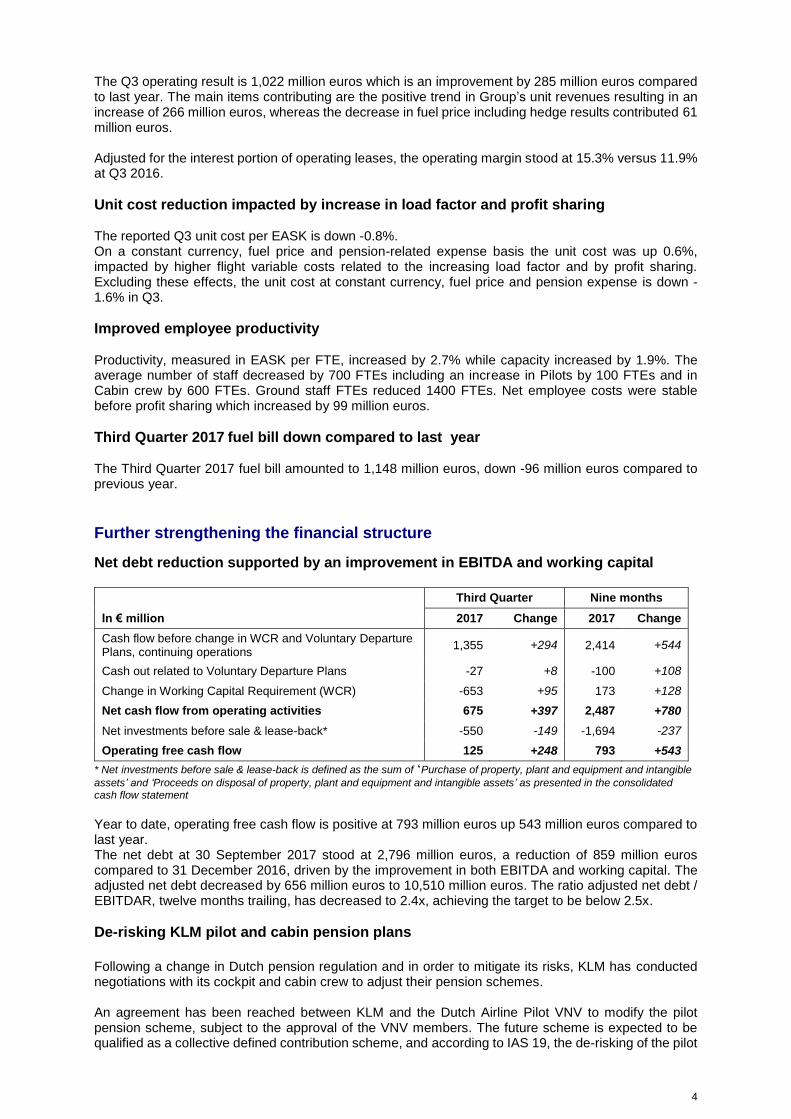
The Q3 operating result is 1,022 million euros which is an improvement by 285 million euros compared to last year. The main items contributing are the positive trend in Group’s unit revenues resulting in an increase of 266 million euros, whereas the decrease in fuel price including hedge results contributed 61 million euros. Adjusted for the interest portion of operating leases, the operating margin stood at 15.3% versus 11.9% at Q3 2016.
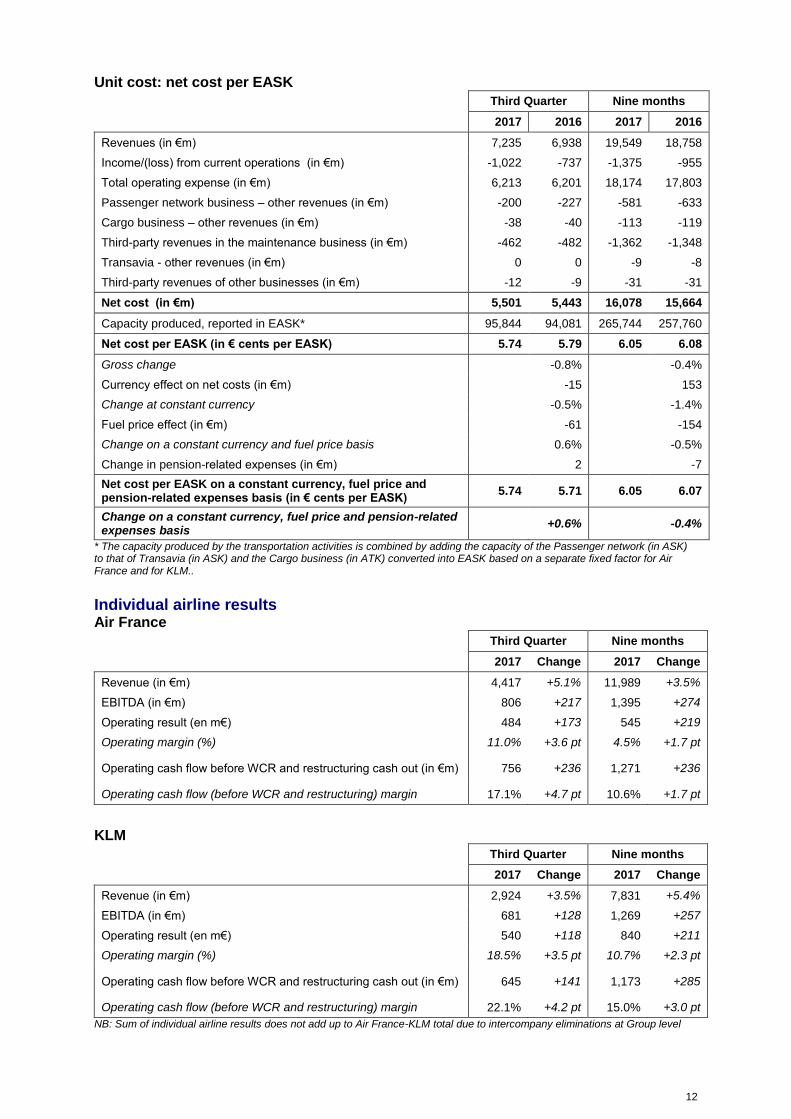
Unit cost reduction impacted by increase in load factor and profit sharing The reported Q3 unit cost per EASK is down -0.8%. On a constant currency, fuel price and pension-related expense basis the unit cost was up 0.6%, impacted by higher flight variable costs related to the increasing load factor and by profit sharing. Excluding these effects, the unit cost at constant currency, fuel price and pension expense is down -1.6% in Q3.
Improved employee productivity Productivity, measured in EASK per FTE, increased by 2.7% while capacity increased by 1.9%. The average number of staff decreased by 700 FTEs including an increase in Pilots by 100 FTEs and in Cabin crew by 600 FTEs. Ground staff FTEs reduced 1400 FTEs. Net employee costs were stable before profit sharing which increased by 99 million euros.
Third Quarter 2017 fuel bill down compared to last year The Third Quarter 2017 fuel bill amounted to 1,148 million euros, down -96 million euros compared to previous year.
Further strengthening the financial structure
Net debt reduction supported by an improvement in EBITDA and working capital
Third Quarter Nine months
In € million 2017 Change 2017 Change
Cash flow before change in WCR and Voluntary Departure Plans, continuing operations
1,355 +294 2,414 +544
Cash out related to Voluntary Departure Plans -27 +8 -100 +108
Change in Working Capital Requirement (WCR) -653 +95 173 +128
Net cash flow from operating activities 675 +397 2,487 +780
Net investments before sale & lease-back* -550 -149 -1,694 -237
Operating free cash flow 125 +248 793 +543
* Net investments before sale & lease-back is defined as the sum of ‘Purchase of property, plant and equipment and intangible
assets’ and ‘Proceeds on disposal of property, plant and equipment and intangible assets’ as presented in the consolidated cash flow statement
Year to date, operating free cash flow is positive at 793 million euros up 543 million euros compared to last year. The net debt at 30 September 2017 stood at 2,796 million euros, a reduction of 859 million euros compared to 31 December 2016, driven by the improvement in both EBITDA and working capital. The adjusted net debt decreased by 656 million euros to 10,510 million euros. The ratio adjusted net debt / EBITDAR, twelve months trailing, has decreased to 2.4x, achieving the target to be below 2.5x.
De-risking KLM pilot and cabin pension plans
Following a change in Dutch pension regulation and in order to mitigate its risks, KLM has conducted negotiations with its cockpit and cabin crew to adjust their pension schemes. An agreement has been reached between KLM and the Dutch Airline Pilot VNV to modify the pilot pension scheme, subject to the approval of the VNV members. The future scheme is expected to be qualified as a collective defined contribution scheme, and according to IAS 19, the de-risking of the pilot
5
pension fund will lead in Q4 to the derecognition of the “Pension asset” of the Group’s balance sheet through non-current expense in the P&L. Another agreement with Cabin crew has been reached in August 17 on a collective defined contribution scheme. The impact on the Group equity and related P&L non-current (and non-cash) expense amounts 311 million euros (net of tax EUR 233 million euros) in Q3 2017
Continued reduction in leverage The reserved capital increase allowing Delta and China Eastern to acquire 10% of Air France-KLM has been completed per October 2017 for an amount of 751 million euros. The exercise by Air France-KLM of the soft call of the OCEANE 2023 will lead to a further debt reduction up to 520 million euros per 15 November 2017. With these operations, Air France-KLM will continue the deleveraging of the Group.
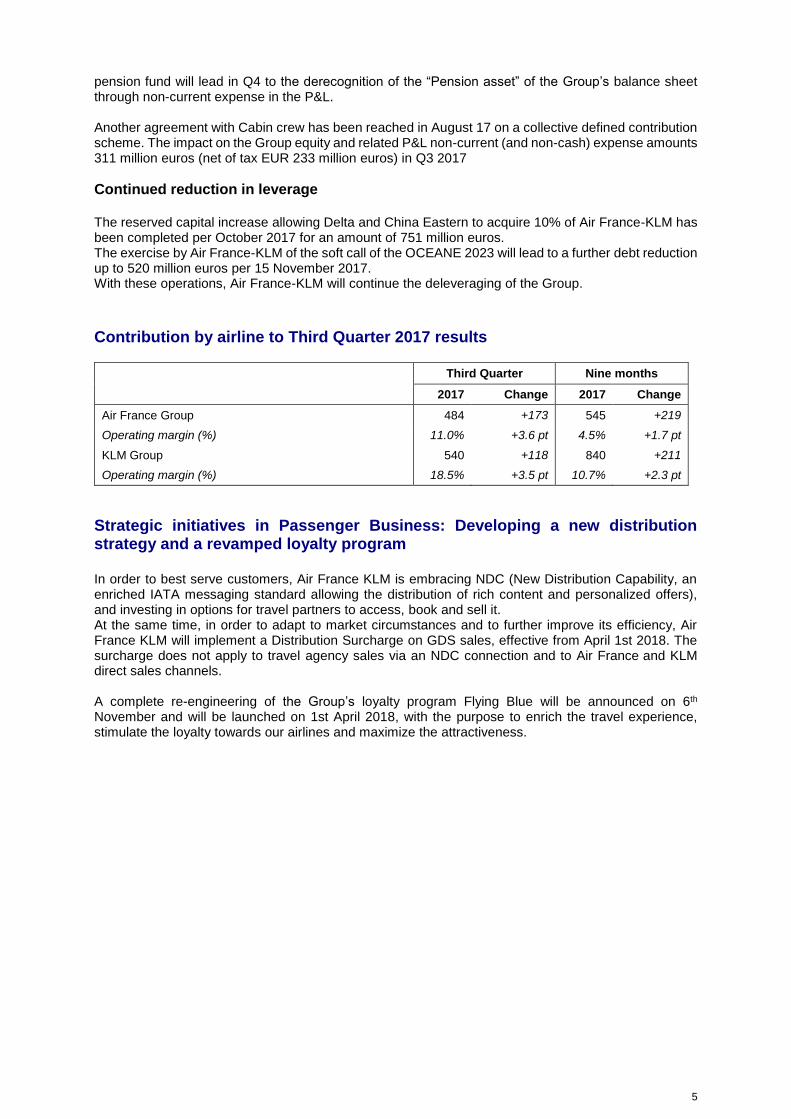
Contribution by airline to Third Quarter 2017 results
Third Quarter Nine months
2017 Change 2017 Change
Air France Group 484 +173 545 +219
Operating margin (%) 11.0% +3.6 pt 4.5% +1.7 pt
KLM Group 540 +118 840 +211
Operating margin (%) 18.5% +3.5 pt 10.7% +2.3 pt
Strategic initiatives in Passenger Business: Developing a new distribution strategy and a revamped loyalty program In order to best serve customers, Air France KLM is embracing NDC (New Distribution Capability, an enriched IATA messaging standard allowing the distribution of rich content and personalized offers), and investing in options for travel partners to access, book and sell it. At the same time, in order to adapt to market circumstances and to further improve its efficiency, Air France KLM will implement a Distribution Surcharge on GDS sales, effective from April 1st 2018. The surcharge does not apply to travel agency sales via an NDC connection and to Air France and KLM direct sales channels. A complete re-engineering of the Group’s loyalty program Flying Blue will be announced on 6th November and will be launched on 1st April 2018, with the purpose to enrich the travel experience, stimulate the loyalty towards our airlines and maximize the attractiveness.
6
Outlook The global context remains highly uncertain regarding the geopolitical environment in which we operate and regarding fuel prices. In a context of dynamic demand, the capacity growth in Q4 2017 will be 3 to 4% for Passenger network and 6 to 7% for Transavia. For the passenger network, the long haul forward bookings for the coming four months stand above last year’s levels and, based on the current outlook, the variation in unit revenue is expected to be positive in Q4 2017 compared to the previous year. The fuel bill in euros is expected to be stable in Q4 2017 compared to 2016. In 2018, it is expected to be stable in euros and up 300 million dollars compared to 20171. The Group is pursuing its initiatives to reduce unit costs. For full year 2017, unit cost evolution at constant currency, fuel and pension charges is expected slightly negative, and between -1.0 to -1.5% excluding load factor and profit sharing effects. The Group is continuing to improve its financial structure. The operating free cash flow 2017 is expected above last year, with a capex at 2.2 billion euros. With the reserved capital increase and the conversion of the OCEANE, the adjusted net debt to EBITDAR is expected between 2.2x and 2.3x at the end of the year (before the acquisition in 2018 of a 31% stake in Virgin Atlantic). In 2018, the early implementation of IFRS 16 is expected, in a first assessment, to result in a consequential reduction of net debt of at least 1.5 billion euros compared to adjusted net debt (based on 31st December 2016 figures). These initiatives show that Air France-KLM is resolutely committed to implementing Trust Together strategic priorities, by regaining the offensive and improving competitiveness.
***** The Third Quarter 2017 accounts are not audited by the Statutory Auditors. The results presentation is available at www.airfranceklm.com on 3rd of November 2017 from 7:15 am CET. A conference call will be hosted by Mr Gagey (CFO) on 3rd of November 2017 at 8:30am CET. To connect to the conference call, please dial:
France: +33 (0)1 76 77 25 06
Netherlands: +31 (0) 20 703 8261
UK: +44 (0)330 336 9411
US: +1 719 325 4787 Confirmation code: 7819012
To listen to the audio-replay of the conference call, please dial:
France: +33 (0) 1 70 48 00 94
Netherlands: +31 (0) 20 721 8903
UK: +44 (0) 207 984 7568
US: +1 719-457-0820 Confirmation code: 7819012 Investor Relations Press Marie-Agnès de Peslouan Wouter van Beek +33 1 49 89 52 59 +33 1 49 89 52 60 +33 1 41 56 56 00 [email protected] [email protected]
1 Based on the current forward at October 30th 2017 and assuming a €/$ at 1.18 for October-December 2017
7
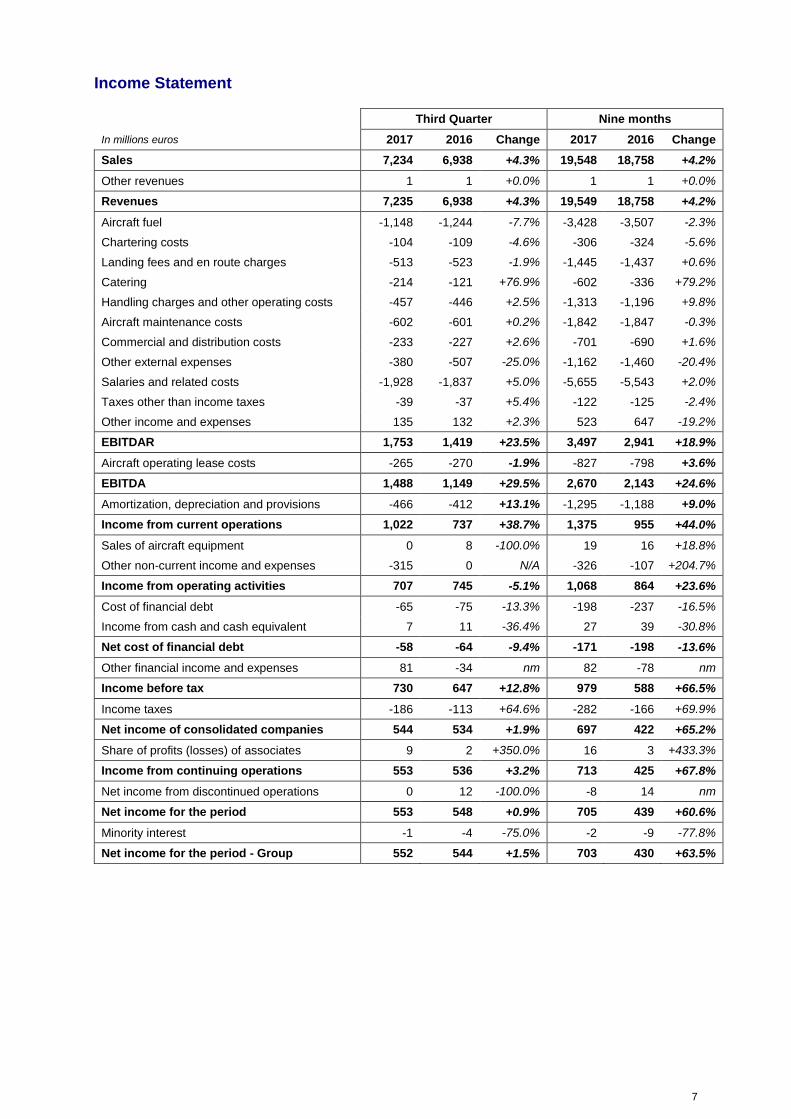
Income Statement
Third Quarter Nine months
In millions euros 2017 2016 Change 2017 2016 Change
Sales 7,234 6,938 +4.3% 19,548 18,758 +4.2%
Other revenues 1 1 +0.0% 1 1 +0.0%
Revenues 7,235 6,938 +4.3% 19,549 18,758 +4.2%
Aircraft fuel -1,148 -1,244 -7.7% -3,428 -3,507 -2.3%
Chartering costs -104 -109 -4.6% -306 -324 -5.6%
Landing fees and en route charges -513 -523 -1.9% -1,445 -1,437 +0.6%
Catering -214 -121 +76.9% -602 -336 +79.2%
Handling charges and other operating costs -457 -446 +2.5% -1,313 -1,196 +9.8%
Aircraft maintenance costs -602 -601 +0.2% -1,842 -1,847 -0.3%
Commercial and distribution costs -233 -227 +2.6% -701 -690 +1.6%
Other external expenses -380 -507 -25.0% -1,162 -1,460 -20.4%
Salaries and related costs -1,928 -1,837 +5.0% -5,655 -5,543 +2.0%
Taxes other than income taxes -39 -37 +5.4% -122 -125 -2.4%
Other income and expenses 135 132 +2.3% 523 647 -19.2%
EBITDAR 1,753 1,419 +23.5% 3,497 2,941 +18.9%
Aircraft operating lease costs -265 -270 -1.9% -827 -798 +3.6%
EBITDA 1,488 1,149 +29.5% 2,670 2,143 +24.6%
Amortization, depreciation and provisions -466 -412 +13.1% -1,295 -1,188 +9.0%
Income from current operations 1,022 737 +38.7% 1,375 955 +44.0%
Sales of aircraft equipment 0 8 -100.0% 19 16 +18.8%
Other non-current income and expenses -315 0 N/A -326 -107 +204.7%
Income from operating activities 707 745 -5.1% 1,068 864 +23.6%
Cost of financial debt -65 -75 -13.3% -198 -237 -16.5%
Income from cash and cash equivalent 7 11 -36.4% 27 39 -30.8%
Net cost of financial debt -58 -64 -9.4% -171 -198 -13.6%
Other financial income and expenses 81 -34 nm 82 -78 nm
Income before tax 730 647 +12.8% 979 588 +66.5%
Income taxes -186 -113 +64.6% -282 -166 +69.9%
Net income of consolidated companies 544 534 +1.9% 697 422 +65.2%
Share of profits (losses) of associates 9 2 +350.0% 16 3 +433.3%
Income from continuing operations 553 536 +3.2% 713 425 +67.8%
Net income from discontinued operations 0 12 -100.0% -8 14 nm
Net income for the period 553 548 +0.9% 705 439 +60.6%
Minority interest -1 -4 -75.0% -2 -9 -77.8%
Net income for the period - Group 552 544 +1.5% 703 430 +63.5%
8
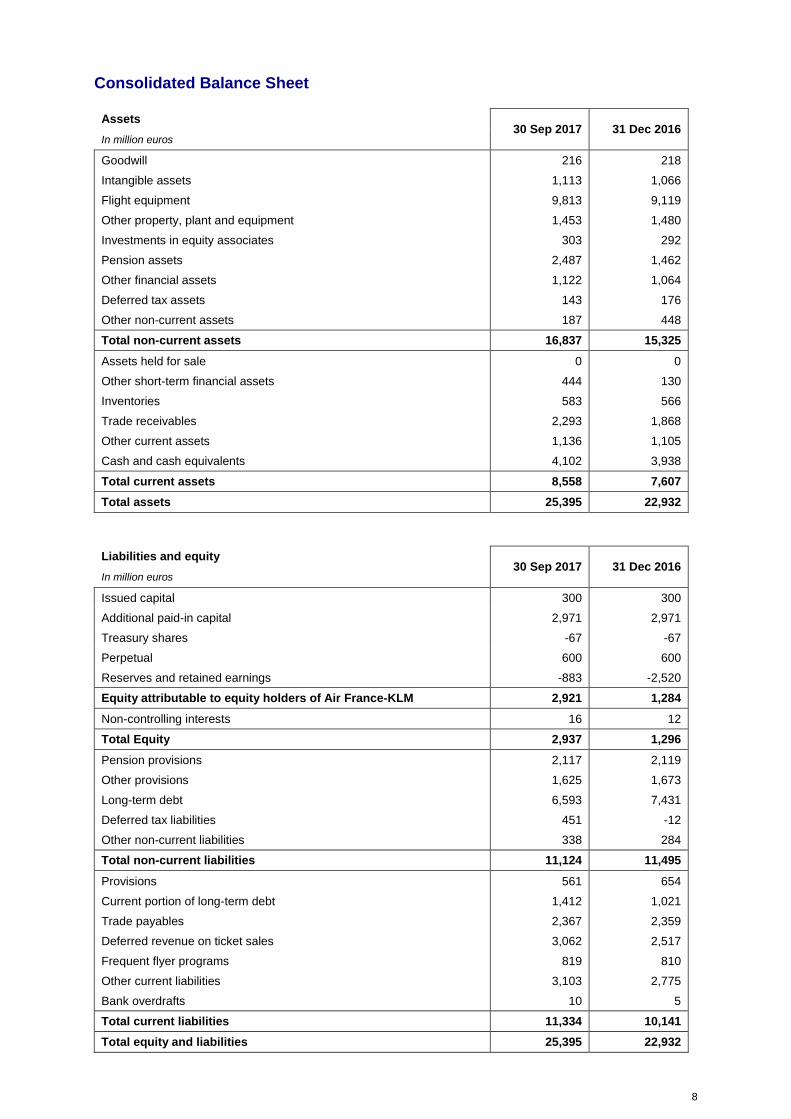
Consolidated Balance Sheet
Assets 30 Sep 2017 31 Dec 2016
In million euros
Goodwill 216 218
Intangible assets 1,113 1,066
Flight equipment 9,813 9,119
Other property, plant and equipment 1,453 1,480
Investments in equity associates 303 292
Pension assets 2,487 1,462
Other financial assets 1,122 1,064
Deferred tax assets 143 176
Other non-current assets 187 448
Total non-current assets 16,837 15,325
Assets held for sale 0 0
Other short-term financial assets 444 130
Inventories 583 566
Trade receivables 2,293 1,868
Other current assets 1,136 1,105
Cash and cash equivalents 4,102 3,938
Total current assets 8,558 7,607
Total assets 25,395 22,932
Liabilities and equity 30 Sep 2017 31 Dec 2016
In million euros
Issued capital 300 300
Additional paid-in capital 2,971 2,971
Treasury shares -67 -67
Perpetual 600 600
Reserves and retained earnings -883 -2,520
Equity attributable to equity holders of Air France-KLM 2,921 1,284
Non-controlling interests 16 12
Total Equity 2,937 1,296
Pension provisions 2,117 2,119
Other provisions 1,625 1,673
Long-term debt 6,593 7,431
Deferred tax liabilities 451 -12
Other non-current liabilities 338 284
Total non-current liabilities 11,124 11,495
Provisions 561 654
Current portion of long-term debt 1,412 1,021
Trade payables 2,367 2,359
Deferred revenue on ticket sales 3,062 2,517
Frequent flyer programs 819 810
Other current liabilities 3,103 2,775
Bank overdrafts 10 5
Total current liabilities 11,334 10,141
Total equity and liabilities 25,395 22,932
9
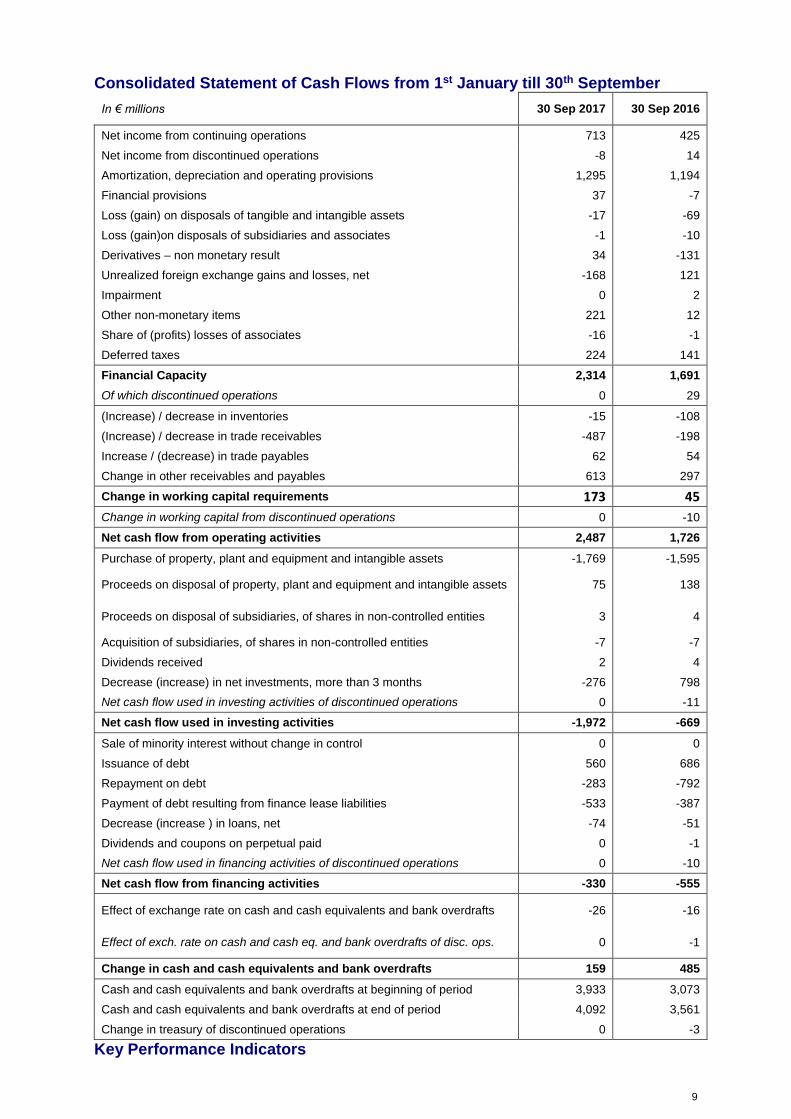
Consolidated Statement of Cash Flows from 1st January till 30th September
In € millions 30 Sep 2017 30 Sep 2016
Net income from continuing operations 713 425
Net income from discontinued operations -8 14
Amortization, depreciation and operating provisions 1,295 1,194
Financial provisions 37 -7
Loss (gain) on disposals of tangible and intangible assets -17 -69
Loss (gain)on disposals of subsidiaries and associates -1 -10
Derivatives – non monetary result 34 -131
Unrealized foreign exchange gains and losses, net -168 121
Impairment 0 2
Other non-monetary items 221 12
Share of (profits) losses of associates -16 -1
Deferred taxes 224 141
Financial Capacity 2,314 1,691
Of which discontinued operations 0 29
(Increase) / decrease in inventories -15 -108
(Increase) / decrease in trade receivables -487 -198
Increase / (decrease) in trade payables 62 54
Change in other receivables and payables 613 297
Change in working capital requirements 173 45
Change in working capital from discontinued operations 0 -10
Net cash flow from operating activities 2,487 1,726
Purchase of property, plant and equipment and intangible assets -1,769 -1,595
Proceeds on disposal of property, plant and equipment and intangible assets 75 138
Proceeds on disposal of subsidiaries, of shares in non-controlled entities 3 4
Acquisition of subsidiaries, of shares in non-controlled entities -7 -7
Dividends received 2 4
Decrease (increase) in net investments, more than 3 months -276 798
Net cash flow used in investing activities of discontinued operations 0 -11
Net cash flow used in investing activities -1,972 -669
Sale of minority interest without change in control 0 0
Issuance of debt 560 686
Repayment on debt -283 -792
Payment of debt resulting from finance lease liabilities -533 -387
Decrease (increase ) in loans, net -74 -51
Dividends and coupons on perpetual paid 0 -1
Net cash flow used in financing activities of discontinued operations 0 -10
Net cash flow from financing activities -330 -555
Effect of exchange rate on cash and cash equivalents and bank overdrafts -26 -16
Effect of exch. rate on cash and cash eq. and bank overdrafts of disc. ops. 0 -1
Change in cash and cash equivalents and bank overdrafts 159 485
Cash and cash equivalents and bank overdrafts at beginning of period 3,933 3,073
Cash and cash equivalents and bank overdrafts at end of period 4,092 3,561
Change in treasury of discontinued operations 0 -3
Key Performance Indicators
10
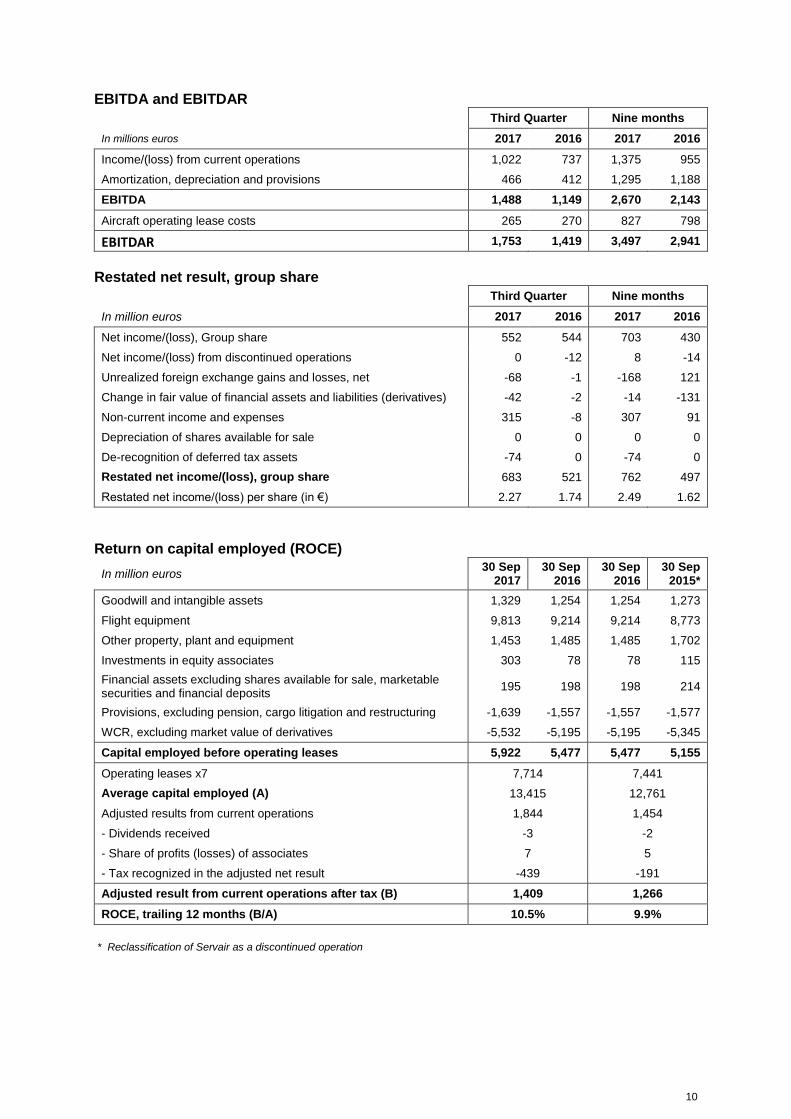
EBITDA and EBITDAR Third Quarter Nine months
In millions euros 2017 2016 2017 2016
Income/(loss) from current operations 1,022 737 1,375 955
Amortization, depreciation and provisions 466 412 1,295 1,188
EBITDA 1,488 1,149 2,670 2,143
Aircraft operating lease costs 265 270 827 798
EBITDAR 1,753 1,419 3,497 2,941
Restated net result, group share
Third Quarter Nine months
In million euros 2017 2016 2017 2016
Net income/(loss), Group share 552 544 703 430
Net income/(loss) from discontinued operations 0 -12 8 -14
Unrealized foreign exchange gains and losses, net -68 -1 -168 121
Change in fair value of financial assets and liabilities (derivatives) -42 -2 -14 -131
Non-current income and expenses 315 -8 307 91
Depreciation of shares available for sale 0 0 0 0
De-recognition of deferred tax assets -74 0 -74 0
Restated net income/(loss), group share 683 521 762 497
Restated net income/(loss) per share (in €) 2.27 1.74 2.49 1.62
Return on capital employed (ROCE)
In million euros 30 Sep
2017 30 Sep
2016 30 Sep
2016 30 Sep
2015*
Goodwill and intangible assets 1,329 1,254 1,254 1,273
Flight equipment 9,813 9,214 9,214 8,773
Other property, plant and equipment 1,453 1,485 1,485 1,702
Investments in equity associates 303 78 78 115
Financial assets excluding shares available for sale, marketable securities and financial deposits
195 198 198 214
Provisions, excluding pension, cargo litigation and restructuring -1,639 -1,557 -1,557 -1,577
WCR, excluding market value of derivatives -5,532 -5,195 -5,195 -5,345
Capital employed before operating leases 5,922 5,477 5,477 5,155
Operating leases x7 7,714 7,441
Average capital employed (A) 13,415 12,761
Adjusted results from current operations 1,844 1,454
- Dividends received -3 -2
- Share of profits (losses) of associates 7 5
- Tax recognized in the adjusted net result -439 -191
Adjusted result from current operations after tax (B) 1,409 1,266
ROCE, trailing 12 months (B/A) 10.5% 9.9%
* Reclassification of Servair as a discontinued operation
11
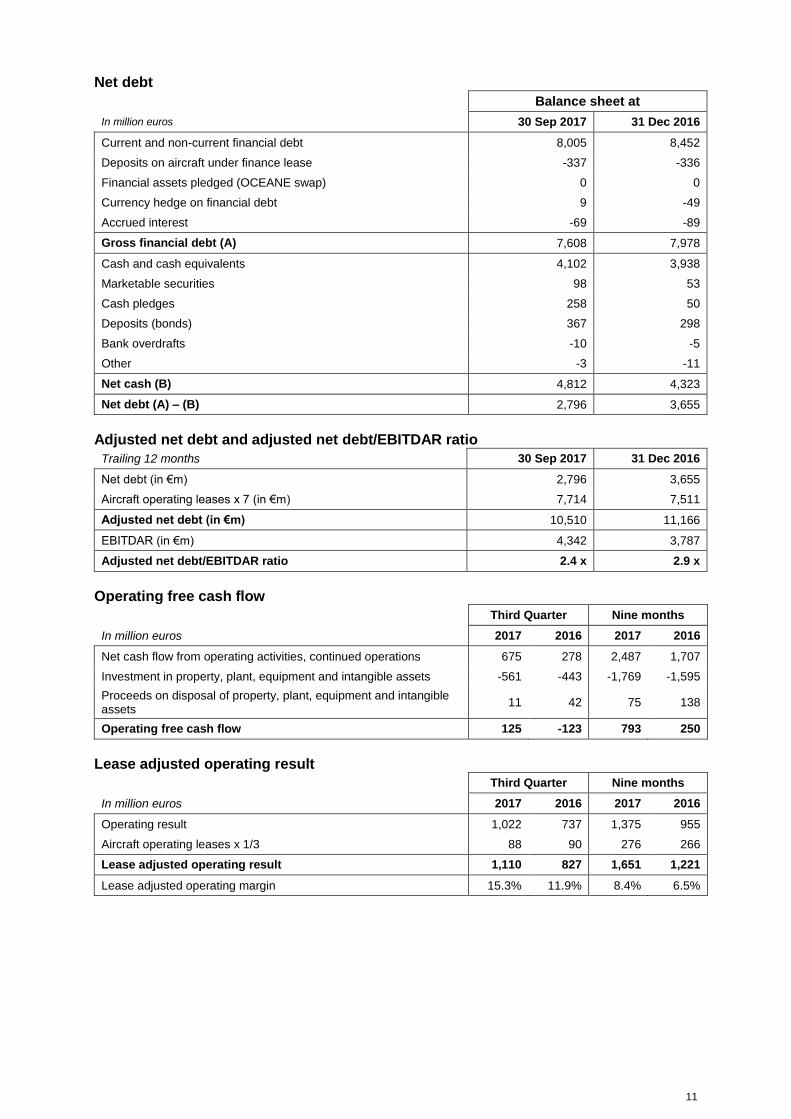
Net debt
Balance sheet at
In million euros 30 Sep 2017 31 Dec 2016
Current and non-current financial debt 8,005 8,452
Deposits on aircraft under finance lease -337 -336
Financial assets pledged (OCEANE swap) 0 0
Currency hedge on financial debt 9 -49
Accrued interest -69 -89
Gross financial debt (A) 7,608 7,978
Cash and cash equivalents 4,102 3,938
Marketable securities 98 53
Cash pledges 258 50
Deposits (bonds) 367 298
Bank overdrafts -10 -5
Other -3 -11
Net cash (B) 4,812 4,323
Net debt (A) – (B) 2,796 3,655
Adjusted net debt and adjusted net debt/EBITDAR ratio
Trailing 12 months 30 Sep 2017 31 Dec 2016
Net debt (in €m) 2,796 3,655
Aircraft operating leases x 7 (in €m) 7,714 7,511
Adjusted net debt (in €m) 10,510 11,166
EBITDAR (in €m) 4,342 3,787
Adjusted net debt/EBITDAR ratio 2.4 x 2.9 x
Operating free cash flow
Third Quarter Nine months
In million euros 2017 2016 2017 2016
Net cash flow from operating activities, continued operations 675 278 2,487 1,707
Investment in property, plant, equipment and intangible assets -561 -443 -1,769 -1,595
Proceeds on disposal of property, plant, equipment and intangible assets
11 42 75 138
Operating free cash flow 125 -123 793 250
Lease adjusted operating result
Third Quarter Nine months
In million euros 2017 2016 2017 2016
Operating result 1,022 737 1,375 955
Aircraft operating leases x 1/3 88 90 276 266
Lease adjusted operating result 1,110 827 1,651 1,221
Lease adjusted operating margin 15.3% 11.9% 8.4% 6.5%
12
Unit cost: net cost per EASK
Third Quarter Nine months
2017 2016 2017 2016
Revenues (in €m) 7,235 6,938 19,549 18,758
Income/(loss) from current operations (in €m) -1,022 -737 -1,375 -955
Total operating expense (in €m) 6,213 6,201 18,174 17,803
Passenger network business – other revenues (in €m) -200 -227 -581 -633
Cargo business – other revenues (in €m) -38 -40 -113 -119
Third-party revenues in the maintenance business (in €m) -462 -482 -1,362 -1,348
Transavia - other revenues (in €m) 0 0 -9 -8
Third-party revenues of other businesses (in €m) -12 -9 -31 -31
Net cost (in €m) 5,501 5,443 16,078 15,664
Capacity produced, reported in EASK* 95,844 94,081 265,744 257,760
Net cost per EASK (in € cents per EASK) 5.74 5.79 6.05 6.08
Gross change -0.8% -0.4%
Currency effect on net costs (in €m) -15 153
Change at constant currency -0.5% -1.4%
Fuel price effect (in €m) -61 -154
Change on a constant currency and fuel price basis 0.6% -0.5%
Change in pension-related expenses (in €m) 2 -7
Net cost per EASK on a constant currency, fuel price and pension-related expenses basis (in € cents per EASK)
5.74 5.71 6.05 6.07
Change on a constant currency, fuel price and pension-related expenses basis
+0.6% -0.4%
* The capacity produced by the transportation activities is combined by adding the capacity of the Passenger network (in ASK) to that of Transavia (in ASK) and the Cargo business (in ATK) converted into EASK based on a separate fixed factor for Air France and for KLM..
Individual airline results Air France
Third Quarter Nine months
2017 Change 2017 Change
Revenue (in €m) 4,417 +5.1% 11,989 +3.5%
EBITDA (in €m) 806 +217 1,395 +274
Operating result (en m€) 484 +173 545 +219
Operating margin (%) 11.0% +3.6 pt 4.5% +1.7 pt
Operating cash flow before WCR and restructuring cash out (in €m) 756 +236 1,271 +236
Operating cash flow (before WCR and restructuring) margin 17.1% +4.7 pt 10.6% +1.7 pt
KLM
Third Quarter Nine months
2017 Change 2017 Change
Revenue (in €m) 2,924 +3.5% 7,831 +5.4%
EBITDA (in €m) 681 +128 1,269 +257
Operating result (en m€) 540 +118 840 +211
Operating margin (%) 18.5% +3.5 pt 10.7% +2.3 pt
Operating cash flow before WCR and restructuring cash out (in €m) 645 +141 1,173 +285
Operating cash flow (before WCR and restructuring) margin 22.1% +4.2 pt 15.0% +3.0 pt
NB: Sum of individual airline results does not add up to Air France-KLM total due to intercompany eliminations at Group level
13
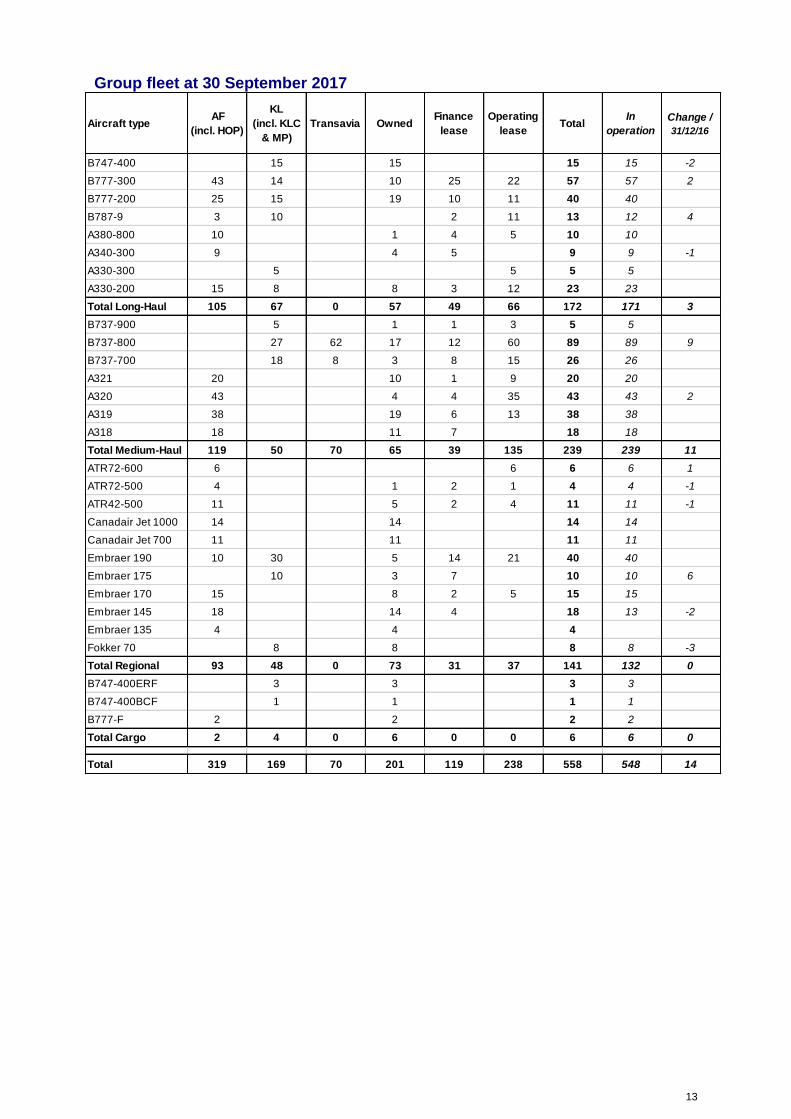
Group fleet at 30 September 2017
Aircraft typeAF
(incl. HOP)
KL
(incl. KLC
& MP)
Transavia OwnedFinance
lease
Operating
leaseTotal
In
operation
Change /
31/12/16
B747-400 15 15 15 15 -2
B777-300 43 14 10 25 22 57 57 2
B777-200 25 15 19 10 11 40 40
B787-9 3 10 2 11 13 12 4
A380-800 10 1 4 5 10 10
A340-300 9 4 5 9 9 -1
A330-300 5 5 5 5
A330-200 15 8 8 3 12 23 23
Total Long-Haul 105 67 0 57 49 66 172 171 3
B737-900 5 1 1 3 5 5
B737-800 27 62 17 12 60 89 89 9
B737-700 18 8 3 8 15 26 26
A321 20 10 1 9 20 20
A320 43 4 4 35 43 43 2
A319 38 19 6 13 38 38
A318 18 11 7 18 18
Total Medium-Haul 119 50 70 65 39 135 239 239 11
ATR72-600 6 6 6 6 1
ATR72-500 4 1 2 1 4 4 -1
ATR42-500 11 5 2 4 11 11 -1
Canadair Jet 1000 14 14 14 14
Canadair Jet 700 11 11 11 11
Embraer 190 10 30 5 14 21 40 40
Embraer 175 10 3 7 10 10 6
Embraer 170 15 8 2 5 15 15
Embraer 145 18 14 4 18 13 -2
Embraer 135 4 4 4
Fokker 70 8 8 8 8 -3
Total Regional 93 48 0 73 31 37 141 132 0
B747-400ERF 3 3 3 3
B747-400BCF 1 1 1 1
B777-F 2 2 2 2
Total Cargo 2 4 0 6 0 0 6 6 0
Total 319 169 70 201 119 238 558 548 14