Embed Size (px)
Citation preview

1
Management Discussion and Analysis for the third quarter ended September 30, 2017
Third Quarter 2017 Results October 26, 2017
www.oceanagold.com

Management Discussion and Analysis for the third quarter ended September 30, 2017
2
CAUTIONARY STATEMENT REGARDING FORWARD-LOOKING INFORMATION IN MANAGEMENT DISCUSSION & ANALYSIS
This Management Discussion & Analysis contains “forward-looking statements and information” within the meaning of applicable securities laws which may include, but is not limited to, statements with respect to the future financial and operating performance of the Company, its subsidiaries and affiliated companies, its mining projects, the future price of gold, the estimation of mineral reserves and mineral resources, the realisation of mineral reserve and resource estimates, costs of production, estimates of initial capital, sustaining capital, operating and exploration expenditures, costs and timing of the development of new deposits, costs and timing of the development of new mines, costs and timing of future exploration and drilling programs, timing of filing of updated technical information, anticipated production amounts, requirements for additional capital, governmental regulation of mining operations and exploration operations, timing and receipt of approvals, consents and permits under applicable mineral legislation, environmental risks, title disputes or claims, limitations of insurance coverage and the timing and possible outcome of pending litigation and regulatory matters. Often, but not always, forward-looking statements and information can be identified by the use of words such as “may”, “plans”, “expects”, “projects”, “is expected”, “budget”, “scheduled”, “potential”, “estimates”, “forecasts”, “intends”, “targets”, “aims”, “anticipates” or “believes” or variations (including negative variations) of such words and phrases, or may be identified by statements to the effect that certain actions, events or results “may”, “could”, “would”, “should”, “might” or “will” be taken, occur or be achieved. Forward-looking statements and information involve known and unknown risks, uncertainties and other factors which may cause the actual results, performance or achievements of the Company and/or its subsidiaries and/or its affiliated companies to be materially different from any future results, performance or achievements expressed or implied by the forward-looking statements. Such factors include, among others, future prices of gold; general business, economic and market factors (including changes in global, national or regional financial, credit, currency or securities markets), changes or developments in global, national or regional political and social conditions; changes in laws (including tax laws) and changes in GAAP or regulatory accounting requirements; the actual results of current production, development and/or exploration activities; conclusions of economic evaluations and studies; fluctuations in the value of the United States dollar relative to the Canadian dollar, the Australian dollar, the Philippines Peso or the New Zealand dollar; changes in project parameters as plans continue to be refined; possible variations of ore grade or recovery rates; failure of plant, equipment or processes to operate as anticipated; accidents, labour disputes and other risks of the mining industry; political instability or insurrection or war; labour force availability and turnover; adverse judicial decisions, delays in obtaining financing or governmental approvals or in the completion of development or construction activities or in the commencement of operations; as well as those factors discussed in the section entitled “Risk Factors” contained in the Company’s Annual Information Form in respect of its fiscal year-ended December 31, 2016, which is available on SEDAR at www.sedar.com under the Company’s name. Although the Company has attempted to identify important factors that could cause actual actions, events or results to differ materially from those described in forward-looking statements and information, there may be other factors that cause actual results, performance, achievements or events to differ from those anticipated, estimated or intended. Also, many of the factors are outside or beyond the control of the Company, its officers, employees, agents or associates. Forward-looking statements and information contained herein are made as of the date of this Management Discussion & Analysis and, subject to applicable securities laws, the Company disclaims any obligation to update any forward-looking statements and information, whether as a result of new information, future events or results or otherwise. There can be no assurance that forward-looking statements and information will prove to be accurate, as actual results and future events could differ materially from those anticipated in such statements. Accordingly, readers should not place undue reliance on forward-looking statements and information due to the inherent uncertainty therein. All forward-looking statements and information made herein are qualified by this cautionary statement. This Management Discussion & Analysis may use the terms “Measured”, “Indicated” and “Inferred” Resources. U.S. investors are advised that while such terms are recognised and required by Canadian regulations, the Securities and Exchange Commission does not recognise them. “Inferred Resources” have a great amount of uncertainty as to their existence and as to their economic and legal feasibility. It cannot be assumed that all or any part of an Inferred Resources will ever be upgraded to a higher category. Under Canadian rules, estimates of Inferred Resources may not form the basis of feasibility or other economic studies. U.S. investors are cautioned not to assume that all or any part of Measured or Indicated Resources will ever be converted into reserves. U.S. investors are also cautioned not to assume that all or any part of an Inferred Resource exists, or is economically or legally mineable. This document does not constitute an offer of securities for sale in the United States or to any person that is, or is acting for the account or benefit of, any U.S. person (as defined in Regulation S under the United States Securities Act of 1933, as amended (the “Securities Act”)) (“U.S. Person”), or in any other jurisdiction in which such an offer would be unlawful.
Technical Disclosure
For further scientific and technical information (including disclosure regarding mineral resources and mineral reserves) relating to the Haile Project, the Waihi mine, the Macraes mine and the Didipio mine please refer to the NI 43-101 compliant technical reports available at sedar.com under the Company’s name.
The exploration results were prepared in accordance with the standards set out in the 2012 Edition of the ‘Australasian Code for Reporting of Exploration Results, Mineral Resources and Ore Reserves’ (“JORC Code”) and in accordance with National Instrument 43-101 – Standards of Disclosure for Mineral Projects of the Canadian Securities Administrators (“NI 43-101”). The JORC Code is the accepted reporting standard for the Australian Stock Exchange Limited (“ASX”). Information relating to Waihi exploration results in this document has been verified by, is based on and fairly represents information compiled by or prepared under the supervision of Lorrance Torckler, a Fellow of the Australasian Institute of Mining and Metallurgy and an employee of OceanaGold. Mr Torckler has sufficient experience that is relevant to the style of mineralisation and type of deposit under consideration and to the activity being undertaken to qualify as a Competent Person as defined in the JORC Code and is a Qualified Persons for the purposes of the NI 43 101. Mr Torckler consents to the inclusion in this public report of the matters based on their information in the form and context in which it appears

3
Management Discussion and Analysis for the third quarter ended September 30, 2017
HIGHLIGHTS
Consolidated production of 408,394 ounces of gold and 14,664 tonnes of copper in the nine months ended 30 September 2017, including 136,043 ounces of gold and 4,387 tonnes of copper in the third quarter.
Consolidated year-to-date All-In Sustaining Cost of $644 per ounce on sales of 326,778 ounces of gold (excluding Haile) and 13,249 tonnes of copper.
Consolidated third quarter All-In Sustaining Cost of $748 per ounce on sales of 98,565 ounces of gold (excluding Haile) and 3,273 tonnes of copper.
Recorded revenue of $478.3 million with EBITDA of $259.8 million and a net profit of $83.1 million in the first nine months of 2017 including revenue of $144.8 million with an EBITDA of $73.4 million and a net profit of $21.7 million in the third quarter.
Declared a semi-annual dividend of $0.01 per common share or CDI to shareholders, payable on 22 December 2017.
Immediate liquidity of $118.4 million including $61.2 million in cash. In addition $69.9 million of marketable securities were held in strategic investments.
Initial gold intercepts beneath the open pit at Waihi have been significant and include 18.1m @ 7.9g/t (true width) and 11.1m @ 8.1g/t (true width).
Subsequent to the quarter end, declared commercial production at the Haile Gold Mine, effective 1 October 2017.
Notes:
All statistics are compared to the preceding quarter unless otherwise stated.
The Company’s presentation currency is USD and all numbers in this document are expressed in USD unless otherwise stated.
Cash Costs, All-In Sustaining Costs, All-In Sustaining Margin, EBITDA (Earnings before interest, taxes, depreciation and amortisation, excluding gain/(loss) on undesignated hedges) and liquidity are non-GAAP measures. Refer to page 28 for explanation of non-GAAP measures.
All-In Sustaining Costs are reported net of by-product credits unless otherwise stated.
All-In Sustaining Costs are based on the methodology outlined by the World Gold Council. Capital costs associated with expansionary growth are excluded from this calculation.
In the first nine months of 2017 in the Management Discussion and Analysis (“MD&A”), all revenue and costs reported exclude the Haile operations. The revenue and costs associated with the Haile Gold Mine have been capitalised and will be reported in the Consolidated Statement of Comprehensive Income following the declaration of commercial production (effective from October 1, 2017).

Management Discussion and Analysis for the third quarter ended September 30, 2017
4
Operating Results
On a consolidated basis, including attributable production from the Haile Gold Mine (“Haile”) the Company has produced 408,394 ounces of gold and 14,664 tonnes of copper, including 136,043 ounces of gold and 4,387 tonnes of copper produced in the third quarter.
Total gold production in the third quarter increased 9% compared to the previous quarter due to increased production at both Haile and Waihi, which was partly offset by lower production from Macraes and Didipio where lower grade stockpiled ore was processed.
On a consolidated basis for the first nine months and excluding Haile gold sales, the Company recorded an AISC of $644 per ounce on sales of 326,778 ounces of gold. For the third quarter and excluding Haile gold sales, the Company recorded an AISC of $748 per ounce on sales of 98,565 ounces of gold. The quarter-on-quarter increase in AISC was attributable to lower volume of sales on reduced grade at Didipio, and a higher proportion of production from New Zealand operations.
Financial Results
Year-to-date, the Company reported revenue of $478.3 million and EBITDA of $259.8 million with a net profit of $83.1 million. For the third quarter, the Company reported revenue of $144.8 million and quarterly EBITDA of $73.4 million with a net profit of $21.7 million. Third quarter revenue was impacted by timing delays in quarter end concentrate and dore shipments from Didipio. This included 5,925 ounces of dore scheduled for shipment in late September delayed until the first week of October.
At the end of the third quarter, the cash balance was $61.2 million while total available liquidity was $118.4 million. In addition $69.9 million of marketable securities were held as strategic investments. In the quarter, the Company repaid $15.3 million in debt including $12.0 million of its credit facilities. As at September 30, 2017, the Company’s total facilities stood at $330 million, of which $272.8 million was drawn.
Growth
Subsequent to the quarter end, the Company announced that the Haile operation had achieved commercial production effective October 1, 2017. In the third quarter, the Company implemented changes to the Haile process plant to address the commissioning issues encountered in the second quarter. These changes were predominately completed in July and early August.
With the changes completed, the Haile process plant stabilised resulting in increasing throughput rates and improved recoveries in August and September.
In the third quarter, the Haile operation produced 31,374 ounces of gold, which was a 94% increase on the second quarter’s production. Throughput increased by 12%, while recoveries improved from 62% in the second quarter to 77% in the third quarter. Head grade through the process plant was in line with expectations, up from 2.0 g/t in the second quarter to 2.8 g/t in the third quarter.
Exploration activities at Haile were mainly focused on infill and step-out drilling at Ledbetter, Mustang and Mill Zone while the Company completed initial drilling at Snakeshoe.
At Didipio, development of the underground mine continued to progress to plan with a focus on installation of the underground pumping station, which will allow for access to Panel 1 and stope development. In addition, construction of the paste plant continued as planned, the surface shotcrete and concrete batch plant was commissioned and work commenced on the underground telecommunications network.
At Waihi, development of the Martha Project underground drill drives continued to progress to plan with drilling commencing from the initial drill drive. The Company continues to advance the plans associated with the Martha Project. In the third quarter, the Company also commenced drilling at the WKP prospect in the Hauraki region, approximately 10-kilometres north of Waihi.
At Macraes, drilling at Coronation North and Golden Point demonstrated the potential for extensions at both deposits, which remain open.
Dividend
Subsequent to the end of the third quarter, the Board of Directors has declared a second semi-annual dividend of US$0.01 per common share payable to shareholders of record on 8 November 2017. The Dividend will be paid on 22 December 2017 and at the election of the shareholder, the Company will pay the dividend in either US Dollars, Canadian Dollars, Australian Dollars or New Zealand Dollars.
Outlook
Looking ahead, the Company expects to achieve its full year consolidated production guidance with steady production in the fourth quarter. Production is expected to increase at Haile with continued ramp-up and fine-tuning of the Haile process plant while at Macraes, higher grade ore feed from Coronation North will commence in the fourth quarter. At Didipio, as guided production is expected to continue to decrease in the fourth quarter with continued feed from lower grade open pit stockpiles.
OVERVIEW

5
Management Discussion and Analysis for the third quarter ended September 30, 2017
Table 1 – Production and Cost Results Summary
Didipio Waihi Macraes Haile (2) Consolidated
Third Quarter 2017 Results Q3 2017 Q2 2017
Gold Produced Ounces 31,887 35,904 36,878 31,374 136,043 124,396
Copper Produced Tonnes 4,387 - - - 4,387 4,322
Gold Sales Ounces 25,656 36,167 36,742 32,506 131,071(3) 129,750 (3)
Copper Sales Tonnes 3,273 - - - 3,273 5,828
Cash Costs $ per ounce (113) 410 792 - 416 401
All-In Sustaining Costs (1) $ per ounce 137 659 1,262 - 748 681
First Nine Months 2017 (September 30 2017) YTD Sep
30 2017 YTD Sep 30 2016
Gold Produced Ounces 137,534 87,323 115,205 68,332 408,394 314,313
Copper Produced Tonnes 14,664 - - - 14,664 17,358
Gold Sales Ounces 124,308 87,667 114,804 60,267 387,046 (3) 331,489 (3)
Copper Sales Tonnes 13,249 - - - 13,249 16,453
Cash Costs $ per ounce (101) 483 795 - 371 477
All-In Sustaining Costs (1) $ per ounce 40 786 1,188 - 644 730
Notes: 1. In the first nine months of 2017, all revenue and costs reported do not include the Haile operations. These have been capitalised as commercial
production was declared after the end of the third quarter (effective from October 1, 2017). 2. Haile gold mine commenced selling gold in February 2017. Revenue from the sale of gold is treated as pre-production income. 3. Consolidated 2017 gold sales ounces include gold sales from Haile.
Table 2 – Consolidated Financial Summary*
Q3 Sep 30 2017
Q2 Jun 30 2017
Q3 Sep 30 2016
YTD Sep 30 2017
YTD Sep 30 2016
Revenue US$’000 144,849 171,650 150,388 478,299 481,202
Operating Costs US$’000 (71,450) (86,905) (88,820) (218,484) (264,476)
EBITDA US$’000 73,399 84,745 61,568 259,815 216,726
Net Profit before impairment US$’000 21,746 25,357 30,693 100,762 93,879
Net Profit US$’000 21,746 25,357 30,693 83,108 93,879
Ave. Gold Price Received $ per ounce 1,276 1,262 1,290 1,254 1,242
Ave. Copper Price Received $ per pound 2.82 2.45 2.15 2.63 2.15
Notes: *: In the first nine months of 2017, all revenue and costs reported do not include the Haile operations as these have been capitalised as commercial production was declared after the end of the third quarter (effective from October 1, 2017).

Management Discussion and Analysis for the third quarter ended September 30, 2017
6
Table 3 – 2017 Production and Cost Guidance
Didipio Waihi Macraes Haile (1) Consolidated
Gold Production Ounces 150,000 – 160,000 110,000 – 120,000 180,000 – 190,000 110,000 – 130,000 550,000 – 600,000
Copper Production Tonnes 18,000 – 19,000 – – – 18,000 – 19,000
All-In Sustaining Costs (2) $ per ounce $70 – $120 $740 – $790 $950 – $1,000 $600 – $650 $600 – $650
Notes: 1. Production and costs prior to declaration of commercial production will be capitalised as part of mining assets and reflected on the balance sheet. 2. AISC calculation conforms to the methodology outlined by the World Gold Council. It includes all cash costs, corporate G&A, maintenance capital
expenditures, capitalised mining expenditures and exploration. It excludes development capital expenditures such as the development of the Haile Gold Mine and Didipio Underground.
Economic assumptions:
NZD: USD exchange rate of 0.70, Copper price: $2.50 / lb on average for full year.
Table 4 – Capital Expenditure Summary
Didipio Waihi Macraes Haile (1) Consolidated
Third Quarter 2017 Results Q3 2017 Q2 2017
Sustaining Capital US$’000 2,598 1,107 3,202 - 6,907 9,412
Pre-strip and Capitalised Mining
US$’000 - 1,738 10,223 - 11,961 11,624
Exploration US$’000 779 3,992 2,822 2,383 9,976 6,706
Growth Capital US$’000 20,685 1,606 455 36,311 59,057 64,686
Capitalised Revenue US$’000 - - - (35,651) (35,651) (20,286)
Total US$’000 24,062 8,443 16,702 3,043 52,250 72,142
YTD September 30 2017 YTD Sep 30
2017 YTD Sep 30
2016
Sustaining Capital US$’000 6,663 7,027 10,528 - 24,218 35,287
Pre-strip and Capitalised Mining
US$’000 - 4,776 25,384 - 30,160 30,323
Exploration US$’000 1,677 10,039 4,959 6,590 23,265 21,127
Growth Capital US$’000 65,656 1,811 703 117,186 185,356 239,903
Capitalised Revenue US$’000 - - - (67,237) (67,237) -
Total US$’000 73,996 23,653 41,574 56,539 195,762 326,640
Notes: 1. Haile’s capitalised revenue prior to commercial production has been offset against Non-sustaining capital expenditure in the above table.
7
Management Discussion and Analysis for the third quarter ended September 30, 2017
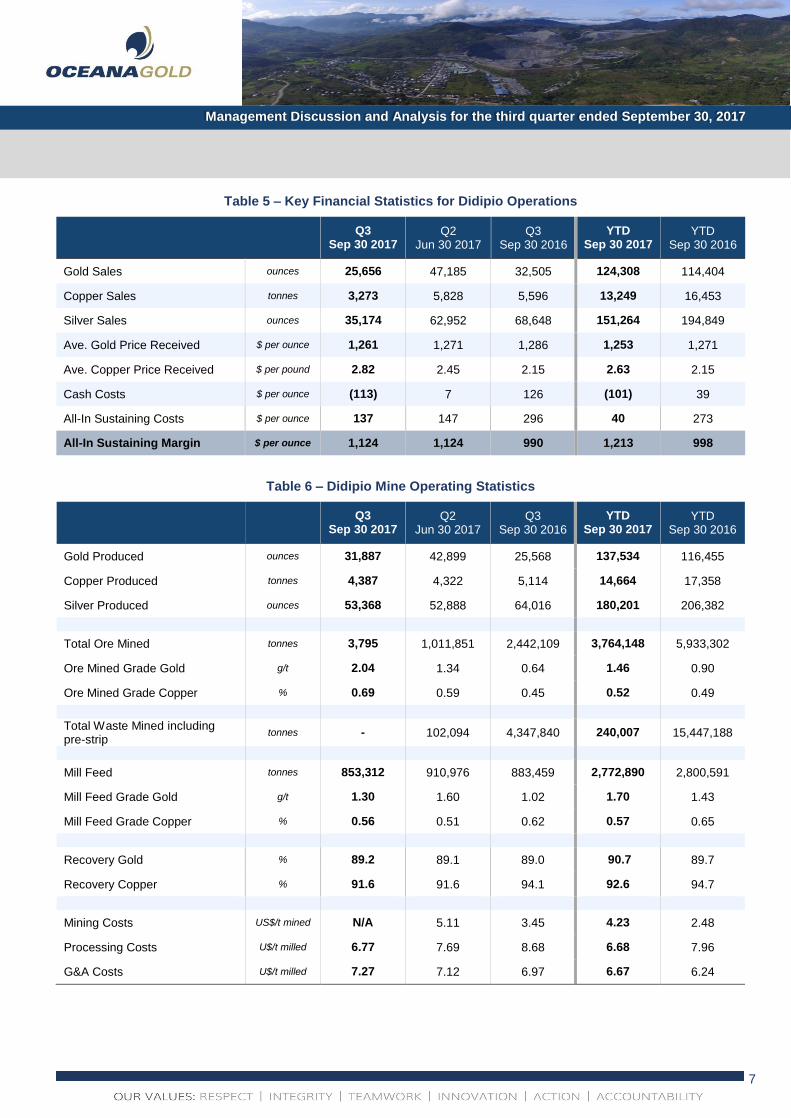
Table 5 – Key Financial Statistics for Didipio Operations
Q3 Sep 30 2017
Q2 Jun 30 2017
Q3 Sep 30 2016
YTD Sep 30 2017
YTD Sep 30 2016
Gold Sales ounces 25,656 47,185 32,505 124,308 114,404
Copper Sales tonnes 3,273 5,828 5,596 13,249 16,453
Silver Sales ounces 35,174 62,952 68,648 151,264 194,849
Ave. Gold Price Received $ per ounce 1,261 1,271 1,286 1,253 1,271
Ave. Copper Price Received $ per pound 2.82 2.45 2.15 2.63 2.15
Cash Costs $ per ounce (113) 7 126 (101) 39
All-In Sustaining Costs $ per ounce 137 147 296 40 273
All-In Sustaining Margin $ per ounce 1,124 1,124 990 1,213 998
Table 6 – Didipio Mine Operating Statistics
Q3 Sep 30 2017
Q2 Jun 30 2017
Q3 Sep 30 2016
YTD Sep 30 2017
YTD Sep 30 2016
Gold Produced ounces 31,887 42,899 25,568 137,534 116,455
Copper Produced tonnes 4,387 4,322 5,114 14,664 17,358
Silver Produced ounces 53,368 52,888 64,016 180,201 206,382
Total Ore Mined tonnes 3,795 1,011,851 2,442,109 3,764,148 5,933,302
Ore Mined Grade Gold g/t 2.04 1.34 0.64 1.46 0.90
Ore Mined Grade Copper % 0.69 0.59 0.45 0.52 0.49
Total Waste Mined including pre-strip
tonnes - 102,094 4,347,840 240,007 15,447,188
Mill Feed tonnes 853,312 910,976 883,459 2,772,890 2,800,591
Mill Feed Grade Gold g/t 1.30 1.60 1.02 1.70 1.43
Mill Feed Grade Copper % 0.56 0.51 0.62 0.57 0.65
Recovery Gold % 89.2 89.1 89.0 90.7 89.7
Recovery Copper % 91.6 91.6 94.1 92.6 94.7
Mining Costs US$/t mined N/A 5.11 3.45 4.23 2.48
Processing Costs U$/t milled 6.77 7.69 8.68 6.68 7.96
G&A Costs U$/t milled 7.27 7.12 6.97 6.67 6.24

Management Discussion and Analysis for the third quarter ended September 30, 2017
8
Table 7 – Key Financial Statistics for Waihi Operations
Q3 Sep 30 2017
Q2 Jun 30 2017
Q3 Sep 30 2016
YTD Sep 30 2017
YTD Sep 30 2016
Gold Sales ounces 36,167 24,743 24,842 87,667 88,504
Ave. Gold Price Received $ per ounce 1,280 1,257 1,335 1,255 1,250
Cash Cost $ per ounce 410 553 461 483 487
All-In Sustaining Costs $ per ounce 659 913 705 786 726
All-In Sustaining Margin $ per ounce 621 344 630 469 524
Table 8 – Waihi Mine Operating Statistics
Q3
Sep 30 2017 Q2
Jun 30 2017 Q3
Sep 30 2016
YTD Sep 30 2017
YTD Sep 30 2016
Gold Produced ounces 35,904 25,559 23,225 87,323 86,748
Total Ore Mined tonnes 127,645 116,969 108,304 354,221 351,319
Ore Mined Grade g/t 9.72 7.48 7.13 8.49 8.17
Total Waste Mined tonnes 100,032 99,119 47,160 282,561 158,440
Mill Feed tonnes 123,647 119,754 110,985 350,722 360,544
Mill Feed Grade g/t 9.77 7.39 7.20 8.50 8.24
Recovery % 92.3 89.8 90.4 91.0 90.7
Mining Costs US$/t mined 45.92 42.11 60.47 44.89 54.01
Processing Costs U$/t milled 28.81 30.26 27.93 29.17 26.97
G&A Costs U$/t milled 20.47 21.19 19.24 21.47 17.80

Management Discussion and Analysis for the third quarter ended September 30, 2017
9
Table 9 – Key Financial Statistics for Macraes and Reefton Operations
Q3
Sep 30 2017 Q2
Jun 30 2017 Q3
Sep 30 2016
YTD Sep 30 2017
YTD Sep 30 2016
Gold Sales ounces 36,742 42,264 40,848 114,804 128,581
Ave. Gold Price Received $ per ounce 1,283 1,255 1,266 1,255 1,212
Cash Cost $ per ounce 792 751 891 795 861
All-In Sustaining Costs $ per ounce 1,262 1,140 1,134 1,188 1,138
All-In Sustaining Margin $ per ounce 21 115 132 67 74
Notes: *: Includes sales from Reefton which entered Care and Maintenance during the first quarter of 2016 and in the fourth quarter the Company announced the
closure of Reefton operations.
Table 10 – Consolidated Operating Statistics for Macraes and Reefton
Q3
Sep 30 2017 Q2
Jun 30 2017 Q3
Sep 30 2016
YTD Sep 30 2017
YTD Sep 30 2016
Gold Produced ounces 36,878 39,778 40,182 115,205 111,110
Total Ore Mined tonnes 1,016,208 1,468,541 1,372,609 3,565,142 3,201,752
Ore Mined Grade g/t 1.24 1.02 1.05 1.12 1.06
Total Waste Mined including pre-strip
tonnes 8,613,683 8,114,666 9,262,496 26,579,088 25,826,594
Mill Feed tonnes 1,485,316 1,508,558 1,469,115 4,369,144 4,591,018
Mill Feed Grade g/t 1.03 1.02 0.99 1.01 0.93
Recovery % 79.2 80.0 86.0 80.8 82.7
Mining Costs (Open Pit) US$/t mined 1.40 1.53 1.18 1.40 1.07
Mining Costs (Underground) US$/t mined 41.01 37.29 38.47 39.01 38.07
Processing Costs U$/t milled 7.71 7.44 7.55 7.58 7.04
G&A Costs U$/t milled 1.61 1.54 1.55 2.17 1.44
Table 11 – Macraes Goldfield Operating Statistics
Q3
Sep 30 2017 Q2
Jun 30 2017 Q3
Sep 30 2016
YTD Sep 30 2017
YTD Sep 30 2016
Gold Produced ounces 36,878 39,778 40,182 115,205 106,633
Total Ore Mined tonnes 1,016,208 1,468,541 1,372,609 3,565,142 3,201,752
Ore Mined Grade g/t 1.24 1.02 1.05 1.12 1.06
Total Waste Mined including pre-strip
tonnes 8,613,683 8,114,666 9,262,496 26,579,088 25,826,594
Mill Feed tonnes 1,485,316 1,508,558 1,469,115 4,369,144 4,389,506
Mill Feed Grade g/t 1.03 1.02 0.99 1.01 0.91
Recovery % 79.2 80.0 86.0 80.8 82.8

Management Discussion and Analysis for the third quarter ended September 30, 2017
10
Table 12 – Haile Pre-Commercial Operating Statistics
Q3
Sep 30 2017 Q2
Jun 30 2017 Q1
Mar 31 2017
YTD Sep 30 2017
Gold Produced ounces 31,374 16,160 20,798 68,332
Total Ore Mined tonnes 625,275 537,670 376,805 1,539,750
Ore Mined Grade g/t 2.08 2.22 1.68 2.04
Total Waste Mined including pre-strip
tonnes 4,475,630 3,513,820 4,583,851 12,573,301
Mill Feed tonnes 456,993 409,251 351,351 1,217,595
Mill Feed Grade g/t 2.76 1.99 2.44 2.48
Recovery % 77.3 61.7 75.6 70.0

Management Discussion and Analysis for the third quarter ended September 30, 2017
11
Summary
On a consolidated basis for the first nine months of 2017, including attributable production from Haile, the Company produced 408,394 ounces of gold and 14,664 tonnes of copper, including 136,043 ounces of gold and 4,387 tonnes of copper produced in the third quarter.
Consolidated gold production increased quarter-on-quarter due to higher production at Haile and Waihi, which was partly offset by lower production from Macraes and Didipio.
On a consolidated basis for the first nine months of 2017 and excluding Haile, the Company recorded AISC of $644 per ounce on sales of 326,778 ounces of gold and 13,249 tonnes of copper. During the third quarter, and excluding Haile, the Company recorded AISC of $748 per ounce on sales of 98,565 ounces of gold and 3,273 tonnes of copper. Quarter-on-quarter AISC were higher due to lower volume of sales on reduced grade at Didipio, and a higher proportion of production from New Zealand operations.
Health & Safety
At the end of the third quarter, the Company recorded a Total Recordable Injury Frequency Rate (“TRIFR”) of 4.16 recordable injuries per million man hours, compared to 3.74 recorded at the end of the second quarter.
The increase is a result of injuries sustained within the projects team at Haile as they undertake manual activities in non-standard work areas.
The Company continues to focus on the two key aspects for driving improvements to safety performance. These two areas of focus are building employee engagement in safe work and delivering strong and visible leadership to support safe work practices.
Although the Company’s current injury rates remain consistent with industry peers, it seeks to deliver significant ongoing improvements.
Didipio Mine (Philippines)
At the end of the third quarter, the Didipio operation recorded a TRIFR of 0.66 per million man hours worked compared to 0.47 per million man hours worked recorded at the end of the second quarter.
For the first nine months of 2017, the Didipio operation produced 137,534 ounces of gold and 14,664 tonnes of copper, including 31,887 ounces of gold and 4,387 tonnes of copper in the third quarter. The 26% quarter-on-quarter decrease in gold production was expected and a result of processing lower grade stockpiled ore material.
In the third quarter, Didipio processed 853,312 tonnes of ore compared to 910,976 tonnes in the previous quarter.
As development of the underground continues to progress, the Company will continue to source mill feed solely from open pit stockpiles. At the end of the quarter, the Company had approximately 22 million tonnes of stockpiled ore.
Gold head grade of 1.30 g/t and copper head grade of 0.56% in the third quarter were lower than in previous quarters due to processing of lower grade stockpiled ore. For the remainder of 2017, stockpiled ore will continue to be processed.
Gold recoveries were 89.2% and copper recoveries were 91.6% in the third quarter.
In the third quarter, the Company made one shipment of concentrate, totaling 9,551 dry metric tonnes to smelters in Asia and delivered 5,201 ounces of gold in Doré to the Perth Mint, Western Australia. As a result of weather related to an increase in typhoons in South-East Asia, the Company experienced delays in shipping gold dore which remained in stock at the end of the quarter. In addition some delays in the issue of transport permits saw an increase in concentrate on hand. These shipments were completed early in the fourth quarter.
Looking ahead, production in the fourth quarter of 2017 is expected to be lower compared to previous quarters with mill feed for the remainder of the year being sourced almost entirely from lower grade stockpiled open pit ore. In the fourth quarter, planned maintenance activities in December are expected to further reduce mill availability.
First underground ore is expected to be available for processing early in 2018.
Waihi Mine (New Zealand)
At the end of the third quarter, the Waihi operation recorded a TRIFR of 8.57 per million man hours compared to 7.54 recorded at the end of the second quarter.
First nine months of 2017 gold production at Waihi was 87,323 ounces, including 35,904 ounces produced in the third quarter. Quarter-on-quarter production increased 40% due to mining a higher grade zone of the underground.
In the third quarter, ore continued to be sourced from the Correnso vein and lower levels of the Daybreak vein. Ore drives continued to be developed in the Empire and Christina veins, and the development of the Martha drill drives continued to advance well.
OPERATIONS

Management Discussion and Analysis for the third quarter ended September 30, 2017
12
Total ore mined for the quarter was 127,645 tonnes, a quarter-on-quarter increase due to improved stoping and better productivities. Correspondingly, mill feed increased quarter-on-quarter to 123,647 tonnes.
Gold head grade for the quarter was 9.77 g/t compared to 7.39 g/t in the previous quarter. The expected increased head grade was a result of mine sequencing. Gold recovery for the quarter was 92.3%, which was higher than in the previous quarter due to a lower sulphide content in the ore.
Looking ahead to the fourth quarter of 2017, gold production is expected to be lower due to lower grades.
Macraes Goldfield (New Zealand)
At the end of the third quarter, the Macraes operation reported a TRIFR of 5.92 per million man hours worked, down from 6.30 per million man hours in the previous quarter.
Gold production for the first nine months of 2017 was 115,205 ounces, including 36,878 ounces in the third quarter. The quarter-on-quarter decrease in gold production was related to unplanned downtime of mining equipment at Innes Mills West and Frasers Underground resulting in less ore being mined. Additionally recoveries were lower.
During the third quarter, pre-stripping activities were prioritised at the Coronation North pit with production of higher grade material expected to commence in the fourth quarter.
Total material mined remained broadly in-line with the previous quarter at 9.6 million tonnes while total ore mined was 1.0 million tonnes. The 31% quarter-on-quarter decrease was due to unplanned excavator maintenance activities and ongoing pre-stripping activities at Coronation North.
Ore mined from the Frasers Underground during the third quarter was 240,627 tonnes at a grade of 1.92 g/t, both slightly down against the previous quarter due to reduced availability of stope loader equipment. With a replacement loader now operational, the Company expects productivity and production at Frasers Underground to improve in the fourth quarter.
Mill feed for the third quarter was broadly in-line with the previous quarter at 1.5 million tonnes, and comprised of approximately 83% material from the open pits and 17% from the underground material. Of this feed material, approximately 30% of the feed material was sourced from lower grade stockpiled material.
Gold recovery for the third quarter was 79% which was slightly lower than in the second quarter related to the
continuation of carbonaceous material within the ore. The Company expects recoveries to improve in the fourth quarter in line with grades and ore quality due to a lower presence of carbonaceous material within the ore and reduced throughput of oxide material from commencing mining of Coronation North.
Looking ahead, the fourth quarter is expected to remain the strongest quarter with processing of higher-grade ore from the Coronation North pit.

Management Discussion and Analysis for the third quarter ended September 30, 2017
13
New Zealand
Year-to-date exploration expenditure in New Zealand was approximately $15.2 million comprised of $11.3 million at Waihi and $3.9 million at Macraes. For the third quarter, exploration expenditure in New Zealand was approximately $6.3 million, comprised of $4.3 million at Waihi and $1.9 million at Macraes.
Macraes
Year-to-date exploration drilling at Macraes totaled 22,144 metres, including 7,785 metres drilled during the third quarter. Drilling activities during the third quarter were undertaken at Coronation North, Innes Mills, Frasers Underground North and Golden Point (Figure 1).
The Company continues to receive encouraging results from drilling at Coronation North and Golden Point.
During the third quarter, the Company completed a program of infill drilling at Innes Mills to convert inferred resources into measured and indicated resources with results expected in the fourth quarter. Additionally, at the end of the third quarter, the Company commenced a program of deep (+600 metre) drill holes to the north of the Frasers Underground which is expected to continue through the fourth quarter.
Drilling activities in the fourth quarter will continue at Coronation North, Golden Point, FRUG North and Deepdell.
Waihi
Year-to-date exploration drilling at Waihi totaled 31,656 metres, including 10,439 metres drilled in the third quarter from four surface and three underground diamond drill rigs.
Drilling in the third quarter focused primarily on reserve conversion of Empire, Gladstone and Favona while resource development drilling of the Martha Underground target commenced from the 800-level drill drive with two rigs completing 2,505 metres from 12 holes. Initial gold intercepts from the Martha Underground drilling have been significant, including 18.1m @ 7.9g/t (true width) and 11.1m @ 8.1g/t (true width).
Development of the 920-level drill drive continues to progress as planned, with drilling from the first drill point along this drill drive expected to commence drilling in the fourth quarter of 2017.
Additionally, encouraging widths and grades within the Favona and Gladstone areas indicate further opportunities for resource growth.
Drilling of the regional WKP prospect commenced in the third quarter with 1,202 metres in two holes, successfully intercepting the East Graben vein with 8.8m @ 10.8g/t Au.
Exploration activities in the fourth quarter will continue to focus on the Martha underground, Favona, Gladstone and WKP prospect.
A detailed exploration update documenting the exploration results referred to herein from Waihi is scheduled to be released early November 2017.
United States
Year-to-date exploration expenditure was approximately $7.5 million including $2.6 million in the third quarter.
Year-to-date exploration drilling totaled 36,098 metres, including 13,145 metres drilled in the third quarter, with 9,825 metres from 48 diamond drill holes of brownfields and 3,320 metres in 13 diamond drill holes of greenfields drilling.
Results from drilling activities within the Snakeshoe and Palomino targets in the first and second quarter of 2017 will be modeled in the fourth quarter and assessed for economic potential. Both are underground targets at approximately 250-350 metres depth.
Brownfields infill and resource delineation drilling was conducted at the Ledbetter, Mustang, Red Hill, Mill Zone, and Snake deposits (Figure 2). Drilling was completed at the Mill Zone and Red Hill targets with a total of 33 holes and 10 holes respectively. At the Mustang and Ledbetter targets, 31 of 46 planned holes have been drilled with assays expected late within the fourth quarter. Drilling commenced in the first of 36 planned holes for an expected 13,800 metres at the Snake target.
Drilling activities in the fourth quarter will focus on extensional and infill drilling in three areas, namely Mill Zone, the Haile pit and Snake pit. Drilling activities will include 20 infill holes for approximately 4,200 metres for the second phase of the layback at the Mill Zone, 12 infill holes for 1,500 metres at the Haile pit, and 36 holes for the Snake pit infill and southwest extensions for a total of approximately 13,800 metres. The Snake pit drilling will extend into the first quarter of 2018.
Greenfields diamond drilling comprise of 13 additional holes for approximately 2,300 metres at the Locust target, located 19 kilometres to the northwest of Haile.
EXPLORATION

Management Discussion and Analysis for the third quarter ended September 30, 2017
14
Philippines
Year-to-date exploration expenditure was approximately $3.4 million including $0.9 million in the third quarter.
During the third quarter, underground resource definition drilling continued with a total of 2,870 meters from 19 holes drilled through eight sections with porphyry mineralisation intercepted in all holes.
Exploration activities within the broader FTAA continued and included the Napartan (part of TNN), Chinichinga, and Radio prospects. At the Chinichinga prospect, diamond drilling was conducted with the completion of one hole for 567 metres, testing the presence and mineralisation of monzonite and quartz-monzosyenite-porphyry exposed in the area. Surface mapping, sampling and trenching on the Radio prospect continued
and confirmed the presence of further outcropping quartz veins at three localities. Veins correspond with elevated gold returned from the grid soil survey completed earlier in 2017. Veins are hosted by andesite and display crystalline, massive, chalcedonic and breccia textures. The majority of vein grab samples have returned grades of less than 1.0 g/t gold with several in the range 1.0 – 3.0 g/t of gold. The highest grade of 21.6 g/t of gold was sampled over a one metre channel.
Drilling activities in the fourth quarter will focus on resource definition at Didipio and initial drilling of the Napartan target.

Management Discussion and Analysis for the third quarter ended September 30, 2017
15
Figure 1 – Location of Third Quarter 2017 Macraes Drilling Targets

Management Discussion and Analysis for the third quarter ended September 30, 2017
16
Figure 2 – Location of Haile Third Quarter 2017 Drilling Targets
17
Management Discussion and Analysis for the third quarter ended September 30, 2017
United States
On October 4, 2017, the Company announced that the Haile project had achieved commercial production effective October 1, 2017.
For the first nine months of 2017, the Haile project produced 68,332 ounces of gold, including 31,374 ounces of gold in the third quarter with ore sourced exclusively from the first stage of the Mill Zone Pit. Quarter-on-quarter production increased 94% due to increased throughput, feed grade and recoveries following the changes implemented to the back-end of the plant to address the commissioning issues experienced in the second quarter. The redesigned Carbon-in-Leach (“CIL”) launder system was installed in August and is operating well with significantly improved plant recoveries.
Mining operations in the third quarter were focused on mining ore at Mill Zone and pre-stripping at Snake pit. At the end of the quarter, total material mined was 5,100,905 tonnes including 625,275 tonnes of ore. Quarter-on-quarter total material and ore tonnes mined increased due to improvements in truck utilisation, pit dewatering and haul road upgrades. Productivity was somewhat impacted by inclement weather related to remnants of large hurricanes that impacted the Gulf Coast and Eastern US Seaboard.
Mill feed for the quarter was 456,993 tonnes, a quarter-on-quarter increase of 12% due to improved plant throughput. Higher throughput and more efficient load sharing between the SAG and Ball mills has been achieved with the installation of the larger aperture steel discharge grates in the SAG mill.
Head grade for the quarter was 2.76 g/t while gold recoveries significantly improved to 77%. The quarter-on-quarter improvement in gold recovery was primarily related to the installation of the new inter-piping system of the CIL tanks, improved plant stability and implementation of a closed loop system on the regrinding circuit.
All tank liners were stripped of their liners in the second quarter and re-application has been deferred to 2018 to reduce the impact of weather delays during re-application.
Looking ahead, the Company will continue to ramp-up and fine-tune the plant as part of the normal course of business. Production is expected to increase in the fourth quarter.
Philippines
Year to date, development of the underground at Didipio progressed more than 3,500 metres, including a total of 1,093 metres during the third quarter while the decline advanced to 2,800 metres from the main portal; Portal One (Figure 3). In the third quarter, mining works focused on the construction of the underground pumping station, the completion of level access for Panel 1 to allow production activities and the construction of an underground water storage stope.
The second leg of the return airway system has been completed while the southern exhaust fan commissioned, surface shotcrete and concrete batch plant were commissioned.
Construction of the underground pump station on the 2280RL commenced with most procurement complete and expected to arrive on site early in the fourth quarter. In September, unexpected power interruptions along with inclement weather resulted in localised increased water ingress at the 2280RL. As a result, completion of the pump station is now expected early in the first quarter of 2018, however this is not expected to materially delay the production schedule.
During the third quarter, work commenced on the installation of the underground communications network to allow improved analysis of mobile equipment utilization as well as improved underground safety.
Construction of the paste fill plant continued to progress well and commissioning remains on-track with completion expected in the fourth quarter of 2017.
DEVELOPMENT

Management Discussion and Analysis for the third quarter ended September 30, 2017
18
Figure 3 – Cross-section of Didipio Underground Design and Construction Phase

Management Discussion and Analysis for the third quarter ended September 30, 2017
19
Environment
The Company has not recorded any significant environmental incidents in 2017.
At Macraes, during the third quarter, a Site Water Management Group was formed to co-ordinate the uses, storage and potential treatment and discharge of water to ensure environmental compliance and protection. This activity was supported by fieldwork to validate the sulphate mitigation Plan for Coronation North waste rock stacks.
Closure planning reviews were undertaken at Macraes as part of the preparation of the Rehabilitation Bond estimation process, supported by discussions with the Macraes Community Incorporated (MCI) to assess the Community’s long term views on final land use.
At Waihi, numerous biological monitoring activities were completed, including an annual biomonitoring survey and a herpetofauna study. The Company also completed a specific survey and enacted protective measures to protect the Nationally Vulnerable Archeys frog.
Additionally, an external audit was completed by the Waikato Regional Council and found that the Waihi operation continued to maintain a high level of compliance with consent conditions.
At Reefton, the Company continued rehabilitation and closure activities. Works were undertaken to commence the backfilling of Souvenir Pit and topsoil and revegetation trials were undertaken within a section of Fossickers Tailings Storage facility.
At Haile, the South Carolina Department of Health and Environmental Control (“DEHC”) performed four site inspections covering all site areas in preparation for the permitting necessary for the expansion of mining activities. No deficiencies were identified and no citations issued.
Community
At Macraes, community activities centered around a preliminary meeting with the Ministry of Social Development to consider a tripartite approach between Government, NGO’s and Macraes Mine for the development of a targeted social investment program. Additional major sponsorship commitments from Macraes included $25,000 to the Macraes Moonlight School and $30,000 to the Strath Taieri Irrigation Group.
At Waihi, activities at the Education Centre remained a key focus for the Company with approximately 4,150 students using the facility thus far in 2017.
Furthermore, at Waihi a partnership was established with a local heritage group to showcase Waihi’s mining history. As part of this partnership, the Company will provide relic mining items recovered whilst constructing the two exploration drives.
At Didipio, the Company continues to focus on key infrastructure and social investment programs including:
Social investments for community projects including construction of Didipio Family Health Centre, Didipio Water System, Didipio-Capisaan road. Year-to-date expenditure of PhP 83 million (US$1.6 million);
27 OceanaGold scholars have graduated from the Clark training facility thus far in 2017 and the second Didipio mining engineer successfully passed the mining engineer licensure examinations;
Hosted almost 400 visitors for mine tours with an 82% positive perception after the tour compared to 25% positive perception prior to the tour;
Engaged with Kasibu Municipal Government officials for an underground educational tour; and,
Conducted the Environment Forum on Responsible Mining in partnership with MGB and 2 other mining companies with over 220 regional stakeholders participating.
At Haile, the first quarterly meeting of the Lynches River Conservation Board to steward the distribution of mitigation funding by Haile was held. The Board consists of Haile Gold Mine, Conservation Voters of South Carolina, Coastal Conservation League, SC Wildlife Federation, SC River Keepers, SC Land Trust and SC Senator Vincent Sheheen.
Key personnel from Haile met with legislators and stakeholders in the conservation community to provide an update on the project.
At Haile, the Company met with the South Carolina Commerce and County Economic Development regarding the opportunity to develop a Skills Demand Center, which is envisioned to become a centre for excellence for mining and trade related skills training within North America.
SUSTAINABILITY

20
Management Discussion and Analysis for the third quarter ended September 30, 2017
Table 13 – Financial Summary*
Note: In this third quarter 2017 MD&A, all revenue and costs reported do not include the Haile operations as these have been capitalised as commercial production was declared after the end of the third quarter (effective from October 1, 2017).
$’000 Q3
Sep 30 2017 Q2
Jun 30 2017 Q3
Sep 30 2016
YTD Sep 30 2017
YTD Sep 30 2016
Revenue 144,849 171,650 150,388 478,299 481,202
Cost of sales, excluding depreciation and amortisation
(59,490) (73,767) (77,524) (190,091) (229,055)
General & administration – other (13,429) (14,513) (11,361) (36,892) (39,294)
Foreign currency exchange gain/(loss) 201 647 (604) 627 2,664
Gain on sale of available-for-sale assets - - - 5,314 -
Other income/(expense) 1,268 728 669 2,558 1,209
Earnings before interest, tax, depreciation and amortisation (EBITDA) (excluding gain/(loss) on undesignated hedges and impairment charge)
73,399 84,745 61,568 259,815 216,726
Depreciation and amortisation (44,372) (51,171) (31,973) (131,946) (93,757)
Net interest expense and finance costs (4,296) (4,292) (2,538) (13,145) (7,261)
Earnings before income tax and gain/(loss) on undesignated hedges and impairment charge
24,731 29,282 27,057 114,724 115,708
Tax on earnings (3,314) (4,538) (2,587) (9,170) (13,392)
Earnings after income tax and before gain/(loss) on undesignated hedges and impairment charge
21,417 24,744 24,470 105,554 102,316
Impairment charge - - - (17,654) -
Gain/(loss) on fair value of undesignated hedges
611 1,075 8,852 (6,188) (11,280)
Tax (expense)/benefit on gain/loss on undesignated hedges
(171) (301) (2,478) 1,733 3,158
Share of profit/(loss) from equity accounted associates
(111) (161) (151) (337) (315)
Net Profit 21,746 25,357 30,693 83,108 93,879
Basic earnings per share $0.04 $0.04 $0.05 $0.14 $0.15
CASH FLOWS
Cash flows from Operating Activities 38,169 88,391 29,440 178,903 152,599
Cash flows used in Investing Activities (50,495) (71,696) (116,342) (188,101) (342,578)
Cash flows (used in) / from Financing Activities (13,676) (6,635) 70,607 (9,766) 85,467
BALANCE SHEET $’000 As at
Sep 30 2017 As at
Dec 31 2016
Cash and cash equivalents 61,191 68,859
Other Current Assets 180,603 119,750
Non-Current Assets 1,734,684 1,727,111
Total Assets 1,976,478 1,915,720
Current Liabilities 222,134 240,860
Non-Current Liabilities 348,592 339,609
Total Liabilities 570,726 580,469
Total Shareholders’ Equity 1,405,752 1,335,251
FINANCIAL SUMMARY

21
Management Discussion and Analysis for the third quarter ended September 30, 2017
In this third quarter 2017 Management Discussion and Analysis (“MD&A”), all revenue and costs reported do not include those of the Haile operation. The revenue and costs associated with the Haile Gold Mine have been capitalized.
Subsequent to the quarter end, commercial production was declared at the Haile Gold Mine, effective from October 1, 2017. Accordingly, all revenue and costs will be reported in the Consolidated Statement of Comprehensive Income as from this date.
Net Earnings
In the third quarter of 2017, the Company reported revenue of $144.8 million and EBITDA of $73.4 million (excluding gain/loss on undesignated hedges and impairment charge).
The quarter-on-quarter decrease in EBITDA (excluding gain/loss on undesignated hedges and impairment charge) was mainly due to lower revenue from reduced gold sales partly offset by lower operating costs at Didipio in line with lower sales volumes.
The third quarter net profit was $21.7 million compared to a net profit of $25.4 million in the second quarter mainly due to lower revenue partly offset by lower operating costs and lower depreciation and amortisation charges.
Sales Revenue
Philippines
Third quarter concentrate and bullion revenue, net of concentrate treatment, refining and selling costs, was $49.7 million of which copper revenue was $20.3 million. In the third quarter, the average gold price received at Didipio was $1,261 per ounce compared to $1,271 per ounce in the previous quarter and the average copper price received was $2.82 per pound compared to $2.45 per pound in the previous quarter.
Sales at Didipio in the third quarter were 25,656 ounces of gold compared to 47,185 ounces sold in the previous quarter. The quarter-on-quarter decrease was related to lower production and delays with shipping concentrate and transporting gold dore. Copper sales of 3,273 tonnes and silver sales of 35,174 ounces were lower than the previous quarter’s sales.
New Zealand
Third quarter revenue was $95.1 million in New Zealand. Gold sales in the third quarter of 72,909 ounces were higher than the previous quarter of 67,007 ounces due to higher production at Waihi. The average gold price received in the third quarter was $1,281 per ounce compared to $1,256 per ounce received in the previous quarter.
AISC per Ounce
Philippines
AISC at Didipio was $137 per ounce sold for the third quarter compared to AISC of $147 per ounce sold in the previous quarter. The decrease in costs per ounce sold was due to lower operating costs partly offset by lower by-product credits.
New Zealand
AISC in New Zealand was $963 per ounce sold for the third quarter compared to $1,057 per ounce sold in the previous quarter due to lower operating costs and higher by-product credits.
Depreciation and Amortisation
Depreciation and amortisation charges include amortisation of mine development, deferred pre-stripping costs and depreciation on plant and equipment.
Depreciation and amortisation charges are mostly calculated on a unit of production basis and totaled $44.4 million for the third quarter compared to $51.2 million in the previous quarter. The decrease was mainly due to lower amortisation charges at Didipio in-line with lower production and capitalised pre-strip costs being fully amortised in the second quarter.
General and Administration Costs
General and administration costs of $13.4 million were lower than the previous quarter due to lower business and property taxes and employee costs.
Undesignated Hedges Gains/Losses
Unrealised gains and losses reflect the changes in the fair value adjustment of the Company’s undesignated hedges which are brought to account at the end of each reporting period.
These valuation adjustments on the gold and fuel hedges for the third quarter reflect a gain of $0.6 million compared to a gain of $1.1 million in the previous quarter. During the third quarter, new undesignated gold hedges were executed to cover future gold production from New Zealand to the end of 2018.
Additionally, subsequent to the end of the quarter, the Company introduced a copper swap program for 2018, with 1,000 metric tonnes of copper delivered per month, for a total of 12,000 tonnes, at a fixed price of $7,040.00 per metric tonne or $3.19 per pound for the period of January 2018 to December 2018.
Details of the derivative instruments held by the Company at September 30, 2017, are summarised below under “Derivative Assets / Liabilities”.
RESULTS OF OPERATIONS

Management Discussion and Analysis for the third quarter ended September 30, 2017
22
Tax Expense
The Company recorded a tax expense of $3.5 million in the third quarter in relation to taxable income in New Zealand. This compared to a tax expense of $4.8 million in the previous quarter. As reported in the previous quarter, the Company utilised remaining available tax losses to offset taxable income in New Zealand in the first quarter. New Zealand provisional tax payments for a given tax year are normally required to be made in March, September and January. As a result of some transitionary tax legislation changes, the March and September tax payments for 2017 have been deferred to the first quarter of 2018.
An income tax holiday still applies to the Philippines operations.
DISCUSSION OF CASH FLOWS
Operating Activities
Cash inflows from operating activities for the third quarter were $38.2 million compared to $88.4 million in the previous quarter. The decrease was mainly due to lower revenue and unfavourable working capital movements including quarter-on-quarter increases in inventories and trade receivables and decrease in trade payables partly offset by lower operating costs. There was no income tax payment required to be made in New Zealand during the last two quarters.
Investing Activities
Cash used for investing activities was $50.5 million in the third quarter compared to $71.7 million in the previous quarter. Investing activities included expenditure on capitalised mining including pre-stripping, sustaining capital and expansionary capital including open pit development at Haile and underground development at Didipio.
Total capital expenditure for the third quarter was $52.3 million compared to $71.7 million in the prior quarter (both net of capitalised revenue from Haile). More information is provided in Table 4.
Financing Activities
Financing net outflows were $13.7 million in the third quarter mainly due to the debt repayment of $12 million and finance lease repayments. Financing net outflows of $6.6 million in the second quarter were due to the dividend payment to shareholders and finance lease
repayments partly offset by proceeds from issue of shares.
DISCUSSION OF FINANCIAL POSITION AND LIQUIDITY
Company's funding and capital requirements
The Company recorded a net profit of $21.7 million for the quarter ended September 30, 2017. As at September 30, 2017, the cash funds held were $61.2 million. The Company was in a net current asset position of $19.7 million. Total repayment of $72.8 million of interest bearing debt is due by December 31, 2017. The Company forecasts that sufficient operating cash flows will be generated to fund this repayment. Furthermore, the Company has options to enhance liquidity including in the extreme scenario, the disposal of strategic investments. These continue to be classified as non-current assets due to their strategic nature.
At September 30, 2017, the Company’s total facilities stood at $330 million, of which $272.8 million was drawn after the debt repayment of $12 million in the third quarter.
As at September 30, 2017, the Company had immediately available liquidity of $118.4 million with $61.2 million in cash and $57.2 million available under credit facilities.
As at the end of the third quarter, the Company held $69.9 million in marketable securities from strategic investments in listed junior exploration companies.
Commitments
The Company’s capital commitments as at September 30, 2017, are as follows:
Table 14 – Capital Commitments
$'000 Sep 30 2017
Within 1 year 16,953
This relates principally to the purchase of property, plant and equipment and the development of mining assets mainly at Didipio.
Management Discussion and Analysis for the third quarter ended September 30, 2017
23
Financial Position
Current Assets
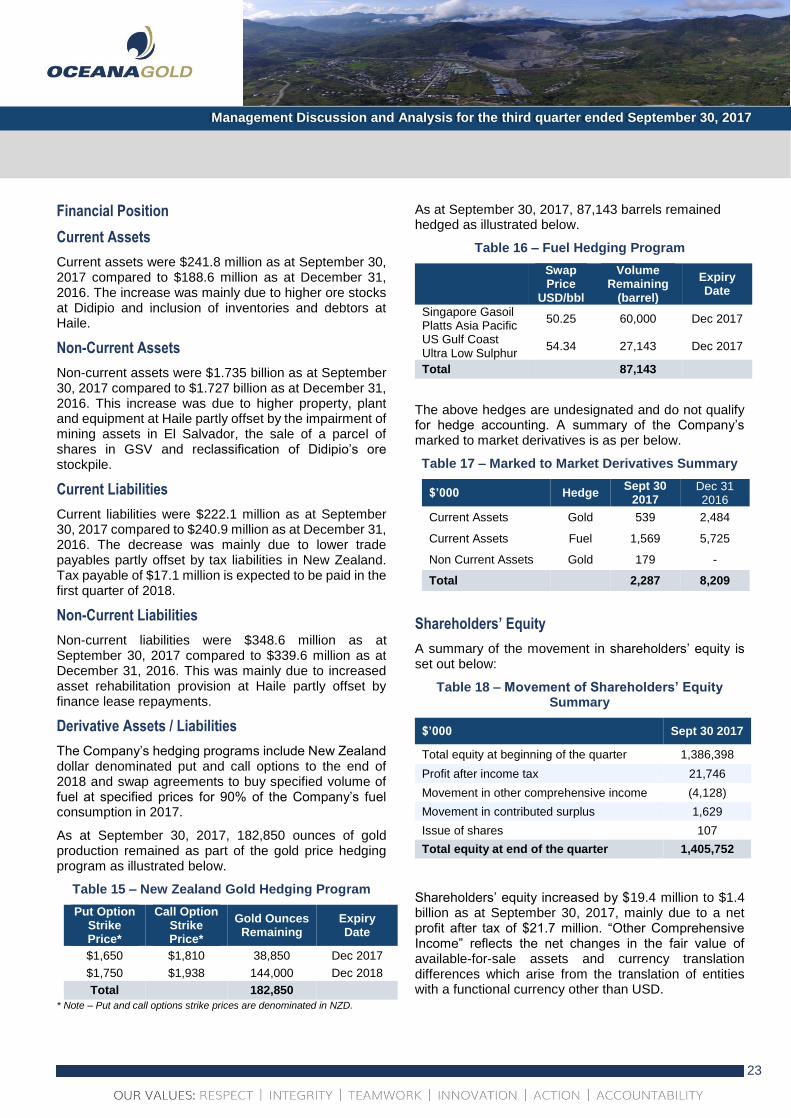
Current assets were $241.8 million as at September 30, 2017 compared to $188.6 million as at December 31, 2016. The increase was mainly due to higher ore stocks at Didipio and inclusion of inventories and debtors at Haile.
Non-Current Assets
Non-current assets were $1.735 billion as at September 30, 2017 compared to $1.727 billion as at December 31, 2016. This increase was due to higher property, plant and equipment at Haile partly offset by the impairment of mining assets in El Salvador, the sale of a parcel of shares in GSV and reclassification of Didipio’s ore stockpile.
Current Liabilities
Current liabilities were $222.1 million as at September 30, 2017 compared to $240.9 million as at December 31, 2016. The decrease was mainly due to lower trade payables partly offset by tax liabilities in New Zealand. Tax payable of $17.1 million is expected to be paid in the first quarter of 2018.
Non-Current Liabilities
Non-current liabilities were $348.6 million as at September 30, 2017 compared to $339.6 million as at December 31, 2016. This was mainly due to increased asset rehabilitation provision at Haile partly offset by finance lease repayments.
Derivative Assets / Liabilities
The Company’s hedging programs include New Zealand dollar denominated put and call options to the end of 2018 and swap agreements to buy specified volume of fuel at specified prices for 90% of the Company’s fuel consumption in 2017.
As at September 30, 2017, 182,850 ounces of gold production remained as part of the gold price hedging program as illustrated below.
Table 15 – New Zealand Gold Hedging Program
Put Option Strike Price*
Call Option Strike Price*
Gold Ounces Remaining
Expiry Date
$1,650 $1,810 38,850 Dec 2017
$1,750 $1,938 144,000 Dec 2018
Total 182,850
* Note – Put and call options strike prices are denominated in NZD.
As at September 30, 2017, 87,143 barrels remained hedged as illustrated below.
Table 16 – Fuel Hedging Program
Swap Price
USD/bbl
Volume Remaining
(barrel)
Expiry Date
Singapore Gasoil Platts Asia Pacific
50.25 60,000 Dec 2017
US Gulf Coast Ultra Low Sulphur
54.34 27,143 Dec 2017
Total 87,143
The above hedges are undesignated and do not qualify for hedge accounting. A summary of the Company’s marked to market derivatives is as per below.
Table 17 – Marked to Market Derivatives Summary
$’000 Hedge Sept 30
2017 Dec 31 2016
Current Assets Gold 539 2,484
Current Assets Fuel 1,569 5,725
Non Current Assets Gold 179 -
Total 2,287 8,209
Shareholders’ Equity
A summary of the movement in shareholders’ equity is set out below:
Table 18 – Movement of Shareholders’ Equity Summary
$’000 Sept 30 2017
Total equity at beginning of the quarter 1,386,398
Profit after income tax 21,746
Movement in other comprehensive income (4,128)
Movement in contributed surplus 1,629
Issue of shares 107
Total equity at end of the quarter 1,405,752
Shareholders’ equity increased by $19.4 million to $1.4 billion as at September 30, 2017, mainly due to a net profit after tax of $21.7 million. “Other Comprehensive Income” reflects the net changes in the fair value of available-for-sale assets and currency translation differences which arise from the translation of entities with a functional currency other than USD.

Management Discussion and Analysis for the third quarter ended September 30, 2017
24
Capital Resources
Table 19 – Capital Resources Summary
Shares
Outstanding
Options and Share Rights Outstanding
26 October 2017 615,094,040 13,351,424
30 September 2017 615,084,025 13,370,052
31 Dec 2016 611,024,600 14,669,052
CRITICAL ACCOUNTING ESTIMATES AND JUDGEMENTS
i. Mining assets
The future recoverability of mining assets including capitalised exploration and evaluation expenditure is dependent on a number of factors, including whether the Group decides and is permitted to exploit the related tenements itself or, if not, whether it successfully recovers the related mining assets through sale.
Factors that could impact the future recoverability include the level of reserves and resources, future technological changes, which could impact the cost of mining, future legal changes (including changes to environmental restoration obligations) and changes to commodity prices and foreign exchange rates.
Exploration and evaluation expenditure is capitalised if activities in the area of interest have not yet reached a stage that permits a reasonable assessment of the existence or otherwise of economically recoverable reserves. To the extent that capitalised exploration and evaluation expenditure is determined not to be recoverable in the future, profits and net assets will be reduced in the period in which this determination is made. As a result of the announcement on March 29, 2017, by the Government of El Salvador to ban all mining for gold and other metals, Management considered this to be an impairment indicator and concluded the value of the mining assets it held in El Salvador was fully impaired during the quarter ended March 31, 2017.
The Group defers mining costs incurred during the production stage of its operations and these are amortised over the life of the components of the ore body to which they relate. Changes in an individual mine’s design will result in changes to the life of component ratios of production. Changes in other technical or economic parameters that impact reserves will also have an impact on the life of component production and cost profile even if they do not affect the mine design.
Changes to deferred mining resulting from change in life of component ratios are accounted for prospectively.
ii. Impairment of assets
The Group assesses each Cash-Generating Unit (CGU), to determine whether there is any indication of impairment or reversal of impairment. Where an indicator of impairment or reversal exists, a formal estimate of the recoverable amount is made, which is the higher of the fair value less costs to sell and value in use calculated in accordance with accounting policy. These assessments require the use of estimates and assumptions such as discount rates, exchange rates, commodity prices (gold, copper and tungsten), sustaining capital requirements, operating performance (including the magnitude and timing of related cash flows) and future operating development from certain identified exploration targets where there is higher degree of confidence in the economic extraction of minerals.
The recoverable values of the New Zealand CGU and United States CGU are dependent on production from certain identified exploration targets in New Zealand and successful commencement of commercial production at the Haile Gold Mine respectively. Subsequent to the quarter end, commercial production was declared at the Haile Gold Mine. Should these projects prove to be uneconomic, the carrying value of the related CGU could be impaired by a significant amount.
The recoverable amount of the exploration and evaluation assets is dependent on various factors including technical studies, further exploration and the eventual granting of mining permits. Should these be unsuccessful, the exploration assets could be impaired. An impairment charge of $17.7 million was recognised in the first quarter for El Salvador assets and there is no associated tax impact.
On February 2, 2017, the Philippines Department of Environment and Natural Resources (“DENR”) held a press conference at which OceanaGold’s Didipio operation was named as the subject of a proposed suspension order citing alleged declining agricultural production.
On February 14, 2017, the Company received an order from the DENR calling for the suspension of the Didipio operations citing “… petition of the Local Government of Nueva Vizcaya for the cancellation of the FTAA; alleged damages to houses caused by the blasting operation; and the potential adverse impact to the agricultural areas of the Province…” as reasons for this decision.
Subsequent to receiving the suspension order, the Company immediately filed an appeal with the Office of

Management Discussion and Analysis for the third quarter ended September 30, 2017
25
the President (“OP”). On March 15, 2017, the Company filed the Appeal Memorandum with the OP substantiating its grounds for appeal. The DENR filed its commentary to the Company’s appeal memorandum on or around 8 May 2017, and the Company subsequently filed a further reply to the DENR commentary. The matter is currently awaiting a decision from the OP. The Didipio operation is expected to continue to operate during this appeal process. Should the appeal fail and operations be suspended for a prolonged period, the Didipio operation could face impairment.
iii. Net realisable value of inventories
The Group reviews the carrying value of its inventories at each reporting date to ensure that the cost does not exceed net realisable value. Estimates of net realisable value include a number of assumptions and estimates, including grade of ore, commodity price forecasts, foreign exchange rates and costs to process inventories to a saleable product.
iv. Asset retirement obligations
Decommissioning and restoration costs are a normal consequence of mining, and the majority of this expenditure is incurred at the end of a mine’s life. In determining an appropriate level of provision, consideration is given to the expected future costs to be incurred, the timing of these expected future costs (largely dependent on the life of the mine), and the estimated future level of inflation.
The ultimate cost of decommissioning and restoration is uncertain and costs can vary in response to many factors including changes to the relevant legal requirements, the emergence of new restoration techniques and experience at other mine sites. The expected timing of expenditure can also change, for example in response to changes in reserves or to production rates.
Changes to any of the estimates could result in significant changes to the level of provisioning required, which would in turn impact future financial results. These estimates are reviewed annually and adjusted where necessary to ensure that the most up to date data is used.
v. Determination of ore reserves and resources
Ore reserves and resources are based on information compiled by a Competent Person as defined in accordance with the Australasian Code of Mineral Resources and Ore Reserves (the JORC code) and in accordance with National Instrument 43-101-Standards of Disclosure for Mineral Projects (“NI-43-101”) under the guidelines set out by the Canadian Institute of Mining,
Metallurgy and Petroleum. There are numerous uncertainties inherent in estimating ore reserves and assumptions that are valid at the time of estimation may change significantly when new information becomes available. Changes in forecast prices of commodities, exchange rates, production costs or recovery rates may change the economic status of reserves and may, ultimately, result in the reserves being restated. Such changes in reserves could impact on depreciation and amortisation rates, asset carrying values and provisions for rehabilitation.
vi. Taxation
The Group’s accounting policy for taxation requires management’s judgment in relation to the application of income tax legislation. There may be some transactions and calculations undertaken during the ordinary course of business where the ultimate tax determination is uncertain. The Group recognises liabilities for tax, and if appropriate, taxation investigation or audit issues, based on whether tax will be due and payable and if there is no more recourse to an appeal process. Liabilities are not recognised until they are determined with reasonable certainty. Where the taxation outcome of such matters is different from the amount initially recorded, such difference will impact the current and deferred tax positions in the period in which the assessment is made.
In addition, certain deferred tax assets for deductible temporary differences and carried forward taxation losses have been recognised. In recognising these deferred tax assets, assumptions have been made regarding the Group’s ability to generate future taxable profits from current operations after reaching commercial production and successful development of certain identified exploration targets where there are higher degrees of confidence in the economic extraction of minerals.
Utilisation of the tax losses also depends on the ability of the entity to satisfy certain tests such as substantial change of control tests at the time the losses are recouped. If the entities fail to satisfy the tests, the carried forward losses that are currently recognised as deferred tax assets would have to be written off to income tax expense. There is an inherent risk and uncertainty in applying this judgement and a possibility that changes in legislation or corporate merger and acquisition activity will impact upon the carrying amount of deferred tax assets and deferred tax liabilities recognised on the statement of financial position.
Moreover, in certain jurisdictions, tax losses may be restricted and only available to offset future profits generated from the same mining permit area. In this
Management Discussion and Analysis for the third quarter ended September 30, 2017
26
case, the recovery of the losses depends on the successful exploitation of the relevant project. Restricted losses could be forfeited if the project did not proceed.
Certain input tax credits in overseas subsidiaries have been recognised as a non-current receivable. The input tax credits are initially measured at cost, based on the interpretation of the terms and conditions of the relevant tax and investment law which allow for the recoverability of input taxes paid.
In assessing the classification and recoverability of these input tax credits, the Group makes a number of assumptions which are subject to risk and uncertainty including the timing and likelihood of success in working through the required legal process in the relevant jurisdiction. The Group views these input tax credits as recoverable via a tax refund or a tax credit. Should management determine that, all or some of the input tax will not be recoverable via tax refund or credit in the future, the Group would reclassify eligible amounts to other components of non-current assets as allowable under the relevant accounting standard. Non-eligible amounts, where so determined, may have to be expensed in the relevant period.
Excise tax payments have been made in certain overseas tax jurisdictions despite the Company’s view that it should be exempt. These amounts are expected to be recovered in due course, and have therefore been recorded as a non-current receivable. Should the amounts ultimately not be recovered, they would be expensed in the relevant period.
vii. Non-Controlling Interest
A third party has a contractual right to an 8% interest in the operating vehicle that is formed to undertake the management, development, mining and processing of ore, and marketing of products as part of the Didipio mine in the Philippines. This 8% interest in the common share capital of the operating vehicle has similar voting and dividend rights to the remaining majority, subject to the operating vehicle having fully recovered its pre-operating costs. A subsidiary of the Company is currently involved in arbitration proceedings with the third party over certain payment claims. At the same time, the third party is also involved in a legal dispute with another party over the ownership of the 8% interest. At September 30, 2017, no such equity has been issued to any third party due to the uncertainty. Consequently, no non-controlling interest has been recognised. A non-controlling interest is intended to be recognised after the issue of shares. This requirement has not yet been satisfied due to a court restriction
resulting from litigation challenging the claim of this third party from a party not related to the Group.
RISKS AND UNCERTAINTIES
This document contains some forward-looking statements that involve risks, uncertainties and other factors that could cause actual results, performance, prospects and opportunities to differ materially from those expressed or implied by those forward-looking statements. Factors that could cause actual results or events to differ materially from current expectations include, among other things: volatility and sensitivity to market prices for gold; replacement of reserves; possible variations of ore grade or recovery rates; changes in project parameters; procurement of required capital equipment and operating parts and supplies; equipment failures; unexpected geological conditions; political risks arising from operating in certain developing countries; inability to enforce legal rights; defects in title; imprecision in reserve estimates; success of future exploration and development initiatives; operating performance of current operations; ability to secure long term financing and capital, water management, environmental and safety risks; seismic activity, weather and other natural phenomena; failure to obtain necessary permits and approvals from government authorities; changes in government regulations and policies including tax and trade laws and policies; ability to maintain and further improve labour relations; general business, economic, competitive, political and social uncertainties and other development and operating risks. For further detail and discussion of risks and uncertainties refer to the Annual Information Form available on the Company’s website.
CHANGES IN ACCOUNTING POLICIES AND STANDARDS INCLUDING INITIAL ADOPTION
The Group did not adopt any new and/or revised standards, amendments and interpretation from January 1, 2017 which had a material effect on the financial position or performance of the Group.
Accounting policies effective for future periods
The following accounting policies are effective for future periods:
IFRS 9 – Financial instruments This standard will replace IAS 39, Financial Instruments: Recognition and Measurement. IFRS 9 has two classification categories: amortised cost and fair value.

Management Discussion and Analysis for the third quarter ended September 30, 2017
27
Classification of debt assets will be driven by the entity’s business model for managing the financial assets and the contractual cash flow characteristics of the financial assets. A ‘simple’ debt instrument is measured at amortised cost if: a) the objective of the business model is to hold the financial asset for the collection of the contractual cash flows, and b) the contractual cash flows under the instrument solely represent payments of principal and interest. All other financial assets, including investments in complex debt instruments and equity investments must be measured at fair value.
All fair value movements on financial assets must be recognised in profit or loss except for equity investments that are not held for trading (short-term profit taking), which may be recorded in other comprehensive income. For financial liabilities that are measured under the fair value option, entities will need to recognise the part of the fair value change that is due to changes in the entity’s own credit risk in other comprehensive income rather than profit or loss. New hedging rules are also included in the standard. These will make testing for hedge effectiveness easier which means that more hedges are likely to be eligible for hedge accounting. The new rules will also allow more items to be hedged and relax the rules on using purchased options and non-derivative financial instruments as hedging instruments.
It also contains a new impairment model which will result in earlier recognition of losses. The amendment also modifies the relief from restating prior periods. As part of this relief, IASB published an amendment to IFRS 7, ‘Financial instruments: Disclosure’, to require additional disclosures on transition from IAS 39 to IFRS 9. This standard is effective for years beginning on/after January 1, 2018. Preliminary assessment by the Group indicates a minimum impact to measurement of this new standard.
IFRS 7 – Financial instruments – Disclosure This standard has been amended to require additional disclosures on transition from IAS 39 to IFRS 9. It is effective on adoption of IFRS 9. The mandatory effective date for IFRS 9 is for the years beginning on/after January 1, 2018. The Group will apply the standard accordingly.
IFRS 15 – Revenue from contracts with customers This standard deals with revenue recognition and establishes principles for reporting useful information to users of financial statements about the nature, amount, timing and uncertainty of revenue and cash flows arising from an entity’s contracts with customers. Revenue is recognised when a customer obtains control of a good or service and thus has the ability to direct the use and obtain the benefits from the good or service. The
standard replaces IAS 18 ‘Revenue’ and IAS 11 ‘Construction contracts’ and related interpretations.
The standard is effective for annual periods beginning on or after 1 January 2018 and earlier application is permitted. Preliminary assessment by the Group indicates a minimum impact to measurement of this new standard. A more detailed assessment is ongoing.
IFRS 16 – Leases This standard will replace IAS 17, Leases and related interpretations. IFRS 16 establishes principles for recognition, measurement, presentation and disclosures of leases. The standard provides a single lessee accounting model which requires the lessee to recognise almost all lease contracts on the balance sheet; the only optional exemptions are for certain short-term leases and leases of low-value assets. Lessors continue to classify leases as operating or finance, with IFRS 16’s approach to lessor accounting substantially unchanged from its predecessor, IAS 17. This standard is effective for years beginning on/after January 1, 2019. Preliminary assessment by the Group indicates minimum impact of this new standard. A more detailed assessment is ongoing.
IAS 28 – Investments in associates and joint ventures This standard is amended to address the inconsistency between IFRS 10 and IAS 28. The main consequence of the amendments is that a full gain or loss is recognised when the transaction involves a business combination, and whereas a partial gain is recognised when the transaction involves assets that do not constitute a business. The amendment was originally effective for years beginning on/after January 1, 2016. However, the effective date has been deferred indefinitely by the IASB. The Group will apply the standard accordingly when effective.
IFRS 2 – Share-based payments This standard has been amended to address certain issues related to the accounting for cash settled awards, and the accounting for equity settled awards that include a ‘net settlement” feature in respect of employee withholding taxes. The amendments are effective for years beginning on/after January 1, 2018 and the Group will apply the amendment accordingly.
There are no other IFRSs or IFRIC interpretations that are not yet effective that would be expected to have a material impact on the Group.

Management Discussion and Analysis for the third quarter ended September 30, 2017
28
SUMMARY OF QUARTERLY RESULTS OF OPERATIONS Table 20 sets forth unaudited information for each of the eight quarters ended December 31, 2015 through to September 30, 2017. This information has been derived from our unaudited consolidated financial statements which, in the opinion of management, have been prepared on a basis consistent with the audited consolidated financial statements and include all adjustments, consisting only of normal recurring adjustments, necessary for fair presentation of our financial position and results of operations for those periods. The most significant factors causing variation in the results are the volatility of the gold price and copper price, the variability in the grade of ore mined from the Macraes, Waihi and Didipio mines, gold and copper recoveries, the timing of waste stripping activities, movements in inventories and large movements in foreign exchange rates between the USD and the NZD.
NON-GAAP MEASURES Throughout this document, we have provided measures prepared according to IFRS (“GAAP”) as well as some non-GAAP performance measures.
As non-GAAP performance measures do not have a standardised meaning prescribed by GAAP, they are unlikely to be comparable to similar measures presented by other companies. We provide these non-GAAP measures as they are used by some investors to evaluate OceanaGold’s performance. Accordingly, such non-GAAP measures are intended to provide additional information and should not be considered in isolation, or a substitute for measures of performance in accordance with GAAP:
Earnings before interest, tax, depreciation and amortisation (EBITDA) - a reconciliation of this measure to Net Profit / (Loss) is provided on page 20.
Net profit before impairment is calculated by adding back the impairment expense to net profit.
All-In Sustaining Costs (“AISC”) per ounce sold is based on the World Gold Council methodology.
All-In Sustaining margin refers to the difference between average gold price received, and AISC per ounce of gold sold.
Liquidity has been calculated as cash and cash equivalents and the total of funds which are available to be drawn under the Company’s loan facilities.
ADDITIONAL INFORMATION Additional information referring to the Company, including the Company’s Annual Information Form, is
available on SEDAR at www.sedar.com and the Company’s website at www.oceanagold.com.
DISCLOSURE CONTROLS AND PROCEDURES The Chief Executive Officer and Chief Financial Officer evaluated the effectiveness of the Company’s disclosure controls and procedures as at December 31, 2016. Based on that evaluation, the Chief Executive Officer and the Chief Financial Officer concluded that the design and operation of these disclosure controls and procedures were effective as at December 31, 2016 to provide reasonable assurance that material information relating to the Company, including its consolidated subsidiaries, would be made known to them by others within those entities. These controls were designed and evaluated using the framework set forth in Internal Control - Integrated Framework published by The Committee of Sponsoring Organisations of the Treadway Commission (1992).
INTERNAL CONTROL OVER FINANCIAL REPORTING Management of OceanaGold, including the Chief Executive Officer and Chief Financial Officer, have evaluated the effectiveness of the design and operation of the Company's internal controls over financial reporting and disclosure controls and procedures as of December 31, 2016. Based on this evaluation, the Chief Executive Officer and Chief Financial Officer have concluded that they were effective at a reasonable assurance level.
There were no significant changes in the Company's internal controls, or in other factors that could significantly affect those controls subsequent to the date the Chief Executive Officer and Chief Financial Officer completed their evaluation, nor were there any significant deficiencies or material weaknesses in the Company's internal controls requiring corrective actions.
During the three months ended September 30, 2017, there were no changes in the Company’s internal control over financial reporting that have materially affected, or are reasonably likely to materially affect, the Company’s internal control over financial reporting. The Company’s management, including the Chief Executive Officer and the Chief Financial Officer, does not expect that its disclosure controls and internal controls over financial conceived or operated, can provide only reasonable not absolute, assurance that the objectives of the internal controls over financial reporting are achieved.

29
Management Discussion and Analysis for the third quarter ended September 30, 2017
Table 20 - Quarterly Financial Summary*
$’000 Sep 30 2017
Jun 30 2017
Mar 31 2017
Dec 31 2016
Sep 30 2016
Jun 30 2016
Mar 31 2016
Dec 31 2015
Revenue 144,849 171,650 161,800 147,432 150,388 169,763 161,051 143,612
EBITDA (excluding gain/(loss) on undesignated hedges and impairment charge)
73,399 84,745 101,671 66,890 61,568 77,286 77,874 57,569
Earnings after income tax and before gain/(loss) on undesignated hedges and impairment charge (net of tax)
21,417 24,744 59,393 31,653 24,470 41,136 36,710 10,750
Net Profit 21,746 25,357 36,005 42,574 30,693 39,655 23,531 22,648
Net Earnings per share
Basic $0.04 $0.04 $0.06 $0.07 $0.05 $0.07 $0.04 $0.04
Diluted $0.03 $0.04 $0.06 $0.07 $0.05 $0.06 $0.04 $0.04
*Note: includes results for Romarco Minerals and Waihi Gold from 1 and 30 October 2015 respectively.
Table 21 – Reconciliation of Cash Costs and All-In Sustaining Costs*
Q3
Sep 30 2017
Q2 Jun 30 2017
Q3 Sep 30 2016
YTD Sep 30 2017
YTD Sep 30 2016
Cost of sales, excluding depreciation and amortisation
$’000 59,490 73,767 77,524 190,091 229,055
Selling costs $’000 4,123 5,106 3,354 13,713 13,866
By-product credits $’000 (22,610) (33,310) (28,933) (82,569) (84,801)
Total cash costs (net of by-product credits) $’000 41,003 45,563 51,945 121,235 158,120
Gold sales from operating mines* ounces 98,565 114,192 98,195 326,778 331,489
Cash Costs $/ounce 416 399 529 371 477
Capitalised mining $/ounce 121 101 37 92 91
Sustaining capital expenditure $/ounce 79 65 82 71 71
Corporate general & administration - other $/ounce 78 74 64 67 55
Exploration and other $/ounce 54 42 36 43 36
All-In Sustaining Costs $/ounce 748 681 748 644 730
*Note: excludes gold sales from the Haile Gold Mine for the first, second and third quarters given that the associated costs have been capitalised as commercial production was declared subsequent to the quarter end (effective from October 1, 2017).
NOT FOR DISSEMINATION OR DISTRIBUTION IN THE UNITED STATES OR TO US PERSONS
AND NOT FOR DISTRIBUTION TO US NEWSWIRE SERVICE