Embed Size (px)
Citation preview

November 7, 2017
Third Quarter 2017Earnings Presentation

2
Strategic Review Edward Tilly
Chairman and Chief Executive Officer
Financial Review Alan Dean
Executive Vice President, CFO and Treasurer
Brian Schell
Deputy CFO
Questions and Answers Edward Tilly
Alan Dean
Brian Schell
Chris Concannon
President and Chief Operating Officer
John Deters
Chief Strategy Officer and Head of Multi-Asset Solutions
Agenda
3
This presentation contains forward-looking statements within the meaning of the Private Securities Litigation Reform Act of 1995 that involve a number of risks and uncertainties. You can identify these statements by forward-looking words such as “may,” “might,” “should,” “expect,” “plan,” “anticipate,” “believe,” “estimate,” “predict,” “potential” or “continue,” and the negative of these terms and other comparable terminology. All statements that reflect our expectations, assumptions or projections about the future other than statements of historical fact are forward-looking statements. These forward-looking statements, which are subject to known and unknown risks, uncertainties and assumptions about us, may include projections of our future financial performance based on our growth strategies and anticipated trends in our business. These statements are only predictions based on our current expectations and projections about future events. There are important factors that could cause our actual results, level of activity, performance or achievements to differ materially from those expressed or implied by the forward-looking statements.
We operate in a very competitive and rapidly changing environment. New risks and uncertainties emerge from time to time, and it is not possible to predict all risks and uncertainties, nor can we assess the impact of all factors on our business or the extent to which any factor, or combination of factors, may cause actual results to differ materially from those contained in any forward-looking statements.
Some factors that could cause actual results to differ include: the loss of our right to exclusively list and trade certain index options and futures products; economic, political and market conditions; compliance with legal and regulatory obligations; price competition and consolidation in our industry; decreases in trading volumes, market data fees or a shift in the mix of products traded on our exchanges; legislative or regulatory changes; increasing competition by foreign and domestic entities; our dependence on and exposure to risk from third parties; our index providers’ ability to maintain the quality and integrity of their indexes and to perform under our agreements; our ability to operate our business without violating the intellectual property rights of others and the costs associated with protecting our intellectual property rights; our ability to attract and retain skilled management and other personnel, including those experienced with post-acquisition integration; our ability to accommodate trading volume and transaction traffic, including significant increases, without failure or degradation of performance of our systems; our ability to protect our systems and communication networks from security risks, including cyber-attacks and unauthorized disclosure of confidential information; challenges to our use of open source software code; our ability to meet our compliance obligations, including managing potential conflicts between our regulatory responsibilities and our for-profit status; damage to our reputation; the ability of our compliance and risk management methods to effectively monitor and manage our risks; our ability to manage our growth and strategic acquisitions or alliances effectively; unanticipated difficulties or expenditures relating to the acquisition of Bats Global Markets, Inc., including, without limitation, difficulties that result in the failure to realize expected synergies, accretion, efficiencies and cost savings from the acquisition within the expected time period (if at all), whether in connection with integration, migrating trading platforms, broadening distribution of product offerings or otherwise; restrictions imposed by our debt obligations; our ability to maintain an investment grade credit rating; potential difficulties in our migration of trading platforms and our ability to retain employees as a result of the acquisition; and the accuracy of our estimates and expectations. More detailed information about factors that may affect our actual results to differ may be found in our filings with the SEC, including in our Annual Report on Form 10-K for the year ended December 31, 2016 and other filings made from time to time with the SEC.
We do not undertake, and we expressly disclaim, any duty to update any forward-looking statement whether as a result of new information, future events or otherwise, except as required by law. Readers are cautioned not to place undue reliance on these forward-looking statements, which speak only as of the date hereof.
Trademarks: Cboe®, Bats®, BZX®, BYX®, EDGX®, EDGA®, Cboe Volatility Index® and VIX® are registered trademarks and Cboe Global MarketsSM and C2SM are service marks of Cboe Global Markets, Inc. and its subsidiaries. All other trademarks and service marks are the property of their respective owners. © 2017 Cboe Global Markets, Inc. All rights reserved.
Cautionary Statements Regarding Forward-Looking Information

Strategic ReviewEdward TillyChairman and CEO

5
Users find utility trading VIX Index options and futures, regardless of the VIX level
3Q17 adjusted diluted EPS of $0.89 on net revenue of $270 million
Continued growth in proprietary index products fueled 3Q17 results
VIX Index options and futures set new quarterly trading highs
¹2017 TD through September 30, 2017
Growth in Proprietary Index Suite Continued to Drive Revenue and Earnings
1.64 1.74 1.94 1.85 2.07
0.24 0.240.26 0.31
0.33
3Q16 4Q16 1Q17 2Q17 3Q17
Index Options VIX Futures
Quarterly ADV for Index Suite: Index Options and VIX Futures(in millions)
1.88 1.982.20 2.16 2.40
1.22 1.48 1.61 1.62 1.72 1.950.09
0.160.20 0.21
0.240.30
2012 2013 2014 2015 2016 2017 TD¹
Index Options VIX Futures
Annual ADV for Index Suite: Index Options and VIX Futures(in millions)
1.64 1.831.81
1.31
1.962.25

6
Strengthening our Position as a Leading Global Exchange Operator
• 11% increase in ADV for 3Q17 versus 3Q16
• 26% increase in ADV for Index options
• Record quarterly ADV in VIX index options
Options
• Market share of 19.2% vs 20.8% in 3Q16• Lower volatility; tougher comparisonsU.S. Equities
• 36% increase in ADV for 3Q17 versus 3Q16• Second consecutive quarterly ADV record in VIX futures Futures
• Market share of 21.1% vs 23.0% in 3Q161
• Net capture up 8% European Equities
• 3Q17 volume up 13% vs 3Q16, net capture down 3%• Market share of 12.9% vs 12.4% in 3Q162Global FX
1Market share based on notional value traded.
2Market share represents Cboe FX volume divided by total volume of publicly reporting spot FX venues (Cboe FX, EBS, Thomson Reuters and FastMatch), which reflects readily available data from publicly reporting venues.
Div
ers
ifie
d P
rod
uct
Off
eri
ng

7
3Q17 Highlights:
• Added 23 new ETF launches
• iShares transferred 30 ETFs to Cboe
YTD through September:
• Executed 22% of trades
• Captured 38% of new listings and 62% of transfers
• 11% market share of all U.S. ETPs
Optimistic about growth prospects
¹YTD and 2017 TD through September 30, 2017
U.S. Equities: Growing ETF Market Listings
2856
137
234
2014 2015 2016 2017 TD¹
Number of Cboe U.S. ETPs
30% 38%
25% 15%
45% 47%
2016 2017 TD¹
Cboe Nasdaq NYSE
Share of New ETF Launches
Growing ETF listings market share enhances benefits for issuing firms and provides deeper liquidity to market participants

8
Our mission: Powering potential to stay ahead of an evolving global marketplace
“This change signals how we have greatly expanded beyond our options heritage to a business with multiple asset classes and a much larger global footprint to serve customers and deliver enhanced value to shareholders.”
–Edward Tilly, Chairman and CEO
Rebranding Unveiled: Cboe Global Markets

9
Committed to Driving GrowthThrough Product Innovation
Index Name Index Ticker Trading Symbol
S&P Financial Select Sector Index IXM SIXM
S&P Energy Select Sector Index IXE SIXE
S&P Technology Select Sector Index IXT SIXT
S&P Health Care Select Sector Index IXV SIXV
S&P Utilities Select Sector Index IXU SIXU
S&P Consumer Staples Select Sector Index IXR SIXR
S&P Industrials Select Sector Index IXI SIXI
S&P Consumer Discretionary Select Sector Index IXY SIXY
S&P Materials Select Sector Index IXB SIXB
S&P Real Estate Select Sector Index IXRE SIXRE
Plan to launch options on 10 S&P Select Sector Indices
Provides exposure to widely followed U.S. equity sectors
Expected to appeal to European investors seeking targeted exposure to key U.S. equity benchmarks
Plan to launch by year end
10
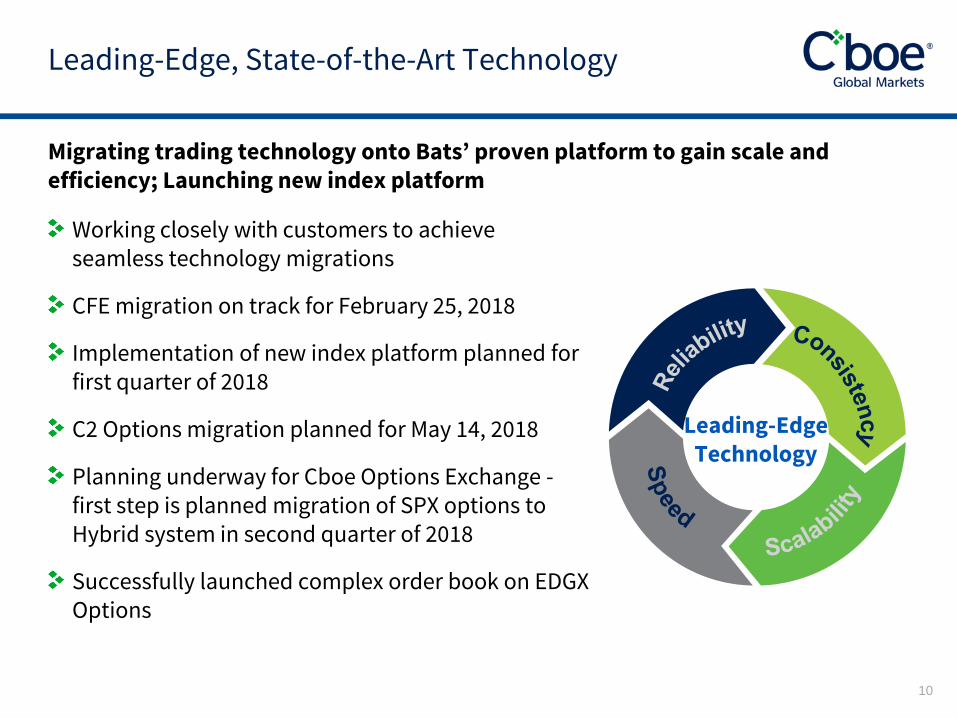
Migrating trading technology onto Bats’ proven platform to gain scale and efficiency; Launching new index platform
Leading-Edge, State-of-the-Art Technology
Working closely with customers to achieve seamless technology migrations
CFE migration on track for February 25, 2018
Implementation of new index platform planned for first quarter of 2018
C2 Options migration planned for May 14, 2018
Planning underway for Cboe Options Exchange -first step is planned migration of SPX options to Hybrid system in second quarter of 2018
Successfully launched complex order book on EDGX Options
Leading-EdgeTechnology

11
Acquired assets of Silexx, developer and operator of a multi-asset order and execution management system
Caters to institutional customers throughout the U.S.
Platform supports equities, options and futures trading
Provides access to more than 40 global markets, including Europe and Asia
Leading-Edge, State-of-the-Art Technology

12
Operational readiness
• Allow customers ample time for testing
• Completed fourth and final software release
Providing value-added products and services
• Cboe LIS - block trading platform that leverages BIDS technology
• Periodic auctions
• Buy-side trade reporting
Providing Seamless Trading Solutions in Preparation for MiFID II; Focus on Operational Readiness

13
Held just outside of London from September 11-13
Included team members from Cboe’s new product lines, including FX products and European Equities
Attracts sophisticated traders who are early adopters of our new products
Seamless Trading Solutions: Customer Education and Collaboration
Record attendance at sixth annual Cboe Risk Management Conference Europe 2017

14

Financial OverviewAlan DeanEVP, CFO and Treasurer

16
3Q17 Financial Overview
Adjusted Combined Financial Results¹($ in millions, except per share)
3Q17 3Q16 $ Change % Change
Net Revenue¹,² $269.7 $245.0 $24.7 10%
Adjusted Operating Expenses¹ 101.9 103.4 -1.5 -2%
Adjusted Operating Income¹ $167.8 $141.6 $26.2 19%
Adjusted Operating Margin¹ 62.2% 57.8% 440 bps
Adjusted Net Income Allocated to Common Stockholders¹ $100.1 $ 80.1 $20.0 25%
Adjusted Diluted EPS¹ $ 0.89 $ 0.72 $0.17 24%
Adjusted EBITDA¹ $180.9 $155.7 $25.2 16%
Adjusted EBITDA Margin¹ 67.1% 63.6% 350 bps
¹Adjusted to reflect the impact of certain items. See Appendix for “Non-GAAP Information.”
²Net revenue referenced in this presentation represents revenue less cost of revenue.

Financial ReviewBrian SchellDeputy CFO

18
Net transaction fees up 14%; non-transaction revenue up 5%
Net transaction fee increase driven by growth in proprietary index products
Exchange services and other fees up $2.6MM primarily due to fee adjustments implemented January 1
Other revenue up $3.1MM primarily due to higher licensing revenue
Regulatory fees down $2.0MM as a result of lower regulatory costs
Net Revenue Growth Supported by BothTransaction and Non-Transaction Revenue
Adjusted CombinedNet Revenue¹(in millions)
3Q17 3Q16 % Chg
Net transaction fees $179.6 $157.6 14%
Access fees 30.1 30.5 -1%
Exchange services and other fees 20.0 17.4 15%
Market data fees 46.8 44.7 5%
Regulatory fees 7.6 9.6 -21%
Royalty fees (22.1) (19.4) 14%
Other revenue 7.7 4.6 67%
Total¹ $269.7 $245.0 10%
¹Adjusted to reflect the impact of certain items. See Appendix for “Non-GAAP Information.”

19
¹Adjusted to reflect the impact of certain items. See Appendix for “Non-GAAP Information.”
*Segment detail for 3Q17 excludes Corporate net revenue of $0.2 million
Strengthening our Position as a Leading Global Exchange Operator
Div
ers
ifie
d P
rod
uct
Off
eri
ng
$10.4 $11.3$15.9 $18.4
$28.4$38.9
$71.1$70.2
$119.2
$130.7
3Q16 3Q17
$245.0
$269.7*
Adjusted Combined Net Revenue1
• 10% increase in net revenue
• 11% increase in ADV ; 5% increase in RPCOptions
• 1% decline in net revenue
• Lower volatility; Industry ADV down 8%U.S. Equities
• 37% increase in net revenue• 36% increase in ADV; 3% increase in RPC Futures
• 16% increase in net revenue• Lower market share offset by 8% increase in
net capture
European
Equities
• 9% increase in net revenue• 13% increase in ADV; 3% decline in net
captureGlobal FX
20
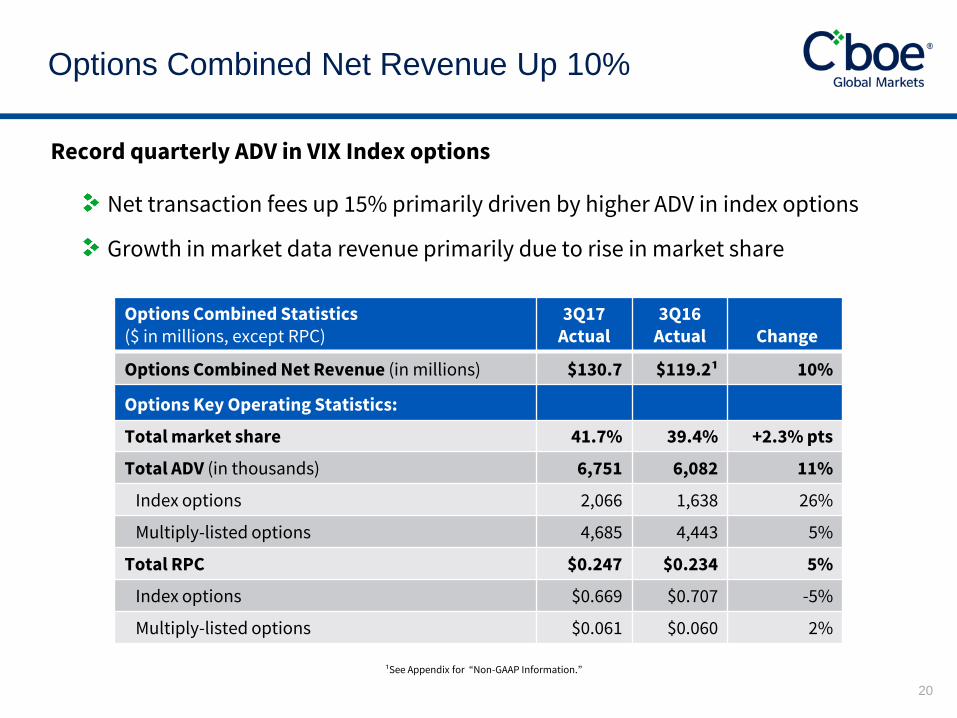
Net transaction fees up 15% primarily driven by higher ADV in index options
Growth in market data revenue primarily due to rise in market share
¹See Appendix for “Non-GAAP Information.”
Options Combined Net Revenue Up 10%
Record quarterly ADV in VIX Index options
Options Combined Statistics ($ in millions, except RPC)
3Q17Actual
3Q16Actual Change
Options Combined Net Revenue (in millions) $130.7 $119.2¹ 10%
Options Key Operating Statistics:
Total market share 41.7% 39.4% +2.3% pts
Total ADV (in thousands) 6,751 6,082 11%
Index options 2,066 1,638 26%
Multiply-listed options 4,685 4,443 5%
Total RPC $0.247 $0.234 5%
Index options $0.669 $0.707 -5%
Multiply-listed options $0.061 $0.060 2%

21
Futures Net Revenue Up 37%
Futures Statistics 3Q17Actual
3Q16Actual Change
Futures Net Revenue (in millions) $38.9 $28.4 37%
Futures Key Operating Statistics:
Total ADV (in thousands) 331 244 36%
Total RPC $1.752 $1.709 3%
VIX futures set second consecutive quarter of record ADV
36% increase in ADV in 3Q17 vs 3Q16
3% increase in RPC in 3Q17 vs 3Q16
• RPC increase primarily due to fee changes implemented in January 2017

22
Proprietary Products Drove 15% Organic Revenue Growth
8%
5%
15.0%
1Q17
2Q17
3Q17
Cboe Organic Revenue¹Quarterly Y-O-Y Growth Rate
¹See Appendix for “Non-GAAP Information.”
31.2% 36.1%
20.4% 16.9%
48.4% 47.0%
3Q17 3Q16
Non-proprietary Futures Index options
Mix of Proprietary Products to Total Net Combined Transaction Fees
63.9%68.8%

23
Low volatility environment dampened trading volumes
Increase in non-transaction revenue nearly offset decline in net transaction fees
Growth in market data fees driven by both pricing changes and expanded usage
Continued growth in ETF listings and market share
Maintained position as second-largest U.S. equities market operator in 3Q17
U.S. EquitiesCombined Net Revenue Down 1%
U.S. Equities Combined Statistics 3Q17 3Q16 Change
U.S. Equities Net Revenue (in millions) $70.2 $71.1 -1%
U.S. Equities Key Operating Statistics:
Total market share 19.2% 20.8% -1.6% pts
Market ADV (shares in billions) 6.1 6.6 -8%
ADV (matched shares in billions) 1.2 1.5 -14%
Net revenue capture (per 100 touched shares) $0.022 $0.022 --

24
Revenue increase reflects growth in net transactions fees and non-transaction fees
Growth in net transaction fees driven by increase in net capture, offset somewhat by lower market share
Increase in non-transaction revenue primarily driven by pricing changes implemented in January
European Equities Combined Net Revenue Up 16%
European Equities Combined Statistics 3Q17 3Q16 Change
European Equities Net Revenue (in millions) $18.4 $15.9 16%
European Equities Key Operating Statistics:
Total market share 21.1% 23.0% -1.9% pts
Market ADNV (Euros, in billions) €41.1 €39.8 3%
Net capture (per matched notional value, in basis points) 0.168 0.156 8%

25
Continued momentum in growing transaction and non-transaction revenue
Net revenue growth driven by 9% increase in net transaction fees
Cboe FX market share of 12.9% matched high reached in 1Q17
Global FXCombined Net Revenue Up 9%
Global FX Combined Statistics 3Q17 3Q16 Change
Global FX Net Revenue (in millions) $11.3 $10.4 9%
Global FX Key Operating Statistics:
Market share 12.9% 12.4% 0.5% pts
Average Daily Notional Value ($ in billions) $29.0 $25.7 13%
Net revenue (per one million dollars traded) $2.63 $2.70 -3%
26
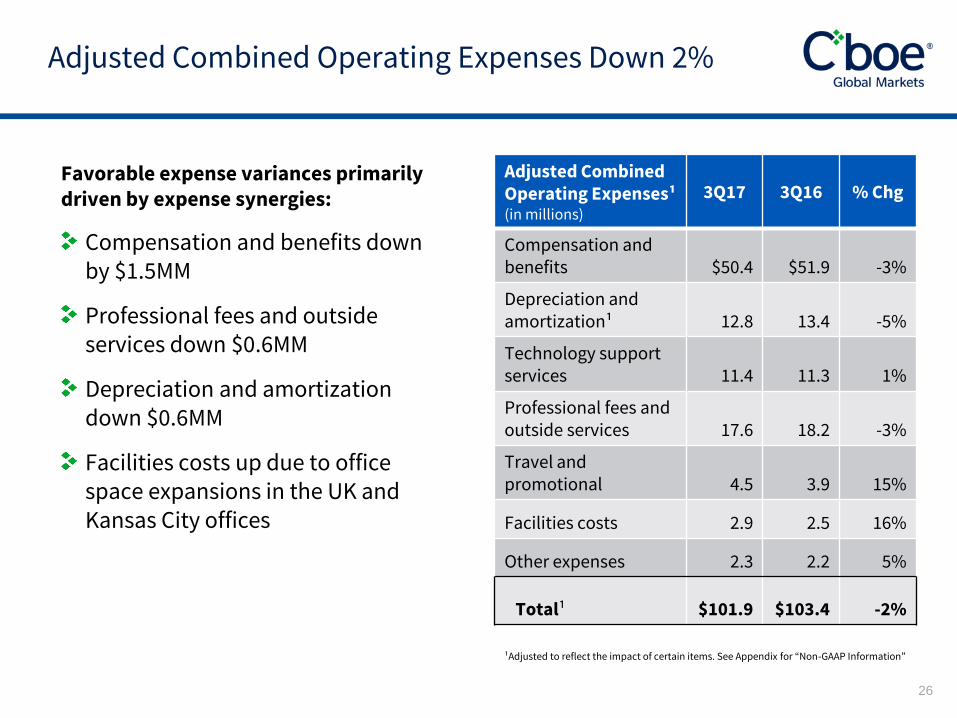
Adjusted Combined Operating Expenses Down 2%
¹Adjusted to reflect the impact of certain items. See Appendix for “Non-GAAP Information”
Favorable expense variances primarily driven by expense synergies:
Compensation and benefits down by $1.5MM
Professional fees and outside services down $0.6MM
Depreciation and amortization down $0.6MM
Facilities costs up due to office space expansions in the UK and Kansas City offices
Adjusted CombinedOperating Expenses¹(in millions)
3Q17 3Q16 % Chg
Compensation and benefits $50.4 $51.9 -3%
Depreciation and amortization¹ 12.8 13.4 -5%
Technology support services 11.4 11.3 1%
Professional fees and outside services 17.6 18.2 -3%
Travel and promotional 4.5 3.9 15%
Facilities costs 2.9 2.5 16%
Other expenses 2.3 2.2 5%
Total¹ $101.9 $103.4 -2%
¹Adjusted to reflect the impact of certain items. See Appendix for “Non-GAAP Information”

27
Increasing targeted annualized GAAP run rate synergies to $30MM for 2017
Incremental year 1 run-rate cost synergies primarily a result of better utilization of technology resources
Synergies realized in 3Q17 of $7.6MM pre-tax; $17.1MM YTD¹
Realization of Year 1 Cost Synergies Running Ahead of Initial Projections
$15
$35
$50$60
$65
$30
YR 1 YR 2 YR 3 YR 4 YR 5
Targeted Run-Rate Cost Synergies as of September 30, 2017 (in millions)
Target as of Sept. '16 Target as of Sept. '17
¹YTD through September 30, 2017

28
Updating 2017 Full-Year Guidance
As of November 7, 2017($ in millions)
Updated 2017 Adjusted Combined Full-Year
Guidance
Previous 2017 Adjusted Combined Full-Year Guidance
2016 Adjusted Combined
Comparison
Adjusted combined operatingexpenses²
$413 to $415 $415 to $423
(expect to be at low end of range)
$417¹
Depreciation and amortization (excluding amortization of acquired intangible assets)
$52 to $54 $52 to $54 $56
Capital expenditures $49 to $53 $55 to $60 $53
Effective tax rate3,4 36.0% to 37.0% 35.5% to 37.5%
¹See “Non-GAAP Information” in the appendix for reconciliation.2Adjusted operating expenses exclude:
• acquisition-related expenses of $75.4 million, which represents expenses recognized through September 30, 2017 • accelerated stock-based compensation of $9.1 million - recognized in 1Q17• amortization of acquired intangible assets of $169 million
The company plans to include these adjustments in its non-GAAP reconciliation. ³Based on adjusted combined earnings for the full-year 2017. 4The effective tax rate on GAAP earnings for the year is expected to be in the range of 37.5 percent to 38.5 percent compared with previous guidance of 36.5 percent to 38.5 percent.

29
Preserving balance sheet flexibility is a priority
Invest in the growth of our business
De-lever – reduced debt by $100 million in 3Q17; $325 million YTD
Return capital through dividends
Maintain an opportunistic approach towards share repurchases
¹Adjusted to reflect the impact of certain items. See Appendix for “Non-GAAP Information.”
Focused on Efficient Allocation of Capital to Create Long-Term Shareholder Value
Debt Outstanding($ in millions)
Sept. 30, 2017
3.650% Senior Notes (10Y) $ 650
1.950% Senior Notes (2Y) 300
Term Loan Facility 375
Total Debt (Gross) $ 1,325
Debt to EBITDA TTM¹ 1.9x
Adjusted Cash & Financial Investments¹ $127

30
Footnotes applied here
Delivering on Sources of Operating Leverage and Key Strategic Initiatives
• Focused on growing proprietary products
• Generated strong organic growth
Growth of Core
Proprietary Products
• Grew base of non-transaction revenueDiversification and
Stabilization of Revenue Stream
• Disciplined expense management
• Provided higher operating marginsScale of Business Model
• Continued to realize cost synergies and accelerate
run rate Synergies Realization
• De-levered to enhance balance sheet flexibility
• Leverage ratio of 1.9X
• Returned capital through quarterly dividendsCapital Allocation

3131
Questions & Answers

32
Appendix Materials

33
S&P 500 Index (SPX) Options, the most actively traded U.S. index option
SPX Index options ADV up 12% YTD¹
VIX Index options ADV up 22% YTD¹
• Reached new single-day trading record on September 25
• Set new quarterly ADV record in 3Q17
*Includes SPX Weeklys
¹YTD and 2017 TD through September 30, 2017
Focused on Growing Higher-Margin Proprietary Index Options
443567
632573 588
739
2012 2013 2014 2015 2016 2017 TD¹
VIX OptionsVIX Options ADV(in thousands)
698823 888 939
1,0241,119
2012 2013 2014 2015 2016 2017 TD¹
SPX Options ADV* by Year(in thousands)

34
VIX futures trades nearly 24X5
VIX futures ADV up 24% YTD¹ versus same period last year
Achieved second consecutive quarterly ADV record in 3Q17
Trading in non-U.S. hours accounts for nearly 10% of trading YTD¹
Futures – Home of VIX Futures Trading
$1.709$1.683
$1.814$1.762 $1.752
3Q16 4Q16 1Q17 2Q17 3Q17
VIX Options
VIX Futures Quarterly RPC
95
159
200 205239
297
2012 2013 2014 2015 2016 2017 TD¹
VIX OptionsVIX Futures ADV(in thousands)
¹YTD and 2017 TD through September 30, 2017
35
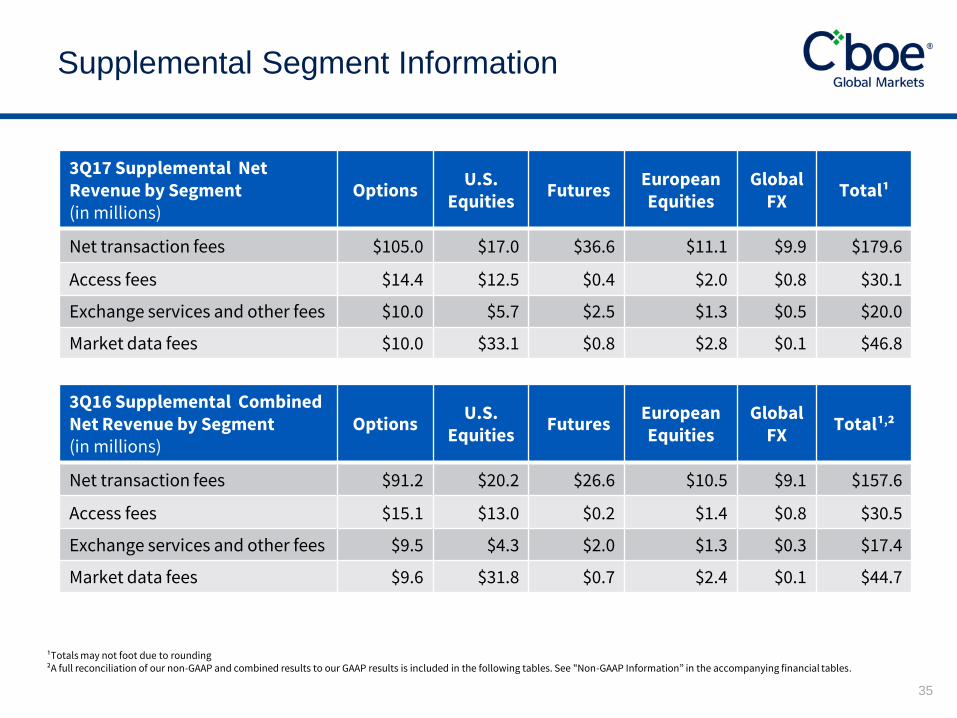
Supplemental Segment Information
3Q17 Supplemental Net Revenue by Segment (in millions)
OptionsU.S.
EquitiesFutures
European Equities
Global FX
Total¹
Net transaction fees $105.0 $17.0 $36.6 $11.1 $9.9 $179.6
Access fees $14.4 $12.5 $0.4 $2.0 $0.8 $30.1
Exchange services and other fees $10.0 $5.7 $2.5 $1.3 $0.5 $20.0
Market data fees $10.0 $33.1 $0.8 $2.8 $0.1 $46.8
3Q16 Supplemental CombinedNet Revenue by Segment (in millions)
OptionsU.S.
EquitiesFutures
European Equities
Global FX
Total¹,²
Net transaction fees $91.2 $20.2 $26.6 $10.5 $9.1 $157.6
Access fees $15.1 $13.0 $0.2 $1.4 $0.8 $30.5
Exchange services and other fees $9.5 $4.3 $2.0 $1.3 $0.3 $17.4
Market data fees $9.6 $31.8 $0.7 $2.4 $0.1 $44.7
¹Totals may not foot due to rounding²A full reconciliation of our non-GAAP and combined results to our GAAP results is included in the following tables. See "Non-GAAP Information” in the accompanying financial tables.

36
Non-GAAP Information

37
Non-GAAP Information
In addition to disclosing results determined in accordance with GAAP, Cboe Global Markets has disclosed certain non-GAAP measures of operating performance. These measures are not in accordance with, or a substitute for, GAAP, and may be different from or inconsistent with non-GAAP financial measures used by other companies. The non-GAAP measures provided in this press release include adjusted operating expenses, adjusted operating income, organic net revenue, adjusted operating margin, adjusted net income allocated to common stockholders and adjusted diluted earnings per share, EBITDA, EBITDA margin, adjusted EBITDA and adjusted EBITDA margin. The non-GAAP measures provided in this press release also include combined company financial measures that are discussed in further detail below under the sub-section "Combined Reconciliations.“
Management believes that the non-GAAP financial measures presented in this press release, including adjusted net revenue, organic net revenue and adjusted operating expenses, provide additional and comparative information to assess trends in our core operations and a means to evaluate period-to-period comparisons. Non-GAAP financial measures disclosed by management are provided as additional information to investors in order to provide them with an alternative method for assessing our financial condition and operating results.
Organic net revenue: Is a non-GAAP financial measure that excludes or has otherwise been adjusted for the impact of our acquisition of Bats. Management believes the organic net revenue growth measure provides users with supplemental information regarding the company's ongoing revenue performance and trends by presenting revenue growth excluding the impact of the Bats acquisition.
Amortization expense of acquired intangible assets: We amortize intangible assets acquired in connection with various acquisitions. Amortization of intangible assets is inconsistent in amount and frequency and is significantly affected by the timing and size of our acquisitions. As such, if intangible asset amortization is included in performance measures, it is more difficult to assess the day-to-day operating performance of the businesses, the relative operating performance of the businesses between periods and the earnings power of the company. Therefore, we believe performance measures excluding intangible asset amortization expense provide investors with an additional basis for comparison across accounting periods.
Acquisition-related expenses: From time to time, we have pursued small bolt-on acquisitions and in 2017 completed a larger transformative acquisition, which have resulted in expenses which would not otherwise have been incurred in the normal course of the company's business operations. These expenses include integration costs, as well as legal, due diligence and other third party transaction costs. The frequency and the amount of such expenses vary significantly based on the size, timing and complexity of the transaction. Accordingly, we exclude these costs for purposes of calculating non-GAAP measures which provide an additional analysis of Cboe’s ongoing operating performance or comparisons in Cboe’s performance between periods.
Other significant items: We have excluded certain other charges that are the result of other non-comparable events to measure operating performance. For 2017, other significant items primarily included interest and other borrowing costs incurred prior to the close of the Bats transaction and accelerated stock-based compensation that was incurred due to a change in the vesting schedule for equity award grants. In addition to disclosing results determined in accordance with GAAP, Cboe Holdings has disclosed certain non-GAAP measures of operating performance.

38
Non-GAAP Information
Reconciliation of Supplemental Combined Net Revenue by Segment for Options
Three months ended September 30, 2016
(in millions)
CBOE Historical
Bats Historical Combined
Net transaction fees $84.8 $6.4 $91.2
Access fees $13.0 $2.1 $15.1
Exchange services and other fees $9.5 --- $9.5
Market data fees $8.2 $1.4 $9.6
Note: There are no reconciliations applicable for the other segments.

39
Non-GAAP Information
Table 1
Third Quarter Results 3Q17 3Q16 Adjusted
($ in millions except per share) Adjusted1 Combined1
Total Revenue Less Cost of Revenue $ 269.7 $ 136.2 98% $ 269.7 $ 245.0 10%
Total Operating Expenses $ 150.4 $ 70.4 114% $ 101.9 $ 103.4 -2%
Operating Income $ 119.3 $ 65.8 81% $ 167.8 $ 141.6 19%
Operating Margin % 44.2 % 48.3 % -410 bps 62.2 % 57.8 % 440 bps
Net Income Allocated to Common Stockholders $ 59.7 $ 40.3 48% $ 100.1 $ 80.1 25%
Diluted EPS $ 0.53 $ 0.50 6% $ 0.89 $ 0.72 24%
EBITDA $ 171.2 $ 77.6 121% $ 180.9 $ 155.7 16%
EBITDA Margin % 63.5 % 57.0 % 650 bps 67.1 % 63.6 % 350 bps
Change Change3Q17 3Q16
¹A full reconciliation of our non-GAAP and combined results to our GAAP results are available in this section.

40
Non-GAAP Information
Table 3
(in millions) 2017 2016 2017 2016
Reconciliation of Revenue Less Cost of Revenue to Organic Net Revenue
Revenue less cost of revenue (net revenue) $ 269.7 $ 136 266.9$ 144.1$ 193.4$ 143.1$
Recent acquisitions:
(112.6) - (114.9) - (39.2) -
Organic net revenue $ 157.1 $ 136 152.0$ 144.1$ 154.2$ 143.1$
Three Months Ended
June 30,
Three Months Ended
March 31,
Bats revenue less cost of revenue
20162017
Three Months Ended
September 30,
Table 2
Revenue Less Cost of Revenue by Business Segment
(in millions) 3Q17
3Q16
Combined
Options¹ 130.7$ 107.8$ 21% 119.2$ 10%
U.S. Equities 70.2 - - 71.1 -1%
Futures 38.9 28.4 37% 28.4 37%
European Equities 18.4 - - 15.9 16%
Global FX 11.3 - - 10.4 9%
Corporate 0.2 - - - -
Total 269.7$ 136.2$ - 245.0$ 10%
Change Change3Q16
¹A full reconciliation of our non-GAAP and combined results to our GAAP results are available in this section.

41
Non-GAAP Information (see footnotes on slide 46)Reconciliation of GAAP and non-GAAP InformationThe information below shows the reconciliation of each financial measure from GAAP to non-GAAP. The non-GAAP financial measures exclude the impact of those items detailed below and are referred to as adjusted financial measures.
Table 4
(in millions, except per share amounts) 2017 2016 2017 2016
Reconciliation of Net Income Allocated to Common Stockholders to Non-GAAP (As shown on Table 1)
GAAP net income allocated to common stockholders 59.7$ 40.3$ 142.1$ 140.0$ Non-GAAP adjustments Compensation and benefits (1) - 0.2 9.1 1.3 Acquisition-related expenses (2) 5.5 8.6 75.4 9.3 Amortization of acquired intangible assets (3) 42.6 0.3 99.6 0.9 Assessment of computer-based lease taxes for prior period use - - - 0.3 Change in contingent consideration 0.4 - 1.1 -
Debt issuance cost - - 0.9 - Impairment of convertible notes receivable 3.8 - 3.8 -
Change in redemption value of non-controlling interests 0.2 0.3 0.8 0.8 Interest and other borrowing costs (4) - 0.2 4.3 0.2 Less: Legal settlement (5) - - - (5.5) Gain on settlement of contingent consideration - (1.4) - (1.4)
Total Non-GAAP adjustments 52.5 8.2 195.0 5.9 Income tax expense related to the items above (19.1) (3.0) (73.1) (2.0) Re-measurement of deferred tax assets and liabilities as a result of corporate rate increase in Illinois 7.4 - 7.4 - Uncertain tax position related to research and development credits - 1.7 - 1.7 Net income allocated to participating securities - effect on reconciling items (0.4) - (1.1) -
Adjusted net income allocated to common stockholders 100.1$ 47.2$ 270.3$ 145.6$
Reconciliation of Diluted EPS to Non-GAAPDiluted earnings per common share 0.53$ 0.50$ 1.34$ 1.72$ Per share impact of non-GAAP adjustments noted above 0.36$ 0.08$ 1.22$ 0.07$ Adjusted diluted earnings per common share 0.89$ 0.58$ 2.56$ 1.79$
Reconciliation of Operating Margin to Non-GAAPRevenue less cost of revenue 269.7$ 136.2$ 730.0$ 423.4$ Non-GAAP adjustments noted above - 1.4 - 1.4 Adjusted revenue less cost of revenue 269.7 134.8 730.0 422.0 Operating expenses 150.4 70.4 466.8 200.1 Non-GAAP adjustments noted above (48.5) (9.1) (185.2) (11.8) Adjusted operating expenses 101.9 61.3 281.6 188.3 Operating income 119.3 65.8 263.2 223.3 Non-GAAP adjustments noted above 48.5 9.1 185.2 11.8 Adjusted operating income 167.8$ 74.9$ 448.4$ 235.1$ Adjusted operating margin (6) 62.2% 55.6% 61.4% 55.7%
Three Months Ended
September 30,
Nine Months Ended
September 30,

42
Non-GAAP Information
EBITDA Reconciliations
EBITDA (earnings before interest, income taxes, depreciation and amortization) is a widely used non-GAAP financial measure of operating performance. EBITDA margin represents EBITDA divided by revenues less cost of revenues (net revenue). It is presented as supplemental information that the company believes is useful to investors to evaluate its results because it excludes certain items that are not directly related to the company’s core operating performance. EBITDA is calculated by adding back to net income interest expense, income tax expense, depreciation and amortization. EBITDA should not be considered as substitutes either for net income, as an indicator of the company’s operating performance, or for cash flow, as a measure of the company’s liquidity. In addition, because EBITDA may not be calculated identically by all companies, the presentation here may not be comparable to other similarly titled measures of other companies.
EBITDA margin represents EBITDA divided by net revenue.

43
Non-GAAP Information
(1) EBITDA margin represents the respective EBITDA divided by the respective net revenue as shown in the non-GAAP reconciliations provided.
(2) Combined results for the three months ended September 30, 2017 are the same as the actual results as the company was operating as a combined entity for the entire quarter.
Table 5
(in millions) 2017 2016 2017 2016
Reconciliation of Net Income Allocated to Common Stockholders to EBITDA and Adjusted EBITDA (Per Table 1)
Net income allocated to common stockholders 59.7$ 40.3$ 142.1$ 140.0$ Interest 10.5 0.2 30.9 0.2 Income tax provision 45.6 26.9 86.8 91.1 Depreciation and amortization 55.4 10.2 136.3 34.4
EBITDA 171.2$ 77.6$ 396.1$ 265.7$
EBITDA Margin¹ 63.5 % 57.0 % 54.3 % 62.8 %
Non-GAAP adjustments not included in above line items Compensation and benefits (accelerated stock-based compensation) - 0.2 9.1 1.3 Acquisition-related expenses 5.5 8.6 75.4 9.3
Impairment of convertible notes receivable 3.8 - 3.8 - Less: Legal settlement - - - (5.5) Gain on settlement of contingent consideration - (1.4) - (1.4)
Other 0.4 - 1.1 0.3
Adjusted EBITDA 180.9$ 85.0$ 485.5$ 269.7$
Adjusted EBITDA Margin¹ 67.1 % 62.4 % 66.5 % 63.7 %
(in millions)
Reconciliation of Combined Net Income Allocated to Common Stockholders to EBITDA and Adjusted EBITDA (Per Table 1) 20172
2016 2017 2016
Combined revenues less cost of revenues 245.0$ 801.9$ 754.2$ Combined net income allocated to common stockholders 52.6 201.3 170.1 Interest 11.1 35.0 32.7 Income tax provision 36.4 114.5 112.0 Depreciation and amortization 55.8 166.5 171.1
Combined EBITDA 155.9$ 517.3$ 485.9$
Combined EBITDA Margin¹ 63.6 % 64.5 % 64.4 %
Non-GAAP adjustments not included in above line items - - - Compensation and benefits (accelerated stock-based compensation) - 9.1 1.1 Acquisition-related expenses - - 0.2
Impairment of convertible notes receivable - 3.8 - Less Legal settlement - - (5.5) Gain on settlement of contingent consideration (1.4) - (1.4)
Other 1.2 1.5 5.7 Adjusted Combined EBITDA 155.7$ 531.7$ 486.0$ Adjusted Combined EBITDA Margin¹ 63.6 % 66.3 % 64.4 %
September 30, September 30,

44
Non-GAAP InformationThe following non-GAAP unaudited combined financial measures have been prepared by recording combined adjustments to the historical consolidated financial statements of Cboe Global Markets. The combined financial measures for the three months ended September 30, 2016 have been prepared as if the Bats acquisition closed on January 1, 2016.
Due to the transformative nature of the Bats acquisition, the company believes that providing a discussion of its results and operations on a non-GAAP combined basis provides management and investors an additional perspective on the company's financial and operational performance and trends.
These combined financial measures are not necessarily indicative of the financial position or results of operations that would have occurred had the transactions been effected on the assumed dates. Additionally, future results may vary significantly from the results reflected in the combined financial measures.
Options Net Revenue - Three Months Ended September 30, 2016 - Table 6
(in millions)Cboe
HistoricalBats
HistoricalCombined
(Per Table 2)
Total net revenue $107.8 $11.4 $119.2
Note: There are no reconciliations applicable for the other segments.

45
Non-GAAP Information (see footnotes on slide 46)
Three months ended September 30, 2016 - Table 7
(in millions, except per share amounts)
Cboe
Historical
Bats
Historical¹ Combined
Adjusted
CombinedRevenues 168.7$ 441.6$ 610.3$ 610.3$ Cost of revenues 32.5 332.8 365.3 365.3 Net revenue: Net transaction fees 111.4 46.2 157.6 157.6 Access fees 13.0 17.5 30.5 30.5 Exchange services and other fees 11.4 6.0 17.4 17.4 Market data fees 8.3 36.4 44.7 44.7 Regulatory fees 9.1 0.5 9.6 9.6 Royalty fees (19.4) - (19.4) (19.4) Other 2.4 2.2 4.6 4.6
Revenues less cost of revenues 136.2$ 108.8$ 245.0$ 245.0$
Operating expenses: Compensation and benefits 28.3 23.6 51.9 - (3) 51.9 Depreciation and amortization 10.2 10.4 35.2 (1) 55.8 (42.4) (3) 13.4 Technology support services 5.6 5.7 11.3 11.3 Professional fees and outside services 12.7 9.4 (3.4) 18.7 (0.5) (3) 18.2 Travel and promotional expenses 2.6 1.3 3.9 3.9 Facilities costs 1.3 1.2 2.5 2.5 Acquisition related costs 8.6 - (8.6) - - Change in contingent consideration - 0.5 0.5 (0.5) (3) - Other expenses 1.1 1.1 2.2 2.2 Total operating expenses 70.4$ 53.2$ 23.2$ 146.8$ (43.4)$ 103.4$ Operating income 65.8 55.6 (23.2) 98.2 43.4 141.6 Operating margin (4) 48.3 % 51.1 % 40.1 % 57.8 %
Non-operating (expense)/income 1.6 (7.1) (3.5) (2) (9.0) (1.2) (10.2)
Income (loss) before income tax provision 67.4 48.5 (26.7) 89.2 42.2 131.4
Income tax provision 26.9 20.0 (10.5) 36.4 15.0 51.4
Net income allocated to common stockholders 40.3$ 28.5$ (16.2)$ 52.6$ 27.5$ 80.1$ Diluted EPS 0.50$ 0.29$ 0.49$ -$ 0.72$
Total non-transaction revenue 44.2$ 62.6$ -$ 106.8$ -$ 106.8$
Total non-transaction revenue as a percent of revenues
less cost of revenues (5) 32.5 % 57.5 % 43.6 % 43.6 %
Combined
Adjustments
Non-GAAP
Adjustments

46
Non-GAAP Information
Table 4 Footnotes:
(1) For the third quarter of 2016, this amount includes $0.2 million for accelerated stock-based compensation expenses. For the nine months
ended September 30, 2017, this amount includes $9.1 million for accelerated stock-based compensation expense. For the nine months ended
September 30, 2016, this amount includes $0.7 million for accelerated stock-based compensation expenses and $0.6 million in additional bonus
accrual resulting from legal settlement income.
(2) This amount includes professional fees and outside services, severance, and other costs related to the company's acquisition of Bats.
(3) This amount represents the amortization of acquired intangible assets for Bats.
(4) This amount represents interest and other borrowing costs incurred prior to the close of the Bats acquisition.
(5) Settlement received for attorney fees and expenses relating to a litigation matter, reported in investment and other income.
(6) Adjusted operating margin represents adjusted operating income divided by adjusted revenue less cost of revenue.
Table 7 Footnotes:
¹Bats historical activity for 2016 reflects activity for the period beginning July 1, 2016 through September 30, 2016.
(1) Reflects adjustments to reduce Bats historical amortization of acquired intangibles by $6.8 million and increase amortization of acquired intangibles by $42.0 million.
(2) Reflects net other income of $3.5 million resulting from interest expense on Cboe debt less Bats historical interest expense.
(3) Reflects adjustment of amortization of purchased intangibles totaling $42.4 million and other items totaling $1.0 million.
(4) Operating margin represents operating income divided by revenue less cost of revenue.
(5) The percentage of non-transaction revenue represents the sum of access fees, exchange services and other fees, market data fees, regulatory fees and other divided by revenue less cost of revenue.
47
Non-GAAP Information
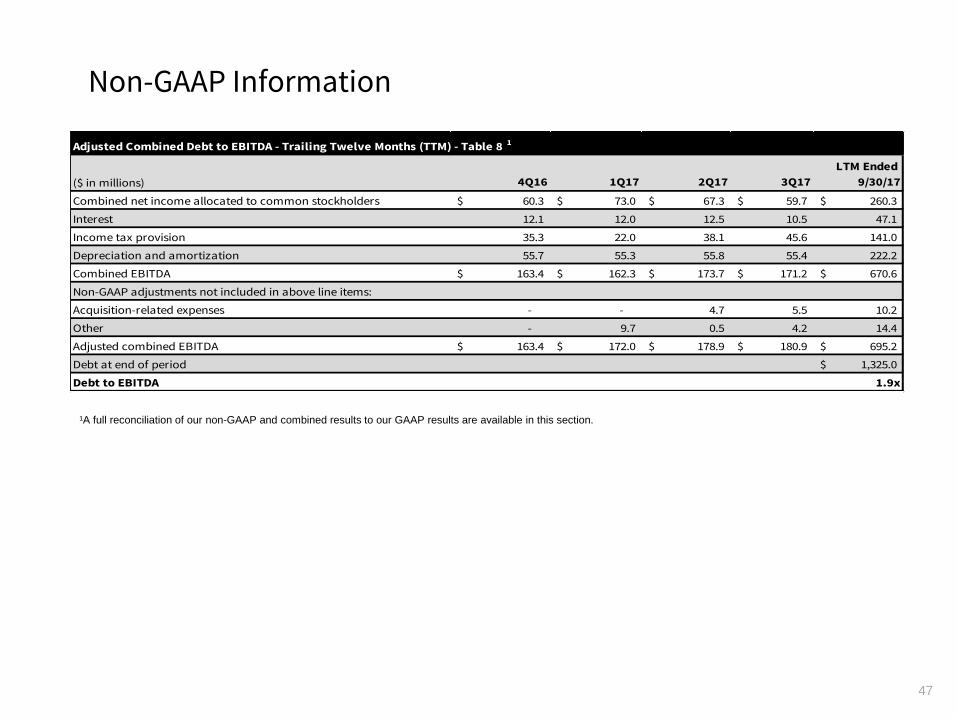
¹A full reconciliation of our non-GAAP and combined results to our GAAP results are available in this section.
($ in millions) 4Q16 1Q17 2Q17 3Q17
LTM Ended
9/30/17
Combined net income allocated to common stockholders 60.3$ 73.0$ 67.3$ 59.7$ 260.3$
Interest 12.1 12.0 12.5 10.5 47.1
Income tax provision 35.3 22.0 38.1 45.6 141.0
Depreciation and amortization 55.7 55.3 55.8 55.4 222.2
Combined EBITDA 163.4$ 162.3$ 173.7$ 171.2$ 670.6$
Non-GAAP adjustments not included in above line items:
Acquisition-related expenses - - 4.7 5.5 10.2
Other - 9.7 0.5 4.2 14.4
Adjusted combined EBITDA 163.4$ 172.0$ 178.9$ 180.9$ 695.2$
Debt at end of period 1,325.0$
Debt to EBITDA 1.9x
Adjusted Combined Debt to EBITDA - Trailing Twelve Months (TTM) - Table 8 1

48
Non-GAAP Information
Three months ended December 31, 2016 - Table 9
(in millions, except per share amounts)
Cboe
Historical
Bats
Historical¹
Combined
Adjustments
Footnote
Reference Combined
Non-GAAP
Adjustments Foot-note
Adjusted
Combined
Revenues $190.8 $315.6 $506.4 $506.4
Cost of revenues 47.8 344.7 392.5 392.5
Net revenue:
Net transaction fees 115.2 45.3 160.5 $160.5
Access fees 13.0 16.6 29.6 29.6
Exchange services and other fees 12.1 5.8 17.9 17.9
Market data fees 8.7 35.5 44.2 44.2
Regulatory fees 9.1 0.6 9.7 9.7
Royalty fees (20.2) - -20.2 -20.2
Other 5.1 1.8 6.9 6.9
Revenues less cost of revenues $143.0 $105.6 $248.6 $248.6
Operating expenses:
Compensation and benefits $29.3 $23.3 $52.6 (0.2) (4) 52.4
Depreciation and amortization 10.0 10.4 $35.3 (1) 55.7 (42.4) (4) 13.3
Technology support services 5.5 5.7 11.2 11.2
Professional fees and outside services 12.9 7.1 ($2.1) (2) 17.9 (0.4) (4) 17.5
Travel and promotional expenses 3.4 1.2 4.6 4.6
Facilities costs 1.5 1.0 2.5 2.5
Acquisition related costs 4.2 - ($4.2) (2) - -
Change in contingent consideration - 0.8 0.8 (0.8) (4) -
Other expenses 1.3 1.8 3.1 3.1
Total operating expenses $68.1 $51.3 $29.0 $148.4 (43.8) $104.6
Operating income $74.9 $54.3 ($29.0) $100.2 43.8 $144.0
Non-operating (expense)/income 0.6 (5.6) 1.2 (3) (3.8) (1.4) (5.2)
Income (loss) before income tax provision 75.5 48.7 ($27.8) 96.4 42.4 $138.8
Income tax provision 29.8 16.4 ($10.9) $35.3 16.7 $52.0
Net income allocated to participating securities (0.8) ($0.8) 0.0 (0.8)
Net income allocated to common stockholders $44.9 $32.3 ($16.9) $60.3 $26.2 $86.5
Diluted EPS $0.55 $0.34 $0.52 $0.78
(1) Reflects adjustments to reduce Bats historical amortization of acquired intangibles by $6.7 million and increase amortization of acquired intangibles by $42.0 million.(2) Reflects acquisition-related expenses relating to the acquisition of Bats.(3) Reflects net other income of $1.2 million resulting from interest expense on Cboe debt less Cboe bridge loan interest expense and Bats historical interest expense.(4) Reflects adjustment of amortization of purchased intangibles and other items totaling $1.4 million.

49
Non-GAAP Information
¹Bats Historical activity for 2016 reflects activity for the period beginning January 1, 2016 through December 31, 2016.
(1) Reflects adjustments to reduce Bats historical amortization of acquired intangibles by $28.0 million and increase amortization of acquired intangibles by $168.0 million.
(2) Reflects adjustments to reduce acquisition costs by $12.9 million for Cboes Historical and reduce professional fees for Bats historical by $5.4 million which are costs associated with the Cboe merger.
(3) Reflects adjustment of amortization of purchased intangibles totaling $169.6 million and other items totaling $26.9 million.
Adjusted Combined Operating Expenses for the Year Ended December 31, 2016 - Table 10
(in millions)
Cboe
Historical
Bats
Historical¹
Footnote
Reference
Operating expenses:
Compensation and benefits 113.1$ 92.0$ 205.1$ (1.4)$ (3) 203.7$
Depreciation and amortization 44.3 41.7 140.0 (1) 226.0 (169.6) (3) 56.4
Technology support services 22.5 23.1 45.6 (0.3) (3) 45.3
Professional fees and outside services 53.4 30.5 (5.4) (2) 78.5 (2.7) (3) 75.8
Travel and promotional expenses 11.0 5.3 16.3 (0.7) (3) 15.6
Facilities costs 5.7 4.1 9.8 9.8
Acquisition related costs 12.9 - (12.9) (2) - - -
Change in contingent consideration - 3.0 3.0 (3.0) (3) -
Other expenses 4.3 6.2 10.5 (0.5) (3) 10.0
Total operating expenses 267.2$ 205.9$ 121.7 594.8$ (178.2)$ 416.6$
Adjustments Combined
Non-GAAP
Adjustments
Foot-
note
Adjusted Combined for
the Year-Ended
December 31, 2016

50
Non-GAAP Information
Adjusted cash is a non-GAAP measure and represents cash and cash equivalents plus financial investments minus cash collected for Section 31 fees, which will need to be remitted in the near term. We have presented adjusted cash because we consider it an important supplemental measure of our liquidity and believe that it is frequently used by analysts, investors and other interested parties in the evaluation of companies.
Adjusted Cash as of September 30, 2017 - Table 11(in millions)Cash and cash equivalents $ 124.8
Financial investments 2.4
Cash collected for Section 31 fees —
Adjusted cash $ 127.2

51
Cboe Global Markets400 South LaSalle StreetChicago, IL 60605www.cboe.com
51