Embed Size (px)
Citation preview
R E P O R T
Third Quarter 2015 Remediation Progress Report SFPP Norwalk Pump Station Norwalk, California
Prepared for
Kinder Morgan Energy Partners, L.P.
October 15, 2015
CH2M HILL Engineers, Inc. 1000 Wilshire Boulevard Suite 2100 Los Angeles, California 90017
Signature Page The material and data presented in this report were prepared consistent with current and generally accepted consulting principles and practices. This work was supervised by the following CH2M HILL licensed professional.
October 15, 2015 William Breedlove Date CH2M HILL California Professional Chemical Engineer, No. 5142
EN1014151027SCO III
Contents Section Page
Signature Page ....................................................................................................................................... iii
Acronyms and Abbreviations ................................................................................................................ vii
1 Introduction ............................................................................................................................ 1-1
2 Remediation Systems .............................................................................................................. 2-1
3 Operations and Maintenance .................................................................................................. 3-1
4 Summary of Remediation Progress ......................................................................................... 4-1
5 System Evaluation and Optimization ...................................................................................... 5-1
6 Planned Fourth Quarter 2015 Activities .................................................................................. 6-1
7 References .............................................................................................................................. 7-1
Appendix
A Laboratory Analytical Reports
Tables
1 Remediation Well Construction and Status 2 Vapor Remediation System Operation Summary 3 Remediation Well Vapor Concentrations 4 Extracted Vapor Analytical Results 5 Groundwater Remediation System Operation Summary 6 Extracted Groundwater Analytical Results 7 Groundwater and Product Measurements and Elevations for Total Fluids, Groundwater,
and Soil Vapor Extraction Wells
Figures
1 Site Location Map 2 Remediation System Layout 3 Hydrographs for Select Groundwater Monitoring Wells
EN1014151027SCO V
Acronyms and Abbreviations µg/L micrograms per liter
1,2-DCA 1,2-dichloroethane
Air Tech Air Technology Laboratories
ASTM ASTM International (formerly American Society for Testing and Materials)
ATL Advanced Technology Laboratories
BTEX benzene, toluene, ethylbenzene, and total xylenes
CCTV closed-circuit television
CH2M CH2M HILL Engineers, Inc.
EPA U.S. Environmental Protection Agency
GWE groundwater extraction
GWTS groundwater treatment system
KMEP Kinder Morgan Energy Partners, L.P.
LGAC liquid-phase granular activated carbon
MTBE methyl tertiary butyl ether
NPDES National Pollutant Discharge Elimination System
O&M operations and maintenance
OWS oil-water separator
PID photoionization detector
RWQCB California Regional Water Quality Control Board, Los Angeles Region
SCAQMD South Coast Air Quality Management District
SFPP SFPP, L.P., an operating partnership of Kinder Morgan Energy Partners, L.P.
SVE soil vapor extraction
TBA tertiary butyl alcohol
TFE total fluids extraction
TGNMOC total gaseous non-methane organic carbon
TPH total petroleum hydrocarbons
TPH-d total petroleum hydrocarbons quantified as diesel
TPH-fp total petroleum hydrocarbons quantified as fuel product
TPH-g total petroleum hydrocarbons quantified as gasoline
TPH-o total petroleum hydrocarbons quantified as oil
TPH-total total petroleum hydrocarbons quantified as gasoline, diesel, and oil
VGAC vapor-phase granular activated carbon
VOC volatile organic compound
WSB West Side Barrier
EN1014151027SCO VII
SECTION 1
Introduction CH2M HILL Engineers, Inc. (CH2M) has prepared this report on behalf of SFPP, L.P. (SFPP), an operating partnership of Kinder Morgan Energy Partners, L.P., to summarize remediation activities performed at the former SFPP Norwalk Pump Station located within the Defense Fuel Support Point Norwalk, located at 15306 Norwalk Boulevard, Norwalk, California (the site; Figure 1) during the third quarter 2015 reporting period.
This progress report is submitted pursuant to a request from the California Regional Water Quality Control Board, Los Angeles Region (RWQCB) in its letter dated October 25, 2006 (RWQCB, 2006). Additional site background information can be found in the Conceptual Site Model and Proposed Alternate Interim Remedy for Soil, Groundwater, and LNAPL (CH2M, 2013a), and in previously submitted semiannual groundwater monitoring reports.
This report summarizes the remediation systems present at the site and describes remediation activities for the period of July through September 2015 with documentation of the following tasks:
• Operations and maintenance (O&M) of remediation systems performed by SFPP field personnel
• Remediation system evaluation
The remediation activities performed during July through September 2015 and the progress achieved through those activities are summarized in the following sections.
EN1014151027SCO 1-1

SECTION 2
Remediation Systems SFPP currently operates remediation systems consisting of soil vapor extraction (SVE), total fluids extraction (TFE) of free product and/or groundwater using a top-loading pump, and treatment of extracted soil vapors and groundwater to address two specific areas at and near the site: the south-central area and the southeastern area. Operation of the West Side Barrier (WSB) groundwater extraction (GWE) system (WSB system) for remediation of the western offsite area was discontinued in August 2008.
Remediation in the south-central and southeastern areas consists of SVE and TFE. At several well locations, SVE is coupled with TFE in a process referred to as dual-phase extraction. SVE is performed using a blower to remove soil vapors from the south-central and southeastern areas. The extracted vapors are conveyed to a knock-out tank that separates entrained moisture from the soil vapors. Accumulated moisture in the knock-out tank is treated by the main groundwater treatment system (GWTS) described below. The soil vapors are then treated in a thermal oxidizer where volatile organic compounds (VOCs) are converted to carbon dioxide and water prior to being discharged to the atmosphere. Operation of the GWTS and SVE is conducted in accordance with Permits to Construct (Application Nos. 569588 and 567723, respectively; ID 110835) issued by the South Coast Air Quality Management District (SCAQMD).
The main GWTS processes free product and groundwater recovered from the south-central and southeastern parts of the site. Free product and groundwater recovered by pneumatically operated top-loading total fluids pumps are piped to an oil-water separator (OWS). Free product from the OWS is collected in a storage tank and recycled at an offsite location. Water from the OWS is treated using liquid-phase granular activated carbon (LGAC). Treated water is routed through an onsite 3,000-gallon equalization tank. Two fluidized bed bioreactors installed downstream of the equalization tank treat fuel oxygenates such as tertiary butyl alcohol (TBA) and methyl tertiary butyl ether (MTBE) that are not treated in the LGAC. The treated groundwater then passes through polishing LGAC units prior to discharge in accordance with a National Pollutant Discharge Elimination System (NPDES) permit (NPDES No. CA0063509, CI No. 7497).
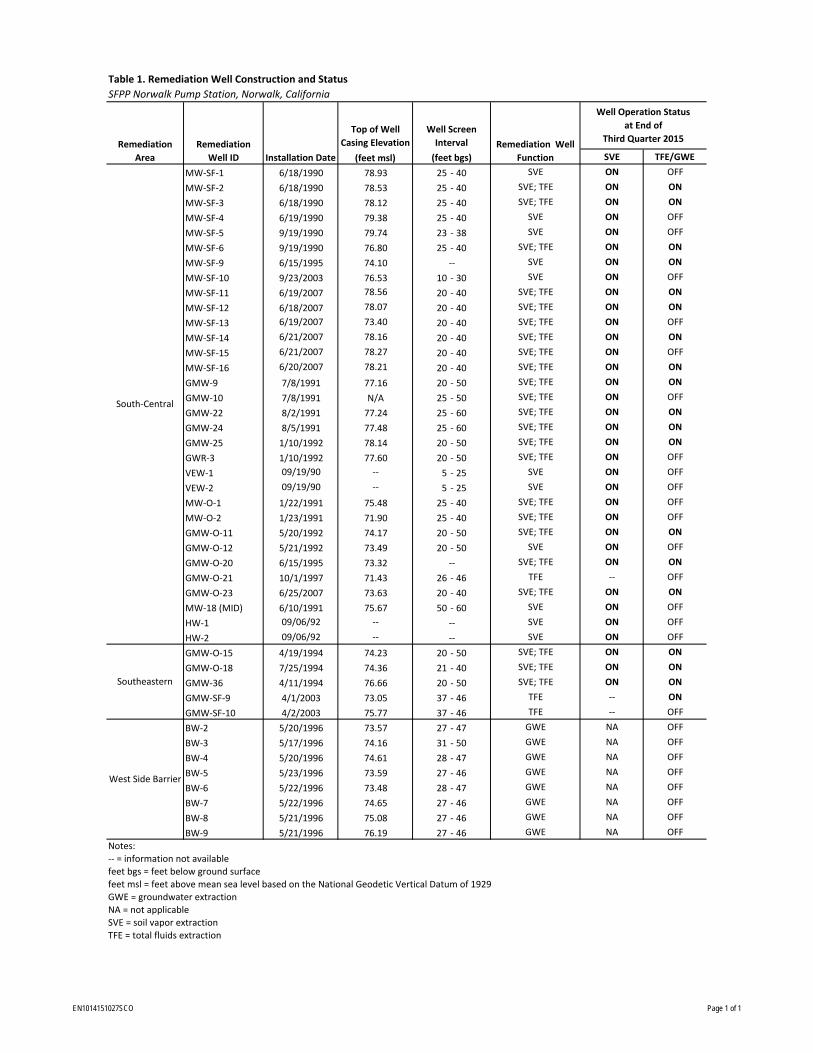
A summary of remediation wells in the south-central, southeastern, and WSB areas is presented in Table 1. Table 1 includes well identifications, well construction details, well use, and operational status at the end of the third quarter 2015. The remediation system layout is presented in Figure 2.
EN1014151027SCO 2-1
SECTION 3
Operations and Maintenance During the third quarter 2015 reporting period, O&M of the remediation systems included the following tasks:
• Performed weekly maintenance and monitoring of the south-central and southeastern SVE and TFE wells, and the SVE system and GWTS (collectively referred to as remediation systems).
• Removed, inspected, and made repairs to the TFE pumps and associated discharge lines.
• Performed cleanout of the OWS, sump, equalization tank, and transfer tank.
• Replaced the broken sump pump with a new sump pump.
• Performed carbon changeout of the LGAC vessels.
• Performed carbon changeout of the vapor-phase granular activated carbon (VGAC) vessels used to treat off-gas from the product tank and OWS.
The remediation systems operated during the third quarter 2015 with the following exceptions:
• The SVE system was turned off on July 15, July 29, and August 6, 2015, for routine system maintenance. The system was restarted on the same day.
• The SVE system was shut down between August 14 and September 3, 2015, to trouble shoot the reduced destruction efficiency of the SVE. As part of this effort, a visual inspection of the SVE burner and plenum was performed using a closed-circuit television (CCTV) camera. No internal mechanical issues were noted during the inspection. Several air samples were also collected from the SVE influent, post-dilution, and effluent at different temperature and vacuum set points to determine optimum conditions for SVE performance. The system was optimized by increasing the temperature set point, increasing residence time, and maximizing the influent concentrations by shutting down low-concentration vapor extraction wells. The SVE was restarted on September 4, 2015. Further discussion of these results is provided in Section 5.
• The SVE system was turned off on September 17, 2015, in preparation for annual soil vapor sampling. The system was restarted on September 25, 2015, once the vapor sampling was completed.
• The GWTS was turned off on July 16, August 25, and September 24, 2015, to clean out the OWS, sump, equalization tank, and transfer tank. The system was restarted on the same day.
• The GWTS was off on arrival on July 6, 2015, due to a transfer tank alarm. The alarm was reset and the system was restarted on the same day.
During this reporting period, remediation system inspections were performed on a weekly basis. For these inspections, volumes of extracted groundwater, hours of operation, and other system parameters were recorded during system operation.
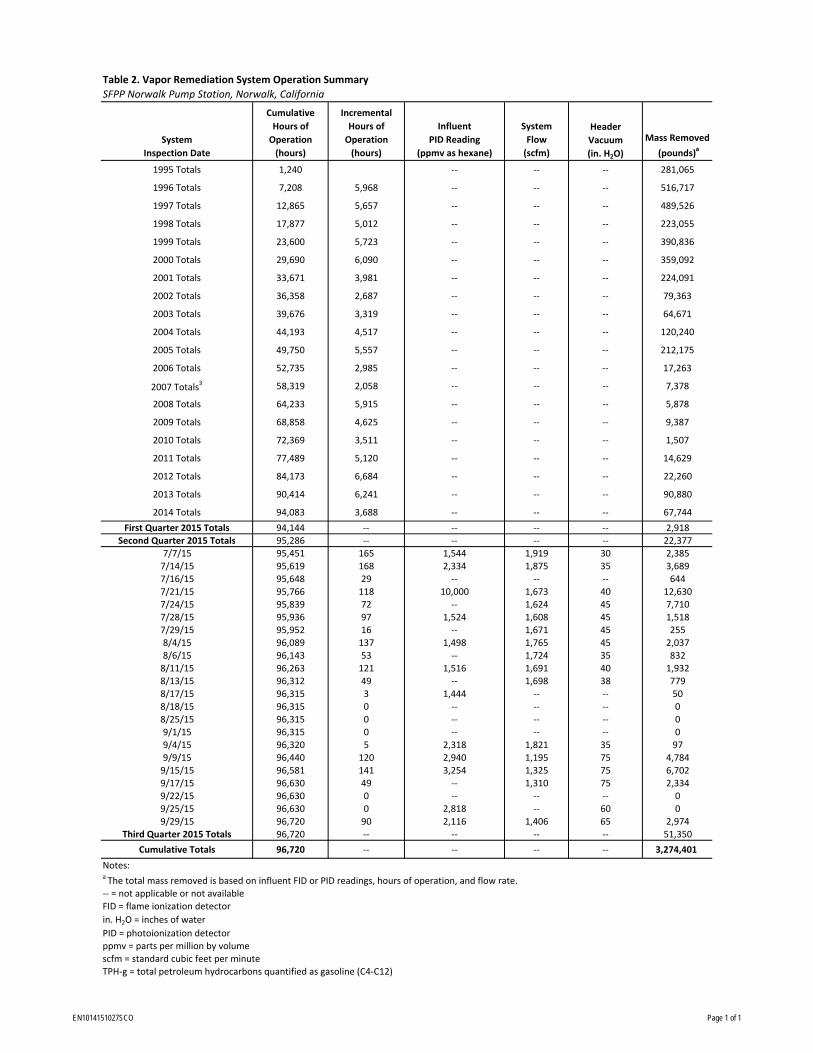
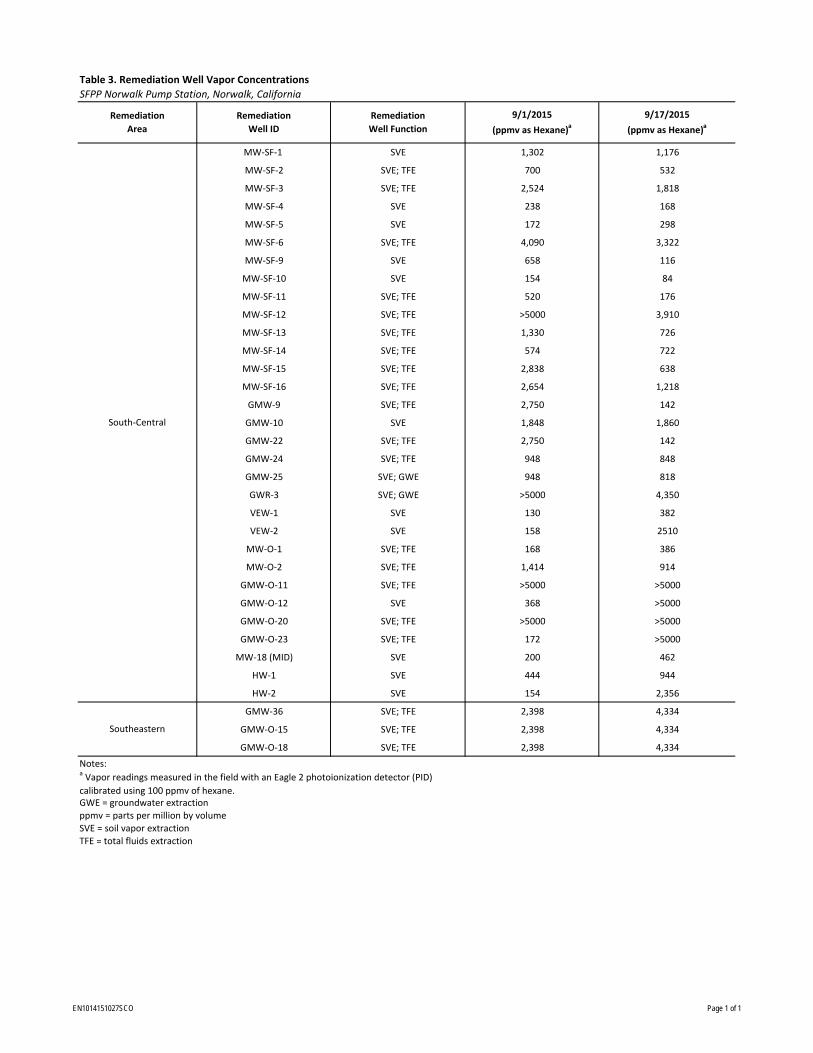
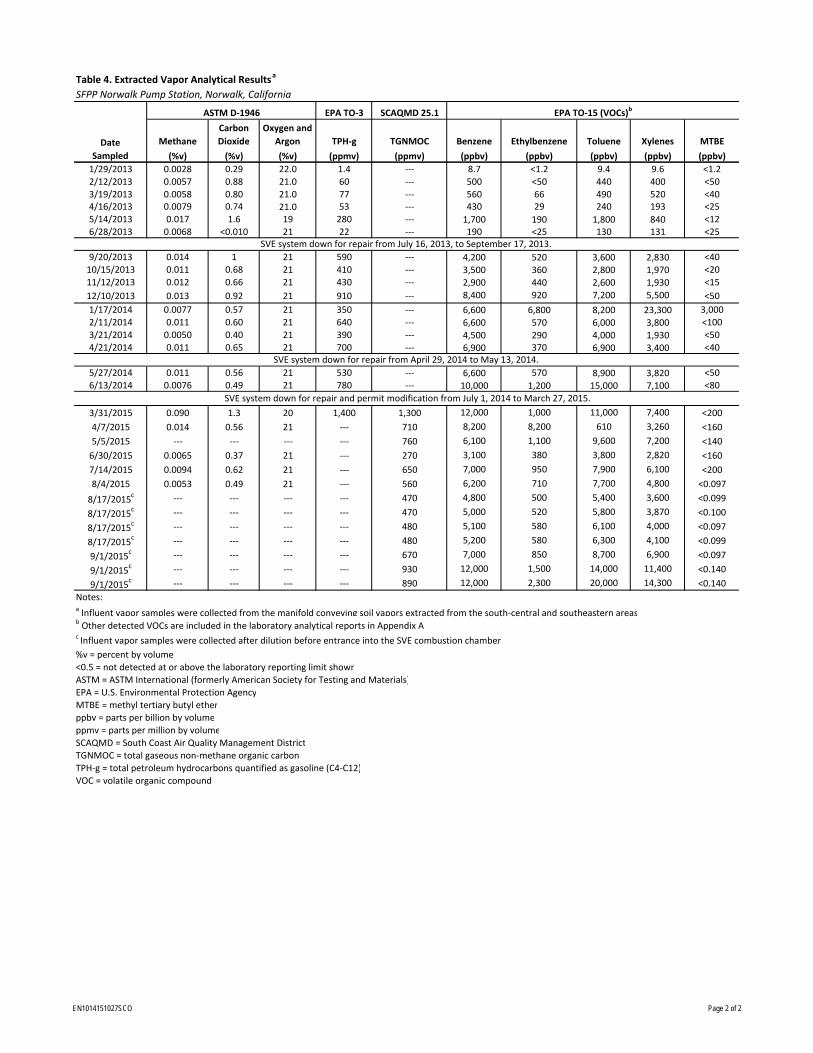
Overall, during the third quarter 2015, the SVE system was operational 66 percent of the time and the GWTS operated 98 percent of the time. Table 2 presents the SVE system operations summary. Extracted vapor photoionization detector (PID) measurements at the end of the third quarter 2015 are summarized in Table 3. Extracted vapor analytical results for the third quarter 2015 are summarized in Table 4. The groundwater remediation system operation activities for the third quarter 2015 are summarized in Table 5. The extracted groundwater analytical results for the third quarter 2015 are
EN1014151027SCO 3-1
SECTION 3 – OPERATIONS AND MAINTENANCE
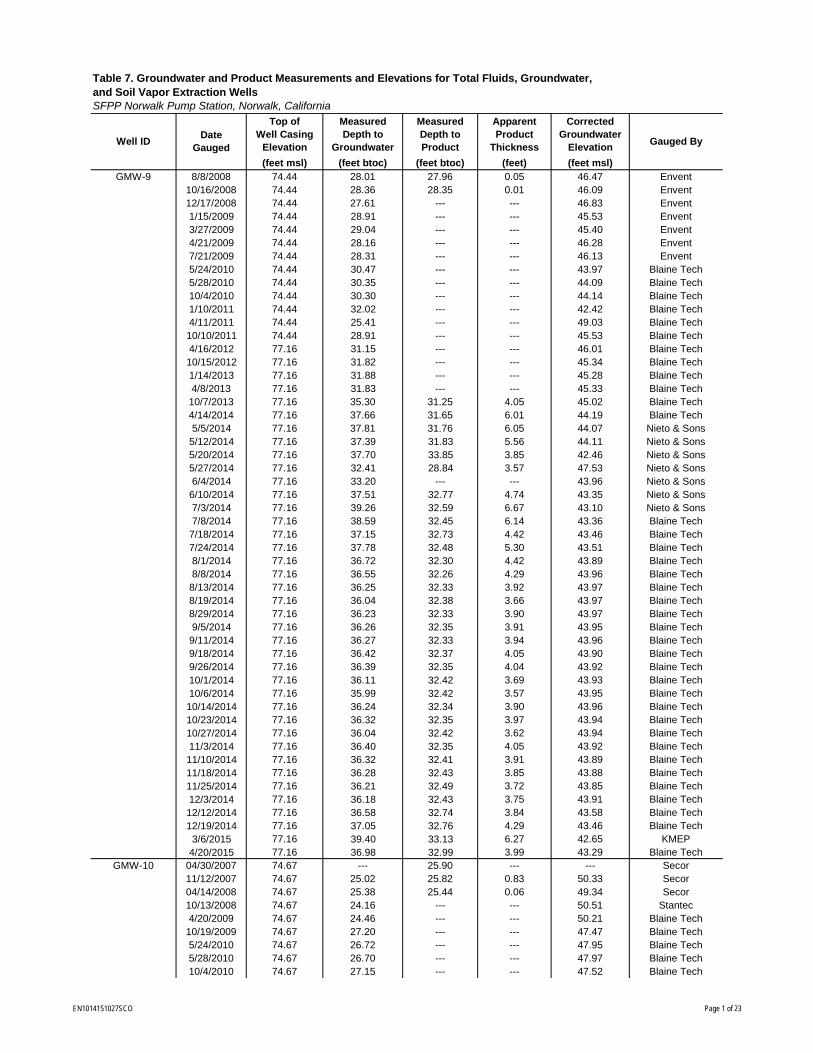
summarized in Table 6. Historical (post-2007) gauging results of select TFE and SVE wells are provided in Table 7. Pre-2007 data can be found in previous semiannual groundwater monitoring reports.
Vapor samples from the SVE system influent and water samples from the GWTS influent were collected during the third quarter 2015 when the systems were in operation. During the third quarter 2015, influent vapor samples were collected on July 14, August 4, August 17, and September 1, 2015. Influent water samples were collected on July 30, August 6, and September 15, 2015, when the GWTS was operating. The water samples were delivered to Advanced Technology Laboratories (ATL) of Las Vegas, Nevada, for analysis. ATL is certified by the California Department of Public Health Environmental Laboratory Accreditation Program. The vapor samples were delivered to Air Technology Laboratories (Air Tech) of City of Industry, California, for analysis.
Air Tech analyzed the vapor samples for the following:
• Fixed gases (methane, carbon dioxide, oxygen, and argon) using ASTM International (ASTM) D1946
• Total gaseous non-methane organic compounds (TGNMOC) using SCAQMD Method 25.1
• VOCs using U.S. Environmental Protection Agency (EPA) Method TO-15
ATL analyzed the water samples for the following:
• Total petroleum hydrocarbons (TPH) quantified as gasoline (TPH-g), TPH quantified as diesel (TPH-d), and TPH quantified as oil (TPH-o) (collectively referred to as TPH-total) using EPA Method 8015(M)
• VOCs using EPA Method 8260B
The laboratory analytical reports and chain-of-custody documents for these samples are included in Appendix A.
3-2 EN1014151027SCO
SECTION 4
Summary of Remediation Progress Based on weekly monitoring of the influent vapor concentration, vapor extraction flow rate, and hours of operation, the total mass of VOCs removed by SVE was 51,350 pounds during the third quarter 2015, for a cumulative mass removal of 3,274,401 pounds since SVE implementation in September 1995 (Table 2). The cumulative mass removed by SVE does not include the mass removed by naturally occurring in situ biodegradation.
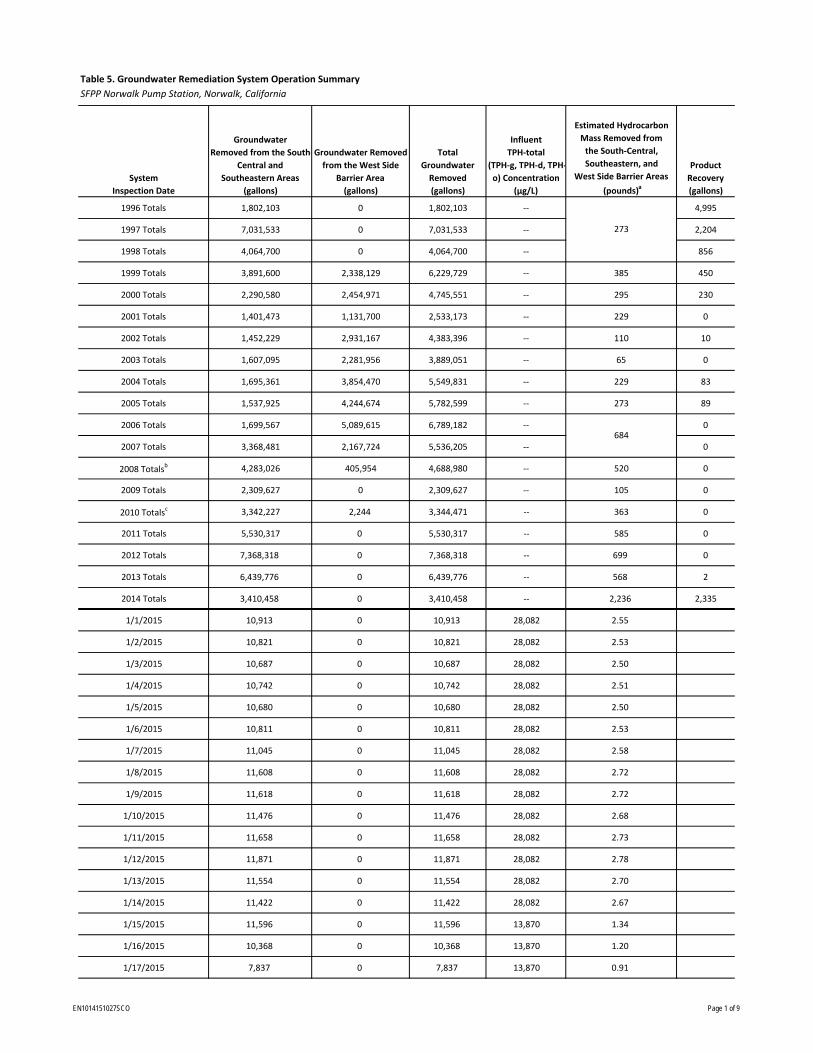
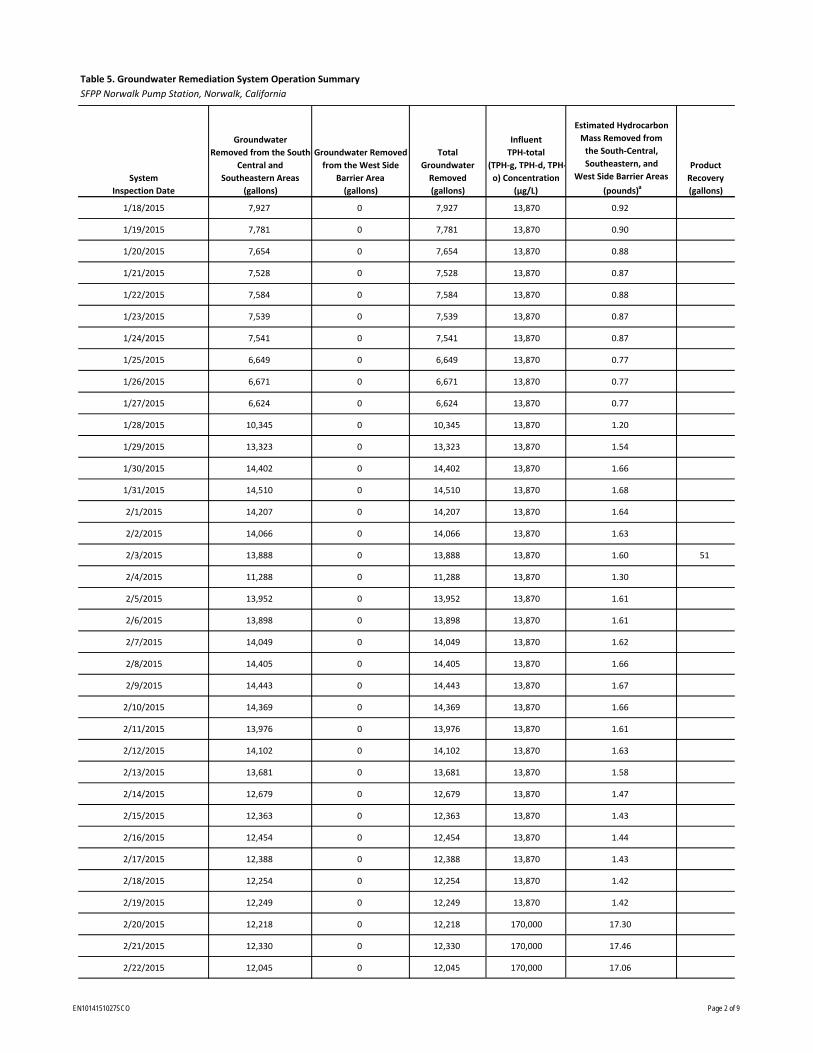
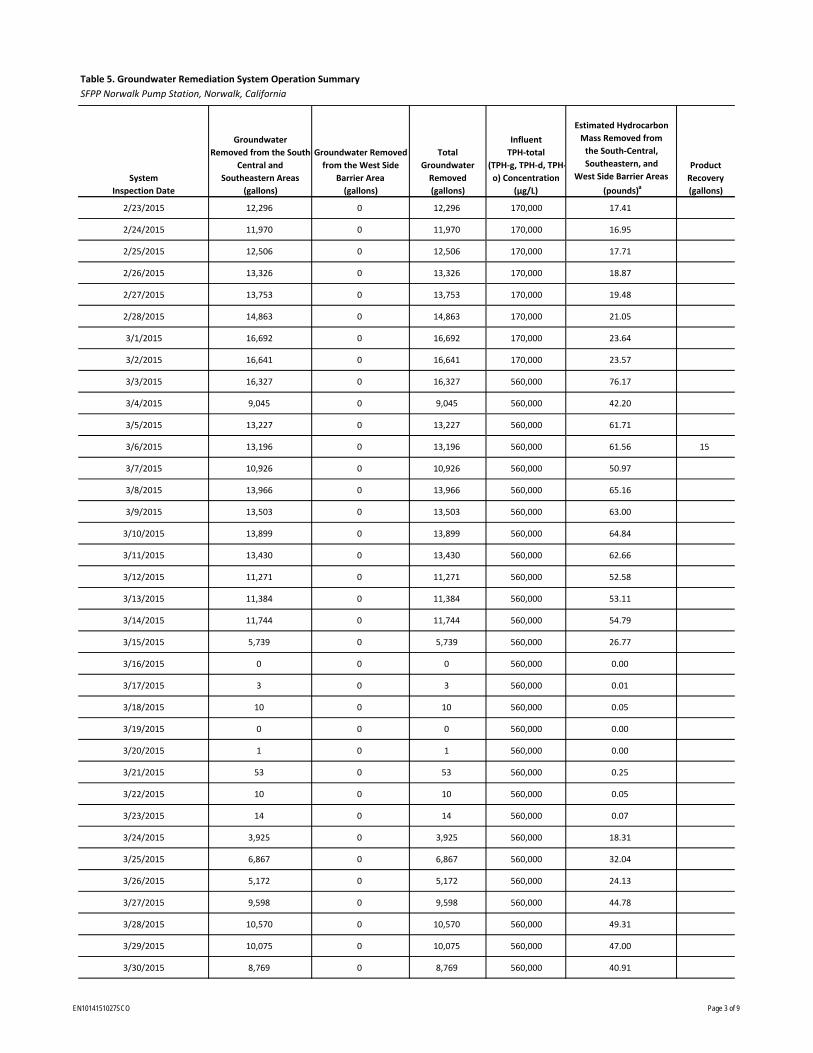
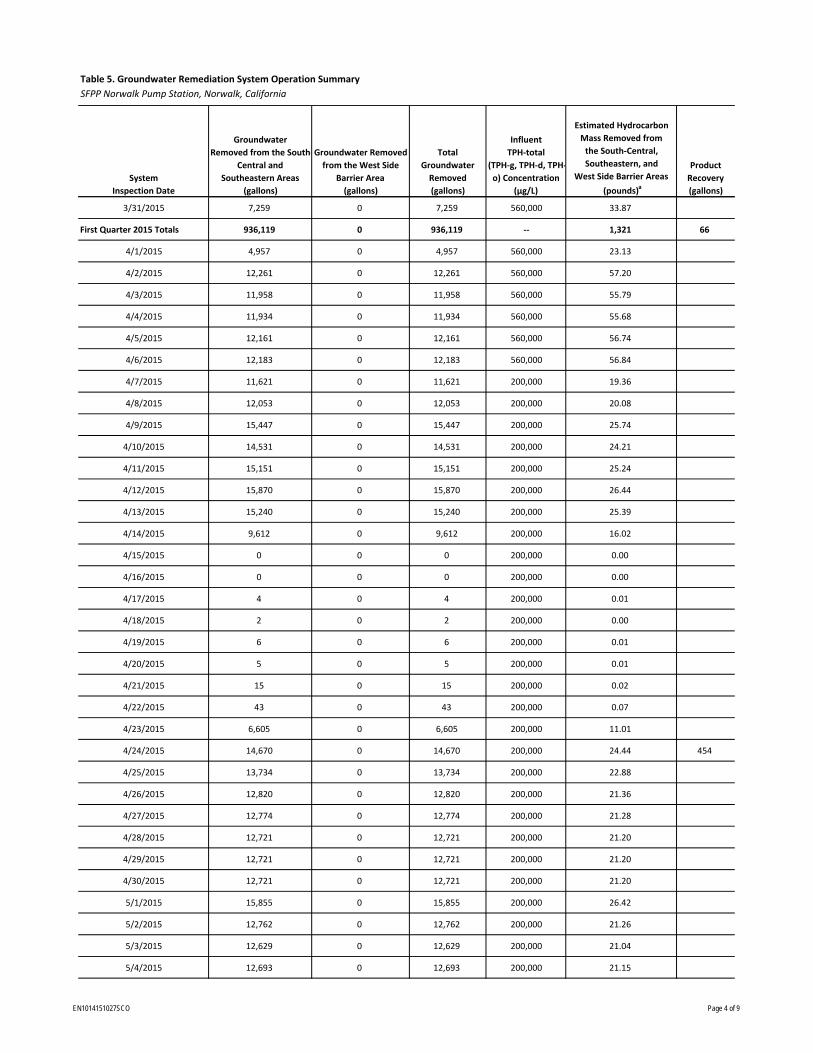
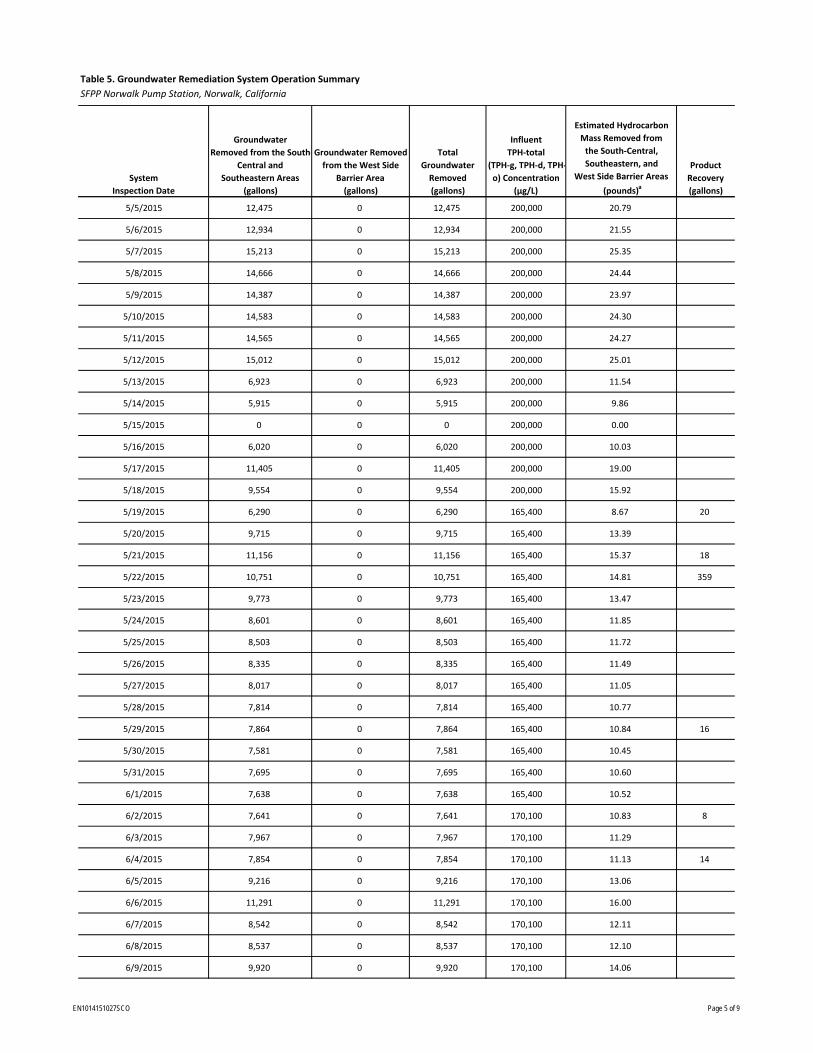
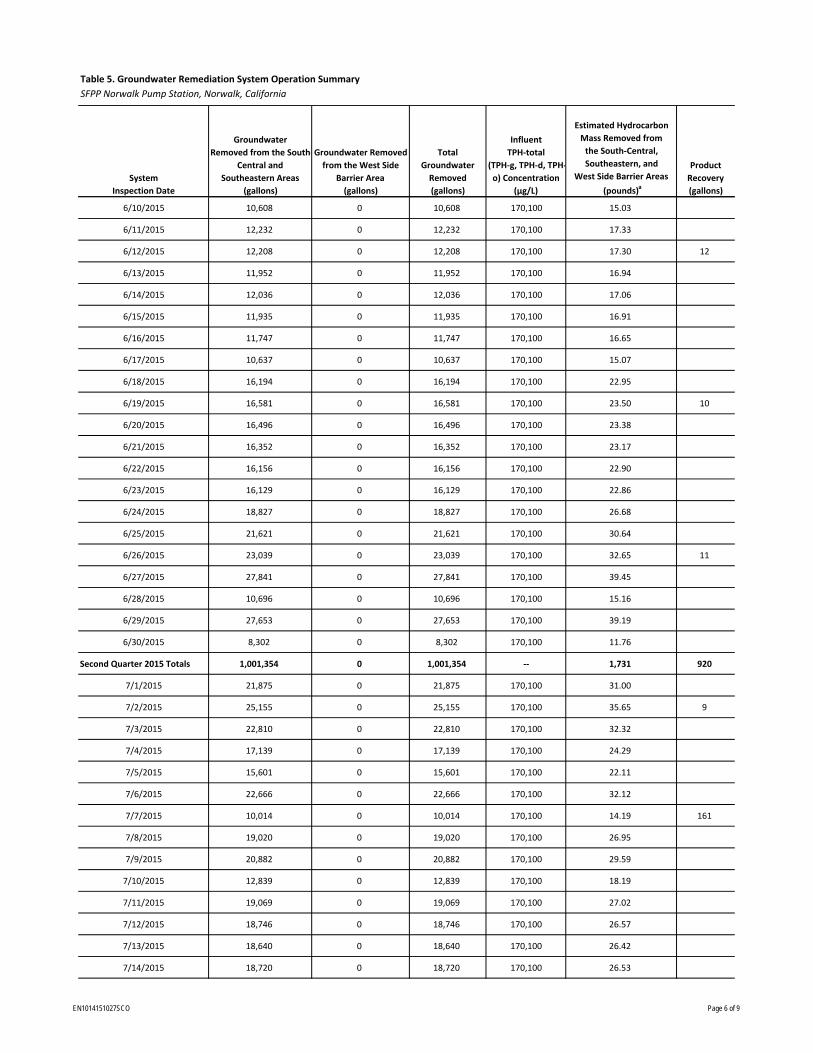
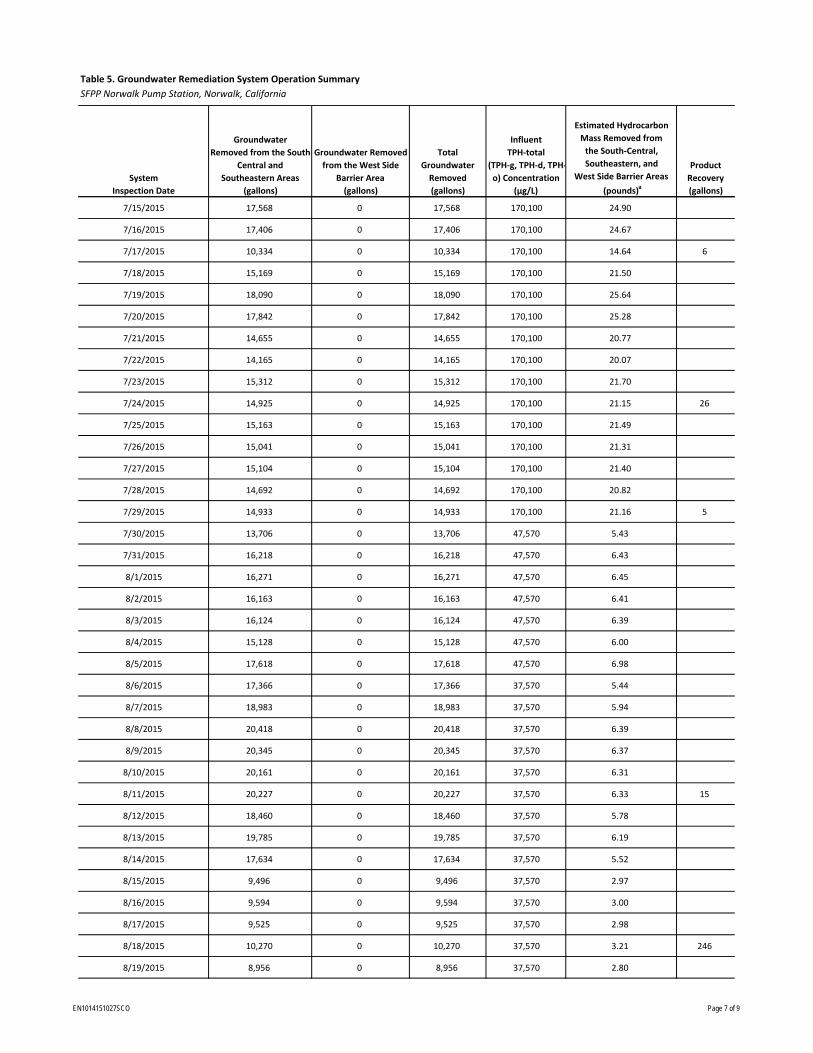
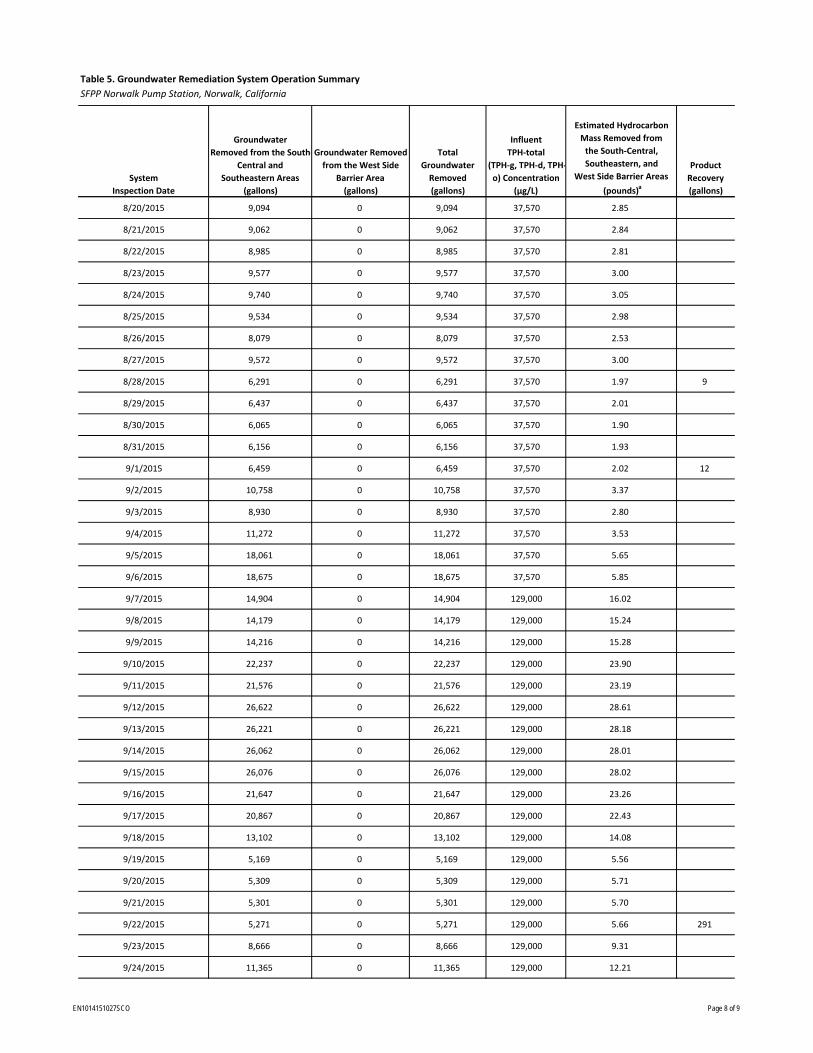
A total of 1,397,963 gallons of groundwater was extracted during the third quarter 2015 (Table 5). No water was extracted from the WSB area during the third quarter 2015. Approximately 95.7 million gallons of groundwater has been extracted from the south-central, southeastern, and WSB areas since GWTS operations first began in 1996.
Groundwater extraction was discontinued in the WSB region during the third quarter 2008 based on the reduced lateral extent and low concentrations of MTBE and 1,2-dichloroethane (1,2-DCA) west of the site. 1,2-DCA, MTBE, and TBA concentrations in the western area continue to be monitored; other wells in the WSB system will be restarted if necessary.
The amount of free product that accumulated in the product holding tank of the GWTS was estimated to be 682 gallons during the third quarter 2015. In addition, 98 gallons of product were manually bailed from a select group of wells that do not have TFE pumps (GMW-22, GMW-O-12, GMW-O-21, GWR-3, and MW-SF-9) during the third quarter 2015. Since 1995, a total of 13,086 gallons of product has been removed by TFE, vacuum truck, or manual bailing operations. Beginning in March 2015 of the first quarter 2015, some online TFE wells were gauged and pump inlets were reset to maximize product removal. These activities will continue into the fourth quarter 2015 until all pumps are reset.
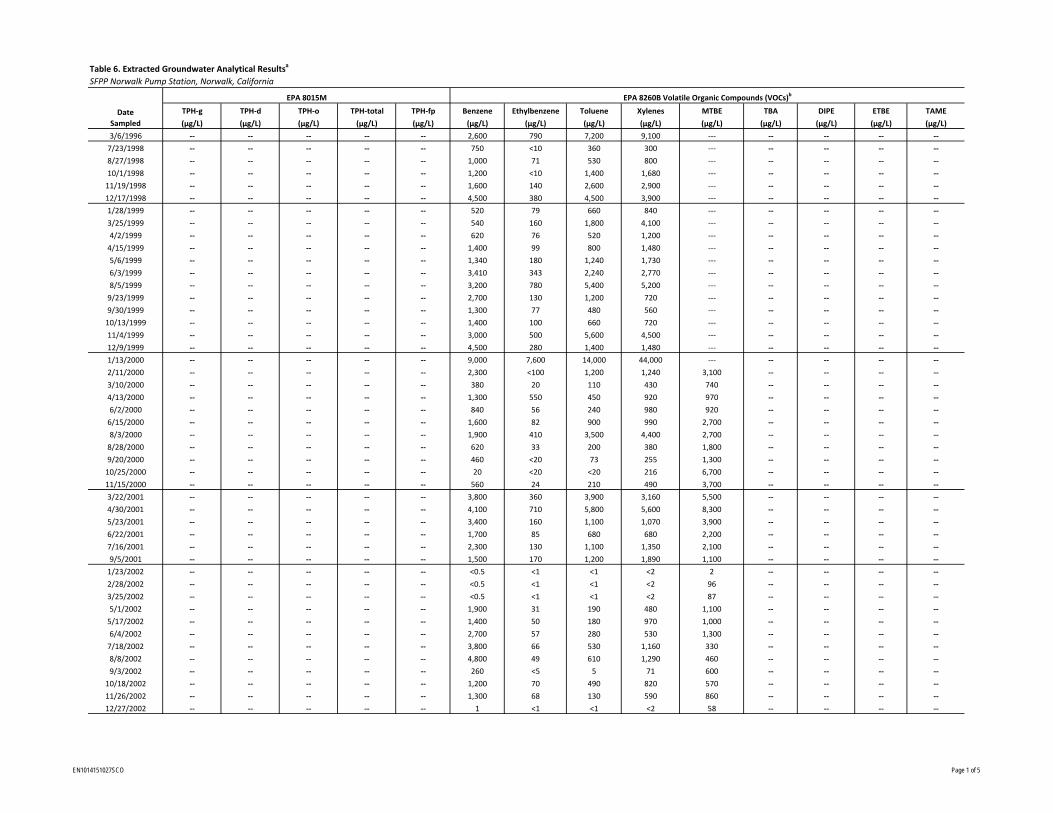
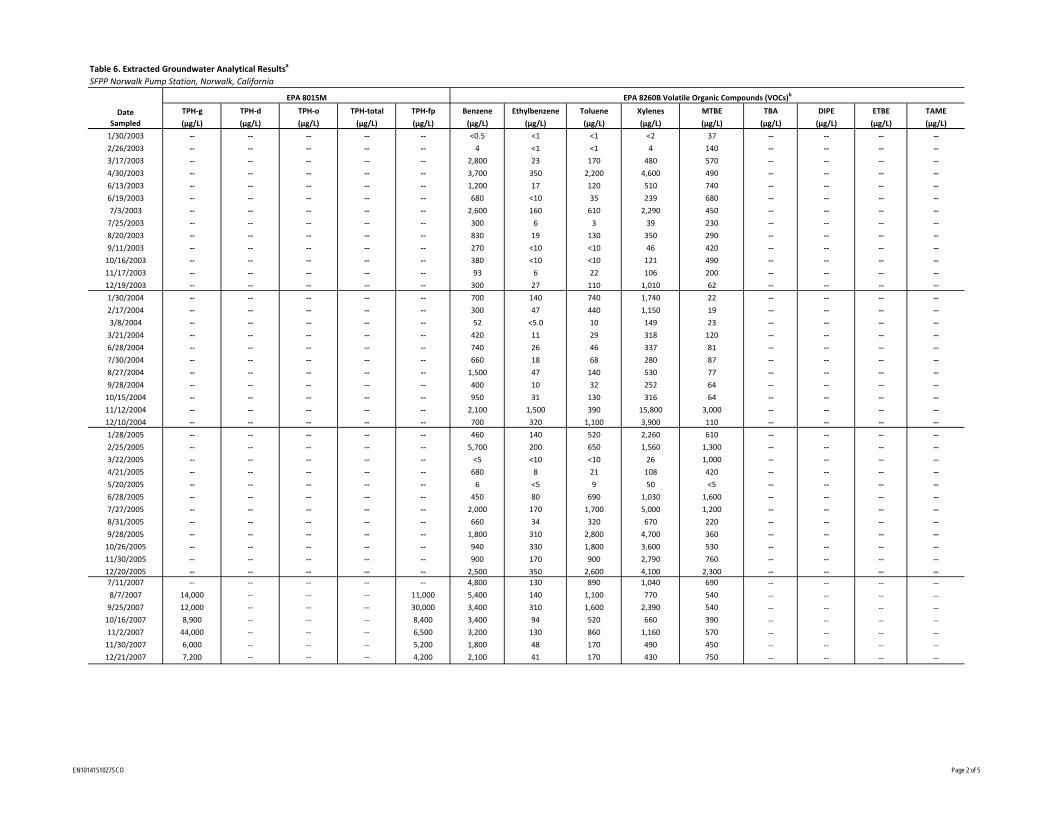
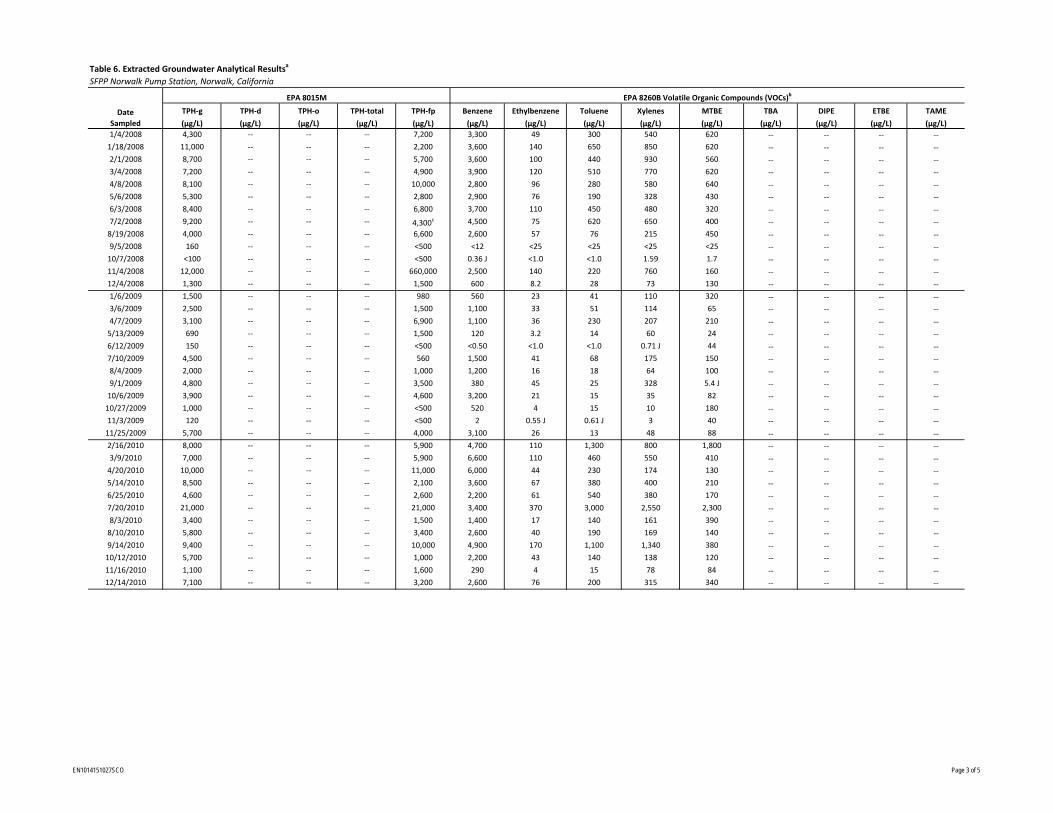
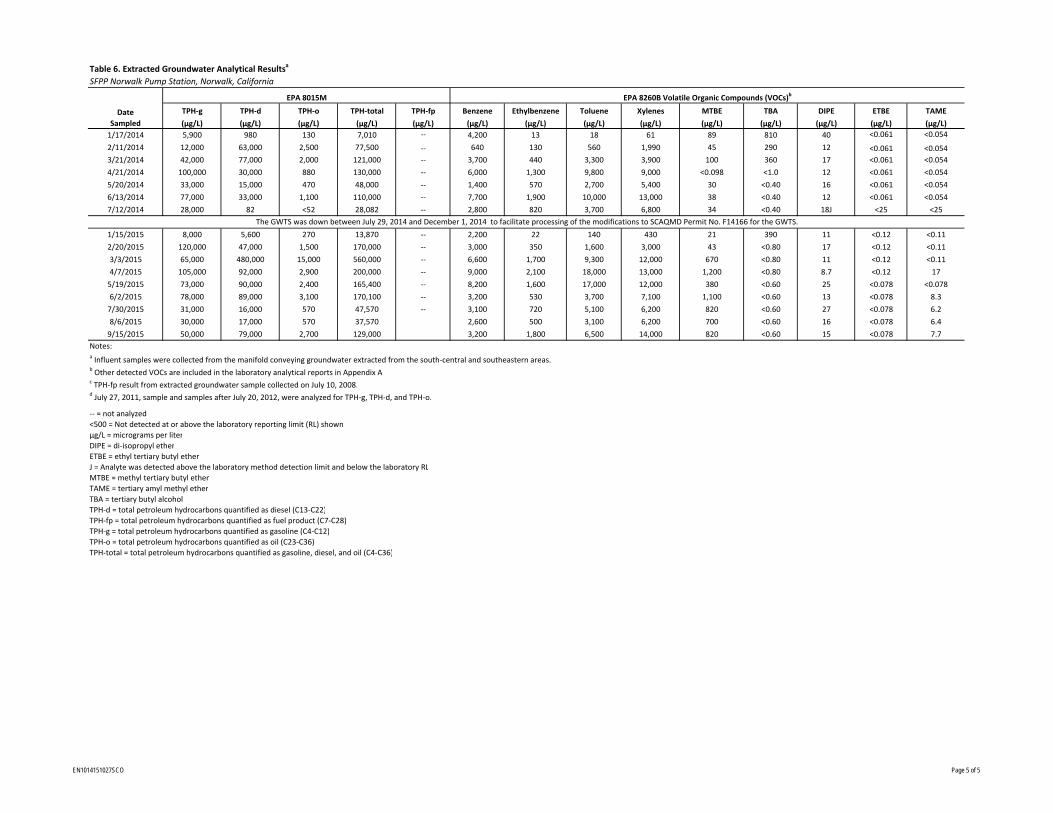
The estimated mass removal (pounds) of hydrocarbons by the GWTS is shown in Table 5. Mass removal estimates between 1996 and 2005 are based on benzene, toluene, ethylbenzene, and total xylenes (BTEX) and MTBE concentrations in the groundwater influent (TPH data were not available) and total volume of extracted groundwater. Mass removal estimates between 2006 and 2011 are based on groundwater influent TPH-g and TPH quantified as fuel product (TPH-fp) concentrations, and total volume of extracted groundwater. Mass removal estimates between 2012 and 2015 are based on groundwater influent TPH-total (TPH-g, TPH-d, and TPH-o) concentrations and total volume of extracted groundwater. Since GWE first began in 1996, hydrocarbon mass removed by the GWTS is estimated to be 13,289 pounds. During the third quarter 2015, the mass removal of hydrocarbons was estimated to be 1,296 pounds. Since the first quarter 2014 there has been significantly more hydrocarbon removal than previous quarters. The increase in mass removal during the third quarter 2015, and since the first quarter 2014, is attributed to the higher TPH-total concentrations in the groundwater influent. The maximum TPH-total concentration in the third quarter 2015 was 129,000 micrograms per liter (µg/L) (Table 6). The higher concentrations of TPH-total are attributed to the free product that is emulsified in the groundwater influent during TFE operations. As discussed in Section 5, the measurable free product thickness in some TFE wells has increased recently because of continued declining water levels across the site due to drought conditions.
EN1014151027SCO 4-1
SECTION 5
System Evaluation and Optimization On August 14, 2015, the SVE system was shut down to troubleshoot the reduced destruction efficiency of the SVE. As part of this effort, several air samples were collected at different points in the treatment system (influent, post-dilution, and effluent) and analyzed for total VOCs. Samples were collected under different operational conditions including flow rate, vacuum, combustion temperature, and influent concentration. Data indicate that SVE destruction efficiency was improved by decreasing the process flow rate, which increased residence time in the combustion chamber, and increasing combustion temperature. These conditions were achieved by shutting off SVE wells exhibiting the lowest VOC concentrations (measured using a PID) and increasing the combustion temperature set point. PID readings collected on September 1 and 17, 2015, are shown in Table 3.
On August 26, 2014, a CCTV (video) survey also was performed on the SVE combustion chamber and plenum to rule out any mechanical issues that may have been contributing to the reduced performance. No mechanical issues were noted during the video survey. Based on these results, the SVE resumed full operation on September 4, 2015. The SVE combustion set point was increased to 1,450 degrees Fahrenheit (°F). Monitoring of individual vapor extraction wells will be conducted routinely to ensure that the wells with the highest concentrations remain online.
The first semiannual 2015 groundwater monitoring event in the WSB region occurred during the second quarter 2015. Monitoring results support the continued shutdown of GWE in the WSB region. 1,2-DCA, MTBE, and TBA concentrations in the western area will continue to be monitored. The WSB system will be restarted if necessary. The second semiannual 2015 groundwater monitoring event will be conducted in October 2015. Results will be presented in the Second Semiannual 2015 Groundwater Monitoring Report due to the RWQCB in January 2016.
As shown in Table 7, measurable free product was observed in 24 remediation wells during the first semiannual 2015 groundwater monitoring event (conducted in the second quarter of 2015). The product thicknesses for these wells ranged from 0.12 foot in MW-SF-6 to 9.02 feet in MW-SF-9. It is believed that increased product thicknesses observed are indicative of declining water levels across the site (Figure 3). The current low water levels have allowed residual product to drain from pore spaces within the smear zone and collect in certain wells, or increase in thickness in wells with measureable product already present. The water table elevation is related to annual rainfall and the cumulative rainfall over time. As shown in Figure 3, since the 2005/2006 El Niño, groundwater elevations in the uppermost aquifer have declined approximately 5 feet to the current low water levels across the site. Continued TFE extraction will remove the product that has accumulated due to these low water levels.
The TFE system currently consists of 15 wells operated for product recovery and hydraulic control in the south-central part of the site, and 4 wells equipped with TFE pumps operated for product recovery and hydraulic control in the southeastern part of the site (Table 1). TFE operations from these wells will continue and pump inlets will be adjusted, as needed, to optimize product recovery.
EN1014151027SCO 5-1
SECTION 6
Planned Fourth Quarter 2015 Activities During the fourth quarter 2015, SFPP plans to continue to focus remedial efforts on the south-central and southeastern areas. The following maintenance activities are planned to be completed during the fourth quarter 2015:
• Continue weekly maintenance and monitoring of the south-central and southeastern SVE and TFE/GWE treatment systems.
• Measure individual well vapor concentrations.
• Collect and analyze system influent vapor and groundwater samples.
• Perform as-needed carbon changeouts of the LGAC vessels.
• Remove, inspect, and repair existing TFE/GWE pumps and associated discharge lines.
• Install pumps and associated equipment necessary for TFE at select wells with measurable free product.
• Continue to remove free product from wells without TFE pumps using manual bailing methods.
• Install the new OWS to allow more efficient removal of free product from the influent stream.
• Continue installation of biosparge ancillary equipment including electrical.
• Conduct biosparge pilot testing, as outlined in the Horizontal Biosparge System Construction and Pilot Test Work Plan submitted to the RWQCB on November 18, 2013 (CH2M, 2013b).
The TFE, GWE, and SVE systems for the south-central and southeastern areas will continue to operate. Operation of the TFE system in the southeastern area will be monitored closely, and adjustments will be made to improve fluid recovery. System inspections will continue on a weekly basis; system evaluation parameters will be collected as needed. The remediation activities and progress for the fourth quarter 2015 will be described in the Fourth Quarter 2015 Remediation Progress Report, to be submitted by January 15, 2016.
Field activities are currently underway to install the horizontal biosparge system as described in the pilot test work plan (CH2M, 2013b) and the response to RWQCB comments on the work plan (CH2M, 2014). The RWQCB approved the pilot test work plan in a letter dated February 26, 2014 (RWQCB, 2014). The purpose of the biosparge system is to enhance mass removal of free-phase and dissolved-phase hydrocarbon constituents beneath the south-central area of the site. Pilot testing of the system is planned to be conducted for a period of approximately 1 year in order to evaluate the feasibility of system expansion. The horizontal biosparge well was installed in August 2014; the installation of the aboveground portion of the system (air compressor, piping, and electrical) is planned to be completed early in the fourth quarter 2015. Monthly progress reports on the pilot testing activities will be submitted to RWQCB once testing begins and until completion of the pilot test, as requested in RWQCB’s letter (RWQCB, 2014).
EN1014151027SCO 6-1
SECTION 7
References California Regional Water Quality Control Board, Los Angeles Region (RWQCB). 2006. Letter to Mr. Kola Olowu, Defense Energy Support Center, Los Angeles, and Mr. Michael Pitta, Kinder Morgan Energy Partners; Conditional Approval of Revised Remedial Action Plan and Second Addendum to Remedial Action Plan for the Defense Fuel Support Point Norwalk, 15306 Norwalk Boulevard, Norwalk (SLIC No. 0286A, DOD No. 16638). October 25.
California Regional Water Quality Control Board, Los Angeles Region (RWQCB). 2014. Letter to Mr. Stephen Defibaugh, Kinder Morgan Energy Partners; Approval of Horizontal Biosparge Pilot Test Work Plan, Defense Fuel Support Point Norwalk, 15306 Norwalk Boulevard, Norwalk, California. February 26.
CH2M HILL (CH2M). 2013a. Conceptual Site Model and Proposed Alternate Interim Remedy for Soil, Groundwater, and LNAPL. September 3.
CH2M HILL (CH2M). 2013b. Horizontal Biosparge System Construction and Pilot Test Work Plan, SFPP Norwalk Pump Station, 15306 Norwalk Boulevard, Norwalk, California. November 18.
CH2M HILL (CH2M). 2014. Response to Comments – Horizontal Biosparge System Construction and Pilot Test Work Plan, SFPP Norwalk Pump Station, 15306 Norwalk Boulevard, Norwalk, California. November 18.
EN1014151027SCO 7-1

Tables
EN1014151027SCO
(feet msl) SVE TFE/GWE
MW‐SF‐1 6/18/1990 78.93 25 ‐ 40 SVE ON OFF
MW‐SF‐2 6/18/1990 78.53 25 ‐ 40 SVE; TFE ON ON
MW‐SF‐3 6/18/1990 78.12 25 ‐ 40 SVE; TFE ON ON
MW‐SF‐4 6/19/1990 79.38 25 ‐ 40 SVE ON OFF
MW‐SF‐5 9/19/1990 79.74 23 ‐ 38 SVE ON OFF
MW‐SF‐6 9/19/1990 76.80 25 ‐ 40 SVE; TFE ON ON
MW‐SF‐9 6/15/1995 74.10 SVE ON ON
MW‐SF‐10 9/23/2003 76.53 10 ‐ 30 SVE ON OFF
MW‐SF‐11 6/19/2007 78.56 20 ‐ 40 SVE; TFE ON ON
MW‐SF‐12 6/18/2007 78.07 20 ‐ 40 SVE; TFE ON ON
MW‐SF‐13 6/19/2007 73.40 20 ‐ 40 SVE; TFE ON OFF
MW‐SF‐14 6/21/2007 78.16 20 ‐ 40 SVE; TFE ON ON
MW‐SF‐15 6/21/2007 78.27 20 ‐ 40 SVE; TFE ON OFF
MW‐SF‐16 6/20/2007 78.21 20 ‐ 40 SVE; TFE ON ON
GMW‐9 7/8/1991 77.16 20 ‐ 50 SVE; TFE ON ON
GMW‐10 7/8/1991 N/A 25 ‐ 50 SVE; TFE ON OFF
GMW‐22 8/2/1991 77.24 25 ‐ 60 SVE; TFE ON ON
GMW‐24 8/5/1991 77.48 25 ‐ 60 SVE; TFE ON ON
GMW‐25 1/10/1992 78.14 20 ‐ 50 SVE; TFE ON ON
GWR‐3 1/10/1992 77.60 20 ‐ 50 SVE; TFE ON OFF
VEW‐1 09/19/90 ‐‐ 5 ‐ 25 SVE ON OFF
VEW‐2 09/19/90 ‐‐ 5 ‐ 25 SVE ON OFF
MW‐O‐1 1/22/1991 75.48 25 ‐ 40 SVE; TFE ON OFF
MW‐O‐2 1/23/1991 71.90 25 ‐ 40 SVE; TFE ON OFF
GMW‐O‐11 5/20/1992 74.17 20 ‐ 50 SVE; TFE ON ON
GMW‐O‐12 5/21/1992 73.49 20 ‐ 50 SVE ON OFF
GMW‐O‐20 6/15/1995 73.32 SVE; TFE ON ON
GMW‐O‐21 10/1/1997 71.43 26 ‐ 46 TFE ‐‐ OFF
GMW‐O‐23 6/25/2007 73.63 20 ‐ 40 SVE; TFE ON ON
MW‐18 (MID) 6/10/1991 75.67 50 ‐ 60 SVE ON OFF
HW‐1 09/06/92 ‐‐ SVE ON OFF
HW‐2 09/06/92 ‐‐ SVE ON OFF
GMW‐O‐15 4/19/1994 74.23 20 ‐ 50 SVE; TFE ON ON
GMW‐O‐18 7/25/1994 74.36 21 ‐ 40 SVE; TFE ON ON
GMW‐36 4/11/1994 76.66 20 ‐ 50 SVE; TFE ON ON
GMW‐SF‐9 4/1/2003 73.05 37 ‐ 46 TFE ‐‐ ON
GMW‐SF‐10 4/2/2003 75.77 37 ‐ 46 TFE ‐‐ OFF
BW‐2 5/20/1996 73.57 27 ‐ 47 GWE NA OFF
BW‐3 5/17/1996 74.16 31 ‐ 50 GWE NA OFF
BW‐4 5/20/1996 74.61 28 ‐ 47 GWE NA OFF
BW‐5 5/23/1996 73.59 27 ‐ 46 GWE NA OFF
BW‐6 5/22/1996 73.48 28 ‐ 47 GWE NA OFF
BW‐7 5/22/1996 74.65 27 ‐ 46 GWE NA OFF
BW‐8 5/21/1996 75.08 27 ‐ 46 GWE NA OFF
BW‐9 5/21/1996 76.19 27 ‐ 46 GWE NA OFF
Notes:‐‐ = information not available
feet bgs = feet below ground surfacefeet msl = feet above mean sea level based on the National Geodetic Vertical Datum of 1929GWE = groundwater extraction
NA = not applicableSVE = soil vapor extraction
TFE = total fluids extraction
Well Operation Status
at End of
Third Quarter 2015
Table 1. Remediation Well Construction and Status
Well Screen
Interval Remediation Well
Function(feet bgs)
SFPP Norwalk Pump Station, Norwalk, California
West Side Barrier
Top of Well
Casing ElevationRemediation
Area
Southeastern
Remediation
Well ID Installation Date
South‐Central
‐‐
‐‐
‐‐
‐‐
EN1014151027SCO Page 1 of 1
System
Inspection Date
Cumulative
Hours of
Operation
(hours)
Incremental
Hours of
Operation
(hours)
Influent
PID Reading
(ppmv as hexane)
System
Flow
(scfm)
Header
Vacuum
(in. H2O)
Mass Removed
(pounds)a
1995 Totals 1,240 ‐‐ ‐‐ ‐‐ 281,065
1996 Totals 7,208 5,968 ‐‐ ‐‐ ‐‐ 516,717
1997 Totals 12,865 5,657 ‐‐ ‐‐ ‐‐ 489,526
1998 Totals 17,877 5,012 ‐‐ ‐‐ ‐‐ 223,055
1999 Totals 23,600 5,723 ‐‐ ‐‐ ‐‐ 390,836
2000 Totals 29,690 6,090 ‐‐ ‐‐ ‐‐ 359,092
2001 Totals 33,671 3,981 ‐‐ ‐‐ ‐‐ 224,091
2002 Totals 36,358 2,687 ‐‐ ‐‐ ‐‐ 79,363
2003 Totals 39,676 3,319 ‐‐ ‐‐ ‐‐ 64,671
2004 Totals 44,193 4,517 ‐‐ ‐‐ ‐‐ 120,240
2005 Totals 49,750 5,557 ‐‐ ‐‐ ‐‐ 212,175
2006 Totals 52,735 2,985 ‐‐ ‐‐ ‐‐ 17,263
2007 Totals3 58,319 2,058 ‐‐ ‐‐ ‐‐ 7,378
2008 Totals 64,233 5,915 ‐‐ ‐‐ ‐‐ 5,878
2009 Totals 68,858 4,625 ‐‐ ‐‐ ‐‐ 9,387
2010 Totals 72,369 3,511 ‐‐ ‐‐ ‐‐ 1,507
2011 Totals 77,489 5,120 ‐‐ ‐‐ ‐‐ 14,629
2012 Totals 84,173 6,684 ‐‐ ‐‐ ‐‐ 22,260
2013 Totals 90,414 6,241 ‐‐ ‐‐ ‐‐ 90,880
2014 Totals 94,083 3,688 ‐‐ ‐‐ ‐‐ 67,744
First Quarter 2015 Totals 94,144 ‐‐ ‐‐ ‐‐ ‐‐ 2,918
Second Quarter 2015 Totals 95,286 ‐‐ ‐‐ ‐‐ ‐‐ 22,377
7/7/15 95,451 165 1,544 1,919 30 2,385
7/14/15 95,619 168 2,334 1,875 35 3,689
7/16/15 95,648 29 ‐‐ ‐‐ ‐‐ 644
7/21/15 95,766 118 10,000 1,673 40 12,630
7/24/15 95,839 72 ‐‐ 1,624 45 7,710
7/28/15 95,936 97 1,524 1,608 45 1,518
7/29/15 95,952 16 ‐‐ 1,671 45 255
8/4/15 96,089 137 1,498 1,765 45 2,037
8/6/15 96,143 53 ‐‐ 1,724 35 832
8/11/15 96,263 121 1,516 1,691 40 1,932
8/13/15 96,312 49 ‐‐ 1,698 38 7798/17/15 96,315 3 1,444 ‐‐ ‐‐ 50
8/18/15 96,315 0 ‐‐ ‐‐ ‐‐ 0
8/25/15 96,315 0 ‐‐ ‐‐ ‐‐ 0
9/1/15 96,315 0 ‐‐ ‐‐ ‐‐ 09/4/15 96,320 5 2,318 1,821 35 979/9/15 96,440 120 2,940 1,195 75 4,784
9/15/15 96,581 141 3,254 1,325 75 6,702
9/17/15 96,630 49 ‐‐ 1,310 75 2,3349/22/15 96,630 0 ‐‐ ‐‐ ‐‐ 09/25/15 96,630 0 2,818 ‐‐ 60 0
9/29/15 96,720 90 2,116 1,406 65 2,974
Third Quarter 2015 Totals 96,720 ‐‐ ‐‐ ‐‐ ‐‐ 51,350
Cumulative Totals 96,720 ‐‐ ‐‐ ‐‐ ‐‐ 3,274,401
Notes:a The total mass removed is based on influent FID or PID readings, hours of operation, and flow rate.
‐‐ = not applicable or not availableFID = flame ionization detector
in. H2O = inches of water
PID = photoionization detectorppmv = parts per million by volumescfm = standard cubic feet per minute
TPH‐g = total petroleum hydrocarbons quantified as gasoline (C4‐C12)
Table 2. Vapor Remediation System Operation Summary
SFPP Norwalk Pump Station, Norwalk, California
EN1014151027SCO Page 1 of 1
MW‐SF‐1 SVE 1,302 1,176
MW‐SF‐2 SVE; TFE 700 532
MW‐SF‐3 SVE; TFE 2,524 1,818
MW‐SF‐4 SVE 238 168
MW‐SF‐5 SVE 172 298
MW‐SF‐6 SVE; TFE 4,090 3,322
MW‐SF‐9 SVE 658 116
MW‐SF‐10 SVE 154 84
MW‐SF‐11 SVE; TFE 520 176
MW‐SF‐12 SVE; TFE >5000 3,910
MW‐SF‐13 SVE; TFE 1,330 726
MW‐SF‐14 SVE; TFE 574 722
MW‐SF‐15 SVE; TFE 2,838 638
MW‐SF‐16 SVE; TFE 2,654 1,218
GMW‐9 SVE; TFE 2,750 142
GMW‐10 SVE 1,848 1,860
GMW‐22 SVE; TFE 2,750 142
GMW‐24 SVE; TFE 948 848
GMW‐25 SVE; GWE 948 818
GWR‐3 SVE; GWE >5000 4,350
VEW‐1 SVE 130 382
VEW‐2 SVE 158 2510
MW‐O‐1 SVE; TFE 168 386
MW‐O‐2 SVE; TFE 1,414 914
GMW‐O‐11 SVE; TFE >5000 >5000
GMW‐O‐12 SVE 368 >5000
GMW‐O‐20 SVE; TFE >5000 >5000
GMW‐O‐23 SVE; TFE 172 >5000
MW‐18 (MID) SVE 200 462
HW‐1 SVE 444 944
HW‐2 SVE 154 2,356
GMW‐36 SVE; TFE 2,398 4,334
GMW‐O‐15 SVE; TFE 2,398 4,334
GMW‐O‐18 SVE; TFE 2,398 4,334
Notes:
GWE = groundwater extractionppmv = parts per million by volumeSVE = soil vapor extraction
TFE = total fluids extraction
South‐Central
9/1/2015
(ppmv as Hexane)a
9/17/2015
(ppmv as Hexane)a
a Vapor readings measured in the field with an Eagle 2 photoionization detector (PID)
calibrated using 100 ppmv of hexane.
Table 3. Remediation Well Vapor Concentrations
SFPP Norwalk Pump Station, Norwalk, California
Remediation
Well Function
Remediation
Area
Remediation
Well ID
Southeastern
EN1014151027SCO Page 1 of 1

Methane
Carbon
Dioxide
Oxygen and
Argon TPH‐g TGNMOC Benzene Ethylbenzene Toluene Xylenes MTBE
(%v) (%v) (%v) (ppmv) (ppmv) (ppbv) (ppbv) (ppbv) (ppbv) (ppbv)
8/3/2007 <0.5 <0.5 22.0 63 ‐‐‐ 650 220 1,100 1,420 55
9/5/2007 <0.5 <0.5 22.0 9 ‐‐‐ 32 48 140 320 18
10/2/2007 <0.5 <0.5 21.9 27 ‐‐‐ 250 75 430 610 20
11/2/2007 <0.5 <0.5 22.1 5 ‐‐‐ 40 10 74 95 7
2/1/2008 <0.5 <0.5 21.8 100 ‐‐‐ 830 260 2,200 1,850 <50
3/4/2008 <0.5 <0.5 21.7 50 ‐‐‐ 380 98 570 1,250 36
4/8/2008 <0.5 <0.5 22.2 69 ‐‐‐ 290 110 480 1,040 41
5/23/2008 <0.5 <0.5 21.8 14 ‐‐‐ 180 24 190 280 23
6/3/2008 <0.5 <0.5 21.7 30 ‐‐‐ 380 42 400 330 70
7/2/2008 <0.5 <0.5 21.4 49 ‐‐‐ 32 6 34 45 10
8/19/2008 <0.5 1.7 20.8 50 ‐‐‐ 390 63 230 450 40
9/5/2008 <0.5 2.0 21.2 22 ‐‐‐ 130 39 130 340 42
10/7/2008 <0.5 1.43 21.4 10 ‐‐‐ 41 15 54 181 6.8
11/4/2008 <0.5 2.08 21.1 7.5 ‐‐‐ 31 47 190 242 <2.0
3/6/2009 <0.5 <0.5 22.0 83 ‐‐‐ 1,900 180 990 770 240
4/17/2009 <0.5 <0.5 22.2 3.1 ‐‐‐ 140 8 37 68 26
5/29/2009 <0.5 1.08 21.0 130 ‐‐‐ 1,700 640 3,700 3,100 100
8/18/2009 <0.5 0.78 21.7 28 ‐‐‐ 380 37 290 310 33
8/25/2009 <0.5 0.87 20.6 37 ‐‐‐ 500 44 320 293 20
9/18/2009 <0.5 0.37 21.6 11 ‐‐‐ 75 11 39 107 3
10/29/2009 <0.5 1.80 18.2 77 ‐‐‐ 350 45 250 440 4
11/25/2009 <0.5 <0.5 21.1 14 ‐‐‐ 110 12 110 164 11
12/15/2009 <0.5 <0.5 21.7 7 ‐‐‐ 28 3 20 47 <3.2
2/26/2010 <0.5 0.4 21.2 20 ‐‐‐ 300 18 220 260 21
3/26/2010 <0.5 1.0 20.2 18 ‐‐‐ 380 20 110 90 5
5/4/2010 <0.5 0.4 21.4 13 ‐‐‐ 100 42 170 222 3
6/29/2010 <0.5 0.4 21.3 9 ‐‐‐ 74 13 66 82 <5.0
8/3/2010 <0.5 0.6 20.4 29 ‐‐‐ 210 13 64 85 9
8/31/2010 0.0039 c <0.5 21.4 11 ‐‐‐ 72 12 66 87 8
9/14/2010 <0.5 <0.5 21.6 6 ‐‐‐ 63 15 57 84 <3.2
11/2/2010 ‐‐ ‐‐ ‐‐ 11 ‐‐‐ 140 <10 31 28 <10
11/17/2010 0.00075 0.4 22.0 ‐‐ ‐‐‐ ‐‐ ‐‐ ‐‐ ‐‐ ‐‐
12/28/2010 0.0052 0.27 22.0 16 ‐‐‐ 160 37 230 324 4.5
1/14/2011 0.016 0.20 22.0 68 ‐‐‐ 340 34 89 183 <10
2/8/2011 0.026 0.24 21.0 210 ‐‐‐ 3,000 1,700 11,000 7,400 110
3/29/2011 0.013 0.13 20.0 5 ‐‐‐ 170 15 18 41.5 <2.5
4/26/2011 0.0011 0.079 20.0 1.9 ‐‐‐ 16 2.4 8.8 7.7 <1.2
5/17/2011 0.021 0.65 22.0 90 ‐‐‐ 2,600 140 2,200 1,100 220
6/17/2011 0.001 0.20 22.0 3 ‐‐‐ 59 8.1 31 56 <0.25
7/19/2011 0.0056 0.49 22.0 80 ‐‐‐ 1,800 130 2,200 1,000 <31
8/16/2011 0.0026 0.31 22.0 140 ‐‐‐ 3,000 600 4,000 2,330 490
9/20/2011 ‐‐ ‐‐ ‐‐ 100 ‐‐‐ 2,100 740.0 2,700 2,040 660
11/22/2011 0.070 0.70 20.0 11 ‐‐‐ 150 12.0 67 35 <5.0
12/20/2011 0.020 0.34 22.0 0 ‐‐‐ 110 <25 260 216 <25
1/10/2012 0.010 0.66 20.0 11 ‐‐‐ 150 14 86 160 <12
2/28/2012 0.0067 0.90 20.0 27 ‐‐‐ 140 42 140 224 <25
3/13/2012 0.0044 0.71 20.0 27 ‐‐‐ 440 38 450 241 <25
4/27/2012 0.0290 0.22 21.0 39 ‐‐‐ 540 42 630 299 <25
5/22/2012 0.0100 0.31 20.0 65 ‐‐‐ 590 350 770 2,070 <12
6/19/2012 0.0028 0.41 21.0 17 ‐‐‐ 130 26 150 162 <12
7/27/2012 0.0059 0.40 21.0 13 ‐‐‐ 46 <5 33 78 <5
8/30/2012 0.0049 0.56 21.0 69 ‐‐‐ 150 <25 66 194 <25
9/25/2012 0.0073 0.80 21.0 57 ‐‐‐ 190 19 120 283 <2.5
10/30/2012 0.0099 0.96 21.0 50 ‐‐‐ 380 <50 230 130 <50
12/11/2012 0.0074 0.84 21.0 53 ‐‐‐ 130 17 110 173 <5.0
Date
Sampled
EPA TO‐15 (VOCs)b
SFPP Norwalk Pump Station, Norwalk, California
EPA TO‐3ASTM D‐1946
Table 4. Extracted Vapor Analytical Resultsa
SCAQMD 25.1
EN1014151027SCO Page 1 of 2
Methane
Carbon
Dioxide
Oxygen and
Argon TPH‐g TGNMOC Benzene Ethylbenzene Toluene Xylenes MTBE
(%v) (%v) (%v) (ppmv) (ppmv) (ppbv) (ppbv) (ppbv) (ppbv) (ppbv)
Date
Sampled
EPA TO‐15 (VOCs)b
SFPP Norwalk Pump Station, Norwalk, California
EPA TO‐3ASTM D‐1946
Table 4. Extracted Vapor Analytical Resultsa
SCAQMD 25.1
1/29/2013 0.0028 0.29 22.0 1.4 ‐‐‐ 8.7 <1.2 9.4 9.6 <1.2
2/12/2013 0.0057 0.88 21.0 60 ‐‐‐ 500 <50 440 400 <50
3/19/2013 0.0058 0.80 21.0 77 ‐‐‐ 560 66 490 520 <404/16/2013 0.0079 0.74 21.0 53 ‐‐‐ 430 29 240 193 <25
5/14/2013 0.017 1.6 19 280 ‐‐‐ 1,700 190 1,800 840 <12
6/28/2013 0.0068 <0.010 21 22 ‐‐‐ 190 <25 130 131 <25
9/20/2013 0.014 1 21 590 ‐‐‐ 4,200 520 3,600 2,830 <40
10/15/2013 0.011 0.68 21 410 ‐‐‐ 3,500 360 2,800 1,970 <20
11/12/2013 0.012 0.66 21 430 ‐‐‐ 2,900 440 2,600 1,930 <15
12/10/2013 0.013 0.92 21 910 ‐‐‐ 8,400 920 7,200 5,500 <50
1/17/2014 0.0077 0.57 21 350 ‐‐‐ 6,600 6,800 8,200 23,300 3,000
2/11/2014 0.011 0.60 21 640 ‐‐‐ 6,600 570 6,000 3,800 <100
3/21/2014 0.0050 0.40 21 390 ‐‐‐ 4,500 290 4,000 1,930 <50
4/21/2014 0.011 0.65 21 700 ‐‐‐ 6,900 370 6,900 3,400 <40
5/27/2014 0.011 0.56 21 530 ‐‐‐ 6,600 570 8,900 3,820 <50
6/13/2014 0.0076 0.49 21 780 ‐‐‐ 10,000 1,200 15,000 7,100 <80
3/31/2015 0.090 1.3 20 1,400 1,300 12,000 1,000 11,000 7,400 <200
4/7/2015 0.014 0.56 21 ‐‐‐ 710 8,200 8,200 610 3,260 <160
5/5/2015 ‐‐‐ ‐‐‐ ‐‐‐ ‐‐‐ 760 6,100 1,100 9,600 7,200 <140
6/30/2015 0.0065 0.37 21 ‐‐‐ 270 3,100 380 3,800 2,820 <160
7/14/2015 0.0094 0.62 21 ‐‐‐ 650 7,000 950 7,900 6,100 <200
8/4/2015 0.0053 0.49 21 ‐‐‐ 560 6,200 710 7,700 4,800 <0.097
8/17/2015c ‐‐‐ ‐‐‐ ‐‐‐ ‐‐‐ 470 4,800 500 5,400 3,600 <0.099
8/17/2015c ‐‐‐ ‐‐‐ ‐‐‐ ‐‐‐ 470 5,000 520 5,800 3,870 <0.100
8/17/2015c ‐‐‐ ‐‐‐ ‐‐‐ ‐‐‐ 480 5,100 580 6,100 4,000 <0.097
8/17/2015c ‐‐‐ ‐‐‐ ‐‐‐ ‐‐‐ 480 5,200 580 6,300 4,100 <0.099
9/1/2015c ‐‐‐ ‐‐‐ ‐‐‐ ‐‐‐ 670 7,000 850 8,700 6,900 <0.097
9/1/2015c ‐‐‐ ‐‐‐ ‐‐‐ ‐‐‐ 930 12,000 1,500 14,000 11,400 <0.140
9/1/2015c ‐‐‐ ‐‐‐ ‐‐‐ ‐‐‐ 890 12,000 2,300 20,000 14,300 <0.140
Notes:a Influent vapor samples were collected from the manifold conveying soil vapors extracted from the south‐central and southeastern areasb Other detected VOCs are included in the laboratory analytical reports in Appendix Ac Influent vapor samples were collected after dilution before entrance into the SVE combustion chamber
%v = percent by volume
<0.5 = not detected at or above the laboratory reporting limit shown
ASTM = ASTM International (formerly American Society for Testing and Materials)
EPA = U.S. Environmental Protection Agency
MTBE = methyl tertiary butyl ether
ppbv = parts per billion by volume
ppmv = parts per million by volume
SCAQMD = South Coast Air Quality Management District
TGNMOC = total gaseous non‐methane organic carbon
TPH‐g = total petroleum hydrocarbons quantified as gasoline (C4‐C12)
VOC = volatile organic compound
SVE system down for repair and permit modification from July 1, 2014 to March 27, 2015.
SVE system down for repair from April 29, 2014 to May 13, 2014.
SVE system down for repair from July 16, 2013, to September 17, 2013.
EN1014151027SCO Page 2 of 2
System
Inspection Date
Groundwater
Removed from the South‐
Central and
Southeastern Areas
(gallons)
Groundwater Removed
from the West Side
Barrier Area
(gallons)
Total
Groundwater
Removed
(gallons)
Influent
TPH‐total
(TPH‐g, TPH‐d, TPH‐
o) Concentration
(µg/L)
Estimated Hydrocarbon
Mass Removed from
the South‐Central,
Southeastern, and
West Side Barrier Areas
(pounds)a
Product
Recovery
(gallons)
1996 Totals 1,802,103 0 1,802,103 ‐‐ 4,995
1997 Totals 7,031,533 0 7,031,533 ‐‐ 2,204
1998 Totals 4,064,700 0 4,064,700 ‐‐ 856
1999 Totals 3,891,600 2,338,129 6,229,729 ‐‐ 385 450
2000 Totals 2,290,580 2,454,971 4,745,551 ‐‐ 295 230
2001 Totals 1,401,473 1,131,700 2,533,173 ‐‐ 229 0
2002 Totals 1,452,229 2,931,167 4,383,396 ‐‐ 110 10
2003 Totals 1,607,095 2,281,956 3,889,051 ‐‐ 65 0
2004 Totals 1,695,361 3,854,470 5,549,831 ‐‐ 229 83
2005 Totals 1,537,925 4,244,674 5,782,599 ‐‐ 273 89
2006 Totals 1,699,567 5,089,615 6,789,182 ‐‐ 0
2007 Totals 3,368,481 2,167,724 5,536,205 ‐‐ 0
2008 Totalsb 4,283,026 405,954 4,688,980 ‐‐ 520 0
2009 Totals 2,309,627 0 2,309,627 ‐‐ 105 0
2010 Totalsc 3,342,227 2,244 3,344,471 ‐‐ 363 0
2011 Totals 5,530,317 0 5,530,317 ‐‐ 585 0
2012 Totals 7,368,318 0 7,368,318 ‐‐ 699 0
2013 Totals 6,439,776 0 6,439,776 ‐‐ 568 2
2014 Totals 3,410,458 0 3,410,458 ‐‐ 2,236 2,335
1/1/2015 10,913 0 10,913 28,082 2.55
1/2/2015 10,821 0 10,821 28,082 2.53
1/3/2015 10,687 0 10,687 28,082 2.50
1/4/2015 10,742 0 10,742 28,082 2.51
1/5/2015 10,680 0 10,680 28,082 2.50
1/6/2015 10,811 0 10,811 28,082 2.53
1/7/2015 11,045 0 11,045 28,082 2.58
1/8/2015 11,608 0 11,608 28,082 2.72
1/9/2015 11,618 0 11,618 28,082 2.72
1/10/2015 11,476 0 11,476 28,082 2.68
1/11/2015 11,658 0 11,658 28,082 2.73
1/12/2015 11,871 0 11,871 28,082 2.78
1/13/2015 11,554 0 11,554 28,082 2.70
1/14/2015 11,422 0 11,422 28,082 2.67
1/15/2015 11,596 0 11,596 13,870 1.34
1/16/2015 10,368 0 10,368 13,870 1.20
1/17/2015 7,837 0 7,837 13,870 0.91
Table 5. Groundwater Remediation System Operation Summary
SFPP Norwalk Pump Station, Norwalk, California
273
684
EN1014151027SCO Page 1 of 9
System
Inspection Date
Groundwater
Removed from the South‐
Central and
Southeastern Areas
(gallons)
Groundwater Removed
from the West Side
Barrier Area
(gallons)
Total
Groundwater
Removed
(gallons)
Influent
TPH‐total
(TPH‐g, TPH‐d, TPH‐
o) Concentration
(µg/L)
Estimated Hydrocarbon
Mass Removed from
the South‐Central,
Southeastern, and
West Side Barrier Areas
(pounds)a
Product
Recovery
(gallons)
Table 5. Groundwater Remediation System Operation Summary
SFPP Norwalk Pump Station, Norwalk, California
1/18/2015 7,927 0 7,927 13,870 0.92
1/19/2015 7,781 0 7,781 13,870 0.90
1/20/2015 7,654 0 7,654 13,870 0.88
1/21/2015 7,528 0 7,528 13,870 0.87
1/22/2015 7,584 0 7,584 13,870 0.88
1/23/2015 7,539 0 7,539 13,870 0.87
1/24/2015 7,541 0 7,541 13,870 0.87
1/25/2015 6,649 0 6,649 13,870 0.77
1/26/2015 6,671 0 6,671 13,870 0.77
1/27/2015 6,624 0 6,624 13,870 0.77
1/28/2015 10,345 0 10,345 13,870 1.20
1/29/2015 13,323 0 13,323 13,870 1.54
1/30/2015 14,402 0 14,402 13,870 1.66
1/31/2015 14,510 0 14,510 13,870 1.68
2/1/2015 14,207 0 14,207 13,870 1.64
2/2/2015 14,066 0 14,066 13,870 1.63
2/3/2015 13,888 0 13,888 13,870 1.60 51
2/4/2015 11,288 0 11,288 13,870 1.30
2/5/2015 13,952 0 13,952 13,870 1.61
2/6/2015 13,898 0 13,898 13,870 1.61
2/7/2015 14,049 0 14,049 13,870 1.62
2/8/2015 14,405 0 14,405 13,870 1.66
2/9/2015 14,443 0 14,443 13,870 1.67
2/10/2015 14,369 0 14,369 13,870 1.66
2/11/2015 13,976 0 13,976 13,870 1.61
2/12/2015 14,102 0 14,102 13,870 1.63
2/13/2015 13,681 0 13,681 13,870 1.58
2/14/2015 12,679 0 12,679 13,870 1.47
2/15/2015 12,363 0 12,363 13,870 1.43
2/16/2015 12,454 0 12,454 13,870 1.44
2/17/2015 12,388 0 12,388 13,870 1.43
2/18/2015 12,254 0 12,254 13,870 1.42
2/19/2015 12,249 0 12,249 13,870 1.42
2/20/2015 12,218 0 12,218 170,000 17.30
2/21/2015 12,330 0 12,330 170,000 17.46
2/22/2015 12,045 0 12,045 170,000 17.06
EN1014151027SCO Page 2 of 9
System
Inspection Date
Groundwater
Removed from the South‐
Central and
Southeastern Areas
(gallons)
Groundwater Removed
from the West Side
Barrier Area
(gallons)
Total
Groundwater
Removed
(gallons)
Influent
TPH‐total
(TPH‐g, TPH‐d, TPH‐
o) Concentration
(µg/L)
Estimated Hydrocarbon
Mass Removed from
the South‐Central,
Southeastern, and
West Side Barrier Areas
(pounds)a
Product
Recovery
(gallons)
Table 5. Groundwater Remediation System Operation Summary
SFPP Norwalk Pump Station, Norwalk, California
2/23/2015 12,296 0 12,296 170,000 17.41
2/24/2015 11,970 0 11,970 170,000 16.95
2/25/2015 12,506 0 12,506 170,000 17.71
2/26/2015 13,326 0 13,326 170,000 18.87
2/27/2015 13,753 0 13,753 170,000 19.48
2/28/2015 14,863 0 14,863 170,000 21.05
3/1/2015 16,692 0 16,692 170,000 23.64
3/2/2015 16,641 0 16,641 170,000 23.57
3/3/2015 16,327 0 16,327 560,000 76.17
3/4/2015 9,045 0 9,045 560,000 42.20
3/5/2015 13,227 0 13,227 560,000 61.71
3/6/2015 13,196 0 13,196 560,000 61.56 15
3/7/2015 10,926 0 10,926 560,000 50.97
3/8/2015 13,966 0 13,966 560,000 65.16
3/9/2015 13,503 0 13,503 560,000 63.00
3/10/2015 13,899 0 13,899 560,000 64.84
3/11/2015 13,430 0 13,430 560,000 62.66
3/12/2015 11,271 0 11,271 560,000 52.58
3/13/2015 11,384 0 11,384 560,000 53.11
3/14/2015 11,744 0 11,744 560,000 54.79
3/15/2015 5,739 0 5,739 560,000 26.77
3/16/2015 0 0 0 560,000 0.00
3/17/2015 3 0 3 560,000 0.01
3/18/2015 10 0 10 560,000 0.05
3/19/2015 0 0 0 560,000 0.00
3/20/2015 1 0 1 560,000 0.00
3/21/2015 53 0 53 560,000 0.25
3/22/2015 10 0 10 560,000 0.05
3/23/2015 14 0 14 560,000 0.07
3/24/2015 3,925 0 3,925 560,000 18.31
3/25/2015 6,867 0 6,867 560,000 32.04
3/26/2015 5,172 0 5,172 560,000 24.13
3/27/2015 9,598 0 9,598 560,000 44.78
3/28/2015 10,570 0 10,570 560,000 49.31
3/29/2015 10,075 0 10,075 560,000 47.00
3/30/2015 8,769 0 8,769 560,000 40.91
EN1014151027SCO Page 3 of 9
System
Inspection Date
Groundwater
Removed from the South‐
Central and
Southeastern Areas
(gallons)
Groundwater Removed
from the West Side
Barrier Area
(gallons)
Total
Groundwater
Removed
(gallons)
Influent
TPH‐total
(TPH‐g, TPH‐d, TPH‐
o) Concentration
(µg/L)
Estimated Hydrocarbon
Mass Removed from
the South‐Central,
Southeastern, and
West Side Barrier Areas
(pounds)a
Product
Recovery
(gallons)
Table 5. Groundwater Remediation System Operation Summary
SFPP Norwalk Pump Station, Norwalk, California
3/31/2015 7,259 0 7,259 560,000 33.87
First Quarter 2015 Totals 936,119 0 936,119 ‐‐ 1,321 66
4/1/2015 4,957 0 4,957 560,000 23.13
4/2/2015 12,261 0 12,261 560,000 57.20
4/3/2015 11,958 0 11,958 560,000 55.79
4/4/2015 11,934 0 11,934 560,000 55.68
4/5/2015 12,161 0 12,161 560,000 56.74
4/6/2015 12,183 0 12,183 560,000 56.84
4/7/2015 11,621 0 11,621 200,000 19.36
4/8/2015 12,053 0 12,053 200,000 20.08
4/9/2015 15,447 0 15,447 200,000 25.74
4/10/2015 14,531 0 14,531 200,000 24.21
4/11/2015 15,151 0 15,151 200,000 25.24
4/12/2015 15,870 0 15,870 200,000 26.44
4/13/2015 15,240 0 15,240 200,000 25.39
4/14/2015 9,612 0 9,612 200,000 16.02
4/15/2015 0 0 0 200,000 0.00
4/16/2015 0 0 0 200,000 0.00
4/17/2015 4 0 4 200,000 0.01
4/18/2015 2 0 2 200,000 0.00
4/19/2015 6 0 6 200,000 0.01
4/20/2015 5 0 5 200,000 0.01
4/21/2015 15 0 15 200,000 0.02
4/22/2015 43 0 43 200,000 0.07
4/23/2015 6,605 0 6,605 200,000 11.01
4/24/2015 14,670 0 14,670 200,000 24.44 454
4/25/2015 13,734 0 13,734 200,000 22.88
4/26/2015 12,820 0 12,820 200,000 21.36
4/27/2015 12,774 0 12,774 200,000 21.28
4/28/2015 12,721 0 12,721 200,000 21.20
4/29/2015 12,721 0 12,721 200,000 21.20
4/30/2015 12,721 0 12,721 200,000 21.20
5/1/2015 15,855 0 15,855 200,000 26.42
5/2/2015 12,762 0 12,762 200,000 21.26
5/3/2015 12,629 0 12,629 200,000 21.04
5/4/2015 12,693 0 12,693 200,000 21.15
EN1014151027SCO Page 4 of 9
System
Inspection Date
Groundwater
Removed from the South‐
Central and
Southeastern Areas
(gallons)
Groundwater Removed
from the West Side
Barrier Area
(gallons)
Total
Groundwater
Removed
(gallons)
Influent
TPH‐total
(TPH‐g, TPH‐d, TPH‐
o) Concentration
(µg/L)
Estimated Hydrocarbon
Mass Removed from
the South‐Central,
Southeastern, and
West Side Barrier Areas
(pounds)a
Product
Recovery
(gallons)
Table 5. Groundwater Remediation System Operation Summary
SFPP Norwalk Pump Station, Norwalk, California
5/5/2015 12,475 0 12,475 200,000 20.79
5/6/2015 12,934 0 12,934 200,000 21.55
5/7/2015 15,213 0 15,213 200,000 25.35
5/8/2015 14,666 0 14,666 200,000 24.44
5/9/2015 14,387 0 14,387 200,000 23.97
5/10/2015 14,583 0 14,583 200,000 24.30
5/11/2015 14,565 0 14,565 200,000 24.27
5/12/2015 15,012 0 15,012 200,000 25.01
5/13/2015 6,923 0 6,923 200,000 11.54
5/14/2015 5,915 0 5,915 200,000 9.86
5/15/2015 0 0 0 200,000 0.00
5/16/2015 6,020 0 6,020 200,000 10.03
5/17/2015 11,405 0 11,405 200,000 19.00
5/18/2015 9,554 0 9,554 200,000 15.92
5/19/2015 6,290 0 6,290 165,400 8.67 20
5/20/2015 9,715 0 9,715 165,400 13.39
5/21/2015 11,156 0 11,156 165,400 15.37 18
5/22/2015 10,751 0 10,751 165,400 14.81 359
5/23/2015 9,773 0 9,773 165,400 13.47
5/24/2015 8,601 0 8,601 165,400 11.85
5/25/2015 8,503 0 8,503 165,400 11.72
5/26/2015 8,335 0 8,335 165,400 11.49
5/27/2015 8,017 0 8,017 165,400 11.05
5/28/2015 7,814 0 7,814 165,400 10.77
5/29/2015 7,864 0 7,864 165,400 10.84 16
5/30/2015 7,581 0 7,581 165,400 10.45
5/31/2015 7,695 0 7,695 165,400 10.60
6/1/2015 7,638 0 7,638 165,400 10.52
6/2/2015 7,641 0 7,641 170,100 10.83 8
6/3/2015 7,967 0 7,967 170,100 11.29
6/4/2015 7,854 0 7,854 170,100 11.13 14
6/5/2015 9,216 0 9,216 170,100 13.06
6/6/2015 11,291 0 11,291 170,100 16.00
6/7/2015 8,542 0 8,542 170,100 12.11
6/8/2015 8,537 0 8,537 170,100 12.10
6/9/2015 9,920 0 9,920 170,100 14.06
EN1014151027SCO Page 5 of 9
System
Inspection Date
Groundwater
Removed from the South‐
Central and
Southeastern Areas
(gallons)
Groundwater Removed
from the West Side
Barrier Area
(gallons)
Total
Groundwater
Removed
(gallons)
Influent
TPH‐total
(TPH‐g, TPH‐d, TPH‐
o) Concentration
(µg/L)
Estimated Hydrocarbon
Mass Removed from
the South‐Central,
Southeastern, and
West Side Barrier Areas
(pounds)a
Product
Recovery
(gallons)
Table 5. Groundwater Remediation System Operation Summary
SFPP Norwalk Pump Station, Norwalk, California
6/10/2015 10,608 0 10,608 170,100 15.03
6/11/2015 12,232 0 12,232 170,100 17.33
6/12/2015 12,208 0 12,208 170,100 17.30 12
6/13/2015 11,952 0 11,952 170,100 16.94
6/14/2015 12,036 0 12,036 170,100 17.06
6/15/2015 11,935 0 11,935 170,100 16.91
6/16/2015 11,747 0 11,747 170,100 16.65
6/17/2015 10,637 0 10,637 170,100 15.07
6/18/2015 16,194 0 16,194 170,100 22.95
6/19/2015 16,581 0 16,581 170,100 23.50 10
6/20/2015 16,496 0 16,496 170,100 23.38
6/21/2015 16,352 0 16,352 170,100 23.17
6/22/2015 16,156 0 16,156 170,100 22.90
6/23/2015 16,129 0 16,129 170,100 22.86
6/24/2015 18,827 0 18,827 170,100 26.68
6/25/2015 21,621 0 21,621 170,100 30.64
6/26/2015 23,039 0 23,039 170,100 32.65 11
6/27/2015 27,841 0 27,841 170,100 39.45
6/28/2015 10,696 0 10,696 170,100 15.16
6/29/2015 27,653 0 27,653 170,100 39.19
6/30/2015 8,302 0 8,302 170,100 11.76
Second Quarter 2015 Totals 1,001,354 0 1,001,354 ‐‐ 1,731 920
7/1/2015 21,875 0 21,875 170,100 31.00
7/2/2015 25,155 0 25,155 170,100 35.65 9
7/3/2015 22,810 0 22,810 170,100 32.32
7/4/2015 17,139 0 17,139 170,100 24.29
7/5/2015 15,601 0 15,601 170,100 22.11
7/6/2015 22,666 0 22,666 170,100 32.12
7/7/2015 10,014 0 10,014 170,100 14.19 161
7/8/2015 19,020 0 19,020 170,100 26.95
7/9/2015 20,882 0 20,882 170,100 29.59
7/10/2015 12,839 0 12,839 170,100 18.19
7/11/2015 19,069 0 19,069 170,100 27.02
7/12/2015 18,746 0 18,746 170,100 26.57
7/13/2015 18,640 0 18,640 170,100 26.42
7/14/2015 18,720 0 18,720 170,100 26.53
EN1014151027SCO Page 6 of 9
System
Inspection Date
Groundwater
Removed from the South‐
Central and
Southeastern Areas
(gallons)
Groundwater Removed
from the West Side
Barrier Area
(gallons)
Total
Groundwater
Removed
(gallons)
Influent
TPH‐total
(TPH‐g, TPH‐d, TPH‐
o) Concentration
(µg/L)
Estimated Hydrocarbon
Mass Removed from
the South‐Central,
Southeastern, and
West Side Barrier Areas
(pounds)a
Product
Recovery
(gallons)
Table 5. Groundwater Remediation System Operation Summary
SFPP Norwalk Pump Station, Norwalk, California
7/15/2015 17,568 0 17,568 170,100 24.90
7/16/2015 17,406 0 17,406 170,100 24.67
7/17/2015 10,334 0 10,334 170,100 14.64 6
7/18/2015 15,169 0 15,169 170,100 21.50
7/19/2015 18,090 0 18,090 170,100 25.64
7/20/2015 17,842 0 17,842 170,100 25.28
7/21/2015 14,655 0 14,655 170,100 20.77
7/22/2015 14,165 0 14,165 170,100 20.07
7/23/2015 15,312 0 15,312 170,100 21.70
7/24/2015 14,925 0 14,925 170,100 21.15 26
7/25/2015 15,163 0 15,163 170,100 21.49
7/26/2015 15,041 0 15,041 170,100 21.31
7/27/2015 15,104 0 15,104 170,100 21.40
7/28/2015 14,692 0 14,692 170,100 20.82
7/29/2015 14,933 0 14,933 170,100 21.16 5
7/30/2015 13,706 0 13,706 47,570 5.43
7/31/2015 16,218 0 16,218 47,570 6.43
8/1/2015 16,271 0 16,271 47,570 6.45
8/2/2015 16,163 0 16,163 47,570 6.41
8/3/2015 16,124 0 16,124 47,570 6.39
8/4/2015 15,128 0 15,128 47,570 6.00
8/5/2015 17,618 0 17,618 47,570 6.98
8/6/2015 17,366 0 17,366 37,570 5.44
8/7/2015 18,983 0 18,983 37,570 5.94
8/8/2015 20,418 0 20,418 37,570 6.39
8/9/2015 20,345 0 20,345 37,570 6.37
8/10/2015 20,161 0 20,161 37,570 6.31
8/11/2015 20,227 0 20,227 37,570 6.33 15
8/12/2015 18,460 0 18,460 37,570 5.78
8/13/2015 19,785 0 19,785 37,570 6.19
8/14/2015 17,634 0 17,634 37,570 5.52
8/15/2015 9,496 0 9,496 37,570 2.97
8/16/2015 9,594 0 9,594 37,570 3.00
8/17/2015 9,525 0 9,525 37,570 2.98
8/18/2015 10,270 0 10,270 37,570 3.21 246
8/19/2015 8,956 0 8,956 37,570 2.80
EN1014151027SCO Page 7 of 9
System
Inspection Date
Groundwater
Removed from the South‐
Central and
Southeastern Areas
(gallons)
Groundwater Removed
from the West Side
Barrier Area
(gallons)
Total
Groundwater
Removed
(gallons)
Influent
TPH‐total
(TPH‐g, TPH‐d, TPH‐
o) Concentration
(µg/L)
Estimated Hydrocarbon
Mass Removed from
the South‐Central,
Southeastern, and
West Side Barrier Areas
(pounds)a
Product
Recovery
(gallons)
Table 5. Groundwater Remediation System Operation Summary
SFPP Norwalk Pump Station, Norwalk, California
8/20/2015 9,094 0 9,094 37,570 2.85
8/21/2015 9,062 0 9,062 37,570 2.84
8/22/2015 8,985 0 8,985 37,570 2.81
8/23/2015 9,577 0 9,577 37,570 3.00
8/24/2015 9,740 0 9,740 37,570 3.05
8/25/2015 9,534 0 9,534 37,570 2.98
8/26/2015 8,079 0 8,079 37,570 2.53
8/27/2015 9,572 0 9,572 37,570 3.00
8/28/2015 6,291 0 6,291 37,570 1.97 9
8/29/2015 6,437 0 6,437 37,570 2.01
8/30/2015 6,065 0 6,065 37,570 1.90
8/31/2015 6,156 0 6,156 37,570 1.93
9/1/2015 6,459 0 6,459 37,570 2.02 12
9/2/2015 10,758 0 10,758 37,570 3.37
9/3/2015 8,930 0 8,930 37,570 2.80
9/4/2015 11,272 0 11,272 37,570 3.53
9/5/2015 18,061 0 18,061 37,570 5.65
9/6/2015 18,675 0 18,675 37,570 5.85
9/7/2015 14,904 0 14,904 129,000 16.02
9/8/2015 14,179 0 14,179 129,000 15.24
9/9/2015 14,216 0 14,216 129,000 15.28
9/10/2015 22,237 0 22,237 129,000 23.90
9/11/2015 21,576 0 21,576 129,000 23.19
9/12/2015 26,622 0 26,622 129,000 28.61
9/13/2015 26,221 0 26,221 129,000 28.18
9/14/2015 26,062 0 26,062 129,000 28.01
9/15/2015 26,076 0 26,076 129,000 28.02
9/16/2015 21,647 0 21,647 129,000 23.26
9/17/2015 20,867 0 20,867 129,000 22.43
9/18/2015 13,102 0 13,102 129,000 14.08
9/19/2015 5,169 0 5,169 129,000 5.56
9/20/2015 5,309 0 5,309 129,000 5.71
9/21/2015 5,301 0 5,301 129,000 5.70
9/22/2015 5,271 0 5,271 129,000 5.66 291
9/23/2015 8,666 0 8,666 129,000 9.31
9/24/2015 11,365 0 11,365 129,000 12.21
EN1014151027SCO Page 8 of 9

System
Inspection Date
Groundwater
Removed from the South‐
Central and
Southeastern Areas
(gallons)
Groundwater Removed
from the West Side
Barrier Area
(gallons)
Total
Groundwater
Removed
(gallons)
Influent
TPH‐total
(TPH‐g, TPH‐d, TPH‐
o) Concentration
(µg/L)
Estimated Hydrocarbon
Mass Removed from
the South‐Central,
Southeastern, and
West Side Barrier Areas
(pounds)a
Product
Recovery
(gallons)
Table 5. Groundwater Remediation System Operation Summary
SFPP Norwalk Pump Station, Norwalk, California
9/25/2015 9,701 0 9,701 129,000 10.43 1
9/26/2015 15,166 0 15,166 129,000 16.30
9/27/2015 20,318 0 20,318 129,000 21.84
9/28/2015 21,698 0 21,698 129,000 23.32
9/29/2015 21,631 0 21,631 129,000 23.25
9/30/2015 21,889 0 21,889 129,000 23.52
Third Quarter 2015 Totals 1,397,963 0 1,397,963 ‐‐ 1,296 780
Cumulative Total 68,797,951 26,902,604 95,700,555 ‐‐ 13,289 13,086
Notes:a Estimated hydrocarbon mass removed (pounds) between 1996 and 2005 is based on concentrations of dissolved BTEX
and MTBE in the groundwater influent and volume of groundwater extracted. Estimated hydrocarbon mass removed
(pounds) between 2006 and 2011 is based on concentrations of TPH‐g and TPH‐fp in the groundwater influent and volume
of groundwater extracted. Estimated hydrocarbon mass removed (pounds) between 2012 and 2015 is based on
concentrations of dissolved TPH‐total in the groundwater influent and volume of extracted groundwater.b Groundwater removal in the West Side Barrier area was discontinued in August 2008.c Groundwater extraction from West Side Barrier area wells BW‐3 and BW‐6 was resumed on May 14, 2010, to evaluate the
efficacy of blending water with lower selenium concentrations from these wells with groundwater extracted from the
south‐central and southeastern areas. Groundwater removal from the West Side Barrier area was discontinued
again on June 22, 2010.
‐‐ = not applicable
µg/L = micrograms per liter
BTEX = benzene, toluene, ethylbenzene, and xylenes
MTBE = methyl tertiary butyl ether
TPH‐d = total petroleum hydrocarbons quantified as diesel (C13‐C22)
TPH‐fp = total petroleum hydrocarbons quantified as fuel product (C7‐C28)
TPH‐g = total petroleum hydrocarbons quantified as gasoline (C4‐C12)
TPH‐o = total petroleum hydrocarbons quantified as oil (C23‐C36)
TPH‐total = total petroleum hydrocarbons quantified as gas, diesel, and oil (C4‐C36)
EN1014151027SCO Page 9 of 9
TPH‐g TPH‐d TPH‐o TPH‐total TPH‐fp Benzene Ethylbenzene Toluene Xylenes MTBE TBA DIPE ETBE TAME
(µg/L) (µg/L) (µg/L) (µg/L) (µg/L) (µg/L) (µg/L) (µg/L) (µg/L) (µg/L) (µg/L) (µg/L) (µg/L) (µg/L)
3/6/1996 ‐‐ ‐‐ ‐‐ ‐‐ ‐‐ 2,600 790 7,200 9,100 ‐‐‐ ‐‐ ‐‐ ‐‐ ‐‐
7/23/1998 ‐‐ ‐‐ ‐‐ ‐‐ ‐‐ 750 <10 360 300 ‐‐‐ ‐‐ ‐‐ ‐‐ ‐‐
8/27/1998 ‐‐ ‐‐ ‐‐ ‐‐ ‐‐ 1,000 71 530 800 ‐‐‐ ‐‐ ‐‐ ‐‐ ‐‐
10/1/1998 ‐‐ ‐‐ ‐‐ ‐‐ ‐‐ 1,200 <10 1,400 1,680 ‐‐‐ ‐‐ ‐‐ ‐‐ ‐‐
11/19/1998 ‐‐ ‐‐ ‐‐ ‐‐ ‐‐ 1,600 140 2,600 2,900 ‐‐‐ ‐‐ ‐‐ ‐‐ ‐‐
12/17/1998 ‐‐ ‐‐ ‐‐ ‐‐ ‐‐ 4,500 380 4,500 3,900 ‐‐‐ ‐‐ ‐‐ ‐‐ ‐‐
1/28/1999 ‐‐ ‐‐ ‐‐ ‐‐ ‐‐ 520 79 660 840 ‐‐‐ ‐‐ ‐‐ ‐‐ ‐‐
3/25/1999 ‐‐ ‐‐ ‐‐ ‐‐ ‐‐ 540 160 1,800 4,100 ‐‐‐ ‐‐ ‐‐ ‐‐ ‐‐
4/2/1999 ‐‐ ‐‐ ‐‐ ‐‐ ‐‐ 620 76 520 1,200 ‐‐‐ ‐‐ ‐‐ ‐‐ ‐‐
4/15/1999 ‐‐ ‐‐ ‐‐ ‐‐ ‐‐ 1,400 99 800 1,480 ‐‐‐ ‐‐ ‐‐ ‐‐ ‐‐
5/6/1999 ‐‐ ‐‐ ‐‐ ‐‐ ‐‐ 1,340 180 1,240 1,730 ‐‐‐ ‐‐ ‐‐ ‐‐ ‐‐
6/3/1999 ‐‐ ‐‐ ‐‐ ‐‐ ‐‐ 3,410 343 2,240 2,770 ‐‐‐ ‐‐ ‐‐ ‐‐ ‐‐
8/5/1999 ‐‐ ‐‐ ‐‐ ‐‐ ‐‐ 3,200 780 5,400 5,200 ‐‐‐ ‐‐ ‐‐ ‐‐ ‐‐
9/23/1999 ‐‐ ‐‐ ‐‐ ‐‐ ‐‐ 2,700 130 1,200 720 ‐‐‐ ‐‐ ‐‐ ‐‐ ‐‐
9/30/1999 ‐‐ ‐‐ ‐‐ ‐‐ ‐‐ 1,300 77 480 560 ‐‐‐ ‐‐ ‐‐ ‐‐ ‐‐
10/13/1999 ‐‐ ‐‐ ‐‐ ‐‐ ‐‐ 1,400 100 660 720 ‐‐‐ ‐‐ ‐‐ ‐‐ ‐‐
11/4/1999 ‐‐ ‐‐ ‐‐ ‐‐ ‐‐ 3,000 500 5,600 4,500 ‐‐‐ ‐‐ ‐‐ ‐‐ ‐‐
12/9/1999 ‐‐ ‐‐ ‐‐ ‐‐ ‐‐ 4,500 280 1,400 1,480 ‐‐‐ ‐‐ ‐‐ ‐‐ ‐‐
1/13/2000 ‐‐ ‐‐ ‐‐ ‐‐ ‐‐ 9,000 7,600 14,000 44,000 ‐‐‐ ‐‐ ‐‐ ‐‐ ‐‐
2/11/2000 ‐‐ ‐‐ ‐‐ ‐‐ ‐‐ 2,300 <100 1,200 1,240 3,100 ‐‐ ‐‐ ‐‐ ‐‐
3/10/2000 ‐‐ ‐‐ ‐‐ ‐‐ ‐‐ 380 20 110 430 740 ‐‐ ‐‐ ‐‐ ‐‐
4/13/2000 ‐‐ ‐‐ ‐‐ ‐‐ ‐‐ 1,300 550 450 920 970 ‐‐ ‐‐ ‐‐ ‐‐
6/2/2000 ‐‐ ‐‐ ‐‐ ‐‐ ‐‐ 840 56 240 980 920 ‐‐ ‐‐ ‐‐ ‐‐
6/15/2000 ‐‐ ‐‐ ‐‐ ‐‐ ‐‐ 1,600 82 900 990 2,700 ‐‐ ‐‐ ‐‐ ‐‐
8/3/2000 ‐‐ ‐‐ ‐‐ ‐‐ ‐‐ 1,900 410 3,500 4,400 2,700 ‐‐ ‐‐ ‐‐ ‐‐
8/28/2000 ‐‐ ‐‐ ‐‐ ‐‐ ‐‐ 620 33 200 380 1,800 ‐‐ ‐‐ ‐‐ ‐‐
9/20/2000 ‐‐ ‐‐ ‐‐ ‐‐ ‐‐ 460 <20 73 255 1,300 ‐‐ ‐‐ ‐‐ ‐‐
10/25/2000 ‐‐ ‐‐ ‐‐ ‐‐ ‐‐ 20 <20 <20 216 6,700 ‐‐ ‐‐ ‐‐ ‐‐
11/15/2000 ‐‐ ‐‐ ‐‐ ‐‐ ‐‐ 560 24 210 490 3,700 ‐‐ ‐‐ ‐‐ ‐‐
3/22/2001 ‐‐ ‐‐ ‐‐ ‐‐ ‐‐ 3,800 360 3,900 3,160 5,500 ‐‐ ‐‐ ‐‐ ‐‐
4/30/2001 ‐‐ ‐‐ ‐‐ ‐‐ ‐‐ 4,100 710 5,800 5,600 8,300 ‐‐ ‐‐ ‐‐ ‐‐
5/23/2001 ‐‐ ‐‐ ‐‐ ‐‐ ‐‐ 3,400 160 1,100 1,070 3,900 ‐‐ ‐‐ ‐‐ ‐‐
6/22/2001 ‐‐ ‐‐ ‐‐ ‐‐ ‐‐ 1,700 85 680 680 2,200 ‐‐ ‐‐ ‐‐ ‐‐
7/16/2001 ‐‐ ‐‐ ‐‐ ‐‐ ‐‐ 2,300 130 1,100 1,350 2,100 ‐‐ ‐‐ ‐‐ ‐‐
9/5/2001 ‐‐ ‐‐ ‐‐ ‐‐ ‐‐ 1,500 170 1,200 1,890 1,100 ‐‐ ‐‐ ‐‐ ‐‐
1/23/2002 ‐‐ ‐‐ ‐‐ ‐‐ ‐‐ <0.5 <1 <1 <2 2 ‐‐ ‐‐ ‐‐ ‐‐
2/28/2002 ‐‐ ‐‐ ‐‐ ‐‐ ‐‐ <0.5 <1 <1 <2 96 ‐‐ ‐‐ ‐‐ ‐‐
3/25/2002 ‐‐ ‐‐ ‐‐ ‐‐ ‐‐ <0.5 <1 <1 <2 87 ‐‐ ‐‐ ‐‐ ‐‐
5/1/2002 ‐‐ ‐‐ ‐‐ ‐‐ ‐‐ 1,900 31 190 480 1,100 ‐‐ ‐‐ ‐‐ ‐‐
5/17/2002 ‐‐ ‐‐ ‐‐ ‐‐ ‐‐ 1,400 50 180 970 1,000 ‐‐ ‐‐ ‐‐ ‐‐
6/4/2002 ‐‐ ‐‐ ‐‐ ‐‐ ‐‐ 2,700 57 280 530 1,300 ‐‐ ‐‐ ‐‐ ‐‐
7/18/2002 ‐‐ ‐‐ ‐‐ ‐‐ ‐‐ 3,800 66 530 1,160 330 ‐‐ ‐‐ ‐‐ ‐‐
8/8/2002 ‐‐ ‐‐ ‐‐ ‐‐ ‐‐ 4,800 49 610 1,290 460 ‐‐ ‐‐ ‐‐ ‐‐
9/3/2002 ‐‐ ‐‐ ‐‐ ‐‐ ‐‐ 260 <5 5 71 600 ‐‐ ‐‐ ‐‐ ‐‐
10/18/2002 ‐‐ ‐‐ ‐‐ ‐‐ ‐‐ 1,200 70 490 820 570 ‐‐ ‐‐ ‐‐ ‐‐
11/26/2002 ‐‐ ‐‐ ‐‐ ‐‐ ‐‐ 1,300 68 130 590 860 ‐‐ ‐‐ ‐‐ ‐‐
12/27/2002 ‐‐ ‐‐ ‐‐ ‐‐ ‐‐ 1 <1 <1 <2 58 ‐‐ ‐‐ ‐‐ ‐‐
Table 6. Extracted Groundwater Analytical Resultsa
SFPP Norwalk Pump Station, Norwalk, California
Date
Sampled
EPA 8015M EPA 8260B Volatile Organic Compounds (VOCs)b
EN1014151027SCO Page 1 of 5
TPH‐g TPH‐d TPH‐o TPH‐total TPH‐fp Benzene Ethylbenzene Toluene Xylenes MTBE TBA DIPE ETBE TAME
(µg/L) (µg/L) (µg/L) (µg/L) (µg/L) (µg/L) (µg/L) (µg/L) (µg/L) (µg/L) (µg/L) (µg/L) (µg/L) (µg/L)
Table 6. Extracted Groundwater Analytical Resultsa
SFPP Norwalk Pump Station, Norwalk, California
Date
Sampled
EPA 8015M EPA 8260B Volatile Organic Compounds (VOCs)b
1/30/2003 ‐‐ ‐‐ ‐‐ ‐‐ ‐‐ <0.5 <1 <1 <2 37 ‐‐ ‐‐ ‐‐ ‐‐
2/26/2003 ‐‐ ‐‐ ‐‐ ‐‐ ‐‐ 4 <1 <1 4 140 ‐‐ ‐‐ ‐‐ ‐‐
3/17/2003 ‐‐ ‐‐ ‐‐ ‐‐ ‐‐ 2,800 23 170 480 570 ‐‐ ‐‐ ‐‐ ‐‐
4/30/2003 ‐‐ ‐‐ ‐‐ ‐‐ ‐‐ 3,700 350 2,200 4,600 490 ‐‐ ‐‐ ‐‐ ‐‐
6/13/2003 ‐‐ ‐‐ ‐‐ ‐‐ ‐‐ 1,200 17 120 510 740 ‐‐ ‐‐ ‐‐ ‐‐
6/19/2003 ‐‐ ‐‐ ‐‐ ‐‐ ‐‐ 680 <10 35 239 680 ‐‐ ‐‐ ‐‐ ‐‐
7/3/2003 ‐‐ ‐‐ ‐‐ ‐‐ ‐‐ 2,600 160 610 2,290 450 ‐‐ ‐‐ ‐‐ ‐‐
7/25/2003 ‐‐ ‐‐ ‐‐ ‐‐ ‐‐ 300 6 3 39 230 ‐‐ ‐‐ ‐‐ ‐‐
8/20/2003 ‐‐ ‐‐ ‐‐ ‐‐ ‐‐ 830 19 130 350 290 ‐‐ ‐‐ ‐‐ ‐‐
9/11/2003 ‐‐ ‐‐ ‐‐ ‐‐ ‐‐ 270 <10 <10 46 420 ‐‐ ‐‐ ‐‐ ‐‐
10/16/2003 ‐‐ ‐‐ ‐‐ ‐‐ ‐‐ 380 <10 <10 121 490 ‐‐ ‐‐ ‐‐ ‐‐
11/17/2003 ‐‐ ‐‐ ‐‐ ‐‐ ‐‐ 93 6 22 106 200 ‐‐ ‐‐ ‐‐ ‐‐
12/19/2003 ‐‐ ‐‐ ‐‐ ‐‐ ‐‐ 300 27 110 1,010 62 ‐‐ ‐‐ ‐‐ ‐‐
1/30/2004 ‐‐ ‐‐ ‐‐ ‐‐ ‐‐ 700 140 740 1,740 22 ‐‐ ‐‐ ‐‐ ‐‐
2/17/2004 ‐‐ ‐‐ ‐‐ ‐‐ ‐‐ 300 47 440 1,150 19 ‐‐ ‐‐ ‐‐ ‐‐
3/8/2004 ‐‐ ‐‐ ‐‐ ‐‐ ‐‐ 52 <5.0 10 149 23 ‐‐ ‐‐ ‐‐ ‐‐
3/21/2004 ‐‐ ‐‐ ‐‐ ‐‐ ‐‐ 420 11 29 318 120 ‐‐ ‐‐ ‐‐ ‐‐
6/28/2004 ‐‐ ‐‐ ‐‐ ‐‐ ‐‐ 740 26 46 337 81 ‐‐ ‐‐ ‐‐ ‐‐
7/30/2004 ‐‐ ‐‐ ‐‐ ‐‐ ‐‐ 660 18 68 280 87 ‐‐ ‐‐ ‐‐ ‐‐
8/27/2004 ‐‐ ‐‐ ‐‐ ‐‐ ‐‐ 1,500 47 140 530 77 ‐‐ ‐‐ ‐‐ ‐‐
9/28/2004 ‐‐ ‐‐ ‐‐ ‐‐ ‐‐ 400 10 32 252 64 ‐‐ ‐‐ ‐‐ ‐‐
10/15/2004 ‐‐ ‐‐ ‐‐ ‐‐ ‐‐ 950 31 130 316 64 ‐‐ ‐‐ ‐‐ ‐‐
11/12/2004 ‐‐ ‐‐ ‐‐ ‐‐ ‐‐ 2,100 1,500 390 15,800 3,000 ‐‐ ‐‐ ‐‐ ‐‐
12/10/2004 ‐‐ ‐‐ ‐‐ ‐‐ ‐‐ 700 320 1,100 3,900 110 ‐‐ ‐‐ ‐‐ ‐‐
1/28/2005 ‐‐ ‐‐ ‐‐ ‐‐ ‐‐ 460 140 520 2,260 610 ‐‐ ‐‐ ‐‐ ‐‐
2/25/2005 ‐‐ ‐‐ ‐‐ ‐‐ ‐‐ 5,700 200 650 1,560 1,300 ‐‐ ‐‐ ‐‐ ‐‐
3/22/2005 ‐‐ ‐‐ ‐‐ ‐‐ ‐‐ <5 <10 <10 26 1,000 ‐‐ ‐‐ ‐‐ ‐‐
4/21/2005 ‐‐ ‐‐ ‐‐ ‐‐ ‐‐ 680 8 21 108 420 ‐‐ ‐‐ ‐‐ ‐‐
5/20/2005 ‐‐ ‐‐ ‐‐ ‐‐ ‐‐ 6 <5 9 50 <5 ‐‐ ‐‐ ‐‐ ‐‐
6/28/2005 ‐‐ ‐‐ ‐‐ ‐‐ ‐‐ 450 80 690 1,030 1,600 ‐‐ ‐‐ ‐‐ ‐‐
7/27/2005 ‐‐ ‐‐ ‐‐ ‐‐ ‐‐ 2,000 170 1,700 5,000 1,200 ‐‐ ‐‐ ‐‐ ‐‐
8/31/2005 ‐‐ ‐‐ ‐‐ ‐‐ ‐‐ 660 34 320 670 220 ‐‐ ‐‐ ‐‐ ‐‐
9/28/2005 ‐‐ ‐‐ ‐‐ ‐‐ ‐‐ 1,800 310 2,800 4,700 360 ‐‐ ‐‐ ‐‐ ‐‐
10/26/2005 ‐‐ ‐‐ ‐‐ ‐‐ ‐‐ 940 330 1,800 3,600 530 ‐‐ ‐‐ ‐‐ ‐‐
11/30/2005 ‐‐ ‐‐ ‐‐ ‐‐ ‐‐ 900 170 900 2,790 760 ‐‐ ‐‐ ‐‐ ‐‐
12/20/2005 ‐‐ ‐‐ ‐‐ ‐‐ ‐‐ 2,500 350 2,600 4,100 2,300 ‐‐ ‐‐ ‐‐ ‐‐
7/11/2007 ‐‐ ‐‐ ‐‐ ‐‐ ‐‐ 4,800 130 890 1,040 690 ‐‐ ‐‐ ‐‐ ‐‐
8/7/2007 14,000 ‐‐ ‐‐ ‐‐ 11,000 5,400 140 1,100 770 540 ‐‐ ‐‐ ‐‐ ‐‐
9/25/2007 12,000 ‐‐ ‐‐ ‐‐ 30,000 3,400 310 1,600 2,390 540 ‐‐ ‐‐ ‐‐ ‐‐
10/16/2007 8,900 ‐‐ ‐‐ ‐‐ 8,400 3,400 94 520 660 390 ‐‐ ‐‐ ‐‐ ‐‐
11/2/2007 44,000 ‐‐ ‐‐ ‐‐ 6,500 3,200 130 860 1,160 570 ‐‐ ‐‐ ‐‐ ‐‐
11/30/2007 6,000 ‐‐ ‐‐ ‐‐ 5,200 1,800 48 170 490 450 ‐‐ ‐‐ ‐‐ ‐‐
12/21/2007 7,200 ‐‐ ‐‐ ‐‐ 4,200 2,100 41 170 430 750 ‐‐ ‐‐ ‐‐ ‐‐
EN1014151027SCO Page 2 of 5
TPH‐g TPH‐d TPH‐o TPH‐total TPH‐fp Benzene Ethylbenzene Toluene Xylenes MTBE TBA DIPE ETBE TAME
(µg/L) (µg/L) (µg/L) (µg/L) (µg/L) (µg/L) (µg/L) (µg/L) (µg/L) (µg/L) (µg/L) (µg/L) (µg/L) (µg/L)
Table 6. Extracted Groundwater Analytical Resultsa
SFPP Norwalk Pump Station, Norwalk, California
Date
Sampled
EPA 8015M EPA 8260B Volatile Organic Compounds (VOCs)b
1/4/2008 4,300 ‐‐ ‐‐ ‐‐ 7,200 3,300 49 300 540 620 ‐‐ ‐‐ ‐‐ ‐‐
1/18/2008 11,000 ‐‐ ‐‐ ‐‐ 2,200 3,600 140 650 850 620 ‐‐ ‐‐ ‐‐ ‐‐
2/1/2008 8,700 ‐‐ ‐‐ ‐‐ 5,700 3,600 100 440 930 560 ‐‐ ‐‐ ‐‐ ‐‐
3/4/2008 7,200 ‐‐ ‐‐ ‐‐ 4,900 3,900 120 510 770 620 ‐‐ ‐‐ ‐‐ ‐‐
4/8/2008 8,100 ‐‐ ‐‐ ‐‐ 10,000 2,800 96 280 580 640 ‐‐ ‐‐ ‐‐ ‐‐
5/6/2008 5,300 ‐‐ ‐‐ ‐‐ 2,800 2,900 76 190 328 430 ‐‐ ‐‐ ‐‐ ‐‐
6/3/2008 8,400 ‐‐ ‐‐ ‐‐ 6,800 3,700 110 450 480 320 ‐‐ ‐‐ ‐‐ ‐‐
7/2/2008 9,200 ‐‐ ‐‐ ‐‐ 4,300c 4,500 75 620 650 400 ‐‐ ‐‐ ‐‐ ‐‐
8/19/2008 4,000 ‐‐ ‐‐ ‐‐ 6,600 2,600 57 76 215 450 ‐‐ ‐‐ ‐‐ ‐‐
9/5/2008 160 ‐‐ ‐‐ ‐‐ <500 <12 <25 <25 <25 <25 ‐‐ ‐‐ ‐‐ ‐‐
10/7/2008 <100 ‐‐ ‐‐ ‐‐ <500 0.36 J <1.0 <1.0 1.59 1.7 ‐‐ ‐‐ ‐‐ ‐‐
11/4/2008 12,000 ‐‐ ‐‐ ‐‐ 660,000 2,500 140 220 760 160 ‐‐ ‐‐ ‐‐ ‐‐
12/4/2008 1,300 ‐‐ ‐‐ ‐‐ 1,500 600 8.2 28 73 130 ‐‐ ‐‐ ‐‐ ‐‐
1/6/2009 1,500 ‐‐ ‐‐ ‐‐ 980 560 23 41 110 320 ‐‐ ‐‐ ‐‐ ‐‐
3/6/2009 2,500 ‐‐ ‐‐ ‐‐ 1,500 1,100 33 51 114 65 ‐‐ ‐‐ ‐‐ ‐‐
4/7/2009 3,100 ‐‐ ‐‐ ‐‐ 6,900 1,100 36 230 207 210 ‐‐ ‐‐ ‐‐ ‐‐
5/13/2009 690 ‐‐ ‐‐ ‐‐ 1,500 120 3.2 14 60 24 ‐‐ ‐‐ ‐‐ ‐‐
6/12/2009 150 ‐‐ ‐‐ ‐‐ <500 <0.50 <1.0 <1.0 0.71 J 44 ‐‐ ‐‐ ‐‐ ‐‐
7/10/2009 4,500 ‐‐ ‐‐ ‐‐ 560 1,500 41 68 175 150 ‐‐ ‐‐ ‐‐ ‐‐
8/4/2009 2,000 ‐‐ ‐‐ ‐‐ 1,000 1,200 16 18 64 100 ‐‐ ‐‐ ‐‐ ‐‐
9/1/2009 4,800 ‐‐ ‐‐ ‐‐ 3,500 380 45 25 328 5.4 J ‐‐ ‐‐ ‐‐ ‐‐
10/6/2009 3,900 ‐‐ ‐‐ ‐‐ 4,600 3,200 21 15 35 82 ‐‐ ‐‐ ‐‐ ‐‐
10/27/2009 1,000 ‐‐ ‐‐ ‐‐ <500 520 4 15 10 180 ‐‐ ‐‐ ‐‐ ‐‐
11/3/2009 120 ‐‐ ‐‐ ‐‐ <500 2 0.55 J 0.61 J 3 40 ‐‐ ‐‐ ‐‐ ‐‐
11/25/2009 5,700 ‐‐ ‐‐ ‐‐ 4,000 3,100 26 13 48 88 ‐‐ ‐‐ ‐‐ ‐‐
2/16/2010 8,000 ‐‐ ‐‐ ‐‐ 5,900 4,700 110 1,300 800 1,800 ‐‐ ‐‐ ‐‐ ‐‐
3/9/2010 7,000 ‐‐ ‐‐ ‐‐ 5,900 6,600 110 460 550 410 ‐‐ ‐‐ ‐‐ ‐‐
4/20/2010 10,000 ‐‐ ‐‐ ‐‐ 11,000 6,000 44 230 174 130 ‐‐ ‐‐ ‐‐ ‐‐
5/14/2010 8,500 ‐‐ ‐‐ ‐‐ 2,100 3,600 67 380 400 210 ‐‐ ‐‐ ‐‐ ‐‐
6/25/2010 4,600 ‐‐ ‐‐ ‐‐ 2,600 2,200 61 540 380 170 ‐‐ ‐‐ ‐‐ ‐‐
7/20/2010 21,000 ‐‐ ‐‐ ‐‐ 21,000 3,400 370 3,000 2,550 2,300 ‐‐ ‐‐ ‐‐ ‐‐
8/3/2010 3,400 ‐‐ ‐‐ ‐‐ 1,500 1,400 17 140 161 390 ‐‐ ‐‐ ‐‐ ‐‐
8/10/2010 5,800 ‐‐ ‐‐ ‐‐ 3,400 2,600 40 190 169 140 ‐‐ ‐‐ ‐‐ ‐‐
9/14/2010 9,400 ‐‐ ‐‐ ‐‐ 10,000 4,900 170 1,100 1,340 380 ‐‐ ‐‐ ‐‐ ‐‐
10/12/2010 5,700 ‐‐ ‐‐ ‐‐ 1,000 2,200 43 140 138 120 ‐‐ ‐‐ ‐‐ ‐‐
11/16/2010 1,100 ‐‐ ‐‐ ‐‐ 1,600 290 4 15 78 84 ‐‐ ‐‐ ‐‐ ‐‐
12/14/2010 7,100 ‐‐ ‐‐ ‐‐ 3,200 2,600 76 200 315 340 ‐‐ ‐‐ ‐‐ ‐‐
EN1014151027SCO Page 3 of 5

TPH‐g TPH‐d TPH‐o TPH‐total TPH‐fp Benzene Ethylbenzene Toluene Xylenes MTBE TBA DIPE ETBE TAME
(µg/L) (µg/L) (µg/L) (µg/L) (µg/L) (µg/L) (µg/L) (µg/L) (µg/L) (µg/L) (µg/L) (µg/L) (µg/L) (µg/L)
Table 6. Extracted Groundwater Analytical Resultsa
SFPP Norwalk Pump Station, Norwalk, California
Date
Sampled
EPA 8015M EPA 8260B Volatile Organic Compounds (VOCs)b
1/14/2011 7,400 ‐‐ ‐‐ ‐‐ 3,500 3,700 56 110 220 280 ‐‐ ‐‐ ‐‐ ‐‐
2/8/2011 5,600 ‐‐ ‐‐ ‐‐ 3,500 2,400 43 110 190 420 ‐‐ ‐‐ ‐‐ ‐‐
3/25/2011 3,100 ‐‐ ‐‐ ‐‐ 1,200 1,300 51 92 200 300 ‐‐ ‐‐ ‐‐ ‐‐
4/26/2011 1,400 ‐‐ ‐‐ ‐‐ 1,200 610 5.8 5.7 20 130 ‐‐ ‐‐ ‐‐ ‐‐
5/17/2011 3,300 ‐‐ ‐‐ ‐‐ 1,700 3,600 82 180 300 240 ‐‐ ‐‐ ‐‐ ‐‐
6/21/2011 1,200 ‐‐ ‐‐ ‐‐ 720 860 9.6 31 82 190 2,200 6.6 <0.07 <0.1
7/27/2011 14,000 10,000 44J ‐‐ ‐‐d 2,800 150 490 2,100 350 2,800 27 <0.07 <0.1
8/26/2011 7,400 ‐‐ ‐‐ ‐‐ 57,000 1,400 120 480 1,300 270 1,600 16 <0.07 <0.1
9/23/2011 6,400 ‐‐ ‐‐ ‐‐ 2,800 2,800 83.0 160 340 300 1,300 22 <0.07 <0.1
10/25/2011 6,000 ‐‐ ‐‐ ‐‐ 2,300 3,000 52 93 200 200 970 20 <0.70 <1.0
11/22/2011 5,900 ‐‐ ‐‐ ‐‐ 2,000 3,600 62 140 240 300 2,900 26 <0.07 <0.1
12/20/2011 780 ‐‐ ‐‐ ‐‐ 2,000 330 8 14 43 160 1,000 18 <0.07 <0.1
1/10/2012 5,300 ‐‐ ‐‐ ‐‐ 1,900 3,400 36 70 170 200 960 26 <0.07 <0.1
2/21/2012 4,900 ‐‐ ‐‐ ‐‐ <13 3,400 19 16 48 120 2,200 21 <0.07 <0.1
3/13/2012 6,100 ‐‐ ‐‐ ‐‐ 2,100 2,900 43 79 180 120 1,600 23 <0.07 <0.1
4/27/2012 5,100 ‐‐ ‐‐ ‐‐ 2,200 3,800 49 61 150 150 500 38 <0.13 <0.12
5/22/2012 6,800 ‐‐ ‐‐ ‐‐ 31,000 2,800 49 140 262 150 690 30 <0.13 <0.12
6/19/2012 5,300 ‐‐ ‐‐ ‐‐ 36,000 3,200 45 230 200 220 2,800 33 <0.13 <0.12
7/20/2012 5,600 2,400 210 8,200 ‐‐ 3,000 71 72 510 170 2,700 26 <0.13 <0.12
8/21/2012 3,600 1,100 140 4,900 ‐‐ 2,400 26 41 80 110 1,500 22 <0.13 <0.12
9/25/2012 2,100 710 71 2,800 ‐‐ 1,700 25 35 86 150 690 17 <1.0 <1.0
10/30/2012 2,600 700 74 3,374 ‐‐ 1,400 15 13 52 54 1,200 14 <0.061 <0.054
11/30/2012 860 8,200 260 9,320 ‐‐ 1,100 2.4 4.4 12 23 690 <0.038 <0.061 <0.054
12/27/2012 6,200 820 86 7,106 ‐‐ 2,000 39 76 130 120 1,300 20 <0.061 <0.054
1/15/2013 3,400 14,000 400 17,800 ‐‐ 800 12 25 130 43 1,200 8.7 <0.061 <0.054
2/12/2013 9,900 3,100 150 13,150 ‐‐ 2,100 110 440 820 110 330 22 <0.061 <0.054
3/5/2013 3,954 970 80 5,004 ‐‐ 1,400 21 23 87 63 1,200 15 <0.061 <0.054
3/15/2013 ‐‐ ‐‐ ‐‐ ‐‐ ‐‐ 1,400 25 49 98 74 570 14 <0.061 <0.054
4/16/2013 1,100 1,300 270 2,670 ‐‐ 370 6 19 56 73 530 17 <0.061 <0.054
5/14/2013 4,300 830 99 5,229 ‐‐ 2,000 52 98 181 61 270 22 <0.061 <0.054
6/28/2013 2,900 870 150 3,920 ‐‐ 1,100 18 58 76 92 500 11 <0.061 <0.054
7/16/2013 3,600 1,000 130 4,730 ‐‐ 870 19 47 140 100 600 14 <0.061 <0.054
8/16/2013 3,800 5,900 530 10,230 ‐‐ 1,400 13 32 85 77 550 27 <0.061 <0.054
9/24/2013 5,800 12,000 550 18,350 ‐‐ 990 53 400 630 78 440 20 <0.061 <0.054
10/15/2013 3,300 650 120 4,070 ‐‐ 1,400 11 37 150 43 250 15 <0.061 <0.054
11/12/2013 5,600 3,500 190 9,290 ‐‐ 570 99 230 660 89 550 20 <0.061 <0.054
12/13/2013 12,500 14,000 400 26,900 ‐‐ 560 170 690 1,500 52 220 17 <0.061 <0.054
EN1014151027SCO Page 4 of 5
TPH‐g TPH‐d TPH‐o TPH‐total TPH‐fp Benzene Ethylbenzene Toluene Xylenes MTBE TBA DIPE ETBE TAME
(µg/L) (µg/L) (µg/L) (µg/L) (µg/L) (µg/L) (µg/L) (µg/L) (µg/L) (µg/L) (µg/L) (µg/L) (µg/L) (µg/L)
Table 6. Extracted Groundwater Analytical Resultsa
SFPP Norwalk Pump Station, Norwalk, California
Date
Sampled
EPA 8015M EPA 8260B Volatile Organic Compounds (VOCs)b
1/17/2014 5,900 980 130 7,010 ‐‐ 4,200 13 18 61 89 810 40 <0.061 <0.054
2/11/2014 12,000 63,000 2,500 77,500 ‐‐ 640 130 560 1,990 45 290 12 <0.061 <0.054
3/21/2014 42,000 77,000 2,000 121,000 ‐‐ 3,700 440 3,300 3,900 100 360 17 <0.061 <0.054
4/21/2014 100,000 30,000 880 130,000 ‐‐ 6,000 1,300 9,800 9,000 <0.098 <1.0 12 <0.061 <0.054
5/20/2014 33,000 15,000 470 48,000 ‐‐ 1,400 570 2,700 5,400 30 <0.40 16 <0.061 <0.054
6/13/2014 77,000 33,000 1,100 110,000 ‐‐ 7,700 1,900 10,000 13,000 38 <0.40 12 <0.061 <0.054
7/12/2014 28,000 82 <52 28,082 ‐‐ 2,800 820 3,700 6,800 34 <0.40 18J <25 <25
1/15/2015 8,000 5,600 270 13,870 ‐‐ 2,200 22 140 430 21 390 11 <0.12 <0.11
2/20/2015 120,000 47,000 1,500 170,000 ‐‐ 3,000 350 1,600 3,000 43 <0.80 17 <0.12 <0.11
3/3/2015 65,000 480,000 15,000 560,000 ‐‐ 6,600 1,700 9,300 12,000 670 <0.80 11 <0.12 <0.11
4/7/2015 105,000 92,000 2,900 200,000 ‐‐ 9,000 2,100 18,000 13,000 1,200 <0.80 8.7 <0.12 17
5/19/2015 73,000 90,000 2,400 165,400 ‐‐ 8,200 1,600 17,000 12,000 380 <0.60 25 <0.078 <0.078
6/2/2015 78,000 89,000 3,100 170,100 ‐‐ 3,200 530 3,700 7,100 1,100 <0.60 13 <0.078 8.3
7/30/2015 31,000 16,000 570 47,570 ‐‐ 3,100 720 5,100 6,200 820 <0.60 27 <0.078 6.2
8/6/2015 30,000 17,000 570 37,570 2,600 500 3,100 6,200 700 <0.60 16 <0.078 6.4
9/15/2015 50,000 79,000 2,700 129,000 3,200 1,800 6,500 14,000 820 <0.60 15 <0.078 7.7
Notes:a Influent samples were collected from the manifold conveying groundwater extracted from the south‐central and southeastern areas.b Other detected VOCs are included in the laboratory analytical reports in Appendix A.c TPH‐fp result from extracted groundwater sample collected on July 10, 2008.d July 27, 2011, sample and samples after July 20, 2012, were analyzed for TPH‐g, TPH‐d, and TPH‐o.
‐‐ = not analyzed
<500 = Not detected at or above the laboratory reporting limit (RL) shown
µg/L = micrograms per liter
DIPE = di‐isopropyl ether
ETBE = ethyl tertiary butyl ether
J = Analyte was detected above the laboratory method detection limit and below the laboratory RL
MTBE = methyl tertiary butyl ether
TAME = tertiary amyl methyl ether
TBA = tertiary butyl alcohol
TPH‐d = total petroleum hydrocarbons quantified as diesel (C13‐C22)
TPH‐fp = total petroleum hydrocarbons quantified as fuel product (C7‐C28)
TPH‐g = total petroleum hydrocarbons quantified as gasoline (C4‐C12)
TPH‐o = total petroleum hydrocarbons quantified as oil (C23‐C36)
TPH‐total = total petroleum hydrocarbons quantified as gasoline, diesel, and oil (C4‐C36)
The GWTS was down between July 29, 2014 and December 1, 2014 to facilitate processing of the modifications to SCAQMD Permit No. F14166 for the GWTS.
EN1014151027SCO Page 5 of 5
(feet msl) (feet btoc) (feet btoc) (feet) (feet msl)GMW-9 8/8/2008 74.44 28.01 27.96 0.05 46.47 Envent
10/16/2008 74.44 28.36 28.35 0.01 46.09 Envent12/17/2008 74.44 27.61 --- --- 46.83 Envent1/15/2009 74.44 28.91 --- --- 45.53 Envent3/27/2009 74.44 29.04 --- --- 45.40 Envent4/21/2009 74.44 28.16 --- --- 46.28 Envent7/21/2009 74.44 28.31 --- --- 46.13 Envent5/24/2010 74.44 30.47 --- --- 43.97 Blaine Tech5/28/2010 74.44 30.35 --- --- 44.09 Blaine Tech10/4/2010 74.44 30.30 --- --- 44.14 Blaine Tech1/10/2011 74.44 32.02 --- --- 42.42 Blaine Tech4/11/2011 74.44 25.41 --- --- 49.03 Blaine Tech10/10/2011 74.44 28.91 --- --- 45.53 Blaine Tech4/16/2012 77.16 31.15 --- --- 46.01 Blaine Tech10/15/2012 77.16 31.82 --- --- 45.34 Blaine Tech1/14/2013 77.16 31.88 --- --- 45.28 Blaine Tech4/8/2013 77.16 31.83 --- --- 45.33 Blaine Tech10/7/2013 77.16 35.30 31.25 4.05 45.02 Blaine Tech4/14/2014 77.16 37.66 31.65 6.01 44.19 Blaine Tech5/5/2014 77.16 37.81 31.76 6.05 44.07 Nieto & Sons
5/12/2014 77.16 37.39 31.83 5.56 44.11 Nieto & Sons5/20/2014 77.16 37.70 33.85 3.85 42.46 Nieto & Sons5/27/2014 77.16 32.41 28.84 3.57 47.53 Nieto & Sons6/4/2014 77.16 33.20 --- --- 43.96 Nieto & Sons
6/10/2014 77.16 37.51 32.77 4.74 43.35 Nieto & Sons7/3/2014 77.16 39.26 32.59 6.67 43.10 Nieto & Sons7/8/2014 77.16 38.59 32.45 6.14 43.36 Blaine Tech
7/18/2014 77.16 37.15 32.73 4.42 43.46 Blaine Tech7/24/2014 77.16 37.78 32.48 5.30 43.51 Blaine Tech8/1/2014 77.16 36.72 32.30 4.42 43.89 Blaine Tech8/8/2014 77.16 36.55 32.26 4.29 43.96 Blaine Tech
8/13/2014 77.16 36.25 32.33 3.92 43.97 Blaine Tech8/19/2014 77.16 36.04 32.38 3.66 43.97 Blaine Tech8/29/2014 77.16 36.23 32.33 3.90 43.97 Blaine Tech9/5/2014 77.16 36.26 32.35 3.91 43.95 Blaine Tech
9/11/2014 77.16 36.27 32.33 3.94 43.96 Blaine Tech9/18/2014 77.16 36.42 32.37 4.05 43.90 Blaine Tech9/26/2014 77.16 36.39 32.35 4.04 43.92 Blaine Tech10/1/2014 77.16 36.11 32.42 3.69 43.93 Blaine Tech10/6/2014 77.16 35.99 32.42 3.57 43.95 Blaine Tech10/14/2014 77.16 36.24 32.34 3.90 43.96 Blaine Tech10/23/2014 77.16 36.32 32.35 3.97 43.94 Blaine Tech10/27/2014 77.16 36.04 32.42 3.62 43.94 Blaine Tech11/3/2014 77.16 36.40 32.35 4.05 43.92 Blaine Tech11/10/2014 77.16 36.32 32.41 3.91 43.89 Blaine Tech11/18/2014 77.16 36.28 32.43 3.85 43.88 Blaine Tech11/25/2014 77.16 36.21 32.49 3.72 43.85 Blaine Tech12/3/2014 77.16 36.18 32.43 3.75 43.91 Blaine Tech12/12/2014 77.16 36.58 32.74 3.84 43.58 Blaine Tech12/19/2014 77.16 37.05 32.76 4.29 43.46 Blaine Tech3/6/2015 77.16 39.40 33.13 6.27 42.65 KMEP
4/20/2015 77.16 36.98 32.99 3.99 43.29 Blaine TechGMW-10 04/30/2007 74.67 --- 25.90 --- --- Secor
11/12/2007 74.67 25.02 25.82 0.83 50.33 Secor04/14/2008 74.67 25.38 25.44 0.06 49.34 Secor10/13/2008 74.67 24.16 --- --- 50.51 Stantec4/20/2009 74.67 24.46 --- --- 50.21 Blaine Tech
10/19/2009 74.67 27.20 --- --- 47.47 Blaine Tech5/24/2010 74.67 26.72 --- --- 47.95 Blaine Tech5/28/2010 74.67 26.70 --- --- 47.97 Blaine Tech10/4/2010 74.67 27.15 --- --- 47.52 Blaine Tech
Gauged By
Table 7. Groundwater and Product Measurements and Elevations for Total Fluids, Groundwater, and Soil Vapor Extraction WellsSFPP Norwalk Pump Station, Norwalk, California
Well IDDate
Gauged
Top of Well Casing
Elevation
Measured Depth to
Groundwater
Measured Depth to Product
Apparent Product
Thickness
Corrected Groundwater
Elevation
EN1014151027SCO Page 1 of 23
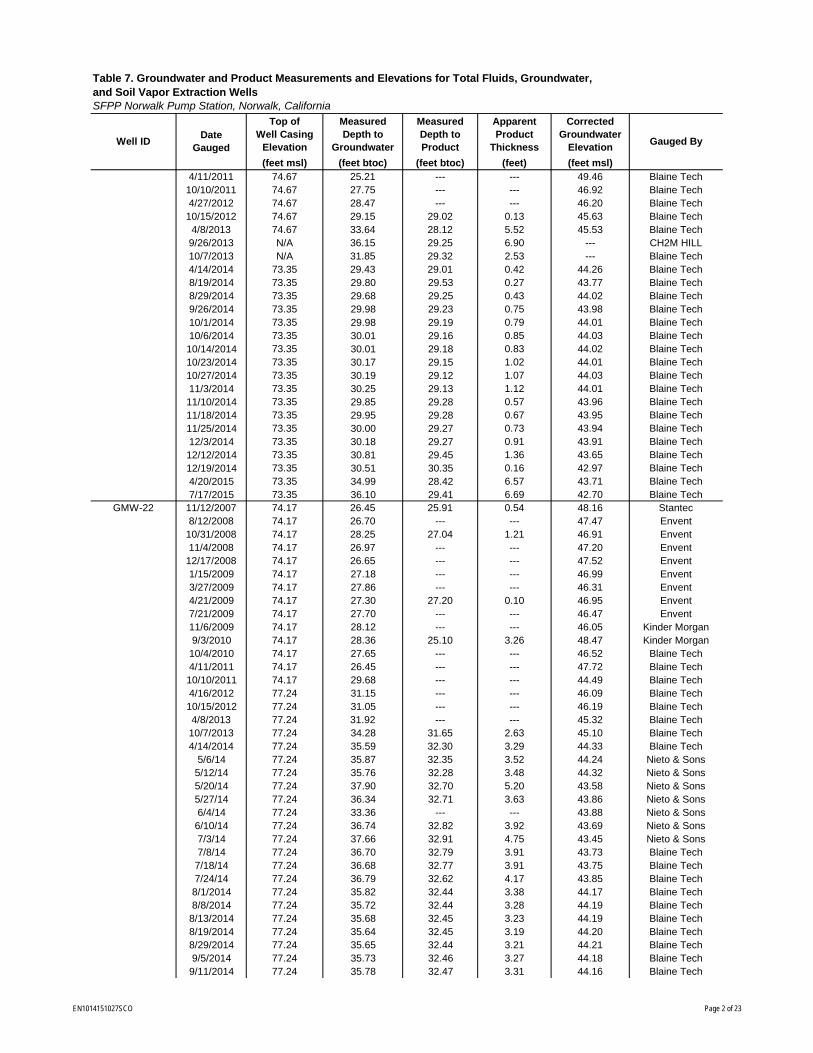
(feet msl) (feet btoc) (feet btoc) (feet) (feet msl)
Gauged By
Table 7. Groundwater and Product Measurements and Elevations for Total Fluids, Groundwater, and Soil Vapor Extraction WellsSFPP Norwalk Pump Station, Norwalk, California
Well IDDate
Gauged
Top of Well Casing
Elevation
Measured Depth to
Groundwater
Measured Depth to Product
Apparent Product
Thickness
Corrected Groundwater
Elevation
4/11/2011 74.67 25.21 --- --- 49.46 Blaine Tech10/10/2011 74.67 27.75 --- --- 46.92 Blaine Tech4/27/2012 74.67 28.47 --- --- 46.20 Blaine Tech
10/15/2012 74.67 29.15 29.02 0.13 45.63 Blaine Tech4/8/2013 74.67 33.64 28.12 5.52 45.53 Blaine Tech9/26/2013 N/A 36.15 29.25 6.90 --- CH2M HILL10/7/2013 N/A 31.85 29.32 2.53 --- Blaine Tech4/14/2014 73.35 29.43 29.01 0.42 44.26 Blaine Tech8/19/2014 73.35 29.80 29.53 0.27 43.77 Blaine Tech8/29/2014 73.35 29.68 29.25 0.43 44.02 Blaine Tech9/26/2014 73.35 29.98 29.23 0.75 43.98 Blaine Tech10/1/2014 73.35 29.98 29.19 0.79 44.01 Blaine Tech10/6/2014 73.35 30.01 29.16 0.85 44.03 Blaine Tech10/14/2014 73.35 30.01 29.18 0.83 44.02 Blaine Tech10/23/2014 73.35 30.17 29.15 1.02 44.01 Blaine Tech10/27/2014 73.35 30.19 29.12 1.07 44.03 Blaine Tech11/3/2014 73.35 30.25 29.13 1.12 44.01 Blaine Tech11/10/2014 73.35 29.85 29.28 0.57 43.96 Blaine Tech11/18/2014 73.35 29.95 29.28 0.67 43.95 Blaine Tech11/25/2014 73.35 30.00 29.27 0.73 43.94 Blaine Tech12/3/2014 73.35 30.18 29.27 0.91 43.91 Blaine Tech12/12/2014 73.35 30.81 29.45 1.36 43.65 Blaine Tech12/19/2014 73.35 30.51 30.35 0.16 42.97 Blaine Tech4/20/2015 73.35 34.99 28.42 6.57 43.71 Blaine Tech7/17/2015 73.35 36.10 29.41 6.69 42.70 Blaine Tech
GMW-22 11/12/2007 74.17 26.45 25.91 0.54 48.16 Stantec8/12/2008 74.17 26.70 --- --- 47.47 Envent
10/31/2008 74.17 28.25 27.04 1.21 46.91 Envent11/4/2008 74.17 26.97 --- --- 47.20 Envent
12/17/2008 74.17 26.65 --- --- 47.52 Envent1/15/2009 74.17 27.18 --- --- 46.99 Envent3/27/2009 74.17 27.86 --- --- 46.31 Envent4/21/2009 74.17 27.30 27.20 0.10 46.95 Envent7/21/2009 74.17 27.70 --- --- 46.47 Envent11/6/2009 74.17 28.12 --- --- 46.05 Kinder Morgan9/3/2010 74.17 28.36 25.10 3.26 48.47 Kinder Morgan
10/4/2010 74.17 27.65 --- --- 46.52 Blaine Tech4/11/2011 74.17 26.45 --- --- 47.72 Blaine Tech10/10/2011 74.17 29.68 --- --- 44.49 Blaine Tech4/16/2012 77.24 31.15 --- --- 46.09 Blaine Tech10/15/2012 77.24 31.05 --- --- 46.19 Blaine Tech4/8/2013 77.24 31.92 --- --- 45.32 Blaine Tech10/7/2013 77.24 34.28 31.65 2.63 45.10 Blaine Tech4/14/2014 77.24 35.59 32.30 3.29 44.33 Blaine Tech
5/6/14 77.24 35.87 32.35 3.52 44.24 Nieto & Sons5/12/14 77.24 35.76 32.28 3.48 44.32 Nieto & Sons5/20/14 77.24 37.90 32.70 5.20 43.58 Nieto & Sons5/27/14 77.24 36.34 32.71 3.63 43.86 Nieto & Sons6/4/14 77.24 33.36 --- --- 43.88 Nieto & Sons
6/10/14 77.24 36.74 32.82 3.92 43.69 Nieto & Sons7/3/14 77.24 37.66 32.91 4.75 43.45 Nieto & Sons7/8/14 77.24 36.70 32.79 3.91 43.73 Blaine Tech
7/18/14 77.24 36.68 32.77 3.91 43.75 Blaine Tech7/24/14 77.24 36.79 32.62 4.17 43.85 Blaine Tech8/1/2014 77.24 35.82 32.44 3.38 44.17 Blaine Tech8/8/2014 77.24 35.72 32.44 3.28 44.19 Blaine Tech
8/13/2014 77.24 35.68 32.45 3.23 44.19 Blaine Tech8/19/2014 77.24 35.64 32.45 3.19 44.20 Blaine Tech8/29/2014 77.24 35.65 32.44 3.21 44.21 Blaine Tech9/5/2014 77.24 35.73 32.46 3.27 44.18 Blaine Tech
9/11/2014 77.24 35.78 32.47 3.31 44.16 Blaine Tech
EN1014151027SCO Page 2 of 23
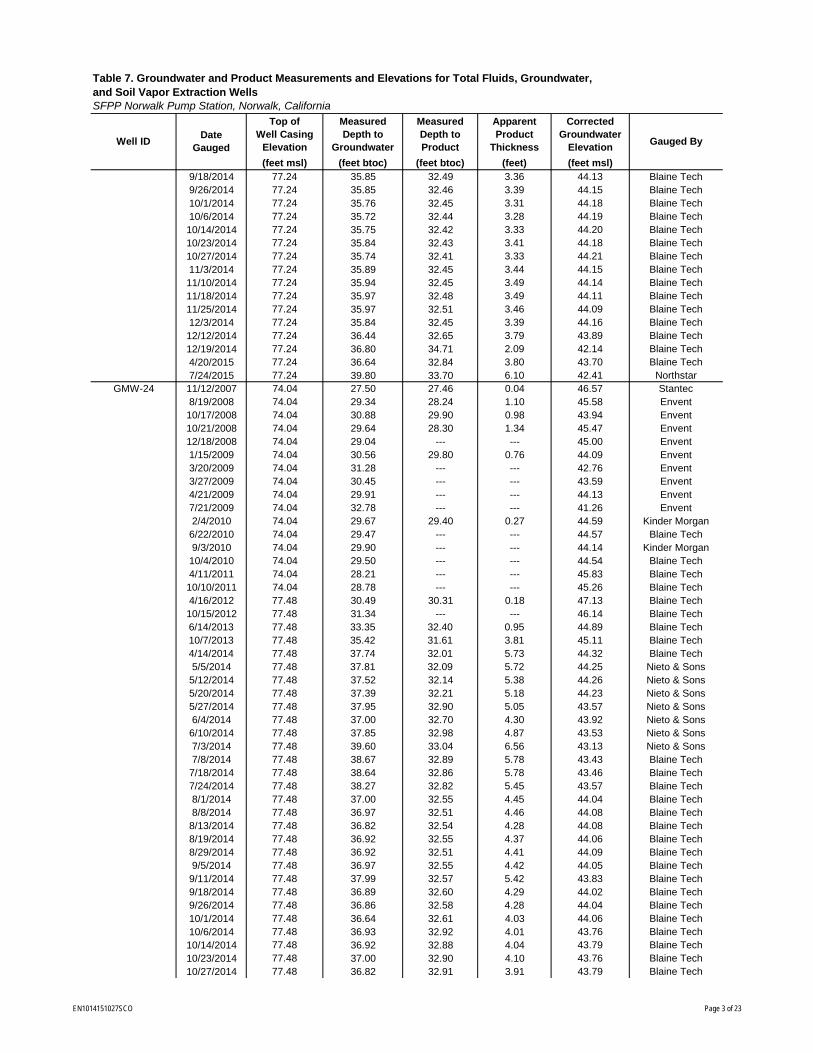
(feet msl) (feet btoc) (feet btoc) (feet) (feet msl)
Gauged By
Table 7. Groundwater and Product Measurements and Elevations for Total Fluids, Groundwater, and Soil Vapor Extraction WellsSFPP Norwalk Pump Station, Norwalk, California
Well IDDate
Gauged
Top of Well Casing
Elevation
Measured Depth to
Groundwater
Measured Depth to Product
Apparent Product
Thickness
Corrected Groundwater
Elevation
9/18/2014 77.24 35.85 32.49 3.36 44.13 Blaine Tech9/26/2014 77.24 35.85 32.46 3.39 44.15 Blaine Tech10/1/2014 77.24 35.76 32.45 3.31 44.18 Blaine Tech10/6/2014 77.24 35.72 32.44 3.28 44.19 Blaine Tech10/14/2014 77.24 35.75 32.42 3.33 44.20 Blaine Tech10/23/2014 77.24 35.84 32.43 3.41 44.18 Blaine Tech10/27/2014 77.24 35.74 32.41 3.33 44.21 Blaine Tech11/3/2014 77.24 35.89 32.45 3.44 44.15 Blaine Tech11/10/2014 77.24 35.94 32.45 3.49 44.14 Blaine Tech11/18/2014 77.24 35.97 32.48 3.49 44.11 Blaine Tech11/25/2014 77.24 35.97 32.51 3.46 44.09 Blaine Tech12/3/2014 77.24 35.84 32.45 3.39 44.16 Blaine Tech12/12/2014 77.24 36.44 32.65 3.79 43.89 Blaine Tech12/19/2014 77.24 36.80 34.71 2.09 42.14 Blaine Tech4/20/2015 77.24 36.64 32.84 3.80 43.70 Blaine Tech7/24/2015 77.24 39.80 33.70 6.10 42.41 Northstar
GMW-24 11/12/2007 74.04 27.50 27.46 0.04 46.57 Stantec8/19/2008 74.04 29.34 28.24 1.10 45.58 Envent10/17/2008 74.04 30.88 29.90 0.98 43.94 Envent10/21/2008 74.04 29.64 28.30 1.34 45.47 Envent12/18/2008 74.04 29.04 --- --- 45.00 Envent1/15/2009 74.04 30.56 29.80 0.76 44.09 Envent3/20/2009 74.04 31.28 --- --- 42.76 Envent3/27/2009 74.04 30.45 --- --- 43.59 Envent4/21/2009 74.04 29.91 --- --- 44.13 Envent7/21/2009 74.04 32.78 --- --- 41.26 Envent2/4/2010 74.04 29.67 29.40 0.27 44.59 Kinder Morgan
6/22/2010 74.04 29.47 --- --- 44.57 Blaine Tech9/3/2010 74.04 29.90 --- --- 44.14 Kinder Morgan
10/4/2010 74.04 29.50 --- --- 44.54 Blaine Tech4/11/2011 74.04 28.21 --- --- 45.83 Blaine Tech10/10/2011 74.04 28.78 --- --- 45.26 Blaine Tech4/16/2012 77.48 30.49 30.31 0.18 47.13 Blaine Tech10/15/2012 77.48 31.34 --- --- 46.14 Blaine Tech6/14/2013 77.48 33.35 32.40 0.95 44.89 Blaine Tech10/7/2013 77.48 35.42 31.61 3.81 45.11 Blaine Tech4/14/2014 77.48 37.74 32.01 5.73 44.32 Blaine Tech5/5/2014 77.48 37.81 32.09 5.72 44.25 Nieto & Sons
5/12/2014 77.48 37.52 32.14 5.38 44.26 Nieto & Sons5/20/2014 77.48 37.39 32.21 5.18 44.23 Nieto & Sons5/27/2014 77.48 37.95 32.90 5.05 43.57 Nieto & Sons6/4/2014 77.48 37.00 32.70 4.30 43.92 Nieto & Sons
6/10/2014 77.48 37.85 32.98 4.87 43.53 Nieto & Sons7/3/2014 77.48 39.60 33.04 6.56 43.13 Nieto & Sons7/8/2014 77.48 38.67 32.89 5.78 43.43 Blaine Tech
7/18/2014 77.48 38.64 32.86 5.78 43.46 Blaine Tech7/24/2014 77.48 38.27 32.82 5.45 43.57 Blaine Tech8/1/2014 77.48 37.00 32.55 4.45 44.04 Blaine Tech8/8/2014 77.48 36.97 32.51 4.46 44.08 Blaine Tech
8/13/2014 77.48 36.82 32.54 4.28 44.08 Blaine Tech8/19/2014 77.48 36.92 32.55 4.37 44.06 Blaine Tech8/29/2014 77.48 36.92 32.51 4.41 44.09 Blaine Tech9/5/2014 77.48 36.97 32.55 4.42 44.05 Blaine Tech
9/11/2014 77.48 37.99 32.57 5.42 43.83 Blaine Tech9/18/2014 77.48 36.89 32.60 4.29 44.02 Blaine Tech9/26/2014 77.48 36.86 32.58 4.28 44.04 Blaine Tech10/1/2014 77.48 36.64 32.61 4.03 44.06 Blaine Tech10/6/2014 77.48 36.93 32.92 4.01 43.76 Blaine Tech10/14/2014 77.48 36.92 32.88 4.04 43.79 Blaine Tech10/23/2014 77.48 37.00 32.90 4.10 43.76 Blaine Tech10/27/2014 77.48 36.82 32.91 3.91 43.79 Blaine Tech
EN1014151027SCO Page 3 of 23
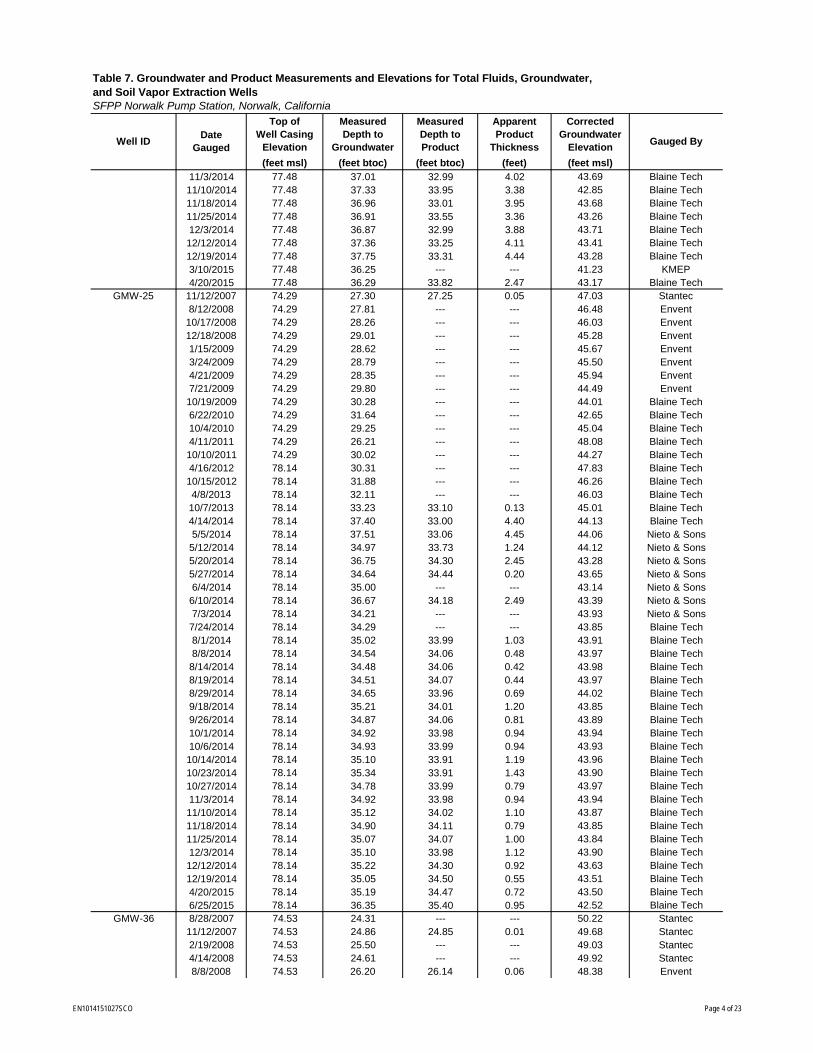
(feet msl) (feet btoc) (feet btoc) (feet) (feet msl)
Gauged By
Table 7. Groundwater and Product Measurements and Elevations for Total Fluids, Groundwater, and Soil Vapor Extraction WellsSFPP Norwalk Pump Station, Norwalk, California
Well IDDate
Gauged
Top of Well Casing
Elevation
Measured Depth to
Groundwater
Measured Depth to Product
Apparent Product
Thickness
Corrected Groundwater
Elevation
11/3/2014 77.48 37.01 32.99 4.02 43.69 Blaine Tech11/10/2014 77.48 37.33 33.95 3.38 42.85 Blaine Tech11/18/2014 77.48 36.96 33.01 3.95 43.68 Blaine Tech11/25/2014 77.48 36.91 33.55 3.36 43.26 Blaine Tech12/3/2014 77.48 36.87 32.99 3.88 43.71 Blaine Tech12/12/2014 77.48 37.36 33.25 4.11 43.41 Blaine Tech12/19/2014 77.48 37.75 33.31 4.44 43.28 Blaine Tech3/10/2015 77.48 36.25 --- --- 41.23 KMEP4/20/2015 77.48 36.29 33.82 2.47 43.17 Blaine Tech
GMW-25 11/12/2007 74.29 27.30 27.25 0.05 47.03 Stantec8/12/2008 74.29 27.81 --- --- 46.48 Envent
10/17/2008 74.29 28.26 --- --- 46.03 Envent12/18/2008 74.29 29.01 --- --- 45.28 Envent1/15/2009 74.29 28.62 --- --- 45.67 Envent3/24/2009 74.29 28.79 --- --- 45.50 Envent4/21/2009 74.29 28.35 --- --- 45.94 Envent7/21/2009 74.29 29.80 --- --- 44.49 Envent10/19/2009 74.29 30.28 --- --- 44.01 Blaine Tech6/22/2010 74.29 31.64 --- --- 42.65 Blaine Tech10/4/2010 74.29 29.25 --- --- 45.04 Blaine Tech4/11/2011 74.29 26.21 --- --- 48.08 Blaine Tech10/10/2011 74.29 30.02 --- --- 44.27 Blaine Tech4/16/2012 78.14 30.31 --- --- 47.83 Blaine Tech10/15/2012 78.14 31.88 --- --- 46.26 Blaine Tech4/8/2013 78.14 32.11 --- --- 46.03 Blaine Tech10/7/2013 78.14 33.23 33.10 0.13 45.01 Blaine Tech4/14/2014 78.14 37.40 33.00 4.40 44.13 Blaine Tech5/5/2014 78.14 37.51 33.06 4.45 44.06 Nieto & Sons
5/12/2014 78.14 34.97 33.73 1.24 44.12 Nieto & Sons5/20/2014 78.14 36.75 34.30 2.45 43.28 Nieto & Sons5/27/2014 78.14 34.64 34.44 0.20 43.65 Nieto & Sons6/4/2014 78.14 35.00 --- --- 43.14 Nieto & Sons
6/10/2014 78.14 36.67 34.18 2.49 43.39 Nieto & Sons7/3/2014 78.14 34.21 --- --- 43.93 Nieto & Sons
7/24/2014 78.14 34.29 --- --- 43.85 Blaine Tech8/1/2014 78.14 35.02 33.99 1.03 43.91 Blaine Tech8/8/2014 78.14 34.54 34.06 0.48 43.97 Blaine Tech
8/14/2014 78.14 34.48 34.06 0.42 43.98 Blaine Tech8/19/2014 78.14 34.51 34.07 0.44 43.97 Blaine Tech8/29/2014 78.14 34.65 33.96 0.69 44.02 Blaine Tech9/18/2014 78.14 35.21 34.01 1.20 43.85 Blaine Tech9/26/2014 78.14 34.87 34.06 0.81 43.89 Blaine Tech10/1/2014 78.14 34.92 33.98 0.94 43.94 Blaine Tech10/6/2014 78.14 34.93 33.99 0.94 43.93 Blaine Tech10/14/2014 78.14 35.10 33.91 1.19 43.96 Blaine Tech10/23/2014 78.14 35.34 33.91 1.43 43.90 Blaine Tech10/27/2014 78.14 34.78 33.99 0.79 43.97 Blaine Tech11/3/2014 78.14 34.92 33.98 0.94 43.94 Blaine Tech11/10/2014 78.14 35.12 34.02 1.10 43.87 Blaine Tech11/18/2014 78.14 34.90 34.11 0.79 43.85 Blaine Tech11/25/2014 78.14 35.07 34.07 1.00 43.84 Blaine Tech12/3/2014 78.14 35.10 33.98 1.12 43.90 Blaine Tech12/12/2014 78.14 35.22 34.30 0.92 43.63 Blaine Tech12/19/2014 78.14 35.05 34.50 0.55 43.51 Blaine Tech4/20/2015 78.14 35.19 34.47 0.72 43.50 Blaine Tech6/25/2015 78.14 36.35 35.40 0.95 42.52 Blaine Tech
GMW-36 8/28/2007 74.53 24.31 --- --- 50.22 Stantec11/12/2007 74.53 24.86 24.85 0.01 49.68 Stantec2/19/2008 74.53 25.50 --- --- 49.03 Stantec4/14/2008 74.53 24.61 --- --- 49.92 Stantec8/8/2008 74.53 26.20 26.14 0.06 48.38 Envent
EN1014151027SCO Page 4 of 23
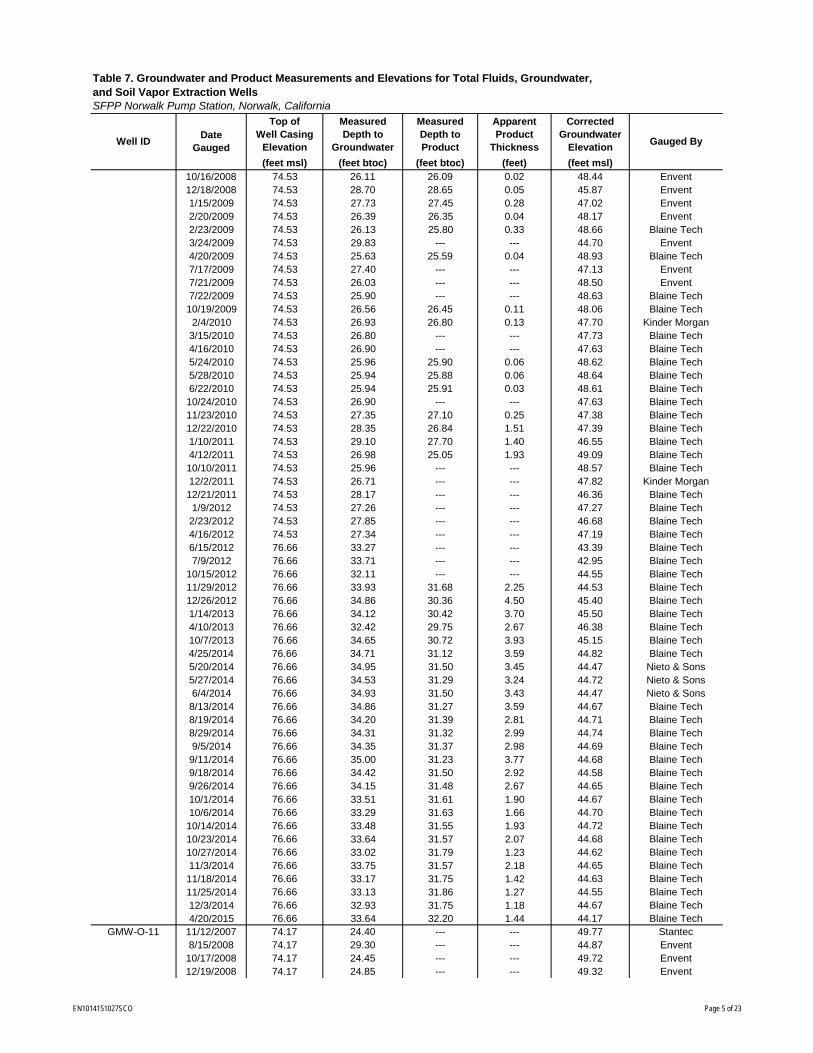
(feet msl) (feet btoc) (feet btoc) (feet) (feet msl)
Gauged By
Table 7. Groundwater and Product Measurements and Elevations for Total Fluids, Groundwater, and Soil Vapor Extraction WellsSFPP Norwalk Pump Station, Norwalk, California
Well IDDate
Gauged
Top of Well Casing
Elevation
Measured Depth to
Groundwater
Measured Depth to Product
Apparent Product
Thickness
Corrected Groundwater
Elevation
10/16/2008 74.53 26.11 26.09 0.02 48.44 Envent12/18/2008 74.53 28.70 28.65 0.05 45.87 Envent1/15/2009 74.53 27.73 27.45 0.28 47.02 Envent2/20/2009 74.53 26.39 26.35 0.04 48.17 Envent2/23/2009 74.53 26.13 25.80 0.33 48.66 Blaine Tech3/24/2009 74.53 29.83 --- --- 44.70 Envent4/20/2009 74.53 25.63 25.59 0.04 48.93 Blaine Tech7/17/2009 74.53 27.40 --- --- 47.13 Envent7/21/2009 74.53 26.03 --- --- 48.50 Envent7/22/2009 74.53 25.90 --- --- 48.63 Blaine Tech10/19/2009 74.53 26.56 26.45 0.11 48.06 Blaine Tech2/4/2010 74.53 26.93 26.80 0.13 47.70 Kinder Morgan
3/15/2010 74.53 26.80 --- --- 47.73 Blaine Tech4/16/2010 74.53 26.90 --- --- 47.63 Blaine Tech5/24/2010 74.53 25.96 25.90 0.06 48.62 Blaine Tech5/28/2010 74.53 25.94 25.88 0.06 48.64 Blaine Tech6/22/2010 74.53 25.94 25.91 0.03 48.61 Blaine Tech10/24/2010 74.53 26.90 --- --- 47.63 Blaine Tech11/23/2010 74.53 27.35 27.10 0.25 47.38 Blaine Tech12/22/2010 74.53 28.35 26.84 1.51 47.39 Blaine Tech1/10/2011 74.53 29.10 27.70 1.40 46.55 Blaine Tech4/12/2011 74.53 26.98 25.05 1.93 49.09 Blaine Tech10/10/2011 74.53 25.96 --- --- 48.57 Blaine Tech12/2/2011 74.53 26.71 --- --- 47.82 Kinder Morgan12/21/2011 74.53 28.17 --- --- 46.36 Blaine Tech1/9/2012 74.53 27.26 --- --- 47.27 Blaine Tech
2/23/2012 74.53 27.85 --- --- 46.68 Blaine Tech4/16/2012 74.53 27.34 --- --- 47.19 Blaine Tech6/15/2012 76.66 33.27 --- --- 43.39 Blaine Tech7/9/2012 76.66 33.71 --- --- 42.95 Blaine Tech
10/15/2012 76.66 32.11 --- --- 44.55 Blaine Tech11/29/2012 76.66 33.93 31.68 2.25 44.53 Blaine Tech12/26/2012 76.66 34.86 30.36 4.50 45.40 Blaine Tech1/14/2013 76.66 34.12 30.42 3.70 45.50 Blaine Tech4/10/2013 76.66 32.42 29.75 2.67 46.38 Blaine Tech10/7/2013 76.66 34.65 30.72 3.93 45.15 Blaine Tech4/25/2014 76.66 34.71 31.12 3.59 44.82 Blaine Tech5/20/2014 76.66 34.95 31.50 3.45 44.47 Nieto & Sons5/27/2014 76.66 34.53 31.29 3.24 44.72 Nieto & Sons6/4/2014 76.66 34.93 31.50 3.43 44.47 Nieto & Sons
8/13/2014 76.66 34.86 31.27 3.59 44.67 Blaine Tech8/19/2014 76.66 34.20 31.39 2.81 44.71 Blaine Tech8/29/2014 76.66 34.31 31.32 2.99 44.74 Blaine Tech9/5/2014 76.66 34.35 31.37 2.98 44.69 Blaine Tech
9/11/2014 76.66 35.00 31.23 3.77 44.68 Blaine Tech9/18/2014 76.66 34.42 31.50 2.92 44.58 Blaine Tech9/26/2014 76.66 34.15 31.48 2.67 44.65 Blaine Tech10/1/2014 76.66 33.51 31.61 1.90 44.67 Blaine Tech10/6/2014 76.66 33.29 31.63 1.66 44.70 Blaine Tech10/14/2014 76.66 33.48 31.55 1.93 44.72 Blaine Tech10/23/2014 76.66 33.64 31.57 2.07 44.68 Blaine Tech10/27/2014 76.66 33.02 31.79 1.23 44.62 Blaine Tech11/3/2014 76.66 33.75 31.57 2.18 44.65 Blaine Tech11/18/2014 76.66 33.17 31.75 1.42 44.63 Blaine Tech11/25/2014 76.66 33.13 31.86 1.27 44.55 Blaine Tech12/3/2014 76.66 32.93 31.75 1.18 44.67 Blaine Tech4/20/2015 76.66 33.64 32.20 1.44 44.17 Blaine Tech
GMW-O-11 11/12/2007 74.17 24.40 --- --- 49.77 Stantec8/15/2008 74.17 29.30 --- --- 44.87 Envent
10/17/2008 74.17 24.45 --- --- 49.72 Envent12/19/2008 74.17 24.85 --- --- 49.32 Envent
EN1014151027SCO Page 5 of 23

(feet msl) (feet btoc) (feet btoc) (feet) (feet msl)
Gauged By
Table 7. Groundwater and Product Measurements and Elevations for Total Fluids, Groundwater, and Soil Vapor Extraction WellsSFPP Norwalk Pump Station, Norwalk, California
Well IDDate
Gauged
Top of Well Casing
Elevation
Measured Depth to
Groundwater
Measured Depth to Product
Apparent Product
Thickness
Corrected Groundwater
Elevation
1/15/2009 74.17 26.87 24.38 2.49 49.29 Envent2/24/2009 74.17 24.31 24.21 0.10 49.94 Envent3/27/2009 74.17 31.08 --- --- 43.09 Envent4/21/2009 74.17 25.36 25.34 0.02 48.83 Envent7/21/2009 74.17 26.18 --- --- 47.99 Envent11/6/2009 74.17 26.33 26.18 0.15 47.96 Kinder Morgan10/4/2010 74.17 30.00 --- --- 44.17 Blaine Tech4/13/2011 74.17 24.19 --- --- 49.98 Blaine Tech10/10/2011 74.17 24.38 --- --- 49.79 Blaine Tech10/15/2012 74.17 28.12 --- --- 46.05 Blaine Tech9/24/2013 74.17 31.25 28.15 3.10 45.40 CH2M HILL10/7/2013 74.17 31.19 27.69 3.50 45.78 Blaine Tech4/25/2014 74.17 28.96 28.62 0.34 45.48 Blaine Tech9/5/2014 74.17 31.13 27.89 3.24 45.63 Blaine Tech
9/11/2014 74.17 31.12 27.85 3.27 45.67 Blaine Tech9/18/2014 74.17 31.22 27.85 3.37 45.65 Blaine Tech9/26/2014 74.17 31.34 27.91 3.43 45.57 Blaine Tech10/1/2014 74.17 31.19 27.84 3.35 45.66 Blaine Tech10/6/2014 74.17 32.19 27.84 4.35 45.46 Blaine Tech10/14/2014 74.17 31.18 28.85 2.33 44.85 Blaine Tech10/23/2014 74.17 31.34 27.85 3.49 45.62 Blaine Tech10/27/2014 74.17 31.28 28.89 2.39 44.80 Blaine Tech11/3/2014 74.17 32.34 27.83 4.51 45.44 Blaine Tech11/10/2014 74.17 31.46 27.97 3.49 45.50 Blaine Tech11/18/2014 74.17 31.41 27.88 3.53 45.58 Blaine Tech11/25/2014 74.17 31.48 27.87 3.61 45.58 Blaine Tech12/3/2014 74.17 33.34 29.95 3.39 43.54 Blaine Tech12/12/2014 74.17 33.25 29.08 4.17 44.26 Blaine Tech12/19/2014 74.17 32.52 28.09 4.43 45.19 Blaine Tech4/22/2015 74.17 31.54 28.10 3.44 45.38 Blaine Tech
GMW-O-12 11/12/2007 73.49 23.13 --- --- 50.36 Stantec4/14/2008 73.49 23.36 --- --- 50.13 Stantec
10/13/2008 73.49 24.20 --- --- 49.29 Stantec4/20/2009 73.49 24.21 --- --- 49.28 Blaine Tech
10/19/2009 73.49 25.08 --- --- 48.41 Blaine Tech5/24/2010 73.49 24.80 --- --- 48.69 Blaine Tech5/28/2010 73.49 24.74 --- --- 48.75 Blaine Tech10/4/2010 73.49 25.31 25.20 0.11 48.27 Blaine Tech1/10/2011 73.49 26.42 26.32 0.10 47.15 Blaine Tech4/11/2011 73.49 24.04 --- --- 49.45 Blaine Tech
10/10/2011 73.49 24.68 --- --- 48.81 Blaine Tech1/9/2012 73.49 25.12 --- --- 48.37 Blaine Tech4/16/2012 73.49 25.40 --- --- 48.09 Blaine Tech7/9/2012 73.49 26.96 --- --- 46.53 Blaine Tech
10/15/2012 73.49 25.48 25.44 0.04 48.04 Blaine Tech4/8/2013 73.49 26.60 26.51 0.09 46.96 Blaine Tech9/24/2013 73.49 27.90 27.74 0.16 45.72 CH2M HILL10/7/2013 73.49 27.34 27.28 0.06 46.20 Blaine Tech4/14/2014 73.49 30.34 26.80 3.54 45.96 Blaine Tech5/6/2014 73.49 30.93 26.74 4.19 45.89 Nieto & Sons
5/12/2014 73.49 30.81 26.82 3.99 45.85 Nieto & Sons5/20/2014 73.49 31.78 27.32 4.46 45.26 Nieto & Sons5/27/2014 73.49 33.04 26.78 6.26 45.43 Nieto & Sons6/4/2014 73.49 33.00 27.75 5.25 44.66 Nieto & Sons
6/10/2014 73.49 34.53 26.81 7.72 45.10 Nieto & Sons7/3/2014 73.49 34.27 26.94 7.33 45.05 Blaine Tech7/8/2014 73.49 33.87 26.87 7.00 45.19 Blaine Tech
7/18/2014 73.49 33.36 27.07 6.29 45.13 Blaine Tech7/24/2014 73.49 33.00 26.98 6.02 45.28 Blaine Tech8/1/2014 73.49 31.80 26.83 4.97 45.64 Blaine Tech8/8/2014 73.49 31.26 26.91 4.35 45.69 Blaine Tech
EN1014151027SCO Page 6 of 23
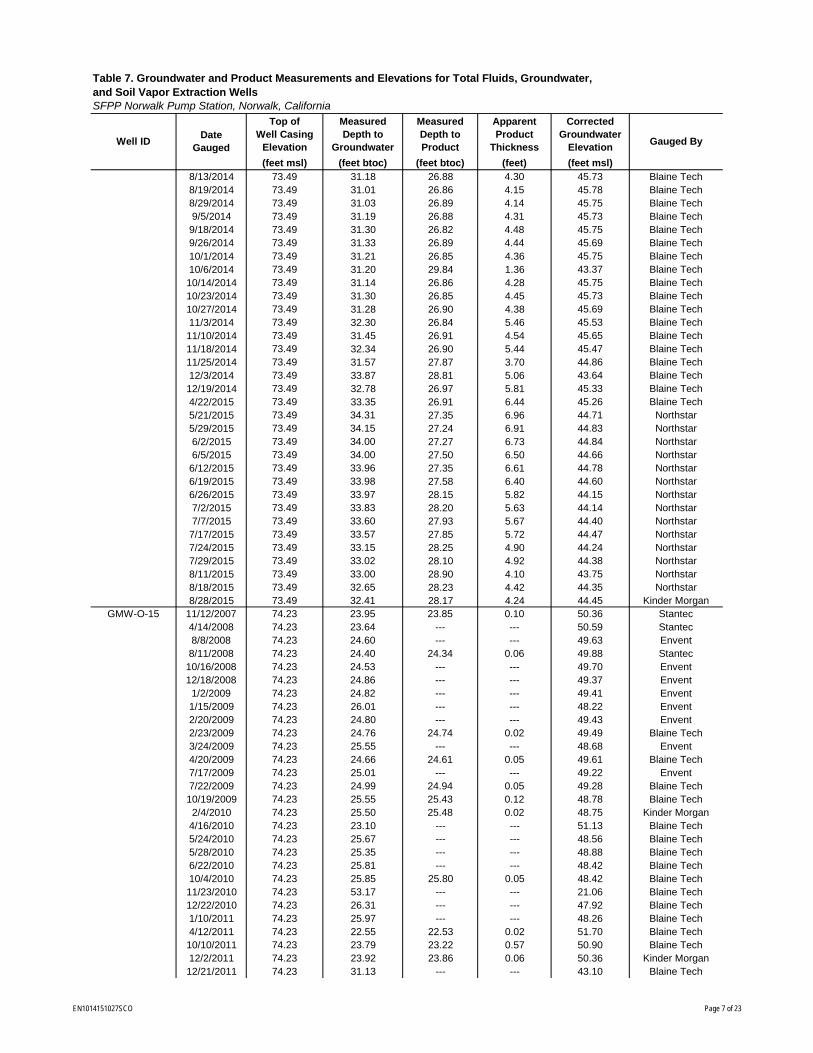
(feet msl) (feet btoc) (feet btoc) (feet) (feet msl)
Gauged By
Table 7. Groundwater and Product Measurements and Elevations for Total Fluids, Groundwater, and Soil Vapor Extraction WellsSFPP Norwalk Pump Station, Norwalk, California
Well IDDate
Gauged
Top of Well Casing
Elevation
Measured Depth to
Groundwater
Measured Depth to Product
Apparent Product
Thickness
Corrected Groundwater
Elevation
8/13/2014 73.49 31.18 26.88 4.30 45.73 Blaine Tech8/19/2014 73.49 31.01 26.86 4.15 45.78 Blaine Tech8/29/2014 73.49 31.03 26.89 4.14 45.75 Blaine Tech9/5/2014 73.49 31.19 26.88 4.31 45.73 Blaine Tech
9/18/2014 73.49 31.30 26.82 4.48 45.75 Blaine Tech9/26/2014 73.49 31.33 26.89 4.44 45.69 Blaine Tech10/1/2014 73.49 31.21 26.85 4.36 45.75 Blaine Tech10/6/2014 73.49 31.20 29.84 1.36 43.37 Blaine Tech10/14/2014 73.49 31.14 26.86 4.28 45.75 Blaine Tech10/23/2014 73.49 31.30 26.85 4.45 45.73 Blaine Tech10/27/2014 73.49 31.28 26.90 4.38 45.69 Blaine Tech11/3/2014 73.49 32.30 26.84 5.46 45.53 Blaine Tech11/10/2014 73.49 31.45 26.91 4.54 45.65 Blaine Tech11/18/2014 73.49 32.34 26.90 5.44 45.47 Blaine Tech11/25/2014 73.49 31.57 27.87 3.70 44.86 Blaine Tech12/3/2014 73.49 33.87 28.81 5.06 43.64 Blaine Tech12/19/2014 73.49 32.78 26.97 5.81 45.33 Blaine Tech4/22/2015 73.49 33.35 26.91 6.44 45.26 Blaine Tech5/21/2015 73.49 34.31 27.35 6.96 44.71 Northstar5/29/2015 73.49 34.15 27.24 6.91 44.83 Northstar6/2/2015 73.49 34.00 27.27 6.73 44.84 Northstar6/5/2015 73.49 34.00 27.50 6.50 44.66 Northstar
6/12/2015 73.49 33.96 27.35 6.61 44.78 Northstar6/19/2015 73.49 33.98 27.58 6.40 44.60 Northstar6/26/2015 73.49 33.97 28.15 5.82 44.15 Northstar7/2/2015 73.49 33.83 28.20 5.63 44.14 Northstar7/7/2015 73.49 33.60 27.93 5.67 44.40 Northstar
7/17/2015 73.49 33.57 27.85 5.72 44.47 Northstar7/24/2015 73.49 33.15 28.25 4.90 44.24 Northstar7/29/2015 73.49 33.02 28.10 4.92 44.38 Northstar8/11/2015 73.49 33.00 28.90 4.10 43.75 Northstar8/18/2015 73.49 32.65 28.23 4.42 44.35 Northstar8/28/2015 73.49 32.41 28.17 4.24 44.45 Kinder Morgan
GMW-O-15 11/12/2007 74.23 23.95 23.85 0.10 50.36 Stantec4/14/2008 74.23 23.64 --- --- 50.59 Stantec8/8/2008 74.23 24.60 --- --- 49.63 Envent8/11/2008 74.23 24.40 24.34 0.06 49.88 Stantec
10/16/2008 74.23 24.53 --- --- 49.70 Envent12/18/2008 74.23 24.86 --- --- 49.37 Envent1/2/2009 74.23 24.82 --- --- 49.41 Envent1/15/2009 74.23 26.01 --- --- 48.22 Envent2/20/2009 74.23 24.80 --- --- 49.43 Envent2/23/2009 74.23 24.76 24.74 0.02 49.49 Blaine Tech3/24/2009 74.23 25.55 --- --- 48.68 Envent4/20/2009 74.23 24.66 24.61 0.05 49.61 Blaine Tech7/17/2009 74.23 25.01 --- --- 49.22 Envent7/22/2009 74.23 24.99 24.94 0.05 49.28 Blaine Tech10/19/2009 74.23 25.55 25.43 0.12 48.78 Blaine Tech2/4/2010 74.23 25.50 25.48 0.02 48.75 Kinder Morgan
4/16/2010 74.23 23.10 --- --- 51.13 Blaine Tech5/24/2010 74.23 25.67 --- --- 48.56 Blaine Tech5/28/2010 74.23 25.35 --- --- 48.88 Blaine Tech6/22/2010 74.23 25.81 --- --- 48.42 Blaine Tech10/4/2010 74.23 25.85 25.80 0.05 48.42 Blaine Tech11/23/2010 74.23 53.17 --- --- 21.06 Blaine Tech12/22/2010 74.23 26.31 --- --- 47.92 Blaine Tech1/10/2011 74.23 25.97 --- --- 48.26 Blaine Tech4/12/2011 74.23 22.55 22.53 0.02 51.70 Blaine Tech10/10/2011 74.23 23.79 23.22 0.57 50.90 Blaine Tech12/2/2011 74.23 23.92 23.86 0.06 50.36 Kinder Morgan12/21/2011 74.23 31.13 --- --- 43.10 Blaine Tech
EN1014151027SCO Page 7 of 23
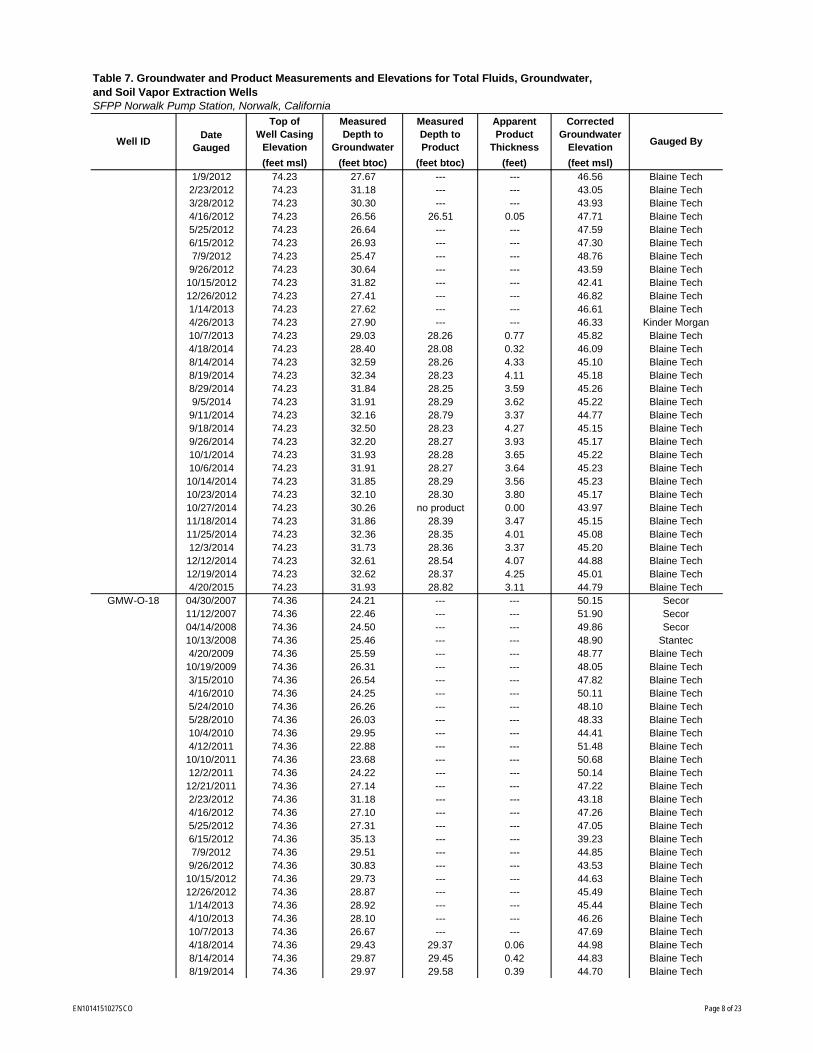
(feet msl) (feet btoc) (feet btoc) (feet) (feet msl)
Gauged By
Table 7. Groundwater and Product Measurements and Elevations for Total Fluids, Groundwater, and Soil Vapor Extraction WellsSFPP Norwalk Pump Station, Norwalk, California
Well IDDate
Gauged
Top of Well Casing
Elevation
Measured Depth to
Groundwater
Measured Depth to Product
Apparent Product
Thickness
Corrected Groundwater
Elevation
1/9/2012 74.23 27.67 --- --- 46.56 Blaine Tech2/23/2012 74.23 31.18 --- --- 43.05 Blaine Tech3/28/2012 74.23 30.30 --- --- 43.93 Blaine Tech4/16/2012 74.23 26.56 26.51 0.05 47.71 Blaine Tech5/25/2012 74.23 26.64 --- --- 47.59 Blaine Tech6/15/2012 74.23 26.93 --- --- 47.30 Blaine Tech7/9/2012 74.23 25.47 --- --- 48.76 Blaine Tech
9/26/2012 74.23 30.64 --- --- 43.59 Blaine Tech10/15/2012 74.23 31.82 --- --- 42.41 Blaine Tech12/26/2012 74.23 27.41 --- --- 46.82 Blaine Tech1/14/2013 74.23 27.62 --- --- 46.61 Blaine Tech4/26/2013 74.23 27.90 --- --- 46.33 Kinder Morgan10/7/2013 74.23 29.03 28.26 0.77 45.82 Blaine Tech4/18/2014 74.23 28.40 28.08 0.32 46.09 Blaine Tech8/14/2014 74.23 32.59 28.26 4.33 45.10 Blaine Tech8/19/2014 74.23 32.34 28.23 4.11 45.18 Blaine Tech8/29/2014 74.23 31.84 28.25 3.59 45.26 Blaine Tech9/5/2014 74.23 31.91 28.29 3.62 45.22 Blaine Tech
9/11/2014 74.23 32.16 28.79 3.37 44.77 Blaine Tech9/18/2014 74.23 32.50 28.23 4.27 45.15 Blaine Tech9/26/2014 74.23 32.20 28.27 3.93 45.17 Blaine Tech10/1/2014 74.23 31.93 28.28 3.65 45.22 Blaine Tech10/6/2014 74.23 31.91 28.27 3.64 45.23 Blaine Tech10/14/2014 74.23 31.85 28.29 3.56 45.23 Blaine Tech10/23/2014 74.23 32.10 28.30 3.80 45.17 Blaine Tech10/27/2014 74.23 30.26 no product 0.00 43.97 Blaine Tech11/18/2014 74.23 31.86 28.39 3.47 45.15 Blaine Tech11/25/2014 74.23 32.36 28.35 4.01 45.08 Blaine Tech12/3/2014 74.23 31.73 28.36 3.37 45.20 Blaine Tech12/12/2014 74.23 32.61 28.54 4.07 44.88 Blaine Tech12/19/2014 74.23 32.62 28.37 4.25 45.01 Blaine Tech4/20/2015 74.23 31.93 28.82 3.11 44.79 Blaine Tech
GMW-O-18 04/30/2007 74.36 24.21 --- --- 50.15 Secor11/12/2007 74.36 22.46 --- --- 51.90 Secor04/14/2008 74.36 24.50 --- --- 49.86 Secor10/13/2008 74.36 25.46 --- --- 48.90 Stantec4/20/2009 74.36 25.59 --- --- 48.77 Blaine Tech
10/19/2009 74.36 26.31 --- --- 48.05 Blaine Tech3/15/2010 74.36 26.54 --- --- 47.82 Blaine Tech4/16/2010 74.36 24.25 --- --- 50.11 Blaine Tech5/24/2010 74.36 26.26 --- --- 48.10 Blaine Tech5/28/2010 74.36 26.03 --- --- 48.33 Blaine Tech10/4/2010 74.36 29.95 --- --- 44.41 Blaine Tech4/12/2011 74.36 22.88 --- --- 51.48 Blaine Tech
10/10/2011 74.36 23.68 --- --- 50.68 Blaine Tech12/2/2011 74.36 24.22 --- --- 50.14 Blaine Tech
12/21/2011 74.36 27.14 --- --- 47.22 Blaine Tech2/23/2012 74.36 31.18 --- --- 43.18 Blaine Tech4/16/2012 74.36 27.10 --- --- 47.26 Blaine Tech5/25/2012 74.36 27.31 --- --- 47.05 Blaine Tech6/15/2012 74.36 35.13 --- --- 39.23 Blaine Tech7/9/2012 74.36 29.51 --- --- 44.85 Blaine Tech9/26/2012 74.36 30.83 --- --- 43.53 Blaine Tech
10/15/2012 74.36 29.73 --- --- 44.63 Blaine Tech12/26/2012 74.36 28.87 --- --- 45.49 Blaine Tech1/14/2013 74.36 28.92 --- --- 45.44 Blaine Tech4/10/2013 74.36 28.10 --- --- 46.26 Blaine Tech10/7/2013 74.36 26.67 --- --- 47.69 Blaine Tech4/18/2014 74.36 29.43 29.37 0.06 44.98 Blaine Tech8/14/2014 74.36 29.87 29.45 0.42 44.83 Blaine Tech8/19/2014 74.36 29.97 29.58 0.39 44.70 Blaine Tech
EN1014151027SCO Page 8 of 23
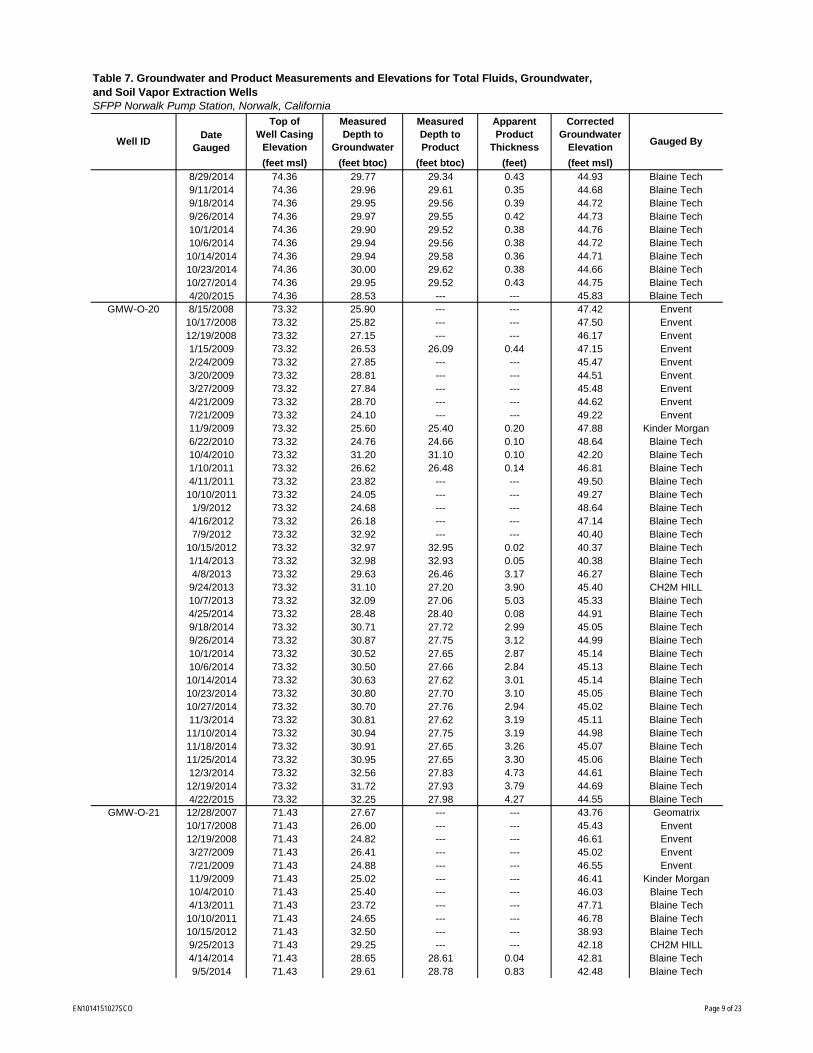
(feet msl) (feet btoc) (feet btoc) (feet) (feet msl)
Gauged By
Table 7. Groundwater and Product Measurements and Elevations for Total Fluids, Groundwater, and Soil Vapor Extraction WellsSFPP Norwalk Pump Station, Norwalk, California
Well IDDate
Gauged
Top of Well Casing
Elevation
Measured Depth to
Groundwater
Measured Depth to Product
Apparent Product
Thickness
Corrected Groundwater
Elevation
8/29/2014 74.36 29.77 29.34 0.43 44.93 Blaine Tech9/11/2014 74.36 29.96 29.61 0.35 44.68 Blaine Tech9/18/2014 74.36 29.95 29.56 0.39 44.72 Blaine Tech9/26/2014 74.36 29.97 29.55 0.42 44.73 Blaine Tech10/1/2014 74.36 29.90 29.52 0.38 44.76 Blaine Tech10/6/2014 74.36 29.94 29.56 0.38 44.72 Blaine Tech10/14/2014 74.36 29.94 29.58 0.36 44.71 Blaine Tech10/23/2014 74.36 30.00 29.62 0.38 44.66 Blaine Tech10/27/2014 74.36 29.95 29.52 0.43 44.75 Blaine Tech4/20/2015 74.36 28.53 --- --- 45.83 Blaine Tech
GMW-O-20 8/15/2008 73.32 25.90 --- --- 47.42 Envent10/17/2008 73.32 25.82 --- --- 47.50 Envent12/19/2008 73.32 27.15 --- --- 46.17 Envent1/15/2009 73.32 26.53 26.09 0.44 47.15 Envent2/24/2009 73.32 27.85 --- --- 45.47 Envent3/20/2009 73.32 28.81 --- --- 44.51 Envent3/27/2009 73.32 27.84 --- --- 45.48 Envent4/21/2009 73.32 28.70 --- --- 44.62 Envent7/21/2009 73.32 24.10 --- --- 49.22 Envent11/9/2009 73.32 25.60 25.40 0.20 47.88 Kinder Morgan6/22/2010 73.32 24.76 24.66 0.10 48.64 Blaine Tech10/4/2010 73.32 31.20 31.10 0.10 42.20 Blaine Tech1/10/2011 73.32 26.62 26.48 0.14 46.81 Blaine Tech4/11/2011 73.32 23.82 --- --- 49.50 Blaine Tech10/10/2011 73.32 24.05 --- --- 49.27 Blaine Tech1/9/2012 73.32 24.68 --- --- 48.64 Blaine Tech
4/16/2012 73.32 26.18 --- --- 47.14 Blaine Tech7/9/2012 73.32 32.92 --- --- 40.40 Blaine Tech
10/15/2012 73.32 32.97 32.95 0.02 40.37 Blaine Tech1/14/2013 73.32 32.98 32.93 0.05 40.38 Blaine Tech4/8/2013 73.32 29.63 26.46 3.17 46.27 Blaine Tech
9/24/2013 73.32 31.10 27.20 3.90 45.40 CH2M HILL10/7/2013 73.32 32.09 27.06 5.03 45.33 Blaine Tech4/25/2014 73.32 28.48 28.40 0.08 44.91 Blaine Tech9/18/2014 73.32 30.71 27.72 2.99 45.05 Blaine Tech9/26/2014 73.32 30.87 27.75 3.12 44.99 Blaine Tech10/1/2014 73.32 30.52 27.65 2.87 45.14 Blaine Tech10/6/2014 73.32 30.50 27.66 2.84 45.13 Blaine Tech10/14/2014 73.32 30.63 27.62 3.01 45.14 Blaine Tech10/23/2014 73.32 30.80 27.70 3.10 45.05 Blaine Tech10/27/2014 73.32 30.70 27.76 2.94 45.02 Blaine Tech11/3/2014 73.32 30.81 27.62 3.19 45.11 Blaine Tech11/10/2014 73.32 30.94 27.75 3.19 44.98 Blaine Tech11/18/2014 73.32 30.91 27.65 3.26 45.07 Blaine Tech11/25/2014 73.32 30.95 27.65 3.30 45.06 Blaine Tech12/3/2014 73.32 32.56 27.83 4.73 44.61 Blaine Tech12/19/2014 73.32 31.72 27.93 3.79 44.69 Blaine Tech4/22/2015 73.32 32.25 27.98 4.27 44.55 Blaine Tech
GMW-O-21 12/28/2007 71.43 27.67 --- --- 43.76 Geomatrix10/17/2008 71.43 26.00 --- --- 45.43 Envent12/19/2008 71.43 24.82 --- --- 46.61 Envent3/27/2009 71.43 26.41 --- --- 45.02 Envent7/21/2009 71.43 24.88 --- --- 46.55 Envent11/9/2009 71.43 25.02 --- --- 46.41 Kinder Morgan10/4/2010 71.43 25.40 --- --- 46.03 Blaine Tech4/13/2011 71.43 23.72 --- --- 47.71 Blaine Tech10/10/2011 71.43 24.65 --- --- 46.78 Blaine Tech10/15/2012 71.43 32.50 --- --- 38.93 Blaine Tech9/25/2013 71.43 29.25 --- --- 42.18 CH2M HILL4/14/2014 71.43 28.65 28.61 0.04 42.81 Blaine Tech9/5/2014 71.43 29.61 28.78 0.83 42.48 Blaine Tech
EN1014151027SCO Page 9 of 23
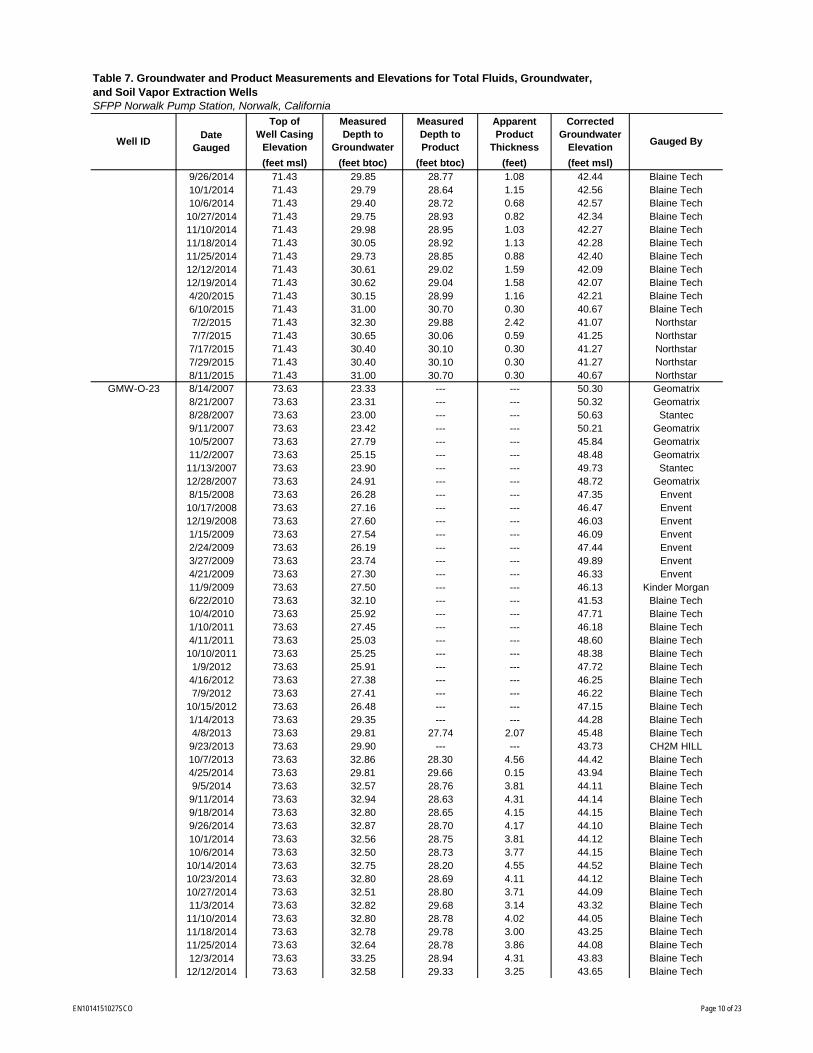
(feet msl) (feet btoc) (feet btoc) (feet) (feet msl)
Gauged By
Table 7. Groundwater and Product Measurements and Elevations for Total Fluids, Groundwater, and Soil Vapor Extraction WellsSFPP Norwalk Pump Station, Norwalk, California
Well IDDate
Gauged
Top of Well Casing
Elevation
Measured Depth to
Groundwater
Measured Depth to Product
Apparent Product
Thickness
Corrected Groundwater
Elevation
9/26/2014 71.43 29.85 28.77 1.08 42.44 Blaine Tech10/1/2014 71.43 29.79 28.64 1.15 42.56 Blaine Tech10/6/2014 71.43 29.40 28.72 0.68 42.57 Blaine Tech10/27/2014 71.43 29.75 28.93 0.82 42.34 Blaine Tech11/10/2014 71.43 29.98 28.95 1.03 42.27 Blaine Tech11/18/2014 71.43 30.05 28.92 1.13 42.28 Blaine Tech11/25/2014 71.43 29.73 28.85 0.88 42.40 Blaine Tech12/12/2014 71.43 30.61 29.02 1.59 42.09 Blaine Tech12/19/2014 71.43 30.62 29.04 1.58 42.07 Blaine Tech4/20/2015 71.43 30.15 28.99 1.16 42.21 Blaine Tech6/10/2015 71.43 31.00 30.70 0.30 40.67 Blaine Tech7/2/2015 71.43 32.30 29.88 2.42 41.07 Northstar7/7/2015 71.43 30.65 30.06 0.59 41.25 Northstar
7/17/2015 71.43 30.40 30.10 0.30 41.27 Northstar7/29/2015 71.43 30.40 30.10 0.30 41.27 Northstar8/11/2015 71.43 31.00 30.70 0.30 40.67 Northstar
GMW-O-23 8/14/2007 73.63 23.33 --- --- 50.30 Geomatrix8/21/2007 73.63 23.31 --- --- 50.32 Geomatrix8/28/2007 73.63 23.00 --- --- 50.63 Stantec9/11/2007 73.63 23.42 --- --- 50.21 Geomatrix10/5/2007 73.63 27.79 --- --- 45.84 Geomatrix11/2/2007 73.63 25.15 --- --- 48.48 Geomatrix11/13/2007 73.63 23.90 --- --- 49.73 Stantec12/28/2007 73.63 24.91 --- --- 48.72 Geomatrix8/15/2008 73.63 26.28 --- --- 47.35 Envent10/17/2008 73.63 27.16 --- --- 46.47 Envent12/19/2008 73.63 27.60 --- --- 46.03 Envent1/15/2009 73.63 27.54 --- --- 46.09 Envent2/24/2009 73.63 26.19 --- --- 47.44 Envent3/27/2009 73.63 23.74 --- --- 49.89 Envent4/21/2009 73.63 27.30 --- --- 46.33 Envent11/9/2009 73.63 27.50 --- --- 46.13 Kinder Morgan6/22/2010 73.63 32.10 --- --- 41.53 Blaine Tech10/4/2010 73.63 25.92 --- --- 47.71 Blaine Tech1/10/2011 73.63 27.45 --- --- 46.18 Blaine Tech4/11/2011 73.63 25.03 --- --- 48.60 Blaine Tech10/10/2011 73.63 25.25 --- --- 48.38 Blaine Tech1/9/2012 73.63 25.91 --- --- 47.72 Blaine Tech
4/16/2012 73.63 27.38 --- --- 46.25 Blaine Tech7/9/2012 73.63 27.41 --- --- 46.22 Blaine Tech
10/15/2012 73.63 26.48 --- --- 47.15 Blaine Tech1/14/2013 73.63 29.35 --- --- 44.28 Blaine Tech4/8/2013 73.63 29.81 27.74 2.07 45.48 Blaine Tech
9/23/2013 73.63 29.90 --- --- 43.73 CH2M HILL10/7/2013 73.63 32.86 28.30 4.56 44.42 Blaine Tech4/25/2014 73.63 29.81 29.66 0.15 43.94 Blaine Tech9/5/2014 73.63 32.57 28.76 3.81 44.11 Blaine Tech
9/11/2014 73.63 32.94 28.63 4.31 44.14 Blaine Tech9/18/2014 73.63 32.80 28.65 4.15 44.15 Blaine Tech9/26/2014 73.63 32.87 28.70 4.17 44.10 Blaine Tech10/1/2014 73.63 32.56 28.75 3.81 44.12 Blaine Tech10/6/2014 73.63 32.50 28.73 3.77 44.15 Blaine Tech10/14/2014 73.63 32.75 28.20 4.55 44.52 Blaine Tech10/23/2014 73.63 32.80 28.69 4.11 44.12 Blaine Tech10/27/2014 73.63 32.51 28.80 3.71 44.09 Blaine Tech11/3/2014 73.63 32.82 29.68 3.14 43.32 Blaine Tech11/10/2014 73.63 32.80 28.78 4.02 44.05 Blaine Tech11/18/2014 73.63 32.78 29.78 3.00 43.25 Blaine Tech11/25/2014 73.63 32.64 28.78 3.86 44.08 Blaine Tech12/3/2014 73.63 33.25 28.94 4.31 43.83 Blaine Tech12/12/2014 73.63 32.58 29.33 3.25 43.65 Blaine Tech
EN1014151027SCO Page 10 of 23
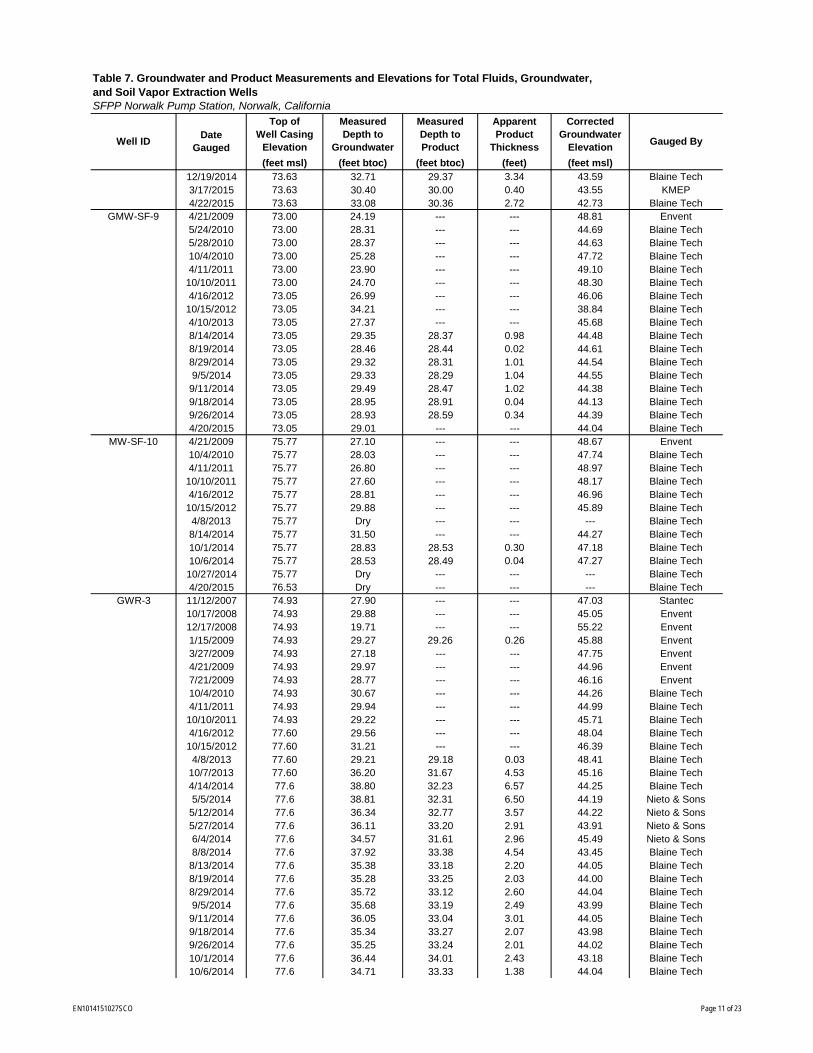
(feet msl) (feet btoc) (feet btoc) (feet) (feet msl)
Gauged By
Table 7. Groundwater and Product Measurements and Elevations for Total Fluids, Groundwater, and Soil Vapor Extraction WellsSFPP Norwalk Pump Station, Norwalk, California
Well IDDate
Gauged
Top of Well Casing
Elevation
Measured Depth to
Groundwater
Measured Depth to Product
Apparent Product
Thickness
Corrected Groundwater
Elevation
12/19/2014 73.63 32.71 29.37 3.34 43.59 Blaine Tech3/17/2015 73.63 30.40 30.00 0.40 43.55 KMEP4/22/2015 73.63 33.08 30.36 2.72 42.73 Blaine Tech
GMW-SF-9 4/21/2009 73.00 24.19 --- --- 48.81 Envent5/24/2010 73.00 28.31 --- --- 44.69 Blaine Tech5/28/2010 73.00 28.37 --- --- 44.63 Blaine Tech10/4/2010 73.00 25.28 --- --- 47.72 Blaine Tech4/11/2011 73.00 23.90 --- --- 49.10 Blaine Tech
10/10/2011 73.00 24.70 --- --- 48.30 Blaine Tech4/16/2012 73.05 26.99 --- --- 46.06 Blaine Tech
10/15/2012 73.05 34.21 --- --- 38.84 Blaine Tech4/10/2013 73.05 27.37 --- --- 45.68 Blaine Tech8/14/2014 73.05 29.35 28.37 0.98 44.48 Blaine Tech8/19/2014 73.05 28.46 28.44 0.02 44.61 Blaine Tech8/29/2014 73.05 29.32 28.31 1.01 44.54 Blaine Tech9/5/2014 73.05 29.33 28.29 1.04 44.55 Blaine Tech
9/11/2014 73.05 29.49 28.47 1.02 44.38 Blaine Tech9/18/2014 73.05 28.95 28.91 0.04 44.13 Blaine Tech9/26/2014 73.05 28.93 28.59 0.34 44.39 Blaine Tech4/20/2015 73.05 29.01 --- --- 44.04 Blaine Tech
MW-SF-10 4/21/2009 75.77 27.10 --- --- 48.67 Envent10/4/2010 75.77 28.03 --- --- 47.74 Blaine Tech4/11/2011 75.77 26.80 --- --- 48.97 Blaine Tech
10/10/2011 75.77 27.60 --- --- 48.17 Blaine Tech4/16/2012 75.77 28.81 --- --- 46.96 Blaine Tech
10/15/2012 75.77 29.88 --- --- 45.89 Blaine Tech4/8/2013 75.77 Dry --- --- --- Blaine Tech8/14/2014 75.77 31.50 --- --- 44.27 Blaine Tech10/1/2014 75.77 28.83 28.53 0.30 47.18 Blaine Tech10/6/2014 75.77 28.53 28.49 0.04 47.27 Blaine Tech10/27/2014 75.77 Dry --- --- --- Blaine Tech4/20/2015 76.53 Dry --- --- --- Blaine Tech
GWR-3 11/12/2007 74.93 27.90 --- --- 47.03 Stantec10/17/2008 74.93 29.88 --- --- 45.05 Envent12/17/2008 74.93 19.71 --- --- 55.22 Envent1/15/2009 74.93 29.27 29.26 0.26 45.88 Envent3/27/2009 74.93 27.18 --- --- 47.75 Envent4/21/2009 74.93 29.97 --- --- 44.96 Envent7/21/2009 74.93 28.77 --- --- 46.16 Envent10/4/2010 74.93 30.67 --- --- 44.26 Blaine Tech4/11/2011 74.93 29.94 --- --- 44.99 Blaine Tech10/10/2011 74.93 29.22 --- --- 45.71 Blaine Tech4/16/2012 77.60 29.56 --- --- 48.04 Blaine Tech10/15/2012 77.60 31.21 --- --- 46.39 Blaine Tech4/8/2013 77.60 29.21 29.18 0.03 48.41 Blaine Tech
10/7/2013 77.60 36.20 31.67 4.53 45.16 Blaine Tech4/14/2014 77.6 38.80 32.23 6.57 44.25 Blaine Tech5/5/2014 77.6 38.81 32.31 6.50 44.19 Nieto & Sons
5/12/2014 77.6 36.34 32.77 3.57 44.22 Nieto & Sons5/27/2014 77.6 36.11 33.20 2.91 43.91 Nieto & Sons6/4/2014 77.6 34.57 31.61 2.96 45.49 Nieto & Sons8/8/2014 77.6 37.92 33.38 4.54 43.45 Blaine Tech
8/13/2014 77.6 35.38 33.18 2.20 44.05 Blaine Tech8/19/2014 77.6 35.28 33.25 2.03 44.00 Blaine Tech8/29/2014 77.6 35.72 33.12 2.60 44.04 Blaine Tech9/5/2014 77.6 35.68 33.19 2.49 43.99 Blaine Tech
9/11/2014 77.6 36.05 33.04 3.01 44.05 Blaine Tech9/18/2014 77.6 35.34 33.27 2.07 43.98 Blaine Tech9/26/2014 77.6 35.25 33.24 2.01 44.02 Blaine Tech10/1/2014 77.6 36.44 34.01 2.43 43.18 Blaine Tech10/6/2014 77.6 34.71 33.33 1.38 44.04 Blaine Tech
EN1014151027SCO Page 11 of 23
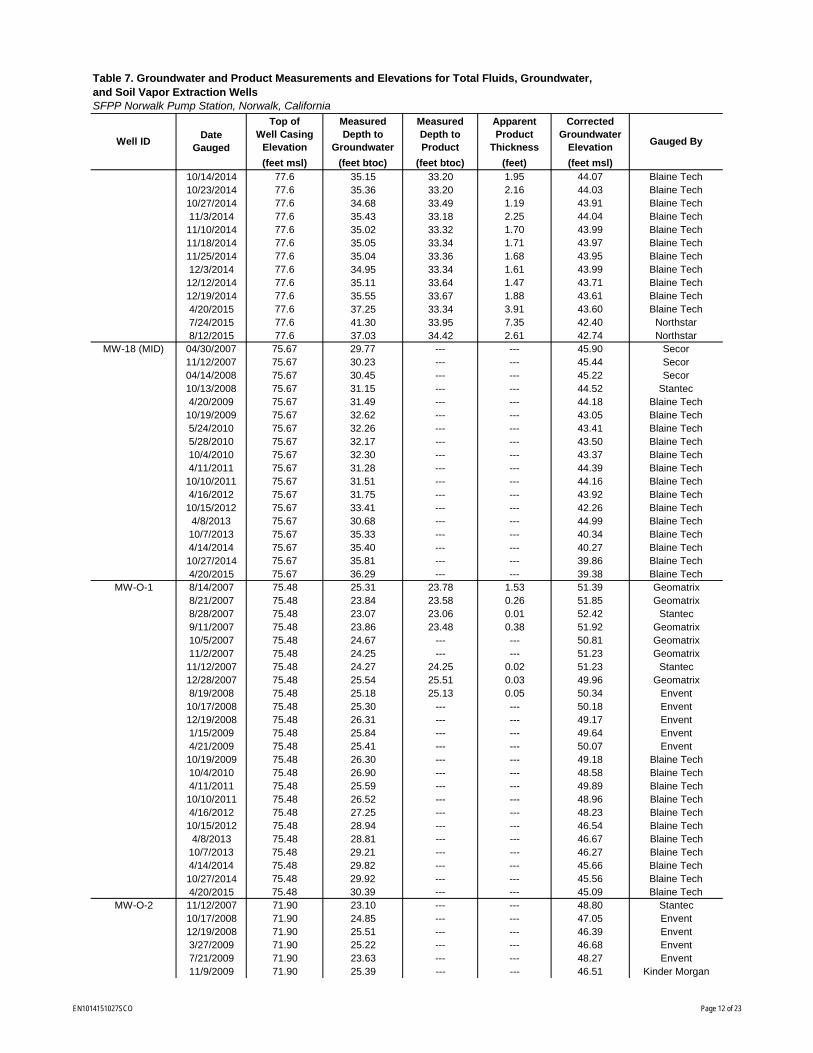
(feet msl) (feet btoc) (feet btoc) (feet) (feet msl)
Gauged By
Table 7. Groundwater and Product Measurements and Elevations for Total Fluids, Groundwater, and Soil Vapor Extraction WellsSFPP Norwalk Pump Station, Norwalk, California
Well IDDate
Gauged
Top of Well Casing
Elevation
Measured Depth to
Groundwater
Measured Depth to Product
Apparent Product
Thickness
Corrected Groundwater
Elevation
10/14/2014 77.6 35.15 33.20 1.95 44.07 Blaine Tech10/23/2014 77.6 35.36 33.20 2.16 44.03 Blaine Tech10/27/2014 77.6 34.68 33.49 1.19 43.91 Blaine Tech11/3/2014 77.6 35.43 33.18 2.25 44.04 Blaine Tech11/10/2014 77.6 35.02 33.32 1.70 43.99 Blaine Tech11/18/2014 77.6 35.05 33.34 1.71 43.97 Blaine Tech11/25/2014 77.6 35.04 33.36 1.68 43.95 Blaine Tech12/3/2014 77.6 34.95 33.34 1.61 43.99 Blaine Tech12/12/2014 77.6 35.11 33.64 1.47 43.71 Blaine Tech12/19/2014 77.6 35.55 33.67 1.88 43.61 Blaine Tech4/20/2015 77.6 37.25 33.34 3.91 43.60 Blaine Tech7/24/2015 77.6 41.30 33.95 7.35 42.40 Northstar8/12/2015 77.6 37.03 34.42 2.61 42.74 Northstar
MW-18 (MID) 04/30/2007 75.67 29.77 --- --- 45.90 Secor11/12/2007 75.67 30.23 --- --- 45.44 Secor04/14/2008 75.67 30.45 --- --- 45.22 Secor10/13/2008 75.67 31.15 --- --- 44.52 Stantec4/20/2009 75.67 31.49 --- --- 44.18 Blaine Tech
10/19/2009 75.67 32.62 --- --- 43.05 Blaine Tech5/24/2010 75.67 32.26 --- --- 43.41 Blaine Tech5/28/2010 75.67 32.17 --- --- 43.50 Blaine Tech10/4/2010 75.67 32.30 --- --- 43.37 Blaine Tech4/11/2011 75.67 31.28 --- --- 44.39 Blaine Tech
10/10/2011 75.67 31.51 --- --- 44.16 Blaine Tech4/16/2012 75.67 31.75 --- --- 43.92 Blaine Tech
10/15/2012 75.67 33.41 --- --- 42.26 Blaine Tech4/8/2013 75.67 30.68 --- --- 44.99 Blaine Tech10/7/2013 75.67 35.33 --- --- 40.34 Blaine Tech4/14/2014 75.67 35.40 --- --- 40.27 Blaine Tech10/27/2014 75.67 35.81 --- --- 39.86 Blaine Tech4/20/2015 75.67 36.29 --- --- 39.38 Blaine Tech
MW-O-1 8/14/2007 75.48 25.31 23.78 1.53 51.39 Geomatrix8/21/2007 75.48 23.84 23.58 0.26 51.85 Geomatrix8/28/2007 75.48 23.07 23.06 0.01 52.42 Stantec9/11/2007 75.48 23.86 23.48 0.38 51.92 Geomatrix10/5/2007 75.48 24.67 --- --- 50.81 Geomatrix11/2/2007 75.48 24.25 --- --- 51.23 Geomatrix11/12/2007 75.48 24.27 24.25 0.02 51.23 Stantec12/28/2007 75.48 25.54 25.51 0.03 49.96 Geomatrix8/19/2008 75.48 25.18 25.13 0.05 50.34 Envent10/17/2008 75.48 25.30 --- --- 50.18 Envent12/19/2008 75.48 26.31 --- --- 49.17 Envent1/15/2009 75.48 25.84 --- --- 49.64 Envent4/21/2009 75.48 25.41 --- --- 50.07 Envent10/19/2009 75.48 26.30 --- --- 49.18 Blaine Tech10/4/2010 75.48 26.90 --- --- 48.58 Blaine Tech4/11/2011 75.48 25.59 --- --- 49.89 Blaine Tech10/10/2011 75.48 26.52 --- --- 48.96 Blaine Tech4/16/2012 75.48 27.25 --- --- 48.23 Blaine Tech10/15/2012 75.48 28.94 --- --- 46.54 Blaine Tech4/8/2013 75.48 28.81 --- --- 46.67 Blaine Tech
10/7/2013 75.48 29.21 --- --- 46.27 Blaine Tech4/14/2014 75.48 29.82 --- --- 45.66 Blaine Tech10/27/2014 75.48 29.92 --- --- 45.56 Blaine Tech4/20/2015 75.48 30.39 --- --- 45.09 Blaine Tech
MW-O-2 11/12/2007 71.90 23.10 --- --- 48.80 Stantec10/17/2008 71.90 24.85 --- --- 47.05 Envent12/19/2008 71.90 25.51 --- --- 46.39 Envent3/27/2009 71.90 25.22 --- --- 46.68 Envent7/21/2009 71.90 23.63 --- --- 48.27 Envent11/9/2009 71.90 25.39 --- --- 46.51 Kinder Morgan
EN1014151027SCO Page 12 of 23
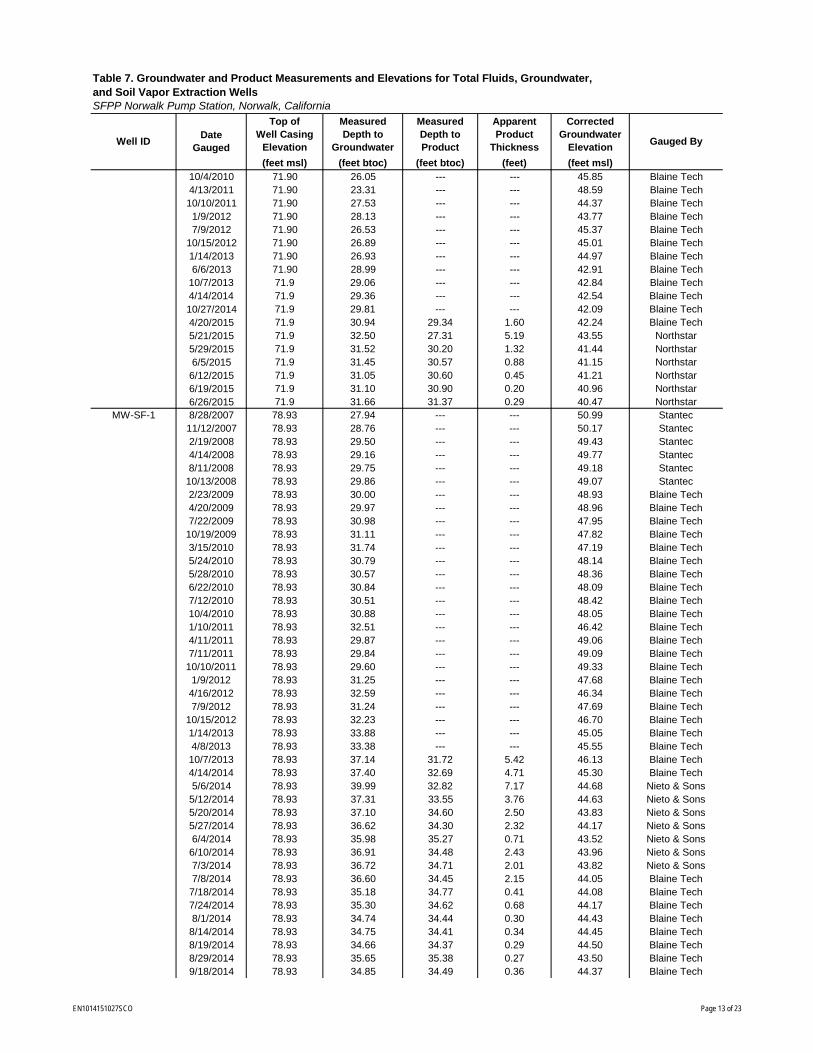
(feet msl) (feet btoc) (feet btoc) (feet) (feet msl)
Gauged By
Table 7. Groundwater and Product Measurements and Elevations for Total Fluids, Groundwater, and Soil Vapor Extraction WellsSFPP Norwalk Pump Station, Norwalk, California
Well IDDate
Gauged
Top of Well Casing
Elevation
Measured Depth to
Groundwater
Measured Depth to Product
Apparent Product
Thickness
Corrected Groundwater
Elevation
10/4/2010 71.90 26.05 --- --- 45.85 Blaine Tech4/13/2011 71.90 23.31 --- --- 48.59 Blaine Tech10/10/2011 71.90 27.53 --- --- 44.37 Blaine Tech1/9/2012 71.90 28.13 --- --- 43.77 Blaine Tech7/9/2012 71.90 26.53 --- --- 45.37 Blaine Tech
10/15/2012 71.90 26.89 --- --- 45.01 Blaine Tech1/14/2013 71.90 26.93 --- --- 44.97 Blaine Tech6/6/2013 71.90 28.99 --- --- 42.91 Blaine Tech
10/7/2013 71.9 29.06 --- --- 42.84 Blaine Tech4/14/2014 71.9 29.36 --- --- 42.54 Blaine Tech10/27/2014 71.9 29.81 --- --- 42.09 Blaine Tech4/20/2015 71.9 30.94 29.34 1.60 42.24 Blaine Tech5/21/2015 71.9 32.50 27.31 5.19 43.55 Northstar5/29/2015 71.9 31.52 30.20 1.32 41.44 Northstar6/5/2015 71.9 31.45 30.57 0.88 41.15 Northstar
6/12/2015 71.9 31.05 30.60 0.45 41.21 Northstar6/19/2015 71.9 31.10 30.90 0.20 40.96 Northstar6/26/2015 71.9 31.66 31.37 0.29 40.47 Northstar
MW-SF-1 8/28/2007 78.93 27.94 --- --- 50.99 Stantec11/12/2007 78.93 28.76 --- --- 50.17 Stantec2/19/2008 78.93 29.50 --- --- 49.43 Stantec4/14/2008 78.93 29.16 --- --- 49.77 Stantec8/11/2008 78.93 29.75 --- --- 49.18 Stantec
10/13/2008 78.93 29.86 --- --- 49.07 Stantec2/23/2009 78.93 30.00 --- --- 48.93 Blaine Tech4/20/2009 78.93 29.97 --- --- 48.96 Blaine Tech7/22/2009 78.93 30.98 --- --- 47.95 Blaine Tech
10/19/2009 78.93 31.11 --- --- 47.82 Blaine Tech3/15/2010 78.93 31.74 --- --- 47.19 Blaine Tech5/24/2010 78.93 30.79 --- --- 48.14 Blaine Tech5/28/2010 78.93 30.57 --- --- 48.36 Blaine Tech6/22/2010 78.93 30.84 --- --- 48.09 Blaine Tech7/12/2010 78.93 30.51 --- --- 48.42 Blaine Tech10/4/2010 78.93 30.88 --- --- 48.05 Blaine Tech1/10/2011 78.93 32.51 --- --- 46.42 Blaine Tech4/11/2011 78.93 29.87 --- --- 49.06 Blaine Tech7/11/2011 78.93 29.84 --- --- 49.09 Blaine Tech
10/10/2011 78.93 29.60 --- --- 49.33 Blaine Tech1/9/2012 78.93 31.25 --- --- 47.68 Blaine Tech4/16/2012 78.93 32.59 --- --- 46.34 Blaine Tech7/9/2012 78.93 31.24 --- --- 47.69 Blaine Tech
10/15/2012 78.93 32.23 --- --- 46.70 Blaine Tech1/14/2013 78.93 33.88 --- --- 45.05 Blaine Tech4/8/2013 78.93 33.38 --- --- 45.55 Blaine Tech10/7/2013 78.93 37.14 31.72 5.42 46.13 Blaine Tech4/14/2014 78.93 37.40 32.69 4.71 45.30 Blaine Tech5/6/2014 78.93 39.99 32.82 7.17 44.68 Nieto & Sons
5/12/2014 78.93 37.31 33.55 3.76 44.63 Nieto & Sons5/20/2014 78.93 37.10 34.60 2.50 43.83 Nieto & Sons5/27/2014 78.93 36.62 34.30 2.32 44.17 Nieto & Sons6/4/2014 78.93 35.98 35.27 0.71 43.52 Nieto & Sons
6/10/2014 78.93 36.91 34.48 2.43 43.96 Nieto & Sons7/3/2014 78.93 36.72 34.71 2.01 43.82 Nieto & Sons7/8/2014 78.93 36.60 34.45 2.15 44.05 Blaine Tech
7/18/2014 78.93 35.18 34.77 0.41 44.08 Blaine Tech7/24/2014 78.93 35.30 34.62 0.68 44.17 Blaine Tech8/1/2014 78.93 34.74 34.44 0.30 44.43 Blaine Tech
8/14/2014 78.93 34.75 34.41 0.34 44.45 Blaine Tech8/19/2014 78.93 34.66 34.37 0.29 44.50 Blaine Tech8/29/2014 78.93 35.65 35.38 0.27 43.50 Blaine Tech9/18/2014 78.93 34.85 34.49 0.36 44.37 Blaine Tech
EN1014151027SCO Page 13 of 23
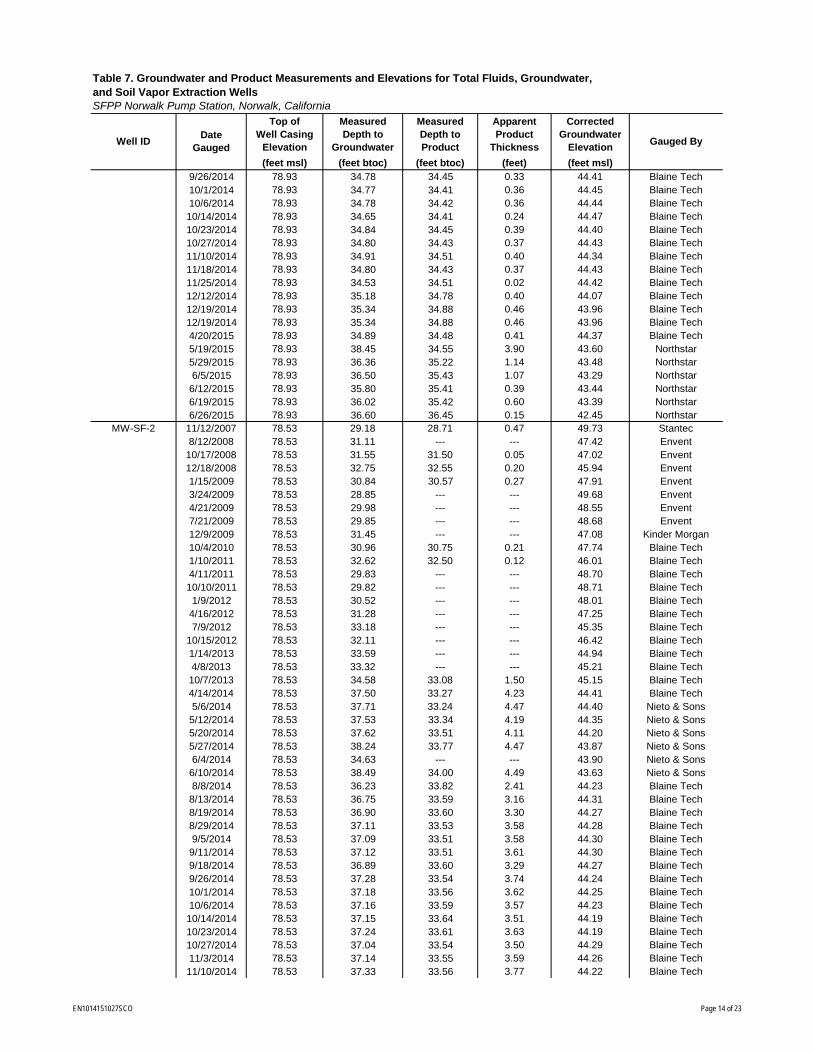
(feet msl) (feet btoc) (feet btoc) (feet) (feet msl)
Gauged By
Table 7. Groundwater and Product Measurements and Elevations for Total Fluids, Groundwater, and Soil Vapor Extraction WellsSFPP Norwalk Pump Station, Norwalk, California
Well IDDate
Gauged
Top of Well Casing
Elevation
Measured Depth to
Groundwater
Measured Depth to Product
Apparent Product
Thickness
Corrected Groundwater
Elevation
9/26/2014 78.93 34.78 34.45 0.33 44.41 Blaine Tech10/1/2014 78.93 34.77 34.41 0.36 44.45 Blaine Tech10/6/2014 78.93 34.78 34.42 0.36 44.44 Blaine Tech10/14/2014 78.93 34.65 34.41 0.24 44.47 Blaine Tech10/23/2014 78.93 34.84 34.45 0.39 44.40 Blaine Tech10/27/2014 78.93 34.80 34.43 0.37 44.43 Blaine Tech11/10/2014 78.93 34.91 34.51 0.40 44.34 Blaine Tech11/18/2014 78.93 34.80 34.43 0.37 44.43 Blaine Tech11/25/2014 78.93 34.53 34.51 0.02 44.42 Blaine Tech12/12/2014 78.93 35.18 34.78 0.40 44.07 Blaine Tech12/19/2014 78.93 35.34 34.88 0.46 43.96 Blaine Tech12/19/2014 78.93 35.34 34.88 0.46 43.96 Blaine Tech4/20/2015 78.93 34.89 34.48 0.41 44.37 Blaine Tech5/19/2015 78.93 38.45 34.55 3.90 43.60 Northstar5/29/2015 78.93 36.36 35.22 1.14 43.48 Northstar6/5/2015 78.93 36.50 35.43 1.07 43.29 Northstar
6/12/2015 78.93 35.80 35.41 0.39 43.44 Northstar6/19/2015 78.93 36.02 35.42 0.60 43.39 Northstar6/26/2015 78.93 36.60 36.45 0.15 42.45 Northstar
MW-SF-2 11/12/2007 78.53 29.18 28.71 0.47 49.73 Stantec8/12/2008 78.53 31.11 --- --- 47.42 Envent
10/17/2008 78.53 31.55 31.50 0.05 47.02 Envent12/18/2008 78.53 32.75 32.55 0.20 45.94 Envent1/15/2009 78.53 30.84 30.57 0.27 47.91 Envent3/24/2009 78.53 28.85 --- --- 49.68 Envent4/21/2009 78.53 29.98 --- --- 48.55 Envent7/21/2009 78.53 29.85 --- --- 48.68 Envent12/9/2009 78.53 31.45 --- --- 47.08 Kinder Morgan10/4/2010 78.53 30.96 30.75 0.21 47.74 Blaine Tech1/10/2011 78.53 32.62 32.50 0.12 46.01 Blaine Tech4/11/2011 78.53 29.83 --- --- 48.70 Blaine Tech10/10/2011 78.53 29.82 --- --- 48.71 Blaine Tech1/9/2012 78.53 30.52 --- --- 48.01 Blaine Tech
4/16/2012 78.53 31.28 --- --- 47.25 Blaine Tech7/9/2012 78.53 33.18 --- --- 45.35 Blaine Tech
10/15/2012 78.53 32.11 --- --- 46.42 Blaine Tech1/14/2013 78.53 33.59 --- --- 44.94 Blaine Tech4/8/2013 78.53 33.32 --- --- 45.21 Blaine Tech10/7/2013 78.53 34.58 33.08 1.50 45.15 Blaine Tech4/14/2014 78.53 37.50 33.27 4.23 44.41 Blaine Tech5/6/2014 78.53 37.71 33.24 4.47 44.40 Nieto & Sons
5/12/2014 78.53 37.53 33.34 4.19 44.35 Nieto & Sons5/20/2014 78.53 37.62 33.51 4.11 44.20 Nieto & Sons5/27/2014 78.53 38.24 33.77 4.47 43.87 Nieto & Sons6/4/2014 78.53 34.63 --- --- 43.90 Nieto & Sons
6/10/2014 78.53 38.49 34.00 4.49 43.63 Nieto & Sons8/8/2014 78.53 36.23 33.82 2.41 44.23 Blaine Tech
8/13/2014 78.53 36.75 33.59 3.16 44.31 Blaine Tech8/19/2014 78.53 36.90 33.60 3.30 44.27 Blaine Tech8/29/2014 78.53 37.11 33.53 3.58 44.28 Blaine Tech9/5/2014 78.53 37.09 33.51 3.58 44.30 Blaine Tech
9/11/2014 78.53 37.12 33.51 3.61 44.30 Blaine Tech9/18/2014 78.53 36.89 33.60 3.29 44.27 Blaine Tech9/26/2014 78.53 37.28 33.54 3.74 44.24 Blaine Tech10/1/2014 78.53 37.18 33.56 3.62 44.25 Blaine Tech10/6/2014 78.53 37.16 33.59 3.57 44.23 Blaine Tech10/14/2014 78.53 37.15 33.64 3.51 44.19 Blaine Tech10/23/2014 78.53 37.24 33.61 3.63 44.19 Blaine Tech10/27/2014 78.53 37.04 33.54 3.50 44.29 Blaine Tech11/3/2014 78.53 37.14 33.55 3.59 44.26 Blaine Tech11/10/2014 78.53 37.33 33.56 3.77 44.22 Blaine Tech
EN1014151027SCO Page 14 of 23

(feet msl) (feet btoc) (feet btoc) (feet) (feet msl)
Gauged By
Table 7. Groundwater and Product Measurements and Elevations for Total Fluids, Groundwater, and Soil Vapor Extraction WellsSFPP Norwalk Pump Station, Norwalk, California
Well IDDate
Gauged
Top of Well Casing
Elevation
Measured Depth to
Groundwater
Measured Depth to Product
Apparent Product
Thickness
Corrected Groundwater
Elevation
11/18/2014 78.53 37.21 33.64 3.57 44.18 Blaine Tech11/25/2014 78.53 37.40 33.69 3.71 44.10 Blaine Tech12/3/2014 78.53 37.16 33.60 3.56 44.22 Blaine Tech12/12/2014 78.53 38.05 33.91 4.14 43.79 Blaine Tech12/19/2014 78.53 38.40 33.95 4.45 43.69 Blaine Tech4/20/2015 78.53 36.15 34.73 1.42 43.52 Blaine Tech6/25/2015 78.53 38.95 35.57 3.38 42.28 Blaine Tech
MW-SF-3 11/12/2007 78.12 29.34 28.28 1.06 49.63 Stantec8/12/2008 78.12 30.30 29.05 1.25 48.82 Envent
10/17/2008 78.12 29.45 --- --- 48.67 Envent12/18/2008 78.12 31.08 30.82 0.26 47.25 Envent1/15/2009 78.12 29.96 29.94 0.02 48.18 Envent3/20/2009 78.12 31.10 --- --- 47.02 Envent3/24/2009 78.12 27.82 --- --- 50.30 Envent4/21/2009 78.12 29.51 29.50 0.01 48.62 Envent7/21/2009 78.12 30.07 --- --- 48.05 Envent11/6/2009 78.12 30.37 30.35 0.02 47.77 Kinder Morgan12/9/2009 78.12 30.53 --- --- 47.59 Kinder Morgan9/3/2010 78.12 30.97 30.42 0.55 47.59 Kinder Morgan
10/4/2010 78.12 30.88 30.30 0.58 47.70 Blaine Tech4/12/2011 78.12 29.44 --- --- 48.68 Blaine Tech10/10/2011 78.12 30.75 --- --- 47.37 Blaine Tech10/15/2012 78.12 32.47 --- --- 45.65 Blaine Tech5/24/2013 78.12 33.35 32.51 0.84 45.44 Blaine Tech9/25/2013 78.12 34.40 --- --- 43.72 CH2M HILL
11/14/2013 78.12 33.26 --- --- 44.86 CH2M HILL4/18/2014 78.12 33.72 33.62 0.10 44.48 Blaine Tech8/8/2014 78.12 34.07 33.71 0.36 44.34 Blaine Tech
10/14/2014 78.12 34.55 33.92 0.63 44.07 Blaine Tech10/23/2014 78.12 34.57 33.94 0.63 44.05 Blaine Tech10/27/2014 78.12 34.49 33.85 0.64 44.14 Blaine Tech11/10/2014 78.12 34.65 33.94 0.71 44.04 Blaine Tech11/18/2014 78.12 34.62 33.88 0.74 44.09 Blaine Tech11/25/2014 78.12 34.22 33.94 0.28 44.12 Blaine Tech12/12/2014 78.12 34.89 34.38 0.51 43.64 Blaine Tech12/19/2014 78.12 35.04 34.43 0.61 43.57 Blaine Tech4/20/2015 78.12 34.52 --- --- 43.60 Blaine Tech
MW-SF-4 8/14/2007 79.38 30.34 28.38 1.96 50.60 Geomatrix8/28/2007 79.38 29.95 28.30 1.65 50.74 Stantec9/11/2007 79.38 29.98 28.43 1.55 50.63 Geomatrix10/5/2007 79.38 30.68 28.85 1.83 50.15 Geomatrix10/12/2007 79.38 30.27 29.96 0.31 49.36 Geomatrix10/19/2007 79.38 30.28 --- --- 49.10 Geomatrix10/26/2007 79.38 30.52 --- --- 48.86 Geomatrix11/2/2007 79.38 30.68 --- --- 48.70 Geomatrix11/12/2007 79.38 29.70 29.69 0.01 49.69 Stantec12/21/2007 79.38 30.69 --- --- 48.69 Geomatrix2/19/2008 79.38 30.22 --- --- 49.16 Stantec3/21/2008 79.38 30.07 --- --- 49.31 Envent4/14/2008 79.38 29.95 --- --- 49.43 Stantec8/8/2008 79.38 30.51 --- --- 48.87 Envent
8/11/2008 79.38 30.57 --- --- 48.81 Stantec10/16/2008 79.38 30.77 --- --- 48.61 Envent1/15/2009 79.38 31.14 --- --- 48.24 Envent2/20/2009 79.38 30.84 --- --- 48.54 Envent2/23/2009 79.38 30.96 --- --- 48.42 Blaine Tech4/20/2009 79.38 30.02 29.94 0.08 49.42 Blaine Tech4/28/2009 79.38 30.78 --- --- 48.60 Envent7/17/2009 79.38 31.85 --- --- 47.53 Envent7/22/2009 79.38 31.65 31.61 0.04 47.76 Blaine Tech10/19/2009 79.38 31.93 31.90 0.03 47.47 Blaine Tech
EN1014151027SCO Page 15 of 23
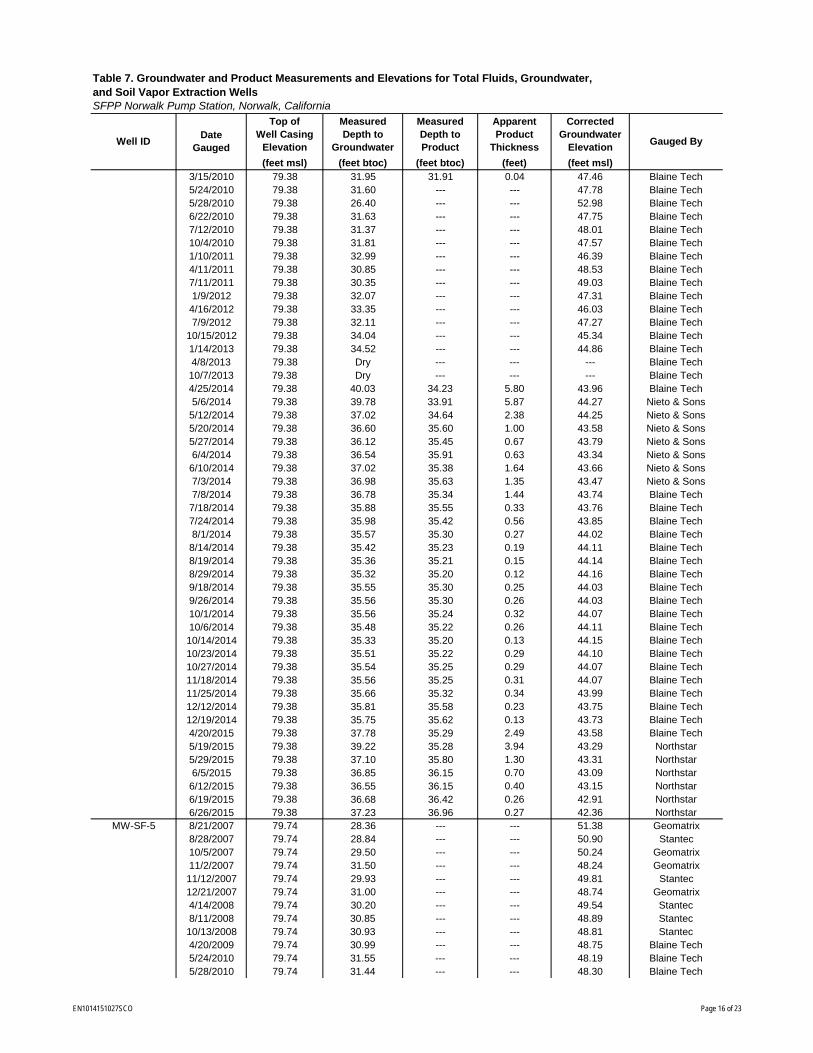
(feet msl) (feet btoc) (feet btoc) (feet) (feet msl)
Gauged By
Table 7. Groundwater and Product Measurements and Elevations for Total Fluids, Groundwater, and Soil Vapor Extraction WellsSFPP Norwalk Pump Station, Norwalk, California
Well IDDate
Gauged
Top of Well Casing
Elevation
Measured Depth to
Groundwater
Measured Depth to Product
Apparent Product
Thickness
Corrected Groundwater
Elevation
3/15/2010 79.38 31.95 31.91 0.04 47.46 Blaine Tech5/24/2010 79.38 31.60 --- --- 47.78 Blaine Tech5/28/2010 79.38 26.40 --- --- 52.98 Blaine Tech6/22/2010 79.38 31.63 --- --- 47.75 Blaine Tech7/12/2010 79.38 31.37 --- --- 48.01 Blaine Tech10/4/2010 79.38 31.81 --- --- 47.57 Blaine Tech1/10/2011 79.38 32.99 --- --- 46.39 Blaine Tech4/11/2011 79.38 30.85 --- --- 48.53 Blaine Tech7/11/2011 79.38 30.35 --- --- 49.03 Blaine Tech1/9/2012 79.38 32.07 --- --- 47.31 Blaine Tech
4/16/2012 79.38 33.35 --- --- 46.03 Blaine Tech7/9/2012 79.38 32.11 --- --- 47.27 Blaine Tech
10/15/2012 79.38 34.04 --- --- 45.34 Blaine Tech1/14/2013 79.38 34.52 --- --- 44.86 Blaine Tech4/8/2013 79.38 Dry --- --- --- Blaine Tech10/7/2013 79.38 Dry --- --- --- Blaine Tech4/25/2014 79.38 40.03 34.23 5.80 43.96 Blaine Tech5/6/2014 79.38 39.78 33.91 5.87 44.27 Nieto & Sons
5/12/2014 79.38 37.02 34.64 2.38 44.25 Nieto & Sons5/20/2014 79.38 36.60 35.60 1.00 43.58 Nieto & Sons5/27/2014 79.38 36.12 35.45 0.67 43.79 Nieto & Sons6/4/2014 79.38 36.54 35.91 0.63 43.34 Nieto & Sons
6/10/2014 79.38 37.02 35.38 1.64 43.66 Nieto & Sons7/3/2014 79.38 36.98 35.63 1.35 43.47 Nieto & Sons7/8/2014 79.38 36.78 35.34 1.44 43.74 Blaine Tech
7/18/2014 79.38 35.88 35.55 0.33 43.76 Blaine Tech7/24/2014 79.38 35.98 35.42 0.56 43.85 Blaine Tech8/1/2014 79.38 35.57 35.30 0.27 44.02 Blaine Tech
8/14/2014 79.38 35.42 35.23 0.19 44.11 Blaine Tech8/19/2014 79.38 35.36 35.21 0.15 44.14 Blaine Tech8/29/2014 79.38 35.32 35.20 0.12 44.16 Blaine Tech9/18/2014 79.38 35.55 35.30 0.25 44.03 Blaine Tech9/26/2014 79.38 35.56 35.30 0.26 44.03 Blaine Tech10/1/2014 79.38 35.56 35.24 0.32 44.07 Blaine Tech10/6/2014 79.38 35.48 35.22 0.26 44.11 Blaine Tech10/14/2014 79.38 35.33 35.20 0.13 44.15 Blaine Tech10/23/2014 79.38 35.51 35.22 0.29 44.10 Blaine Tech10/27/2014 79.38 35.54 35.25 0.29 44.07 Blaine Tech11/18/2014 79.38 35.56 35.25 0.31 44.07 Blaine Tech11/25/2014 79.38 35.66 35.32 0.34 43.99 Blaine Tech12/12/2014 79.38 35.81 35.58 0.23 43.75 Blaine Tech12/19/2014 79.38 35.75 35.62 0.13 43.73 Blaine Tech4/20/2015 79.38 37.78 35.29 2.49 43.58 Blaine Tech5/19/2015 79.38 39.22 35.28 3.94 43.29 Northstar5/29/2015 79.38 37.10 35.80 1.30 43.31 Northstar6/5/2015 79.38 36.85 36.15 0.70 43.09 Northstar
6/12/2015 79.38 36.55 36.15 0.40 43.15 Northstar6/19/2015 79.38 36.68 36.42 0.26 42.91 Northstar6/26/2015 79.38 37.23 36.96 0.27 42.36 Northstar
MW-SF-5 8/21/2007 79.74 28.36 --- --- 51.38 Geomatrix8/28/2007 79.74 28.84 --- --- 50.90 Stantec10/5/2007 79.74 29.50 --- --- 50.24 Geomatrix11/2/2007 79.74 31.50 --- --- 48.24 Geomatrix11/12/2007 79.74 29.93 --- --- 49.81 Stantec12/21/2007 79.74 31.00 --- --- 48.74 Geomatrix4/14/2008 79.74 30.20 --- --- 49.54 Stantec8/11/2008 79.74 30.85 --- --- 48.89 Stantec10/13/2008 79.74 30.93 --- --- 48.81 Stantec4/20/2009 79.74 30.99 --- --- 48.75 Blaine Tech5/24/2010 79.74 31.55 --- --- 48.19 Blaine Tech5/28/2010 79.74 31.44 --- --- 48.30 Blaine Tech
EN1014151027SCO Page 16 of 23
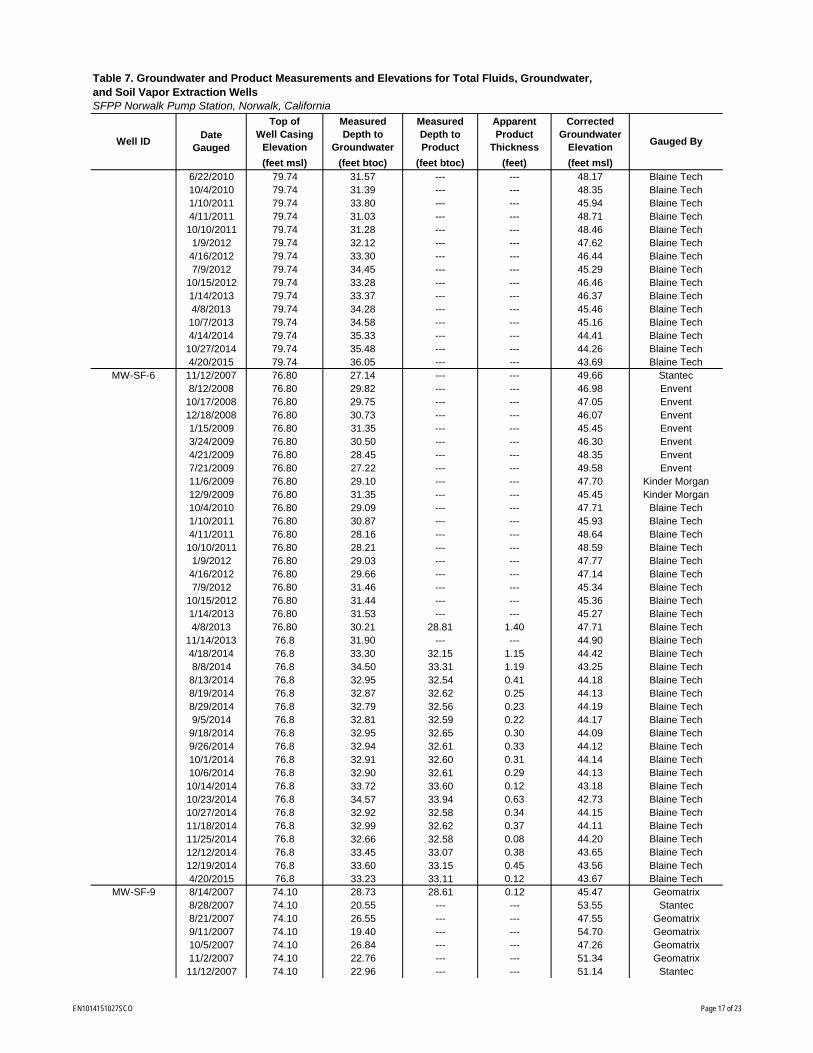
(feet msl) (feet btoc) (feet btoc) (feet) (feet msl)
Gauged By
Table 7. Groundwater and Product Measurements and Elevations for Total Fluids, Groundwater, and Soil Vapor Extraction WellsSFPP Norwalk Pump Station, Norwalk, California
Well IDDate
Gauged
Top of Well Casing
Elevation
Measured Depth to
Groundwater
Measured Depth to Product
Apparent Product
Thickness
Corrected Groundwater
Elevation
6/22/2010 79.74 31.57 --- --- 48.17 Blaine Tech10/4/2010 79.74 31.39 --- --- 48.35 Blaine Tech1/10/2011 79.74 33.80 --- --- 45.94 Blaine Tech4/11/2011 79.74 31.03 --- --- 48.71 Blaine Tech10/10/2011 79.74 31.28 --- --- 48.46 Blaine Tech1/9/2012 79.74 32.12 --- --- 47.62 Blaine Tech
4/16/2012 79.74 33.30 --- --- 46.44 Blaine Tech7/9/2012 79.74 34.45 --- --- 45.29 Blaine Tech
10/15/2012 79.74 33.28 --- --- 46.46 Blaine Tech1/14/2013 79.74 33.37 --- --- 46.37 Blaine Tech4/8/2013 79.74 34.28 --- --- 45.46 Blaine Tech10/7/2013 79.74 34.58 --- --- 45.16 Blaine Tech4/14/2014 79.74 35.33 --- --- 44.41 Blaine Tech
10/27/2014 79.74 35.48 --- --- 44.26 Blaine Tech4/20/2015 79.74 36.05 --- --- 43.69 Blaine Tech
MW-SF-6 11/12/2007 76.80 27.14 --- --- 49.66 Stantec8/12/2008 76.80 29.82 --- --- 46.98 Envent
10/17/2008 76.80 29.75 --- --- 47.05 Envent12/18/2008 76.80 30.73 --- --- 46.07 Envent1/15/2009 76.80 31.35 --- --- 45.45 Envent3/24/2009 76.80 30.50 --- --- 46.30 Envent4/21/2009 76.80 28.45 --- --- 48.35 Envent7/21/2009 76.80 27.22 --- --- 49.58 Envent11/6/2009 76.80 29.10 --- --- 47.70 Kinder Morgan12/9/2009 76.80 31.35 --- --- 45.45 Kinder Morgan10/4/2010 76.80 29.09 --- --- 47.71 Blaine Tech1/10/2011 76.80 30.87 --- --- 45.93 Blaine Tech4/11/2011 76.80 28.16 --- --- 48.64 Blaine Tech10/10/2011 76.80 28.21 --- --- 48.59 Blaine Tech1/9/2012 76.80 29.03 --- --- 47.77 Blaine Tech
4/16/2012 76.80 29.66 --- --- 47.14 Blaine Tech7/9/2012 76.80 31.46 --- --- 45.34 Blaine Tech
10/15/2012 76.80 31.44 --- --- 45.36 Blaine Tech1/14/2013 76.80 31.53 --- --- 45.27 Blaine Tech4/8/2013 76.80 30.21 28.81 1.40 47.71 Blaine Tech
11/14/2013 76.8 31.90 --- --- 44.90 Blaine Tech4/18/2014 76.8 33.30 32.15 1.15 44.42 Blaine Tech8/8/2014 76.8 34.50 33.31 1.19 43.25 Blaine Tech
8/13/2014 76.8 32.95 32.54 0.41 44.18 Blaine Tech8/19/2014 76.8 32.87 32.62 0.25 44.13 Blaine Tech8/29/2014 76.8 32.79 32.56 0.23 44.19 Blaine Tech9/5/2014 76.8 32.81 32.59 0.22 44.17 Blaine Tech
9/18/2014 76.8 32.95 32.65 0.30 44.09 Blaine Tech9/26/2014 76.8 32.94 32.61 0.33 44.12 Blaine Tech10/1/2014 76.8 32.91 32.60 0.31 44.14 Blaine Tech10/6/2014 76.8 32.90 32.61 0.29 44.13 Blaine Tech10/14/2014 76.8 33.72 33.60 0.12 43.18 Blaine Tech10/23/2014 76.8 34.57 33.94 0.63 42.73 Blaine Tech10/27/2014 76.8 32.92 32.58 0.34 44.15 Blaine Tech11/18/2014 76.8 32.99 32.62 0.37 44.11 Blaine Tech11/25/2014 76.8 32.66 32.58 0.08 44.20 Blaine Tech12/12/2014 76.8 33.45 33.07 0.38 43.65 Blaine Tech12/19/2014 76.8 33.60 33.15 0.45 43.56 Blaine Tech4/20/2015 76.8 33.23 33.11 0.12 43.67 Blaine Tech
MW-SF-9 8/14/2007 74.10 28.73 28.61 0.12 45.47 Geomatrix8/28/2007 74.10 20.55 --- --- 53.55 Stantec8/21/2007 74.10 26.55 --- --- 47.55 Geomatrix9/11/2007 74.10 19.40 --- --- 54.70 Geomatrix10/5/2007 74.10 26.84 --- --- 47.26 Geomatrix11/2/2007 74.10 22.76 --- --- 51.34 Geomatrix11/12/2007 74.10 22.96 --- --- 51.14 Stantec
EN1014151027SCO Page 17 of 23
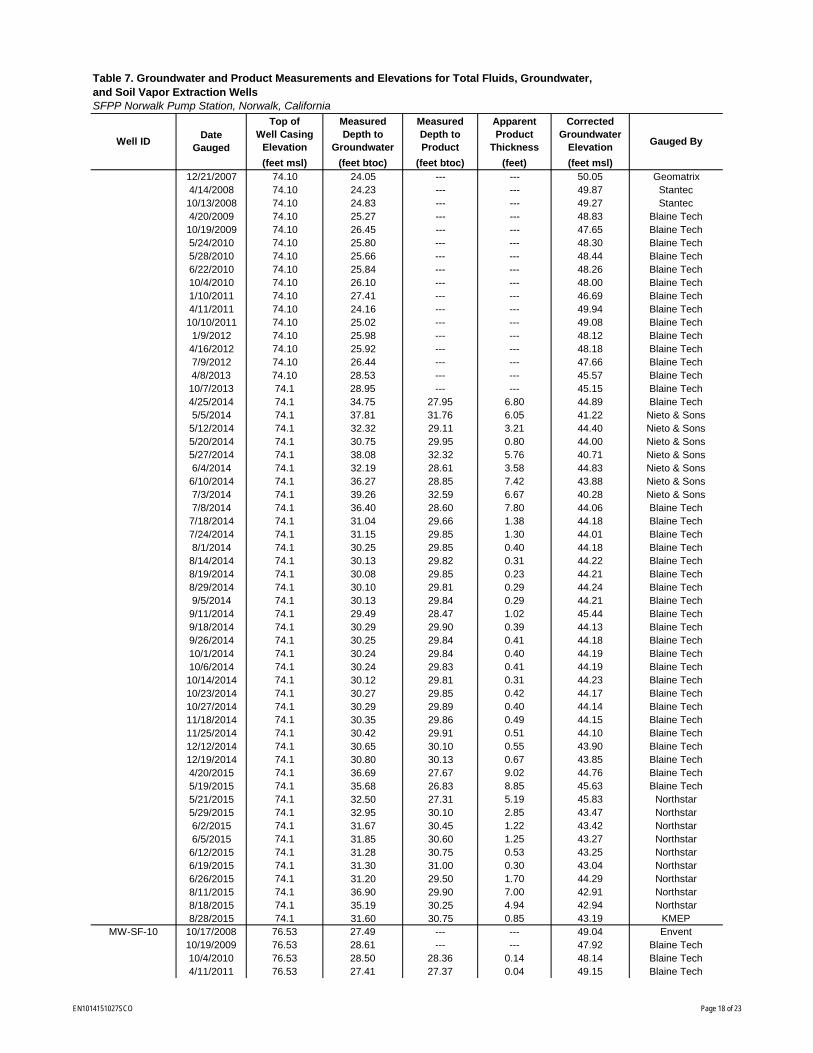
(feet msl) (feet btoc) (feet btoc) (feet) (feet msl)
Gauged By
Table 7. Groundwater and Product Measurements and Elevations for Total Fluids, Groundwater, and Soil Vapor Extraction WellsSFPP Norwalk Pump Station, Norwalk, California
Well IDDate
Gauged
Top of Well Casing
Elevation
Measured Depth to
Groundwater
Measured Depth to Product
Apparent Product
Thickness
Corrected Groundwater
Elevation
12/21/2007 74.10 24.05 --- --- 50.05 Geomatrix4/14/2008 74.10 24.23 --- --- 49.87 Stantec10/13/2008 74.10 24.83 --- --- 49.27 Stantec4/20/2009 74.10 25.27 --- --- 48.83 Blaine Tech10/19/2009 74.10 26.45 --- --- 47.65 Blaine Tech5/24/2010 74.10 25.80 --- --- 48.30 Blaine Tech5/28/2010 74.10 25.66 --- --- 48.44 Blaine Tech6/22/2010 74.10 25.84 --- --- 48.26 Blaine Tech10/4/2010 74.10 26.10 --- --- 48.00 Blaine Tech1/10/2011 74.10 27.41 --- --- 46.69 Blaine Tech4/11/2011 74.10 24.16 --- --- 49.94 Blaine Tech10/10/2011 74.10 25.02 --- --- 49.08 Blaine Tech1/9/2012 74.10 25.98 --- --- 48.12 Blaine Tech
4/16/2012 74.10 25.92 --- --- 48.18 Blaine Tech7/9/2012 74.10 26.44 --- --- 47.66 Blaine Tech4/8/2013 74.10 28.53 --- --- 45.57 Blaine Tech10/7/2013 74.1 28.95 --- --- 45.15 Blaine Tech4/25/2014 74.1 34.75 27.95 6.80 44.89 Blaine Tech5/5/2014 74.1 37.81 31.76 6.05 41.22 Nieto & Sons
5/12/2014 74.1 32.32 29.11 3.21 44.40 Nieto & Sons5/20/2014 74.1 30.75 29.95 0.80 44.00 Nieto & Sons5/27/2014 74.1 38.08 32.32 5.76 40.71 Nieto & Sons6/4/2014 74.1 32.19 28.61 3.58 44.83 Nieto & Sons
6/10/2014 74.1 36.27 28.85 7.42 43.88 Nieto & Sons7/3/2014 74.1 39.26 32.59 6.67 40.28 Nieto & Sons7/8/2014 74.1 36.40 28.60 7.80 44.06 Blaine Tech
7/18/2014 74.1 31.04 29.66 1.38 44.18 Blaine Tech7/24/2014 74.1 31.15 29.85 1.30 44.01 Blaine Tech8/1/2014 74.1 30.25 29.85 0.40 44.18 Blaine Tech
8/14/2014 74.1 30.13 29.82 0.31 44.22 Blaine Tech8/19/2014 74.1 30.08 29.85 0.23 44.21 Blaine Tech8/29/2014 74.1 30.10 29.81 0.29 44.24 Blaine Tech9/5/2014 74.1 30.13 29.84 0.29 44.21 Blaine Tech
9/11/2014 74.1 29.49 28.47 1.02 45.44 Blaine Tech9/18/2014 74.1 30.29 29.90 0.39 44.13 Blaine Tech9/26/2014 74.1 30.25 29.84 0.41 44.18 Blaine Tech10/1/2014 74.1 30.24 29.84 0.40 44.19 Blaine Tech10/6/2014 74.1 30.24 29.83 0.41 44.19 Blaine Tech10/14/2014 74.1 30.12 29.81 0.31 44.23 Blaine Tech10/23/2014 74.1 30.27 29.85 0.42 44.17 Blaine Tech10/27/2014 74.1 30.29 29.89 0.40 44.14 Blaine Tech11/18/2014 74.1 30.35 29.86 0.49 44.15 Blaine Tech11/25/2014 74.1 30.42 29.91 0.51 44.10 Blaine Tech12/12/2014 74.1 30.65 30.10 0.55 43.90 Blaine Tech12/19/2014 74.1 30.80 30.13 0.67 43.85 Blaine Tech4/20/2015 74.1 36.69 27.67 9.02 44.76 Blaine Tech5/19/2015 74.1 35.68 26.83 8.85 45.63 Blaine Tech5/21/2015 74.1 32.50 27.31 5.19 45.83 Northstar5/29/2015 74.1 32.95 30.10 2.85 43.47 Northstar6/2/2015 74.1 31.67 30.45 1.22 43.42 Northstar6/5/2015 74.1 31.85 30.60 1.25 43.27 Northstar
6/12/2015 74.1 31.28 30.75 0.53 43.25 Northstar6/19/2015 74.1 31.30 31.00 0.30 43.04 Northstar6/26/2015 74.1 31.20 29.50 1.70 44.29 Northstar8/11/2015 74.1 36.90 29.90 7.00 42.91 Northstar8/18/2015 74.1 35.19 30.25 4.94 42.94 Northstar8/28/2015 74.1 31.60 30.75 0.85 43.19 KMEP
MW-SF-10 10/17/2008 76.53 27.49 --- --- 49.04 Envent10/19/2009 76.53 28.61 --- --- 47.92 Blaine Tech10/4/2010 76.53 28.50 28.36 0.14 48.14 Blaine Tech4/11/2011 76.53 27.41 27.37 0.04 49.15 Blaine Tech
EN1014151027SCO Page 18 of 23
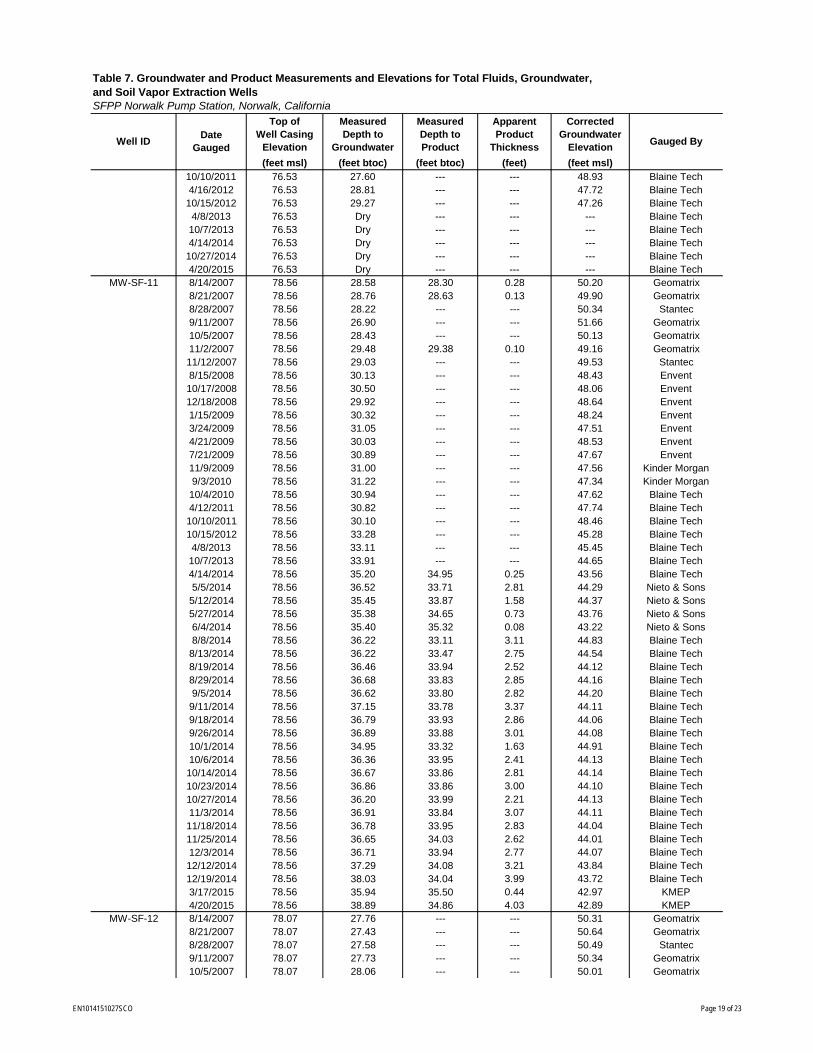
(feet msl) (feet btoc) (feet btoc) (feet) (feet msl)
Gauged By
Table 7. Groundwater and Product Measurements and Elevations for Total Fluids, Groundwater, and Soil Vapor Extraction WellsSFPP Norwalk Pump Station, Norwalk, California
Well IDDate
Gauged
Top of Well Casing
Elevation
Measured Depth to
Groundwater
Measured Depth to Product
Apparent Product
Thickness
Corrected Groundwater
Elevation
10/10/2011 76.53 27.60 --- --- 48.93 Blaine Tech4/16/2012 76.53 28.81 --- --- 47.72 Blaine Tech
10/15/2012 76.53 29.27 --- --- 47.26 Blaine Tech4/8/2013 76.53 Dry --- --- --- Blaine Tech10/7/2013 76.53 Dry --- --- --- Blaine Tech4/14/2014 76.53 Dry --- --- --- Blaine Tech
10/27/2014 76.53 Dry --- --- --- Blaine Tech4/20/2015 76.53 Dry --- --- --- Blaine Tech
MW-SF-11 8/14/2007 78.56 28.58 28.30 0.28 50.20 Geomatrix8/21/2007 78.56 28.76 28.63 0.13 49.90 Geomatrix8/28/2007 78.56 28.22 --- --- 50.34 Stantec9/11/2007 78.56 26.90 --- --- 51.66 Geomatrix10/5/2007 78.56 28.43 --- --- 50.13 Geomatrix11/2/2007 78.56 29.48 29.38 0.10 49.16 Geomatrix11/12/2007 78.56 29.03 --- --- 49.53 Stantec8/15/2008 78.56 30.13 --- --- 48.43 Envent10/17/2008 78.56 30.50 --- --- 48.06 Envent12/18/2008 78.56 29.92 --- --- 48.64 Envent1/15/2009 78.56 30.32 --- --- 48.24 Envent3/24/2009 78.56 31.05 --- --- 47.51 Envent4/21/2009 78.56 30.03 --- --- 48.53 Envent7/21/2009 78.56 30.89 --- --- 47.67 Envent11/9/2009 78.56 31.00 --- --- 47.56 Kinder Morgan9/3/2010 78.56 31.22 --- --- 47.34 Kinder Morgan
10/4/2010 78.56 30.94 --- --- 47.62 Blaine Tech4/12/2011 78.56 30.82 --- --- 47.74 Blaine Tech10/10/2011 78.56 30.10 --- --- 48.46 Blaine Tech10/15/2012 78.56 33.28 --- --- 45.28 Blaine Tech4/8/2013 78.56 33.11 --- --- 45.45 Blaine Tech10/7/2013 78.56 33.91 --- --- 44.65 Blaine Tech4/14/2014 78.56 35.20 34.95 0.25 43.56 Blaine Tech5/5/2014 78.56 36.52 33.71 2.81 44.29 Nieto & Sons
5/12/2014 78.56 35.45 33.87 1.58 44.37 Nieto & Sons5/27/2014 78.56 35.38 34.65 0.73 43.76 Nieto & Sons6/4/2014 78.56 35.40 35.32 0.08 43.22 Nieto & Sons8/8/2014 78.56 36.22 33.11 3.11 44.83 Blaine Tech
8/13/2014 78.56 36.22 33.47 2.75 44.54 Blaine Tech8/19/2014 78.56 36.46 33.94 2.52 44.12 Blaine Tech8/29/2014 78.56 36.68 33.83 2.85 44.16 Blaine Tech9/5/2014 78.56 36.62 33.80 2.82 44.20 Blaine Tech
9/11/2014 78.56 37.15 33.78 3.37 44.11 Blaine Tech9/18/2014 78.56 36.79 33.93 2.86 44.06 Blaine Tech9/26/2014 78.56 36.89 33.88 3.01 44.08 Blaine Tech10/1/2014 78.56 34.95 33.32 1.63 44.91 Blaine Tech10/6/2014 78.56 36.36 33.95 2.41 44.13 Blaine Tech10/14/2014 78.56 36.67 33.86 2.81 44.14 Blaine Tech10/23/2014 78.56 36.86 33.86 3.00 44.10 Blaine Tech10/27/2014 78.56 36.20 33.99 2.21 44.13 Blaine Tech11/3/2014 78.56 36.91 33.84 3.07 44.11 Blaine Tech11/18/2014 78.56 36.78 33.95 2.83 44.04 Blaine Tech11/25/2014 78.56 36.65 34.03 2.62 44.01 Blaine Tech12/3/2014 78.56 36.71 33.94 2.77 44.07 Blaine Tech12/12/2014 78.56 37.29 34.08 3.21 43.84 Blaine Tech12/19/2014 78.56 38.03 34.04 3.99 43.72 Blaine Tech3/17/2015 78.56 35.94 35.50 0.44 42.97 KMEP4/20/2015 78.56 38.89 34.86 4.03 42.89 KMEP
MW-SF-12 8/14/2007 78.07 27.76 --- --- 50.31 Geomatrix8/21/2007 78.07 27.43 --- --- 50.64 Geomatrix8/28/2007 78.07 27.58 --- --- 50.49 Stantec9/11/2007 78.07 27.73 --- --- 50.34 Geomatrix10/5/2007 78.07 28.06 --- --- 50.01 Geomatrix
EN1014151027SCO Page 19 of 23
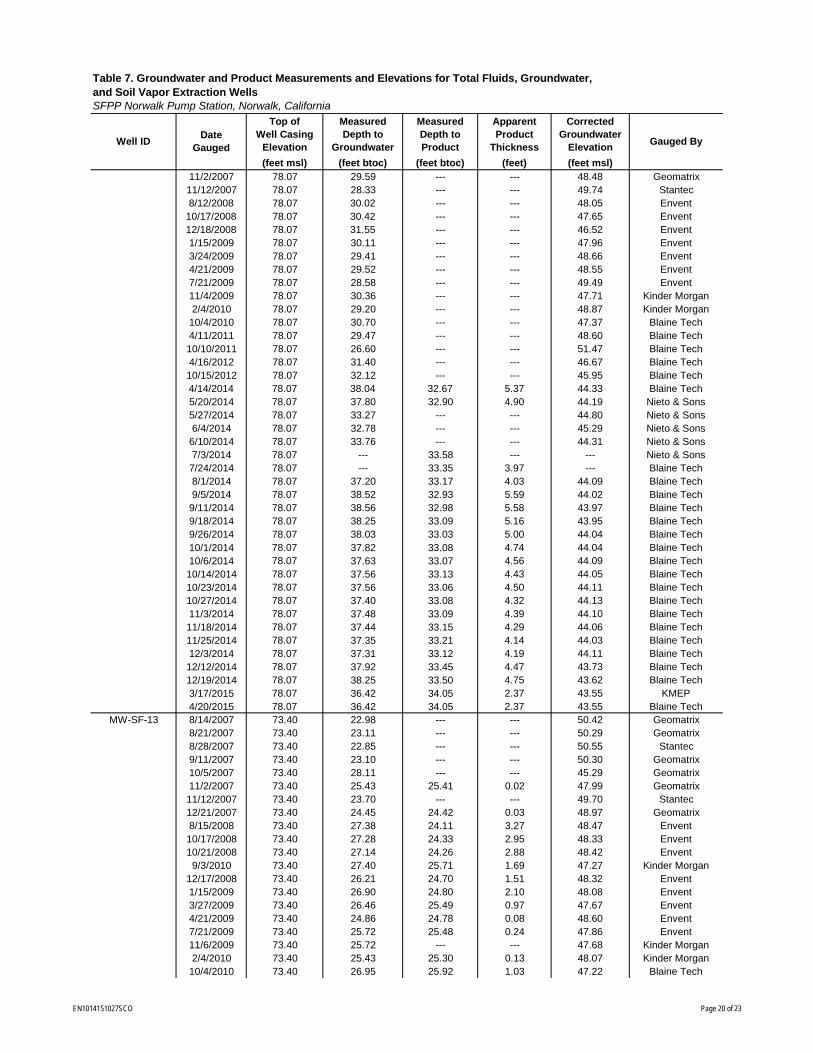
(feet msl) (feet btoc) (feet btoc) (feet) (feet msl)
Gauged By
Table 7. Groundwater and Product Measurements and Elevations for Total Fluids, Groundwater, and Soil Vapor Extraction WellsSFPP Norwalk Pump Station, Norwalk, California
Well IDDate
Gauged
Top of Well Casing
Elevation
Measured Depth to
Groundwater
Measured Depth to Product
Apparent Product
Thickness
Corrected Groundwater
Elevation
11/2/2007 78.07 29.59 --- --- 48.48 Geomatrix11/12/2007 78.07 28.33 --- --- 49.74 Stantec8/12/2008 78.07 30.02 --- --- 48.05 Envent
10/17/2008 78.07 30.42 --- --- 47.65 Envent12/18/2008 78.07 31.55 --- --- 46.52 Envent1/15/2009 78.07 30.11 --- --- 47.96 Envent3/24/2009 78.07 29.41 --- --- 48.66 Envent4/21/2009 78.07 29.52 --- --- 48.55 Envent7/21/2009 78.07 28.58 --- --- 49.49 Envent11/4/2009 78.07 30.36 --- --- 47.71 Kinder Morgan2/4/2010 78.07 29.20 --- --- 48.87 Kinder Morgan
10/4/2010 78.07 30.70 --- --- 47.37 Blaine Tech4/11/2011 78.07 29.47 --- --- 48.60 Blaine Tech10/10/2011 78.07 26.60 --- --- 51.47 Blaine Tech4/16/2012 78.07 31.40 --- --- 46.67 Blaine Tech10/15/2012 78.07 32.12 --- --- 45.95 Blaine Tech4/14/2014 78.07 38.04 32.67 5.37 44.33 Blaine Tech5/20/2014 78.07 37.80 32.90 4.90 44.19 Nieto & Sons5/27/2014 78.07 33.27 --- --- 44.80 Nieto & Sons6/4/2014 78.07 32.78 --- --- 45.29 Nieto & Sons
6/10/2014 78.07 33.76 --- --- 44.31 Nieto & Sons7/3/2014 78.07 --- 33.58 --- --- Nieto & Sons
7/24/2014 78.07 --- 33.35 3.97 --- Blaine Tech8/1/2014 78.07 37.20 33.17 4.03 44.09 Blaine Tech9/5/2014 78.07 38.52 32.93 5.59 44.02 Blaine Tech
9/11/2014 78.07 38.56 32.98 5.58 43.97 Blaine Tech9/18/2014 78.07 38.25 33.09 5.16 43.95 Blaine Tech9/26/2014 78.07 38.03 33.03 5.00 44.04 Blaine Tech10/1/2014 78.07 37.82 33.08 4.74 44.04 Blaine Tech10/6/2014 78.07 37.63 33.07 4.56 44.09 Blaine Tech10/14/2014 78.07 37.56 33.13 4.43 44.05 Blaine Tech10/23/2014 78.07 37.56 33.06 4.50 44.11 Blaine Tech10/27/2014 78.07 37.40 33.08 4.32 44.13 Blaine Tech11/3/2014 78.07 37.48 33.09 4.39 44.10 Blaine Tech11/18/2014 78.07 37.44 33.15 4.29 44.06 Blaine Tech11/25/2014 78.07 37.35 33.21 4.14 44.03 Blaine Tech12/3/2014 78.07 37.31 33.12 4.19 44.11 Blaine Tech12/12/2014 78.07 37.92 33.45 4.47 43.73 Blaine Tech12/19/2014 78.07 38.25 33.50 4.75 43.62 Blaine Tech3/17/2015 78.07 36.42 34.05 2.37 43.55 KMEP4/20/2015 78.07 36.42 34.05 2.37 43.55 Blaine Tech
MW-SF-13 8/14/2007 73.40 22.98 --- --- 50.42 Geomatrix8/21/2007 73.40 23.11 --- --- 50.29 Geomatrix8/28/2007 73.40 22.85 --- --- 50.55 Stantec9/11/2007 73.40 23.10 --- --- 50.30 Geomatrix10/5/2007 73.40 28.11 --- --- 45.29 Geomatrix11/2/2007 73.40 25.43 25.41 0.02 47.99 Geomatrix11/12/2007 73.40 23.70 --- --- 49.70 Stantec12/21/2007 73.40 24.45 24.42 0.03 48.97 Geomatrix8/15/2008 73.40 27.38 24.11 3.27 48.47 Envent10/17/2008 73.40 27.28 24.33 2.95 48.33 Envent10/21/2008 73.40 27.14 24.26 2.88 48.42 Envent9/3/2010 73.40 27.40 25.71 1.69 47.27 Kinder Morgan
12/17/2008 73.40 26.21 24.70 1.51 48.32 Envent1/15/2009 73.40 26.90 24.80 2.10 48.08 Envent3/27/2009 73.40 26.46 25.49 0.97 47.67 Envent4/21/2009 73.40 24.86 24.78 0.08 48.60 Envent7/21/2009 73.40 25.72 25.48 0.24 47.86 Envent11/6/2009 73.40 25.72 --- --- 47.68 Kinder Morgan2/4/2010 73.40 25.43 25.30 0.13 48.07 Kinder Morgan
10/4/2010 73.40 26.95 25.92 1.03 47.22 Blaine Tech
EN1014151027SCO Page 20 of 23
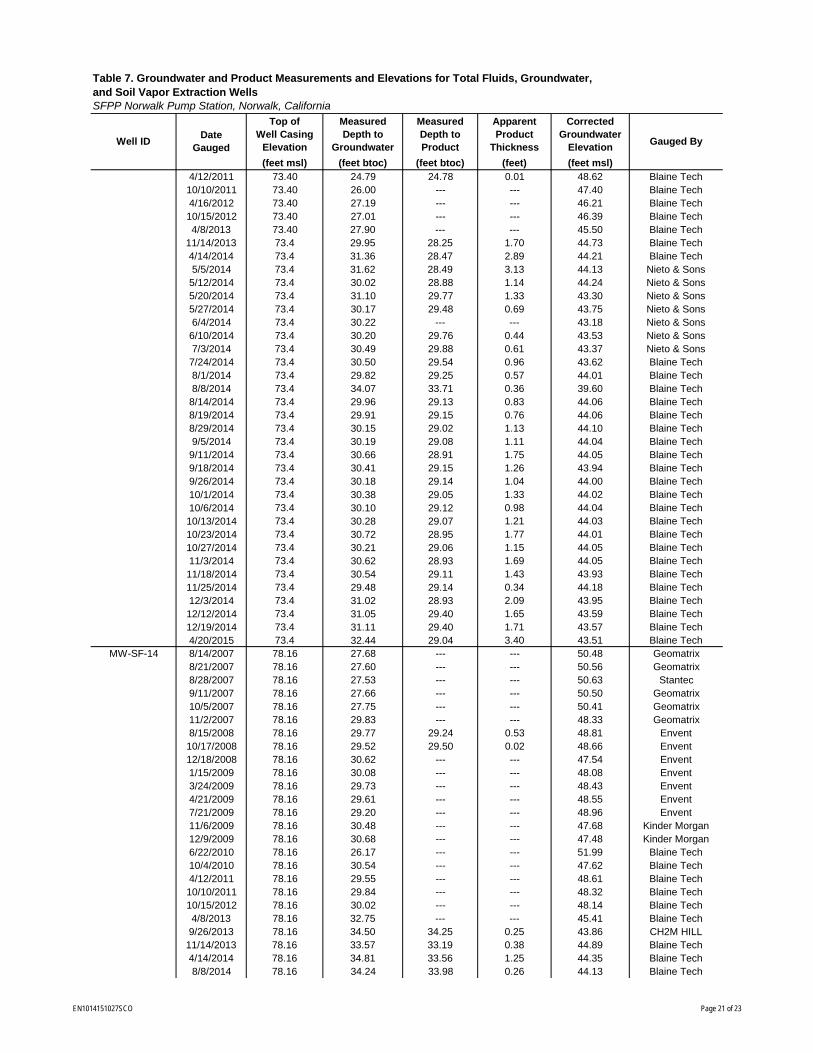
(feet msl) (feet btoc) (feet btoc) (feet) (feet msl)
Gauged By
Table 7. Groundwater and Product Measurements and Elevations for Total Fluids, Groundwater, and Soil Vapor Extraction WellsSFPP Norwalk Pump Station, Norwalk, California
Well IDDate
Gauged
Top of Well Casing
Elevation
Measured Depth to
Groundwater
Measured Depth to Product
Apparent Product
Thickness
Corrected Groundwater
Elevation
4/12/2011 73.40 24.79 24.78 0.01 48.62 Blaine Tech10/10/2011 73.40 26.00 --- --- 47.40 Blaine Tech4/16/2012 73.40 27.19 --- --- 46.21 Blaine Tech10/15/2012 73.40 27.01 --- --- 46.39 Blaine Tech4/8/2013 73.40 27.90 --- --- 45.50 Blaine Tech
11/14/2013 73.4 29.95 28.25 1.70 44.73 Blaine Tech4/14/2014 73.4 31.36 28.47 2.89 44.21 Blaine Tech5/5/2014 73.4 31.62 28.49 3.13 44.13 Nieto & Sons
5/12/2014 73.4 30.02 28.88 1.14 44.24 Nieto & Sons5/20/2014 73.4 31.10 29.77 1.33 43.30 Nieto & Sons5/27/2014 73.4 30.17 29.48 0.69 43.75 Nieto & Sons6/4/2014 73.4 30.22 --- --- 43.18 Nieto & Sons
6/10/2014 73.4 30.20 29.76 0.44 43.53 Nieto & Sons7/3/2014 73.4 30.49 29.88 0.61 43.37 Nieto & Sons
7/24/2014 73.4 30.50 29.54 0.96 43.62 Blaine Tech8/1/2014 73.4 29.82 29.25 0.57 44.01 Blaine Tech8/8/2014 73.4 34.07 33.71 0.36 39.60 Blaine Tech
8/14/2014 73.4 29.96 29.13 0.83 44.06 Blaine Tech8/19/2014 73.4 29.91 29.15 0.76 44.06 Blaine Tech8/29/2014 73.4 30.15 29.02 1.13 44.10 Blaine Tech9/5/2014 73.4 30.19 29.08 1.11 44.04 Blaine Tech
9/11/2014 73.4 30.66 28.91 1.75 44.05 Blaine Tech9/18/2014 73.4 30.41 29.15 1.26 43.94 Blaine Tech9/26/2014 73.4 30.18 29.14 1.04 44.00 Blaine Tech10/1/2014 73.4 30.38 29.05 1.33 44.02 Blaine Tech10/6/2014 73.4 30.10 29.12 0.98 44.04 Blaine Tech10/13/2014 73.4 30.28 29.07 1.21 44.03 Blaine Tech10/23/2014 73.4 30.72 28.95 1.77 44.01 Blaine Tech10/27/2014 73.4 30.21 29.06 1.15 44.05 Blaine Tech11/3/2014 73.4 30.62 28.93 1.69 44.05 Blaine Tech11/18/2014 73.4 30.54 29.11 1.43 43.93 Blaine Tech11/25/2014 73.4 29.48 29.14 0.34 44.18 Blaine Tech12/3/2014 73.4 31.02 28.93 2.09 43.95 Blaine Tech12/12/2014 73.4 31.05 29.40 1.65 43.59 Blaine Tech12/19/2014 73.4 31.11 29.40 1.71 43.57 Blaine Tech4/20/2015 73.4 32.44 29.04 3.40 43.51 Blaine Tech
MW-SF-14 8/14/2007 78.16 27.68 --- --- 50.48 Geomatrix8/21/2007 78.16 27.60 --- --- 50.56 Geomatrix8/28/2007 78.16 27.53 --- --- 50.63 Stantec9/11/2007 78.16 27.66 --- --- 50.50 Geomatrix10/5/2007 78.16 27.75 --- --- 50.41 Geomatrix11/2/2007 78.16 29.83 --- --- 48.33 Geomatrix8/15/2008 78.16 29.77 29.24 0.53 48.81 Envent10/17/2008 78.16 29.52 29.50 0.02 48.66 Envent12/18/2008 78.16 30.62 --- --- 47.54 Envent1/15/2009 78.16 30.08 --- --- 48.08 Envent3/24/2009 78.16 29.73 --- --- 48.43 Envent4/21/2009 78.16 29.61 --- --- 48.55 Envent7/21/2009 78.16 29.20 --- --- 48.96 Envent11/6/2009 78.16 30.48 --- --- 47.68 Kinder Morgan12/9/2009 78.16 30.68 --- --- 47.48 Kinder Morgan6/22/2010 78.16 26.17 --- --- 51.99 Blaine Tech10/4/2010 78.16 30.54 --- --- 47.62 Blaine Tech4/12/2011 78.16 29.55 --- --- 48.61 Blaine Tech10/10/2011 78.16 29.84 --- --- 48.32 Blaine Tech10/15/2012 78.16 30.02 --- --- 48.14 Blaine Tech4/8/2013 78.16 32.75 --- --- 45.41 Blaine Tech9/26/2013 78.16 34.50 34.25 0.25 43.86 CH2M HILL
11/14/2013 78.16 33.57 33.19 0.38 44.89 Blaine Tech4/14/2014 78.16 34.81 33.56 1.25 44.35 Blaine Tech8/8/2014 78.16 34.24 33.98 0.26 44.13 Blaine Tech
EN1014151027SCO Page 21 of 23
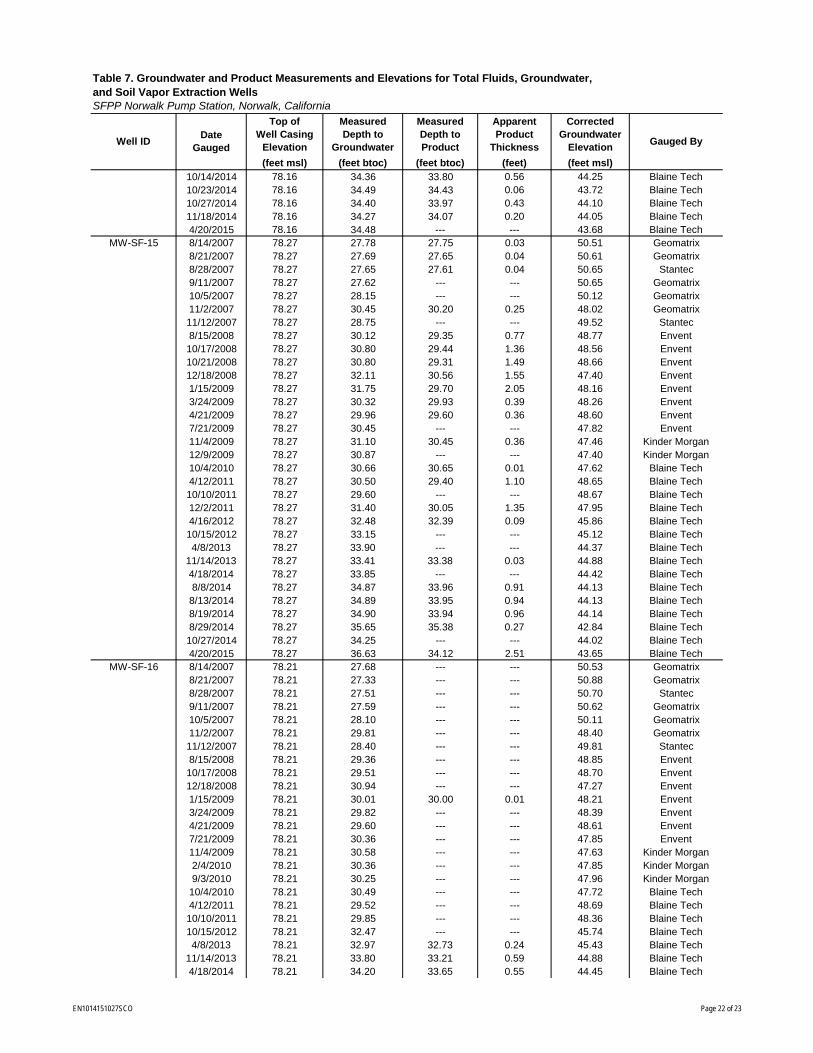
(feet msl) (feet btoc) (feet btoc) (feet) (feet msl)
Gauged By
Table 7. Groundwater and Product Measurements and Elevations for Total Fluids, Groundwater, and Soil Vapor Extraction WellsSFPP Norwalk Pump Station, Norwalk, California
Well IDDate
Gauged
Top of Well Casing
Elevation
Measured Depth to
Groundwater
Measured Depth to Product
Apparent Product
Thickness
Corrected Groundwater
Elevation
10/14/2014 78.16 34.36 33.80 0.56 44.25 Blaine Tech10/23/2014 78.16 34.49 34.43 0.06 43.72 Blaine Tech10/27/2014 78.16 34.40 33.97 0.43 44.10 Blaine Tech11/18/2014 78.16 34.27 34.07 0.20 44.05 Blaine Tech4/20/2015 78.16 34.48 --- --- 43.68 Blaine Tech
MW-SF-15 8/14/2007 78.27 27.78 27.75 0.03 50.51 Geomatrix8/21/2007 78.27 27.69 27.65 0.04 50.61 Geomatrix8/28/2007 78.27 27.65 27.61 0.04 50.65 Stantec9/11/2007 78.27 27.62 --- --- 50.65 Geomatrix10/5/2007 78.27 28.15 --- --- 50.12 Geomatrix11/2/2007 78.27 30.45 30.20 0.25 48.02 Geomatrix11/12/2007 78.27 28.75 --- --- 49.52 Stantec8/15/2008 78.27 30.12 29.35 0.77 48.77 Envent10/17/2008 78.27 30.80 29.44 1.36 48.56 Envent10/21/2008 78.27 30.80 29.31 1.49 48.66 Envent12/18/2008 78.27 32.11 30.56 1.55 47.40 Envent1/15/2009 78.27 31.75 29.70 2.05 48.16 Envent3/24/2009 78.27 30.32 29.93 0.39 48.26 Envent4/21/2009 78.27 29.96 29.60 0.36 48.60 Envent7/21/2009 78.27 30.45 --- --- 47.82 Envent11/4/2009 78.27 31.10 30.45 0.36 47.46 Kinder Morgan12/9/2009 78.27 30.87 --- --- 47.40 Kinder Morgan10/4/2010 78.27 30.66 30.65 0.01 47.62 Blaine Tech4/12/2011 78.27 30.50 29.40 1.10 48.65 Blaine Tech10/10/2011 78.27 29.60 --- --- 48.67 Blaine Tech12/2/2011 78.27 31.40 30.05 1.35 47.95 Blaine Tech4/16/2012 78.27 32.48 32.39 0.09 45.86 Blaine Tech10/15/2012 78.27 33.15 --- --- 45.12 Blaine Tech4/8/2013 78.27 33.90 --- --- 44.37 Blaine Tech
11/14/2013 78.27 33.41 33.38 0.03 44.88 Blaine Tech4/18/2014 78.27 33.85 --- --- 44.42 Blaine Tech8/8/2014 78.27 34.87 33.96 0.91 44.13 Blaine Tech
8/13/2014 78.27 34.89 33.95 0.94 44.13 Blaine Tech8/19/2014 78.27 34.90 33.94 0.96 44.14 Blaine Tech8/29/2014 78.27 35.65 35.38 0.27 42.84 Blaine Tech10/27/2014 78.27 34.25 --- --- 44.02 Blaine Tech4/20/2015 78.27 36.63 34.12 2.51 43.65 Blaine Tech
MW-SF-16 8/14/2007 78.21 27.68 --- --- 50.53 Geomatrix8/21/2007 78.21 27.33 --- --- 50.88 Geomatrix8/28/2007 78.21 27.51 --- --- 50.70 Stantec9/11/2007 78.21 27.59 --- --- 50.62 Geomatrix10/5/2007 78.21 28.10 --- --- 50.11 Geomatrix11/2/2007 78.21 29.81 --- --- 48.40 Geomatrix11/12/2007 78.21 28.40 --- --- 49.81 Stantec8/15/2008 78.21 29.36 --- --- 48.85 Envent10/17/2008 78.21 29.51 --- --- 48.70 Envent12/18/2008 78.21 30.94 --- --- 47.27 Envent1/15/2009 78.21 30.01 30.00 0.01 48.21 Envent3/24/2009 78.21 29.82 --- --- 48.39 Envent4/21/2009 78.21 29.60 --- --- 48.61 Envent7/21/2009 78.21 30.36 --- --- 47.85 Envent11/4/2009 78.21 30.58 --- --- 47.63 Kinder Morgan2/4/2010 78.21 30.36 --- --- 47.85 Kinder Morgan9/3/2010 78.21 30.25 --- --- 47.96 Kinder Morgan
10/4/2010 78.21 30.49 --- --- 47.72 Blaine Tech4/12/2011 78.21 29.52 --- --- 48.69 Blaine Tech10/10/2011 78.21 29.85 --- --- 48.36 Blaine Tech10/15/2012 78.21 32.47 --- --- 45.74 Blaine Tech4/8/2013 78.21 32.97 32.73 0.24 45.43 Blaine Tech
11/14/2013 78.21 33.80 33.21 0.59 44.88 Blaine Tech4/18/2014 78.21 34.20 33.65 0.55 44.45 Blaine Tech
EN1014151027SCO Page 22 of 23
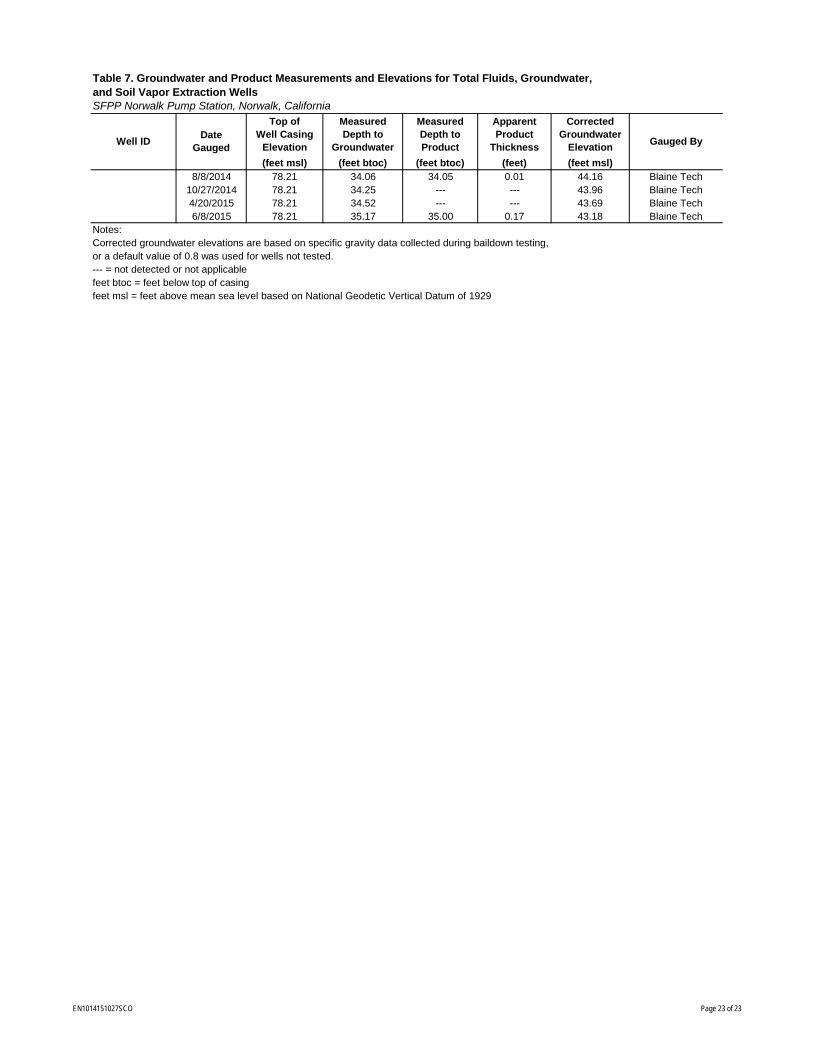
(feet msl) (feet btoc) (feet btoc) (feet) (feet msl)
Gauged By
Table 7. Groundwater and Product Measurements and Elevations for Total Fluids, Groundwater, and Soil Vapor Extraction WellsSFPP Norwalk Pump Station, Norwalk, California
Well IDDate
Gauged
Top of Well Casing
Elevation
Measured Depth to
Groundwater
Measured Depth to Product
Apparent Product
Thickness
Corrected Groundwater
Elevation
8/8/2014 78.21 34.06 34.05 0.01 44.16 Blaine Tech10/27/2014 78.21 34.25 --- --- 43.96 Blaine Tech4/20/2015 78.21 34.52 --- --- 43.69 Blaine Tech6/8/2015 78.21 35.17 35.00 0.17 43.18 Blaine Tech
Notes:Corrected groundwater elevations are based on specific gravity data collected during baildown testing, or a default value of 0.8 was used for wells not tested. --- = not detected or not applicablefeet btoc = feet below top of casingfeet msl = feet above mean sea level based on National Geodetic Vertical Datum of 1929
EN1014151027SCO Page 23 of 23

Figures
EN1014151027SCO
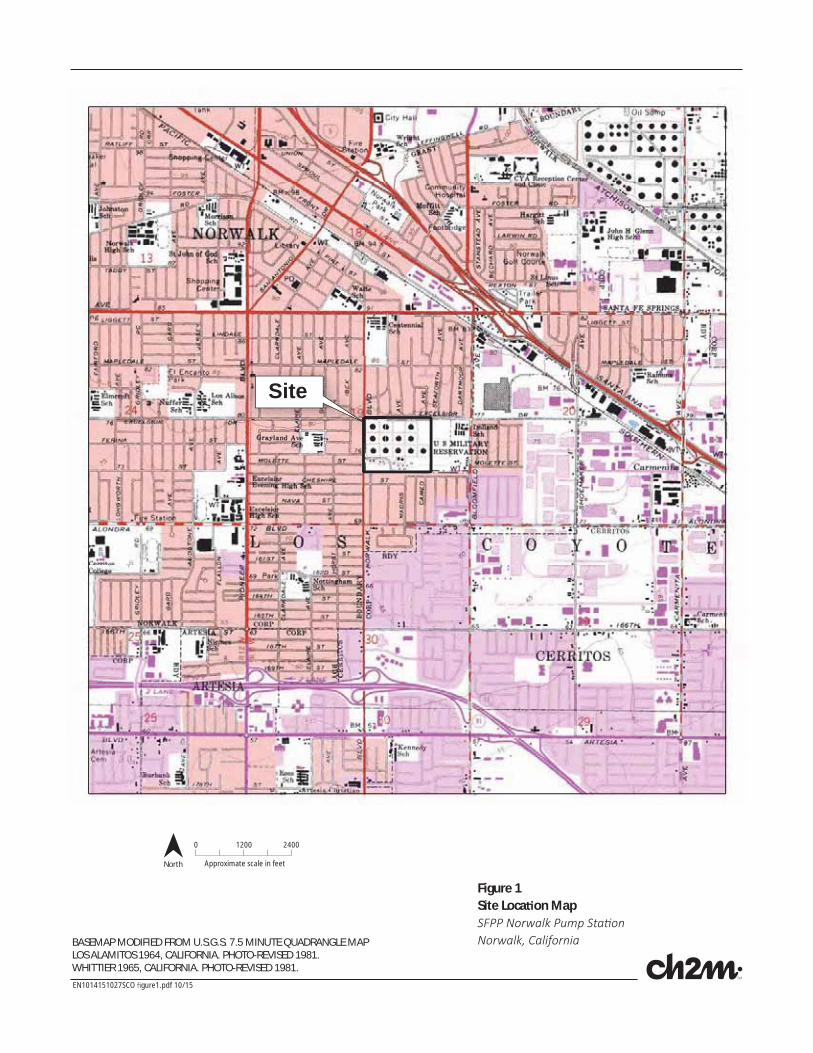
North
0 24001200
Approximate scale in feet
Figure 1Site Loca on Map
Site
EN1014151027SCO gure1.pdf 10/15
BASEMAP MODIFIED FROM U.S.G.S. 7.5 MINUTE QUADRANGLE MAPLOS ALAMITOS 1964, CALIFORNIA. PHOTO-REVISED 1981.WHITTIER 1965, CALIFORNIA. PHOTO-REVISED 1981.
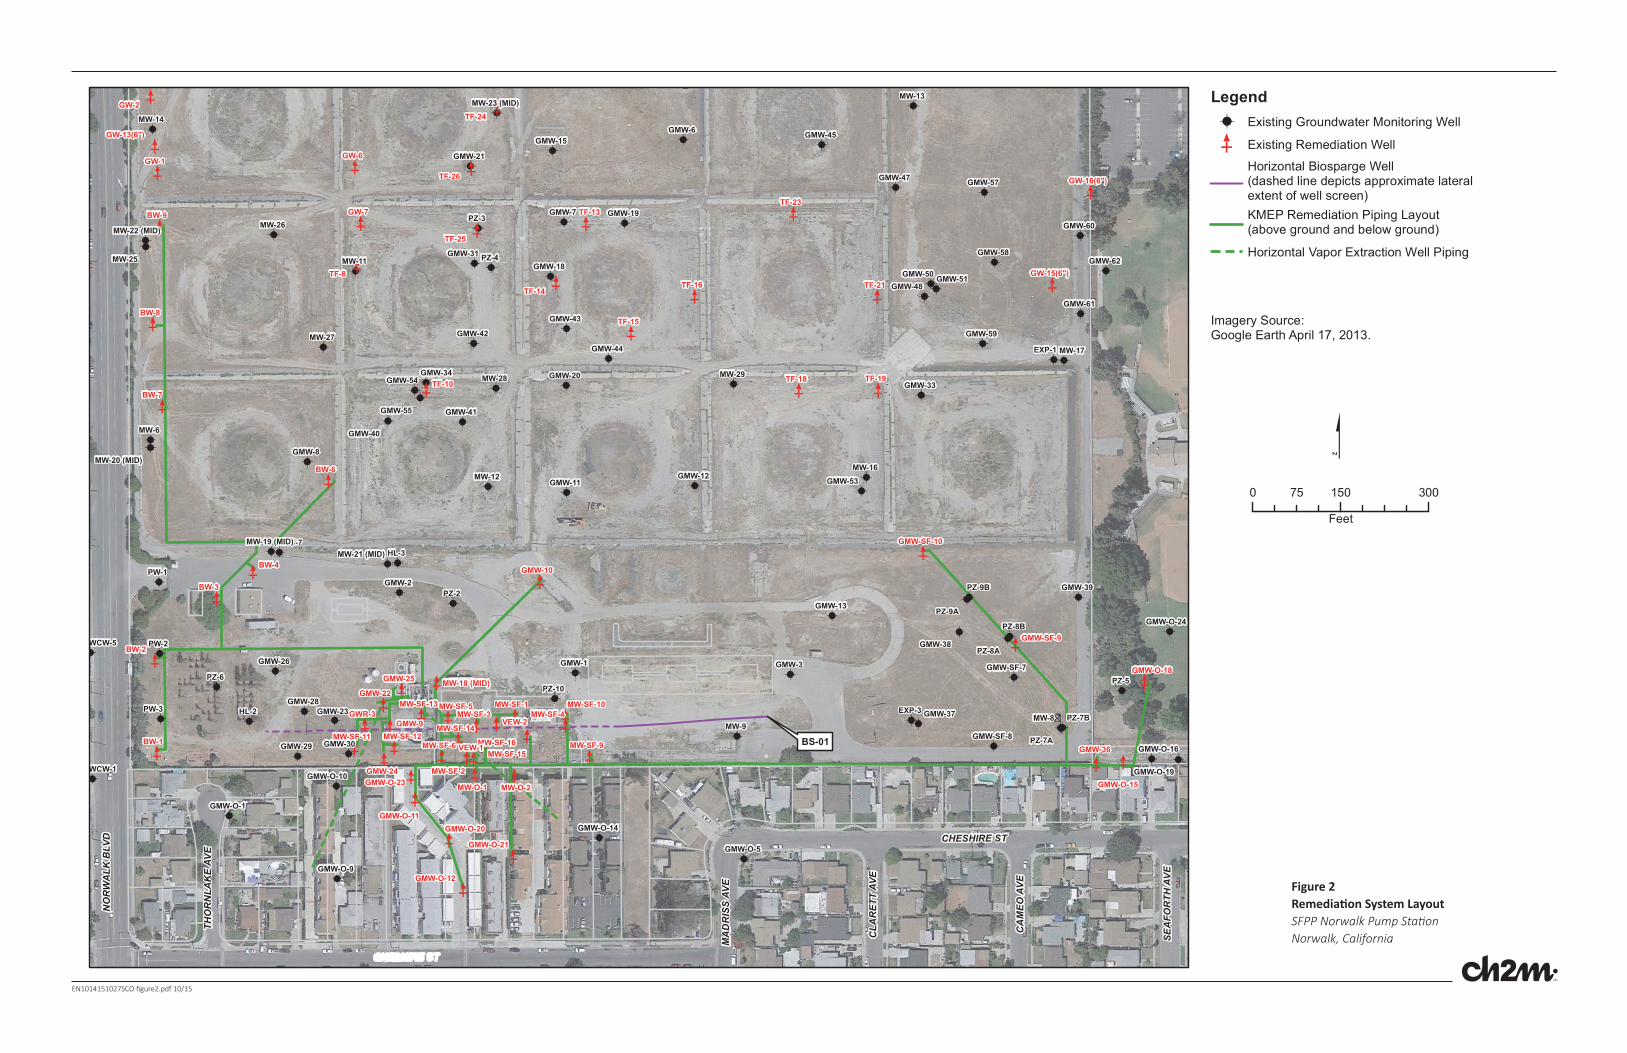
E
E
E
E
E
E
E
E
!A
!A
!A
!A
!A
!A
!A
!A
E
E
!A!A
!A
!A
!A
!A
!A
!A
E!A
E
E
!A
!A
!A !A
!A
!A!A
E
!A
!A
!A
!A !A
!A
!A
!A
!A
!A
!A!A!A
!A
!A!A
!A
!A
!A
!A
!A
!A
!A
A A !A
!A
!A
!A
E
E
!A
E!A
A
E
!A
E
E
E
E
E
!A
!A
E
E
E
E
E
E
E!A
!A
!A
!A
!A!A
!A
!A
!A
!A
!A
!A
E
!A
!A
!A
!A
!A
!A!A
!A
!A!A
E E
E
E
E EE
E E
E
E E
E
EE
E
!A
!A
!A
!A
!A
!A
!A!A
!A!A
!A
E
E
E
E
E
E
E E
E
E
E
E
E
E
E
!A
!A
!A
E
!A
!A!A!A
!A!ABS-01
PZ-6 PZ-5
PZ-4
PZ-3
PZ-2
PW-3
PW-2
PW-1
MW-9MW-8
MW-7
MW-6
HL-3
HL-2
PZ-7A
PZ-7B
PZ-8A
PZ-8B
WCW-5
WCW-1
PZ-10
PZ-9B
PZ-9A
MW-29MW-28
MW-27
MW-26
MW-25
MW-17
MW-16
MW-14
MW-13
MW-12
MW-11
GMW-8
GMW-7
GMW-6
GMW-3
GMW-2
GMW-1
EXP-3
EXP-1
GMW-62
GMW-61
GMW-60
GMW-59
GMW-58
GMW-57
GMW-55
GMW-54
GMW-53
GMW-51GMW-50GMW-48
GMW-47
GMW-45
GMW-44
GMW-43
GMW-42
GMW-41
GMW-40
GMW-39
GMW-38
GMW-37
GMW-34GMW-33
GMW-31
GMW-30GMW-29
GMW-28
GMW-26
GMW-23
GMW-21
GMW-20
GMW-19
GMW-18
GMW-15
GMW-13
GMW-12GMW-11
GMW-O-9
GMW-O-5
GMW-O-1
GMW-O-24
GMW-SF-8
GMW-SF-7
GMW-O-19
GMW-O-16
GMW-O-14
GMW-O-10
MW-23 (MID)
MW-22 (MID)
MW-21 (MID)
MW-20 (MID)
MW-19 (MID)
TF-8
GW-7
GW-6
GW-2
GW-1
BW-9
BW-8
BW-7
BW-6
BW-4
BW-3
BW-2
BW-1
VEW-2
TF-26
TF-25
TF-24
TF-23
TF-21
TF-19TF-18
TF-16
TF-15
TF-14
TF-13
TF-10
GMW-9
MW-O-2MW-O-1
GMW-36
GMW-25
GMW-24
GMW-22
GMW-10
MW-SF-9
MW-SF-5MW-SF-4
MW-SF-1
MW-SF-16MW-SF-15
MW-SF-12
MW-SF-10
GMW-SF-9
GMW-O-23
GMW-O-21
GMW-O-20
GMW-O-18
GMW-O-12
GMW-O-11
GW-16(6")
GW-15(6")
GW-13(6")
GMW-SF-10
MW-18 (MID)
VEW-1
GWR-3
MW-SF-6
MW-SF-3
MW-SF-2
MW-SF-14
MW-SF-13
MW-SF-11
GMW-O-15
NO
RW
ALK
BLV
D
CA
MEO
AVE
MA
DR
ISS
AVE
CLA
RET
T AV
E
SEA
FOR
TH A
VE
THO
RN
LAK
E AV
E
CHESHIRE ST
Legend!A Existing Groundwater Monitoring Well
E Existing Remediation Well
Horizontal Biosparge Well(dashed line depicts approximate lateralextent of well screen)KMEP Remediation Piping Layout(above ground and below ground)
Horizontal Vapor Extraction Well Piping
0 150 30075
Feet
$
Imagery Source:Google Earth April 17, 2013.
EN1014151027SCO figure2.pdf 10/15
Figure 2
Remedia on System Layout
SFPP Norwalk Pump Sta onNorwalk, California
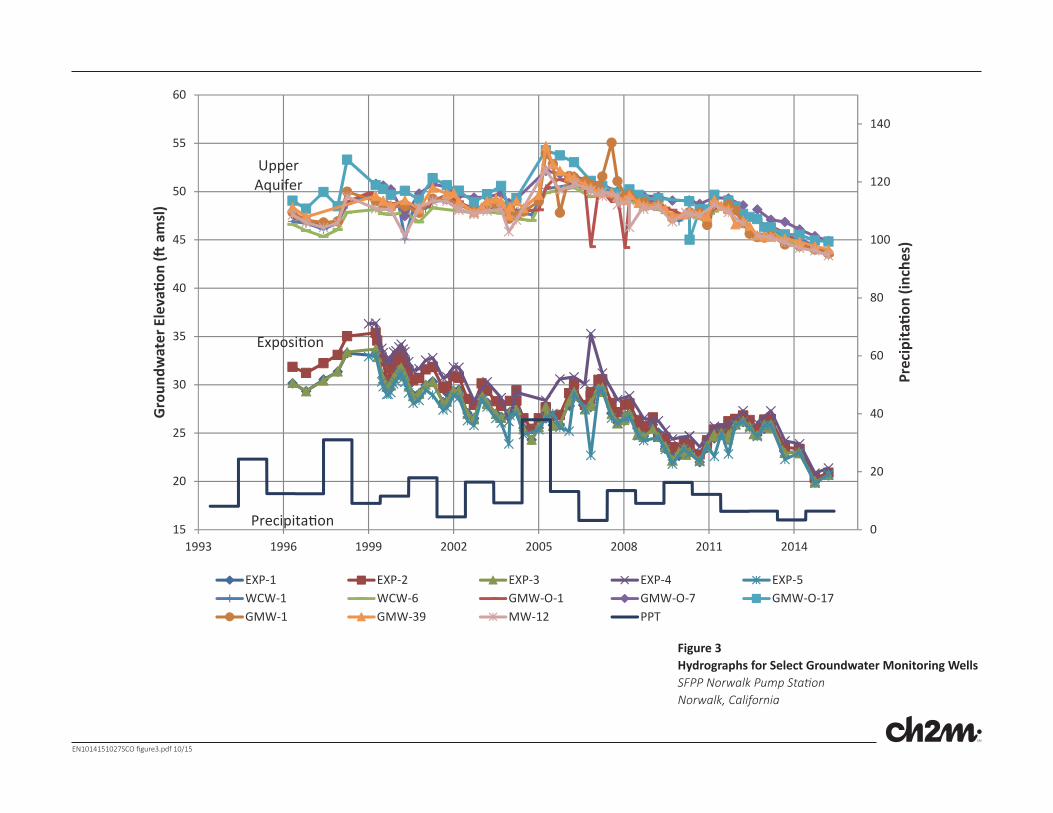
0
20
40
60
80
100
120
140
15
20
25
30
35
40
45
50
55
60
1993 1996 1999 2002 2005 2008 2011 2014
Pre
cip
ita
on
(in
che
s)
Gro
un
dw
ater
Ele
vao
n (
am
sl)
EXP-1 EXP-2 EXP-3 EXP-4 EXP-5
WCW-1 WCW-6 GMW-O-1 GMW-O-7 GMW-O-17
GMW-1 GMW-39 MW-12 PPT
Exposi on
UpperAquifer
Precipita on
Figure 3
Hydrographs for Select Groundwater Monitoring Wells
SFPP Norwalk Pump Sta onNorwalk, California
EN1014151027SCO figure3.pdf 10/15
Appendix A Laboratory Analytical Reports
EN1014151027SCO


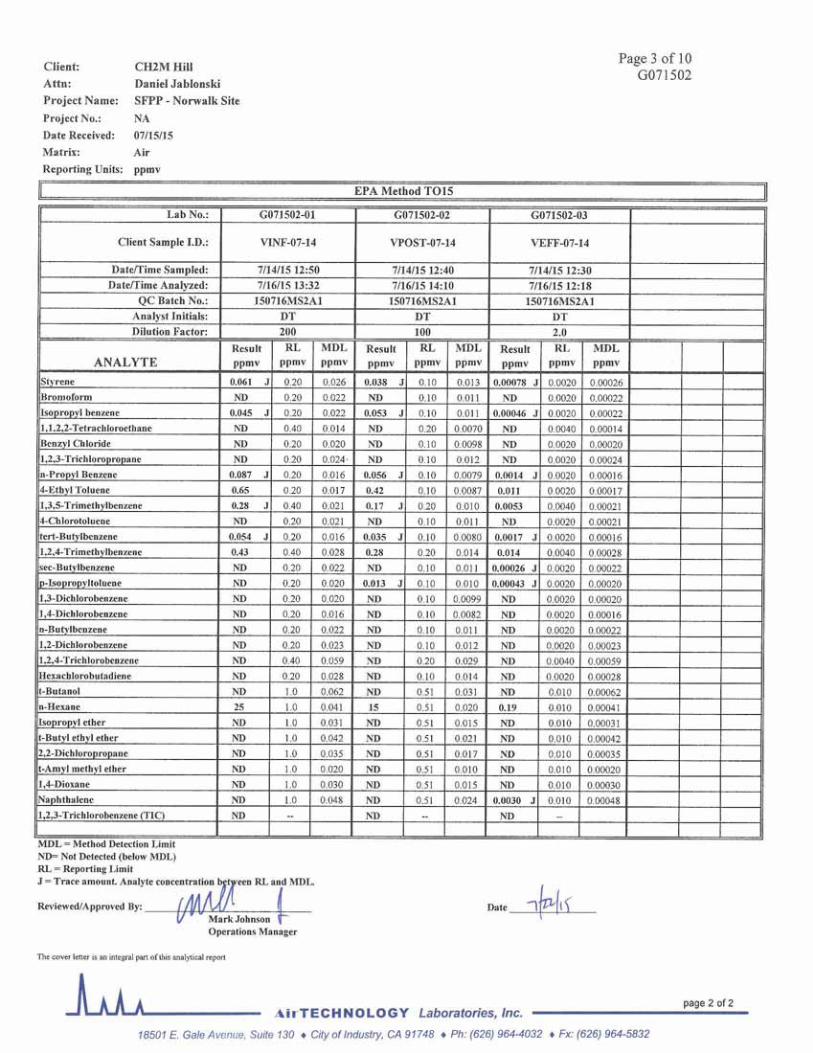
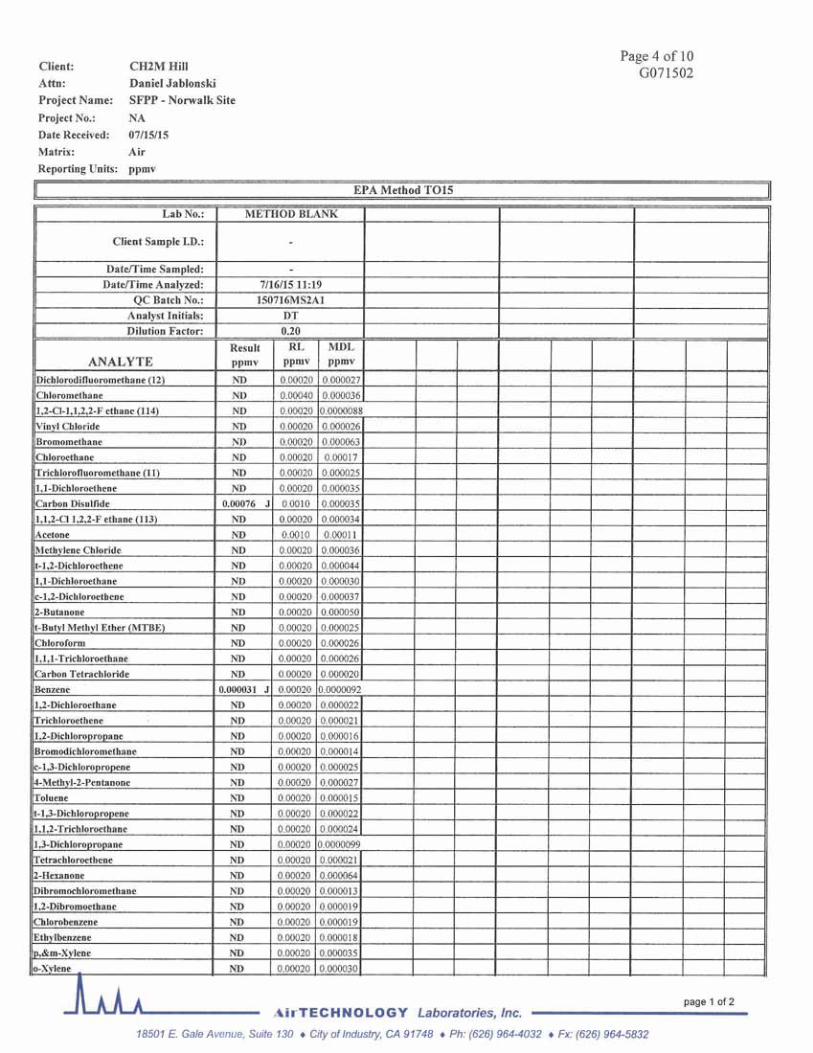
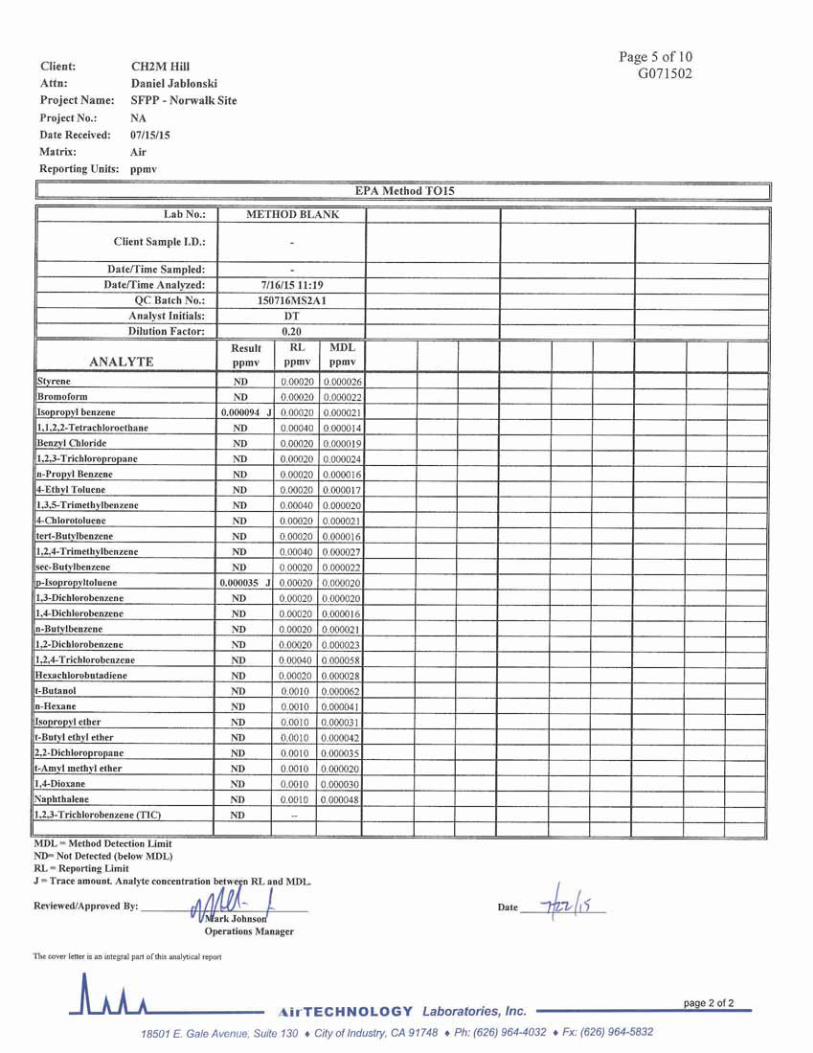
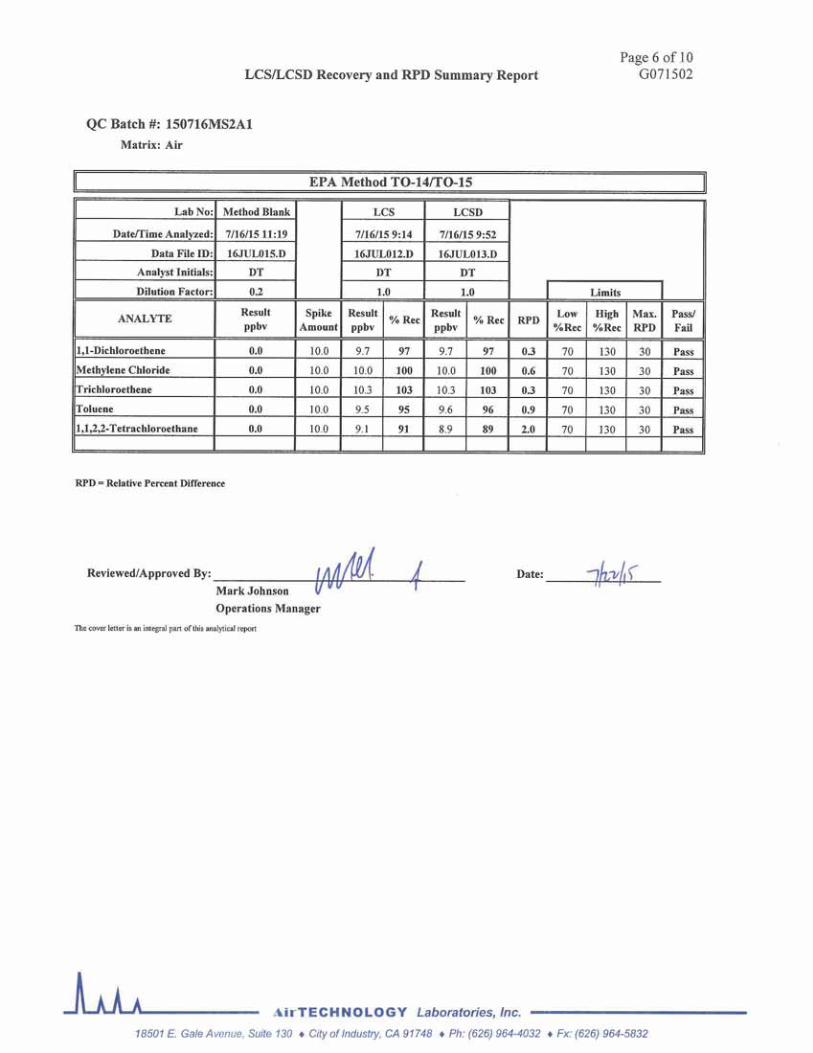
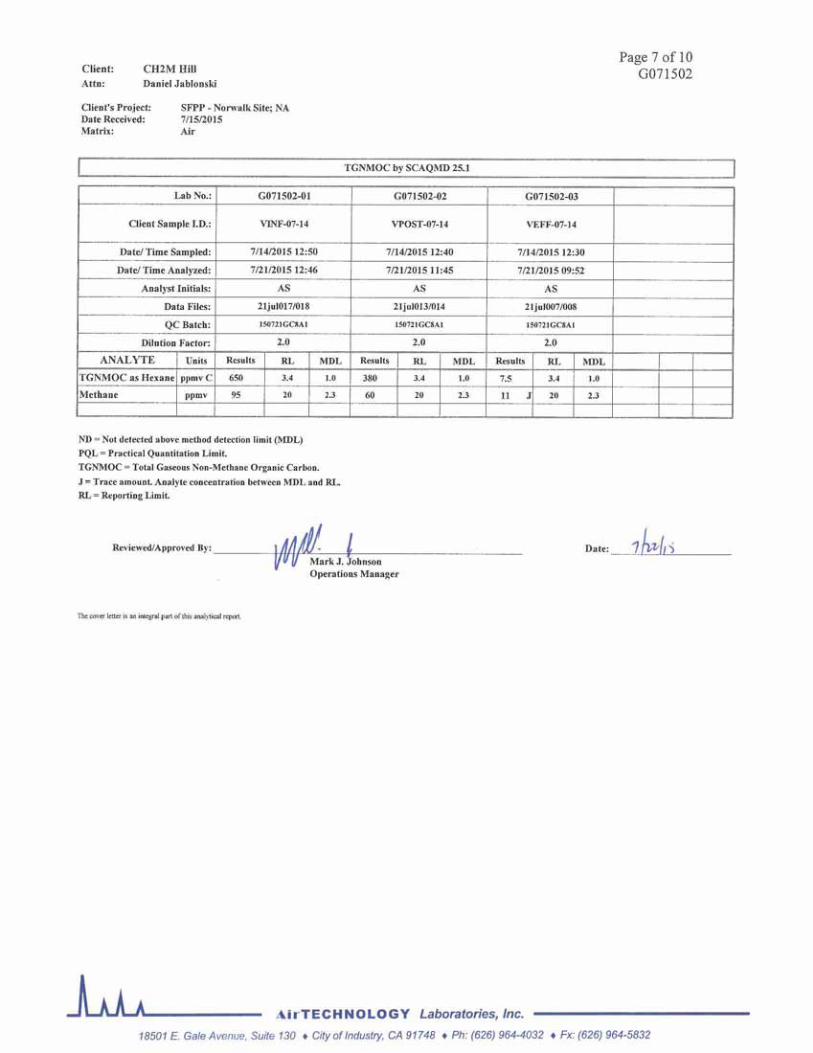
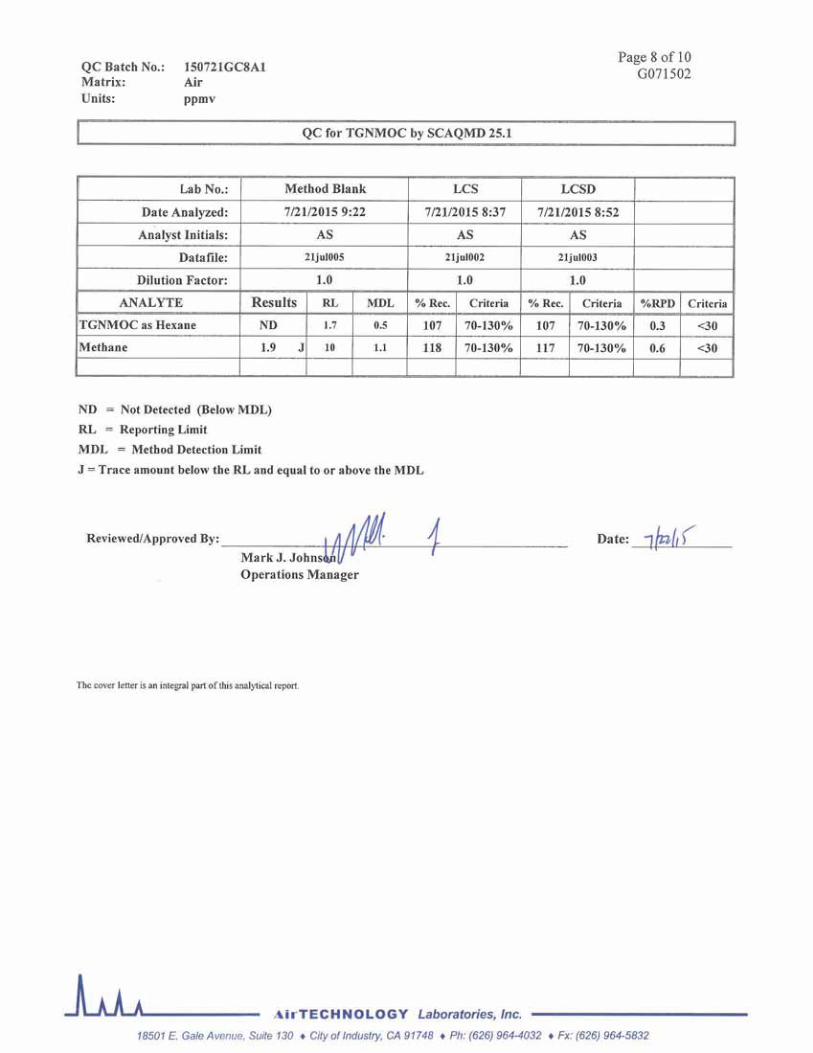
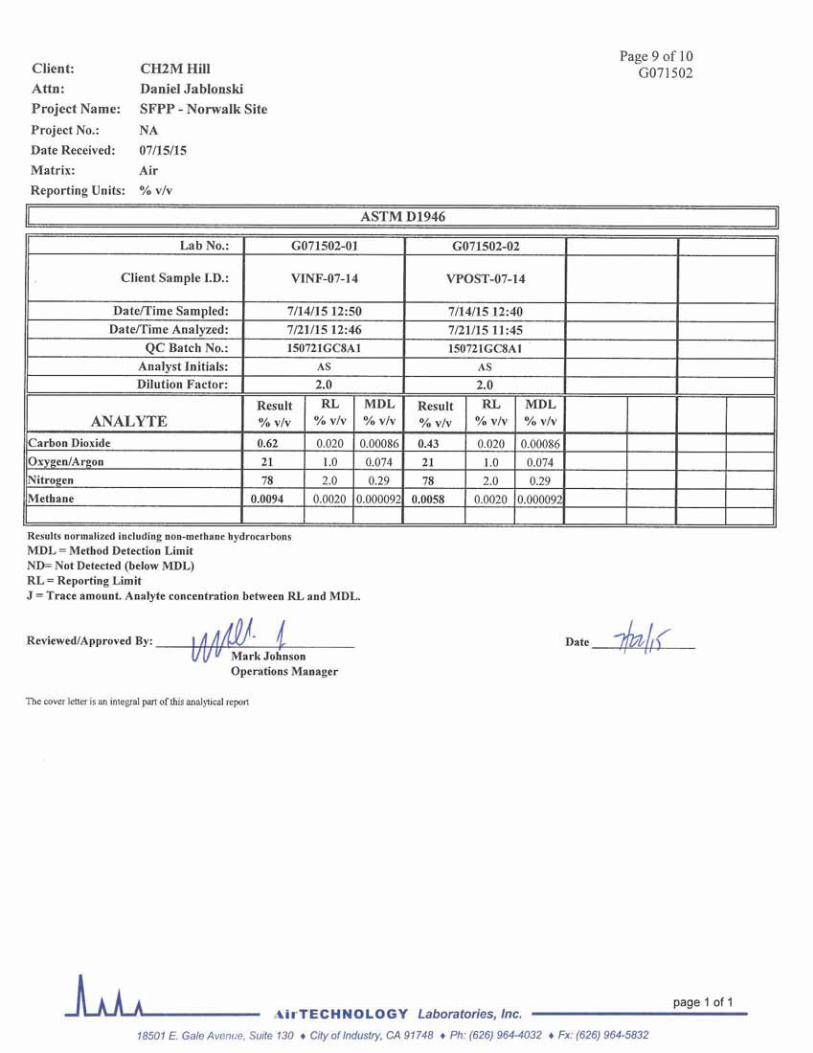
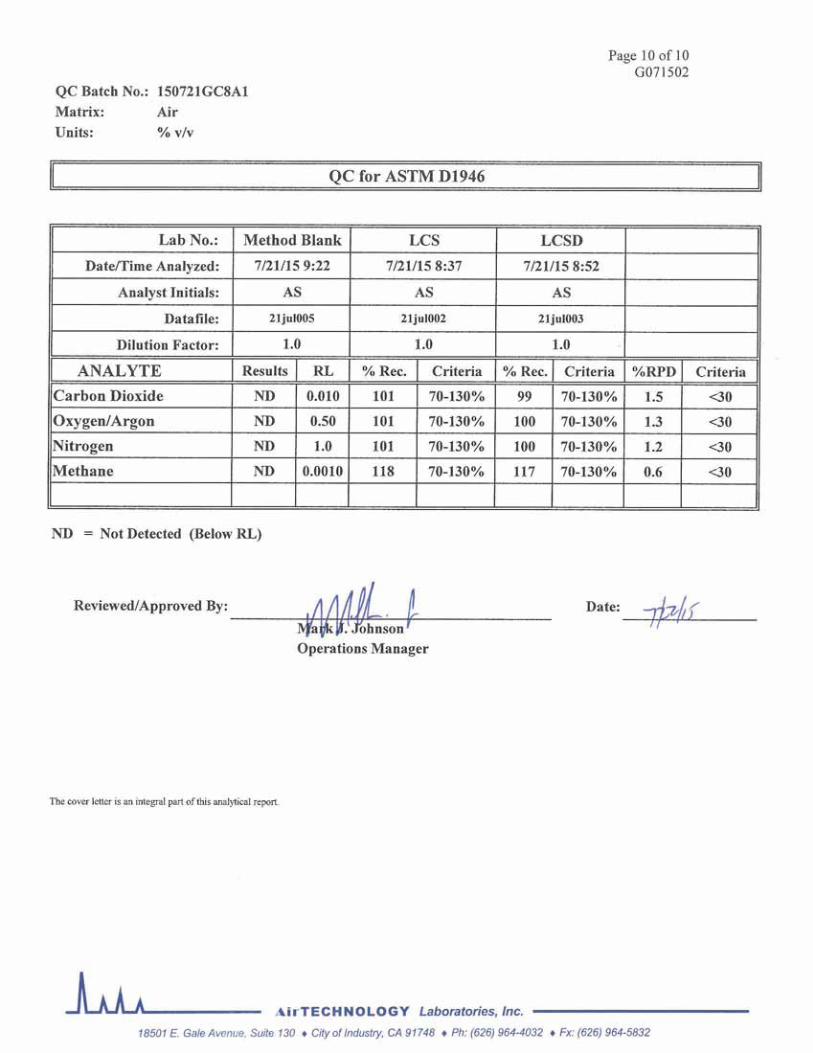
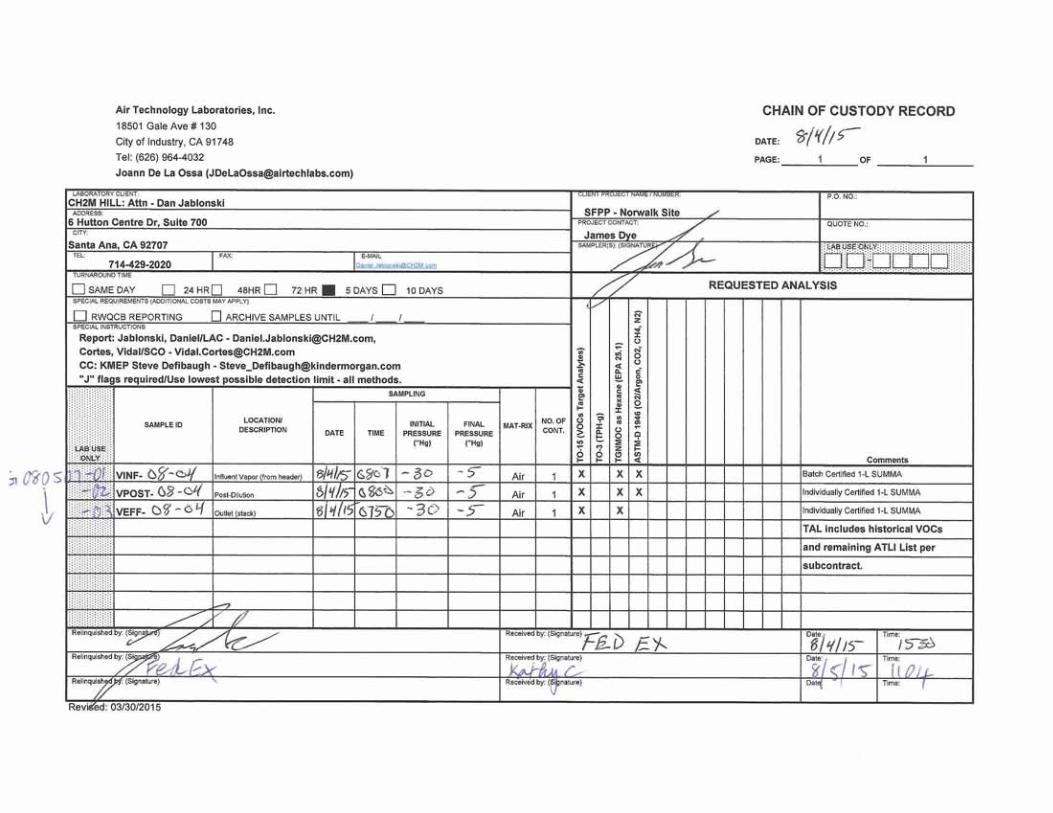
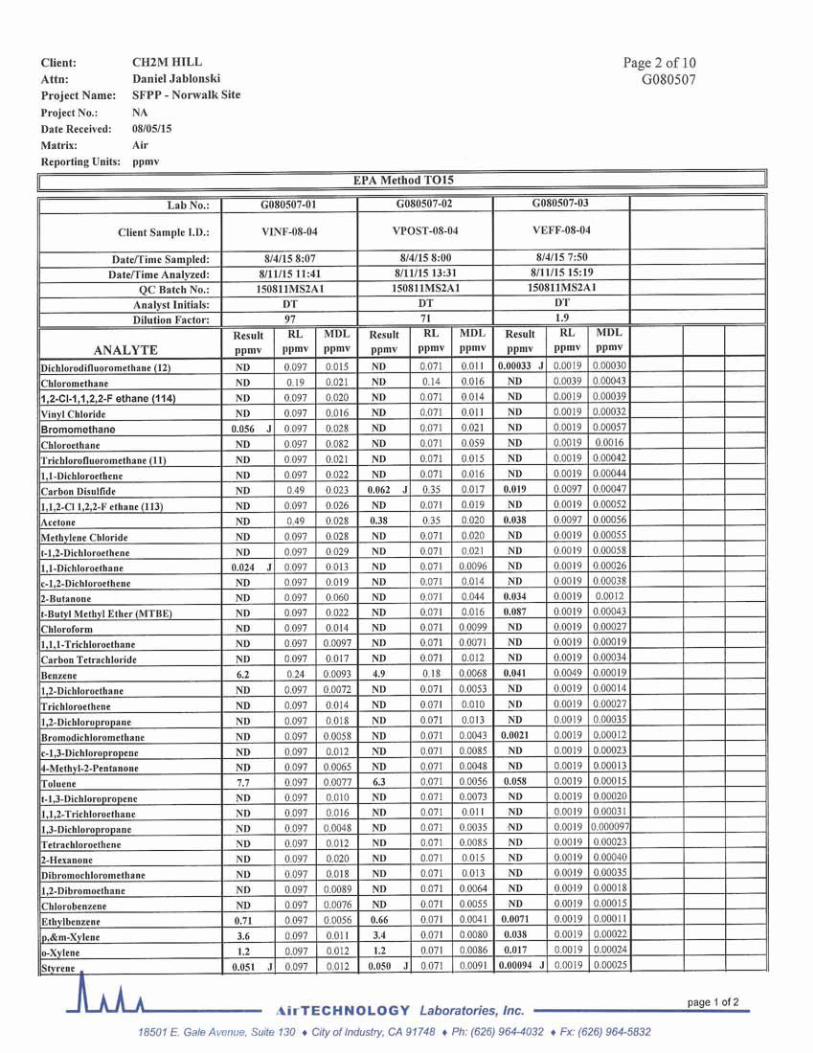
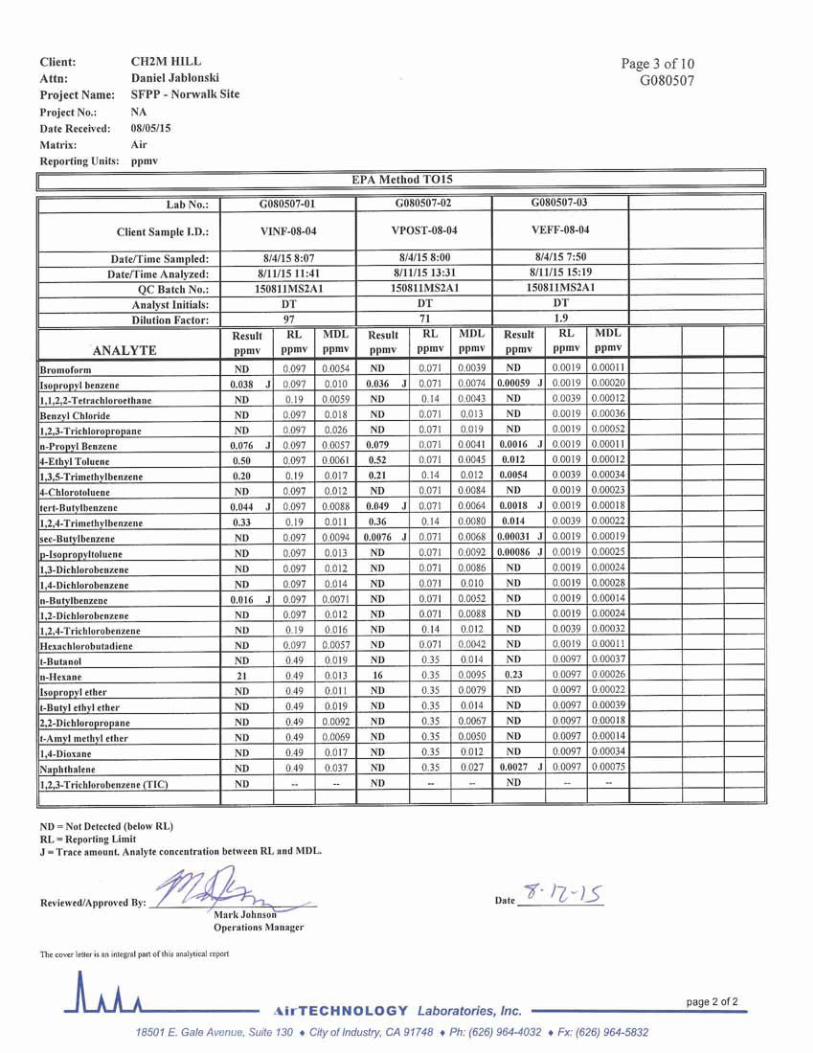
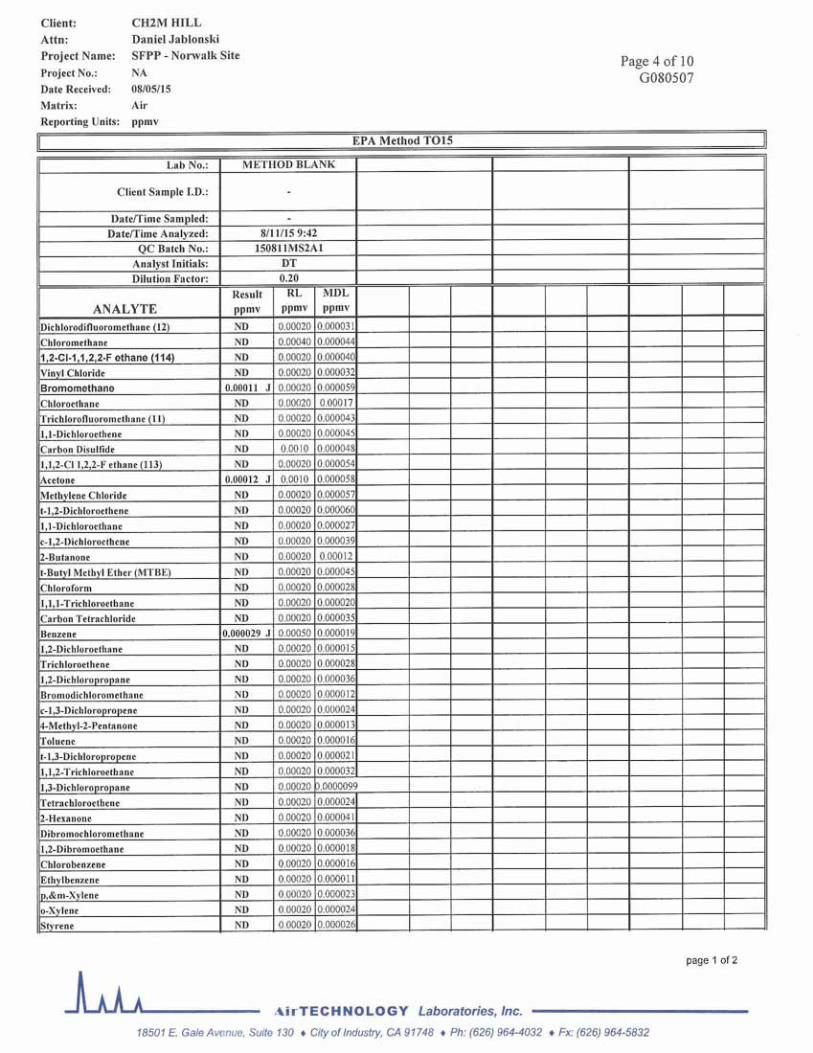
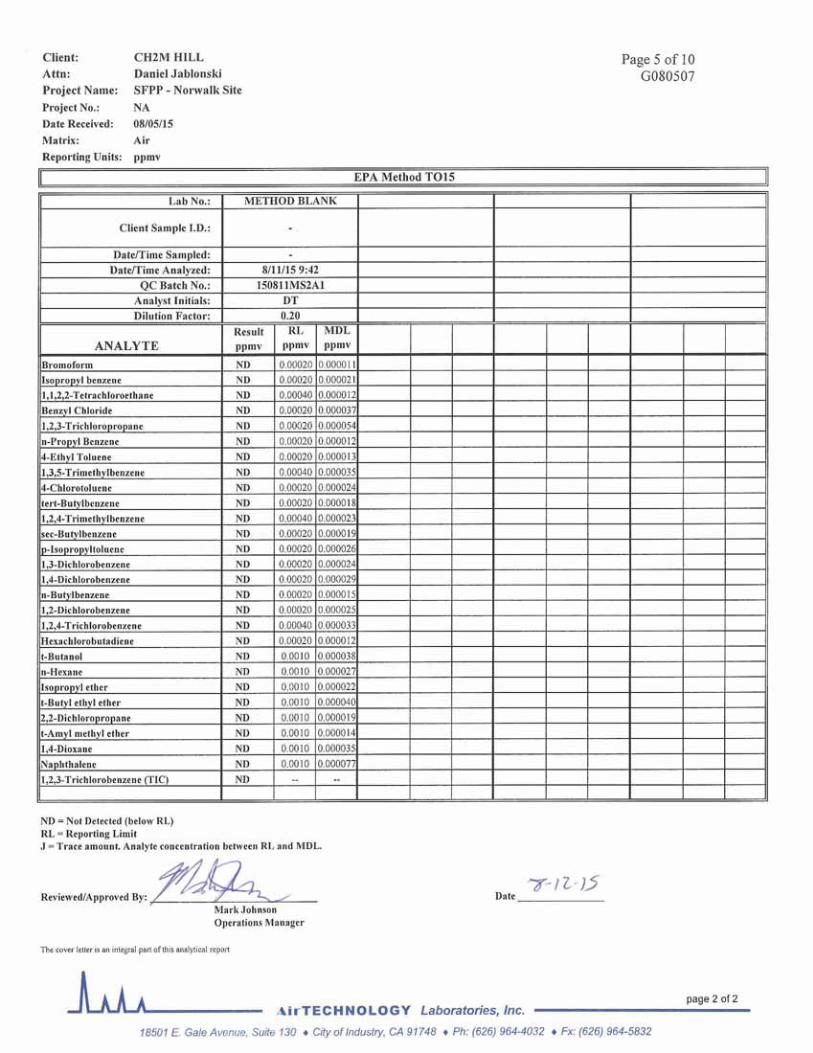
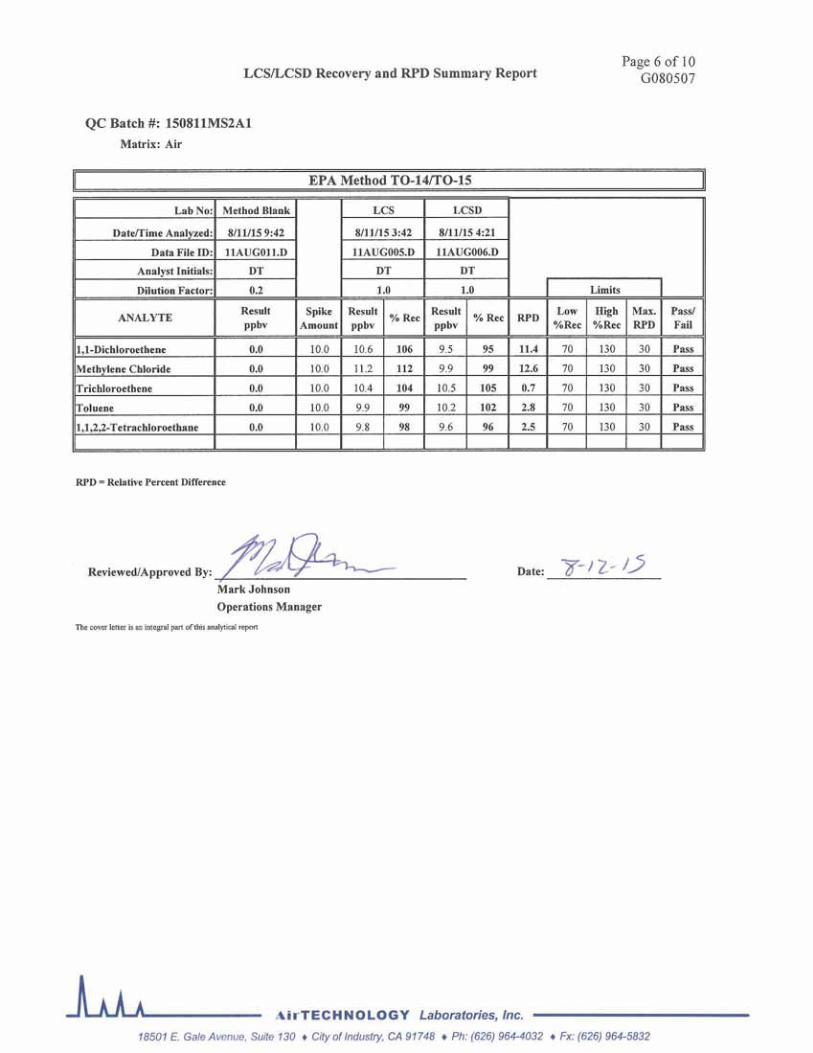
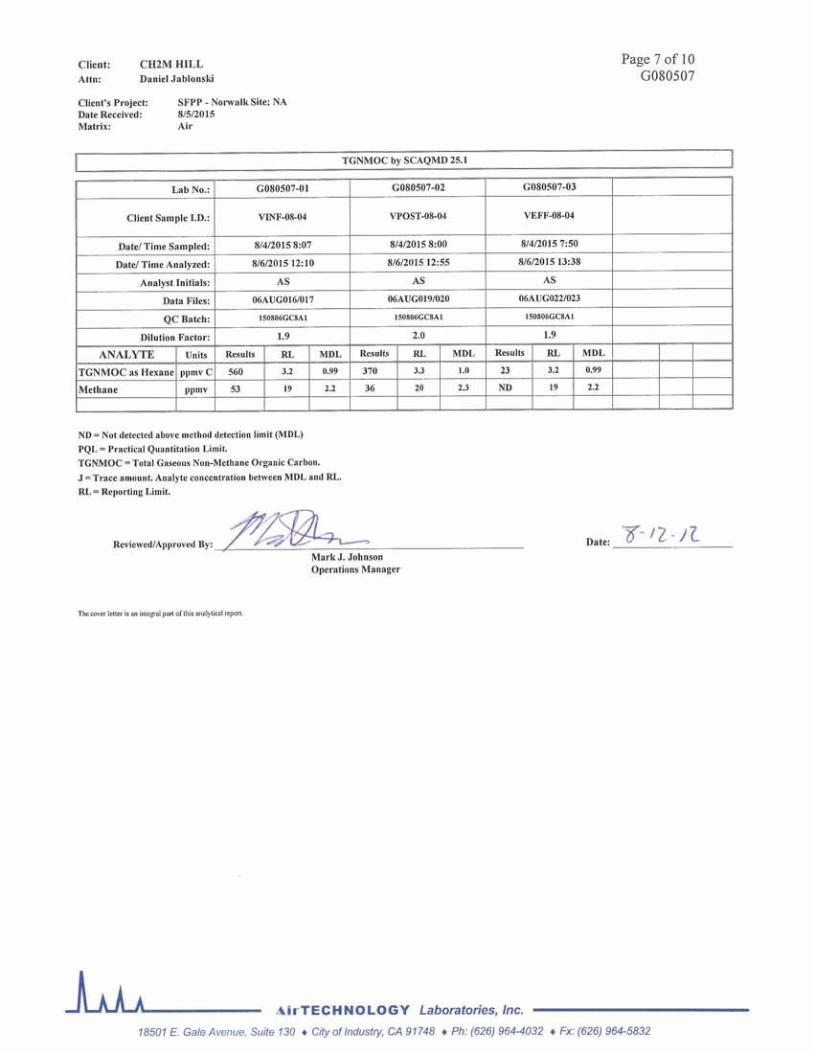
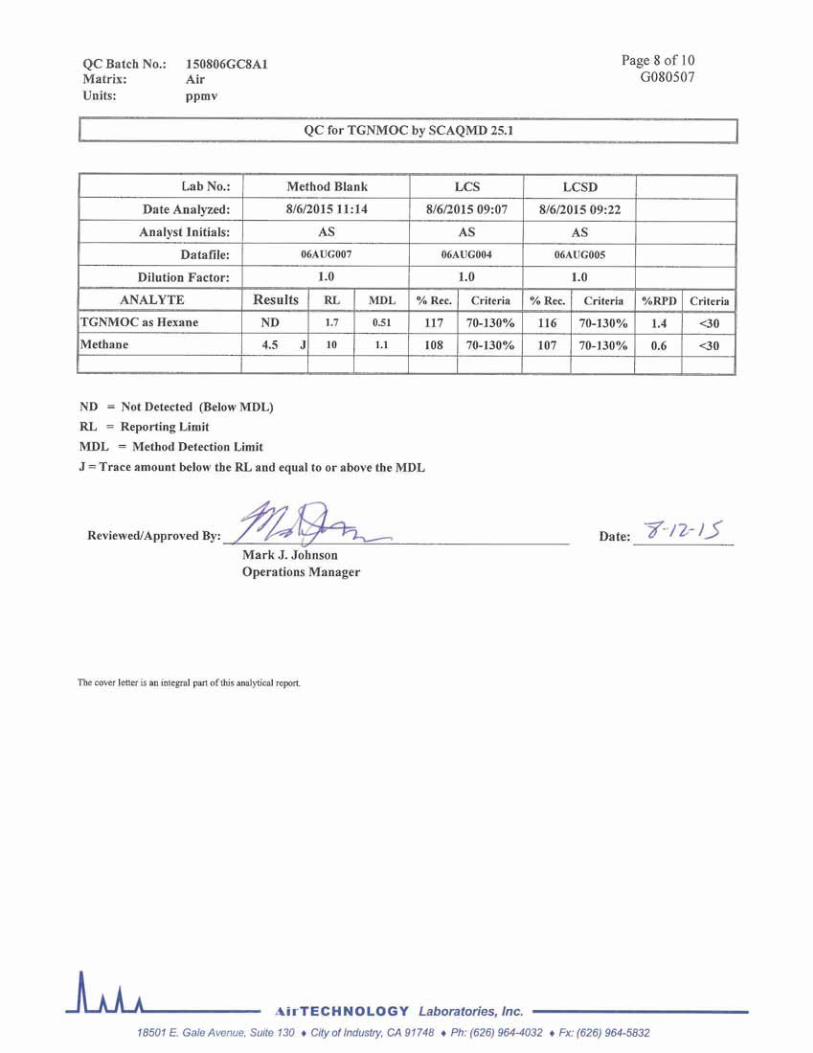
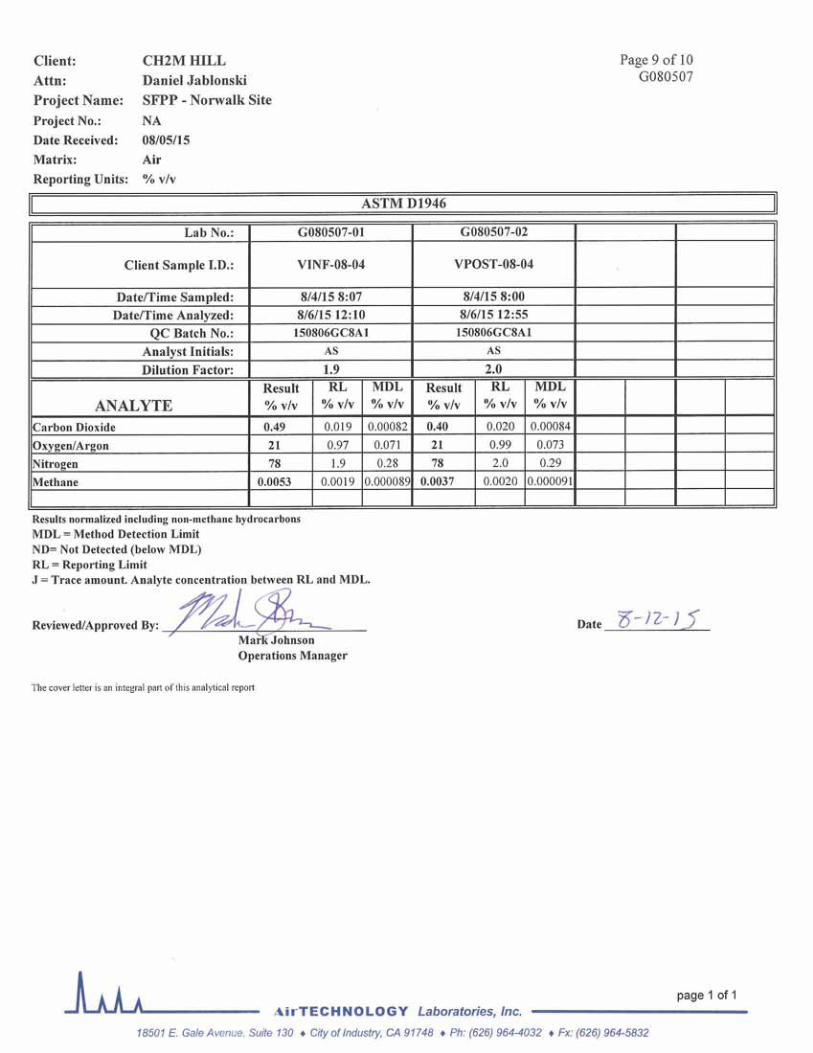
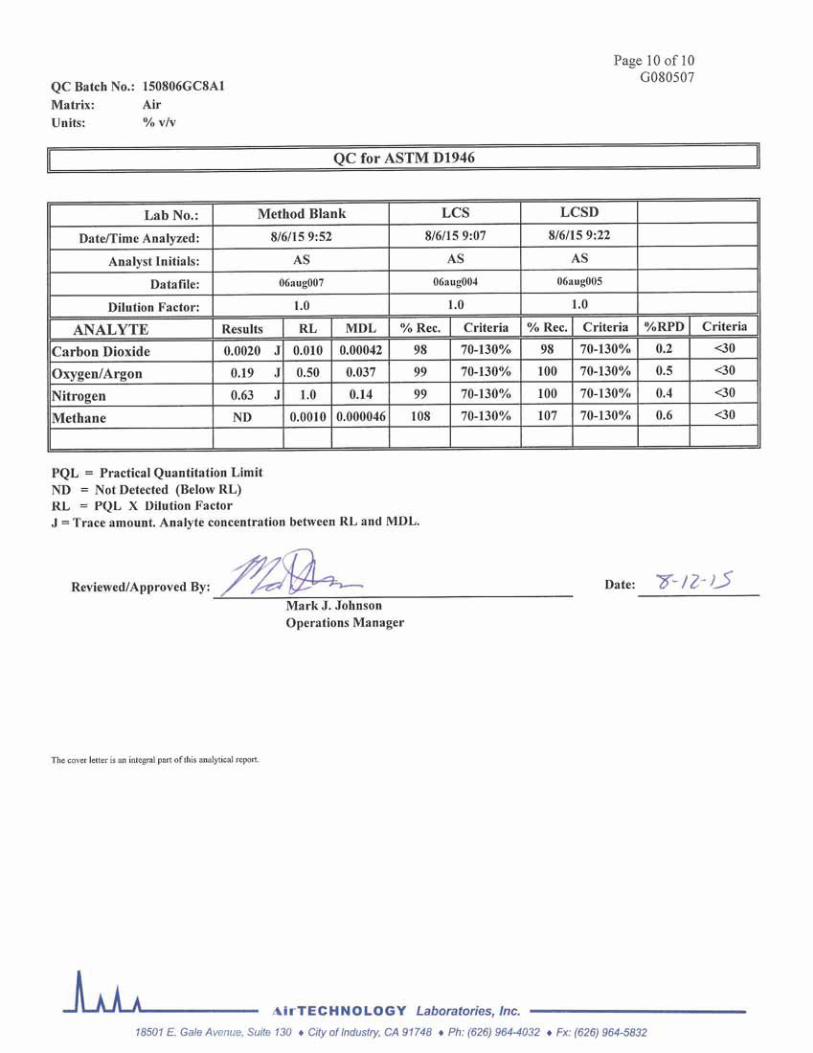

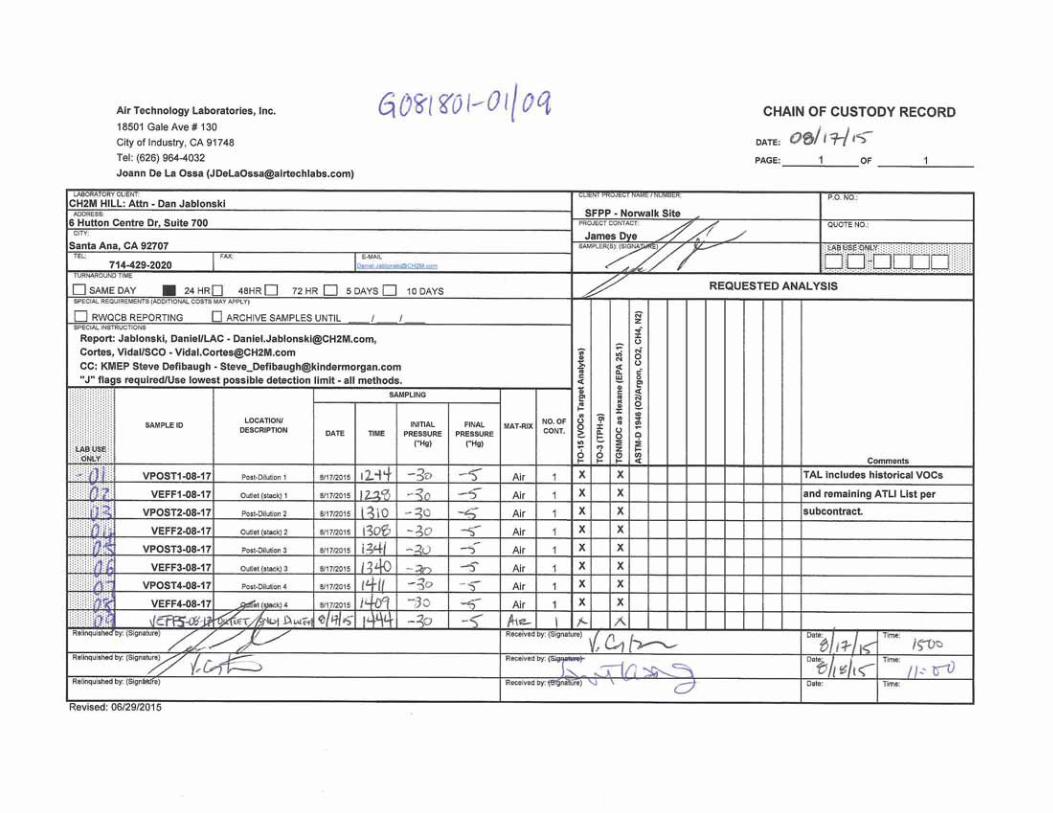
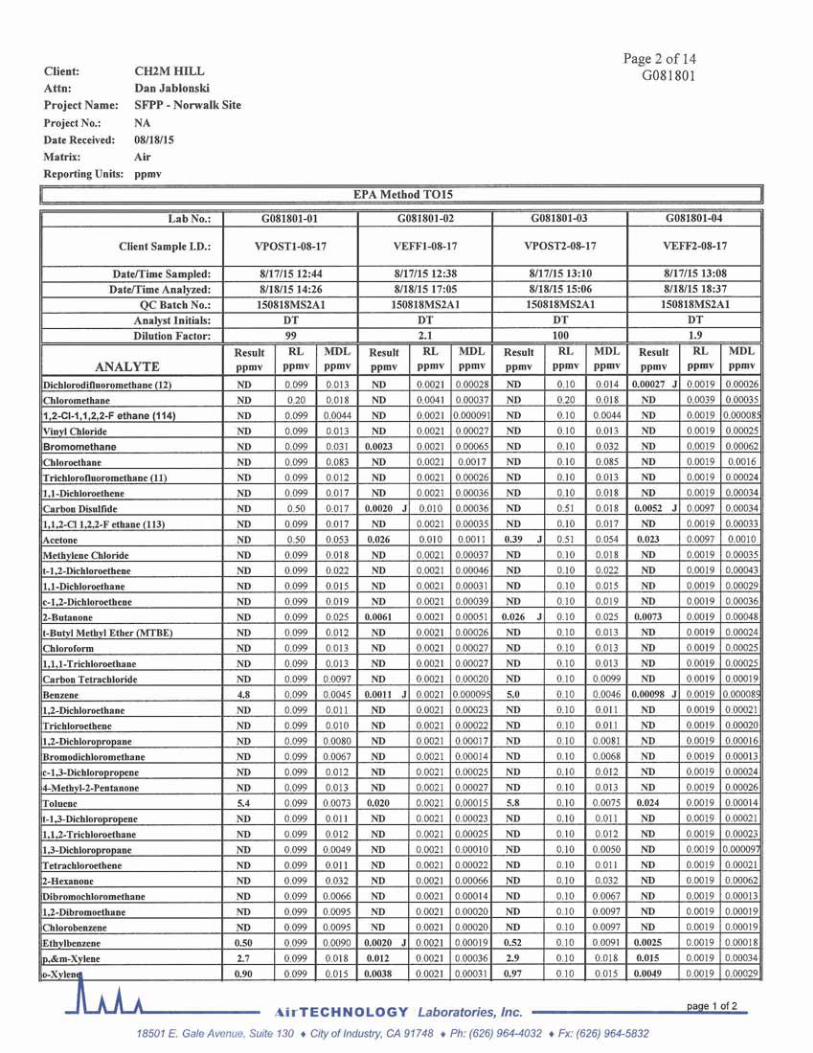
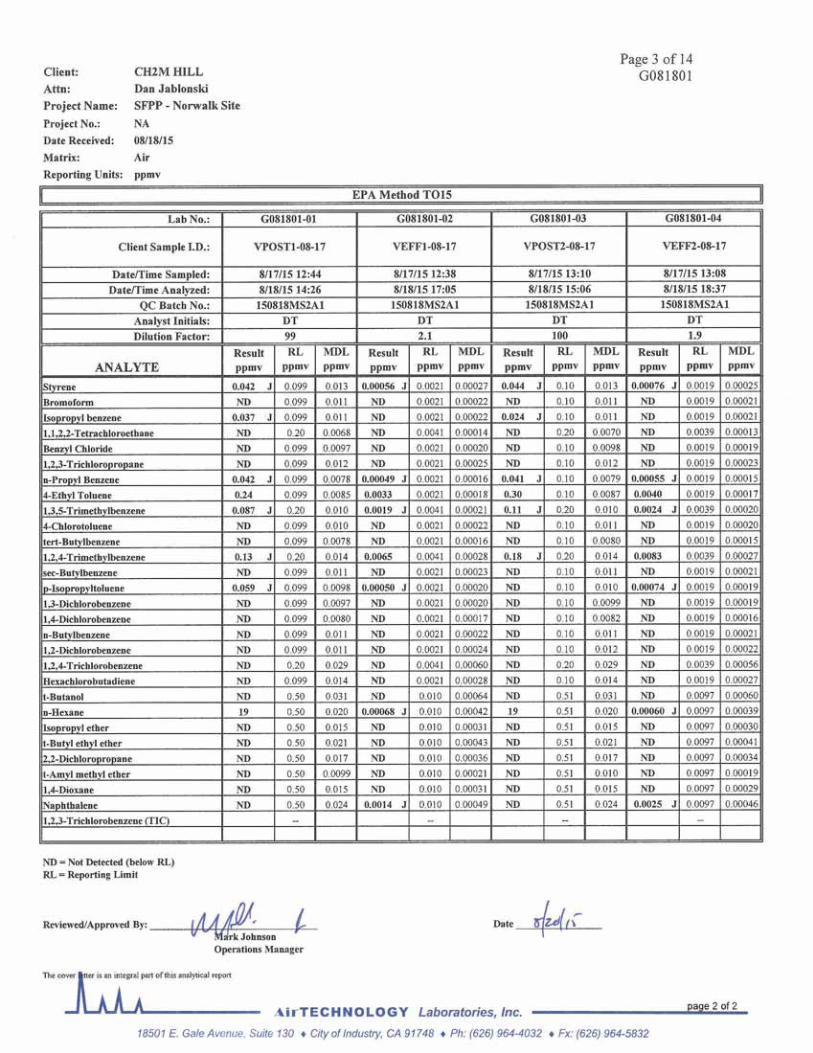

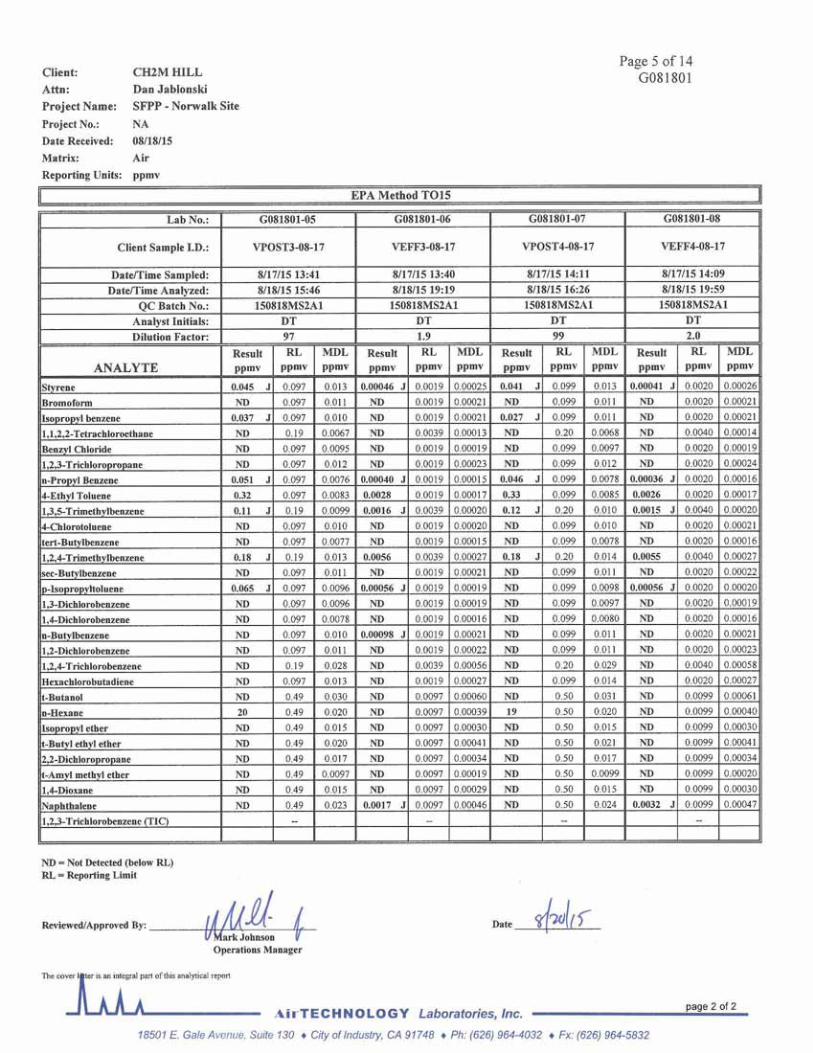
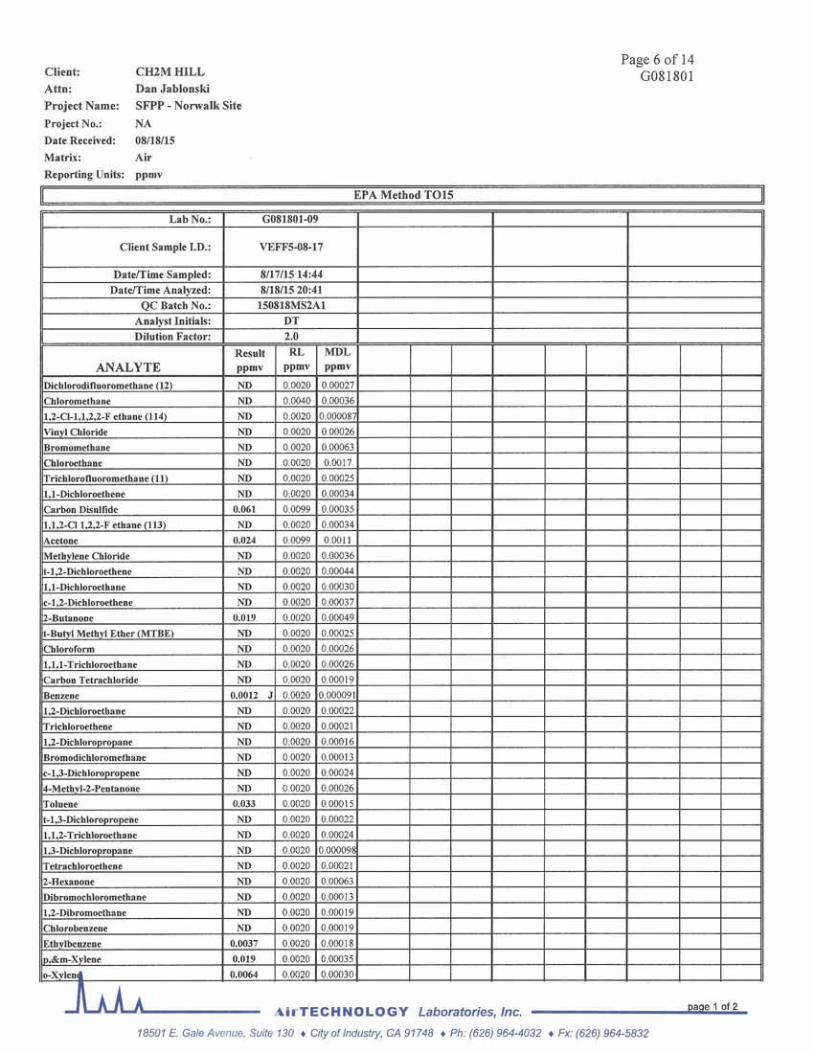


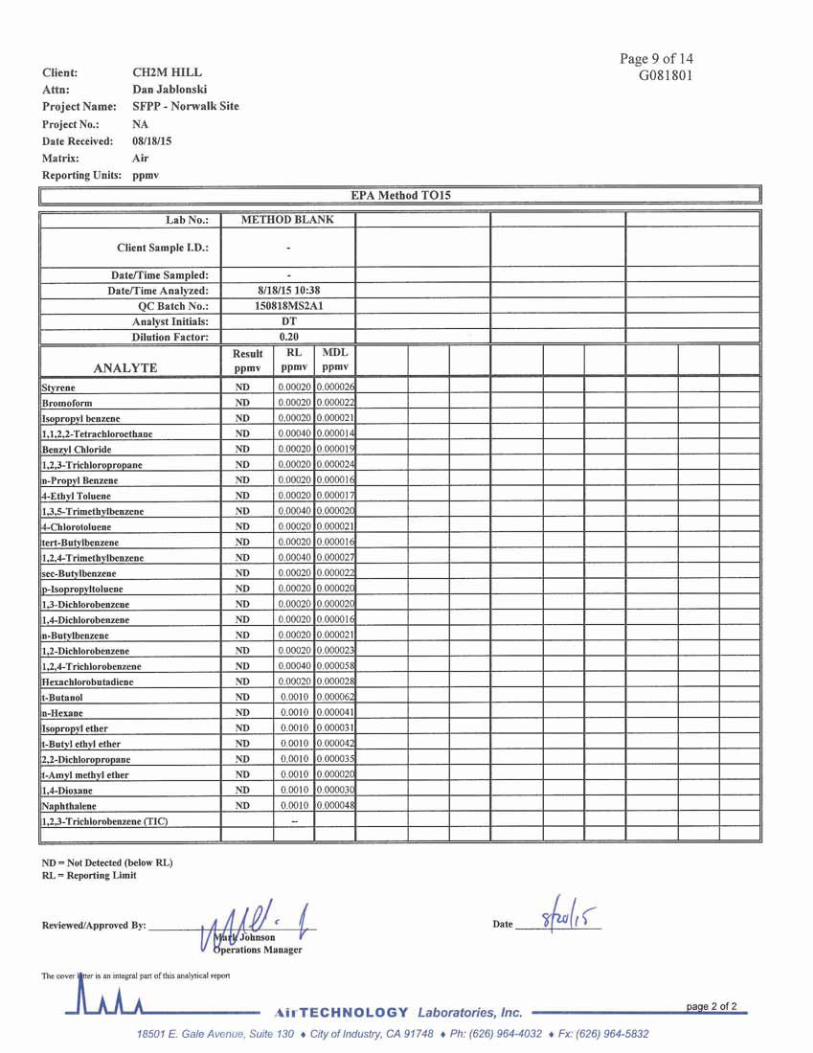

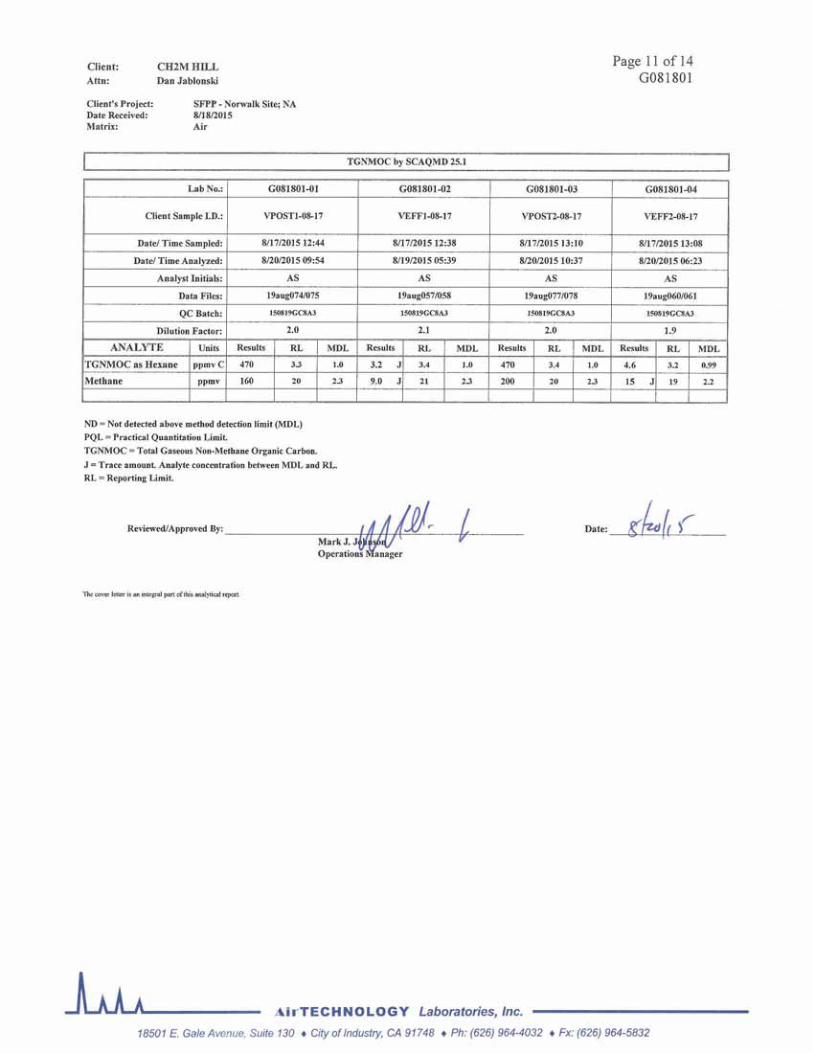
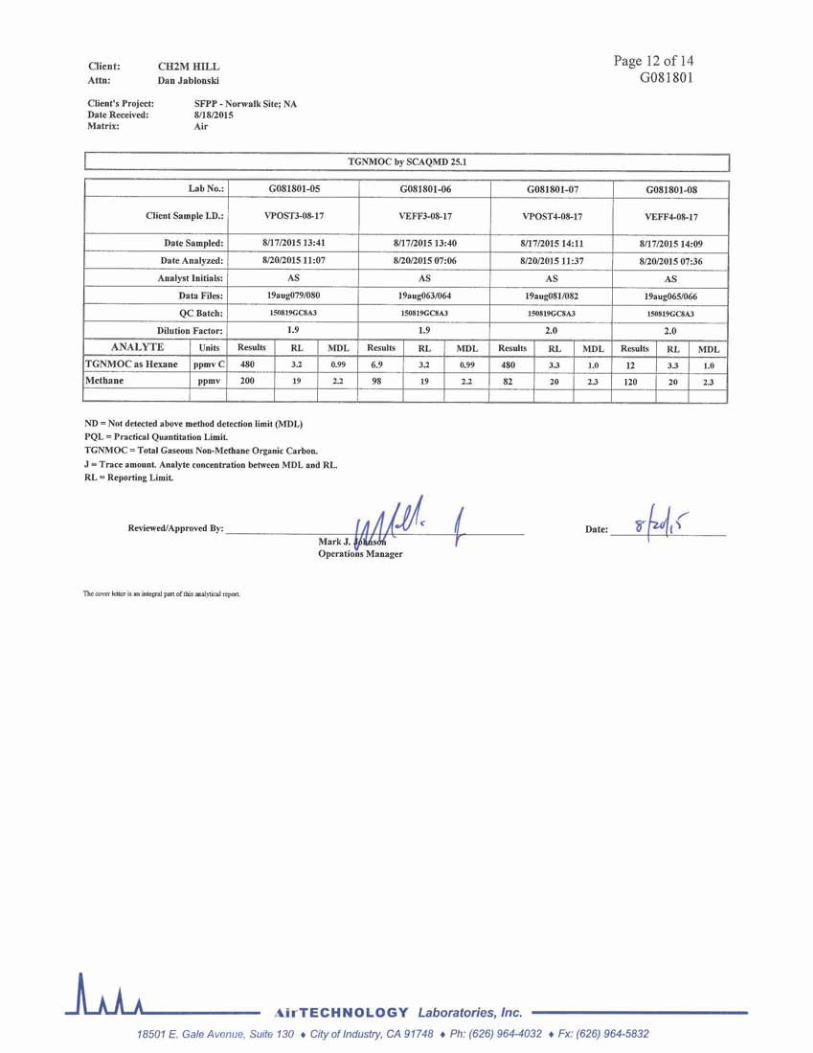
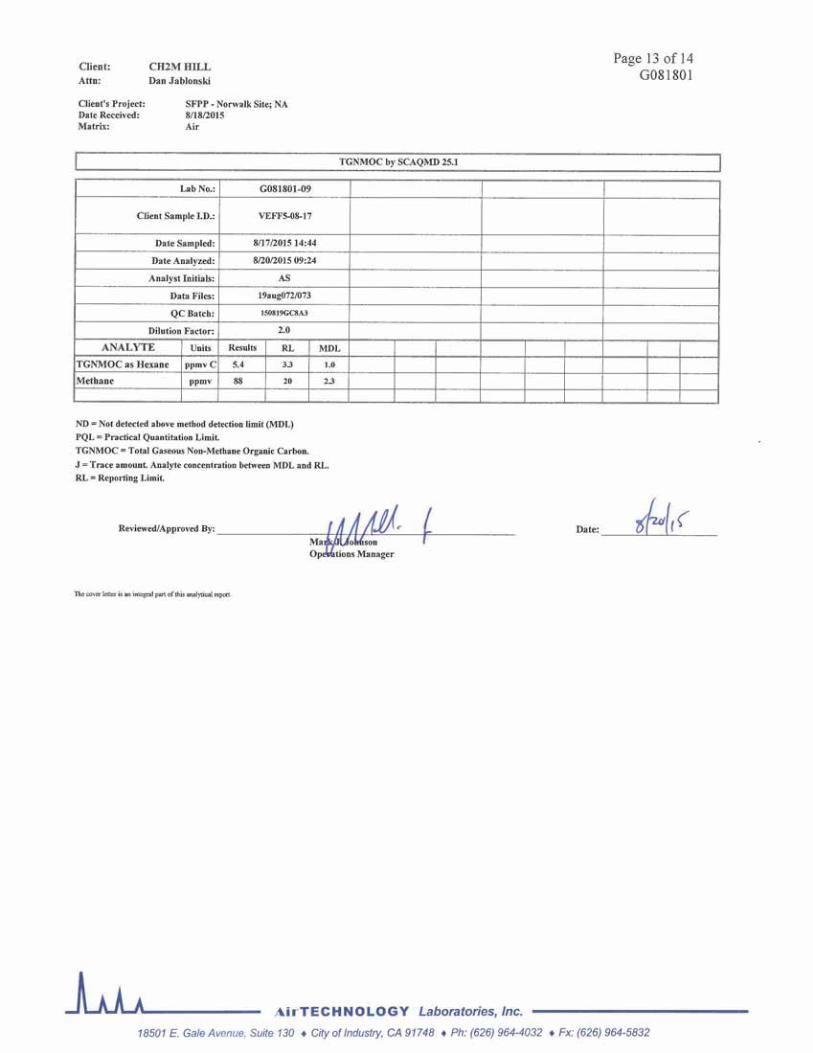
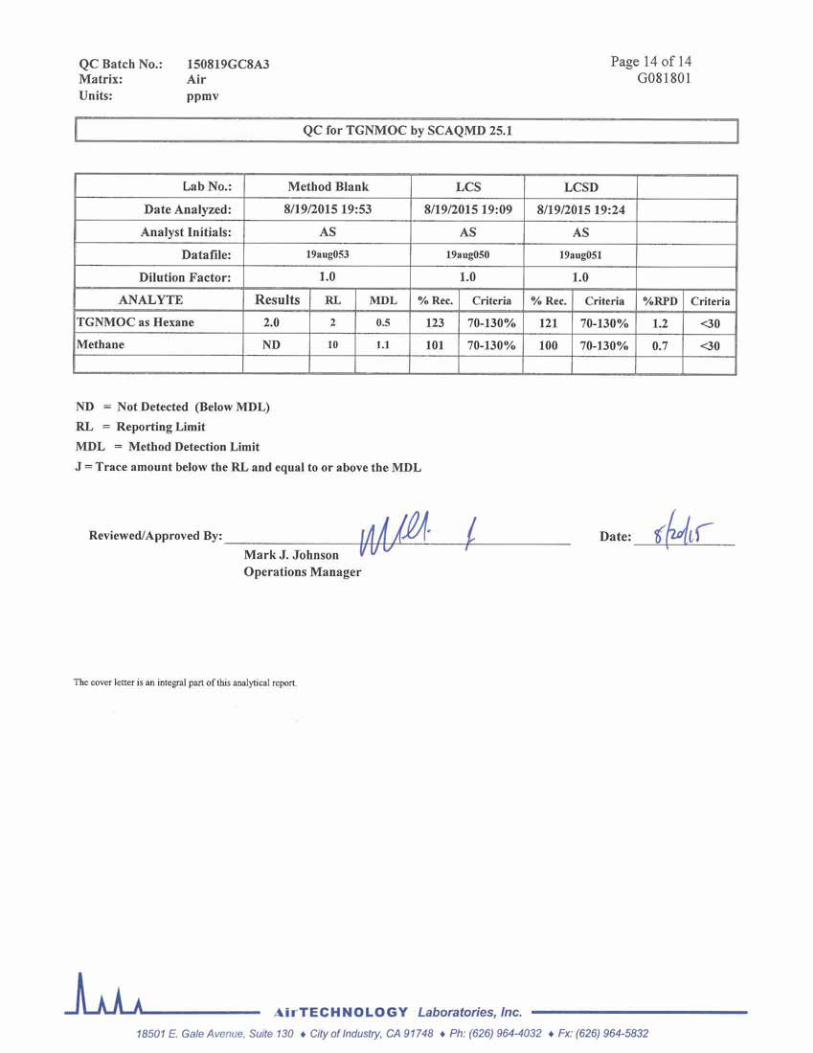
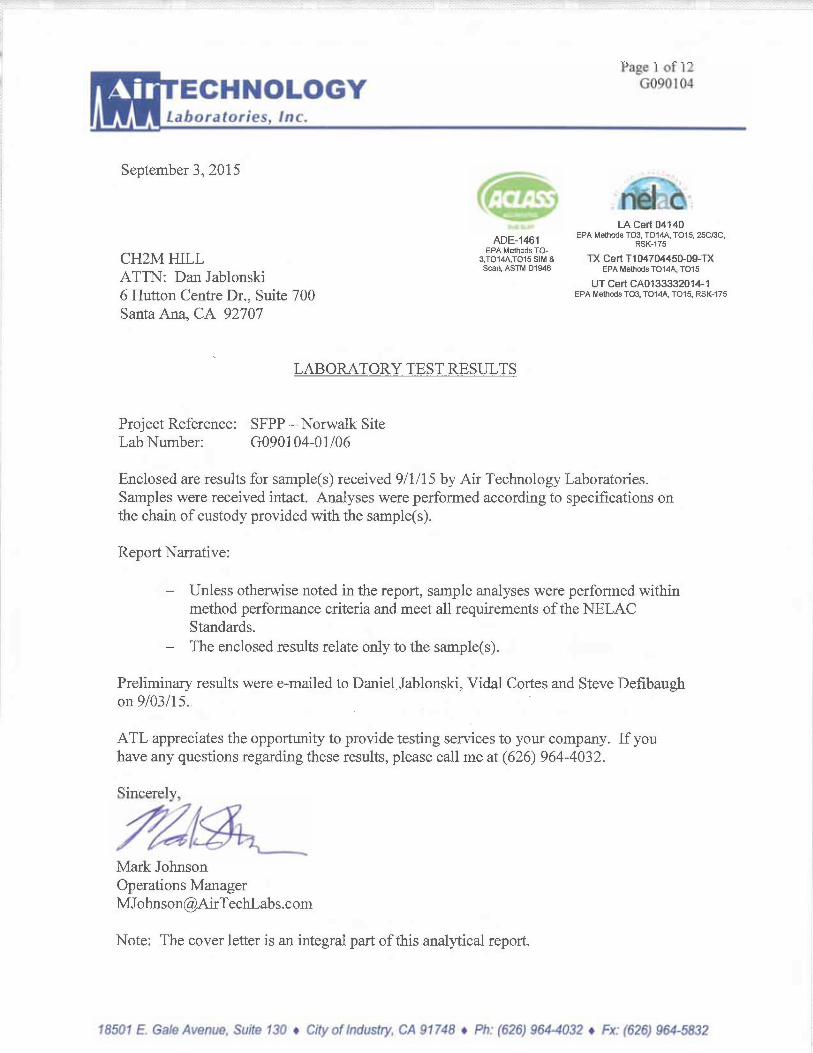
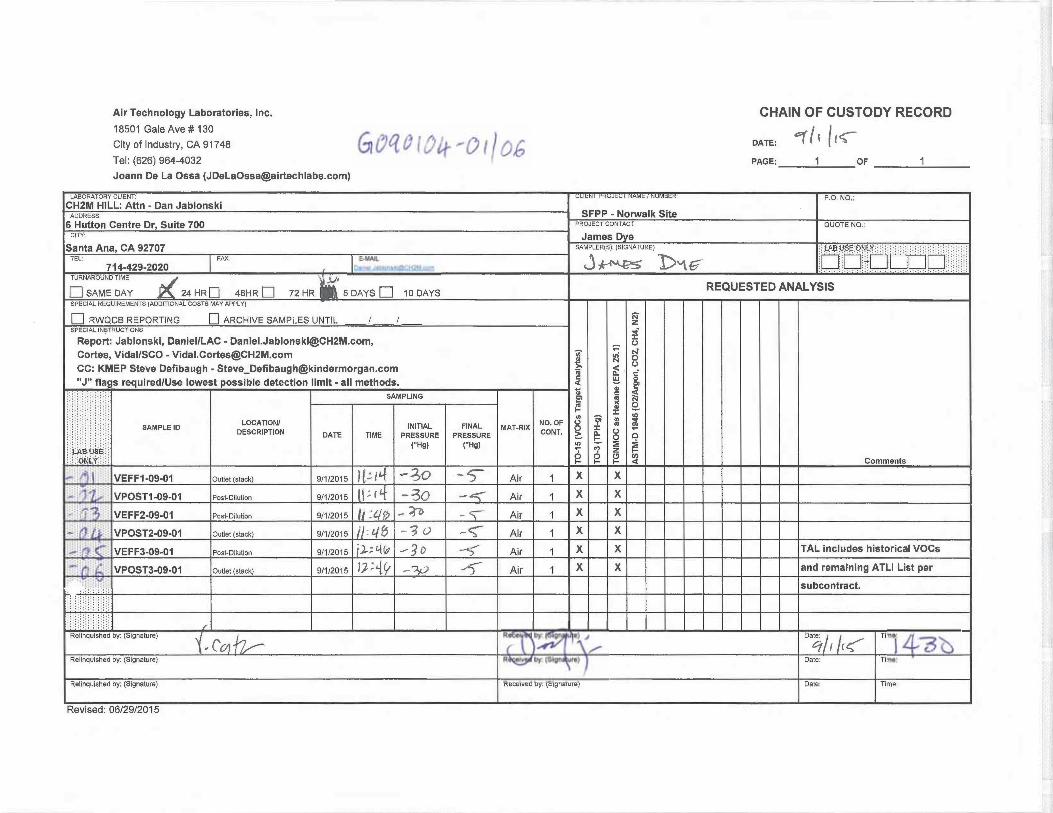
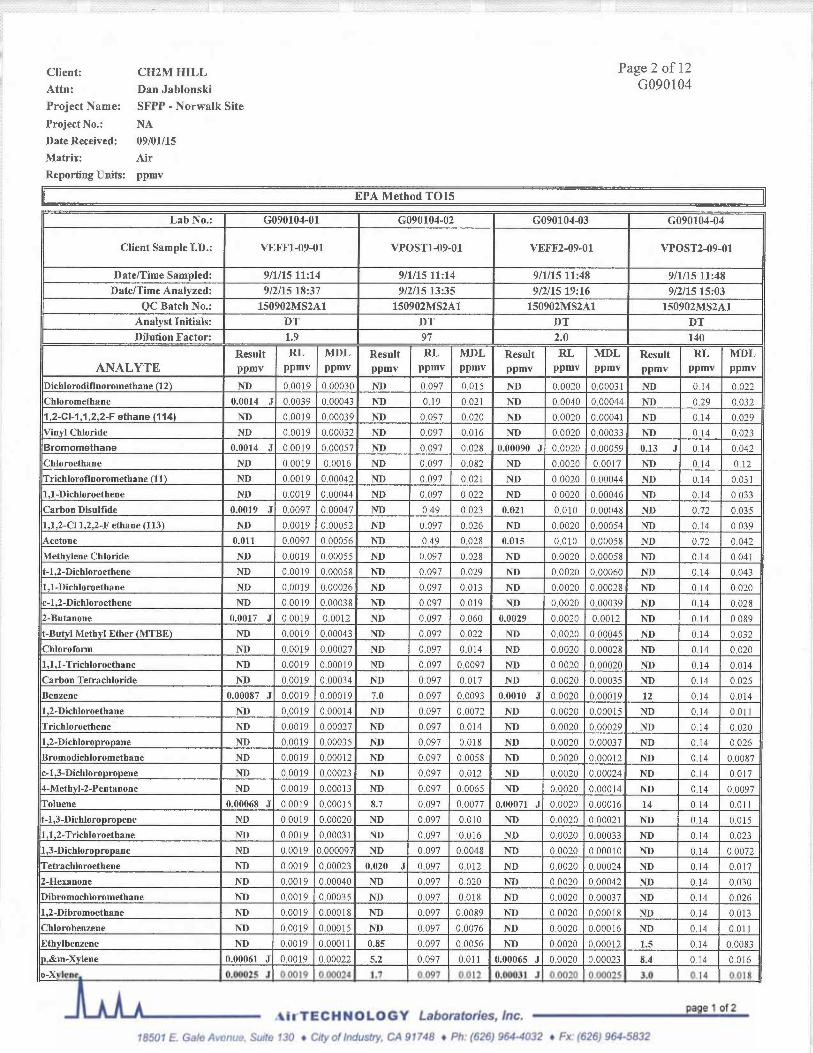
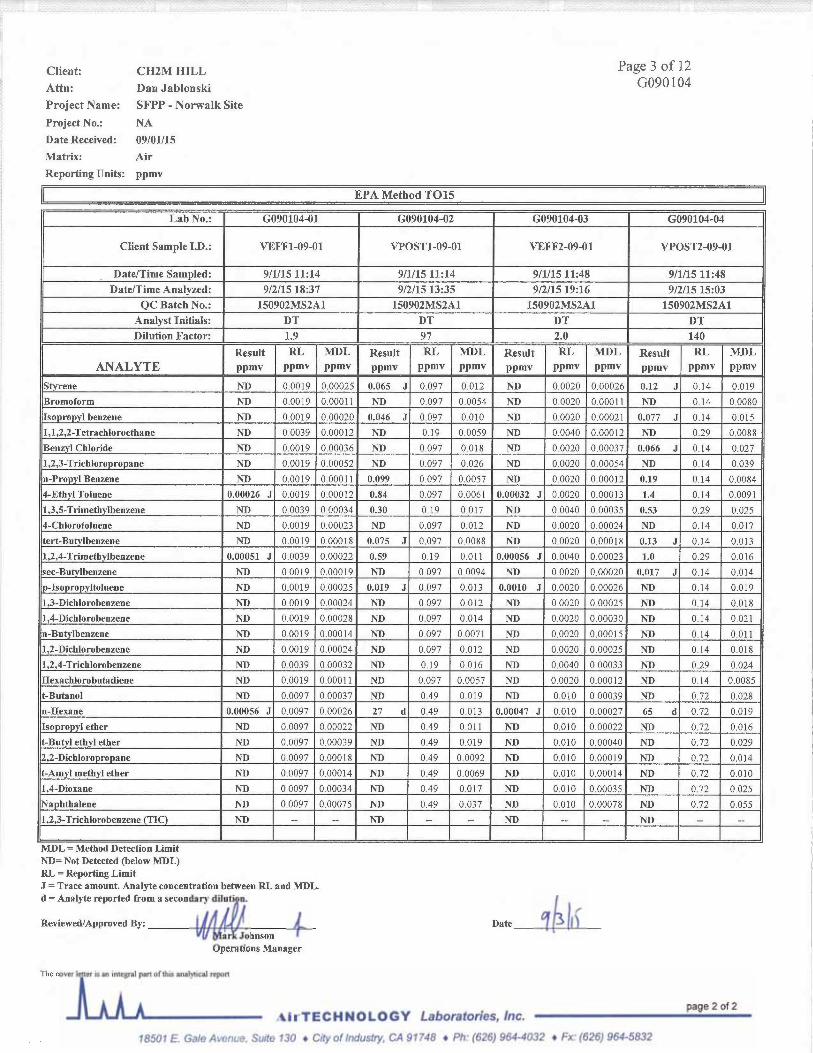
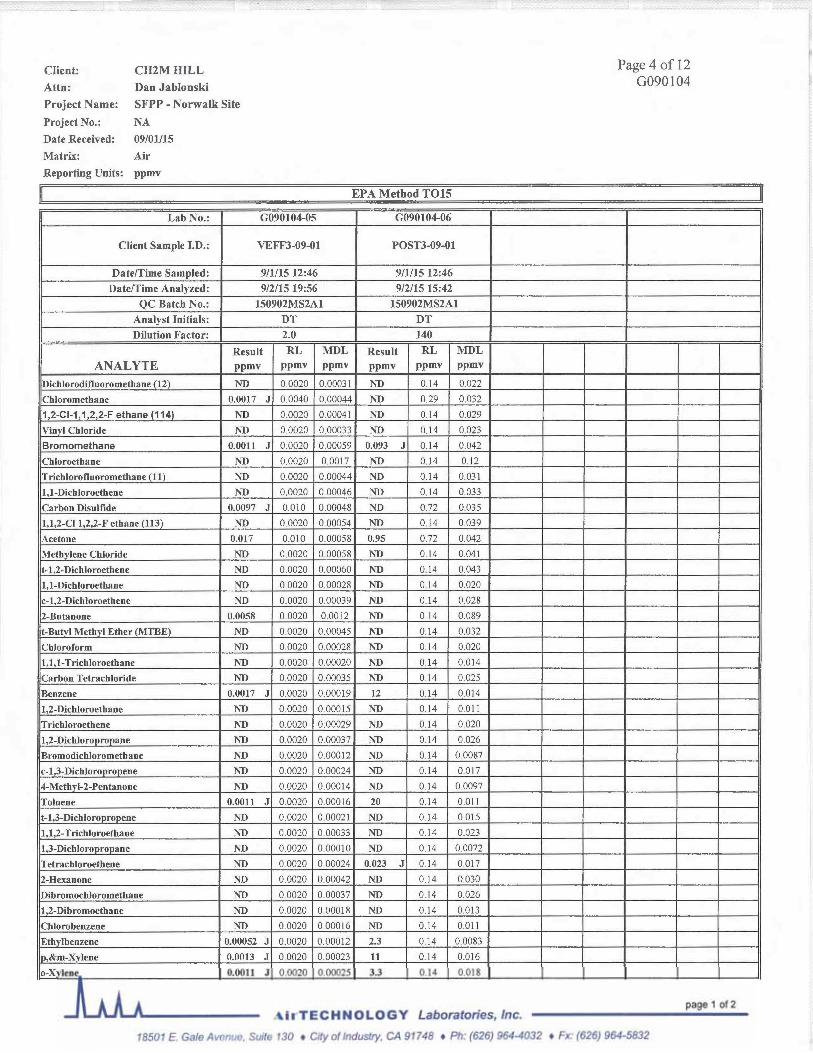
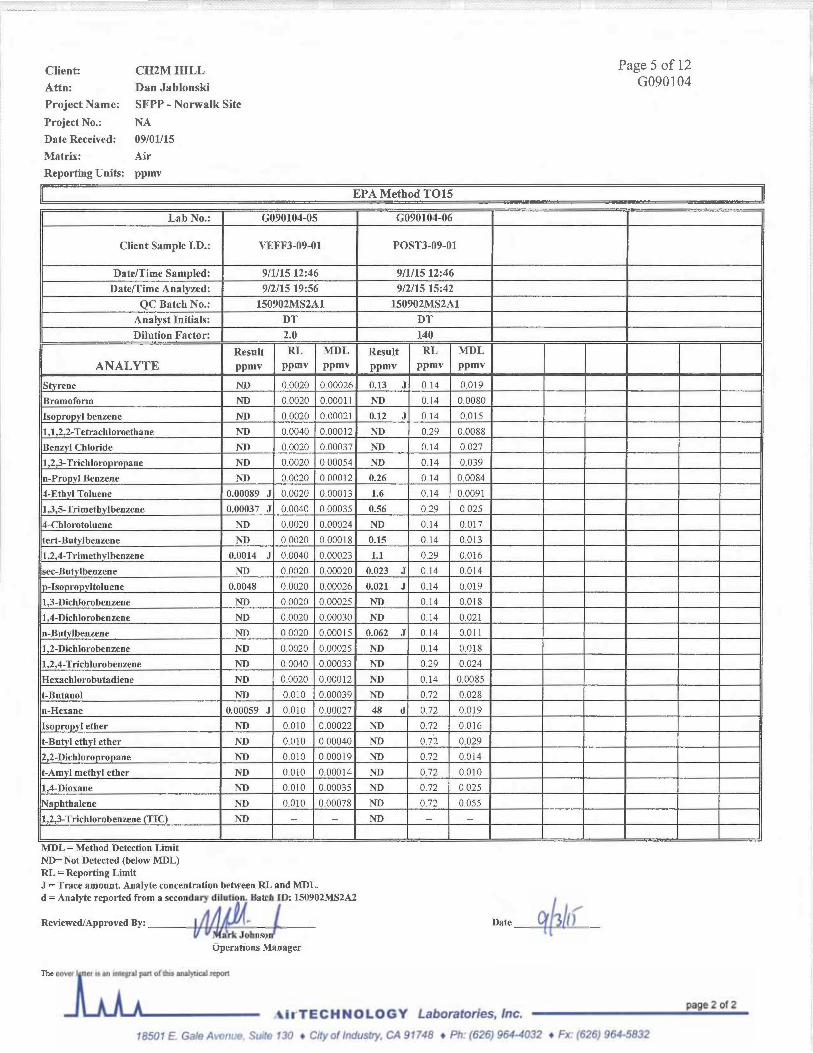
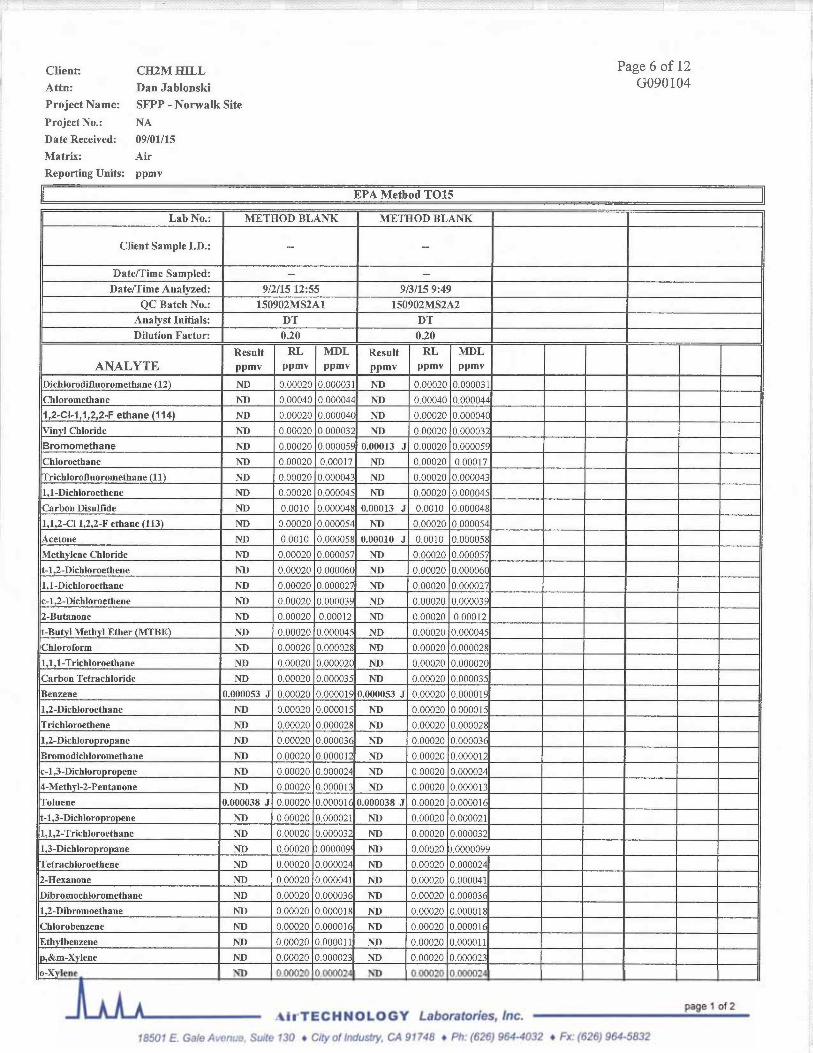
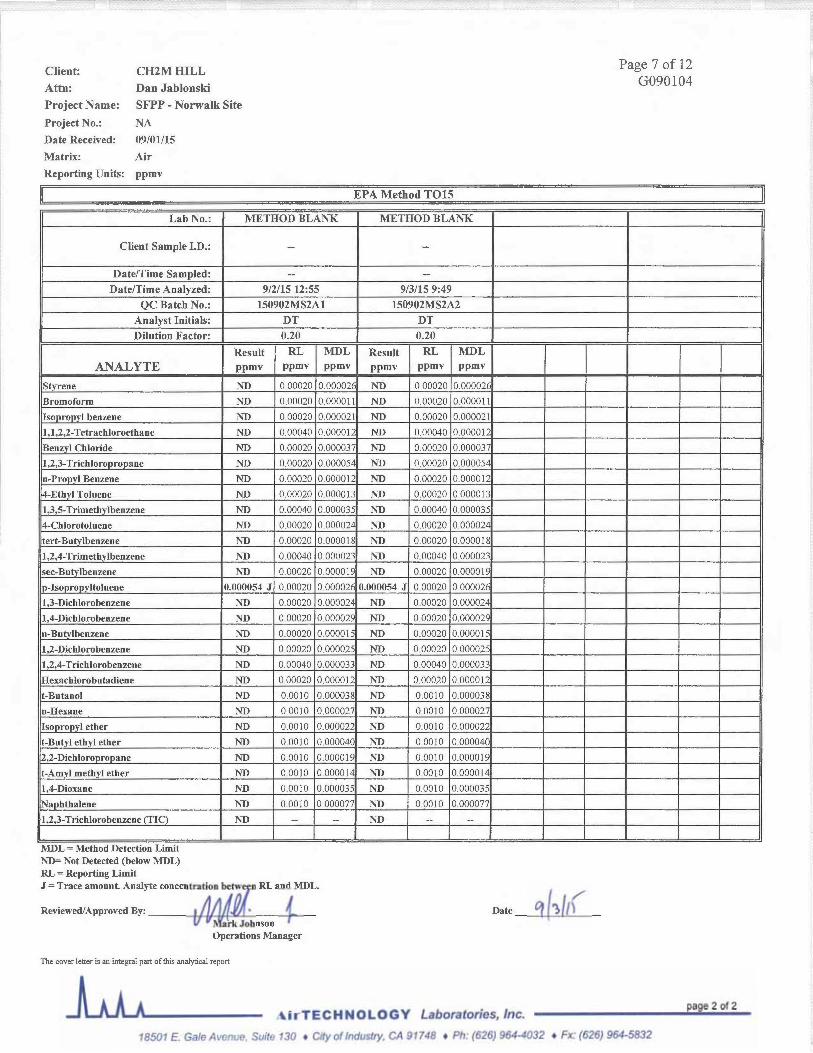
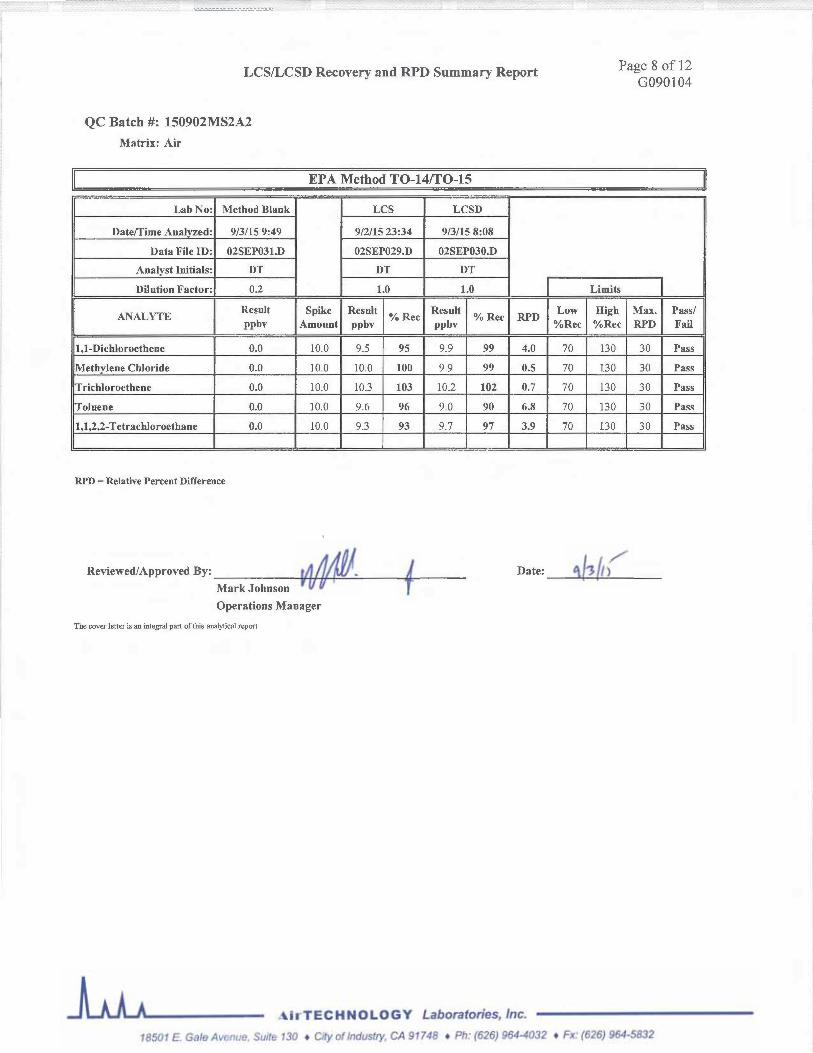
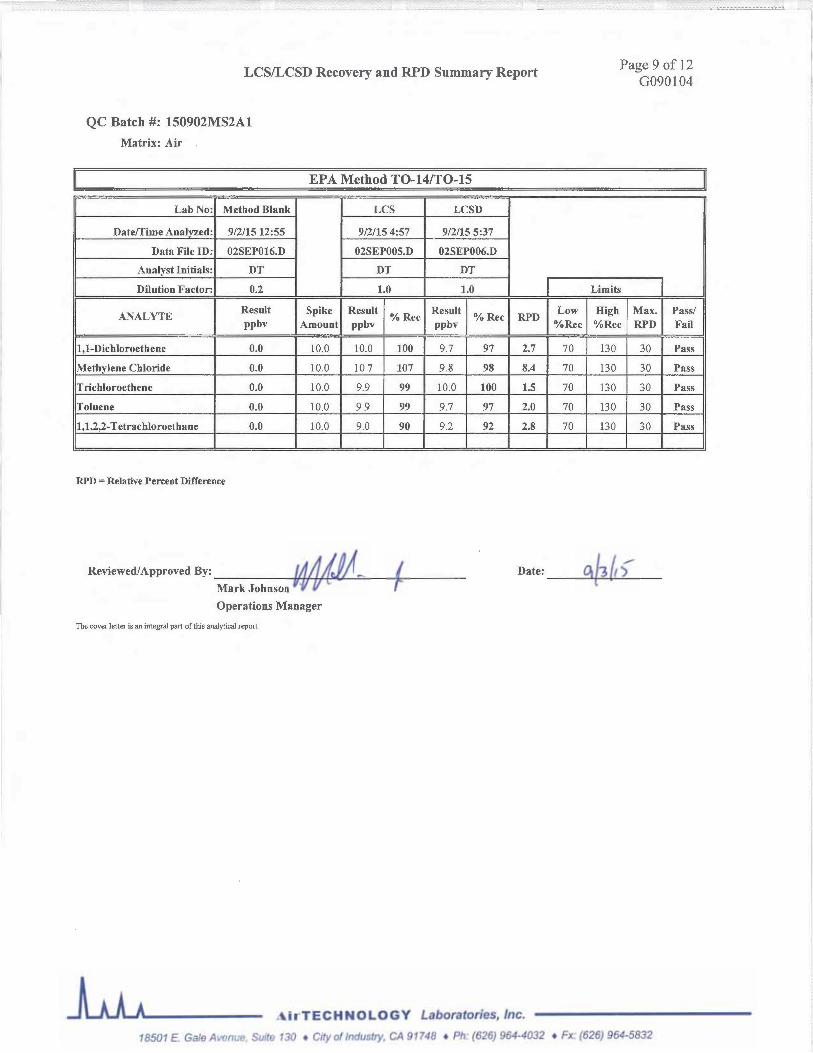

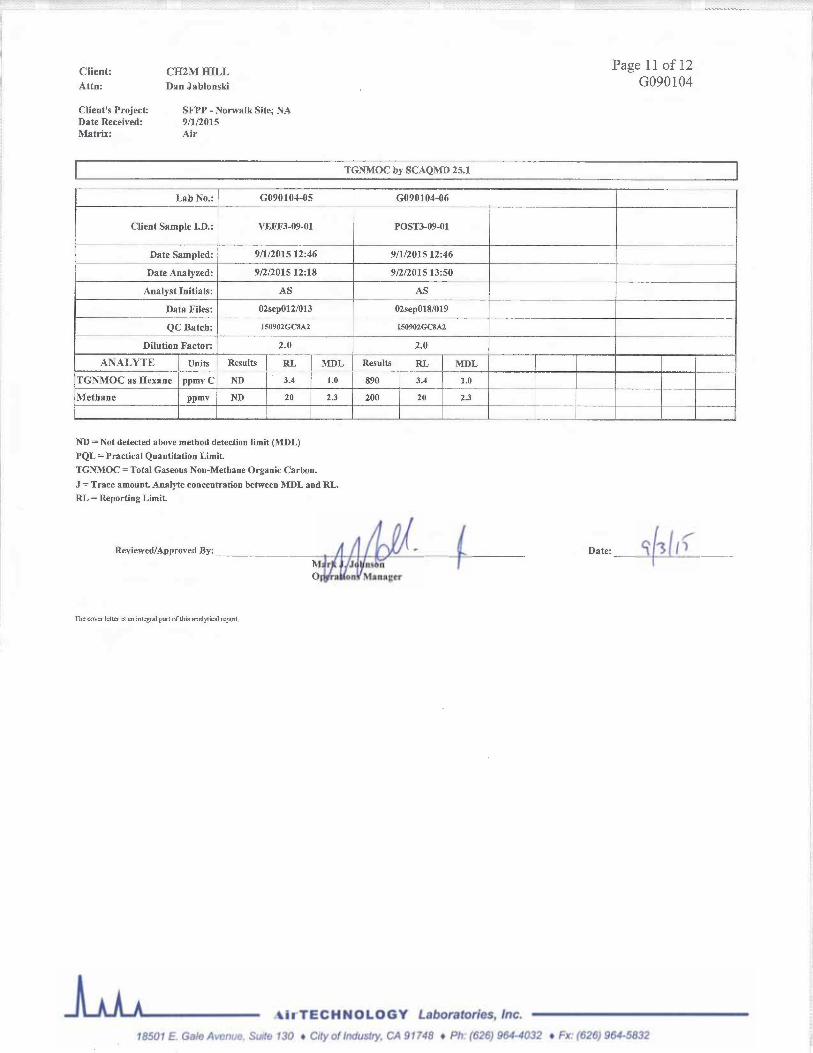
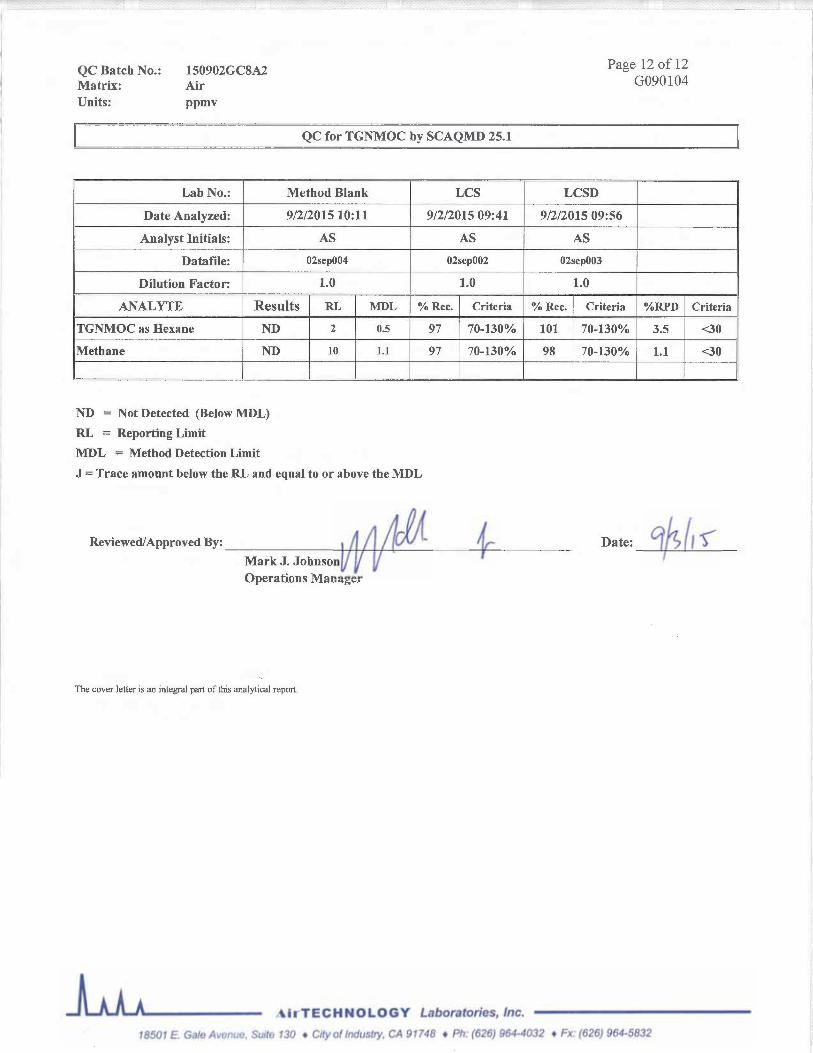
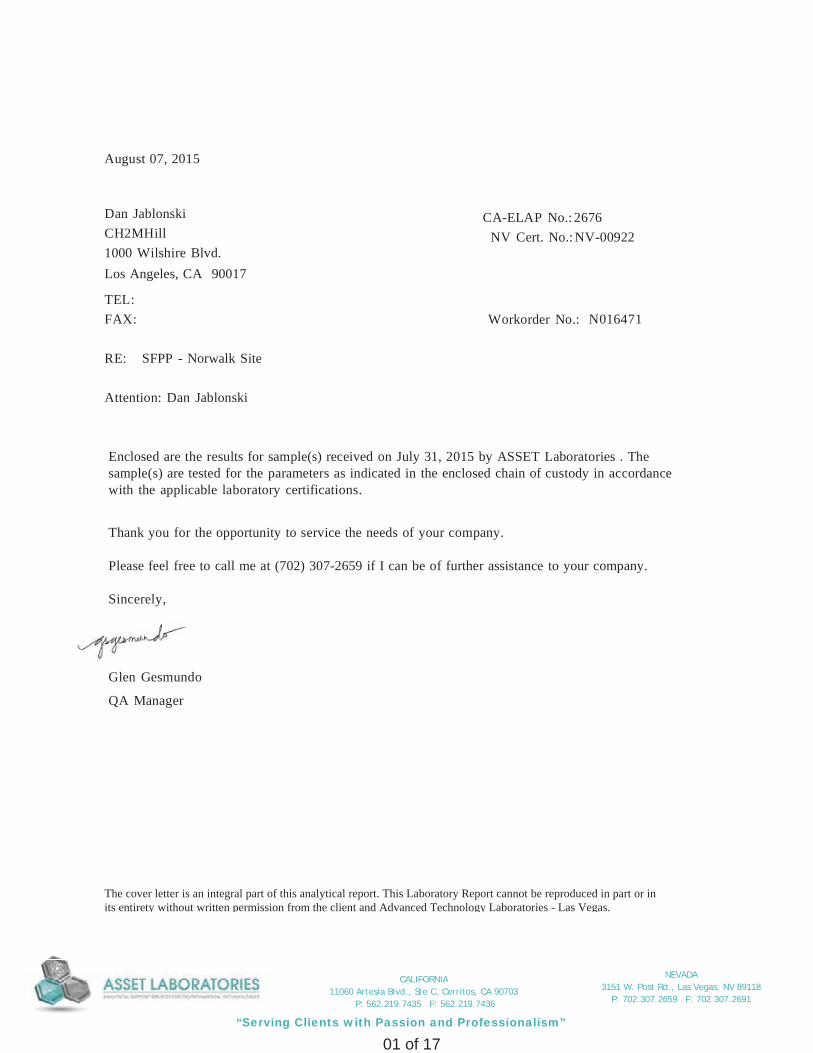
NEVADA3151 W. Post Rd., Las Vegas, NV 89118
P: 702.307.2659 F: 702.307.2691
“Serving Clients with Passion and Professionalism”
CALIFORNIA11060 Artesia Blvd., Ste C, Cerritos, CA 90703
P: 562.219.7435 F: 562.219.7436
August 07, 2015
CH2MHillDan Jablonski
Attention: Dan Jablonski
RE: SFPP - Norwalk Site
Workorder No.: N016471FAX:TEL:
1000 Wilshire Blvd.Los Angeles, CA 90017
CA-ELAP No.: 2676NV Cert. No.: NV-00922
Thank you for the opportunity to service the needs of your company.
Please feel free to call me at (702) 307-2659 if I can be of further assistance to your company.
Sincerely,
Glen Gesmundo
QA Manager
Enclosed are the results for sample(s) received on July 31, 2015 by ASSET Laboratories . The sample(s) are tested for the parameters as indicated in the enclosed chain of custody in accordance with the applicable laboratory certifications.
The cover letter is an integral part of this analytical report. This Laboratory Report cannot be reproduced in part or in its entirety without written permission from the client and Advanced Technology Laboratories - Las Vegas.
01 of 17

NEVADA3151 W. Post Rd., Las Vegas, NV 89118
P: 702.307.2659 F: 702.307.2691
“Serving Clients with Passion and Professionalism”
CALIFORNIA11060 Artesia Blvd., Ste C, Cerritos, CA 90703
P: 562.219.7435 F: 562.219.7436
07-Aug-15Date:ASSET Laboratories
Project: SFPP - Norwalk SiteCLIENT: CH2MHill
Lab Order: N016471CASE NARRATIVE
SAMPLE RECEIVING/GENERAL COMMENTS:
Sample was received intact with proper chain of custody documentation.
Cooler temperature and sample preservation were verified upon receipt of samples if applicable.
Information on sample receipt conditions including discrepancies can be found in attached Sample Receipt Checklist Form.
Sample was analyzed within method holding time.
Page 2 of 16
02 of 17

NEVADA3151 W. Post Rd., Las Vegas, NV 89118
P: 702.307.2659 F: 702.307.2691
“Serving Clients with Passion and Professionalism”
CALIFORNIA11060 Artesia Blvd., Ste C, Cerritos, CA 90703
P: 562.219.7435 F: 562.219.7436
07-Aug-15Date:ASSET Laboratories
Project: SFPP - Norwalk SiteCLIENT: CH2MHill
Lab Order: N016471Work Order Sample Summary
Lab Sample ID Client Sample ID Collection DateMatrix Date Received
Contract No:
Date Reported
N016471-001A INF-07-30 7/30/2015 9:45:00 AM 7/31/2015 8/7/2015Wastewater
N016471-001B INF-07-30 7/30/2015 9:45:00 AM 7/31/2015 8/7/2015Wastewater
Page 1 of 1
03 of 17
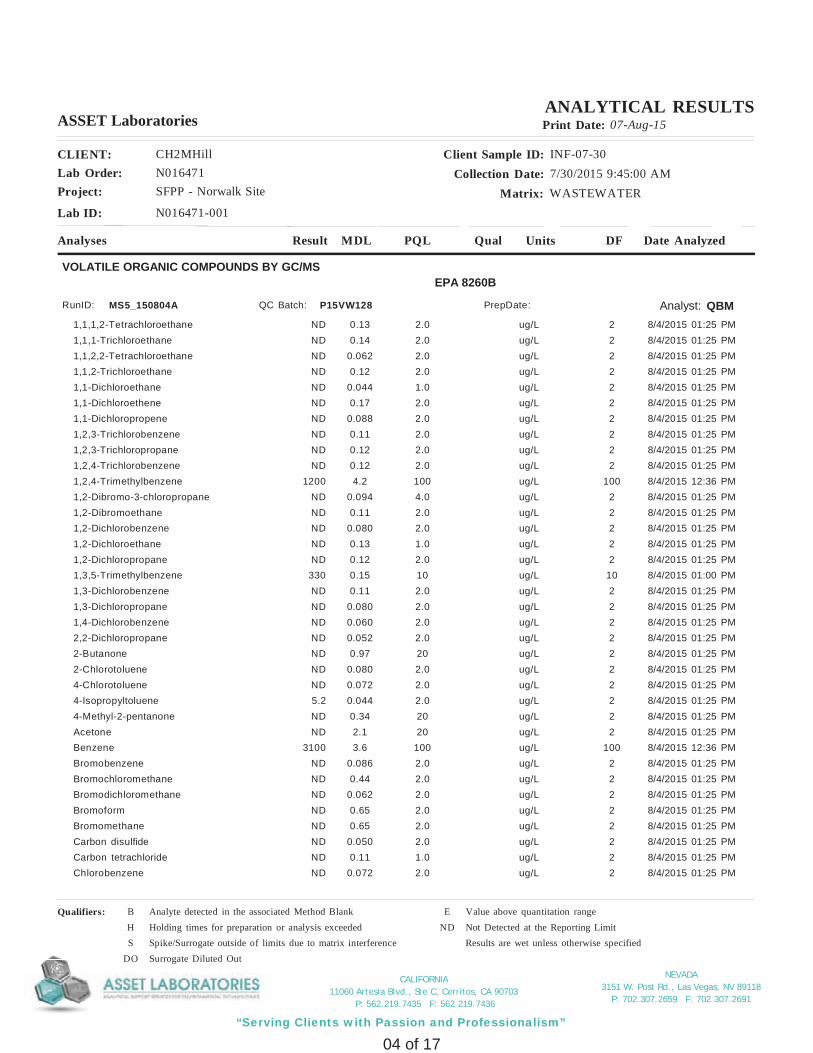
NEVADA3151 W. Post Rd., Las Vegas, NV 89118
P: 702.307.2659 F: 702.307.2691
“Serving Clients with Passion and Professionalism”
CALIFORNIA11060 Artesia Blvd., Ste C, Cerritos, CA 90703
P: 562.219.7435 F: 562.219.7436
Project: SFPP - Norwalk Site
Client Sample ID: INF-07-30Collection Date: 7/30/2015 9:45:00 AM
Matrix: WASTEWATER
CLIENT: CH2MHillLab Order: N016471
Lab ID: N016471-001
ASSET Laboratories Print Date: 07-Aug-15
Analyses Result Qual Units Date AnalyzedDFPQLMDL
ANALYTICAL RESULTS
VOLATILE ORGANIC COMPOUNDS BY GC/MSEPA 8260B
Analyst: QBMRunID: MS5_150804A P15VW128QC Batch: PrepDate:
1,1,1,2-Tetrachloroethane 2.0 ug/L 2ND 0.13 8/4/2015 01:25 PM1,1,1-Trichloroethane 2.0 ug/L 2ND 0.14 8/4/2015 01:25 PM1,1,2,2-Tetrachloroethane 2.0 ug/L 2ND 0.062 8/4/2015 01:25 PM1,1,2-Trichloroethane 2.0 ug/L 2ND 0.12 8/4/2015 01:25 PM1,1-Dichloroethane 1.0 ug/L 2ND 0.044 8/4/2015 01:25 PM1,1-Dichloroethene 2.0 ug/L 2ND 0.17 8/4/2015 01:25 PM1,1-Dichloropropene 2.0 ug/L 2ND 0.088 8/4/2015 01:25 PM1,2,3-Trichlorobenzene 2.0 ug/L 2ND 0.11 8/4/2015 01:25 PM1,2,3-Trichloropropane 2.0 ug/L 2ND 0.12 8/4/2015 01:25 PM1,2,4-Trichlorobenzene 2.0 ug/L 2ND 0.12 8/4/2015 01:25 PM1,2,4-Trimethylbenzene 100 ug/L 1001200 4.2 8/4/2015 12:36 PM1,2-Dibromo-3-chloropropane 4.0 ug/L 2ND 0.094 8/4/2015 01:25 PM1,2-Dibromoethane 2.0 ug/L 2ND 0.11 8/4/2015 01:25 PM1,2-Dichlorobenzene 2.0 ug/L 2ND 0.080 8/4/2015 01:25 PM1,2-Dichloroethane 1.0 ug/L 2ND 0.13 8/4/2015 01:25 PM1,2-Dichloropropane 2.0 ug/L 2ND 0.12 8/4/2015 01:25 PM1,3,5-Trimethylbenzene 10 ug/L 10330 0.15 8/4/2015 01:00 PM1,3-Dichlorobenzene 2.0 ug/L 2ND 0.11 8/4/2015 01:25 PM1,3-Dichloropropane 2.0 ug/L 2ND 0.080 8/4/2015 01:25 PM1,4-Dichlorobenzene 2.0 ug/L 2ND 0.060 8/4/2015 01:25 PM2,2-Dichloropropane 2.0 ug/L 2ND 0.052 8/4/2015 01:25 PM2-Butanone 20 ug/L 2ND 0.97 8/4/2015 01:25 PM2-Chlorotoluene 2.0 ug/L 2ND 0.080 8/4/2015 01:25 PM4-Chlorotoluene 2.0 ug/L 2ND 0.072 8/4/2015 01:25 PM4-Isopropyltoluene 2.0 ug/L 25.2 0.044 8/4/2015 01:25 PM4-Methyl-2-pentanone 20 ug/L 2ND 0.34 8/4/2015 01:25 PMAcetone 20 ug/L 2ND 2.1 8/4/2015 01:25 PMBenzene 100 ug/L 1003100 3.6 8/4/2015 12:36 PMBromobenzene 2.0 ug/L 2ND 0.086 8/4/2015 01:25 PMBromochloromethane 2.0 ug/L 2ND 0.44 8/4/2015 01:25 PMBromodichloromethane 2.0 ug/L 2ND 0.062 8/4/2015 01:25 PMBromoform 2.0 ug/L 2ND 0.65 8/4/2015 01:25 PMBromomethane 2.0 ug/L 2ND 0.65 8/4/2015 01:25 PMCarbon disulfide 2.0 ug/L 2ND 0.050 8/4/2015 01:25 PMCarbon tetrachloride 1.0 ug/L 2ND 0.11 8/4/2015 01:25 PMChlorobenzene 2.0 ug/L 2ND 0.072 8/4/2015 01:25 PM
Qualifiers: B Analyte detected in the associated Method Blank E Value above quantitation rangeH Holding times for preparation or analysis exceeded ND Not Detected at the Reporting LimitS Spike/Surrogate outside of limits due to matrix interference Results are wet unless otherwise specified
DO Surrogate Diluted Out
04 of 17
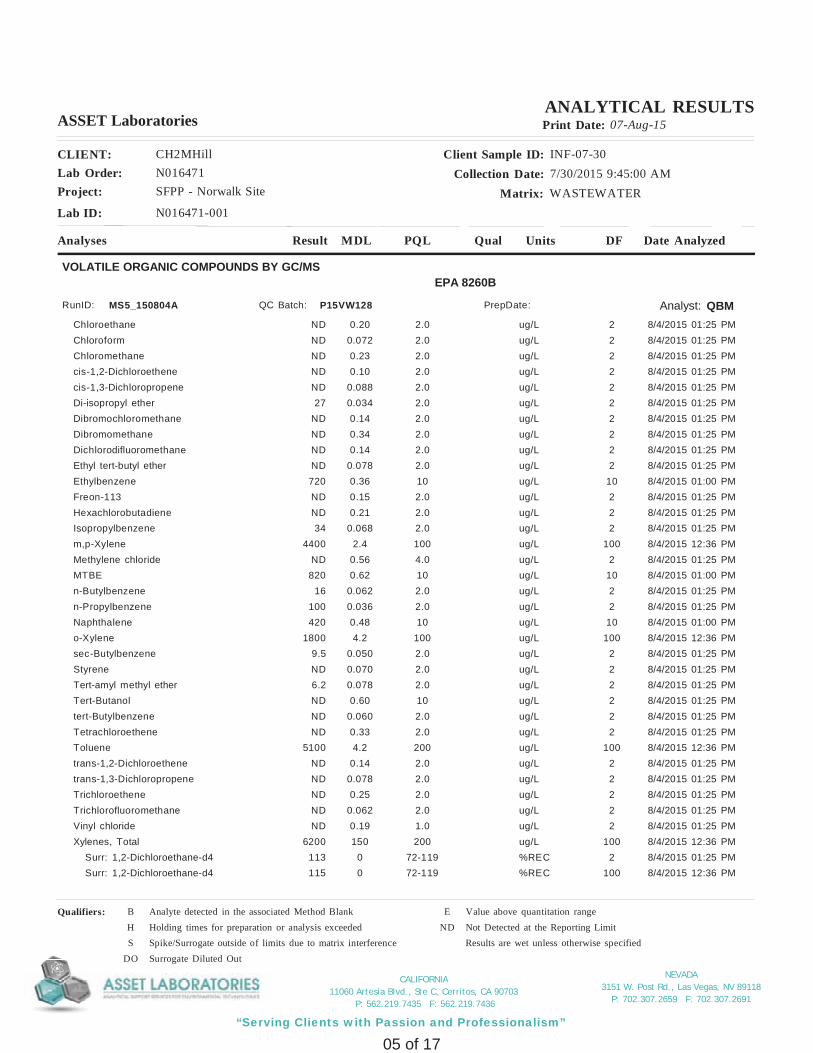
NEVADA3151 W. Post Rd., Las Vegas, NV 89118
P: 702.307.2659 F: 702.307.2691
“Serving Clients with Passion and Professionalism”
CALIFORNIA11060 Artesia Blvd., Ste C, Cerritos, CA 90703
P: 562.219.7435 F: 562.219.7436
Project: SFPP - Norwalk Site
Client Sample ID: INF-07-30Collection Date: 7/30/2015 9:45:00 AM
Matrix: WASTEWATER
CLIENT: CH2MHillLab Order: N016471
Lab ID: N016471-001
ASSET Laboratories Print Date: 07-Aug-15
Analyses Result Qual Units Date AnalyzedDFPQLMDL
ANALYTICAL RESULTS
VOLATILE ORGANIC COMPOUNDS BY GC/MSEPA 8260B
Analyst: QBMRunID: MS5_150804A P15VW128QC Batch: PrepDate:
Chloroethane 2.0 ug/L 2ND 0.20 8/4/2015 01:25 PMChloroform 2.0 ug/L 2ND 0.072 8/4/2015 01:25 PMChloromethane 2.0 ug/L 2ND 0.23 8/4/2015 01:25 PMcis-1,2-Dichloroethene 2.0 ug/L 2ND 0.10 8/4/2015 01:25 PMcis-1,3-Dichloropropene 2.0 ug/L 2ND 0.088 8/4/2015 01:25 PMDi-isopropyl ether 2.0 ug/L 227 0.034 8/4/2015 01:25 PMDibromochloromethane 2.0 ug/L 2ND 0.14 8/4/2015 01:25 PMDibromomethane 2.0 ug/L 2ND 0.34 8/4/2015 01:25 PMDichlorodifluoromethane 2.0 ug/L 2ND 0.14 8/4/2015 01:25 PMEthyl tert-butyl ether 2.0 ug/L 2ND 0.078 8/4/2015 01:25 PMEthylbenzene 10 ug/L 10720 0.36 8/4/2015 01:00 PMFreon-113 2.0 ug/L 2ND 0.15 8/4/2015 01:25 PMHexachlorobutadiene 2.0 ug/L 2ND 0.21 8/4/2015 01:25 PMIsopropylbenzene 2.0 ug/L 234 0.068 8/4/2015 01:25 PMm,p-Xylene 100 ug/L 1004400 2.4 8/4/2015 12:36 PMMethylene chloride 4.0 ug/L 2ND 0.56 8/4/2015 01:25 PMMTBE 10 ug/L 10820 0.62 8/4/2015 01:00 PMn-Butylbenzene 2.0 ug/L 216 0.062 8/4/2015 01:25 PMn-Propylbenzene 2.0 ug/L 2100 0.036 8/4/2015 01:25 PMNaphthalene 10 ug/L 10420 0.48 8/4/2015 01:00 PMo-Xylene 100 ug/L 1001800 4.2 8/4/2015 12:36 PMsec-Butylbenzene 2.0 ug/L 29.5 0.050 8/4/2015 01:25 PMStyrene 2.0 ug/L 2ND 0.070 8/4/2015 01:25 PMTert-amyl methyl ether 2.0 ug/L 26.2 0.078 8/4/2015 01:25 PMTert-Butanol 10 ug/L 2ND 0.60 8/4/2015 01:25 PMtert-Butylbenzene 2.0 ug/L 2ND 0.060 8/4/2015 01:25 PMTetrachloroethene 2.0 ug/L 2ND 0.33 8/4/2015 01:25 PMToluene 200 ug/L 1005100 4.2 8/4/2015 12:36 PMtrans-1,2-Dichloroethene 2.0 ug/L 2ND 0.14 8/4/2015 01:25 PMtrans-1,3-Dichloropropene 2.0 ug/L 2ND 0.078 8/4/2015 01:25 PMTrichloroethene 2.0 ug/L 2ND 0.25 8/4/2015 01:25 PMTrichlorofluoromethane 2.0 ug/L 2ND 0.062 8/4/2015 01:25 PMVinyl chloride 1.0 ug/L 2ND 0.19 8/4/2015 01:25 PMXylenes, Total 200 ug/L 1006200 150 8/4/2015 12:36 PM Surr: 1,2-Dichloroethane-d4 72-119 %REC 2113 0 8/4/2015 01:25 PM Surr: 1,2-Dichloroethane-d4 72-119 %REC 100115 0 8/4/2015 12:36 PM
Qualifiers: B Analyte detected in the associated Method Blank E Value above quantitation rangeH Holding times for preparation or analysis exceeded ND Not Detected at the Reporting LimitS Spike/Surrogate outside of limits due to matrix interference Results are wet unless otherwise specified
DO Surrogate Diluted Out
05 of 17

NEVADA3151 W. Post Rd., Las Vegas, NV 89118
P: 702.307.2659 F: 702.307.2691
“Serving Clients with Passion and Professionalism”
CALIFORNIA11060 Artesia Blvd., Ste C, Cerritos, CA 90703
P: 562.219.7435 F: 562.219.7436
Project: SFPP - Norwalk Site
Client Sample ID: INF-07-30Collection Date: 7/30/2015 9:45:00 AM
Matrix: WASTEWATER
CLIENT: CH2MHillLab Order: N016471
Lab ID: N016471-001
ASSET Laboratories Print Date: 07-Aug-15
Analyses Result Qual Units Date AnalyzedDFPQLMDL
ANALYTICAL RESULTS
VOLATILE ORGANIC COMPOUNDS BY GC/MSEPA 8260B
Analyst: QBMRunID: MS5_150804A P15VW128QC Batch: PrepDate:
Surr: 1,2-Dichloroethane-d4 72-119 %REC 10116 0 8/4/2015 01:00 PM Surr: 4-Bromofluorobenzene 76-119 %REC 100104 0 8/4/2015 12:36 PM Surr: 4-Bromofluorobenzene 76-119 %REC 2107 0 8/4/2015 01:25 PM Surr: 4-Bromofluorobenzene 76-119 %REC 10105 0 8/4/2015 01:00 PM Surr: Dibromofluoromethane 85-115 %REC 100110 0 8/4/2015 12:36 PM Surr: Dibromofluoromethane 85-115 %REC 2104 0 8/4/2015 01:25 PM Surr: Dibromofluoromethane 85-115 %REC 10110 0 8/4/2015 01:00 PM Surr: Toluene-d8 81-120 %REC 2105 0 8/4/2015 01:25 PM Surr: Toluene-d8 81-120 %REC 10104 0 8/4/2015 01:00 PM Surr: Toluene-d8 81-120 %REC 100103 0 8/4/2015 12:36 PM
TPH EXTRACTABLE BY GC/FIDEPA 8015B
Analyst: JAA
EPA 3510C
RunID: GC3_150803A 51105QC Batch: PrepDate: 8/3/2015
TPH-Diesel (C13-C22) 260 ug/L 1016000 160 8/4/2015 12:06 AMTPH-Oil (C23-C36) 26 ug/L 1570 14 8/4/2015 02:17 AM Surr: Octacosane 26-152 %REC 1100 0 8/4/2015 02:17 AM Surr: p-Terphenyl 57-132 %REC 1115 0 8/4/2015 02:17 AM
GASOLINE RANGE ORGANICS BY GC/FIDEPA 8015B
Analyst: QBMRunID: GC4_150731A E15VW049QC Batch: PrepDate:
TPH-Gasoline (C4-C12) 500 ug/L 1031000 160 7/31/2015 02:38 PM Surr: Chlorobenzene - d5 74-138 %REC 1081.0 0 7/31/2015 02:38 PM
TOTAL TPHEPA 8015B
Analyst: JAA
EPA 3510C
RunID: GC3_150803A 51105QC Batch: PrepDate: 8/3/2015
Total TPH 50 ug/L 147570 16 8/4/2015 02:17 AM
Qualifiers: B Analyte detected in the associated Method Blank E Value above quantitation rangeH Holding times for preparation or analysis exceeded ND Not Detected at the Reporting LimitS Spike/Surrogate outside of limits due to matrix interference Results are wet unless otherwise specified
DO Surrogate Diluted Out
06 of 17

NEVADA3151 W. Post Rd., Las Vegas, NV 89118
P: 702.307.2659 F: 702.307.2691
“Serving Clients with Passion and Professionalism”
CALIFORNIA11060 Artesia Blvd., Ste C, Cerritos, CA 90703
P: 562.219.7435 F: 562.219.7436
07-Aug-15Date:ASSET Laboratories
Project: SFPP - Norwalk Site
CLIENT: CH2MHillWork Order: N016471
ANALYTICAL QC SUMMARY REPORTTestCode: 8015_W_FP_SFPP
Sample ID: MB-51105
Batch ID: 51105 TestNo: EPA 8015B Analysis Date: 8/3/2015
Prep Date: 8/3/2015
Analyte Result SPK value SPK Ref Val %REC RPD Ref Val %RPDLowLimit HighLimit RPDLimit Qual
Units: ug/L
PQL
Client ID: PBW
RunNo: 101542
SeqNo: 2056172
MBLKSampType: TestCode: 8015_W_FP_
EPA 3510C
TPH-Diesel (C13-C22) N25NDTPH-Oil (C23-C36) N25ND Surr: Octacosane 80.00 84.9 26 15267.913 Surr: p-Terphenyl 80.00 99.4 57 13279.517
Qualifiers: B Analyte detected in the associated Method Blank E Value above quantitation range H Holding times for preparation or analysis exceededN Parameter not NELAC certified ND Not Detected at the Reporting Limit R RPD outside accepted recovery limitsS Spike/Surrogate outside of limits due to matrix interference DO Surrogate Diluted Out Calculations are based on raw values
07 of 17
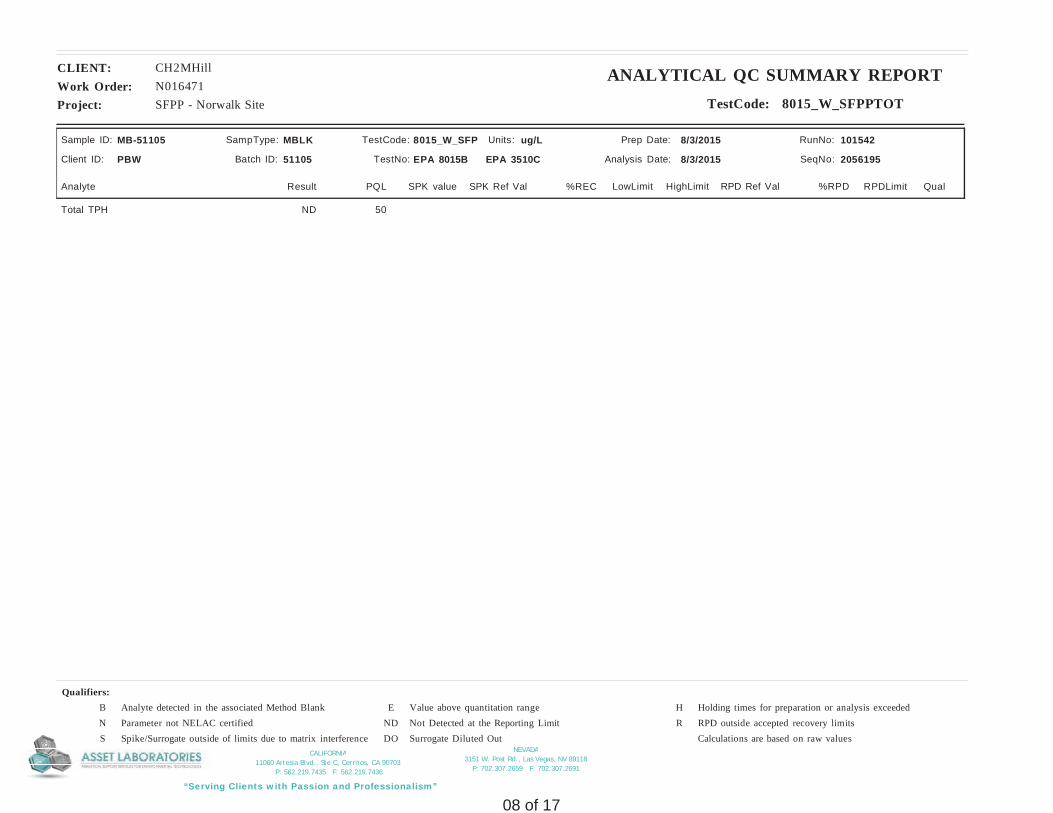
NEVADA3151 W. Post Rd., Las Vegas, NV 89118
P: 702.307.2659 F: 702.307.2691
“Serving Clients with Passion and Professionalism”
CALIFORNIA11060 Artesia Blvd., Ste C, Cerritos, CA 90703
P: 562.219.7435 F: 562.219.7436
Project: SFPP - Norwalk Site
CLIENT: CH2MHillWork Order: N016471
ANALYTICAL QC SUMMARY REPORTTestCode: 8015_W_SFPPTOT
Sample ID: MB-51105
Batch ID: 51105 TestNo: EPA 8015B Analysis Date: 8/3/2015
Prep Date: 8/3/2015
Analyte Result SPK value SPK Ref Val %REC RPD Ref Val %RPDLowLimit HighLimit RPDLimit Qual
Units: ug/L
PQL
Client ID: PBW
RunNo: 101542
SeqNo: 2056195
MBLKSampType: TestCode: 8015_W_SFP
EPA 3510C
Total TPH N50ND
Qualifiers: B Analyte detected in the associated Method Blank E Value above quantitation range H Holding times for preparation or analysis exceededN Parameter not NELAC certified ND Not Detected at the Reporting Limit R RPD outside accepted recovery limitsS Spike/Surrogate outside of limits due to matrix interference DO Surrogate Diluted Out Calculations are based on raw values
08 of 17

NEVADA3151 W. Post Rd., Las Vegas, NV 89118
P: 702.307.2659 F: 702.307.2691
“Serving Clients with Passion and Professionalism”
CALIFORNIA11060 Artesia Blvd., Ste C, Cerritos, CA 90703
P: 562.219.7435 F: 562.219.7436
Project: SFPP - Norwalk Site
CLIENT: CH2MHillWork Order: N016471
ANALYTICAL QC SUMMARY REPORTTestCode: 8015GAS_WSFPP
Sample ID: E150731LCS
Batch ID: E15VW049 TestNo: EPA 8015B Analysis Date: 7/31/2015
Prep Date:
Analyte Result SPK value SPK Ref Val %REC RPD Ref Val %RPDLowLimit HighLimit RPDLimit Qual
Units: ug/L
PQL
Client ID: LCSW
RunNo: 101525
SeqNo: 2055704
LCSSampType: TestCode: 8015GAS_WS
TPH-Gasoline (C4-C12) 1000 86.5 67 13650 0865.000 Surr: Chlorobenzene - d5 50000 94.2 74 13847101.000
Sample ID: E150731MB2
Batch ID: E15VW049 TestNo: EPA 8015B Analysis Date: 7/31/2015
Prep Date:
Analyte Result SPK value SPK Ref Val %REC RPD Ref Val %RPDLowLimit HighLimit RPDLimit Qual
Units: ug/L
PQL
Client ID: PBW
RunNo: 101525
SeqNo: 2055706
MBLKSampType: TestCode: 8015GAS_WS
TPH-Gasoline (C4-C12) 5029.000 Surr: Chlorobenzene - d5 50000 90.9 74 13845432.000
Sample ID: N016470-001JMS
Batch ID: E15VW049 TestNo: EPA 8015B Analysis Date: 7/31/2015
Prep Date:
Analyte Result SPK value SPK Ref Val %REC RPD Ref Val %RPDLowLimit HighLimit RPDLimit Qual
Units: ug/L
PQL
Client ID: ZZZZZZ
RunNo: 101525
SeqNo: 2055709
MSSampType: TestCode: 8015GAS_WS
TPH-Gasoline (C4-C12) 1000 81.8 67 13650 30.00848.000 Surr: Chlorobenzene - d5 50000 94.6 74 13847301.000
Sample ID: N016470-001JMSD
Batch ID: E15VW049 TestNo: EPA 8015B Analysis Date: 7/31/2015
Prep Date:
Analyte Result SPK value SPK Ref Val %REC RPD Ref Val %RPDLowLimit HighLimit RPDLimit Qual
Units: ug/L
PQL
Client ID: ZZZZZZ
RunNo: 101525
SeqNo: 2055710
MSDSampType: TestCode: 8015GAS_WS
TPH-Gasoline (C4-C12) 1000 81.3 67 136 3050 30.00 848.0 0.591843.000 Surr: Chlorobenzene - d5 50000 96.8 74 138 0048416.000
Qualifiers: B Analyte detected in the associated Method Blank E Value above quantitation range H Holding times for preparation or analysis exceededN Parameter not NELAC certified ND Not Detected at the Reporting Limit R RPD outside accepted recovery limitsS Spike/Surrogate outside of limits due to matrix interference DO Surrogate Diluted Out Calculations are based on raw values
09 of 17
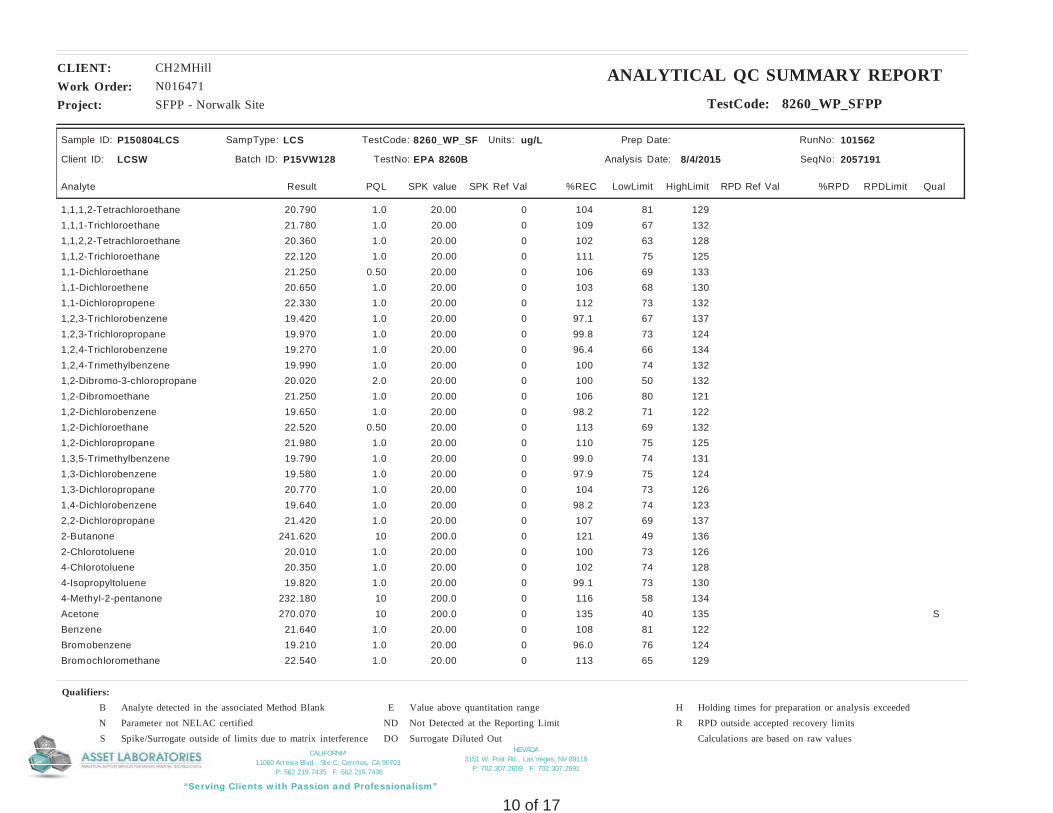
NEVADA3151 W. Post Rd., Las Vegas, NV 89118
P: 702.307.2659 F: 702.307.2691
“Serving Clients with Passion and Professionalism”
CALIFORNIA11060 Artesia Blvd., Ste C, Cerritos, CA 90703
P: 562.219.7435 F: 562.219.7436
Project: SFPP - Norwalk Site
CLIENT: CH2MHillWork Order: N016471
ANALYTICAL QC SUMMARY REPORTTestCode: 8260_WP_SFPP
Sample ID: P150804LCS
Batch ID: P15VW128 TestNo: EPA 8260B Analysis Date: 8/4/2015
Prep Date:
Analyte Result SPK value SPK Ref Val %REC RPD Ref Val %RPDLowLimit HighLimit RPDLimit Qual
Units: ug/L
PQL
Client ID: LCSW
RunNo: 101562
SeqNo: 2057191
LCSSampType: TestCode: 8260_WP_SF
1,1,1,2-Tetrachloroethane 20.00 104 81 1291.0 020.7901,1,1-Trichloroethane 20.00 109 67 1321.0 021.7801,1,2,2-Tetrachloroethane 20.00 102 63 1281.0 020.3601,1,2-Trichloroethane 20.00 111 75 1251.0 022.1201,1-Dichloroethane 20.00 106 69 1330.50 021.2501,1-Dichloroethene 20.00 103 68 1301.0 020.6501,1-Dichloropropene 20.00 112 73 1321.0 022.3301,2,3-Trichlorobenzene 20.00 97.1 67 1371.0 019.4201,2,3-Trichloropropane 20.00 99.8 73 1241.0 019.9701,2,4-Trichlorobenzene 20.00 96.4 66 1341.0 019.2701,2,4-Trimethylbenzene 20.00 100 74 1321.0 019.9901,2-Dibromo-3-chloropropane 20.00 100 50 1322.0 020.0201,2-Dibromoethane 20.00 106 80 1211.0 021.2501,2-Dichlorobenzene 20.00 98.2 71 1221.0 019.6501,2-Dichloroethane 20.00 113 69 1320.50 022.5201,2-Dichloropropane 20.00 110 75 1251.0 021.9801,3,5-Trimethylbenzene 20.00 99.0 74 1311.0 019.7901,3-Dichlorobenzene 20.00 97.9 75 1241.0 019.5801,3-Dichloropropane 20.00 104 73 1261.0 020.7701,4-Dichlorobenzene 20.00 98.2 74 1231.0 019.6402,2-Dichloropropane 20.00 107 69 1371.0 021.4202-Butanone 200.0 121 49 13610 0241.6202-Chlorotoluene 20.00 100 73 1261.0 020.0104-Chlorotoluene 20.00 102 74 1281.0 020.3504-Isopropyltoluene 20.00 99.1 73 1301.0 019.8204-Methyl-2-pentanone 200.0 116 58 13410 0232.180Acetone 200.0 135 40 135 S10 0270.070Benzene 20.00 108 81 1221.0 021.640Bromobenzene 20.00 96.0 76 1241.0 019.210Bromochloromethane 20.00 113 65 1291.0 022.540
Qualifiers: B Analyte detected in the associated Method Blank E Value above quantitation range H Holding times for preparation or analysis exceededN Parameter not NELAC certified ND Not Detected at the Reporting Limit R RPD outside accepted recovery limitsS Spike/Surrogate outside of limits due to matrix interference DO Surrogate Diluted Out Calculations are based on raw values
10 of 17

NEVADA3151 W. Post Rd., Las Vegas, NV 89118
P: 702.307.2659 F: 702.307.2691
“Serving Clients with Passion and Professionalism”
CALIFORNIA11060 Artesia Blvd., Ste C, Cerritos, CA 90703
P: 562.219.7435 F: 562.219.7436
Project: SFPP - Norwalk Site
CLIENT: CH2MHillWork Order: N016471
ANALYTICAL QC SUMMARY REPORTTestCode: 8260_WP_SFPP
Sample ID: P150804LCS
Batch ID: P15VW128 TestNo: EPA 8260B Analysis Date: 8/4/2015
Prep Date:
Analyte Result SPK value SPK Ref Val %REC RPD Ref Val %RPDLowLimit HighLimit RPDLimit Qual
Units: ug/L
PQL
Client ID: LCSW
RunNo: 101562
SeqNo: 2057191
LCSSampType: TestCode: 8260_WP_SF
Bromodichloromethane 20.00 120 76 1211.0 023.990Bromoform 20.00 106 69 1281.0 021.270Bromomethane 20.00 121 53 1411.0 024.220Carbon disulfide 20.00 113 75 1251.0 022.520Carbon tetrachloride 20.00 101 66 1380.50 020.270Chlorobenzene 20.00 101 81 1221.0 020.130Chloroethane 20.00 237 58 133 S1.0 047.480Chloroform 20.00 110 69 1281.0 022.060Chloromethane 20.00 119 56 1311.0 023.850cis-1,2-Dichloroethene 20.00 107 72 1261.0 021.370cis-1,3-Dichloropropene 20.00 111 69 1311.0 022.110Di-isopropyl ether 20.00 118 70 1301.0 023.600Dibromochloromethane 20.00 101 66 1331.0 020.240Dibromomethane 20.00 109 76 1251.0 021.780Dichlorodifluoromethane 20.00 109 53 1531.0 021.710Ethyl tert-butyl ether 20.00 110 70 1301.0 022.000Ethylbenzene 20.00 101 73 1271.0 020.190Freon-113 20.00 110 75 1251.0 021.900Hexachlorobutadiene 20.00 93.7 67 1311.0 018.740Isopropylbenzene 20.00 98.8 75 1271.0 019.760m,p-Xylene 40.00 102 76 1281.0 040.820Methylene chloride 20.00 105 63 1372.0 021.050MTBE 20.00 108 65 1231.0 021.650n-Butylbenzene 20.00 103 69 1371.0 020.660n-Propylbenzene 20.00 101 72 1291.0 020.140Naphthalene 20.00 100 54 1381.0 020.010o-Xylene 20.00 102 80 1211.0 020.380sec-Butylbenzene 20.00 99.5 72 1271.0 019.900Styrene 20.00 101 65 1341.0 020.200Tert-amyl methyl ether 20.00 103 70 1301.0 020.610
Qualifiers: B Analyte detected in the associated Method Blank E Value above quantitation range H Holding times for preparation or analysis exceededN Parameter not NELAC certified ND Not Detected at the Reporting Limit R RPD outside accepted recovery limitsS Spike/Surrogate outside of limits due to matrix interference DO Surrogate Diluted Out Calculations are based on raw values
11 of 17

NEVADA3151 W. Post Rd., Las Vegas, NV 89118
P: 702.307.2659 F: 702.307.2691
“Serving Clients with Passion and Professionalism”
CALIFORNIA11060 Artesia Blvd., Ste C, Cerritos, CA 90703
P: 562.219.7435 F: 562.219.7436
Project: SFPP - Norwalk Site
CLIENT: CH2MHillWork Order: N016471
ANALYTICAL QC SUMMARY REPORTTestCode: 8260_WP_SFPP
Sample ID: P150804LCS
Batch ID: P15VW128 TestNo: EPA 8260B Analysis Date: 8/4/2015
Prep Date:
Analyte Result SPK value SPK Ref Val %REC RPD Ref Val %RPDLowLimit HighLimit RPDLimit Qual
Units: ug/L
PQL
Client ID: LCSW
RunNo: 101562
SeqNo: 2057191
LCSSampType: TestCode: 8260_WP_SF
Tert-Butanol 100.0 95.0 70 1305.0 094.970tert-Butylbenzene 20.00 98.4 70 1291.0 019.680Tetrachloroethene 20.00 102 66 1281.0 020.300Toluene 20.00 109 77 1222.0 021.810trans-1,2-Dichloroethene 20.00 108 63 1371.0 021.680trans-1,3-Dichloropropene 20.00 109 59 1351.0 021.850Trichloroethene 20.00 106 70 1271.0 021.160Trichlorofluoromethane 20.00 121 57 1291.0 024.290Vinyl chloride 20.00 104 50 1340.50 020.780Xylenes, Total 60.00 102 75 1252.0 061.200 Surr: 1,2-Dichloroethane-d4 25.00 114 72 11928.580 Surr: 4-Bromofluorobenzene 25.00 108 76 11926.920 Surr: Dibromofluoromethane 25.00 110 85 11527.590 Surr: Toluene-d8 25.00 107 81 12026.840
Sample ID: P150804LCSD
Batch ID: P15VW128 TestNo: EPA 8260B Analysis Date: 8/4/2015
Prep Date:
Analyte Result SPK value SPK Ref Val %REC RPD Ref Val %RPDLowLimit HighLimit RPDLimit Qual
Units: ug/L
PQL
Client ID: LCSS02
RunNo: 101562
SeqNo: 2057192
LCSDSampType: TestCode: 8260_WP_SF
1,1,1,2-Tetrachloroethane 20.00 105 81 129 201.0 0 20.79 0.81420.9601,1,1-Trichloroethane 20.00 112 67 132 201.0 0 21.78 3.0322.4501,1,2,2-Tetrachloroethane 20.00 104 63 128 201.0 0 20.36 2.4320.8601,1,2-Trichloroethane 20.00 110 75 125 201.0 0 22.12 0.27222.0601,1-Dichloroethane 20.00 109 69 133 200.50 0 21.25 2.6021.8101,1-Dichloroethene 20.00 112 68 130 201.0 0 20.65 8.0022.3701,1-Dichloropropene 20.00 111 73 132 201.0 0 22.33 0.58422.2001,2,3-Trichlorobenzene 20.00 98.9 67 137 201.0 0 19.42 1.8419.7801,2,3-Trichloropropane 20.00 102 73 124 201.0 0 19.97 1.7420.3201,2,4-Trichlorobenzene 20.00 98.6 66 134 201.0 0 19.27 2.3119.7201,2,4-Trimethylbenzene 20.00 102 74 132 201.0 0 19.99 1.5920.310
Qualifiers: B Analyte detected in the associated Method Blank E Value above quantitation range H Holding times for preparation or analysis exceededN Parameter not NELAC certified ND Not Detected at the Reporting Limit R RPD outside accepted recovery limitsS Spike/Surrogate outside of limits due to matrix interference DO Surrogate Diluted Out Calculations are based on raw values
12 of 17
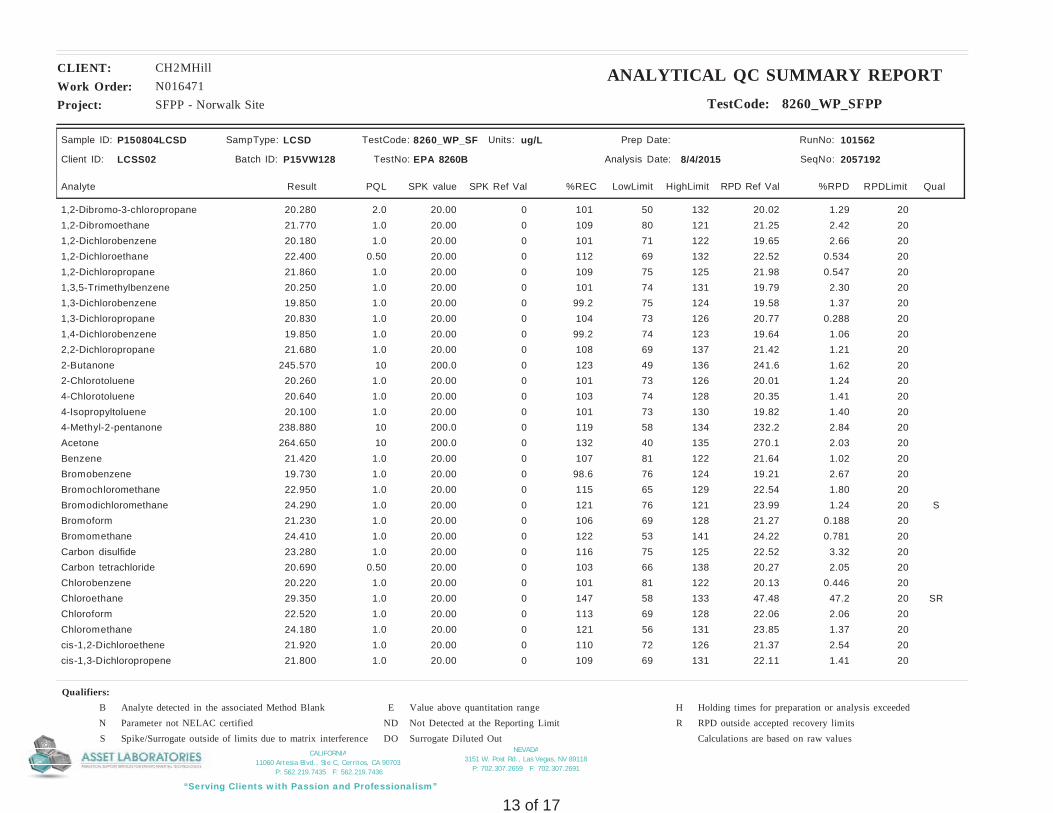
NEVADA3151 W. Post Rd., Las Vegas, NV 89118
P: 702.307.2659 F: 702.307.2691
“Serving Clients with Passion and Professionalism”
CALIFORNIA11060 Artesia Blvd., Ste C, Cerritos, CA 90703
P: 562.219.7435 F: 562.219.7436
Project: SFPP - Norwalk Site
CLIENT: CH2MHillWork Order: N016471
ANALYTICAL QC SUMMARY REPORTTestCode: 8260_WP_SFPP
Sample ID: P150804LCSD
Batch ID: P15VW128 TestNo: EPA 8260B Analysis Date: 8/4/2015
Prep Date:
Analyte Result SPK value SPK Ref Val %REC RPD Ref Val %RPDLowLimit HighLimit RPDLimit Qual
Units: ug/L
PQL
Client ID: LCSS02
RunNo: 101562
SeqNo: 2057192
LCSDSampType: TestCode: 8260_WP_SF
1,2-Dibromo-3-chloropropane 20.00 101 50 132 202.0 0 20.02 1.2920.2801,2-Dibromoethane 20.00 109 80 121 201.0 0 21.25 2.4221.7701,2-Dichlorobenzene 20.00 101 71 122 201.0 0 19.65 2.6620.1801,2-Dichloroethane 20.00 112 69 132 200.50 0 22.52 0.53422.4001,2-Dichloropropane 20.00 109 75 125 201.0 0 21.98 0.54721.8601,3,5-Trimethylbenzene 20.00 101 74 131 201.0 0 19.79 2.3020.2501,3-Dichlorobenzene 20.00 99.2 75 124 201.0 0 19.58 1.3719.8501,3-Dichloropropane 20.00 104 73 126 201.0 0 20.77 0.28820.8301,4-Dichlorobenzene 20.00 99.2 74 123 201.0 0 19.64 1.0619.8502,2-Dichloropropane 20.00 108 69 137 201.0 0 21.42 1.2121.6802-Butanone 200.0 123 49 136 2010 0 241.6 1.62245.5702-Chlorotoluene 20.00 101 73 126 201.0 0 20.01 1.2420.2604-Chlorotoluene 20.00 103 74 128 201.0 0 20.35 1.4120.6404-Isopropyltoluene 20.00 101 73 130 201.0 0 19.82 1.4020.1004-Methyl-2-pentanone 200.0 119 58 134 2010 0 232.2 2.84238.880Acetone 200.0 132 40 135 2010 0 270.1 2.03264.650Benzene 20.00 107 81 122 201.0 0 21.64 1.0221.420Bromobenzene 20.00 98.6 76 124 201.0 0 19.21 2.6719.730Bromochloromethane 20.00 115 65 129 201.0 0 22.54 1.8022.950Bromodichloromethane 20.00 121 76 121 20 S1.0 0 23.99 1.2424.290Bromoform 20.00 106 69 128 201.0 0 21.27 0.18821.230Bromomethane 20.00 122 53 141 201.0 0 24.22 0.78124.410Carbon disulfide 20.00 116 75 125 201.0 0 22.52 3.3223.280Carbon tetrachloride 20.00 103 66 138 200.50 0 20.27 2.0520.690Chlorobenzene 20.00 101 81 122 201.0 0 20.13 0.44620.220Chloroethane 20.00 147 58 133 20 SR1.0 0 47.48 47.229.350Chloroform 20.00 113 69 128 201.0 0 22.06 2.0622.520Chloromethane 20.00 121 56 131 201.0 0 23.85 1.3724.180cis-1,2-Dichloroethene 20.00 110 72 126 201.0 0 21.37 2.5421.920cis-1,3-Dichloropropene 20.00 109 69 131 201.0 0 22.11 1.4121.800
Qualifiers: B Analyte detected in the associated Method Blank E Value above quantitation range H Holding times for preparation or analysis exceededN Parameter not NELAC certified ND Not Detected at the Reporting Limit R RPD outside accepted recovery limitsS Spike/Surrogate outside of limits due to matrix interference DO Surrogate Diluted Out Calculations are based on raw values
13 of 17

NEVADA3151 W. Post Rd., Las Vegas, NV 89118
P: 702.307.2659 F: 702.307.2691
“Serving Clients with Passion and Professionalism”
CALIFORNIA11060 Artesia Blvd., Ste C, Cerritos, CA 90703
P: 562.219.7435 F: 562.219.7436
Project: SFPP - Norwalk Site
CLIENT: CH2MHillWork Order: N016471
ANALYTICAL QC SUMMARY REPORTTestCode: 8260_WP_SFPP
Sample ID: P150804LCSD
Batch ID: P15VW128 TestNo: EPA 8260B Analysis Date: 8/4/2015
Prep Date:
Analyte Result SPK value SPK Ref Val %REC RPD Ref Val %RPDLowLimit HighLimit RPDLimit Qual
Units: ug/L
PQL
Client ID: LCSS02
RunNo: 101562
SeqNo: 2057192
LCSDSampType: TestCode: 8260_WP_SF
Di-isopropyl ether 20.00 119 70 130 201.0 0 23.60 0.76023.780Dibromochloromethane 20.00 103 66 133 201.0 0 20.24 1.5220.550Dibromomethane 20.00 112 76 125 201.0 0 21.78 2.8122.400Dichlorodifluoromethane 20.00 109 53 153 201.0 0 21.71 0.50521.820Ethyl tert-butyl ether 20.00 113 70 130 201.0 0 22.00 2.3822.530Ethylbenzene 20.00 101 73 127 201.0 0 20.19 0.049520.200Freon-113 20.00 113 75 125 201.0 0 21.90 3.1022.590Hexachlorobutadiene 20.00 95.8 67 131 201.0 0 18.74 2.2219.160Isopropylbenzene 20.00 100 75 127 201.0 0 19.76 1.3620.030m,p-Xylene 40.00 103 76 128 201.0 0 40.82 0.97541.220Methylene chloride 20.00 106 63 137 202.0 0 21.05 0.75721.210MTBE 20.00 110 65 123 201.0 0 21.65 1.5621.990n-Butylbenzene 20.00 104 69 137 201.0 0 20.66 0.62720.790n-Propylbenzene 20.00 103 72 129 201.0 0 20.14 2.6520.680Naphthalene 20.00 105 54 138 201.0 0 20.01 4.7320.980o-Xylene 20.00 102 80 121 201.0 0 20.38 0.098220.360sec-Butylbenzene 20.00 100 72 127 201.0 0 19.90 0.75120.050Styrene 20.00 104 65 134 201.0 0 20.20 3.3120.880Tert-amyl methyl ether 20.00 105 70 130 201.0 0 20.61 2.3021.090Tert-Butanol 100.0 100 70 130 205.0 0 94.97 5.49100.330tert-Butylbenzene 20.00 99.4 70 129 201.0 0 19.68 0.96119.870Tetrachloroethene 20.00 100 66 128 201.0 0 20.30 1.1420.070Toluene 20.00 108 77 122 202.0 0 21.81 0.82921.630trans-1,2-Dichloroethene 20.00 109 63 137 201.0 0 21.68 0.78121.850trans-1,3-Dichloropropene 20.00 110 59 135 201.0 0 21.85 0.36521.930Trichloroethene 20.00 107 70 127 201.0 0 21.16 1.3121.440Trichlorofluoromethane 20.00 122 57 129 201.0 0 24.29 0.37024.380Vinyl chloride 20.00 103 50 134 200.50 0 20.78 0.87020.600Xylenes, Total 60.00 103 75 125 202.0 0 61.20 0.61961.580 Surr: 1,2-Dichloroethane-d4 25.00 115 72 119 028.820
Qualifiers: B Analyte detected in the associated Method Blank E Value above quantitation range H Holding times for preparation or analysis exceededN Parameter not NELAC certified ND Not Detected at the Reporting Limit R RPD outside accepted recovery limitsS Spike/Surrogate outside of limits due to matrix interference DO Surrogate Diluted Out Calculations are based on raw values
14 of 17
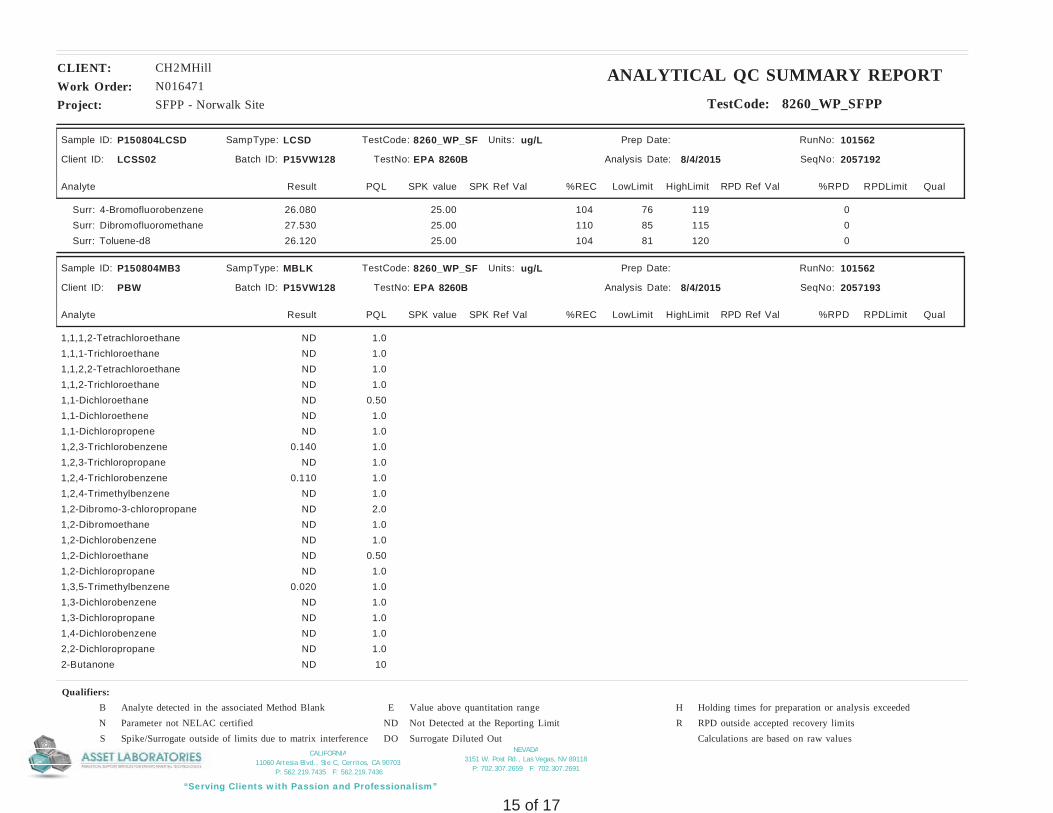
NEVADA3151 W. Post Rd., Las Vegas, NV 89118
P: 702.307.2659 F: 702.307.2691
“Serving Clients with Passion and Professionalism”
CALIFORNIA11060 Artesia Blvd., Ste C, Cerritos, CA 90703
P: 562.219.7435 F: 562.219.7436
Project: SFPP - Norwalk Site
CLIENT: CH2MHillWork Order: N016471
ANALYTICAL QC SUMMARY REPORTTestCode: 8260_WP_SFPP
Sample ID: P150804LCSD
Batch ID: P15VW128 TestNo: EPA 8260B Analysis Date: 8/4/2015
Prep Date:
Analyte Result SPK value SPK Ref Val %REC RPD Ref Val %RPDLowLimit HighLimit RPDLimit Qual
Units: ug/L
PQL
Client ID: LCSS02
RunNo: 101562
SeqNo: 2057192
LCSDSampType: TestCode: 8260_WP_SF
Surr: 4-Bromofluorobenzene 25.00 104 76 119 026.080 Surr: Dibromofluoromethane 25.00 110 85 115 027.530 Surr: Toluene-d8 25.00 104 81 120 026.120
Sample ID: P150804MB3
Batch ID: P15VW128 TestNo: EPA 8260B Analysis Date: 8/4/2015
Prep Date:
Analyte Result SPK value SPK Ref Val %REC RPD Ref Val %RPDLowLimit HighLimit RPDLimit Qual
Units: ug/L
PQL
Client ID: PBW
RunNo: 101562
SeqNo: 2057193
MBLKSampType: TestCode: 8260_WP_SF
1,1,1,2-Tetrachloroethane 1.0ND1,1,1-Trichloroethane 1.0ND1,1,2,2-Tetrachloroethane 1.0ND1,1,2-Trichloroethane 1.0ND1,1-Dichloroethane 0.50ND1,1-Dichloroethene 1.0ND1,1-Dichloropropene 1.0ND1,2,3-Trichlorobenzene 1.00.1401,2,3-Trichloropropane 1.0ND1,2,4-Trichlorobenzene 1.00.1101,2,4-Trimethylbenzene 1.0ND1,2-Dibromo-3-chloropropane 2.0ND1,2-Dibromoethane 1.0ND1,2-Dichlorobenzene 1.0ND1,2-Dichloroethane 0.50ND1,2-Dichloropropane 1.0ND1,3,5-Trimethylbenzene 1.00.0201,3-Dichlorobenzene 1.0ND1,3-Dichloropropane 1.0ND1,4-Dichlorobenzene 1.0ND2,2-Dichloropropane 1.0ND2-Butanone 10ND
Qualifiers: B Analyte detected in the associated Method Blank E Value above quantitation range H Holding times for preparation or analysis exceededN Parameter not NELAC certified ND Not Detected at the Reporting Limit R RPD outside accepted recovery limitsS Spike/Surrogate outside of limits due to matrix interference DO Surrogate Diluted Out Calculations are based on raw values
15 of 17
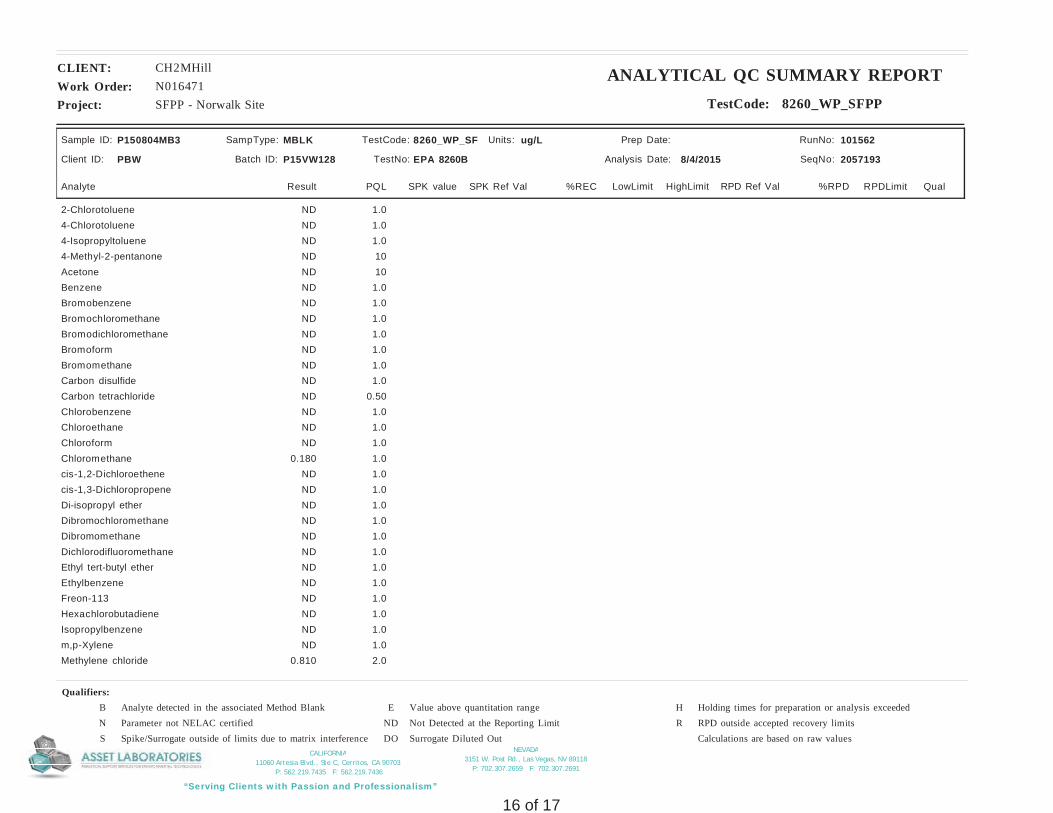
NEVADA3151 W. Post Rd., Las Vegas, NV 89118
P: 702.307.2659 F: 702.307.2691
“Serving Clients with Passion and Professionalism”
CALIFORNIA11060 Artesia Blvd., Ste C, Cerritos, CA 90703
P: 562.219.7435 F: 562.219.7436
Project: SFPP - Norwalk Site
CLIENT: CH2MHillWork Order: N016471
ANALYTICAL QC SUMMARY REPORTTestCode: 8260_WP_SFPP
Sample ID: P150804MB3
Batch ID: P15VW128 TestNo: EPA 8260B Analysis Date: 8/4/2015
Prep Date:
Analyte Result SPK value SPK Ref Val %REC RPD Ref Val %RPDLowLimit HighLimit RPDLimit Qual
Units: ug/L
PQL
Client ID: PBW
RunNo: 101562
SeqNo: 2057193
MBLKSampType: TestCode: 8260_WP_SF
2-Chlorotoluene 1.0ND4-Chlorotoluene 1.0ND4-Isopropyltoluene 1.0ND4-Methyl-2-pentanone 10NDAcetone 10NDBenzene 1.0NDBromobenzene 1.0NDBromochloromethane 1.0NDBromodichloromethane 1.0NDBromoform 1.0NDBromomethane 1.0NDCarbon disulfide 1.0NDCarbon tetrachloride 0.50NDChlorobenzene 1.0NDChloroethane 1.0NDChloroform 1.0NDChloromethane 1.00.180cis-1,2-Dichloroethene 1.0NDcis-1,3-Dichloropropene 1.0NDDi-isopropyl ether 1.0NDDibromochloromethane 1.0NDDibromomethane 1.0NDDichlorodifluoromethane 1.0NDEthyl tert-butyl ether 1.0NDEthylbenzene 1.0NDFreon-113 1.0NDHexachlorobutadiene 1.0NDIsopropylbenzene 1.0NDm,p-Xylene 1.0NDMethylene chloride 2.00.810
Qualifiers: B Analyte detected in the associated Method Blank E Value above quantitation range H Holding times for preparation or analysis exceededN Parameter not NELAC certified ND Not Detected at the Reporting Limit R RPD outside accepted recovery limitsS Spike/Surrogate outside of limits due to matrix interference DO Surrogate Diluted Out Calculations are based on raw values
16 of 17
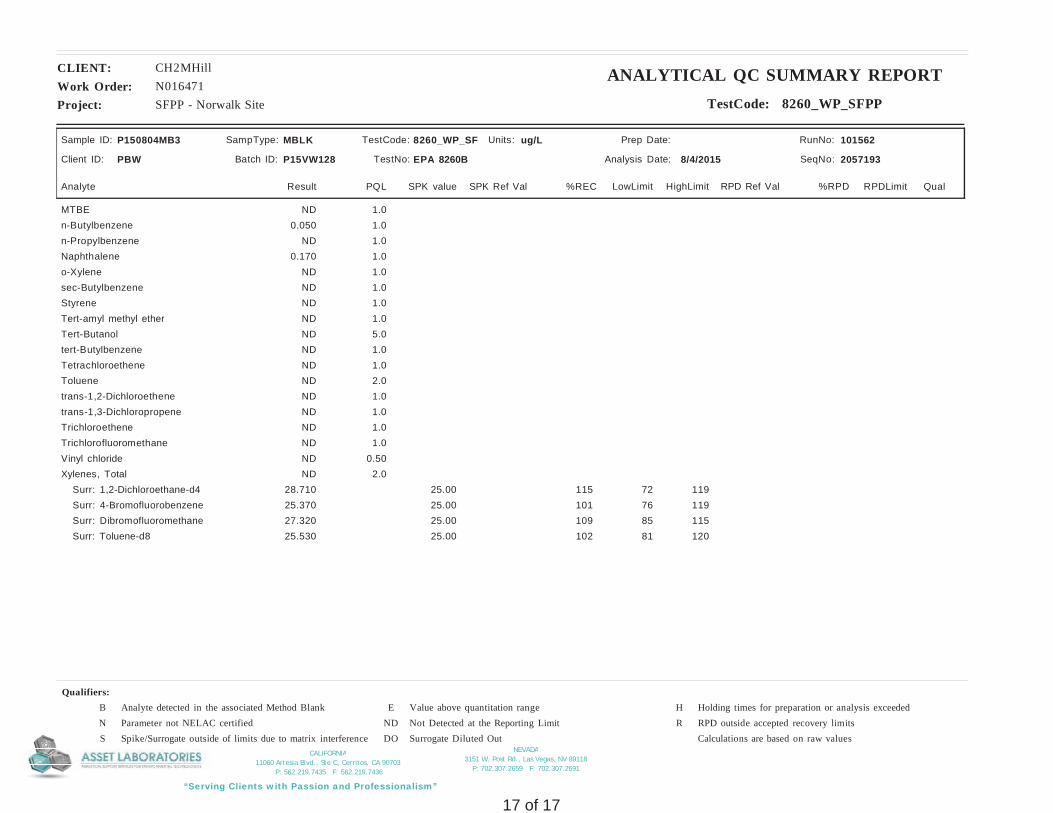
NEVADA3151 W. Post Rd., Las Vegas, NV 89118
P: 702.307.2659 F: 702.307.2691
“Serving Clients with Passion and Professionalism”
CALIFORNIA11060 Artesia Blvd., Ste C, Cerritos, CA 90703
P: 562.219.7435 F: 562.219.7436
Project: SFPP - Norwalk Site
CLIENT: CH2MHillWork Order: N016471
ANALYTICAL QC SUMMARY REPORTTestCode: 8260_WP_SFPP
Sample ID: P150804MB3
Batch ID: P15VW128 TestNo: EPA 8260B Analysis Date: 8/4/2015
Prep Date:
Analyte Result SPK value SPK Ref Val %REC RPD Ref Val %RPDLowLimit HighLimit RPDLimit Qual
Units: ug/L
PQL
Client ID: PBW
RunNo: 101562
SeqNo: 2057193
MBLKSampType: TestCode: 8260_WP_SF
MTBE 1.0NDn-Butylbenzene 1.00.050n-Propylbenzene 1.0NDNaphthalene 1.00.170o-Xylene 1.0NDsec-Butylbenzene 1.0NDStyrene 1.0NDTert-amyl methyl ether 1.0NDTert-Butanol 5.0NDtert-Butylbenzene 1.0NDTetrachloroethene 1.0NDToluene 2.0NDtrans-1,2-Dichloroethene 1.0NDtrans-1,3-Dichloropropene 1.0NDTrichloroethene 1.0NDTrichlorofluoromethane 1.0NDVinyl chloride 0.50NDXylenes, Total 2.0ND Surr: 1,2-Dichloroethane-d4 25.00 115 72 11928.710 Surr: 4-Bromofluorobenzene 25.00 101 76 11925.370 Surr: Dibromofluoromethane 25.00 109 85 11527.320 Surr: Toluene-d8 25.00 102 81 12025.530
Qualifiers: B Analyte detected in the associated Method Blank E Value above quantitation range H Holding times for preparation or analysis exceededN Parameter not NELAC certified ND Not Detected at the Reporting Limit R RPD outside accepted recovery limitsS Spike/Surrogate outside of limits due to matrix interference DO Surrogate Diluted Out Calculations are based on raw values
17 of 17
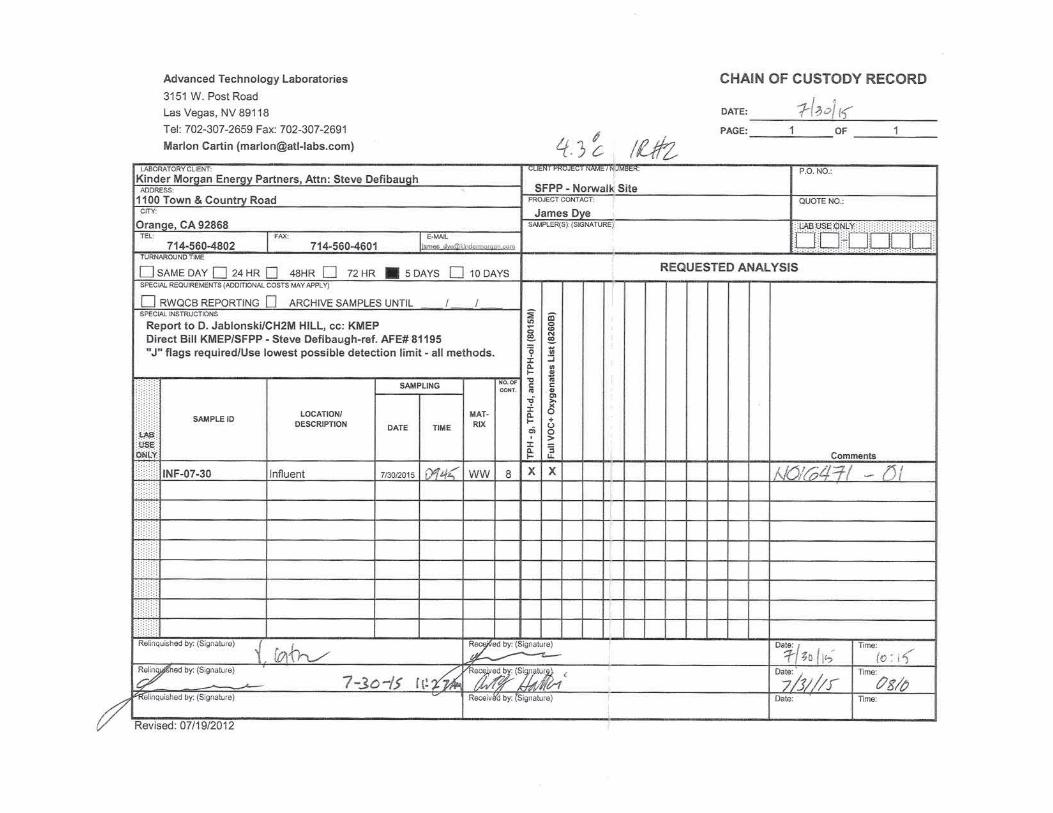
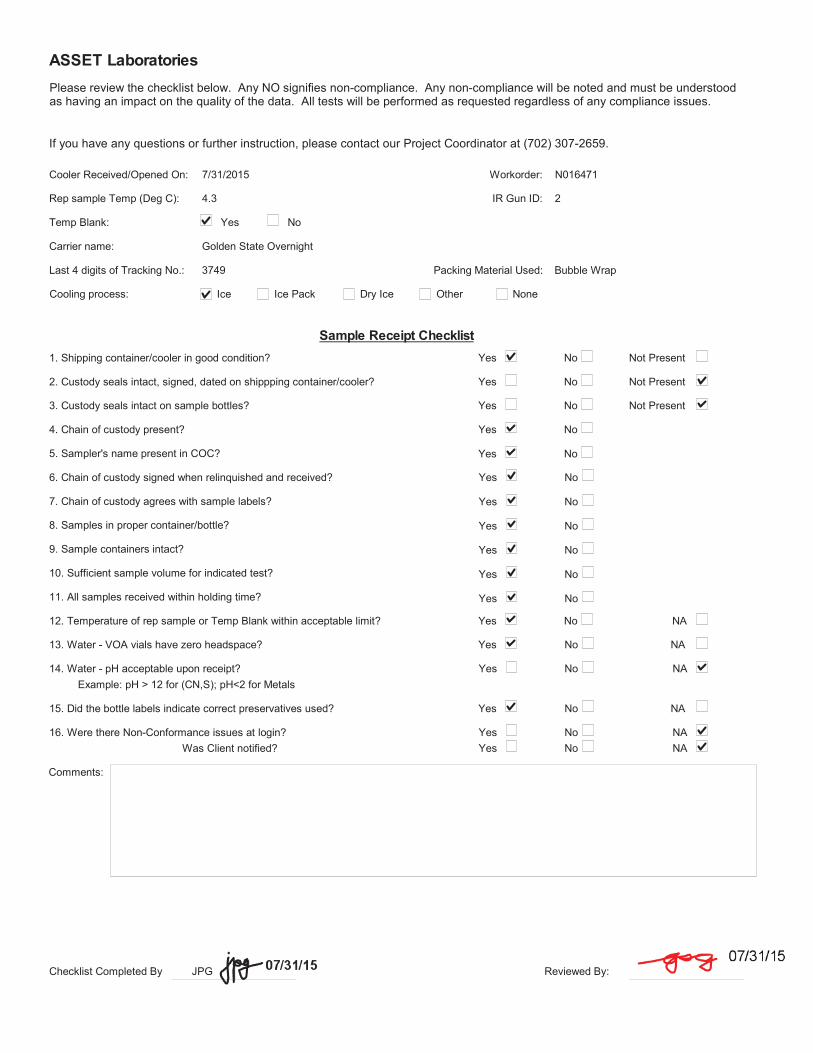

Sample ID Client Sample ID Date Collected
Date Received:
Date Due Matrix Test No
WORK ORDER Summary 31-Jul-15
WorkOrder: N016471
Comments: Report to D. Jablonski/CH2M HILL, cc:KMEP
Client ID: CH2HI03Project: SFPP - Norwalk Site QC Level: RTNE
Hld MS Sub
7/31/2015
Test Name
ASSET Laboratories
Storage
N016471-001A INF-07-30 7/30/2015 9:45:00 AM 8/7/2015 Wastewater EPA 8015B GASOLINE RANGE ORGANICS BY GC/FID
VW
8/7/2015 EPA 8260B VOLATILE ORGANIC COMPOUNDS BY GC/MS
VW
N016471-001B 8/7/2015 EPA 3510C SEPARATORY FUNNEL EXTRACTION: EXTRACTABLE FUELS
WW
8/7/2015 EPA 8015B TPH EXTRACTABLE BY GC/FID WW
8/7/2015 EPA 8015B Total TPH WW
N016471-002A FOLDER 8/7/2015 Folder Folder LAB
1 of 1Page


NEVADA3151 W. Post Rd., Las Vegas, NV 89118
P: 702.307.2659 F: 702.307.2691
“Serving Clients with Passion and Professionalism”
CALIFORNIA11060 Artesia Blvd., Ste C, Cerritos, CA 90703
P: 562.219.7435 F: 562.219.7436
August 17, 2015
CH2MHillDan Jablonski
Attention: Dan Jablonski
RE: SFPP - Norwalk Site
Workorder No.: N016534FAX:TEL:
1000 Wilshire Blvd.Los Angeles, CA 90017
CA-ELAP No.: 2676NV Cert. No.: NV-00922
Thank you for the opportunity to service the needs of your company.
Please feel free to call me at (702) 307-2659 if I can be of further assistance to your company.
Sincerely,
Glen Gesmundo
QA Manager
Enclosed are the results for sample(s) received on August 07, 2015 by ASSET Laboratories . The sample(s) are tested for the parameters as indicated in the enclosed chain of custody in accordance with the applicable laboratory certifications.
The cover letter is an integral part of this analytical report. This Laboratory Report cannot be reproduced in part or in its entirety without written permission from the client and Advanced Technology Laboratories - Las Vegas.
01 of 18
NEVADA3151 W. Post Rd., Las Vegas, NV 89118
P: 702.307.2659 F: 702.307.2691
“Serving Clients with Passion and Professionalism”
CALIFORNIA11060 Artesia Blvd., Ste C, Cerritos, CA 90703
P: 562.219.7435 F: 562.219.7436
17-Aug-15Date:ASSET Laboratories
Project: SFPP - Norwalk SiteCLIENT: CH2MHill
Lab Order: N016534CASE NARRATIVE
SAMPLE RECEIVING/GENERAL COMMENTS:
Samples were received intact with proper chain of custody documentation.
Cooler temperature and sample preservation were verified upon receipt of samples if applicable.
Information on sample receipt conditions including discrepancies can be found in attached Sample Receipt Checklist Form.
Samples were analyzed within method holding time.
Results were J-Flag. "J" is used to flag those results that are between the PQL (Practical Quantitation Limit) and the calculated MDL (Method Detection Limit). Results that are "J" Flagged are estimated values since it becomes difficult to accurately quantitate the analyte near the MDL.
Page 2 of 17
02 of 18
NEVADA3151 W. Post Rd., Las Vegas, NV 89118
P: 702.307.2659 F: 702.307.2691
“Serving Clients with Passion and Professionalism”
CALIFORNIA11060 Artesia Blvd., Ste C, Cerritos, CA 90703
P: 562.219.7435 F: 562.219.7436
17-Aug-15Date:ASSET Laboratories
Project: SFPP - Norwalk SiteCLIENT: CH2MHill
Lab Order: N016534Work Order Sample Summary
Lab Sample ID Client Sample ID Collection DateMatrix Date Received
Contract No:
Date Reported
N016534-001A INF-08-06 8/6/2015 1:45:00 PM 8/7/2015 8/17/2015Wastewater
N016534-001B INF-08-06 8/6/2015 1:45:00 PM 8/7/2015 8/17/2015Wastewater
Page 1 of 1
03 of 18
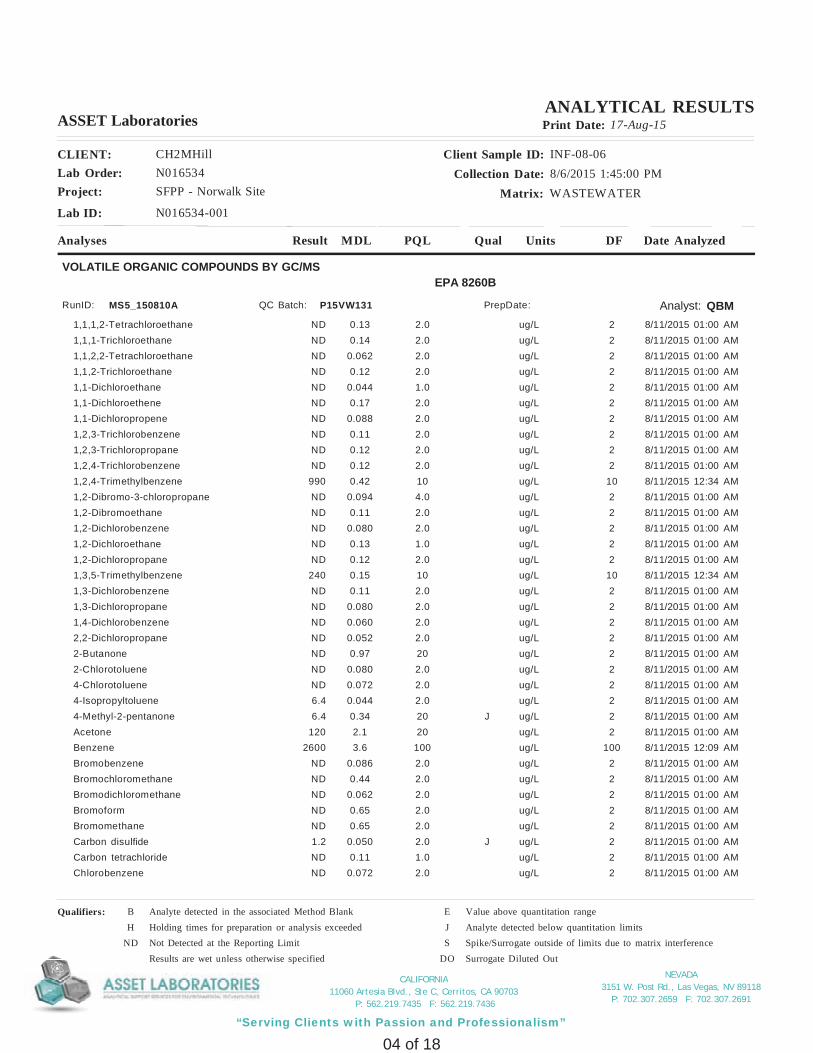
NEVADA3151 W. Post Rd., Las Vegas, NV 89118
P: 702.307.2659 F: 702.307.2691
“Serving Clients with Passion and Professionalism”
CALIFORNIA11060 Artesia Blvd., Ste C, Cerritos, CA 90703
P: 562.219.7435 F: 562.219.7436
Project: SFPP - Norwalk Site
Client Sample ID: INF-08-06Collection Date: 8/6/2015 1:45:00 PM
Matrix: WASTEWATER
CLIENT: CH2MHillLab Order: N016534
Lab ID: N016534-001
ASSET Laboratories Print Date: 17-Aug-15
Analyses Result Qual Units Date AnalyzedDFPQLMDL
ANALYTICAL RESULTS
VOLATILE ORGANIC COMPOUNDS BY GC/MSEPA 8260B
Analyst: QBMRunID: MS5_150810A P15VW131QC Batch: PrepDate:
1,1,1,2-Tetrachloroethane 2.0 ug/L 2ND 0.13 8/11/2015 01:00 AM1,1,1-Trichloroethane 2.0 ug/L 2ND 0.14 8/11/2015 01:00 AM1,1,2,2-Tetrachloroethane 2.0 ug/L 2ND 0.062 8/11/2015 01:00 AM1,1,2-Trichloroethane 2.0 ug/L 2ND 0.12 8/11/2015 01:00 AM1,1-Dichloroethane 1.0 ug/L 2ND 0.044 8/11/2015 01:00 AM1,1-Dichloroethene 2.0 ug/L 2ND 0.17 8/11/2015 01:00 AM1,1-Dichloropropene 2.0 ug/L 2ND 0.088 8/11/2015 01:00 AM1,2,3-Trichlorobenzene 2.0 ug/L 2ND 0.11 8/11/2015 01:00 AM1,2,3-Trichloropropane 2.0 ug/L 2ND 0.12 8/11/2015 01:00 AM1,2,4-Trichlorobenzene 2.0 ug/L 2ND 0.12 8/11/2015 01:00 AM1,2,4-Trimethylbenzene 10 ug/L 10990 0.42 8/11/2015 12:34 AM1,2-Dibromo-3-chloropropane 4.0 ug/L 2ND 0.094 8/11/2015 01:00 AM1,2-Dibromoethane 2.0 ug/L 2ND 0.11 8/11/2015 01:00 AM1,2-Dichlorobenzene 2.0 ug/L 2ND 0.080 8/11/2015 01:00 AM1,2-Dichloroethane 1.0 ug/L 2ND 0.13 8/11/2015 01:00 AM1,2-Dichloropropane 2.0 ug/L 2ND 0.12 8/11/2015 01:00 AM1,3,5-Trimethylbenzene 10 ug/L 10240 0.15 8/11/2015 12:34 AM1,3-Dichlorobenzene 2.0 ug/L 2ND 0.11 8/11/2015 01:00 AM1,3-Dichloropropane 2.0 ug/L 2ND 0.080 8/11/2015 01:00 AM1,4-Dichlorobenzene 2.0 ug/L 2ND 0.060 8/11/2015 01:00 AM2,2-Dichloropropane 2.0 ug/L 2ND 0.052 8/11/2015 01:00 AM2-Butanone 20 ug/L 2ND 0.97 8/11/2015 01:00 AM2-Chlorotoluene 2.0 ug/L 2ND 0.080 8/11/2015 01:00 AM4-Chlorotoluene 2.0 ug/L 2ND 0.072 8/11/2015 01:00 AM4-Isopropyltoluene 2.0 ug/L 26.4 0.044 8/11/2015 01:00 AM4-Methyl-2-pentanone J20 ug/L 26.4 0.34 8/11/2015 01:00 AMAcetone 20 ug/L 2120 2.1 8/11/2015 01:00 AMBenzene 100 ug/L 1002600 3.6 8/11/2015 12:09 AMBromobenzene 2.0 ug/L 2ND 0.086 8/11/2015 01:00 AMBromochloromethane 2.0 ug/L 2ND 0.44 8/11/2015 01:00 AMBromodichloromethane 2.0 ug/L 2ND 0.062 8/11/2015 01:00 AMBromoform 2.0 ug/L 2ND 0.65 8/11/2015 01:00 AMBromomethane 2.0 ug/L 2ND 0.65 8/11/2015 01:00 AMCarbon disulfide J2.0 ug/L 21.2 0.050 8/11/2015 01:00 AMCarbon tetrachloride 1.0 ug/L 2ND 0.11 8/11/2015 01:00 AMChlorobenzene 2.0 ug/L 2ND 0.072 8/11/2015 01:00 AM
Qualifiers: B Analyte detected in the associated Method Blank E Value above quantitation rangeH Holding times for preparation or analysis exceeded J Analyte detected below quantitation limits
ND Not Detected at the Reporting Limit S Spike/Surrogate outside of limits due to matrix interferenceResults are wet unless otherwise specified DO Surrogate Diluted Out
04 of 18
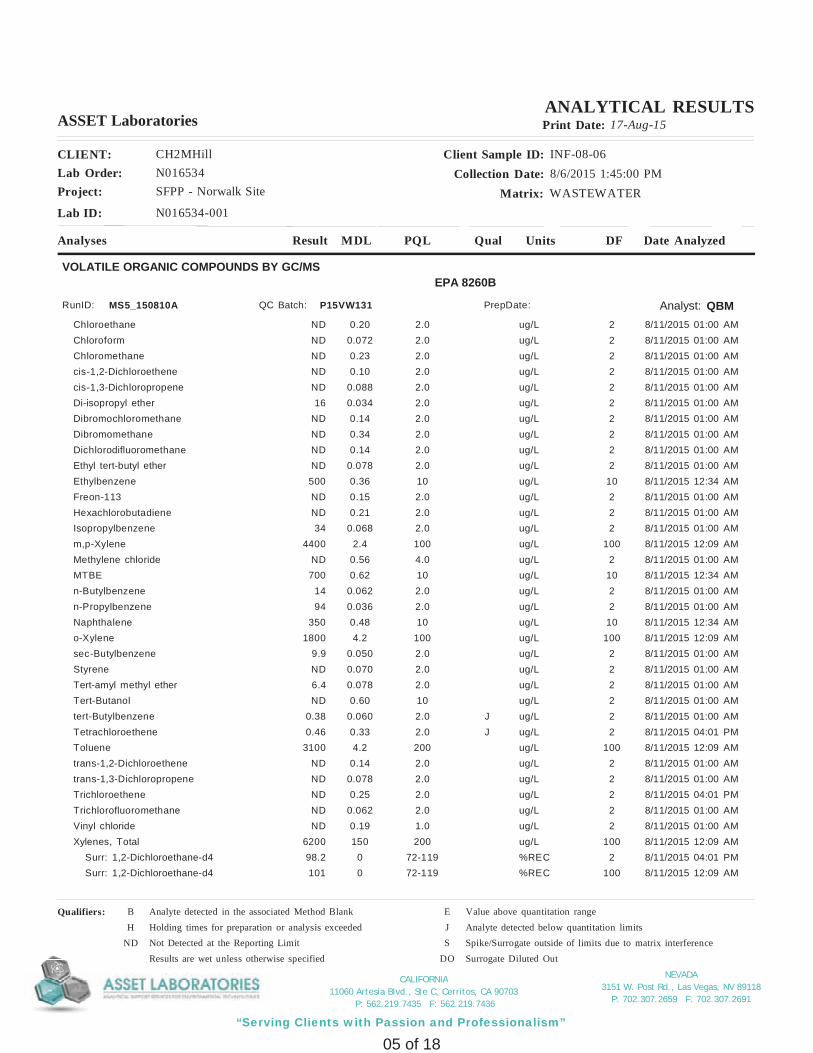
NEVADA3151 W. Post Rd., Las Vegas, NV 89118
P: 702.307.2659 F: 702.307.2691
“Serving Clients with Passion and Professionalism”
CALIFORNIA11060 Artesia Blvd., Ste C, Cerritos, CA 90703
P: 562.219.7435 F: 562.219.7436
Project: SFPP - Norwalk Site
Client Sample ID: INF-08-06Collection Date: 8/6/2015 1:45:00 PM
Matrix: WASTEWATER
CLIENT: CH2MHillLab Order: N016534
Lab ID: N016534-001
ASSET Laboratories Print Date: 17-Aug-15
Analyses Result Qual Units Date AnalyzedDFPQLMDL
ANALYTICAL RESULTS
VOLATILE ORGANIC COMPOUNDS BY GC/MSEPA 8260B
Analyst: QBMRunID: MS5_150810A P15VW131QC Batch: PrepDate:
Chloroethane 2.0 ug/L 2ND 0.20 8/11/2015 01:00 AMChloroform 2.0 ug/L 2ND 0.072 8/11/2015 01:00 AMChloromethane 2.0 ug/L 2ND 0.23 8/11/2015 01:00 AMcis-1,2-Dichloroethene 2.0 ug/L 2ND 0.10 8/11/2015 01:00 AMcis-1,3-Dichloropropene 2.0 ug/L 2ND 0.088 8/11/2015 01:00 AMDi-isopropyl ether 2.0 ug/L 216 0.034 8/11/2015 01:00 AMDibromochloromethane 2.0 ug/L 2ND 0.14 8/11/2015 01:00 AMDibromomethane 2.0 ug/L 2ND 0.34 8/11/2015 01:00 AMDichlorodifluoromethane 2.0 ug/L 2ND 0.14 8/11/2015 01:00 AMEthyl tert-butyl ether 2.0 ug/L 2ND 0.078 8/11/2015 01:00 AMEthylbenzene 10 ug/L 10500 0.36 8/11/2015 12:34 AMFreon-113 2.0 ug/L 2ND 0.15 8/11/2015 01:00 AMHexachlorobutadiene 2.0 ug/L 2ND 0.21 8/11/2015 01:00 AMIsopropylbenzene 2.0 ug/L 234 0.068 8/11/2015 01:00 AMm,p-Xylene 100 ug/L 1004400 2.4 8/11/2015 12:09 AMMethylene chloride 4.0 ug/L 2ND 0.56 8/11/2015 01:00 AMMTBE 10 ug/L 10700 0.62 8/11/2015 12:34 AMn-Butylbenzene 2.0 ug/L 214 0.062 8/11/2015 01:00 AMn-Propylbenzene 2.0 ug/L 294 0.036 8/11/2015 01:00 AMNaphthalene 10 ug/L 10350 0.48 8/11/2015 12:34 AMo-Xylene 100 ug/L 1001800 4.2 8/11/2015 12:09 AMsec-Butylbenzene 2.0 ug/L 29.9 0.050 8/11/2015 01:00 AMStyrene 2.0 ug/L 2ND 0.070 8/11/2015 01:00 AMTert-amyl methyl ether 2.0 ug/L 26.4 0.078 8/11/2015 01:00 AMTert-Butanol 10 ug/L 2ND 0.60 8/11/2015 01:00 AMtert-Butylbenzene J2.0 ug/L 20.38 0.060 8/11/2015 01:00 AMTetrachloroethene J2.0 ug/L 20.46 0.33 8/11/2015 04:01 PMToluene 200 ug/L 1003100 4.2 8/11/2015 12:09 AMtrans-1,2-Dichloroethene 2.0 ug/L 2ND 0.14 8/11/2015 01:00 AMtrans-1,3-Dichloropropene 2.0 ug/L 2ND 0.078 8/11/2015 01:00 AMTrichloroethene 2.0 ug/L 2ND 0.25 8/11/2015 04:01 PMTrichlorofluoromethane 2.0 ug/L 2ND 0.062 8/11/2015 01:00 AMVinyl chloride 1.0 ug/L 2ND 0.19 8/11/2015 01:00 AMXylenes, Total 200 ug/L 1006200 150 8/11/2015 12:09 AM Surr: 1,2-Dichloroethane-d4 72-119 %REC 298.2 0 8/11/2015 04:01 PM Surr: 1,2-Dichloroethane-d4 72-119 %REC 100101 0 8/11/2015 12:09 AM
Qualifiers: B Analyte detected in the associated Method Blank E Value above quantitation rangeH Holding times for preparation or analysis exceeded J Analyte detected below quantitation limits
ND Not Detected at the Reporting Limit S Spike/Surrogate outside of limits due to matrix interferenceResults are wet unless otherwise specified DO Surrogate Diluted Out
05 of 18
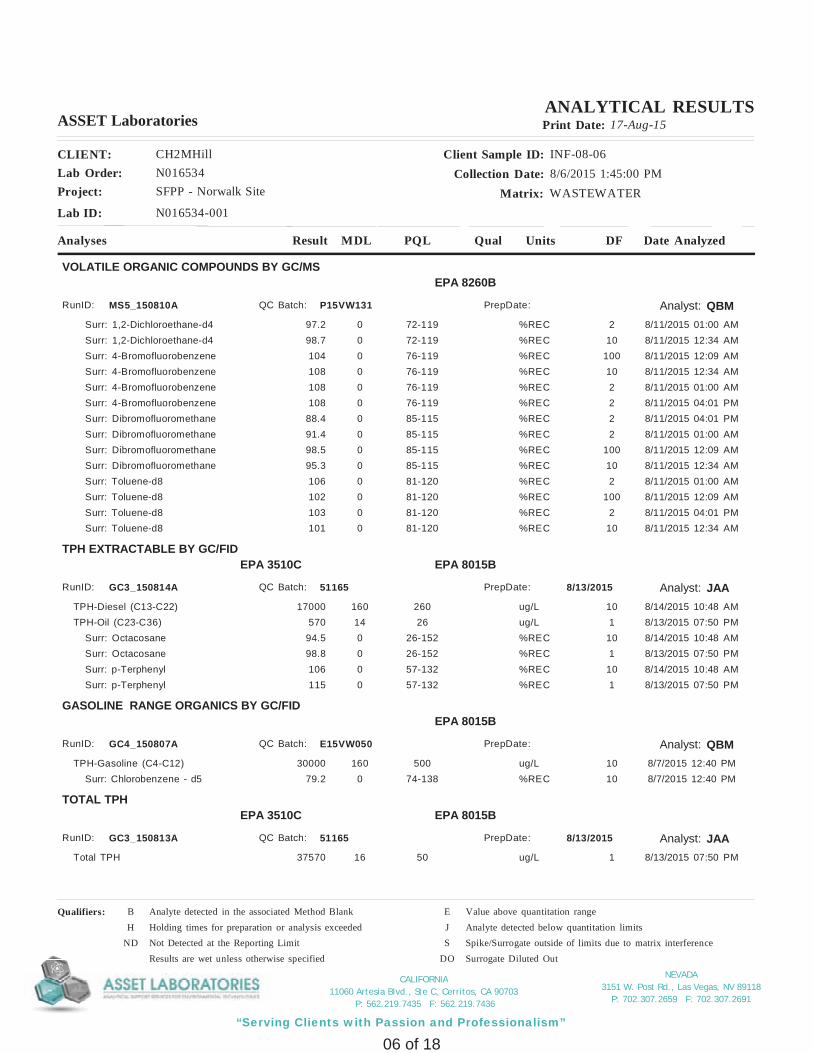
NEVADA3151 W. Post Rd., Las Vegas, NV 89118
P: 702.307.2659 F: 702.307.2691
“Serving Clients with Passion and Professionalism”
CALIFORNIA11060 Artesia Blvd., Ste C, Cerritos, CA 90703
P: 562.219.7435 F: 562.219.7436
Project: SFPP - Norwalk Site
Client Sample ID: INF-08-06Collection Date: 8/6/2015 1:45:00 PM
Matrix: WASTEWATER
CLIENT: CH2MHillLab Order: N016534
Lab ID: N016534-001
ASSET Laboratories Print Date: 17-Aug-15
Analyses Result Qual Units Date AnalyzedDFPQLMDL
ANALYTICAL RESULTS
VOLATILE ORGANIC COMPOUNDS BY GC/MSEPA 8260B
Analyst: QBMRunID: MS5_150810A P15VW131QC Batch: PrepDate:
Surr: 1,2-Dichloroethane-d4 72-119 %REC 297.2 0 8/11/2015 01:00 AM Surr: 1,2-Dichloroethane-d4 72-119 %REC 1098.7 0 8/11/2015 12:34 AM Surr: 4-Bromofluorobenzene 76-119 %REC 100104 0 8/11/2015 12:09 AM Surr: 4-Bromofluorobenzene 76-119 %REC 10108 0 8/11/2015 12:34 AM Surr: 4-Bromofluorobenzene 76-119 %REC 2108 0 8/11/2015 01:00 AM Surr: 4-Bromofluorobenzene 76-119 %REC 2108 0 8/11/2015 04:01 PM Surr: Dibromofluoromethane 85-115 %REC 288.4 0 8/11/2015 04:01 PM Surr: Dibromofluoromethane 85-115 %REC 291.4 0 8/11/2015 01:00 AM Surr: Dibromofluoromethane 85-115 %REC 10098.5 0 8/11/2015 12:09 AM Surr: Dibromofluoromethane 85-115 %REC 1095.3 0 8/11/2015 12:34 AM Surr: Toluene-d8 81-120 %REC 2106 0 8/11/2015 01:00 AM Surr: Toluene-d8 81-120 %REC 100102 0 8/11/2015 12:09 AM Surr: Toluene-d8 81-120 %REC 2103 0 8/11/2015 04:01 PM Surr: Toluene-d8 81-120 %REC 10101 0 8/11/2015 12:34 AM
TPH EXTRACTABLE BY GC/FIDEPA 8015B
Analyst: JAA
EPA 3510C
RunID: GC3_150814A 51165QC Batch: PrepDate: 8/13/2015
TPH-Diesel (C13-C22) 260 ug/L 1017000 160 8/14/2015 10:48 AMTPH-Oil (C23-C36) 26 ug/L 1570 14 8/13/2015 07:50 PM Surr: Octacosane 26-152 %REC 1094.5 0 8/14/2015 10:48 AM Surr: Octacosane 26-152 %REC 198.8 0 8/13/2015 07:50 PM Surr: p-Terphenyl 57-132 %REC 10106 0 8/14/2015 10:48 AM Surr: p-Terphenyl 57-132 %REC 1115 0 8/13/2015 07:50 PM
GASOLINE RANGE ORGANICS BY GC/FIDEPA 8015B
Analyst: QBMRunID: GC4_150807A E15VW050QC Batch: PrepDate:
TPH-Gasoline (C4-C12) 500 ug/L 1030000 160 8/7/2015 12:40 PM Surr: Chlorobenzene - d5 74-138 %REC 1079.2 0 8/7/2015 12:40 PM
TOTAL TPHEPA 8015B
Analyst: JAA
EPA 3510C
RunID: GC3_150813A 51165QC Batch: PrepDate: 8/13/2015
Total TPH 50 ug/L 137570 16 8/13/2015 07:50 PM
Qualifiers: B Analyte detected in the associated Method Blank E Value above quantitation rangeH Holding times for preparation or analysis exceeded J Analyte detected below quantitation limits
ND Not Detected at the Reporting Limit S Spike/Surrogate outside of limits due to matrix interferenceResults are wet unless otherwise specified DO Surrogate Diluted Out
06 of 18
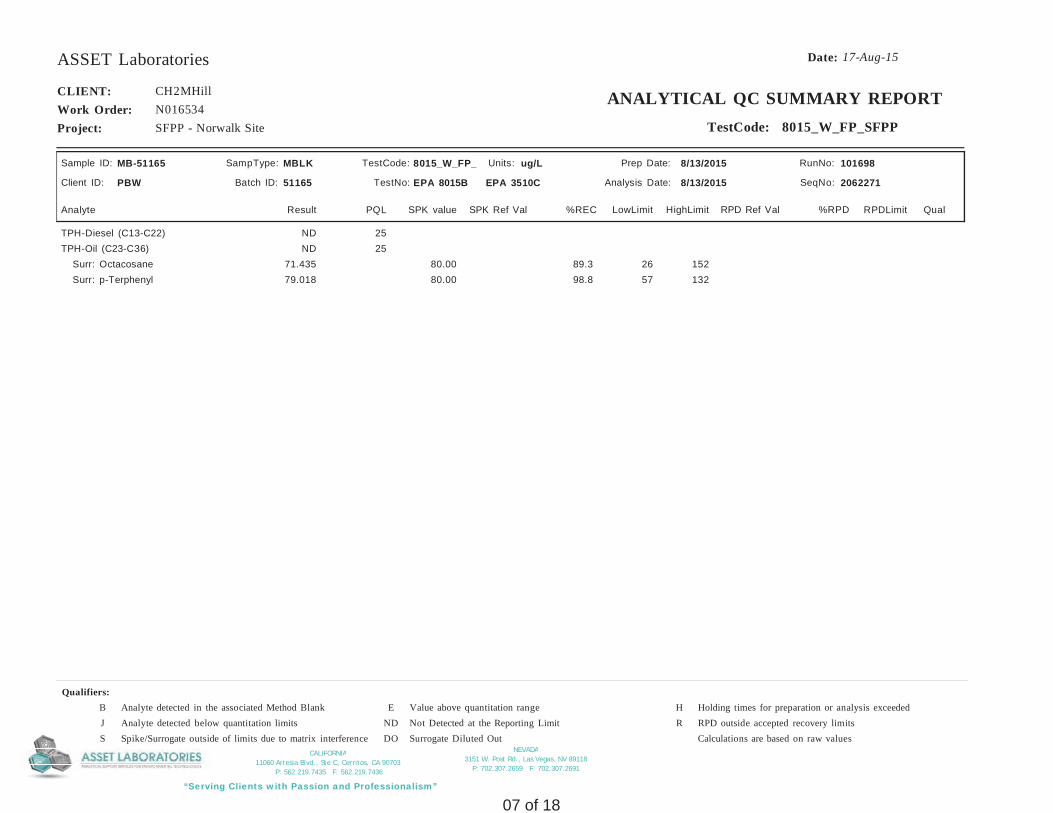
NEVADA3151 W. Post Rd., Las Vegas, NV 89118
P: 702.307.2659 F: 702.307.2691
“Serving Clients with Passion and Professionalism”
CALIFORNIA11060 Artesia Blvd., Ste C, Cerritos, CA 90703
P: 562.219.7435 F: 562.219.7436
17-Aug-15Date:ASSET Laboratories
Project: SFPP - Norwalk Site
CLIENT: CH2MHillWork Order: N016534
ANALYTICAL QC SUMMARY REPORTTestCode: 8015_W_FP_SFPP
Sample ID: MB-51165
Batch ID: 51165 TestNo: EPA 8015B Analysis Date: 8/13/2015
Prep Date: 8/13/2015
Analyte Result SPK value SPK Ref Val %REC RPD Ref Val %RPDLowLimit HighLimit RPDLimit Qual
Units: ug/L
PQL
Client ID: PBW
RunNo: 101698
SeqNo: 2062271
MBLKSampType: TestCode: 8015_W_FP_
EPA 3510C
TPH-Diesel (C13-C22) 25NDTPH-Oil (C23-C36) 25ND Surr: Octacosane 80.00 89.3 26 15271.435 Surr: p-Terphenyl 80.00 98.8 57 13279.018
Qualifiers: B Analyte detected in the associated Method Blank E Value above quantitation range H Holding times for preparation or analysis exceededJ Analyte detected below quantitation limits ND Not Detected at the Reporting Limit R RPD outside accepted recovery limitsS Spike/Surrogate outside of limits due to matrix interference DO Surrogate Diluted Out Calculations are based on raw values
07 of 18

NEVADA3151 W. Post Rd., Las Vegas, NV 89118
P: 702.307.2659 F: 702.307.2691
“Serving Clients with Passion and Professionalism”
CALIFORNIA11060 Artesia Blvd., Ste C, Cerritos, CA 90703
P: 562.219.7435 F: 562.219.7436
Project: SFPP - Norwalk Site
CLIENT: CH2MHillWork Order: N016534
ANALYTICAL QC SUMMARY REPORTTestCode: 8015_W_SFPPTOT
Sample ID: MB-51165
Batch ID: 51165 TestNo: EPA 8015B Analysis Date: 8/13/2015
Prep Date: 8/13/2015
Analyte Result SPK value SPK Ref Val %REC RPD Ref Val %RPDLowLimit HighLimit RPDLimit Qual
Units: ug/L
PQL
Client ID: PBW
RunNo: 101698
SeqNo: 2062277
MBLKSampType: TestCode: 8015_W_SFP
EPA 3510C
Total TPH 50ND
Qualifiers: B Analyte detected in the associated Method Blank E Value above quantitation range H Holding times for preparation or analysis exceededJ Analyte detected below quantitation limits ND Not Detected at the Reporting Limit R RPD outside accepted recovery limitsS Spike/Surrogate outside of limits due to matrix interference DO Surrogate Diluted Out Calculations are based on raw values
08 of 18
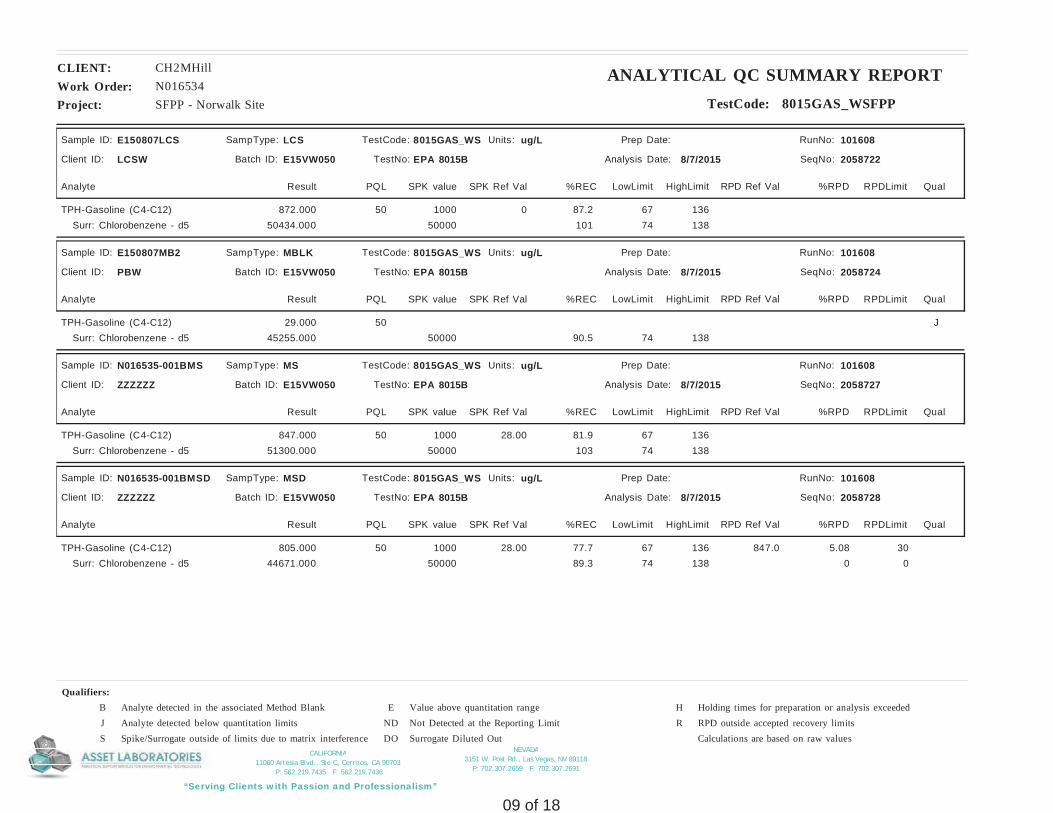
NEVADA3151 W. Post Rd., Las Vegas, NV 89118
P: 702.307.2659 F: 702.307.2691
“Serving Clients with Passion and Professionalism”
CALIFORNIA11060 Artesia Blvd., Ste C, Cerritos, CA 90703
P: 562.219.7435 F: 562.219.7436
Project: SFPP - Norwalk Site
CLIENT: CH2MHillWork Order: N016534
ANALYTICAL QC SUMMARY REPORTTestCode: 8015GAS_WSFPP
Sample ID: E150807LCS
Batch ID: E15VW050 TestNo: EPA 8015B Analysis Date: 8/7/2015
Prep Date:
Analyte Result SPK value SPK Ref Val %REC RPD Ref Val %RPDLowLimit HighLimit RPDLimit Qual
Units: ug/L
PQL
Client ID: LCSW
RunNo: 101608
SeqNo: 2058722
LCSSampType: TestCode: 8015GAS_WS
TPH-Gasoline (C4-C12) 1000 87.2 67 13650 0872.000 Surr: Chlorobenzene - d5 50000 101 74 13850434.000
Sample ID: E150807MB2
Batch ID: E15VW050 TestNo: EPA 8015B Analysis Date: 8/7/2015
Prep Date:
Analyte Result SPK value SPK Ref Val %REC RPD Ref Val %RPDLowLimit HighLimit RPDLimit Qual
Units: ug/L
PQL
Client ID: PBW
RunNo: 101608
SeqNo: 2058724
MBLKSampType: TestCode: 8015GAS_WS
TPH-Gasoline (C4-C12) J5029.000 Surr: Chlorobenzene - d5 50000 90.5 74 13845255.000
Sample ID: N016535-001BMS
Batch ID: E15VW050 TestNo: EPA 8015B Analysis Date: 8/7/2015
Prep Date:
Analyte Result SPK value SPK Ref Val %REC RPD Ref Val %RPDLowLimit HighLimit RPDLimit Qual
Units: ug/L
PQL
Client ID: ZZZZZZ
RunNo: 101608
SeqNo: 2058727
MSSampType: TestCode: 8015GAS_WS
TPH-Gasoline (C4-C12) 1000 81.9 67 13650 28.00847.000 Surr: Chlorobenzene - d5 50000 103 74 13851300.000
Sample ID: N016535-001BMSD
Batch ID: E15VW050 TestNo: EPA 8015B Analysis Date: 8/7/2015
Prep Date:
Analyte Result SPK value SPK Ref Val %REC RPD Ref Val %RPDLowLimit HighLimit RPDLimit Qual
Units: ug/L
PQL
Client ID: ZZZZZZ
RunNo: 101608
SeqNo: 2058728
MSDSampType: TestCode: 8015GAS_WS
TPH-Gasoline (C4-C12) 1000 77.7 67 136 3050 28.00 847.0 5.08805.000 Surr: Chlorobenzene - d5 50000 89.3 74 138 0044671.000
Qualifiers: B Analyte detected in the associated Method Blank E Value above quantitation range H Holding times for preparation or analysis exceededJ Analyte detected below quantitation limits ND Not Detected at the Reporting Limit R RPD outside accepted recovery limitsS Spike/Surrogate outside of limits due to matrix interference DO Surrogate Diluted Out Calculations are based on raw values
09 of 18
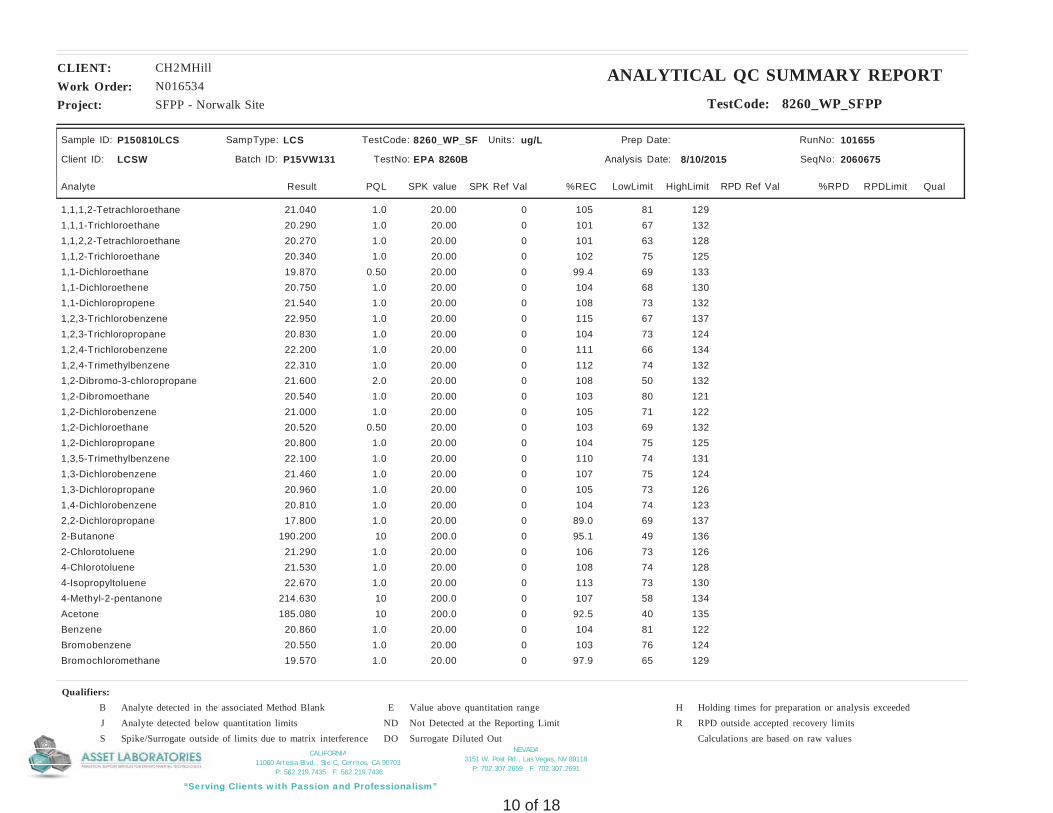
NEVADA3151 W. Post Rd., Las Vegas, NV 89118
P: 702.307.2659 F: 702.307.2691
“Serving Clients with Passion and Professionalism”
CALIFORNIA11060 Artesia Blvd., Ste C, Cerritos, CA 90703
P: 562.219.7435 F: 562.219.7436
Project: SFPP - Norwalk Site
CLIENT: CH2MHillWork Order: N016534
ANALYTICAL QC SUMMARY REPORTTestCode: 8260_WP_SFPP
Sample ID: P150810LCS
Batch ID: P15VW131 TestNo: EPA 8260B Analysis Date: 8/10/2015
Prep Date:
Analyte Result SPK value SPK Ref Val %REC RPD Ref Val %RPDLowLimit HighLimit RPDLimit Qual
Units: ug/L
PQL
Client ID: LCSW
RunNo: 101655
SeqNo: 2060675
LCSSampType: TestCode: 8260_WP_SF
1,1,1,2-Tetrachloroethane 20.00 105 81 1291.0 021.0401,1,1-Trichloroethane 20.00 101 67 1321.0 020.2901,1,2,2-Tetrachloroethane 20.00 101 63 1281.0 020.2701,1,2-Trichloroethane 20.00 102 75 1251.0 020.3401,1-Dichloroethane 20.00 99.4 69 1330.50 019.8701,1-Dichloroethene 20.00 104 68 1301.0 020.7501,1-Dichloropropene 20.00 108 73 1321.0 021.5401,2,3-Trichlorobenzene 20.00 115 67 1371.0 022.9501,2,3-Trichloropropane 20.00 104 73 1241.0 020.8301,2,4-Trichlorobenzene 20.00 111 66 1341.0 022.2001,2,4-Trimethylbenzene 20.00 112 74 1321.0 022.3101,2-Dibromo-3-chloropropane 20.00 108 50 1322.0 021.6001,2-Dibromoethane 20.00 103 80 1211.0 020.5401,2-Dichlorobenzene 20.00 105 71 1221.0 021.0001,2-Dichloroethane 20.00 103 69 1320.50 020.5201,2-Dichloropropane 20.00 104 75 1251.0 020.8001,3,5-Trimethylbenzene 20.00 110 74 1311.0 022.1001,3-Dichlorobenzene 20.00 107 75 1241.0 021.4601,3-Dichloropropane 20.00 105 73 1261.0 020.9601,4-Dichlorobenzene 20.00 104 74 1231.0 020.8102,2-Dichloropropane 20.00 89.0 69 1371.0 017.8002-Butanone 200.0 95.1 49 13610 0190.2002-Chlorotoluene 20.00 106 73 1261.0 021.2904-Chlorotoluene 20.00 108 74 1281.0 021.5304-Isopropyltoluene 20.00 113 73 1301.0 022.6704-Methyl-2-pentanone 200.0 107 58 13410 0214.630Acetone 200.0 92.5 40 13510 0185.080Benzene 20.00 104 81 1221.0 020.860Bromobenzene 20.00 103 76 1241.0 020.550Bromochloromethane 20.00 97.9 65 1291.0 019.570
Qualifiers: B Analyte detected in the associated Method Blank E Value above quantitation range H Holding times for preparation or analysis exceededJ Analyte detected below quantitation limits ND Not Detected at the Reporting Limit R RPD outside accepted recovery limitsS Spike/Surrogate outside of limits due to matrix interference DO Surrogate Diluted Out Calculations are based on raw values
10 of 18
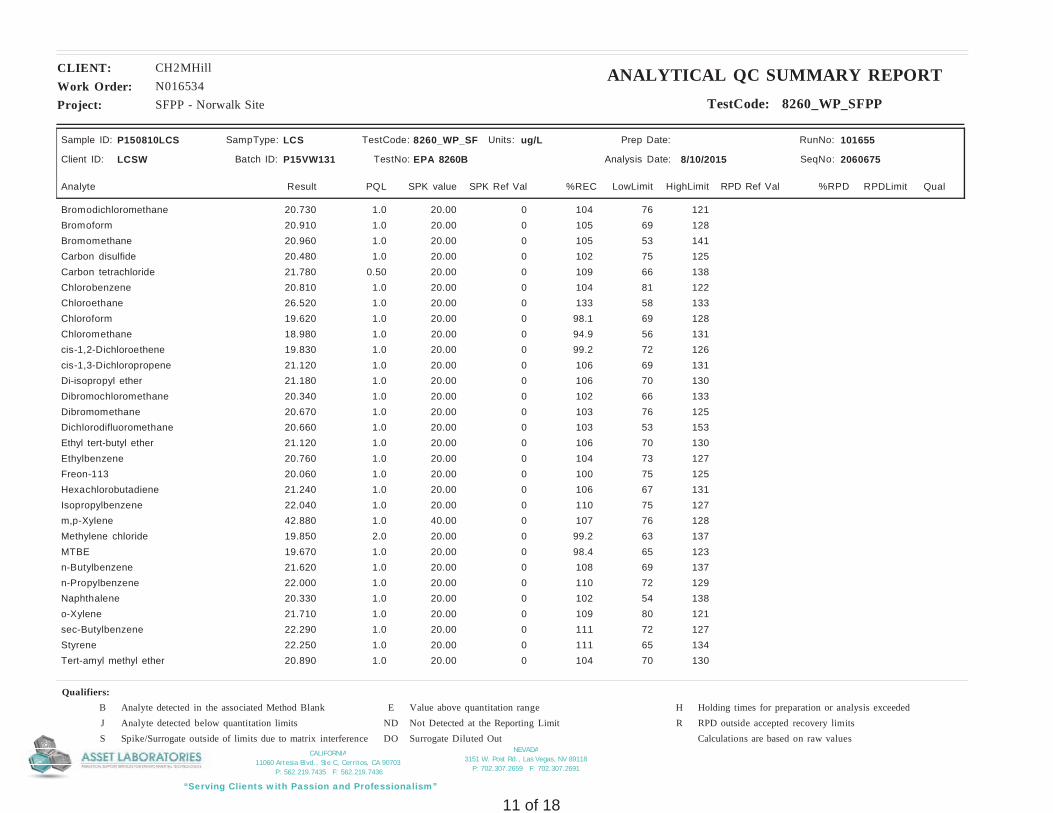
NEVADA3151 W. Post Rd., Las Vegas, NV 89118
P: 702.307.2659 F: 702.307.2691
“Serving Clients with Passion and Professionalism”
CALIFORNIA11060 Artesia Blvd., Ste C, Cerritos, CA 90703
P: 562.219.7435 F: 562.219.7436
Project: SFPP - Norwalk Site
CLIENT: CH2MHillWork Order: N016534
ANALYTICAL QC SUMMARY REPORTTestCode: 8260_WP_SFPP
Sample ID: P150810LCS
Batch ID: P15VW131 TestNo: EPA 8260B Analysis Date: 8/10/2015
Prep Date:
Analyte Result SPK value SPK Ref Val %REC RPD Ref Val %RPDLowLimit HighLimit RPDLimit Qual
Units: ug/L
PQL
Client ID: LCSW
RunNo: 101655
SeqNo: 2060675
LCSSampType: TestCode: 8260_WP_SF
Bromodichloromethane 20.00 104 76 1211.0 020.730Bromoform 20.00 105 69 1281.0 020.910Bromomethane 20.00 105 53 1411.0 020.960Carbon disulfide 20.00 102 75 1251.0 020.480Carbon tetrachloride 20.00 109 66 1380.50 021.780Chlorobenzene 20.00 104 81 1221.0 020.810Chloroethane 20.00 133 58 1331.0 026.520Chloroform 20.00 98.1 69 1281.0 019.620Chloromethane 20.00 94.9 56 1311.0 018.980cis-1,2-Dichloroethene 20.00 99.2 72 1261.0 019.830cis-1,3-Dichloropropene 20.00 106 69 1311.0 021.120Di-isopropyl ether 20.00 106 70 1301.0 021.180Dibromochloromethane 20.00 102 66 1331.0 020.340Dibromomethane 20.00 103 76 1251.0 020.670Dichlorodifluoromethane 20.00 103 53 1531.0 020.660Ethyl tert-butyl ether 20.00 106 70 1301.0 021.120Ethylbenzene 20.00 104 73 1271.0 020.760Freon-113 20.00 100 75 1251.0 020.060Hexachlorobutadiene 20.00 106 67 1311.0 021.240Isopropylbenzene 20.00 110 75 1271.0 022.040m,p-Xylene 40.00 107 76 1281.0 042.880Methylene chloride 20.00 99.2 63 1372.0 019.850MTBE 20.00 98.4 65 1231.0 019.670n-Butylbenzene 20.00 108 69 1371.0 021.620n-Propylbenzene 20.00 110 72 1291.0 022.000Naphthalene 20.00 102 54 1381.0 020.330o-Xylene 20.00 109 80 1211.0 021.710sec-Butylbenzene 20.00 111 72 1271.0 022.290Styrene 20.00 111 65 1341.0 022.250Tert-amyl methyl ether 20.00 104 70 1301.0 020.890
Qualifiers: B Analyte detected in the associated Method Blank E Value above quantitation range H Holding times for preparation or analysis exceededJ Analyte detected below quantitation limits ND Not Detected at the Reporting Limit R RPD outside accepted recovery limitsS Spike/Surrogate outside of limits due to matrix interference DO Surrogate Diluted Out Calculations are based on raw values
11 of 18
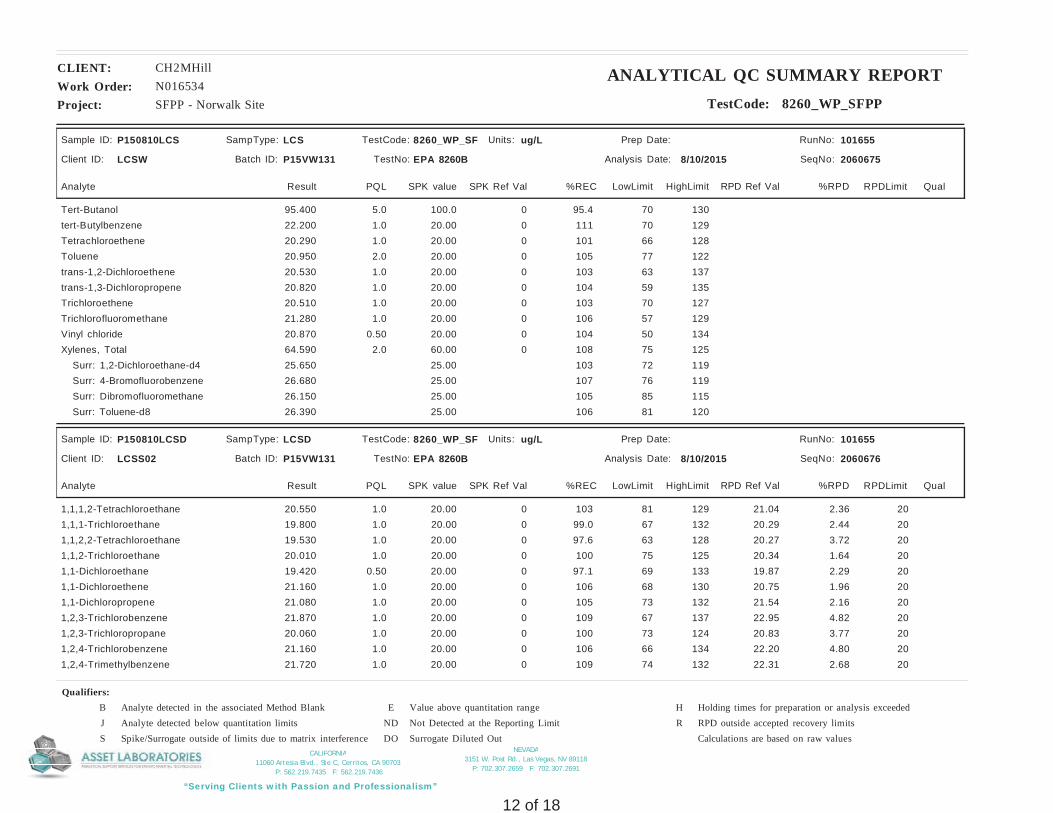
NEVADA3151 W. Post Rd., Las Vegas, NV 89118
P: 702.307.2659 F: 702.307.2691
“Serving Clients with Passion and Professionalism”
CALIFORNIA11060 Artesia Blvd., Ste C, Cerritos, CA 90703
P: 562.219.7435 F: 562.219.7436
Project: SFPP - Norwalk Site
CLIENT: CH2MHillWork Order: N016534
ANALYTICAL QC SUMMARY REPORTTestCode: 8260_WP_SFPP
Sample ID: P150810LCS
Batch ID: P15VW131 TestNo: EPA 8260B Analysis Date: 8/10/2015
Prep Date:
Analyte Result SPK value SPK Ref Val %REC RPD Ref Val %RPDLowLimit HighLimit RPDLimit Qual
Units: ug/L
PQL
Client ID: LCSW
RunNo: 101655
SeqNo: 2060675
LCSSampType: TestCode: 8260_WP_SF
Tert-Butanol 100.0 95.4 70 1305.0 095.400tert-Butylbenzene 20.00 111 70 1291.0 022.200Tetrachloroethene 20.00 101 66 1281.0 020.290Toluene 20.00 105 77 1222.0 020.950trans-1,2-Dichloroethene 20.00 103 63 1371.0 020.530trans-1,3-Dichloropropene 20.00 104 59 1351.0 020.820Trichloroethene 20.00 103 70 1271.0 020.510Trichlorofluoromethane 20.00 106 57 1291.0 021.280Vinyl chloride 20.00 104 50 1340.50 020.870Xylenes, Total 60.00 108 75 1252.0 064.590 Surr: 1,2-Dichloroethane-d4 25.00 103 72 11925.650 Surr: 4-Bromofluorobenzene 25.00 107 76 11926.680 Surr: Dibromofluoromethane 25.00 105 85 11526.150 Surr: Toluene-d8 25.00 106 81 12026.390
Sample ID: P150810LCSD
Batch ID: P15VW131 TestNo: EPA 8260B Analysis Date: 8/10/2015
Prep Date:
Analyte Result SPK value SPK Ref Val %REC RPD Ref Val %RPDLowLimit HighLimit RPDLimit Qual
Units: ug/L
PQL
Client ID: LCSS02
RunNo: 101655
SeqNo: 2060676
LCSDSampType: TestCode: 8260_WP_SF
1,1,1,2-Tetrachloroethane 20.00 103 81 129 201.0 0 21.04 2.3620.5501,1,1-Trichloroethane 20.00 99.0 67 132 201.0 0 20.29 2.4419.8001,1,2,2-Tetrachloroethane 20.00 97.6 63 128 201.0 0 20.27 3.7219.5301,1,2-Trichloroethane 20.00 100 75 125 201.0 0 20.34 1.6420.0101,1-Dichloroethane 20.00 97.1 69 133 200.50 0 19.87 2.2919.4201,1-Dichloroethene 20.00 106 68 130 201.0 0 20.75 1.9621.1601,1-Dichloropropene 20.00 105 73 132 201.0 0 21.54 2.1621.0801,2,3-Trichlorobenzene 20.00 109 67 137 201.0 0 22.95 4.8221.8701,2,3-Trichloropropane 20.00 100 73 124 201.0 0 20.83 3.7720.0601,2,4-Trichlorobenzene 20.00 106 66 134 201.0 0 22.20 4.8021.1601,2,4-Trimethylbenzene 20.00 109 74 132 201.0 0 22.31 2.6821.720
Qualifiers: B Analyte detected in the associated Method Blank E Value above quantitation range H Holding times for preparation or analysis exceededJ Analyte detected below quantitation limits ND Not Detected at the Reporting Limit R RPD outside accepted recovery limitsS Spike/Surrogate outside of limits due to matrix interference DO Surrogate Diluted Out Calculations are based on raw values
12 of 18
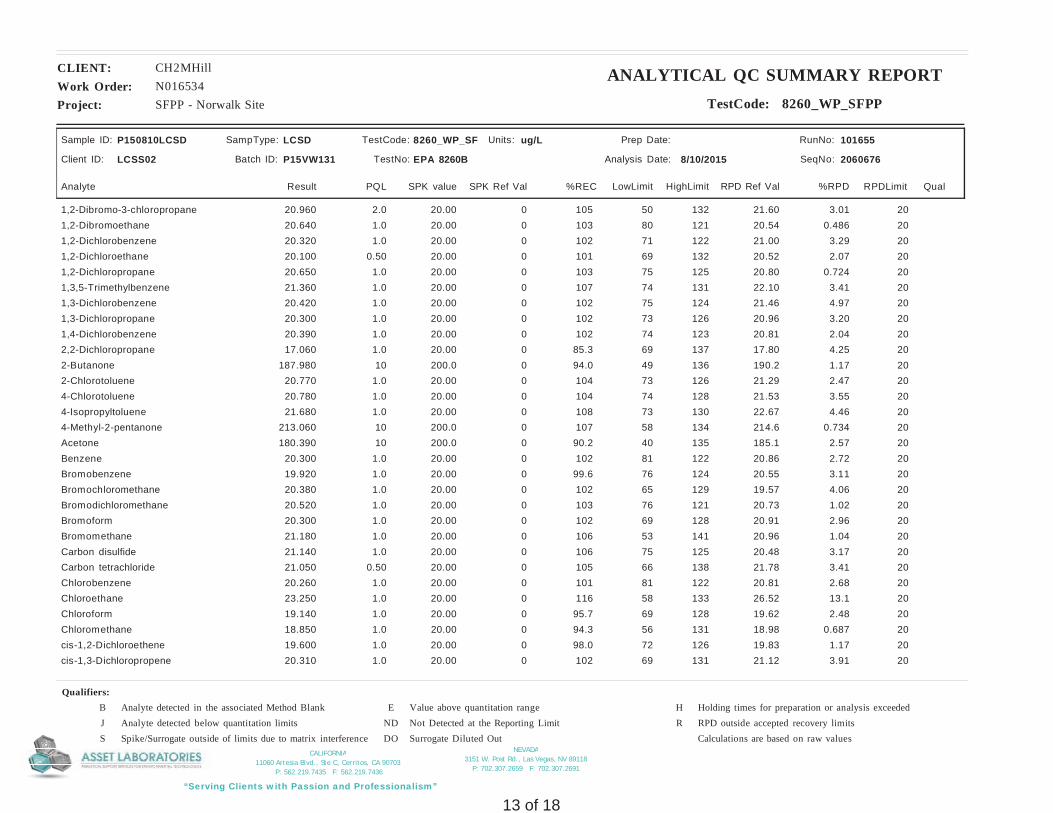
NEVADA3151 W. Post Rd., Las Vegas, NV 89118
P: 702.307.2659 F: 702.307.2691
“Serving Clients with Passion and Professionalism”
CALIFORNIA11060 Artesia Blvd., Ste C, Cerritos, CA 90703
P: 562.219.7435 F: 562.219.7436
Project: SFPP - Norwalk Site
CLIENT: CH2MHillWork Order: N016534
ANALYTICAL QC SUMMARY REPORTTestCode: 8260_WP_SFPP
Sample ID: P150810LCSD
Batch ID: P15VW131 TestNo: EPA 8260B Analysis Date: 8/10/2015
Prep Date:
Analyte Result SPK value SPK Ref Val %REC RPD Ref Val %RPDLowLimit HighLimit RPDLimit Qual
Units: ug/L
PQL
Client ID: LCSS02
RunNo: 101655
SeqNo: 2060676
LCSDSampType: TestCode: 8260_WP_SF
1,2-Dibromo-3-chloropropane 20.00 105 50 132 202.0 0 21.60 3.0120.9601,2-Dibromoethane 20.00 103 80 121 201.0 0 20.54 0.48620.6401,2-Dichlorobenzene 20.00 102 71 122 201.0 0 21.00 3.2920.3201,2-Dichloroethane 20.00 101 69 132 200.50 0 20.52 2.0720.1001,2-Dichloropropane 20.00 103 75 125 201.0 0 20.80 0.72420.6501,3,5-Trimethylbenzene 20.00 107 74 131 201.0 0 22.10 3.4121.3601,3-Dichlorobenzene 20.00 102 75 124 201.0 0 21.46 4.9720.4201,3-Dichloropropane 20.00 102 73 126 201.0 0 20.96 3.2020.3001,4-Dichlorobenzene 20.00 102 74 123 201.0 0 20.81 2.0420.3902,2-Dichloropropane 20.00 85.3 69 137 201.0 0 17.80 4.2517.0602-Butanone 200.0 94.0 49 136 2010 0 190.2 1.17187.9802-Chlorotoluene 20.00 104 73 126 201.0 0 21.29 2.4720.7704-Chlorotoluene 20.00 104 74 128 201.0 0 21.53 3.5520.7804-Isopropyltoluene 20.00 108 73 130 201.0 0 22.67 4.4621.6804-Methyl-2-pentanone 200.0 107 58 134 2010 0 214.6 0.734213.060Acetone 200.0 90.2 40 135 2010 0 185.1 2.57180.390Benzene 20.00 102 81 122 201.0 0 20.86 2.7220.300Bromobenzene 20.00 99.6 76 124 201.0 0 20.55 3.1119.920Bromochloromethane 20.00 102 65 129 201.0 0 19.57 4.0620.380Bromodichloromethane 20.00 103 76 121 201.0 0 20.73 1.0220.520Bromoform 20.00 102 69 128 201.0 0 20.91 2.9620.300Bromomethane 20.00 106 53 141 201.0 0 20.96 1.0421.180Carbon disulfide 20.00 106 75 125 201.0 0 20.48 3.1721.140Carbon tetrachloride 20.00 105 66 138 200.50 0 21.78 3.4121.050Chlorobenzene 20.00 101 81 122 201.0 0 20.81 2.6820.260Chloroethane 20.00 116 58 133 201.0 0 26.52 13.123.250Chloroform 20.00 95.7 69 128 201.0 0 19.62 2.4819.140Chloromethane 20.00 94.3 56 131 201.0 0 18.98 0.68718.850cis-1,2-Dichloroethene 20.00 98.0 72 126 201.0 0 19.83 1.1719.600cis-1,3-Dichloropropene 20.00 102 69 131 201.0 0 21.12 3.9120.310
Qualifiers: B Analyte detected in the associated Method Blank E Value above quantitation range H Holding times for preparation or analysis exceededJ Analyte detected below quantitation limits ND Not Detected at the Reporting Limit R RPD outside accepted recovery limitsS Spike/Surrogate outside of limits due to matrix interference DO Surrogate Diluted Out Calculations are based on raw values
13 of 18
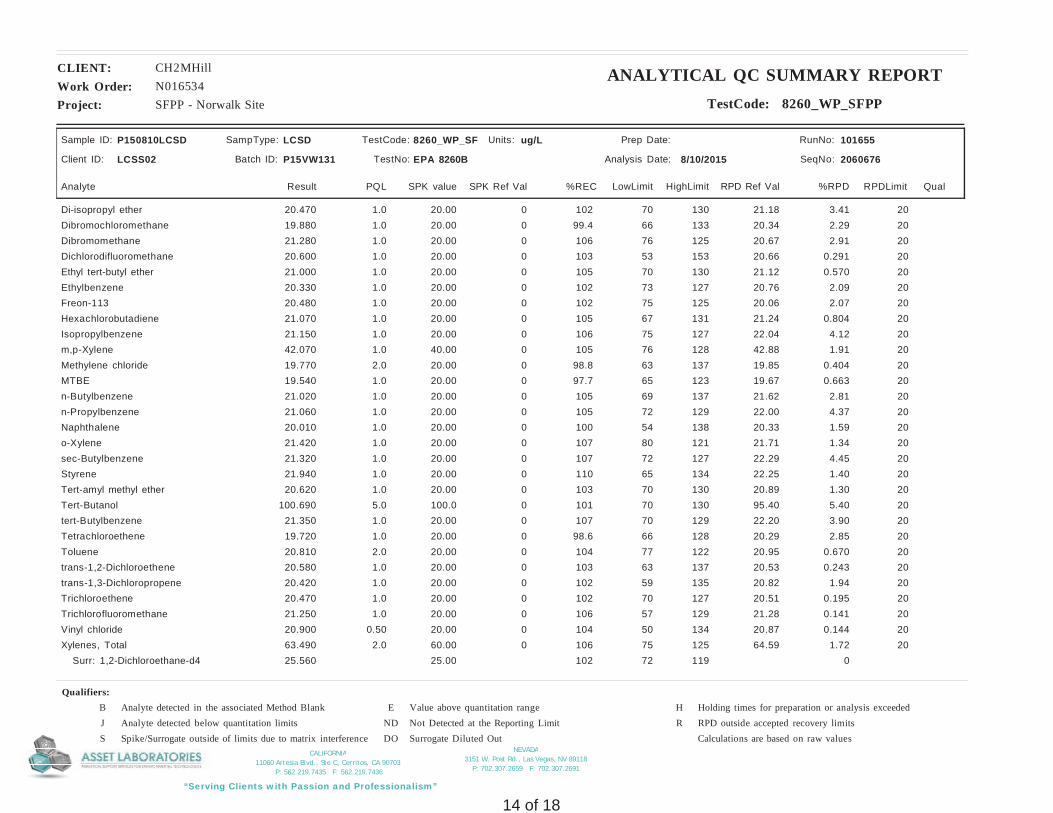
NEVADA3151 W. Post Rd., Las Vegas, NV 89118
P: 702.307.2659 F: 702.307.2691
“Serving Clients with Passion and Professionalism”
CALIFORNIA11060 Artesia Blvd., Ste C, Cerritos, CA 90703
P: 562.219.7435 F: 562.219.7436
Project: SFPP - Norwalk Site
CLIENT: CH2MHillWork Order: N016534
ANALYTICAL QC SUMMARY REPORTTestCode: 8260_WP_SFPP
Sample ID: P150810LCSD
Batch ID: P15VW131 TestNo: EPA 8260B Analysis Date: 8/10/2015
Prep Date:
Analyte Result SPK value SPK Ref Val %REC RPD Ref Val %RPDLowLimit HighLimit RPDLimit Qual
Units: ug/L
PQL
Client ID: LCSS02
RunNo: 101655
SeqNo: 2060676
LCSDSampType: TestCode: 8260_WP_SF
Di-isopropyl ether 20.00 102 70 130 201.0 0 21.18 3.4120.470Dibromochloromethane 20.00 99.4 66 133 201.0 0 20.34 2.2919.880Dibromomethane 20.00 106 76 125 201.0 0 20.67 2.9121.280Dichlorodifluoromethane 20.00 103 53 153 201.0 0 20.66 0.29120.600Ethyl tert-butyl ether 20.00 105 70 130 201.0 0 21.12 0.57021.000Ethylbenzene 20.00 102 73 127 201.0 0 20.76 2.0920.330Freon-113 20.00 102 75 125 201.0 0 20.06 2.0720.480Hexachlorobutadiene 20.00 105 67 131 201.0 0 21.24 0.80421.070Isopropylbenzene 20.00 106 75 127 201.0 0 22.04 4.1221.150m,p-Xylene 40.00 105 76 128 201.0 0 42.88 1.9142.070Methylene chloride 20.00 98.8 63 137 202.0 0 19.85 0.40419.770MTBE 20.00 97.7 65 123 201.0 0 19.67 0.66319.540n-Butylbenzene 20.00 105 69 137 201.0 0 21.62 2.8121.020n-Propylbenzene 20.00 105 72 129 201.0 0 22.00 4.3721.060Naphthalene 20.00 100 54 138 201.0 0 20.33 1.5920.010o-Xylene 20.00 107 80 121 201.0 0 21.71 1.3421.420sec-Butylbenzene 20.00 107 72 127 201.0 0 22.29 4.4521.320Styrene 20.00 110 65 134 201.0 0 22.25 1.4021.940Tert-amyl methyl ether 20.00 103 70 130 201.0 0 20.89 1.3020.620Tert-Butanol 100.0 101 70 130 205.0 0 95.40 5.40100.690tert-Butylbenzene 20.00 107 70 129 201.0 0 22.20 3.9021.350Tetrachloroethene 20.00 98.6 66 128 201.0 0 20.29 2.8519.720Toluene 20.00 104 77 122 202.0 0 20.95 0.67020.810trans-1,2-Dichloroethene 20.00 103 63 137 201.0 0 20.53 0.24320.580trans-1,3-Dichloropropene 20.00 102 59 135 201.0 0 20.82 1.9420.420Trichloroethene 20.00 102 70 127 201.0 0 20.51 0.19520.470Trichlorofluoromethane 20.00 106 57 129 201.0 0 21.28 0.14121.250Vinyl chloride 20.00 104 50 134 200.50 0 20.87 0.14420.900Xylenes, Total 60.00 106 75 125 202.0 0 64.59 1.7263.490 Surr: 1,2-Dichloroethane-d4 25.00 102 72 119 025.560
Qualifiers: B Analyte detected in the associated Method Blank E Value above quantitation range H Holding times for preparation or analysis exceededJ Analyte detected below quantitation limits ND Not Detected at the Reporting Limit R RPD outside accepted recovery limitsS Spike/Surrogate outside of limits due to matrix interference DO Surrogate Diluted Out Calculations are based on raw values
14 of 18

NEVADA3151 W. Post Rd., Las Vegas, NV 89118
P: 702.307.2659 F: 702.307.2691
“Serving Clients with Passion and Professionalism”
CALIFORNIA11060 Artesia Blvd., Ste C, Cerritos, CA 90703
P: 562.219.7435 F: 562.219.7436
Project: SFPP - Norwalk Site
CLIENT: CH2MHillWork Order: N016534
ANALYTICAL QC SUMMARY REPORTTestCode: 8260_WP_SFPP
Sample ID: P150810LCSD
Batch ID: P15VW131 TestNo: EPA 8260B Analysis Date: 8/10/2015
Prep Date:
Analyte Result SPK value SPK Ref Val %REC RPD Ref Val %RPDLowLimit HighLimit RPDLimit Qual
Units: ug/L
PQL
Client ID: LCSS02
RunNo: 101655
SeqNo: 2060676
LCSDSampType: TestCode: 8260_WP_SF
Surr: 4-Bromofluorobenzene 25.00 107 76 119 026.760 Surr: Dibromofluoromethane 25.00 102 85 115 025.400 Surr: Toluene-d8 25.00 104 81 120 026.040
Sample ID: P150810MB3
Batch ID: P15VW131 TestNo: EPA 8260B Analysis Date: 8/10/2015
Prep Date:
Analyte Result SPK value SPK Ref Val %REC RPD Ref Val %RPDLowLimit HighLimit RPDLimit Qual
Units: ug/L
PQL
Client ID: PBW
RunNo: 101655
SeqNo: 2060677
MBLKSampType: TestCode: 8260_WP_SF
1,1,1,2-Tetrachloroethane 1.0ND1,1,1-Trichloroethane 1.0ND1,1,2,2-Tetrachloroethane 1.0ND1,1,2-Trichloroethane 1.0ND1,1-Dichloroethane 0.50ND1,1-Dichloroethene 1.0ND1,1-Dichloropropene 1.0ND1,2,3-Trichlorobenzene J1.00.2901,2,3-Trichloropropane 1.0ND1,2,4-Trichlorobenzene J1.00.2601,2,4-Trimethylbenzene 1.0ND1,2-Dibromo-3-chloropropane 2.0ND1,2-Dibromoethane 1.0ND1,2-Dichlorobenzene J1.00.0801,2-Dichloroethane 0.50ND1,2-Dichloropropane 1.0ND1,3,5-Trimethylbenzene J1.00.0401,3-Dichlorobenzene J1.00.0801,3-Dichloropropane 1.0ND1,4-Dichlorobenzene 1.0ND2,2-Dichloropropane 1.0ND2-Butanone 10ND
Qualifiers: B Analyte detected in the associated Method Blank E Value above quantitation range H Holding times for preparation or analysis exceededJ Analyte detected below quantitation limits ND Not Detected at the Reporting Limit R RPD outside accepted recovery limitsS Spike/Surrogate outside of limits due to matrix interference DO Surrogate Diluted Out Calculations are based on raw values
15 of 18

NEVADA3151 W. Post Rd., Las Vegas, NV 89118
P: 702.307.2659 F: 702.307.2691
“Serving Clients with Passion and Professionalism”
CALIFORNIA11060 Artesia Blvd., Ste C, Cerritos, CA 90703
P: 562.219.7435 F: 562.219.7436
Project: SFPP - Norwalk Site
CLIENT: CH2MHillWork Order: N016534
ANALYTICAL QC SUMMARY REPORTTestCode: 8260_WP_SFPP
Sample ID: P150810MB3
Batch ID: P15VW131 TestNo: EPA 8260B Analysis Date: 8/10/2015
Prep Date:
Analyte Result SPK value SPK Ref Val %REC RPD Ref Val %RPDLowLimit HighLimit RPDLimit Qual
Units: ug/L
PQL
Client ID: PBW
RunNo: 101655
SeqNo: 2060677
MBLKSampType: TestCode: 8260_WP_SF
2-Chlorotoluene J1.00.0404-Chlorotoluene J1.00.0404-Isopropyltoluene 1.0ND4-Methyl-2-pentanone 10NDAcetone 10NDBenzene 1.0NDBromobenzene 1.0NDBromochloromethane 1.0NDBromodichloromethane 1.0NDBromoform 1.0NDBromomethane 1.0NDCarbon disulfide 1.0NDCarbon tetrachloride 0.50NDChlorobenzene 1.0NDChloroethane 1.0NDChloroform J1.00.050Chloromethane 1.0NDcis-1,2-Dichloroethene 1.0NDcis-1,3-Dichloropropene 1.0NDDi-isopropyl ether 1.0NDDibromochloromethane 1.0NDDibromomethane 1.0NDDichlorodifluoromethane 1.0NDEthyl tert-butyl ether 1.0NDEthylbenzene 1.0NDFreon-113 1.0NDHexachlorobutadiene 1.0NDIsopropylbenzene 1.0NDm,p-Xylene J1.00.050Methylene chloride 2.0ND
Qualifiers: B Analyte detected in the associated Method Blank E Value above quantitation range H Holding times for preparation or analysis exceededJ Analyte detected below quantitation limits ND Not Detected at the Reporting Limit R RPD outside accepted recovery limitsS Spike/Surrogate outside of limits due to matrix interference DO Surrogate Diluted Out Calculations are based on raw values
16 of 18
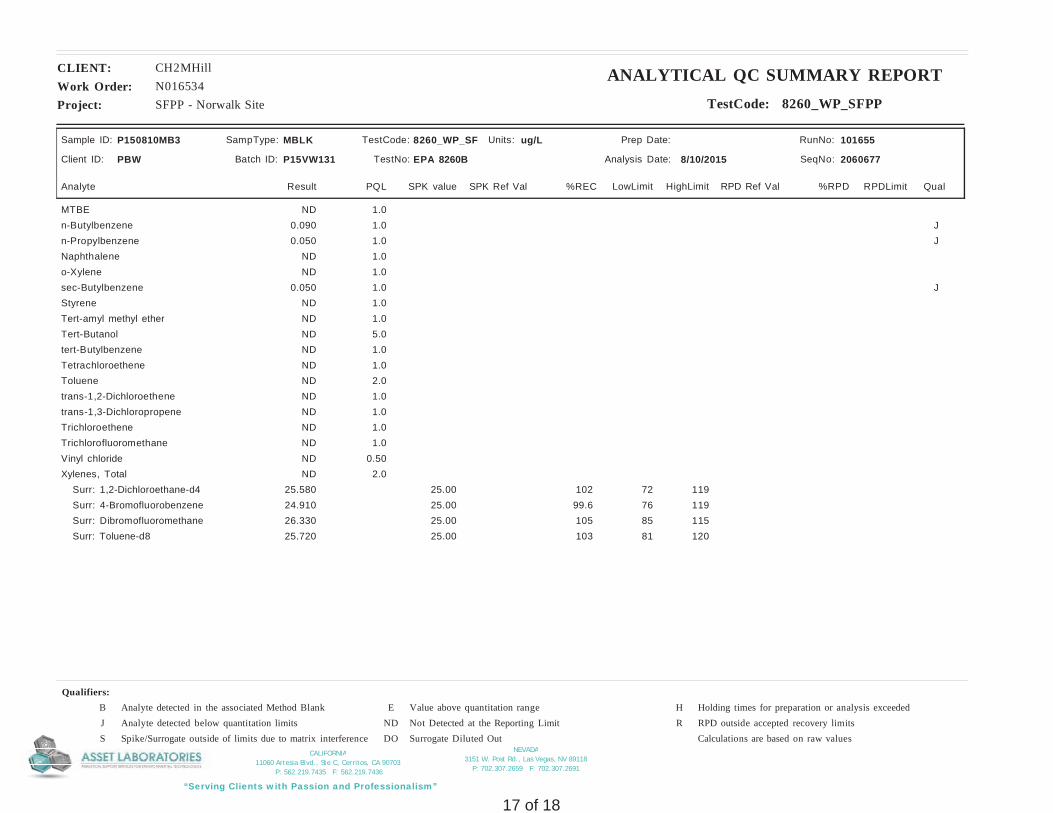
NEVADA3151 W. Post Rd., Las Vegas, NV 89118
P: 702.307.2659 F: 702.307.2691
“Serving Clients with Passion and Professionalism”
CALIFORNIA11060 Artesia Blvd., Ste C, Cerritos, CA 90703
P: 562.219.7435 F: 562.219.7436
Project: SFPP - Norwalk Site
CLIENT: CH2MHillWork Order: N016534
ANALYTICAL QC SUMMARY REPORTTestCode: 8260_WP_SFPP
Sample ID: P150810MB3
Batch ID: P15VW131 TestNo: EPA 8260B Analysis Date: 8/10/2015
Prep Date:
Analyte Result SPK value SPK Ref Val %REC RPD Ref Val %RPDLowLimit HighLimit RPDLimit Qual
Units: ug/L
PQL
Client ID: PBW
RunNo: 101655
SeqNo: 2060677
MBLKSampType: TestCode: 8260_WP_SF
MTBE 1.0NDn-Butylbenzene J1.00.090n-Propylbenzene J1.00.050Naphthalene 1.0NDo-Xylene 1.0NDsec-Butylbenzene J1.00.050Styrene 1.0NDTert-amyl methyl ether 1.0NDTert-Butanol 5.0NDtert-Butylbenzene 1.0NDTetrachloroethene 1.0NDToluene 2.0NDtrans-1,2-Dichloroethene 1.0NDtrans-1,3-Dichloropropene 1.0NDTrichloroethene 1.0NDTrichlorofluoromethane 1.0NDVinyl chloride 0.50NDXylenes, Total 2.0ND Surr: 1,2-Dichloroethane-d4 25.00 102 72 11925.580 Surr: 4-Bromofluorobenzene 25.00 99.6 76 11924.910 Surr: Dibromofluoromethane 25.00 105 85 11526.330 Surr: Toluene-d8 25.00 103 81 12025.720
Qualifiers: B Analyte detected in the associated Method Blank E Value above quantitation range H Holding times for preparation or analysis exceededJ Analyte detected below quantitation limits ND Not Detected at the Reporting Limit R RPD outside accepted recovery limitsS Spike/Surrogate outside of limits due to matrix interference DO Surrogate Diluted Out Calculations are based on raw values
17 of 18
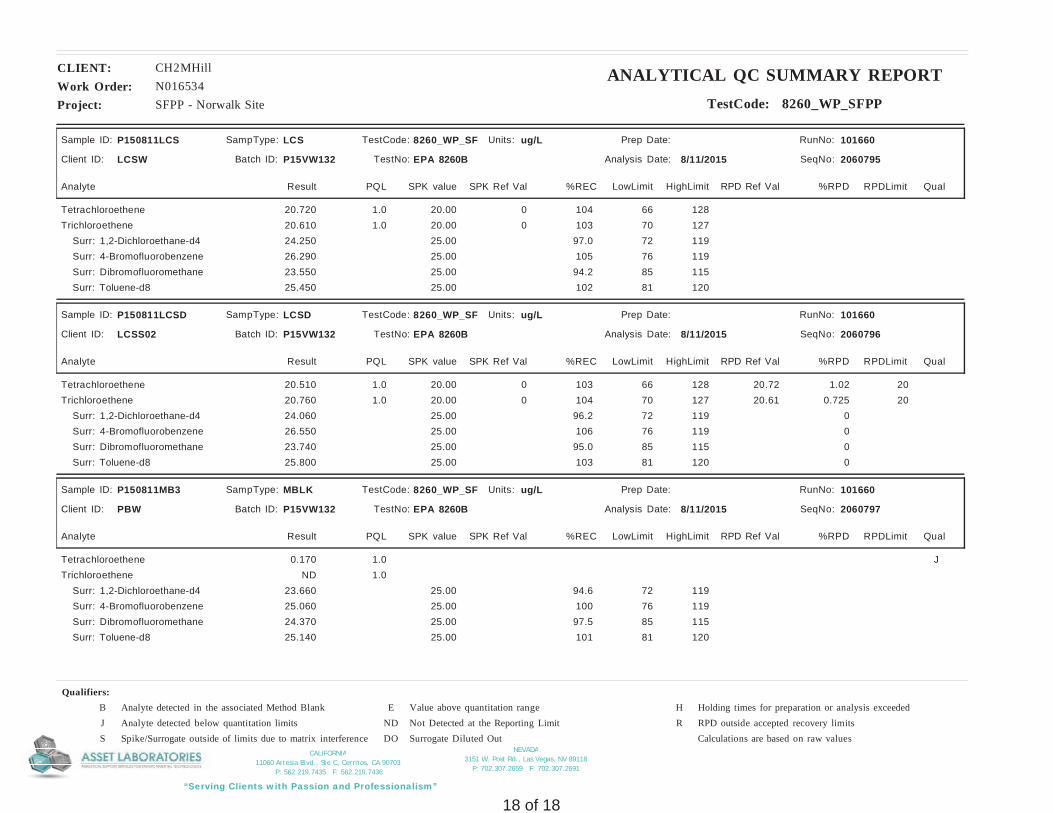
NEVADA3151 W. Post Rd., Las Vegas, NV 89118
P: 702.307.2659 F: 702.307.2691
“Serving Clients with Passion and Professionalism”
CALIFORNIA11060 Artesia Blvd., Ste C, Cerritos, CA 90703
P: 562.219.7435 F: 562.219.7436
Project: SFPP - Norwalk Site
CLIENT: CH2MHillWork Order: N016534
ANALYTICAL QC SUMMARY REPORTTestCode: 8260_WP_SFPP
Sample ID: P150811LCS
Batch ID: P15VW132 TestNo: EPA 8260B Analysis Date: 8/11/2015
Prep Date:
Analyte Result SPK value SPK Ref Val %REC RPD Ref Val %RPDLowLimit HighLimit RPDLimit Qual
Units: ug/L
PQL
Client ID: LCSW
RunNo: 101660
SeqNo: 2060795
LCSSampType: TestCode: 8260_WP_SF
Tetrachloroethene 20.00 104 66 1281.0 020.720Trichloroethene 20.00 103 70 1271.0 020.610 Surr: 1,2-Dichloroethane-d4 25.00 97.0 72 11924.250 Surr: 4-Bromofluorobenzene 25.00 105 76 11926.290 Surr: Dibromofluoromethane 25.00 94.2 85 11523.550 Surr: Toluene-d8 25.00 102 81 12025.450
Sample ID: P150811LCSD
Batch ID: P15VW132 TestNo: EPA 8260B Analysis Date: 8/11/2015
Prep Date:
Analyte Result SPK value SPK Ref Val %REC RPD Ref Val %RPDLowLimit HighLimit RPDLimit Qual
Units: ug/L
PQL
Client ID: LCSS02
RunNo: 101660
SeqNo: 2060796
LCSDSampType: TestCode: 8260_WP_SF
Tetrachloroethene 20.00 103 66 128 201.0 0 20.72 1.0220.510Trichloroethene 20.00 104 70 127 201.0 0 20.61 0.72520.760 Surr: 1,2-Dichloroethane-d4 25.00 96.2 72 119 024.060 Surr: 4-Bromofluorobenzene 25.00 106 76 119 026.550 Surr: Dibromofluoromethane 25.00 95.0 85 115 023.740 Surr: Toluene-d8 25.00 103 81 120 025.800
Sample ID: P150811MB3
Batch ID: P15VW132 TestNo: EPA 8260B Analysis Date: 8/11/2015
Prep Date:
Analyte Result SPK value SPK Ref Val %REC RPD Ref Val %RPDLowLimit HighLimit RPDLimit Qual
Units: ug/L
PQL
Client ID: PBW
RunNo: 101660
SeqNo: 2060797
MBLKSampType: TestCode: 8260_WP_SF
Tetrachloroethene J1.00.170Trichloroethene 1.0ND Surr: 1,2-Dichloroethane-d4 25.00 94.6 72 11923.660 Surr: 4-Bromofluorobenzene 25.00 100 76 11925.060 Surr: Dibromofluoromethane 25.00 97.5 85 11524.370 Surr: Toluene-d8 25.00 101 81 12025.140
Qualifiers: B Analyte detected in the associated Method Blank E Value above quantitation range H Holding times for preparation or analysis exceededJ Analyte detected below quantitation limits ND Not Detected at the Reporting Limit R RPD outside accepted recovery limitsS Spike/Surrogate outside of limits due to matrix interference DO Surrogate Diluted Out Calculations are based on raw values
18 of 18
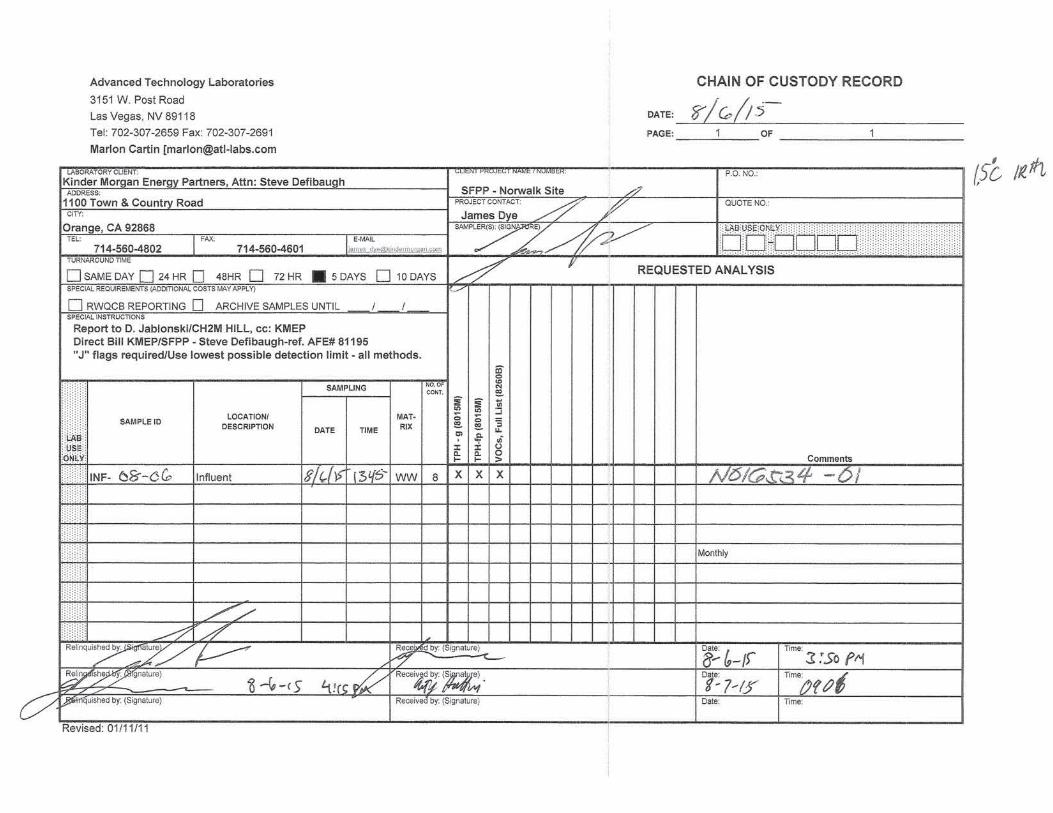
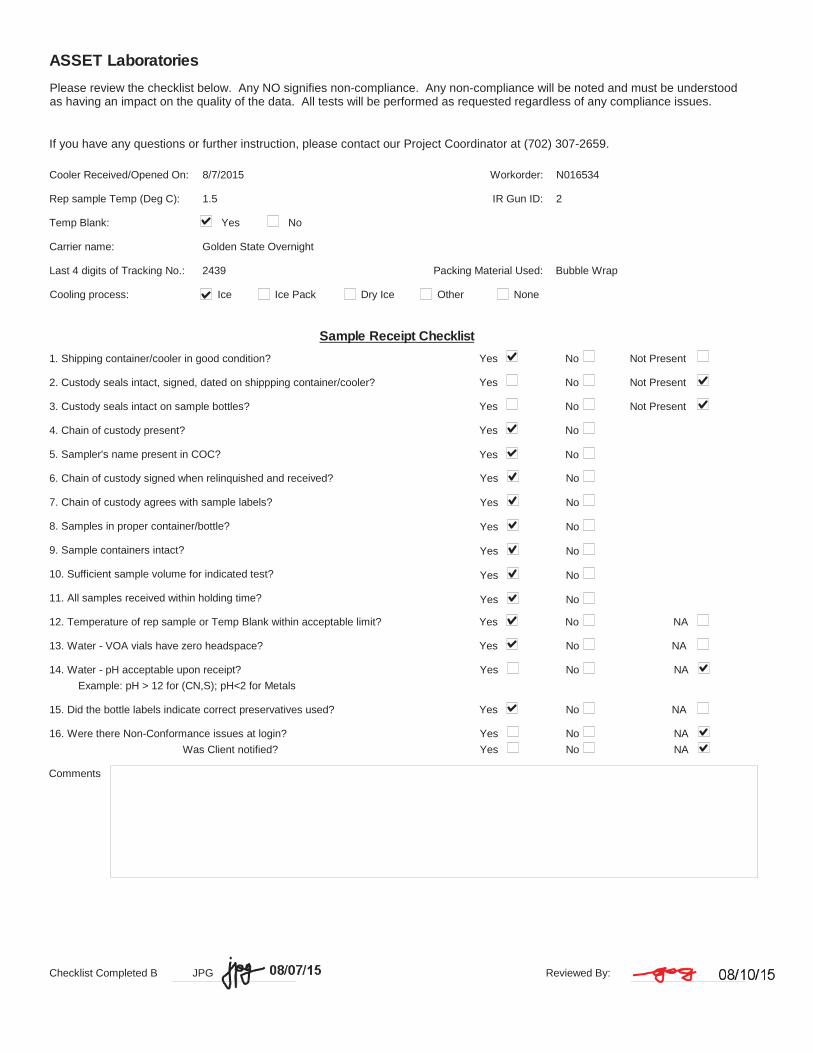
ASSET Laboratories
Please review the checklist below. Any NO signifies non-compliance. Any non-compliance will be noted and must be understoodas having an impact on the quality of the data. All tests will be performed as requested regardless of any compliance issues.
If you have any questions or further instruction, please contact our Project Coordinator at (702) 307-2659.
Carrier name: Golden State Overnight
Cooler Received/Opened On: 8/7/2015
Rep sample Temp (Deg C): 1.5 IR Gun ID: 2
Temp Blank: Yes No
Last 4 digits of Tracking No.: 2439
Cooling process: Ice Ice Pack Dry Ice Other None
Packing Material Used: Bubble Wrap
Workorder: N016534
Sample Receipt Checklist
4. Chain of custody present? Yes No
6. Chain of custody signed when relinquished and received? Yes No
7. Chain of custody agrees with sample labels? Yes No
8. Samples in proper container/bottle? Yes No
9. Sample containers intact? Yes No
10. Sufficient sample volume for indicated test? Yes No
11. All samples received within holding time? Yes No
Yes No NA13. Water - VOA vials have zero headspace?
14. Water - pH acceptable upon receipt? Yes No NAExample: pH > 12 for (CN,S); pH<2 for Metals
1. Shipping container/cooler in good condition? Yes No Not Present
2. Custody seals intact, signed, dated on shippping container/cooler? Yes No Not Present
3. Custody seals intact on sample bottles? Yes No Not Present
5. Sampler's name present in COC? Yes No
12. Temperature of rep sample or Temp Blank within acceptable limit? Yes No NA
Yes No NA15. Did the bottle labels indicate correct preservatives used?
16. Were there Non-Conformance issues at login? Yes No NAWas Client notified? Yes No NA
Comments
Checklist Completed B JPG Reviewed By:
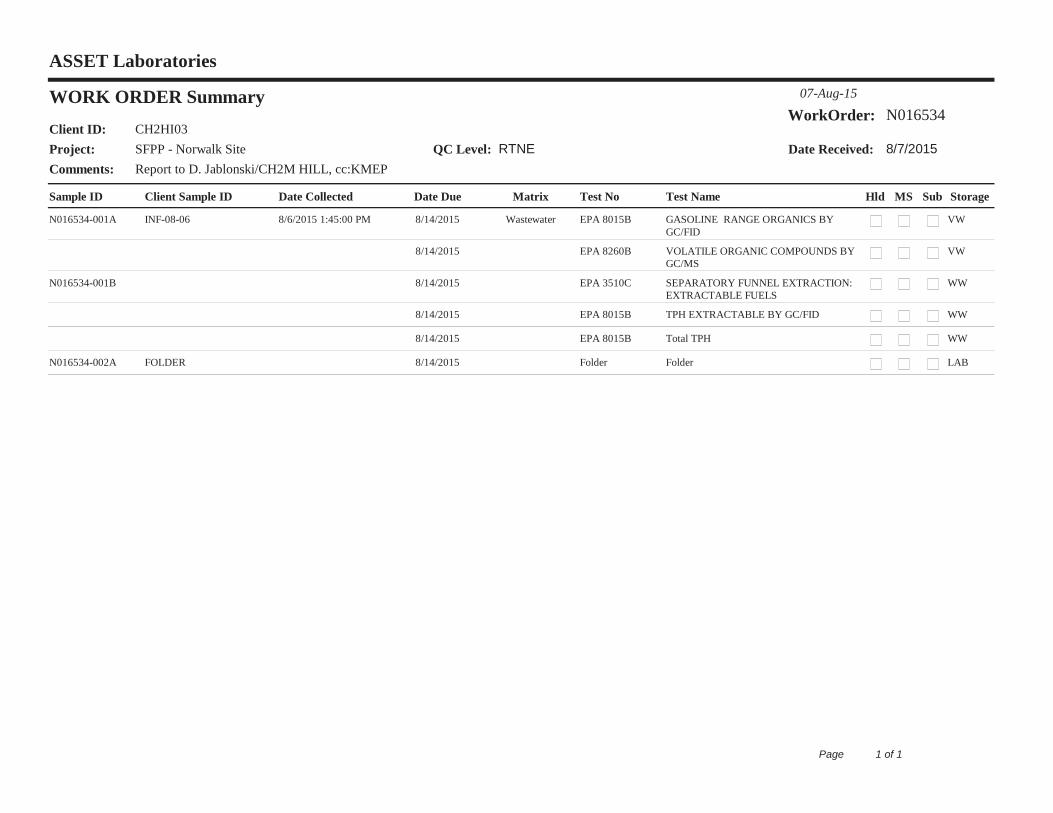
Sample ID Client Sample ID Date Collected
Date Received:
Date Due Matrix Test No
WORK ORDER Summary 07-Aug-15
WorkOrder: N016534
Comments: Report to D. Jablonski/CH2M HILL, cc:KMEP
Client ID: CH2HI03Project: SFPP - Norwalk Site QC Level: RTNE
Hld MS Sub
8/7/2015
Test Name
ASSET Laboratories
Storage
N016534-001A INF-08-06 8/6/2015 1:45:00 PM 8/14/2015 Wastewater EPA 8015B GASOLINE RANGE ORGANICS BY GC/FID
VW
8/14/2015 EPA 8260B VOLATILE ORGANIC COMPOUNDS BY GC/MS
VW
N016534-001B 8/14/2015 EPA 3510C SEPARATORY FUNNEL EXTRACTION: EXTRACTABLE FUELS
WW
8/14/2015 EPA 8015B TPH EXTRACTABLE BY GC/FID WW
8/14/2015 EPA 8015B Total TPH WW
N016534-002A FOLDER 8/14/2015 Folder Folder LAB
1 of 1Page
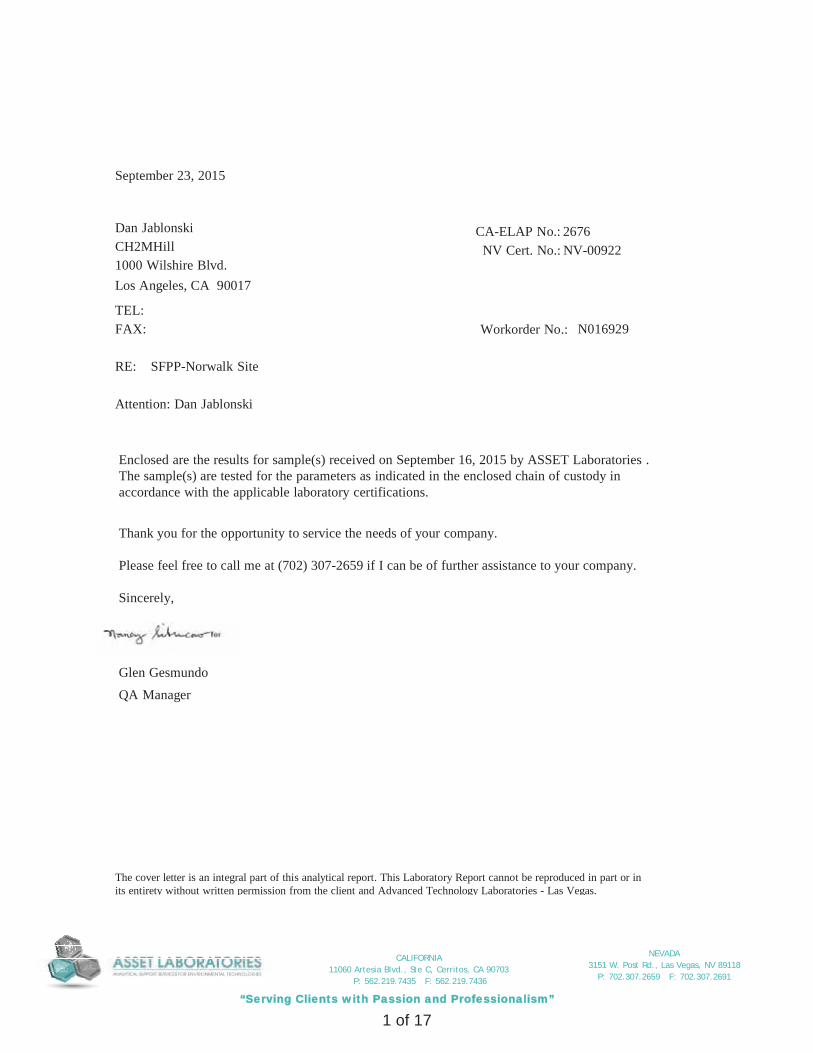
NEVADA3151 W. Post Rd., Las Vegas, NV 89118
P: 702.307.2659 F: 702.307.2691
“Serving Clients with Passion and Professionalism”
CALIFORNIA11060 Artesia Blvd., Ste C, Cerritos, CA 90703
P: 562.219.7435 F: 562.219.7436
September 23, 2015
CH2MHillDan Jablonski
Attention: Dan Jablonski
RE: SFPP-Norwalk Site
Workorder No.: N016929FAX:TEL:
1000 Wilshire Blvd.Los Angeles, CA 90017
CA-ELAP No.: 2676NV Cert. No.: NV-00922
Thank you for the opportunity to service the needs of your company.
Please feel free to call me at (702) 307-2659 if I can be of further assistance to your company.
Sincerely,
Glen Gesmundo
QA Manager
Enclosed are the results for sample(s) received on September 16, 2015 by ASSET Laboratories .The sample(s) are tested for the parameters as indicated in the enclosed chain of custody inaccordance with the applicable laboratory certifications.
The cover letter is an integral part of this analytical report. This Laboratory Report cannot be reproduced in part or inits entirety without written permission from the client and Advanced Technology Laboratories - Las Vegas.
1 of 17
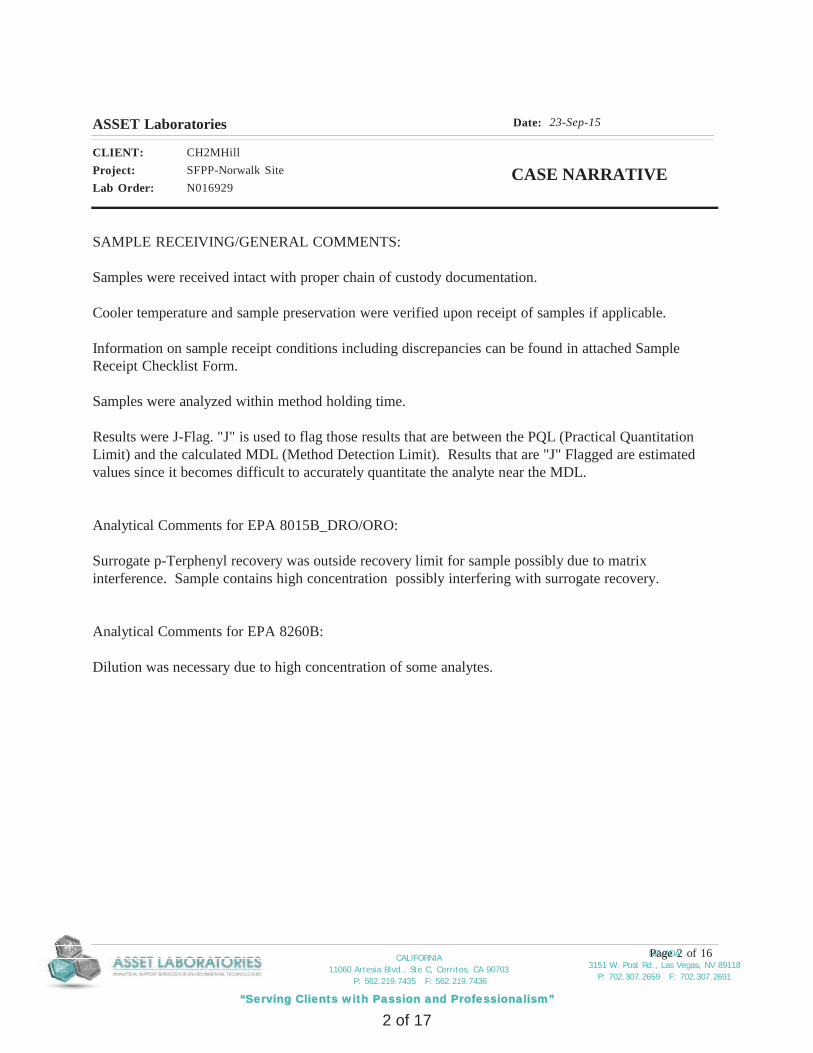
NEVADA3151 W. Post Rd., Las Vegas, NV 89118
P: 702.307.2659 F: 702.307.2691
“Serving Clients with Passion and Professionalism”
CALIFORNIA11060 Artesia Blvd., Ste C, Cerritos, CA 90703
P: 562.219.7435 F: 562.219.7436
23-Sep-15Date:ASSET Laboratories
Project: SFPP-Norwalk SiteCLIENT: CH2MHill
Lab Order: N016929CASE NARRATIVE
SAMPLE RECEIVING/GENERAL COMMENTS:
Samples were received intact with proper chain of custody documentation.
Cooler temperature and sample preservation were verified upon receipt of samples if applicable.
Information on sample receipt conditions including discrepancies can be found in attached SampleReceipt Checklist Form.
Samples were analyzed within method holding time.
Results were J-Flag. "J" is used to flag those results that are between the PQL (Practical QuantitationLimit) and the calculated MDL (Method Detection Limit). Results that are "J" Flagged are estimatedvalues since it becomes difficult to accurately quantitate the analyte near the MDL.
Analytical Comments for EPA 8015B_DRO/ORO:
Surrogate p-Terphenyl recovery was outside recovery limit for sample possibly due to matrixinterference. Sample contains high concentration possibly interfering with surrogate recovery.
Analytical Comments for EPA 8260B:
Dilution was necessary due to high concentration of some analytes.
Page 2 of 16
2 of 17
NEVADA3151 W. Post Rd., Las Vegas, NV 89118
P: 702.307.2659 F: 702.307.2691
“Serving Clients with Passion and Professionalism”
CALIFORNIA11060 Artesia Blvd., Ste C, Cerritos, CA 90703
P: 562.219.7435 F: 562.219.7436
23-Sep-15Date:ASSET Laboratories
Project: SFPP-Norwalk SiteCLIENT: CH2MHill
Lab Order: N016929Work Order Sample Summary
Lab Sample ID Client Sample ID Collection DateMatrix Date Received
Contract No:
Date Reported
N016929-001A INF-09-15 9/15/2015 1:15:00 PM 9/16/2015 9/23/2015Wastewater
N016929-001B INF-09-15 9/15/2015 1:15:00 PM 9/16/2015 9/23/2015Wastewater
Page 1 of 1
3 of 17
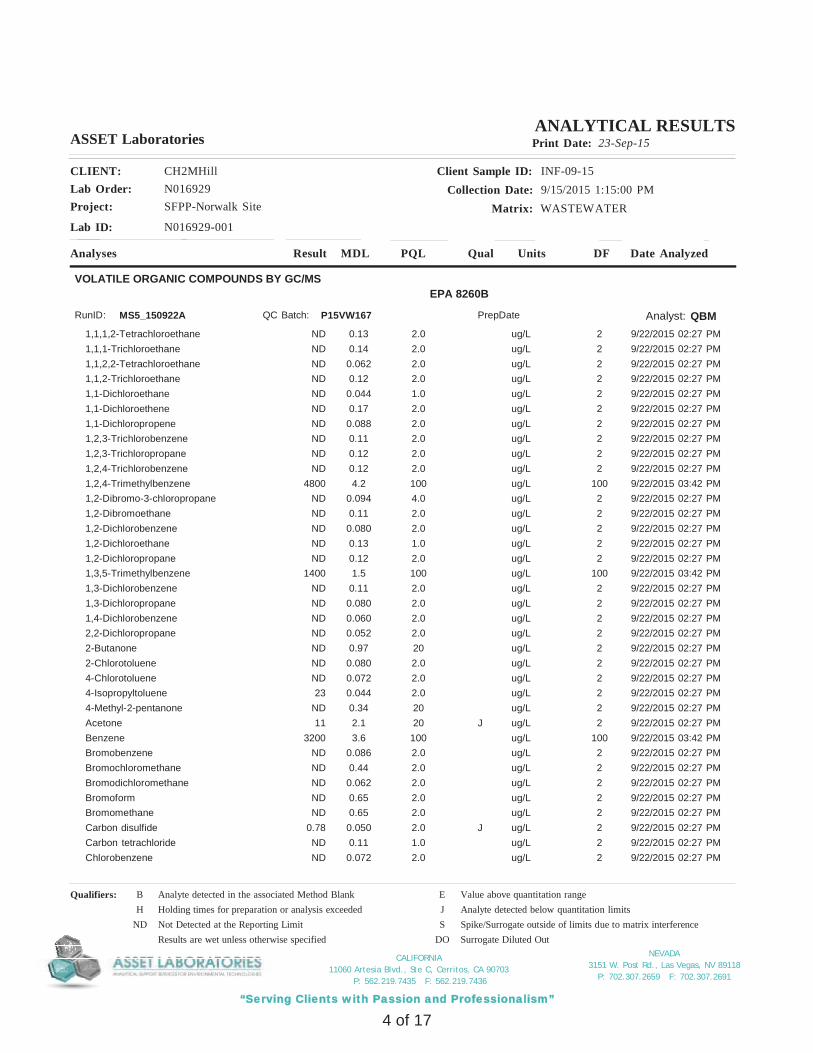
NEVADA3151 W. Post Rd., Las Vegas, NV 89118
P: 702.307.2659 F: 702.307.2691
“Serving Clients with Passion and Professionalism”
CALIFORNIA11060 Artesia Blvd., Ste C, Cerritos, CA 90703
P: 562.219.7435 F: 562.219.7436
Project: SFPP-Norwalk Site
Client Sample ID: INF-09-15Collection Date: 9/15/2015 1:15:00 PM
Matrix: WASTEWATER
CLIENT: CH2MHillLab Order: N016929
Lab ID: N016929-001
ASSET Laboratories Print Date: 23-Sep-15
Analyses Result Qual Units Date AnalyzedDFPQLMDL
ANALYTICAL RESULTS
VOLATILE ORGANIC COMPOUNDS BY GC/MSEPA 8260B
Analyst: QBMRunID: MS5_150922A P15VW167QC Batch: PrepDate
1,1,1,2-Tetrachloroethane 2.0 ug/L 2ND 0.13 9/22/2015 02:27 PM1,1,1-Trichloroethane 2.0 ug/L 2ND 0.14 9/22/2015 02:27 PM1,1,2,2-Tetrachloroethane 2.0 ug/L 2ND 0.062 9/22/2015 02:27 PM1,1,2-Trichloroethane 2.0 ug/L 2ND 0.12 9/22/2015 02:27 PM1,1-Dichloroethane 1.0 ug/L 2ND 0.044 9/22/2015 02:27 PM1,1-Dichloroethene 2.0 ug/L 2ND 0.17 9/22/2015 02:27 PM1,1-Dichloropropene 2.0 ug/L 2ND 0.088 9/22/2015 02:27 PM1,2,3-Trichlorobenzene 2.0 ug/L 2ND 0.11 9/22/2015 02:27 PM1,2,3-Trichloropropane 2.0 ug/L 2ND 0.12 9/22/2015 02:27 PM1,2,4-Trichlorobenzene 2.0 ug/L 2ND 0.12 9/22/2015 02:27 PM1,2,4-Trimethylbenzene 100 ug/L 1004800 4.2 9/22/2015 03:42 PM1,2-Dibromo-3-chloropropane 4.0 ug/L 2ND 0.094 9/22/2015 02:27 PM1,2-Dibromoethane 2.0 ug/L 2ND 0.11 9/22/2015 02:27 PM1,2-Dichlorobenzene 2.0 ug/L 2ND 0.080 9/22/2015 02:27 PM1,2-Dichloroethane 1.0 ug/L 2ND 0.13 9/22/2015 02:27 PM1,2-Dichloropropane 2.0 ug/L 2ND 0.12 9/22/2015 02:27 PM1,3,5-Trimethylbenzene 100 ug/L 1001400 1.5 9/22/2015 03:42 PM1,3-Dichlorobenzene 2.0 ug/L 2ND 0.11 9/22/2015 02:27 PM1,3-Dichloropropane 2.0 ug/L 2ND 0.080 9/22/2015 02:27 PM1,4-Dichlorobenzene 2.0 ug/L 2ND 0.060 9/22/2015 02:27 PM2,2-Dichloropropane 2.0 ug/L 2ND 0.052 9/22/2015 02:27 PM2-Butanone 20 ug/L 2ND 0.97 9/22/2015 02:27 PM2-Chlorotoluene 2.0 ug/L 2ND 0.080 9/22/2015 02:27 PM4-Chlorotoluene 2.0 ug/L 2ND 0.072 9/22/2015 02:27 PM4-Isopropyltoluene 2.0 ug/L 223 0.044 9/22/2015 02:27 PM4-Methyl-2-pentanone 20 ug/L 2ND 0.34 9/22/2015 02:27 PMAcetone J20 ug/L 211 2.1 9/22/2015 02:27 PMBenzene 100 ug/L 1003200 3.6 9/22/2015 03:42 PMBromobenzene 2.0 ug/L 2ND 0.086 9/22/2015 02:27 PMBromochloromethane 2.0 ug/L 2ND 0.44 9/22/2015 02:27 PMBromodichloromethane 2.0 ug/L 2ND 0.062 9/22/2015 02:27 PMBromoform 2.0 ug/L 2ND 0.65 9/22/2015 02:27 PMBromomethane 2.0 ug/L 2ND 0.65 9/22/2015 02:27 PMCarbon disulfide J2.0 ug/L 20.78 0.050 9/22/2015 02:27 PMCarbon tetrachloride 1.0 ug/L 2ND 0.11 9/22/2015 02:27 PMChlorobenzene 2.0 ug/L 2ND 0.072 9/22/2015 02:27 PM
Qualifiers: B Analyte detected in the associated Method Blank E Value above quantitation rangeH Holding times for preparation or analysis exceeded J Analyte detected below quantitation limits
ND Not Detected at the Reporting Limit S Spike/Surrogate outside of limits due to matrix interferenceResults are wet unless otherwise specified DO Surrogate Diluted Out
4 of 17
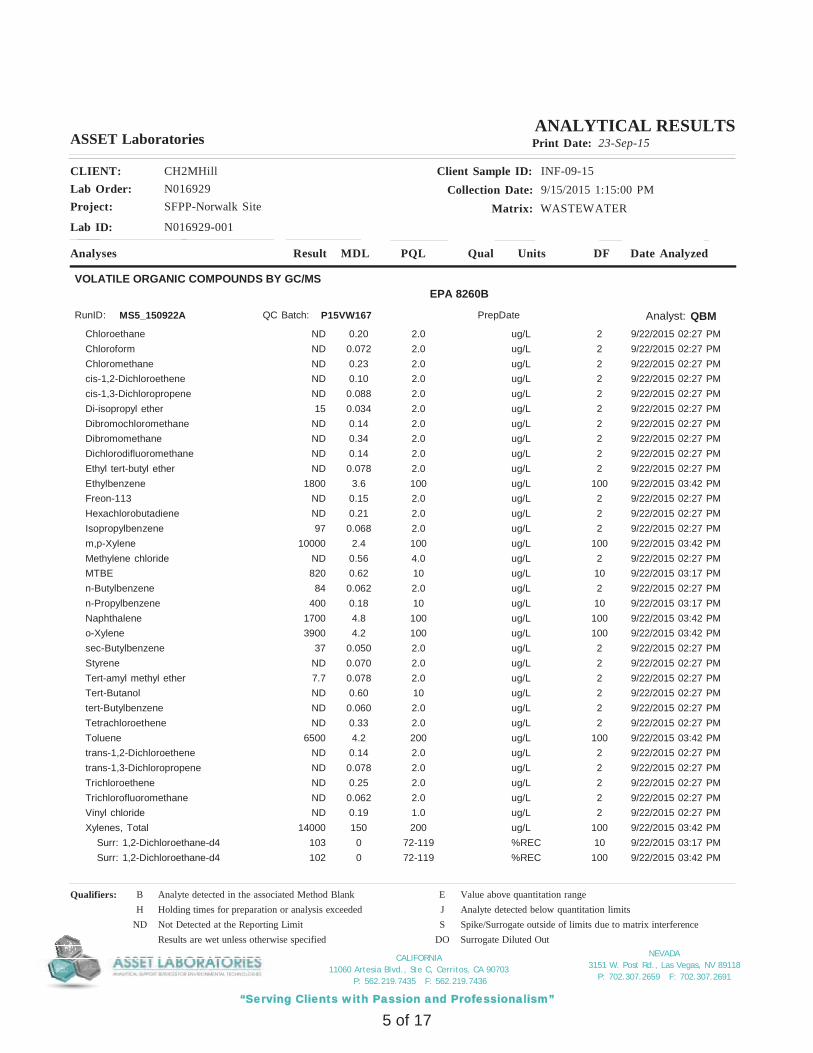
NEVADA3151 W. Post Rd., Las Vegas, NV 89118
P: 702.307.2659 F: 702.307.2691
“Serving Clients with Passion and Professionalism”
CALIFORNIA11060 Artesia Blvd., Ste C, Cerritos, CA 90703
P: 562.219.7435 F: 562.219.7436
Project: SFPP-Norwalk Site
Client Sample ID: INF-09-15Collection Date: 9/15/2015 1:15:00 PM
Matrix: WASTEWATER
CLIENT: CH2MHillLab Order: N016929
Lab ID: N016929-001
ASSET Laboratories Print Date: 23-Sep-15
Analyses Result Qual Units Date AnalyzedDFPQLMDL
ANALYTICAL RESULTS
VOLATILE ORGANIC COMPOUNDS BY GC/MSEPA 8260B
Analyst: QBMRunID: MS5_150922A P15VW167QC Batch: PrepDate
Chloroethane 2.0 ug/L 2ND 0.20 9/22/2015 02:27 PMChloroform 2.0 ug/L 2ND 0.072 9/22/2015 02:27 PMChloromethane 2.0 ug/L 2ND 0.23 9/22/2015 02:27 PMcis-1,2-Dichloroethene 2.0 ug/L 2ND 0.10 9/22/2015 02:27 PMcis-1,3-Dichloropropene 2.0 ug/L 2ND 0.088 9/22/2015 02:27 PMDi-isopropyl ether 2.0 ug/L 215 0.034 9/22/2015 02:27 PMDibromochloromethane 2.0 ug/L 2ND 0.14 9/22/2015 02:27 PMDibromomethane 2.0 ug/L 2ND 0.34 9/22/2015 02:27 PMDichlorodifluoromethane 2.0 ug/L 2ND 0.14 9/22/2015 02:27 PMEthyl tert-butyl ether 2.0 ug/L 2ND 0.078 9/22/2015 02:27 PMEthylbenzene 100 ug/L 1001800 3.6 9/22/2015 03:42 PMFreon-113 2.0 ug/L 2ND 0.15 9/22/2015 02:27 PMHexachlorobutadiene 2.0 ug/L 2ND 0.21 9/22/2015 02:27 PMIsopropylbenzene 2.0 ug/L 297 0.068 9/22/2015 02:27 PMm,p-Xylene 100 ug/L 10010000 2.4 9/22/2015 03:42 PMMethylene chloride 4.0 ug/L 2ND 0.56 9/22/2015 02:27 PMMTBE 10 ug/L 10820 0.62 9/22/2015 03:17 PMn-Butylbenzene 2.0 ug/L 284 0.062 9/22/2015 02:27 PMn-Propylbenzene 10 ug/L 10400 0.18 9/22/2015 03:17 PMNaphthalene 100 ug/L 1001700 4.8 9/22/2015 03:42 PMo-Xylene 100 ug/L 1003900 4.2 9/22/2015 03:42 PMsec-Butylbenzene 2.0 ug/L 237 0.050 9/22/2015 02:27 PMStyrene 2.0 ug/L 2ND 0.070 9/22/2015 02:27 PMTert-amyl methyl ether 2.0 ug/L 27.7 0.078 9/22/2015 02:27 PMTert-Butanol 10 ug/L 2ND 0.60 9/22/2015 02:27 PMtert-Butylbenzene 2.0 ug/L 2ND 0.060 9/22/2015 02:27 PMTetrachloroethene 2.0 ug/L 2ND 0.33 9/22/2015 02:27 PMToluene 200 ug/L 1006500 4.2 9/22/2015 03:42 PMtrans-1,2-Dichloroethene 2.0 ug/L 2ND 0.14 9/22/2015 02:27 PMtrans-1,3-Dichloropropene 2.0 ug/L 2ND 0.078 9/22/2015 02:27 PMTrichloroethene 2.0 ug/L 2ND 0.25 9/22/2015 02:27 PMTrichlorofluoromethane 2.0 ug/L 2ND 0.062 9/22/2015 02:27 PMVinyl chloride 1.0 ug/L 2ND 0.19 9/22/2015 02:27 PMXylenes, Total 200 ug/L 10014000 150 9/22/2015 03:42 PM
Surr: 1,2-Dichloroethane-d4 72-119 %REC 10103 0 9/22/2015 03:17 PMSurr: 1,2-Dichloroethane-d4 72-119 %REC 100102 0 9/22/2015 03:42 PM
Qualifiers: B Analyte detected in the associated Method Blank E Value above quantitation rangeH Holding times for preparation or analysis exceeded J Analyte detected below quantitation limits
ND Not Detected at the Reporting Limit S Spike/Surrogate outside of limits due to matrix interferenceResults are wet unless otherwise specified DO Surrogate Diluted Out
5 of 17

NEVADA3151 W. Post Rd., Las Vegas, NV 89118
P: 702.307.2659 F: 702.307.2691
“Serving Clients with Passion and Professionalism”
CALIFORNIA11060 Artesia Blvd., Ste C, Cerritos, CA 90703
P: 562.219.7435 F: 562.219.7436
Project: SFPP-Norwalk Site
Client Sample ID: INF-09-15Collection Date: 9/15/2015 1:15:00 PM
Matrix: WASTEWATER
CLIENT: CH2MHillLab Order: N016929
Lab ID: N016929-001
ASSET Laboratories Print Date: 23-Sep-15
Analyses Result Qual Units Date AnalyzedDFPQLMDL
ANALYTICAL RESULTS
VOLATILE ORGANIC COMPOUNDS BY GC/MSEPA 8260B
Analyst: QBMRunID: MS5_150922A P15VW167QC Batch: PrepDate
Surr: 1,2-Dichloroethane-d4 72-119 %REC 2107 0 9/22/2015 02:27 PMSurr: 4-Bromofluorobenzene 76-119 %REC 2110 0 9/22/2015 02:27 PMSurr: 4-Bromofluorobenzene 76-119 %REC 1099.2 0 9/22/2015 03:17 PMSurr: 4-Bromofluorobenzene 76-119 %REC 100102 0 9/22/2015 03:42 PMSurr: Dibromofluoromethane 85-115 %REC 10103 0 9/22/2015 03:17 PMSurr: Dibromofluoromethane 85-115 %REC 100104 0 9/22/2015 03:42 PMSurr: Dibromofluoromethane 85-115 %REC 2105 0 9/22/2015 02:27 PMSurr: Toluene-d8 81-120 %REC 100101 0 9/22/2015 03:42 PMSurr: Toluene-d8 81-120 %REC 299.1 0 9/22/2015 02:27 PMSurr: Toluene-d8 81-120 %REC 10102 0 9/22/2015 03:17 PM
TPH EXTRACTABLE BY GC/FIDEPA 8015B
Analyst: MDM
EPA 3510C
RunID: GC3_150918A 51449QC Batch: PrepDate 9/17/2015
TPH-Diesel (C13-C22) 2500 ug/L 10079000 1500 9/18/2015 11:01 AMTPH-Oil (C23-C36) 25 ug/L 12700 14 9/18/2015 12:38 AM
Surr: Octacosane 26-152 %REC 1100 0 9/18/2015 12:38 AMSurr: p-Terphenyl S57-132 %REC 1150 0 9/18/2015 12:38 AM
GASOLINE RANGE ORGANICS BY GC/FIDEPA 8015B
Analyst: QBMRunID: GC4_150916A E15VW056QC Batch: PrepDate
TPH-Gasoline (C4-C12) 500 ug/L 1050000 160 9/16/2015 06:29 PMSurr: Chlorobenzene - d5 74-138 %REC 1079.5 0 9/16/2015 06:29 PM
TOTAL TPHEPA 8015B
Analyst: MDMRunID: GC3_150918A R102181QC Batch: PrepDate
Total TPH 50 ug/L 1129000 16 9/18/2015
Qualifiers: B Analyte detected in the associated Method Blank E Value above quantitation rangeH Holding times for preparation or analysis exceeded J Analyte detected below quantitation limits
ND Not Detected at the Reporting Limit S Spike/Surrogate outside of limits due to matrix interferenceResults are wet unless otherwise specified DO Surrogate Diluted Out
6 of 17
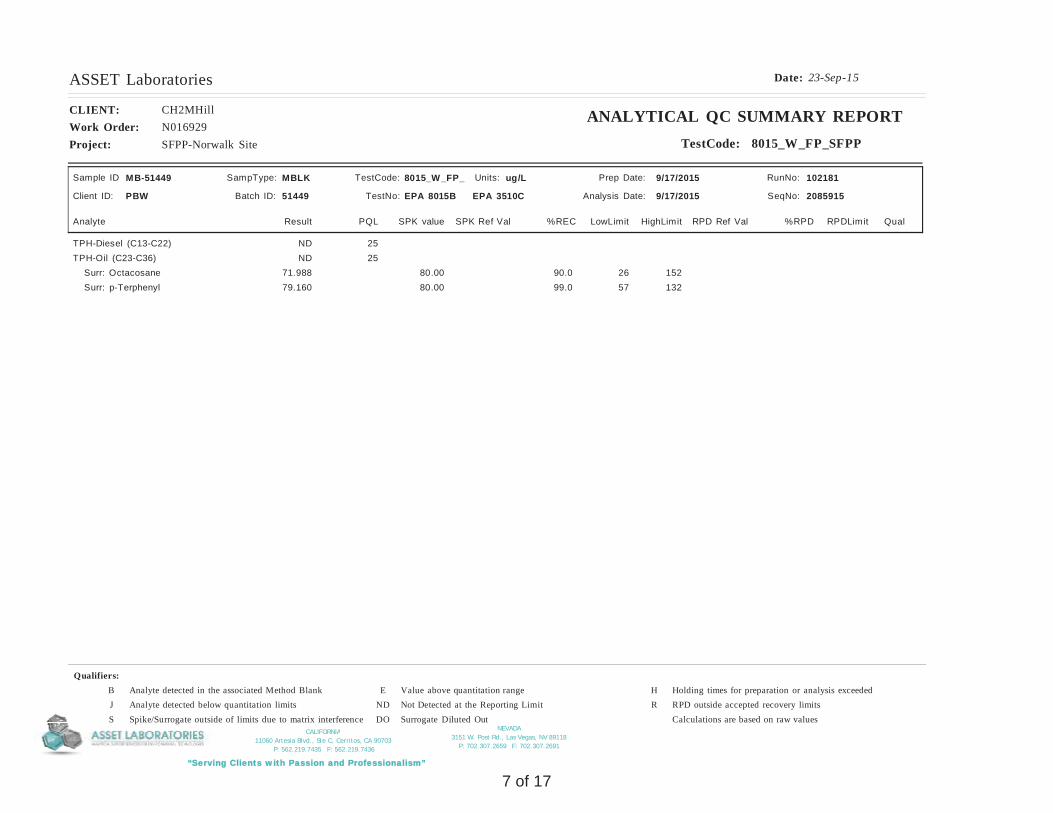
NEVADA3151 W. Post Rd., Las Vegas, NV 89118
P: 702.307.2659 F: 702.307.2691
“Serving Clients with Passion and Professionalism”
CALIFORNIA11060 Artesia Blvd., Ste C, Cerritos, CA 90703
P: 562.219.7435 F: 562.219.7436
23-Sep-15Date:ASSET Laboratories
Project: SFPP-Norwalk Site
CLIENT: CH2MHillWork Order: N016929
ANALYTICAL QC SUMMARY REPORTTestCode: 8015_W_FP_SFPP
Sample ID MB-51449
Batch ID: 51449 TestNo: EPA 8015B Analysis Date: 9/17/2015
Prep Date: 9/17/2015
Analyte Result SPK value SPK Ref Val %REC RPD Ref Val %RPDLowLimit HighLimit RPDLimit Qual
Units: ug/L
PQL
Client ID: PBW
RunNo: 102181
SeqNo: 2085915
MBLKSampType: TestCode: 8015_W_FP_
EPA 3510C
TPH-Diesel (C13-C22) 25NDTPH-Oil (C23-C36) 25ND
Surr: Octacosane 80.00 90.0 26 15271.988Surr: p-Terphenyl 80.00 99.0 57 13279.160
Qualifiers:B Analyte detected in the associated Method Blank E Value above quantitation range H Holding times for preparation or analysis exceededJ Analyte detected below quantitation limits ND Not Detected at the Reporting Limit R RPD outside accepted recovery limitsS Spike/Surrogate outside of limits due to matrix interference DO Surrogate Diluted Out Calculations are based on raw values
7 of 17
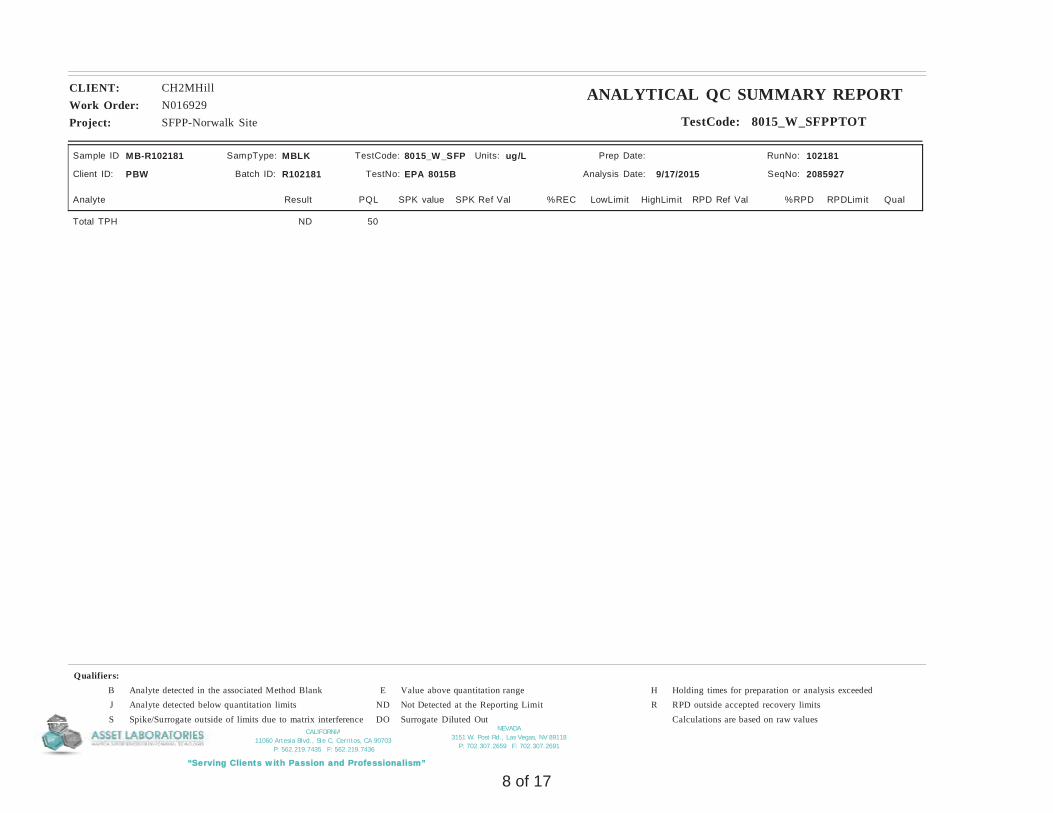
NEVADA3151 W. Post Rd., Las Vegas, NV 89118
P: 702.307.2659 F: 702.307.2691
“Serving Clients with Passion and Professionalism”
CALIFORNIA11060 Artesia Blvd., Ste C, Cerritos, CA 90703
P: 562.219.7435 F: 562.219.7436
Project: SFPP-Norwalk Site
CLIENT: CH2MHillWork Order: N016929
ANALYTICAL QC SUMMARY REPORTTestCode: 8015_W_SFPPTOT
Sample ID MB-R102181
Batch ID: R102181 TestNo: EPA 8015B Analysis Date: 9/17/2015
Prep Date:
Analyte Result SPK value SPK Ref Val %REC RPD Ref Val %RPDLowLimit HighLimit RPDLimit Qual
Units: ug/L
PQL
Client ID: PBW
RunNo: 102181
SeqNo: 2085927
MBLKSampType: TestCode: 8015_W_SFP
Total TPH 50ND
Qualifiers:B Analyte detected in the associated Method Blank E Value above quantitation range H Holding times for preparation or analysis exceededJ Analyte detected below quantitation limits ND Not Detected at the Reporting Limit R RPD outside accepted recovery limitsS Spike/Surrogate outside of limits due to matrix interference DO Surrogate Diluted Out Calculations are based on raw values
8 of 17
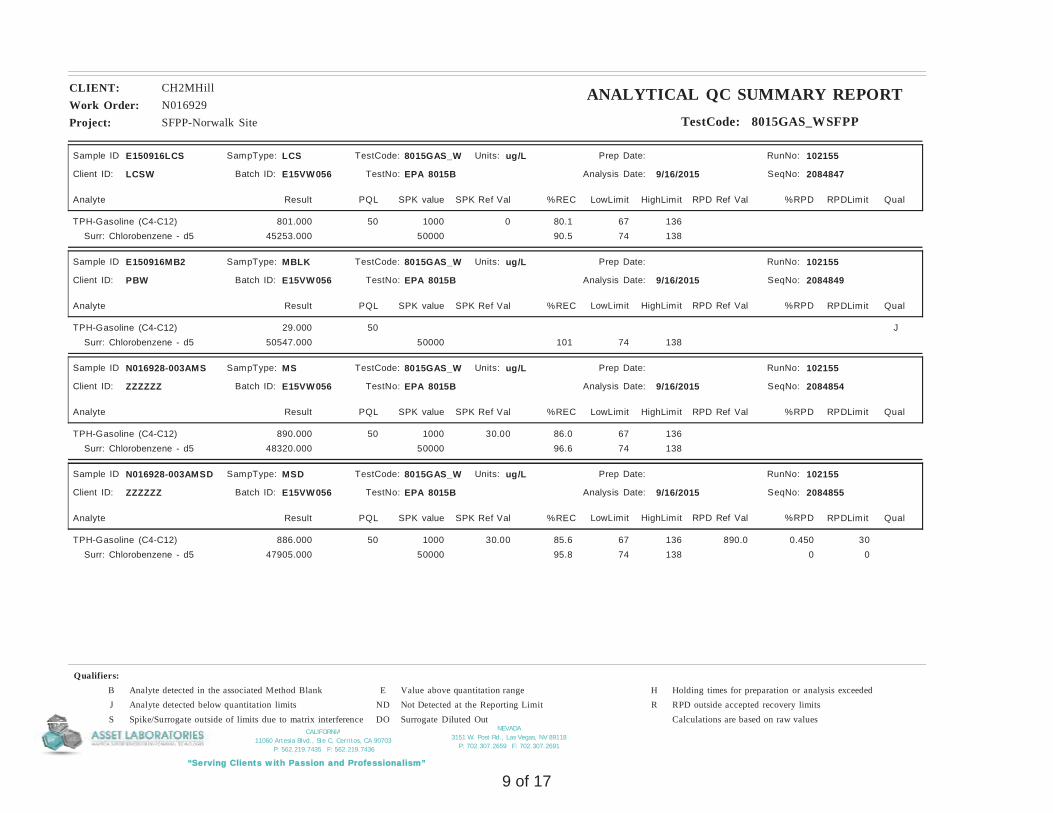
NEVADA3151 W. Post Rd., Las Vegas, NV 89118
P: 702.307.2659 F: 702.307.2691
“Serving Clients with Passion and Professionalism”
CALIFORNIA11060 Artesia Blvd., Ste C, Cerritos, CA 90703
P: 562.219.7435 F: 562.219.7436
Project: SFPP-Norwalk Site
CLIENT: CH2MHillWork Order: N016929
ANALYTICAL QC SUMMARY REPORTTestCode: 8015GAS_WSFPP
Sample ID E150916LCS
Batch ID: E15VW056 TestNo: EPA 8015B Analysis Date: 9/16/2015
Prep Date:
Analyte Result SPK value SPK Ref Val %REC RPD Ref Val %RPDLowLimit HighLimit RPDLimit Qual
Units: ug/L
PQL
Client ID: LCSW
RunNo: 102155
SeqNo: 2084847
LCSSampType: TestCode: 8015GAS_W
TPH-Gasoline (C4-C12) 1000 80.1 67 13650 0801.000Surr: Chlorobenzene - d5 50000 90.5 74 13845253.000
Sample ID E150916MB2
Batch ID: E15VW056 TestNo: EPA 8015B Analysis Date: 9/16/2015
Prep Date:
Analyte Result SPK value SPK Ref Val %REC RPD Ref Val %RPDLowLimit HighLimit RPDLimit Qual
Units: ug/L
PQL
Client ID: PBW
RunNo: 102155
SeqNo: 2084849
MBLKSampType: TestCode: 8015GAS_W
TPH-Gasoline (C4-C12) J5029.000Surr: Chlorobenzene - d5 50000 101 74 13850547.000
Sample ID N016928-003AMS
Batch ID: E15VW056 TestNo: EPA 8015B Analysis Date: 9/16/2015
Prep Date:
Analyte Result SPK value SPK Ref Val %REC RPD Ref Val %RPDLowLimit HighLimit RPDLimit Qual
Units: ug/L
PQL
Client ID: ZZZZZZ
RunNo: 102155
SeqNo: 2084854
MSSampType: TestCode: 8015GAS_W
TPH-Gasoline (C4-C12) 1000 86.0 67 13650 30.00890.000Surr: Chlorobenzene - d5 50000 96.6 74 13848320.000
Sample ID N016928-003AMSD
Batch ID: E15VW056 TestNo: EPA 8015B Analysis Date: 9/16/2015
Prep Date:
Analyte Result SPK value SPK Ref Val %REC RPD Ref Val %RPDLowLimit HighLimit RPDLimit Qual
Units: ug/L
PQL
Client ID: ZZZZZZ
RunNo: 102155
SeqNo: 2084855
MSDSampType: TestCode: 8015GAS_W
TPH-Gasoline (C4-C12) 1000 85.6 67 136 3050 30.00 890.0 0.450886.000Surr: Chlorobenzene - d5 50000 95.8 74 138 0047905.000
Qualifiers:B Analyte detected in the associated Method Blank E Value above quantitation range H Holding times for preparation or analysis exceededJ Analyte detected below quantitation limits ND Not Detected at the Reporting Limit R RPD outside accepted recovery limitsS Spike/Surrogate outside of limits due to matrix interference DO Surrogate Diluted Out Calculations are based on raw values
9 of 17
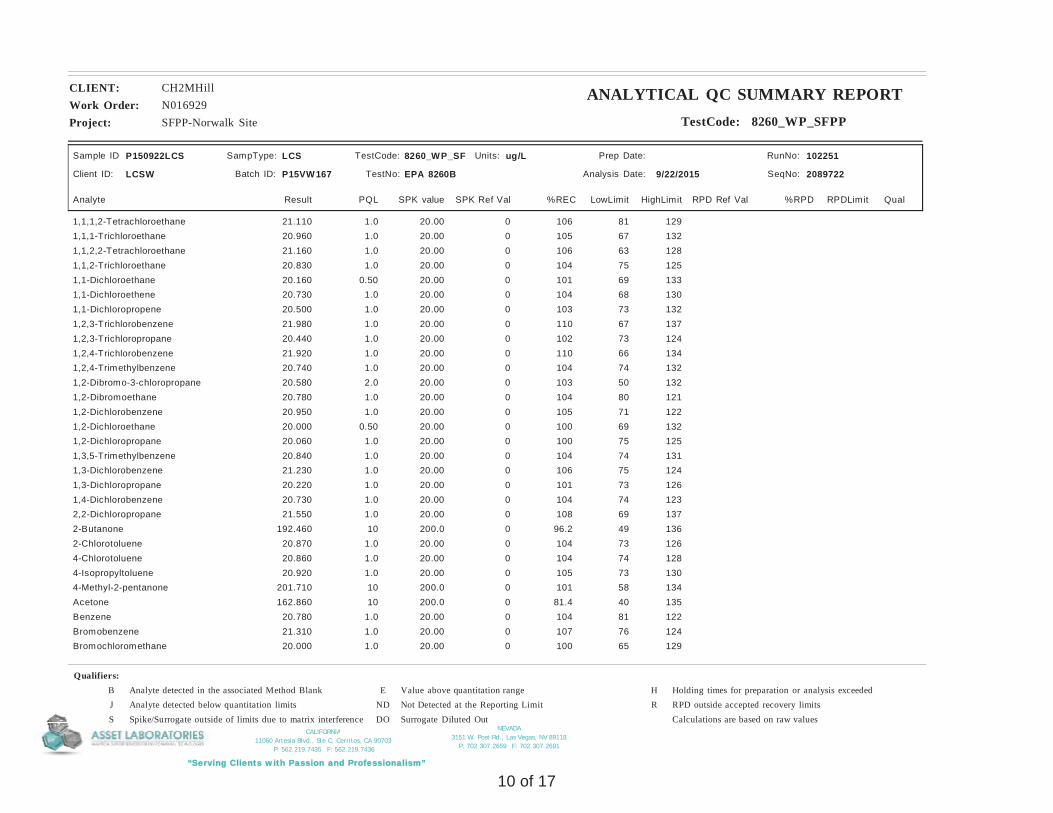
NEVADA3151 W. Post Rd., Las Vegas, NV 89118
P: 702.307.2659 F: 702.307.2691
“Serving Clients with Passion and Professionalism”
CALIFORNIA11060 Artesia Blvd., Ste C, Cerritos, CA 90703
P: 562.219.7435 F: 562.219.7436
Project: SFPP-Norwalk Site
CLIENT: CH2MHillWork Order: N016929
ANALYTICAL QC SUMMARY REPORTTestCode: 8260_WP_SFPP
Sample ID P150922LCS
Batch ID: P15VW167 TestNo: EPA 8260B Analysis Date: 9/22/2015
Prep Date:
Analyte Result SPK value SPK Ref Val %REC RPD Ref Val %RPDLowLimit HighLimit RPDLimit Qual
Units: ug/L
PQL
Client ID: LCSW
RunNo: 102251
SeqNo: 2089722
LCSSampType: TestCode: 8260_WP_SF
1,1,1,2-Tetrachloroethane 20.00 106 81 1291.0 021.1101,1,1-Trichloroethane 20.00 105 67 1321.0 020.9601,1,2,2-Tetrachloroethane 20.00 106 63 1281.0 021.1601,1,2-Trichloroethane 20.00 104 75 1251.0 020.8301,1-Dichloroethane 20.00 101 69 1330.50 020.1601,1-Dichloroethene 20.00 104 68 1301.0 020.7301,1-Dichloropropene 20.00 103 73 1321.0 020.5001,2,3-Trichlorobenzene 20.00 110 67 1371.0 021.9801,2,3-Trichloropropane 20.00 102 73 1241.0 020.4401,2,4-Trichlorobenzene 20.00 110 66 1341.0 021.9201,2,4-Trimethylbenzene 20.00 104 74 1321.0 020.7401,2-Dibromo-3-chloropropane 20.00 103 50 1322.0 020.5801,2-Dibromoethane 20.00 104 80 1211.0 020.7801,2-Dichlorobenzene 20.00 105 71 1221.0 020.9501,2-Dichloroethane 20.00 100 69 1320.50 020.0001,2-Dichloropropane 20.00 100 75 1251.0 020.0601,3,5-Trimethylbenzene 20.00 104 74 1311.0 020.8401,3-Dichlorobenzene 20.00 106 75 1241.0 021.2301,3-Dichloropropane 20.00 101 73 1261.0 020.2201,4-Dichlorobenzene 20.00 104 74 1231.0 020.7302,2-Dichloropropane 20.00 108 69 1371.0 021.5502-Butanone 200.0 96.2 49 13610 0192.4602-Chlorotoluene 20.00 104 73 1261.0 020.8704-Chlorotoluene 20.00 104 74 1281.0 020.8604-Isopropyltoluene 20.00 105 73 1301.0 020.9204-Methyl-2-pentanone 200.0 101 58 13410 0201.710Acetone 200.0 81.4 40 13510 0162.860Benzene 20.00 104 81 1221.0 020.780Bromobenzene 20.00 107 76 1241.0 021.310Bromochloromethane 20.00 100 65 1291.0 020.000
Qualifiers:B Analyte detected in the associated Method Blank E Value above quantitation range H Holding times for preparation or analysis exceededJ Analyte detected below quantitation limits ND Not Detected at the Reporting Limit R RPD outside accepted recovery limitsS Spike/Surrogate outside of limits due to matrix interference DO Surrogate Diluted Out Calculations are based on raw values
10 of 17
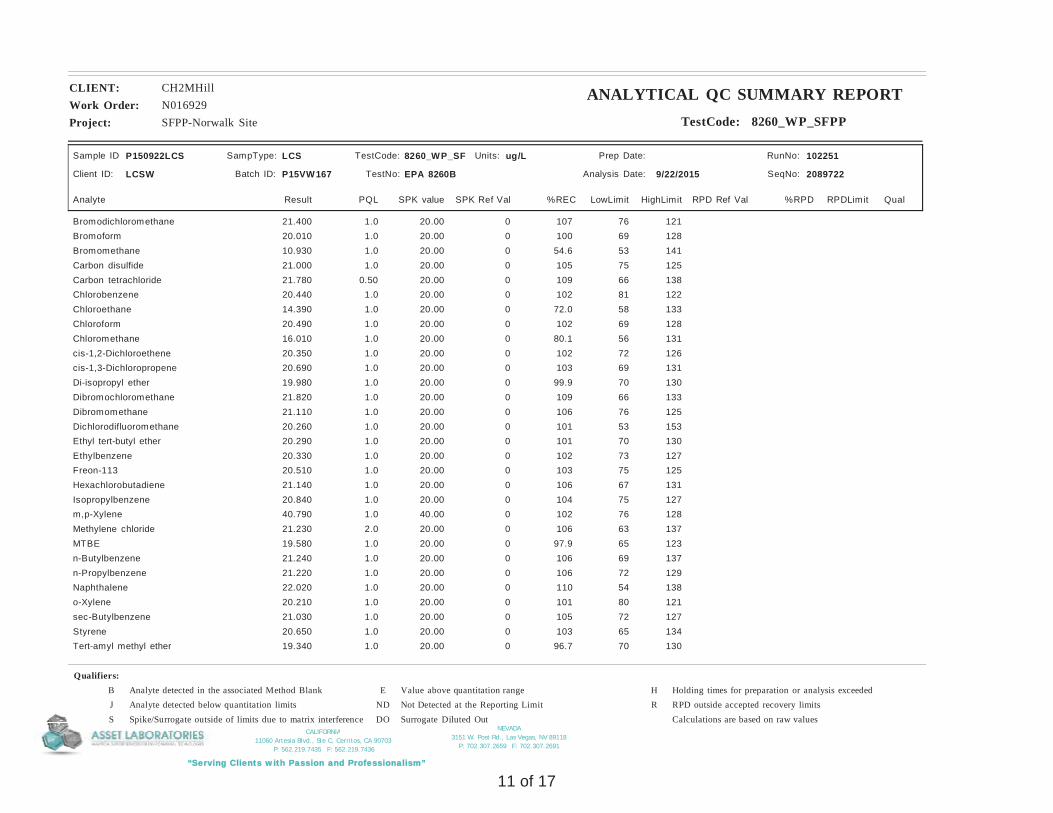
NEVADA3151 W. Post Rd., Las Vegas, NV 89118
P: 702.307.2659 F: 702.307.2691
“Serving Clients with Passion and Professionalism”
CALIFORNIA11060 Artesia Blvd., Ste C, Cerritos, CA 90703
P: 562.219.7435 F: 562.219.7436
Project: SFPP-Norwalk Site
CLIENT: CH2MHillWork Order: N016929
ANALYTICAL QC SUMMARY REPORTTestCode: 8260_WP_SFPP
Sample ID P150922LCS
Batch ID: P15VW167 TestNo: EPA 8260B Analysis Date: 9/22/2015
Prep Date:
Analyte Result SPK value SPK Ref Val %REC RPD Ref Val %RPDLowLimit HighLimit RPDLimit Qual
Units: ug/L
PQL
Client ID: LCSW
RunNo: 102251
SeqNo: 2089722
LCSSampType: TestCode: 8260_WP_SF
Bromodichloromethane 20.00 107 76 1211.0 021.400Bromoform 20.00 100 69 1281.0 020.010Bromomethane 20.00 54.6 53 1411.0 010.930Carbon disulfide 20.00 105 75 1251.0 021.000Carbon tetrachloride 20.00 109 66 1380.50 021.780Chlorobenzene 20.00 102 81 1221.0 020.440Chloroethane 20.00 72.0 58 1331.0 014.390Chloroform 20.00 102 69 1281.0 020.490Chloromethane 20.00 80.1 56 1311.0 016.010cis-1,2-Dichloroethene 20.00 102 72 1261.0 020.350cis-1,3-Dichloropropene 20.00 103 69 1311.0 020.690Di-isopropyl ether 20.00 99.9 70 1301.0 019.980Dibromochloromethane 20.00 109 66 1331.0 021.820Dibromomethane 20.00 106 76 1251.0 021.110Dichlorodifluoromethane 20.00 101 53 1531.0 020.260Ethyl tert-butyl ether 20.00 101 70 1301.0 020.290Ethylbenzene 20.00 102 73 1271.0 020.330Freon-113 20.00 103 75 1251.0 020.510Hexachlorobutadiene 20.00 106 67 1311.0 021.140Isopropylbenzene 20.00 104 75 1271.0 020.840m,p-Xylene 40.00 102 76 1281.0 040.790Methylene chloride 20.00 106 63 1372.0 021.230MTBE 20.00 97.9 65 1231.0 019.580n-Butylbenzene 20.00 106 69 1371.0 021.240n-Propylbenzene 20.00 106 72 1291.0 021.220Naphthalene 20.00 110 54 1381.0 022.020o-Xylene 20.00 101 80 1211.0 020.210sec-Butylbenzene 20.00 105 72 1271.0 021.030Styrene 20.00 103 65 1341.0 020.650Tert-amyl methyl ether 20.00 96.7 70 1301.0 019.340
Qualifiers:B Analyte detected in the associated Method Blank E Value above quantitation range H Holding times for preparation or analysis exceededJ Analyte detected below quantitation limits ND Not Detected at the Reporting Limit R RPD outside accepted recovery limitsS Spike/Surrogate outside of limits due to matrix interference DO Surrogate Diluted Out Calculations are based on raw values
11 of 17
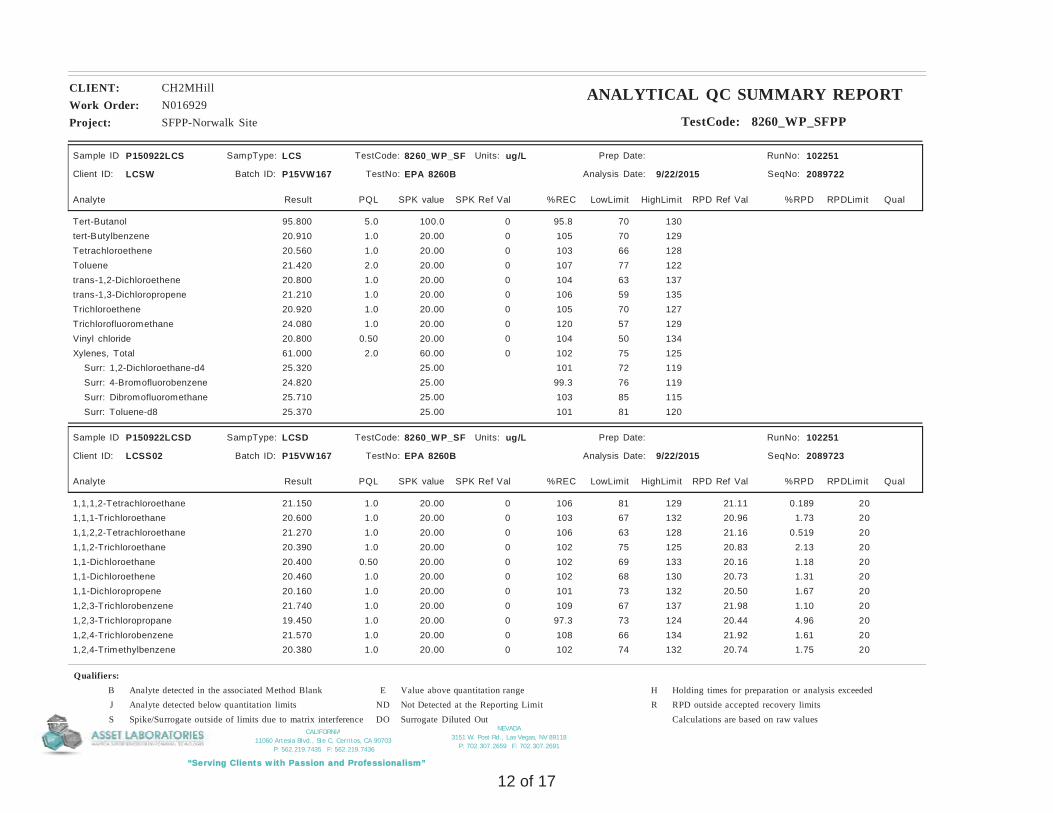
NEVADA3151 W. Post Rd., Las Vegas, NV 89118
P: 702.307.2659 F: 702.307.2691
“Serving Clients with Passion and Professionalism”
CALIFORNIA11060 Artesia Blvd., Ste C, Cerritos, CA 90703
P: 562.219.7435 F: 562.219.7436
Project: SFPP-Norwalk Site
CLIENT: CH2MHillWork Order: N016929
ANALYTICAL QC SUMMARY REPORTTestCode: 8260_WP_SFPP
Sample ID P150922LCS
Batch ID: P15VW167 TestNo: EPA 8260B Analysis Date: 9/22/2015
Prep Date:
Analyte Result SPK value SPK Ref Val %REC RPD Ref Val %RPDLowLimit HighLimit RPDLimit Qual
Units: ug/L
PQL
Client ID: LCSW
RunNo: 102251
SeqNo: 2089722
LCSSampType: TestCode: 8260_WP_SF
Tert-Butanol 100.0 95.8 70 1305.0 095.800tert-Butylbenzene 20.00 105 70 1291.0 020.910Tetrachloroethene 20.00 103 66 1281.0 020.560Toluene 20.00 107 77 1222.0 021.420trans-1,2-Dichloroethene 20.00 104 63 1371.0 020.800trans-1,3-Dichloropropene 20.00 106 59 1351.0 021.210Trichloroethene 20.00 105 70 1271.0 020.920Trichlorofluoromethane 20.00 120 57 1291.0 024.080Vinyl chloride 20.00 104 50 1340.50 020.800Xylenes, Total 60.00 102 75 1252.0 061.000
Surr: 1,2-Dichloroethane-d4 25.00 101 72 11925.320Surr: 4-Bromofluorobenzene 25.00 99.3 76 11924.820Surr: Dibromofluoromethane 25.00 103 85 11525.710Surr: Toluene-d8 25.00 101 81 12025.370
Sample ID P150922LCSD
Batch ID: P15VW167 TestNo: EPA 8260B Analysis Date: 9/22/2015
Prep Date:
Analyte Result SPK value SPK Ref Val %REC RPD Ref Val %RPDLowLimit HighLimit RPDLimit Qual
Units: ug/L
PQL
Client ID: LCSS02
RunNo: 102251
SeqNo: 2089723
LCSDSampType: TestCode: 8260_WP_SF
1,1,1,2-Tetrachloroethane 20.00 106 81 129 201.0 0 21.11 0.18921.1501,1,1-Trichloroethane 20.00 103 67 132 201.0 0 20.96 1.7320.6001,1,2,2-Tetrachloroethane 20.00 106 63 128 201.0 0 21.16 0.51921.2701,1,2-Trichloroethane 20.00 102 75 125 201.0 0 20.83 2.1320.3901,1-Dichloroethane 20.00 102 69 133 200.50 0 20.16 1.1820.4001,1-Dichloroethene 20.00 102 68 130 201.0 0 20.73 1.3120.4601,1-Dichloropropene 20.00 101 73 132 201.0 0 20.50 1.6720.1601,2,3-Trichlorobenzene 20.00 109 67 137 201.0 0 21.98 1.1021.7401,2,3-Trichloropropane 20.00 97.3 73 124 201.0 0 20.44 4.9619.4501,2,4-Trichlorobenzene 20.00 108 66 134 201.0 0 21.92 1.6121.5701,2,4-Trimethylbenzene 20.00 102 74 132 201.0 0 20.74 1.7520.380
Qualifiers:B Analyte detected in the associated Method Blank E Value above quantitation range H Holding times for preparation or analysis exceededJ Analyte detected below quantitation limits ND Not Detected at the Reporting Limit R RPD outside accepted recovery limitsS Spike/Surrogate outside of limits due to matrix interference DO Surrogate Diluted Out Calculations are based on raw values
12 of 17
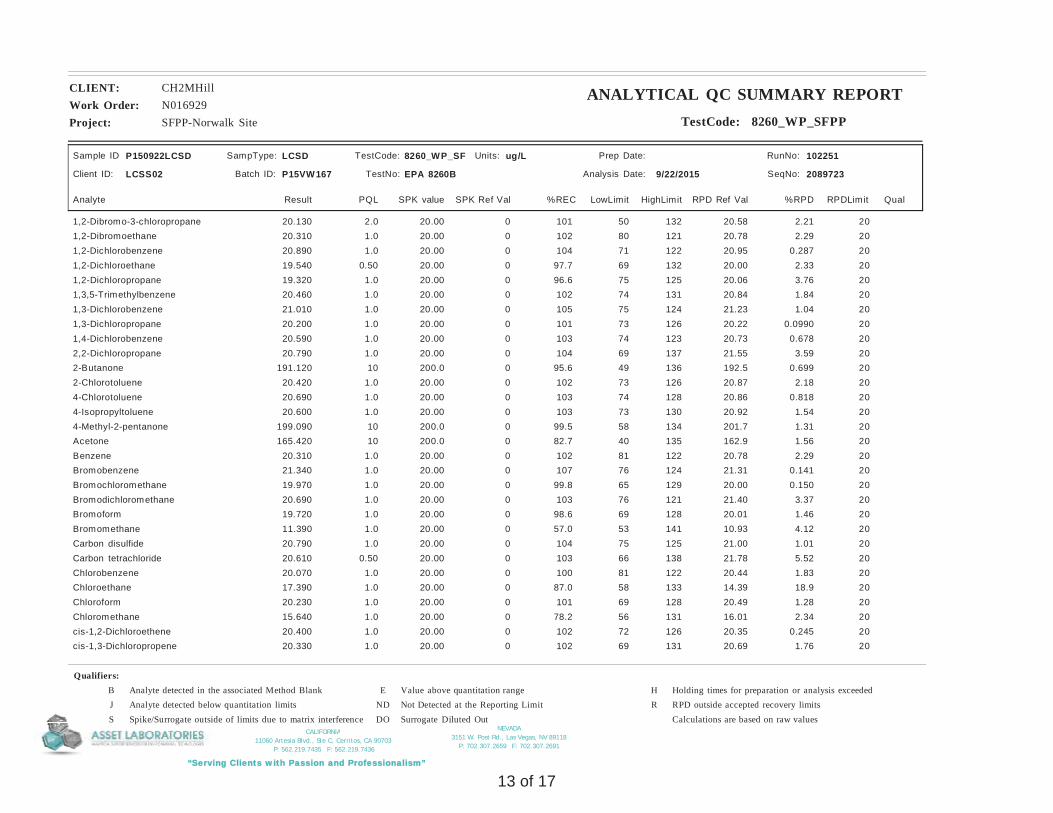
NEVADA3151 W. Post Rd., Las Vegas, NV 89118
P: 702.307.2659 F: 702.307.2691
“Serving Clients with Passion and Professionalism”
CALIFORNIA11060 Artesia Blvd., Ste C, Cerritos, CA 90703
P: 562.219.7435 F: 562.219.7436
Project: SFPP-Norwalk Site
CLIENT: CH2MHillWork Order: N016929
ANALYTICAL QC SUMMARY REPORTTestCode: 8260_WP_SFPP
Sample ID P150922LCSD
Batch ID: P15VW167 TestNo: EPA 8260B Analysis Date: 9/22/2015
Prep Date:
Analyte Result SPK value SPK Ref Val %REC RPD Ref Val %RPDLowLimit HighLimit RPDLimit Qual
Units: ug/L
PQL
Client ID: LCSS02
RunNo: 102251
SeqNo: 2089723
LCSDSampType: TestCode: 8260_WP_SF
1,2-Dibromo-3-chloropropane 20.00 101 50 132 202.0 0 20.58 2.2120.1301,2-Dibromoethane 20.00 102 80 121 201.0 0 20.78 2.2920.3101,2-Dichlorobenzene 20.00 104 71 122 201.0 0 20.95 0.28720.8901,2-Dichloroethane 20.00 97.7 69 132 200.50 0 20.00 2.3319.5401,2-Dichloropropane 20.00 96.6 75 125 201.0 0 20.06 3.7619.3201,3,5-Trimethylbenzene 20.00 102 74 131 201.0 0 20.84 1.8420.4601,3-Dichlorobenzene 20.00 105 75 124 201.0 0 21.23 1.0421.0101,3-Dichloropropane 20.00 101 73 126 201.0 0 20.22 0.099020.2001,4-Dichlorobenzene 20.00 103 74 123 201.0 0 20.73 0.67820.5902,2-Dichloropropane 20.00 104 69 137 201.0 0 21.55 3.5920.7902-Butanone 200.0 95.6 49 136 2010 0 192.5 0.699191.1202-Chlorotoluene 20.00 102 73 126 201.0 0 20.87 2.1820.4204-Chlorotoluene 20.00 103 74 128 201.0 0 20.86 0.81820.6904-Isopropyltoluene 20.00 103 73 130 201.0 0 20.92 1.5420.6004-Methyl-2-pentanone 200.0 99.5 58 134 2010 0 201.7 1.31199.090Acetone 200.0 82.7 40 135 2010 0 162.9 1.56165.420Benzene 20.00 102 81 122 201.0 0 20.78 2.2920.310Bromobenzene 20.00 107 76 124 201.0 0 21.31 0.14121.340Bromochloromethane 20.00 99.8 65 129 201.0 0 20.00 0.15019.970Bromodichloromethane 20.00 103 76 121 201.0 0 21.40 3.3720.690Bromoform 20.00 98.6 69 128 201.0 0 20.01 1.4619.720Bromomethane 20.00 57.0 53 141 201.0 0 10.93 4.1211.390Carbon disulfide 20.00 104 75 125 201.0 0 21.00 1.0120.790Carbon tetrachloride 20.00 103 66 138 200.50 0 21.78 5.5220.610Chlorobenzene 20.00 100 81 122 201.0 0 20.44 1.8320.070Chloroethane 20.00 87.0 58 133 201.0 0 14.39 18.917.390Chloroform 20.00 101 69 128 201.0 0 20.49 1.2820.230Chloromethane 20.00 78.2 56 131 201.0 0 16.01 2.3415.640cis-1,2-Dichloroethene 20.00 102 72 126 201.0 0 20.35 0.24520.400cis-1,3-Dichloropropene 20.00 102 69 131 201.0 0 20.69 1.7620.330
Qualifiers:B Analyte detected in the associated Method Blank E Value above quantitation range H Holding times for preparation or analysis exceededJ Analyte detected below quantitation limits ND Not Detected at the Reporting Limit R RPD outside accepted recovery limitsS Spike/Surrogate outside of limits due to matrix interference DO Surrogate Diluted Out Calculations are based on raw values
13 of 17
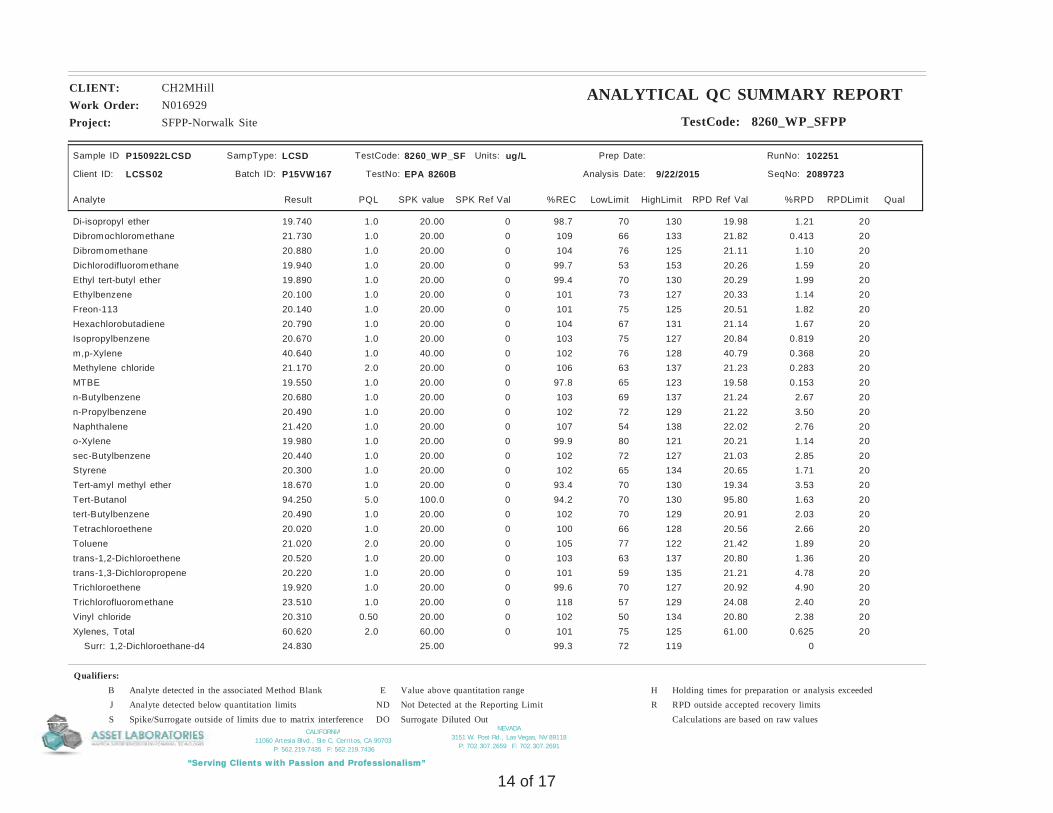
NEVADA3151 W. Post Rd., Las Vegas, NV 89118
P: 702.307.2659 F: 702.307.2691
“Serving Clients with Passion and Professionalism”
CALIFORNIA11060 Artesia Blvd., Ste C, Cerritos, CA 90703
P: 562.219.7435 F: 562.219.7436
Project: SFPP-Norwalk Site
CLIENT: CH2MHillWork Order: N016929
ANALYTICAL QC SUMMARY REPORTTestCode: 8260_WP_SFPP
Sample ID P150922LCSD
Batch ID: P15VW167 TestNo: EPA 8260B Analysis Date: 9/22/2015
Prep Date:
Analyte Result SPK value SPK Ref Val %REC RPD Ref Val %RPDLowLimit HighLimit RPDLimit Qual
Units: ug/L
PQL
Client ID: LCSS02
RunNo: 102251
SeqNo: 2089723
LCSDSampType: TestCode: 8260_WP_SF
Di-isopropyl ether 20.00 98.7 70 130 201.0 0 19.98 1.2119.740Dibromochloromethane 20.00 109 66 133 201.0 0 21.82 0.41321.730Dibromomethane 20.00 104 76 125 201.0 0 21.11 1.1020.880Dichlorodifluoromethane 20.00 99.7 53 153 201.0 0 20.26 1.5919.940Ethyl tert-butyl ether 20.00 99.4 70 130 201.0 0 20.29 1.9919.890Ethylbenzene 20.00 101 73 127 201.0 0 20.33 1.1420.100Freon-113 20.00 101 75 125 201.0 0 20.51 1.8220.140Hexachlorobutadiene 20.00 104 67 131 201.0 0 21.14 1.6720.790Isopropylbenzene 20.00 103 75 127 201.0 0 20.84 0.81920.670m,p-Xylene 40.00 102 76 128 201.0 0 40.79 0.36840.640Methylene chloride 20.00 106 63 137 202.0 0 21.23 0.28321.170MTBE 20.00 97.8 65 123 201.0 0 19.58 0.15319.550n-Butylbenzene 20.00 103 69 137 201.0 0 21.24 2.6720.680n-Propylbenzene 20.00 102 72 129 201.0 0 21.22 3.5020.490Naphthalene 20.00 107 54 138 201.0 0 22.02 2.7621.420o-Xylene 20.00 99.9 80 121 201.0 0 20.21 1.1419.980sec-Butylbenzene 20.00 102 72 127 201.0 0 21.03 2.8520.440Styrene 20.00 102 65 134 201.0 0 20.65 1.7120.300Tert-amyl methyl ether 20.00 93.4 70 130 201.0 0 19.34 3.5318.670Tert-Butanol 100.0 94.2 70 130 205.0 0 95.80 1.6394.250tert-Butylbenzene 20.00 102 70 129 201.0 0 20.91 2.0320.490Tetrachloroethene 20.00 100 66 128 201.0 0 20.56 2.6620.020Toluene 20.00 105 77 122 202.0 0 21.42 1.8921.020trans-1,2-Dichloroethene 20.00 103 63 137 201.0 0 20.80 1.3620.520trans-1,3-Dichloropropene 20.00 101 59 135 201.0 0 21.21 4.7820.220Trichloroethene 20.00 99.6 70 127 201.0 0 20.92 4.9019.920Trichlorofluoromethane 20.00 118 57 129 201.0 0 24.08 2.4023.510Vinyl chloride 20.00 102 50 134 200.50 0 20.80 2.3820.310Xylenes, Total 60.00 101 75 125 202.0 0 61.00 0.62560.620
Surr: 1,2-Dichloroethane-d4 25.00 99.3 72 119 024.830
Qualifiers:B Analyte detected in the associated Method Blank E Value above quantitation range H Holding times for preparation or analysis exceededJ Analyte detected below quantitation limits ND Not Detected at the Reporting Limit R RPD outside accepted recovery limitsS Spike/Surrogate outside of limits due to matrix interference DO Surrogate Diluted Out Calculations are based on raw values
14 of 17
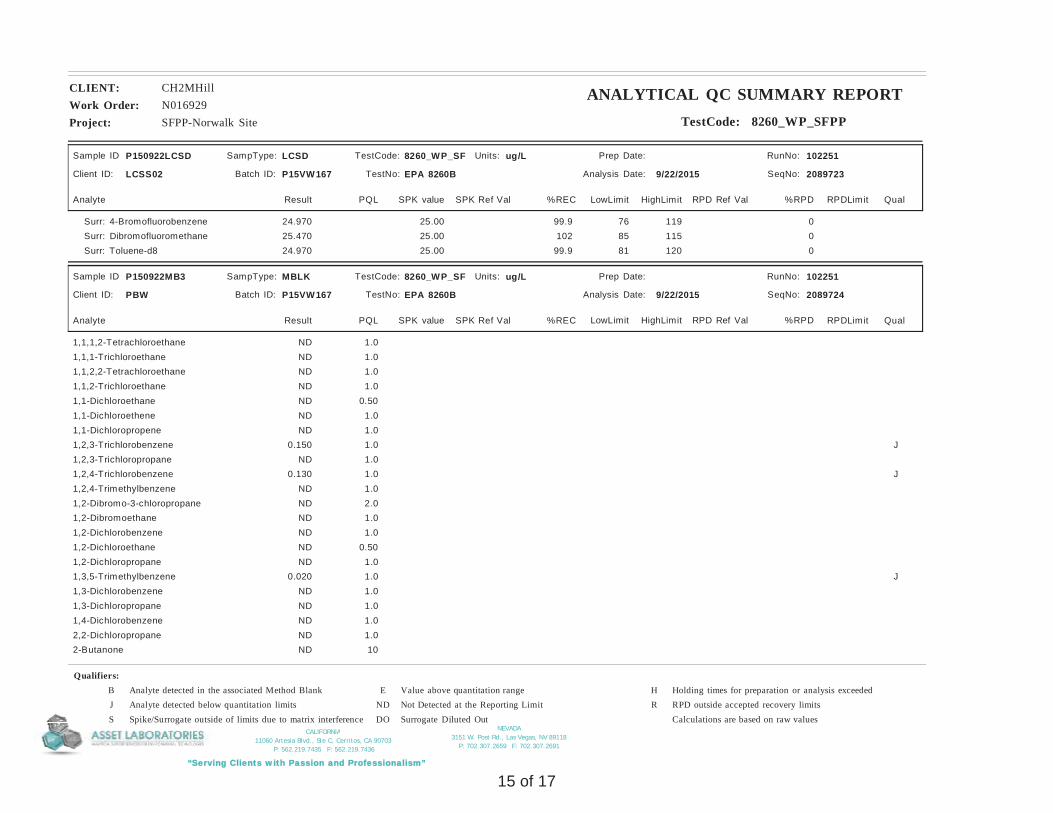
NEVADA3151 W. Post Rd., Las Vegas, NV 89118
P: 702.307.2659 F: 702.307.2691
“Serving Clients with Passion and Professionalism”
CALIFORNIA11060 Artesia Blvd., Ste C, Cerritos, CA 90703
P: 562.219.7435 F: 562.219.7436
Project: SFPP-Norwalk Site
CLIENT: CH2MHillWork Order: N016929
ANALYTICAL QC SUMMARY REPORTTestCode: 8260_WP_SFPP
Sample ID P150922LCSD
Batch ID: P15VW167 TestNo: EPA 8260B Analysis Date: 9/22/2015
Prep Date:
Analyte Result SPK value SPK Ref Val %REC RPD Ref Val %RPDLowLimit HighLimit RPDLimit Qual
Units: ug/L
PQL
Client ID: LCSS02
RunNo: 102251
SeqNo: 2089723
LCSDSampType: TestCode: 8260_WP_SF
Surr: 4-Bromofluorobenzene 25.00 99.9 76 119 024.970Surr: Dibromofluoromethane 25.00 102 85 115 025.470Surr: Toluene-d8 25.00 99.9 81 120 024.970
Sample ID P150922MB3
Batch ID: P15VW167 TestNo: EPA 8260B Analysis Date: 9/22/2015
Prep Date:
Analyte Result SPK value SPK Ref Val %REC RPD Ref Val %RPDLowLimit HighLimit RPDLimit Qual
Units: ug/L
PQL
Client ID: PBW
RunNo: 102251
SeqNo: 2089724
MBLKSampType: TestCode: 8260_WP_SF
1,1,1,2-Tetrachloroethane 1.0ND1,1,1-Trichloroethane 1.0ND1,1,2,2-Tetrachloroethane 1.0ND1,1,2-Trichloroethane 1.0ND1,1-Dichloroethane 0.50ND1,1-Dichloroethene 1.0ND1,1-Dichloropropene 1.0ND1,2,3-Trichlorobenzene J1.00.1501,2,3-Trichloropropane 1.0ND1,2,4-Trichlorobenzene J1.00.1301,2,4-Trimethylbenzene 1.0ND1,2-Dibromo-3-chloropropane 2.0ND1,2-Dibromoethane 1.0ND1,2-Dichlorobenzene 1.0ND1,2-Dichloroethane 0.50ND1,2-Dichloropropane 1.0ND1,3,5-Trimethylbenzene J1.00.0201,3-Dichlorobenzene 1.0ND1,3-Dichloropropane 1.0ND1,4-Dichlorobenzene 1.0ND2,2-Dichloropropane 1.0ND2-Butanone 10ND
Qualifiers:B Analyte detected in the associated Method Blank E Value above quantitation range H Holding times for preparation or analysis exceededJ Analyte detected below quantitation limits ND Not Detected at the Reporting Limit R RPD outside accepted recovery limitsS Spike/Surrogate outside of limits due to matrix interference DO Surrogate Diluted Out Calculations are based on raw values
15 of 17
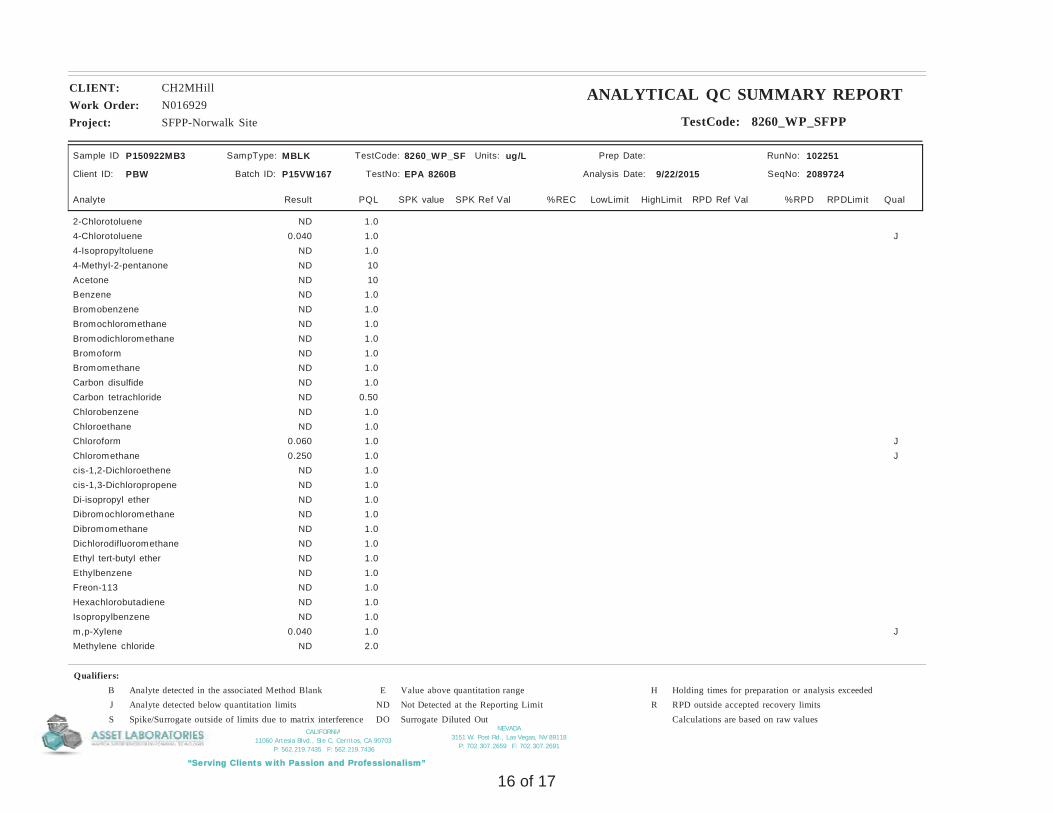
NEVADA3151 W. Post Rd., Las Vegas, NV 89118
P: 702.307.2659 F: 702.307.2691
“Serving Clients with Passion and Professionalism”
CALIFORNIA11060 Artesia Blvd., Ste C, Cerritos, CA 90703
P: 562.219.7435 F: 562.219.7436
Project: SFPP-Norwalk Site
CLIENT: CH2MHillWork Order: N016929
ANALYTICAL QC SUMMARY REPORTTestCode: 8260_WP_SFPP
Sample ID P150922MB3
Batch ID: P15VW167 TestNo: EPA 8260B Analysis Date: 9/22/2015
Prep Date:
Analyte Result SPK value SPK Ref Val %REC RPD Ref Val %RPDLowLimit HighLimit RPDLimit Qual
Units: ug/L
PQL
Client ID: PBW
RunNo: 102251
SeqNo: 2089724
MBLKSampType: TestCode: 8260_WP_SF
2-Chlorotoluene 1.0ND4-Chlorotoluene J1.00.0404-Isopropyltoluene 1.0ND4-Methyl-2-pentanone 10NDAcetone 10NDBenzene 1.0NDBromobenzene 1.0NDBromochloromethane 1.0NDBromodichloromethane 1.0NDBromoform 1.0NDBromomethane 1.0NDCarbon disulfide 1.0NDCarbon tetrachloride 0.50NDChlorobenzene 1.0NDChloroethane 1.0NDChloroform J1.00.060Chloromethane J1.00.250cis-1,2-Dichloroethene 1.0NDcis-1,3-Dichloropropene 1.0NDDi-isopropyl ether 1.0NDDibromochloromethane 1.0NDDibromomethane 1.0NDDichlorodifluoromethane 1.0NDEthyl tert-butyl ether 1.0NDEthylbenzene 1.0NDFreon-113 1.0NDHexachlorobutadiene 1.0NDIsopropylbenzene 1.0NDm,p-Xylene J1.00.040Methylene chloride 2.0ND
Qualifiers:B Analyte detected in the associated Method Blank E Value above quantitation range H Holding times for preparation or analysis exceededJ Analyte detected below quantitation limits ND Not Detected at the Reporting Limit R RPD outside accepted recovery limitsS Spike/Surrogate outside of limits due to matrix interference DO Surrogate Diluted Out Calculations are based on raw values
16 of 17
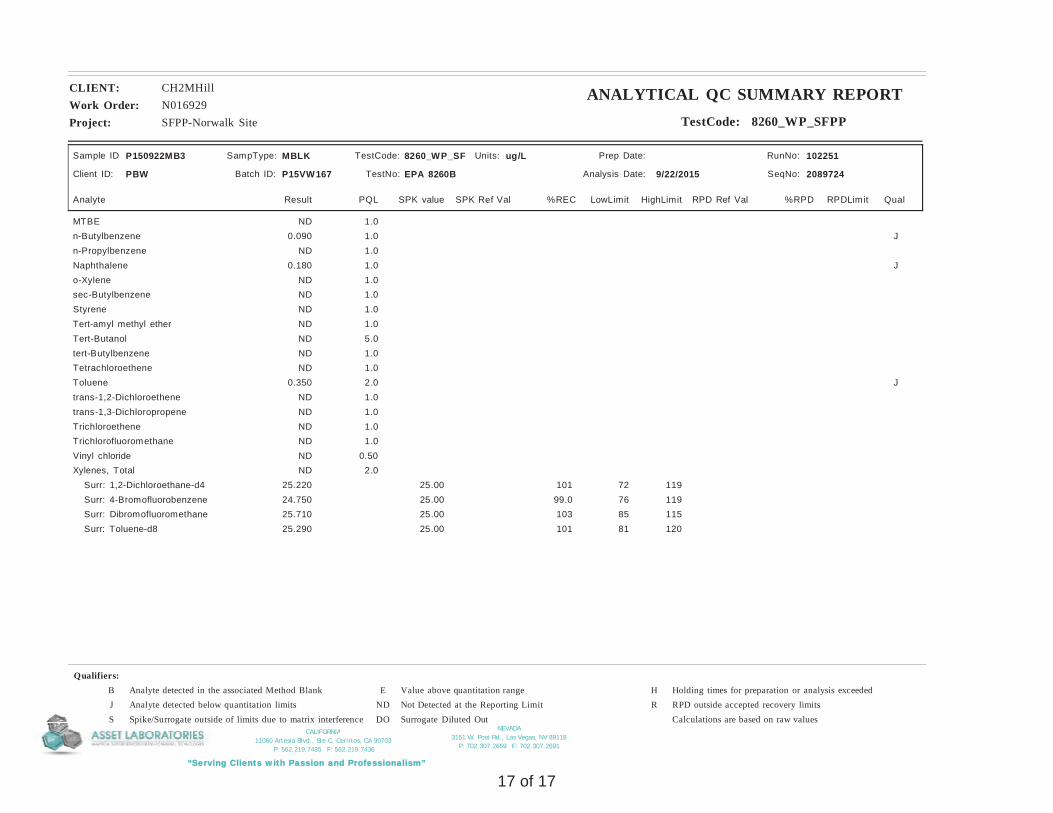
NEVADA3151 W. Post Rd., Las Vegas, NV 89118
P: 702.307.2659 F: 702.307.2691
“Serving Clients with Passion and Professionalism”
CALIFORNIA11060 Artesia Blvd., Ste C, Cerritos, CA 90703
P: 562.219.7435 F: 562.219.7436
Project: SFPP-Norwalk Site
CLIENT: CH2MHillWork Order: N016929
ANALYTICAL QC SUMMARY REPORTTestCode: 8260_WP_SFPP
Sample ID P150922MB3
Batch ID: P15VW167 TestNo: EPA 8260B Analysis Date: 9/22/2015
Prep Date:
Analyte Result SPK value SPK Ref Val %REC RPD Ref Val %RPDLowLimit HighLimit RPDLimit Qual
Units: ug/L
PQL
Client ID: PBW
RunNo: 102251
SeqNo: 2089724
MBLKSampType: TestCode: 8260_WP_SF
MTBE 1.0NDn-Butylbenzene J1.00.090n-Propylbenzene 1.0NDNaphthalene J1.00.180o-Xylene 1.0NDsec-Butylbenzene 1.0NDStyrene 1.0NDTert-amyl methyl ether 1.0NDTert-Butanol 5.0NDtert-Butylbenzene 1.0NDTetrachloroethene 1.0NDToluene J2.00.350trans-1,2-Dichloroethene 1.0NDtrans-1,3-Dichloropropene 1.0NDTrichloroethene 1.0NDTrichlorofluoromethane 1.0NDVinyl chloride 0.50NDXylenes, Total 2.0ND
Surr: 1,2-Dichloroethane-d4 25.00 101 72 11925.220Surr: 4-Bromofluorobenzene 25.00 99.0 76 11924.750Surr: Dibromofluoromethane 25.00 103 85 11525.710Surr: Toluene-d8 25.00 101 81 12025.290
Qualifiers:B Analyte detected in the associated Method Blank E Value above quantitation range H Holding times for preparation or analysis exceededJ Analyte detected below quantitation limits ND Not Detected at the Reporting Limit R RPD outside accepted recovery limitsS Spike/Surrogate outside of limits due to matrix interference DO Surrogate Diluted Out Calculations are based on raw values
17 of 17
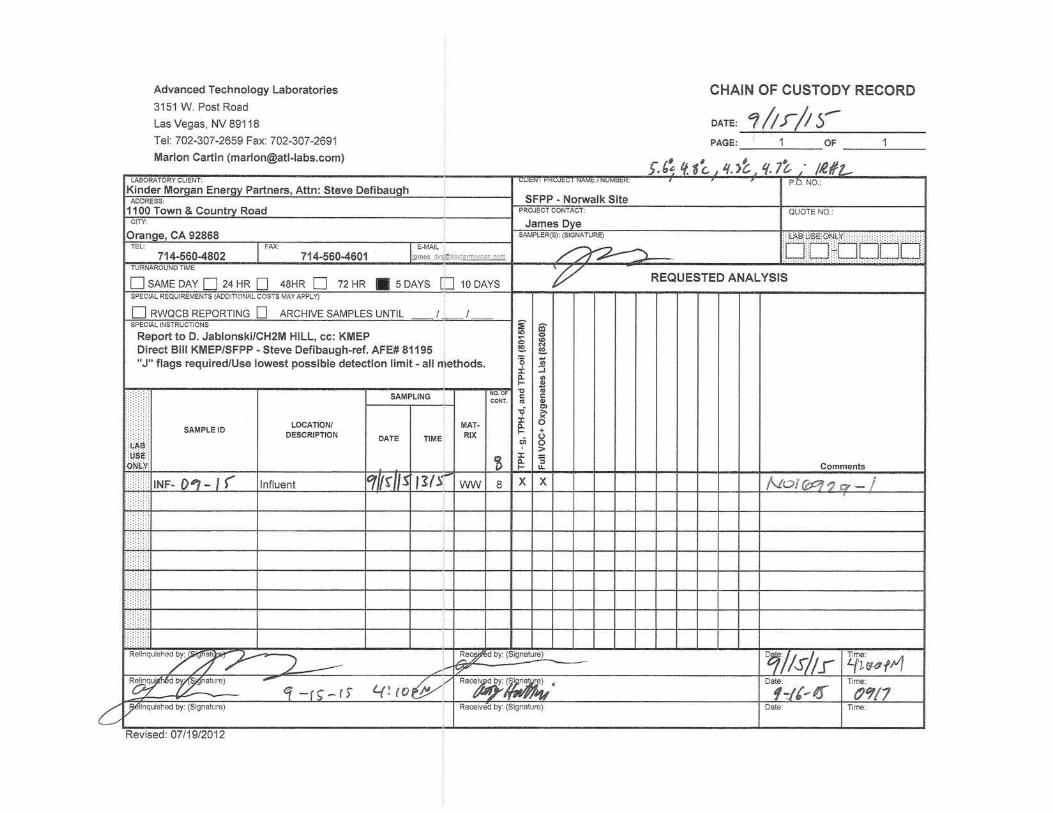
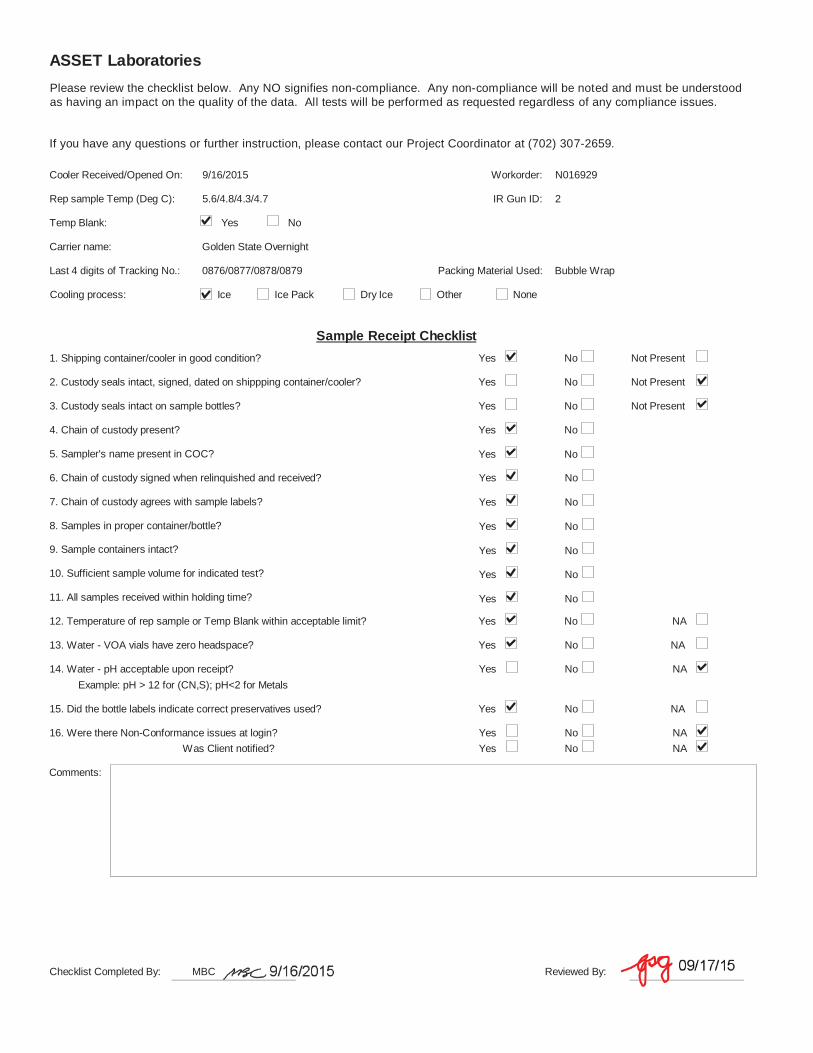
ASSET Laboratories
Please review the checklist below. Any NO signifies non-compliance. Any non-compliance will be noted and must be understood as having an impact on the quality of the data. All tests will be performed as requested regardless of any compliance issues.
If you have any questions or further instruction, please contact our Project Coordinator at (702) 307-2659.
Carrier name: Golden State Overnight
Cooler Received/Opened On: 9/16/2015
Rep sample Temp (Deg C): 5.6/4.8/4.3/4.7 IR Gun ID: 2
Temp Blank: Yes No
Last 4 digits of Tracking No.: 0876/0877/0878/0879
Cooling process: Ice Ice Pack Dry Ice Other None
Packing Material Used: Bubble Wrap
Workorder: N016929
Sample Receipt Checklist
4. Chain of custody present? Yes No
6. Chain of custody signed when relinquished and received? Yes No
7. Chain of custody agrees with sample labels? Yes No
8. Samples in proper container/bottle? Yes No
9. Sample containers intact? Yes No
10. Sufficient sample volume for indicated test? Yes No
11. All samples received within holding time? Yes No
Yes No NA13. Water - VOA vials have zero headspace?
14. Water - pH acceptable upon receipt? Yes No NAExample: pH > 12 for (CN,S); pH<2 for Metals
1. Shipping container/cooler in good condition? Yes No Not Present
2. Custody seals intact, signed, dated on shippping container/cooler? Yes No Not Present
3. Custody seals intact on sample bottles? Yes No Not Present
5. Sampler's name present in COC? Yes No
12. Temperature of rep sample or Temp Blank within acceptable limit? Yes No NA
Yes No NA15. Did the bottle labels indicate correct preservatives used?
16. Were there Non-Conformance issues at login? Yes No NAWas Client notified? Yes No NA
Comments:
Checklist Completed By: MBC Reviewed By:
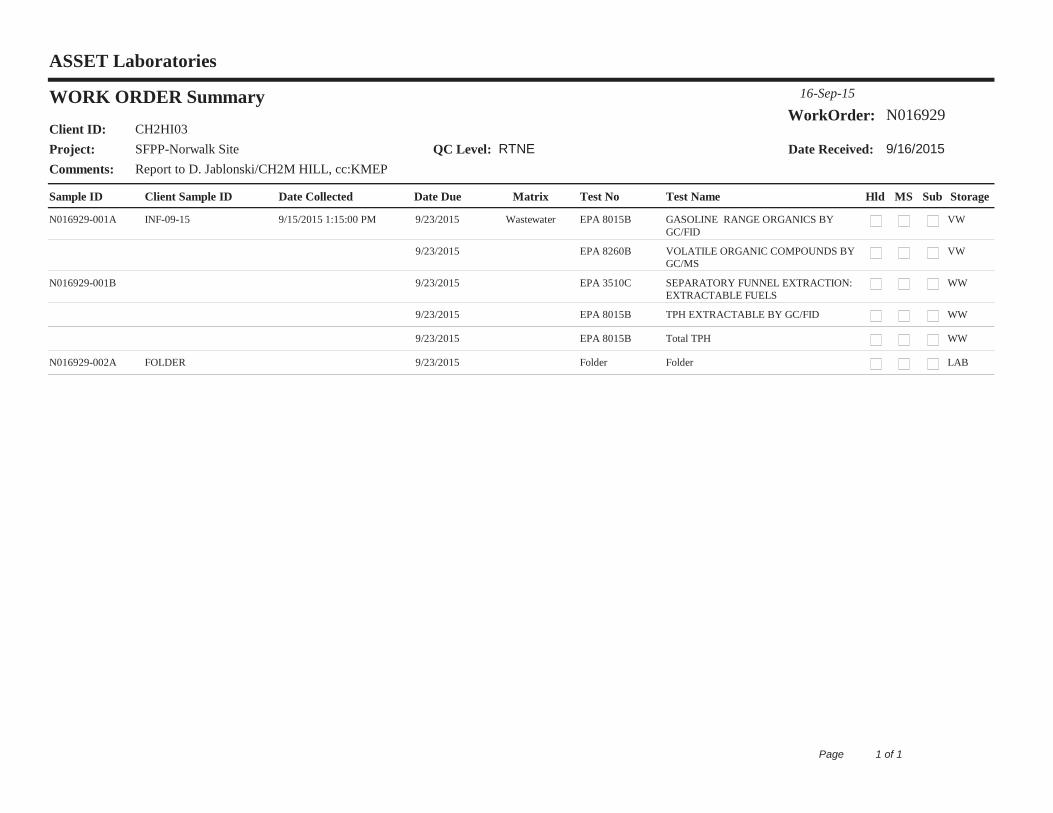
Sample ID Client Sample ID Date Collected
Date Received:
Date Due Matrix Test No
WORK ORDER Summary 16-Sep-15
WorkOrder: N016929
Comments: Report to D. Jablonski/CH2M HILL, cc:KMEP
Client ID: CH2HI03Project: SFPP-Norwalk Site QC Level: RTNE
Hld MS Sub
9/16/2015
Test Name
ASSET Laboratories
Storage
N016929-001A INF-09-15 9/15/2015 1:15:00 PM 9/23/2015 Wastewater EPA 8015B GASOLINE RANGE ORGANICS BY GC/FID
VW
9/23/2015 EPA 8260B VOLATILE ORGANIC COMPOUNDS BY GC/MS
VW
N016929-001B 9/23/2015 EPA 3510C SEPARATORY FUNNEL EXTRACTION: EXTRACTABLE FUELS
WW
9/23/2015 EPA 8015B TPH EXTRACTABLE BY GC/FID WW
9/23/2015 EPA 8015B Total TPH WW
N016929-002A FOLDER 9/23/2015 Folder Folder LAB
1 of 1Page