Embed Size (px)
Citation preview
Fixed Income Investor PresentationTHIRD QUARTER 2015
2
Our public communications often include oral or written forward‐looking statements. Statements of this type are included in this document, and may be included in other filings with Canadian securities regulators or the U.S. Securities and Exchange Commission, or in other communications. All such statements are made pursuant to the “safe harbor” provisions of the U.S. Private Securities Litigation Reform Act of 1995 and any applicable Canadian securities legislation. Forward‐looking statements may include, but are not limited to, statements made in this document, the Management’s Discussion and Analysis in the Bank’s 2014 Annual Report under the headings “Overview – Outlook,” for Group Financial Performance “Outlook,” for each business segment “Outlook” and in other statements regarding the Bank’s objectives, strategies to achieve those objectives, the regulatory environment in which the Bank operates, anticipated financial results (including those in the area of risk management), and the outlook for the Bank’s businesses and for the Canadian, U.S. and global economies. Such statements are typically identified by words or phrases such as “believe,” “expect,” “anticipate,” “intent,” “estimate,” “plan,” “may increase,” “may fluctuate,” and similar expressions of future or conditional verbs, such as “will,” “may,” “should,” “would” and “could.” By their very nature, forward‐looking statements involve numerous assumptions, inherent risks and uncertainties, both general and specific, and the risk that predictions and other forward‐looking statements will not prove to be accurate. Do not unduly rely on forward‐looking statements, as a number of important factors, many of which are beyond the Bank’s control and the effects of which can be difficult to predict, could cause actual results to differ materially from the estimates and intentions expressed in such forward‐looking statements. These factors include, but are not limited to: the economic and financial conditions in Canada and globally; fluctuations in interest rates and currency values; liquidity and funding; significant market volatility and interruptions; the failure of third parties to comply with their obligations to the Bank and its affiliates; changes in monetary policy; legislative and regulatory developments in Canada and elsewhere, including changes to, and interpretations of tax laws and risk‐based capital guidelines and reporting instructions and liquidity regulatory guidance; changes to the Bank’s credit ratings; operational (including technology) and infrastructure risks; reputational risks; the risk that the Bank’s risk management models may not take into account all relevant factors; the accuracy and completeness of information the Bank receives on customers and counterparties; the timely development and introduction of new products and services in receptive markets; the Bank’s ability to expand existing distribution channels and to develop and realize revenues from new distribution channels; the Bank’s ability to complete and integrate acquisitions and its other growth strategies; critical accounting estimates and the effects of changes in accounting policies and methods used by the Bank (See “Controls and Accounting Policies – Critical accounting estimates” in the Bank’s 2014 Annual Report, as updated by this document); global capital markets activity; the Bank’s ability to attract and retain key executives; reliance on third parties to provide components of the Bank’s business infrastructure; unexpected changes in consumer spending and saving habits; technological developments; fraud by internal or external parties, including the use of new technologies in unprecedented ways to defraud the Bank or its customers; increasing cyber security risks which may include theft of assets, unauthorized access to sensitive information or operational disruptions; consolidation in the Canadian financial services sector; competition, both from new entrants and established competitors; judicial and regulatory proceedings; natural disasters, including, but not limited to earthquakes and hurricanes; and disruptions to public infrastructure, such as transportation, communication, power or water supply; the possible impact of international conflicts and other developments, including terrorist activities and war; the effects of disease or illness on local, national or international economies; and the Bank’s anticipation of and success in managing the risks implied by the foregoing. A substantial amount of the Bank’s business involves making loans or otherwise committing resources to specific companies, industries or countries. Unforeseen events affecting such borrowers, industries or countries could have a material adverse effect on the Bank’s financial results, businesses, financial condition or liquidity. These and other factors may cause the Bank’s actual performance to differ materially from that contemplated by forward‐looking statements. For more information, see the “Risk Management” section starting on page 65 of the Bank’s 2014 Annual Report. Material economic assumptions underlying the forward‐looking statements contained in this document are set out in the 2014 Annual Report under the heading “Overview – Outlook,” as updated by this document; and for each business segment “Outlook”. The “Outlook” sections are based on the Bank’s views and the actual outcome is uncertain. Readers should consider the above‐noted factors when reviewing these sections. The preceding list of factors is not exhaustive of all possible risk factors and other factors could also adversely affect the Bank’s results. When relying on forward‐looking statements to make decisions with respect to the Bank and its securities, investors and others should carefully consider the preceding factors, other uncertainties and potential events. The Bank does not undertake to update any forward‐looking statements, whether written or oral, that may be made from time to time by or on its behalf. Additional information relating to the Bank, including the Bank’s Annual Information Form, can be located on the SEDAR website at www.sedar.com and on the EDGAR section of the SEC’s website at www.sec.gov.
Caution Regarding Forward‐Looking Statements
3
Appendix: other
Scotiabank Overview
4
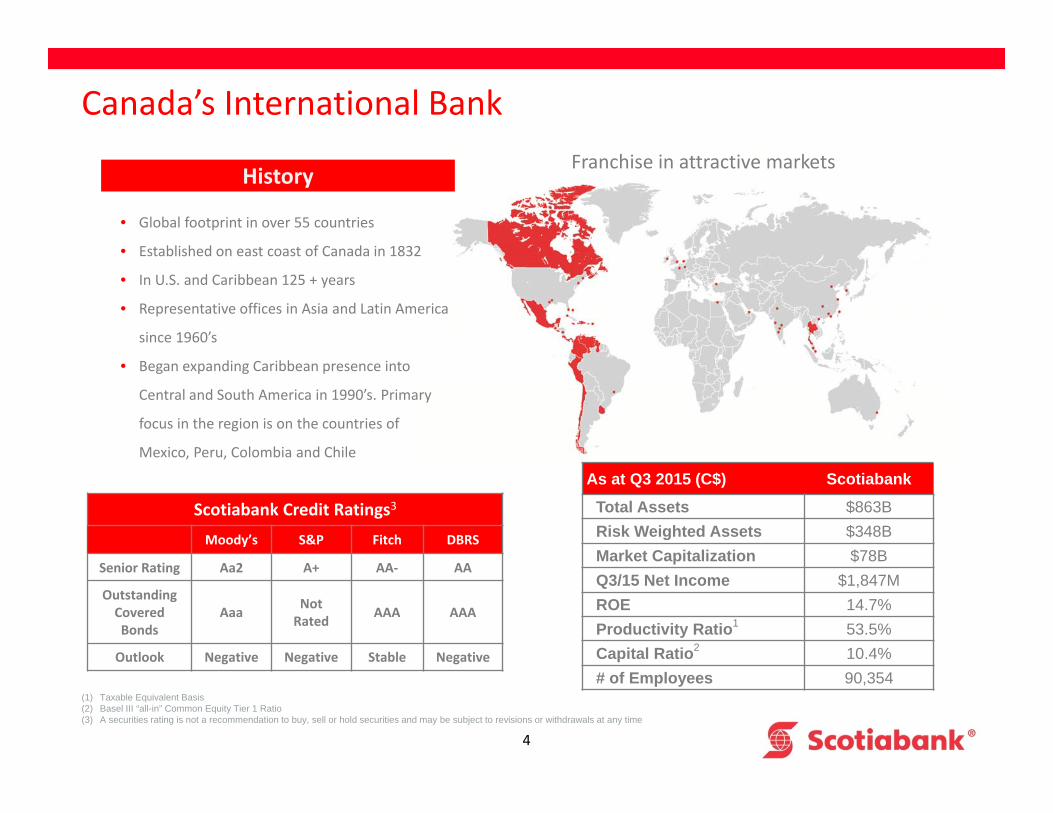
Canada’s International Bank
• Global footprint in over 55 countries
• Established on east coast of Canada in 1832
• In U.S. and Caribbean 125 + years
• Representative offices in Asia and Latin America
since 1960’s
• Began expanding Caribbean presence into
Central and South America in 1990’s. Primary
focus in the region is on the countries of
Mexico, Peru, Colombia and Chile
History
(1) Taxable Equivalent Basis(2) Basel III “all-in” Common Equity Tier 1 Ratio(3) A securities rating is not a recommendation to buy, sell or hold securities and may be subject to revisions or withdrawals at any time
Franchise in attractive markets
As at Q3 2015 (C$) Scotiabank
Total Assets $863BRisk Weighted Assets $348BMarket Capitalization $78BQ3/15 Net Income $1,847MROE 14.7%Productivity Ratio1 53.5%Capital Ratio2 10.4%# of Employees 90,354
Scotiabank Credit Ratings3
Moody’s S&P Fitch DBRS
Senior Rating Aa2 A+ AA‐ AA
Outstanding Covered Bonds
Aaa Not Rated AAA AAA
Outlook Negative Negative Stable Negative
5
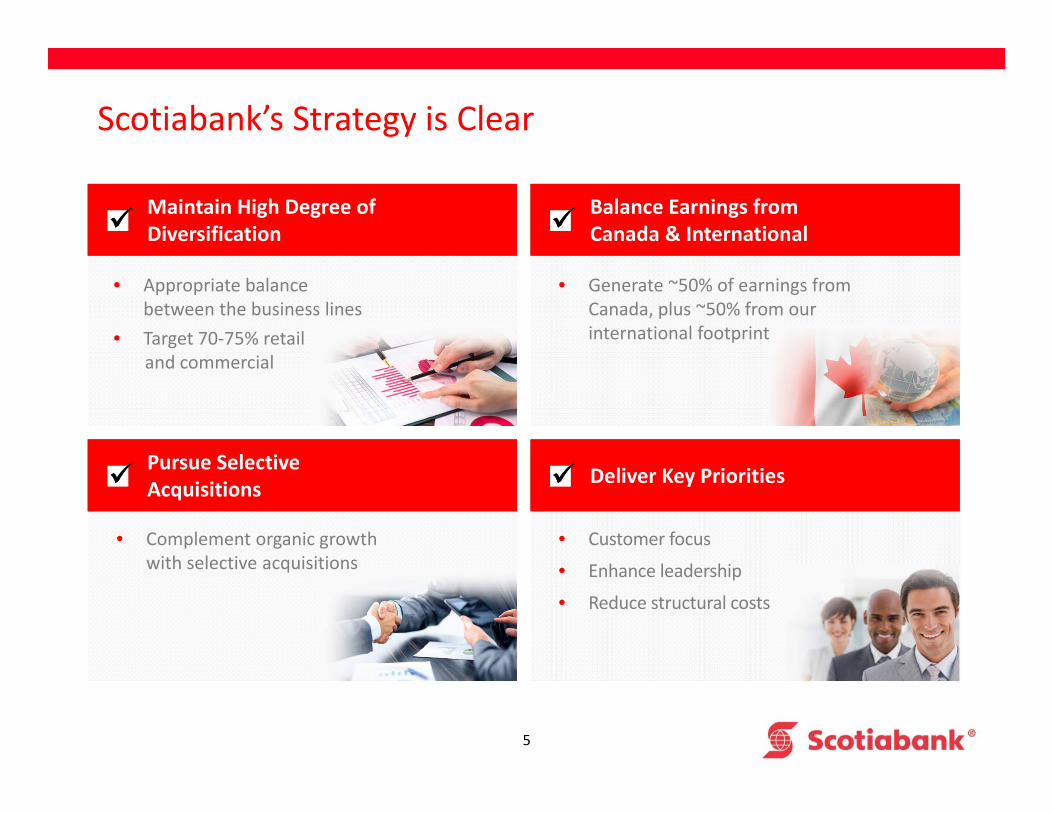
Scotiabank’s Strategy is Clear
Maintain High Degree ofDiversificationMaintain High Degree ofDiversification
Balance Earnings from Canada & InternationalBalance Earnings from Canada & International
Pursue SelectiveAcquisitionsPursue SelectiveAcquisitions
• Generate ~50% of earnings from Canada, plus ~50% from our international footprint
• Complement organic growth with selective acquisitions
Deliver Key PrioritiesDeliver Key Priorities
• Target 70‐75% retailand commercial
• Customer focus
• Enhance leadership
• Reduce structural costs
• Appropriate balance between the business lines
6
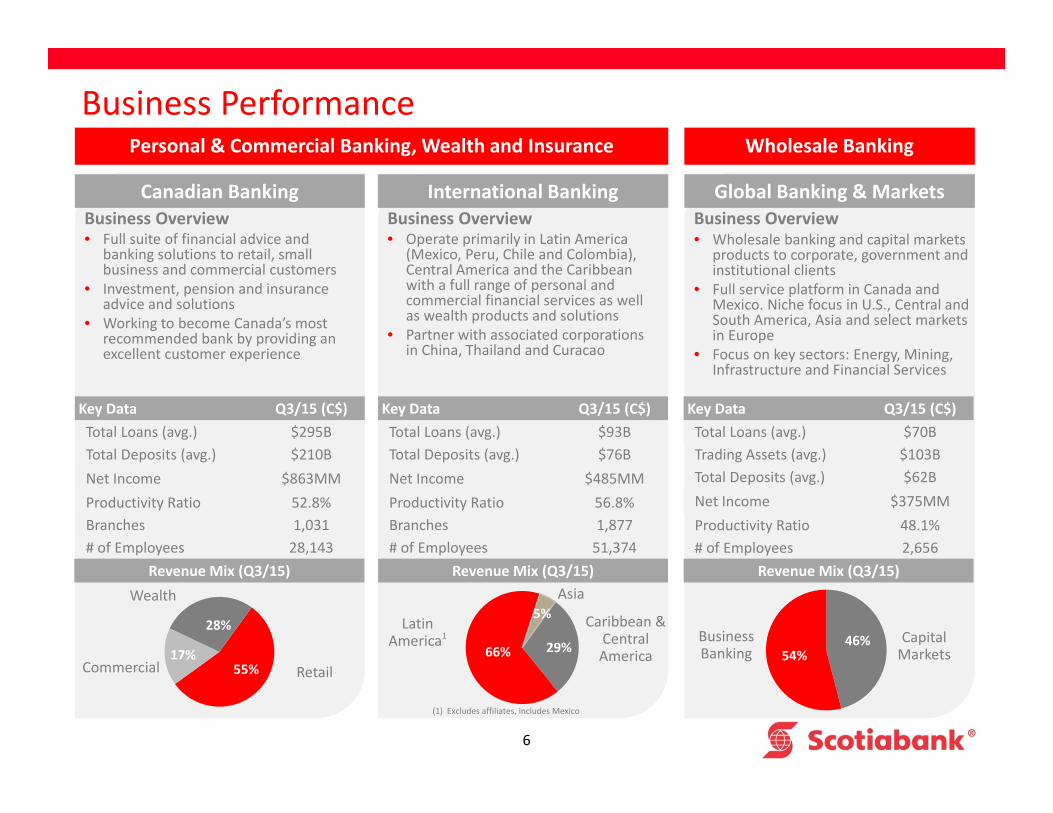
Business Performance
Canadian BankingBusiness Overview• Full suite of financial advice and
banking solutions to retail, small business and commercial customers
• Investment, pension and insurance advice and solutions
• Working to become Canada’s most recommended bank by providing an excellent customer experience
Personal & Commercial Banking, Wealth and Insurance
International BankingBusiness Overview• Operate primarily in Latin America
(Mexico, Peru, Chile and Colombia), Central America and the Caribbean with a full range of personal and commercial financial services as well as wealth products and solutions
• Partner with associated corporations in China, Thailand and Curacao
Global Banking & MarketsBusiness Overview• Wholesale banking and capital markets
products to corporate, government and institutional clients
• Full service platform in Canada and Mexico. Niche focus in U.S., Central and South America, Asia and select markets in Europe
• Focus on key sectors: Energy, Mining, Infrastructure and Financial Services
Wholesale Banking
Key Data Q3/15 (C$)Total Loans (avg.) $295BTotal Deposits (avg.) $210BNet Income $863MMProductivity Ratio 52.8%Branches 1,031# of Employees 28,143
Revenue Mix (Q3/15)
Key Data Q3/15 (C$)Total Loans (avg.) $93BTotal Deposits (avg.) $76BNet Income $485MMProductivity Ratio 56.8%Branches 1,877# of Employees 51,374
Revenue Mix (Q3/15)
Key Data Q3/15 (C$)Total Loans (avg.) $70BTrading Assets (avg.) $103BTotal Deposits (avg.) $62BNet Income $375MMProductivity Ratio 48.1%# of Employees 2,656
Revenue Mix (Q3/15)
Commercial Retail55%17%
28%
Wealth
77%
29%66%
5% Caribbean & Central America
Asia
Latin America1
(1) Excludes affiliates, includes Mexico
77%
46%54%
Business Banking
Capital Markets
7
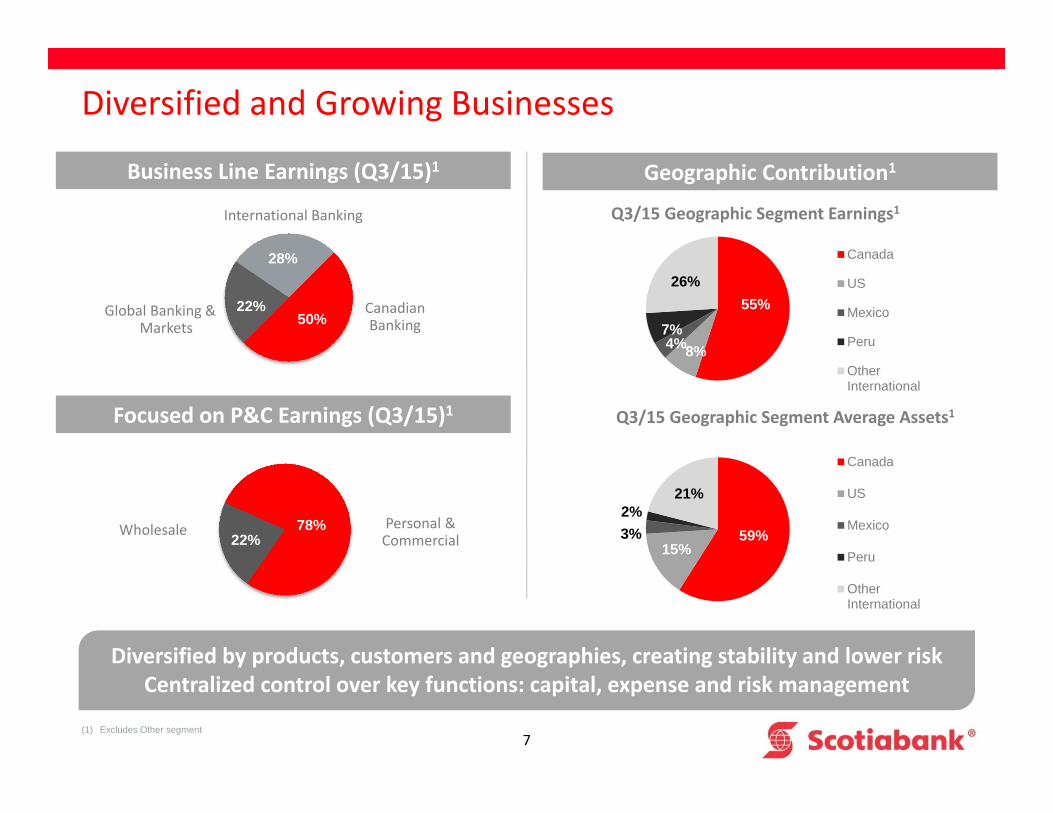
22%78%
Diversified and Growing Businesses
50%22%
28%
Canadian Banking
International Banking
Global Banking & Markets
Business Line Earnings (Q3/15)1 Geographic Contribution1
Focused on P&C Earnings (Q3/15)1
Wholesale Personal &Commercial
Diversified by products, customers and geographies, creating stability and lower riskCentralized control over key functions: capital, expense and risk management
(1) Excludes Other segment
59%15%
3%2%
21%
Canada
US
Mexico
Peru
OtherInternational
55%
8%4%7%
26%
Canada
US
Mexico
Peru
OtherInternational
Q3/15 Geographic Segment Average Assets1
Q3/15 Geographic Segment Earnings1
8
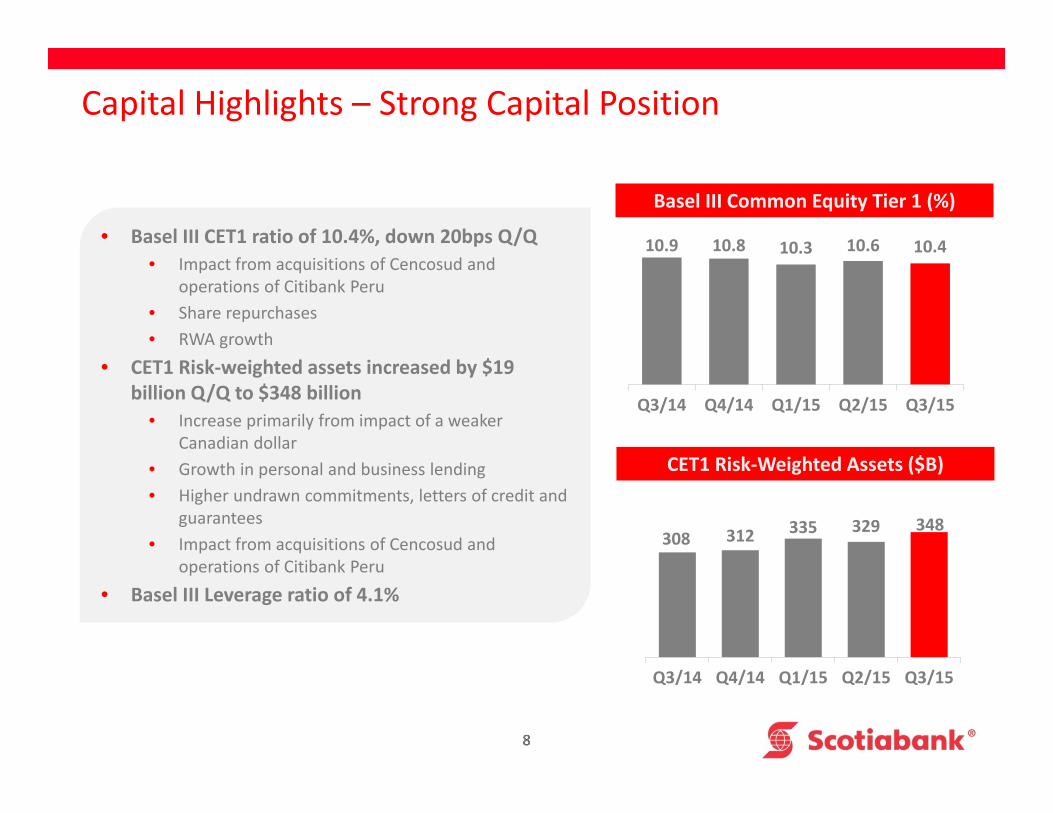
10.9 10.8 10.3 10.6 10.4
Q3/14 Q4/14 Q1/15 Q2/15 Q3/15
8
308 312 335 329 348
Q3/14 Q4/14 Q1/15 Q2/15 Q3/15
Capital Highlights – Strong Capital Position
• Basel III CET1 ratio of 10.4%, down 20bps Q/Q• Impact from acquisitions of Cencosud and
operations of Citibank Peru• Share repurchases • RWA growth
• CET1 Risk‐weighted assets increased by $19 billion Q/Q to $348 billion
• Increase primarily from impact of a weaker Canadian dollar
• Growth in personal and business lending• Higher undrawn commitments, letters of credit and
guarantees • Impact from acquisitions of Cencosud and
operations of Citibank Peru• Basel III Leverage ratio of 4.1%
Basel III Common Equity Tier 1 (%)
CET1 Risk‐Weighted Assets ($B)
9
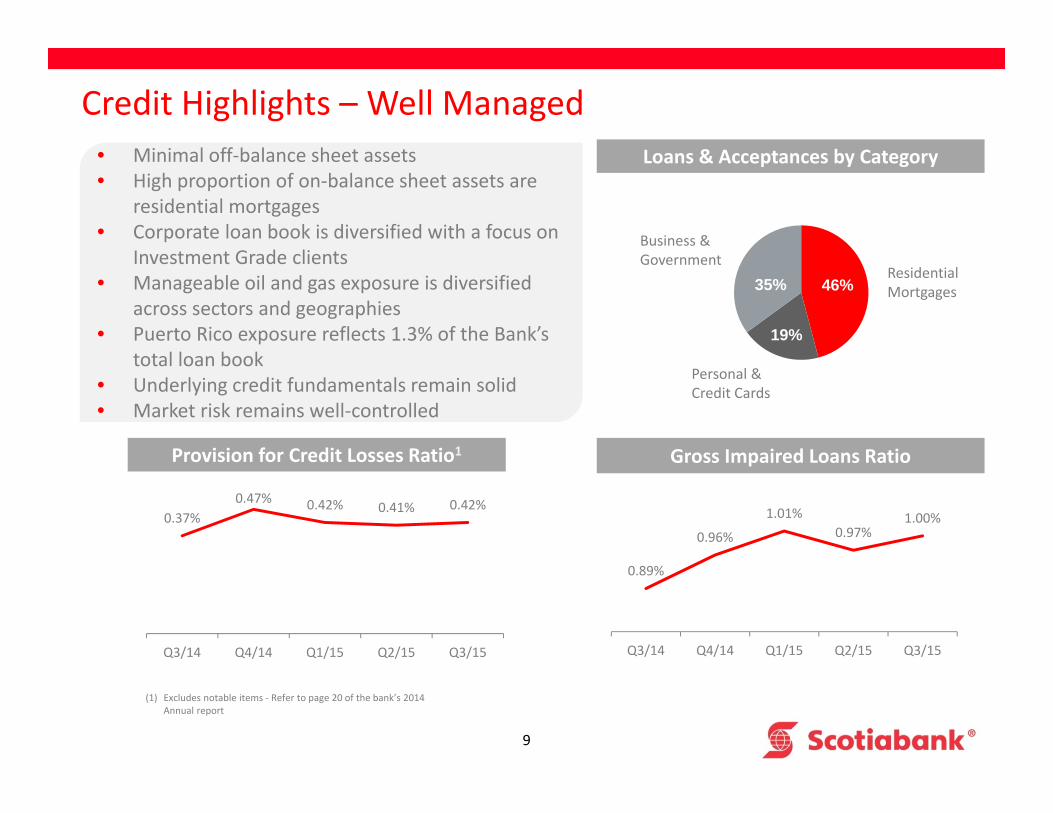
Credit Highlights – Well Managed• Minimal off‐balance sheet assets • High proportion of on‐balance sheet assets are
residential mortgages• Corporate loan book is diversified with a focus on
Investment Grade clients• Manageable oil and gas exposure is diversified
across sectors and geographies • Puerto Rico exposure reflects 1.3% of the Bank’s
total loan book• Underlying credit fundamentals remain solid• Market risk remains well‐controlled
Business & Government
Personal & Credit Cards
Residential Mortgages
(1) Excludes notable items ‐ Refer to page 20 of the bank’s 2014 Annual report
Loans & Acceptances by Category
Provision for Credit Losses Ratio1 Gross Impaired Loans Ratio
0.37%0.47% 0.42% 0.41% 0.42%
Q3/14 Q4/14 Q1/15 Q2/15 Q3/15
0.89%
0.96%
1.01%0.97%
1.00%
Q3/14 Q4/14 Q1/15 Q2/15 Q3/15
46%
19%
35%

10
Canadian & Select International Economies
11
Canadian Economy and Financial System
Strong Financial System
Canadian Banking System ranked World’s Soundest by World Economic Forum for 7th consecutive yearGlobal Competitiveness Report (2014 – 2015)
• Effective regulatory framework– Principles based regime– Single regulator for major banks– Conservative capital requirements– Proactive policies and programs
• Risk management practices– Conservative lending standards– Few sub‐prime mortgages – Relatively little securitization– Primarily originate to hold model
• Canadian banks well capitalized and profitable
Canadian Economy
• The 15th largest economy in the world, with a large export orientation
• Economy is diversified, with a focus on services, manufacturing, primary and construction & utilities industries
• Manageable Canadian government deficits
• Proactive government and central bank
• Moderate growth forecast affected by slowdown in commodity sectors balanced by lower dollar stimulating exports in manufacturing and services sectors
12
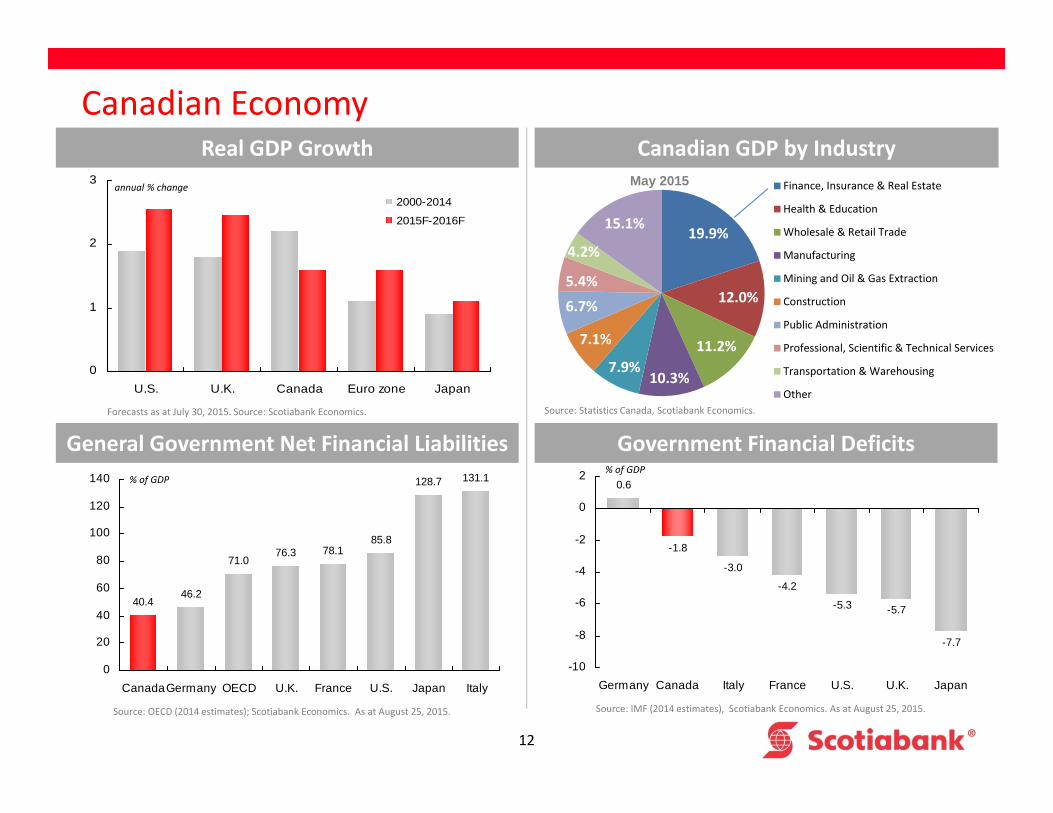
Canadian EconomyReal GDP Growth
General Government Net Financial Liabilities Government Financial Deficits
annual % change
% of GDP% of GDP
Canadian GDP by Industry
Source: Statistics Canada, Scotiabank Economics.
0
1
2
3
U.S. U.K. Canada Euro zone Japan
2000-2014
2015F-2016F
Forecasts as at July 30, 2015. Source: Scotiabank Economics.
19.9%
12.0%
11.2%
10.3%7.9%
7.1%
6.7%
5.4%
4.2%
15.1%
Finance, Insurance & Real Estate
Health & Education
Wholesale & Retail Trade
Manufacturing
Mining and Oil & Gas Extraction
Construction
Public Administration
Professional, Scientific & Technical Services
Transportation & Warehousing
Other
May 2015
40.446.2
71.076.3 78.1
85.8
128.7 131.1
0
20
40
60
80
100
120
140
CanadaGermany OECD U.K. France U.S. Japan Italy
Source: OECD (2014 estimates); Scotiabank Economics. As at August 25, 2015.
0.6
-1.8
-3.0
-4.2
-5.3 -5.7
-7.7
-10
-8
-6
-4
-2
0
2
Germany Canada Italy France U.S. U.K. Japan
Source: IMF (2014 estimates), Scotiabank Economics. As at August 25, 2015.
13
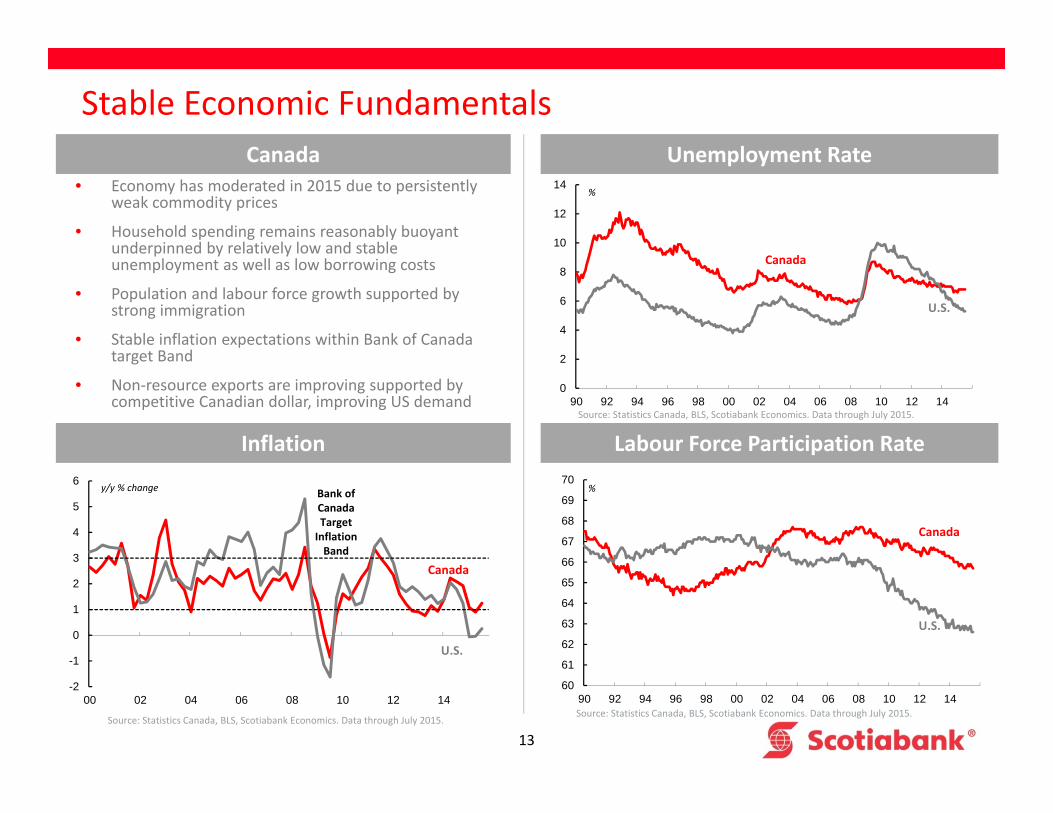
Stable Economic Fundamentals
Labour Force Participation Rate
Unemployment Rate
y/y % change
Inflation
U.S.
Canada
%
U.S.
Canada
Bank of Canada Target Inflation Band
%
U.S.
Canada
Canada• Economy has moderated in 2015 due to persistently
weak commodity prices
• Household spending remains reasonably buoyant underpinned by relatively low and stable unemployment as well as low borrowing costs
• Population and labour force growth supported by strong immigration
• Stable inflation expectations within Bank of Canada target Band
• Non‐resource exports are improving supported by competitive Canadian dollar, improving US demand
-2
-1
0
1
2
3
4
5
6
00 02 04 06 08 10 12 14
0
2
4
6
8
10
12
14
90 92 94 96 98 00 02 04 06 08 10 12 14
Source: Statistics Canada, BLS, Scotiabank Economics. Data through July 2015.
Source: Statistics Canada, BLS, Scotiabank Economics. Data through July 2015.
Source: Statistics Canada, BLS, Scotiabank Economics. Data through July 2015.
60
61
62
63
64
65
66
67
68
69
70
90 92 94 96 98 00 02 04 06 08 10 12 14
14
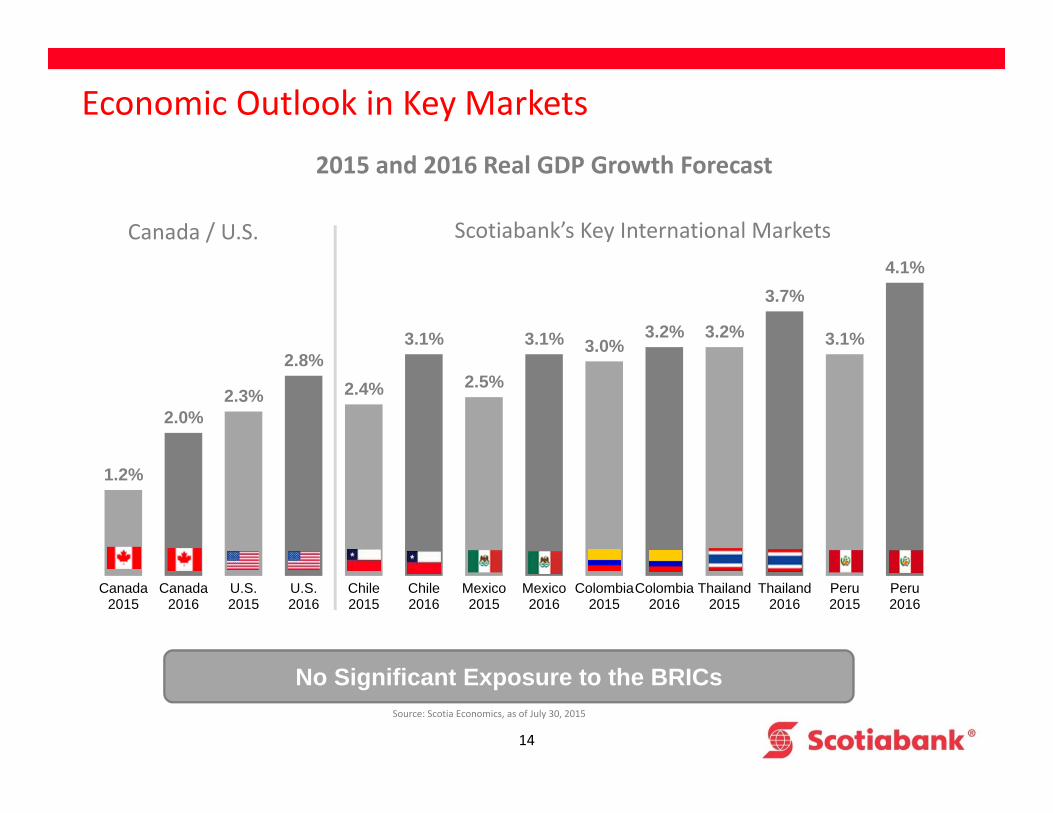
Economic Outlook in Key Markets
1.2%
2.0%2.3%
2.8%2.4%
3.1%
2.5%
3.1% 3.0%3.2% 3.2%
3.7%
3.1%
4.1%
Canada2015
Canada2016
U.S.2015
U.S.2016
Chile2015
Chile2016
Mexico2015
Mexico2016
Colombia2015
Colombia2016
Thailand2015
Thailand2016
Peru2015
Peru2016
Scotiabank’s Key International MarketsCanada / U.S.
Source: Scotia Economics, as of July 30, 2015
2015 and 2016 Real GDP Growth Forecast
No Significant Exposure to the BRICs

15
Canadian Housing Market
16
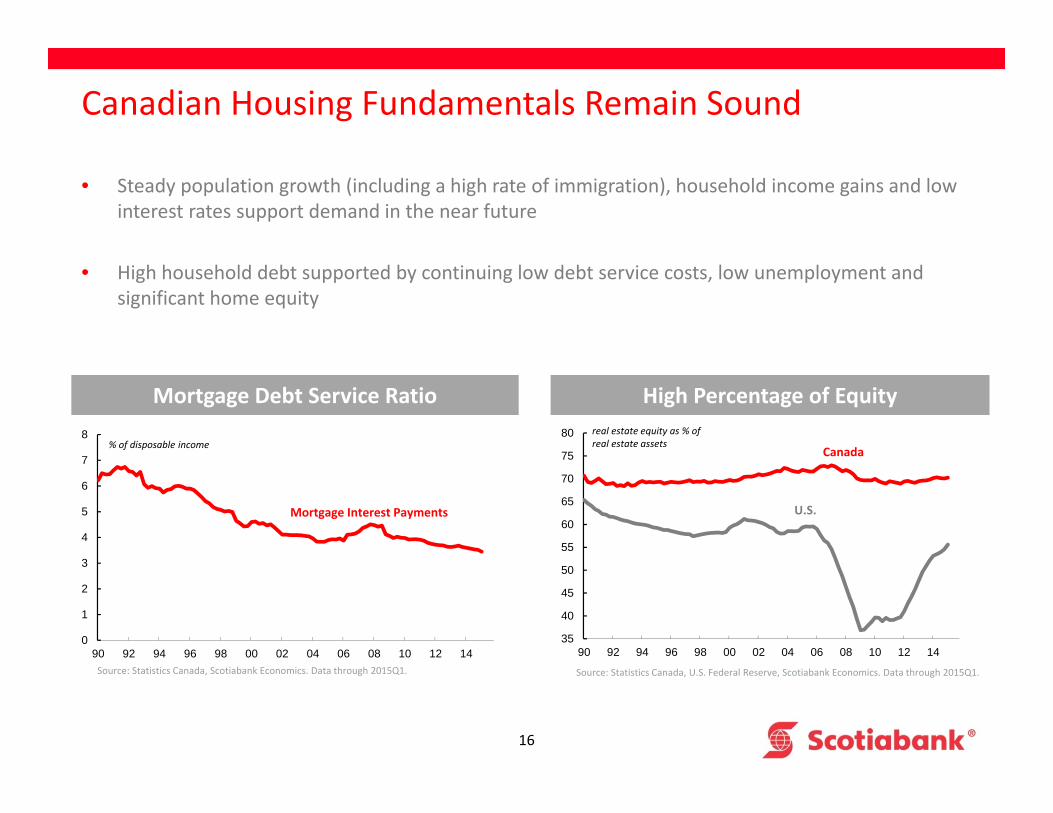
Canadian Housing Fundamentals Remain Sound
• Steady population growth (including a high rate of immigration), household income gains and low interest rates support demand in the near future
• High household debt supported by continuing low debt service costs, low unemployment and significant home equity
real estate equity as % of real estate assets
High Percentage of Equity
U.S.
Canada
Mortgage Debt Service Ratio
% of disposable income
Mortgage Interest Payments
0
1
2
3
4
5
6
7
8
90 92 94 96 98 00 02 04 06 08 10 12 14Source: Statistics Canada, Scotiabank Economics. Data through 2015Q1.
35
40
45
50
55
60
65
70
75
80
90 92 94 96 98 00 02 04 06 08 10 12 14
Source: Statistics Canada, U.S. Federal Reserve, Scotiabank Economics. Data through 2015Q1.
17
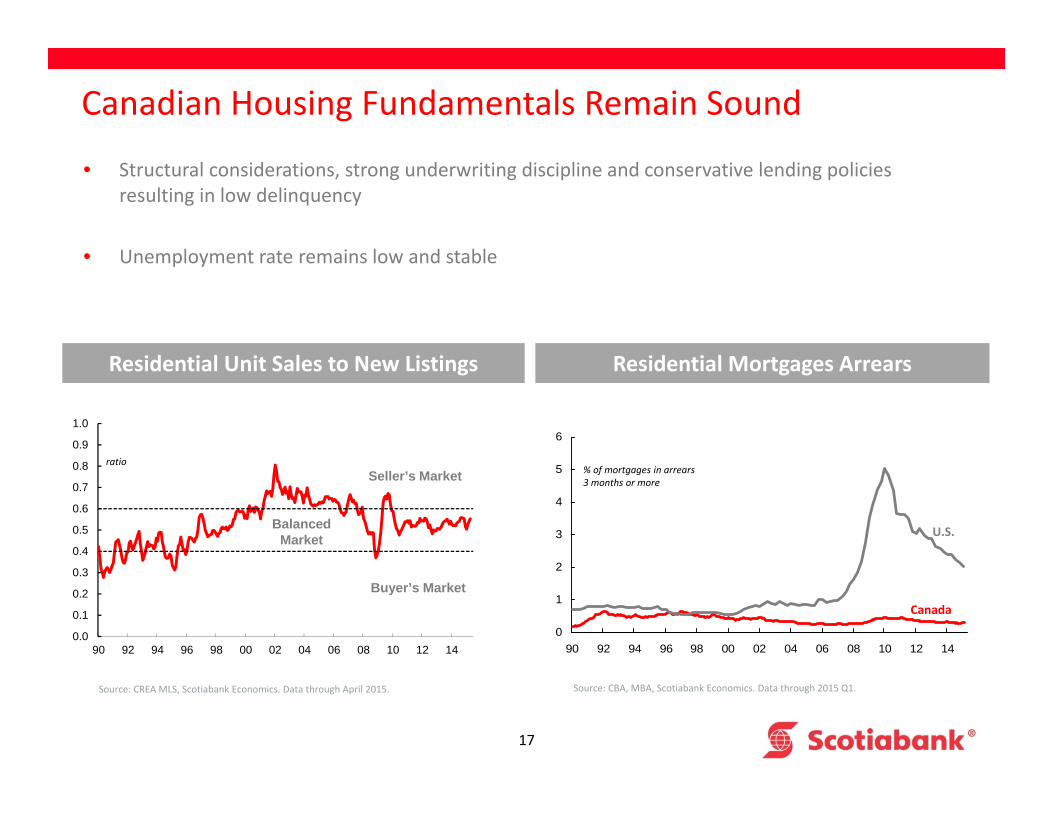
Canadian Housing Fundamentals Remain Sound
• Structural considerations, strong underwriting discipline and conservative lending policies resulting in low delinquency
• Unemployment rate remains low and stable
Residential Mortgages Arrears
0
1
2
3
4
5
6
90 92 94 96 98 00 02 04 06 08 10 12 14
Source: CBA, MBA, Scotiabank Economics. Data through 2015 Q1.
% of mortgages in arrears 3 months or more
U.S.
Canada
Residential Unit Sales to New Listings
0.0
0.1
0.2
0.3
0.4
0.5
0.6
0.7
0.8
0.9
1.0
90 92 94 96 98 00 02 04 06 08 10 12 14
ratioSeller’s Market
Buyer’s Market
Balanced Market
Source: CREA MLS, Scotiabank Economics. Data through April 2015.
18
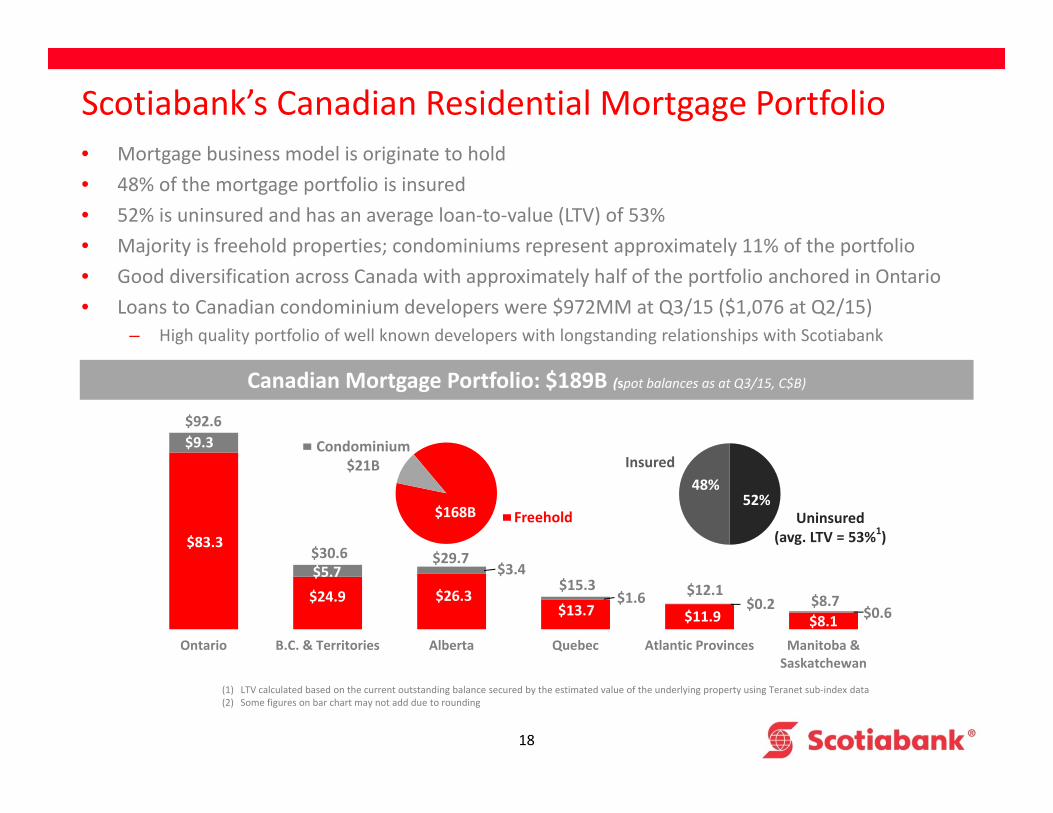
$83.3
$24.9 $26.3$13.7 $11.9 $8.1
Ontario B.C. & Territories Alberta Quebec Atlantic Provinces Manitoba &Saskatchewan
Scotiabank’s Canadian Residential Mortgage Portfolio• Mortgage business model is originate to hold• 48% of the mortgage portfolio is insured• 52% is uninsured and has an average loan‐to‐value (LTV) of 53%• Majority is freehold properties; condominiums represent approximately 11% of the portfolio • Good diversification across Canada with approximately half of the portfolio anchored in Ontario• Loans to Canadian condominium developers were $972MM at Q3/15 ($1,076 at Q2/15)
– High quality portfolio of well known developers with longstanding relationships with Scotiabank
(1) LTV calculated based on the current outstanding balance secured by the estimated value of the underlying property using Teranet sub‐index data(2) Some figures on bar chart may not add due to rounding
52%48%
Insured
Uninsured(avg. LTV = 53%1)
Canadian Mortgage Portfolio: $189B (spot balances as at Q3/15, C$B)
$168B
Condominium$21B
Freehold
$92.6
$30.6 $29.7
$15.3 $12.1$1.6 $8.7
$3.4
$0.6$0.2
$5.7
$9.3
19
Funding
20
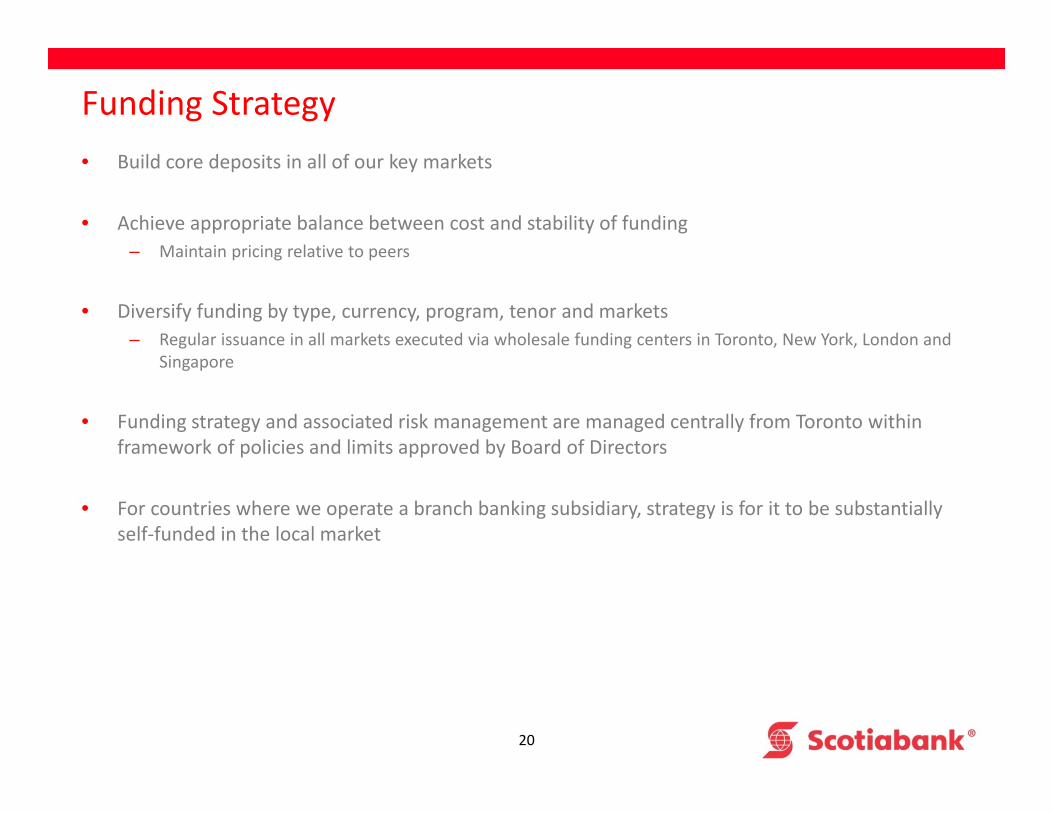
Funding Strategy• Build core deposits in all of our key markets
• Achieve appropriate balance between cost and stability of funding– Maintain pricing relative to peers
• Diversify funding by type, currency, program, tenor and markets– Regular issuance in all markets executed via wholesale funding centers in Toronto, New York, London and
Singapore
• Funding strategy and associated risk management are managed centrally from Toronto within framework of policies and limits approved by Board of Directors
• For countries where we operate a branch banking subsidiary, strategy is for it to be substantially self‐funded in the local market
21
2%
43%
3%
30%
1%
10%
8%
3%
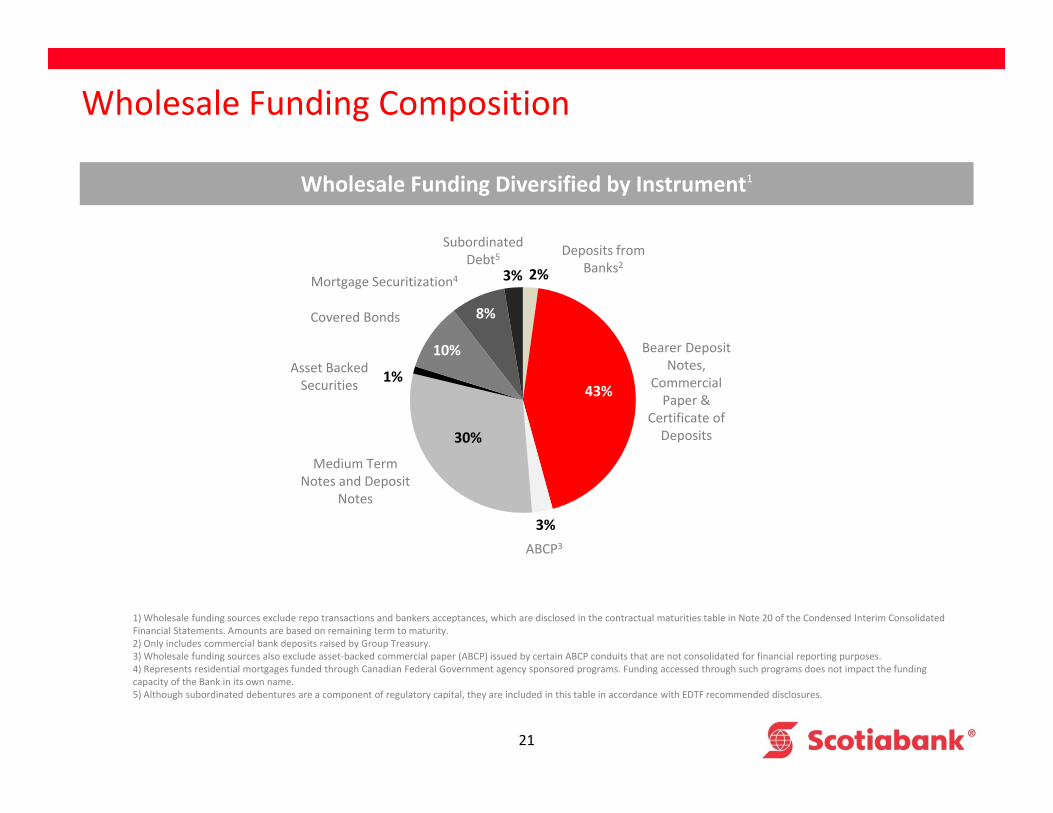
Wholesale Funding Composition
Subordinated Debt5
Mortgage Securitization4
Covered Bonds
Asset Backed Securities
Medium Term Notes and Deposit
Notes
ABCP3
Bearer Deposit Notes,
Commercial Paper &
Certificate of Deposits
Deposits from Banks2
Wholesale Funding Diversified by Instrument1
1) Wholesale funding sources exclude repo transactions and bankers acceptances, which are disclosed in the contractual maturities table in Note 20 of the Condensed Interim Consolidated Financial Statements. Amounts are based on remaining term to maturity.2) Only includes commercial bank deposits raised by Group Treasury.3) Wholesale funding sources also exclude asset‐backed commercial paper (ABCP) issued by certain ABCP conduits that are not consolidated for financial reporting purposes.4) Represents residential mortgages funded through Canadian Federal Government agency sponsored programs. Funding accessed through such programs does not impact the funding capacity of the Bank in its own name.5) Although subordinated debentures are a component of regulatory capital, they are included in this table in accordance with EDTF recommended disclosures.
22
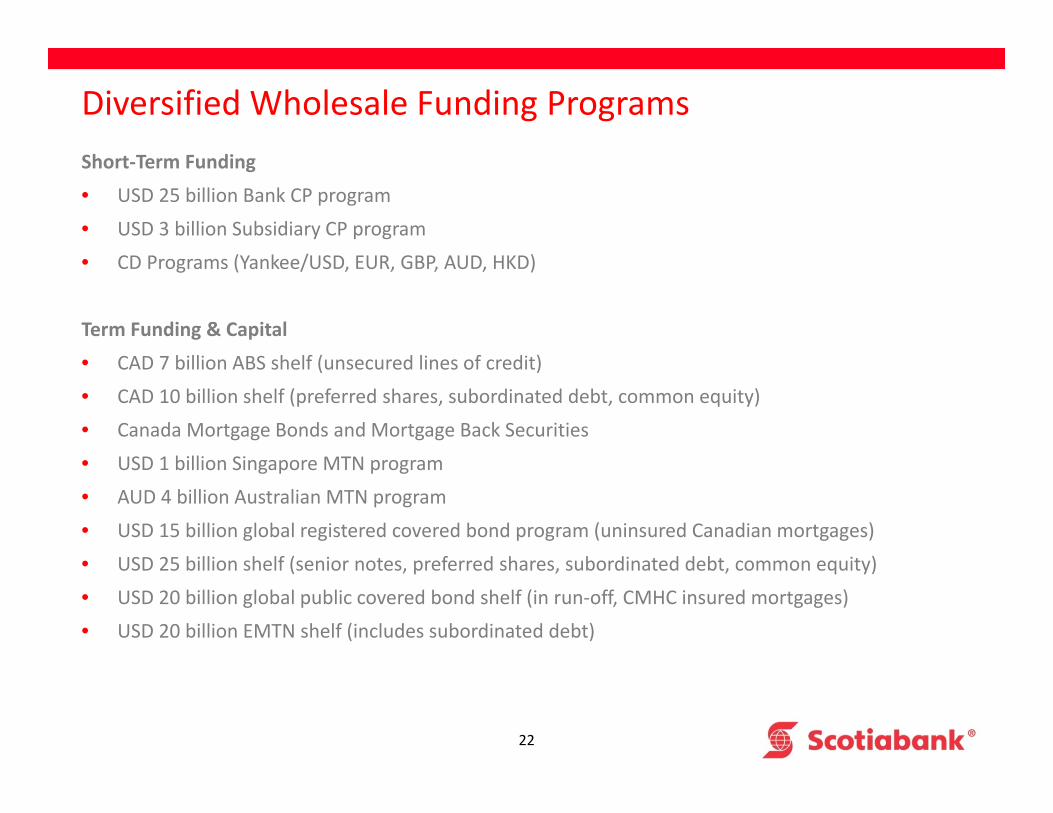
Diversified Wholesale Funding ProgramsShort‐Term Funding
• USD 25 billion Bank CP program
• USD 3 billion Subsidiary CP program
• CD Programs (Yankee/USD, EUR, GBP, AUD, HKD)
Term Funding & Capital
• CAD 7 billion ABS shelf (unsecured lines of credit)
• CAD 10 billion shelf (preferred shares, subordinated debt, common equity)
• Canada Mortgage Bonds and Mortgage Back Securities
• USD 1 billion Singapore MTN program
• AUD 4 billion Australian MTN program
• USD 15 billion global registered covered bond program (uninsured Canadian mortgages)
• USD 25 billion shelf (senior notes, preferred shares, subordinated debt, common equity)
• USD 20 billion global public covered bond shelf (in run‐off, CMHC insured mortgages)
• USD 20 billion EMTN shelf (includes subordinated debt)
23
Contact Information
For additional public information, including our Annual Report and Quarterly Results please visit: http://www.scotiabank.com/investorrelations
Michael LomasManaging Director, Treasury Sales & Market Development, Group Treasury416 866 5734 | [email protected]
Mark MichalskiDirector, Strategy & Market Development, Group Treasury416 866 6905 | [email protected]
Jake LawrenceSenior Vice President, Investor Relations416 866 5712 | [email protected]
24
Appendix 1: Canadian Covered Bonds
25
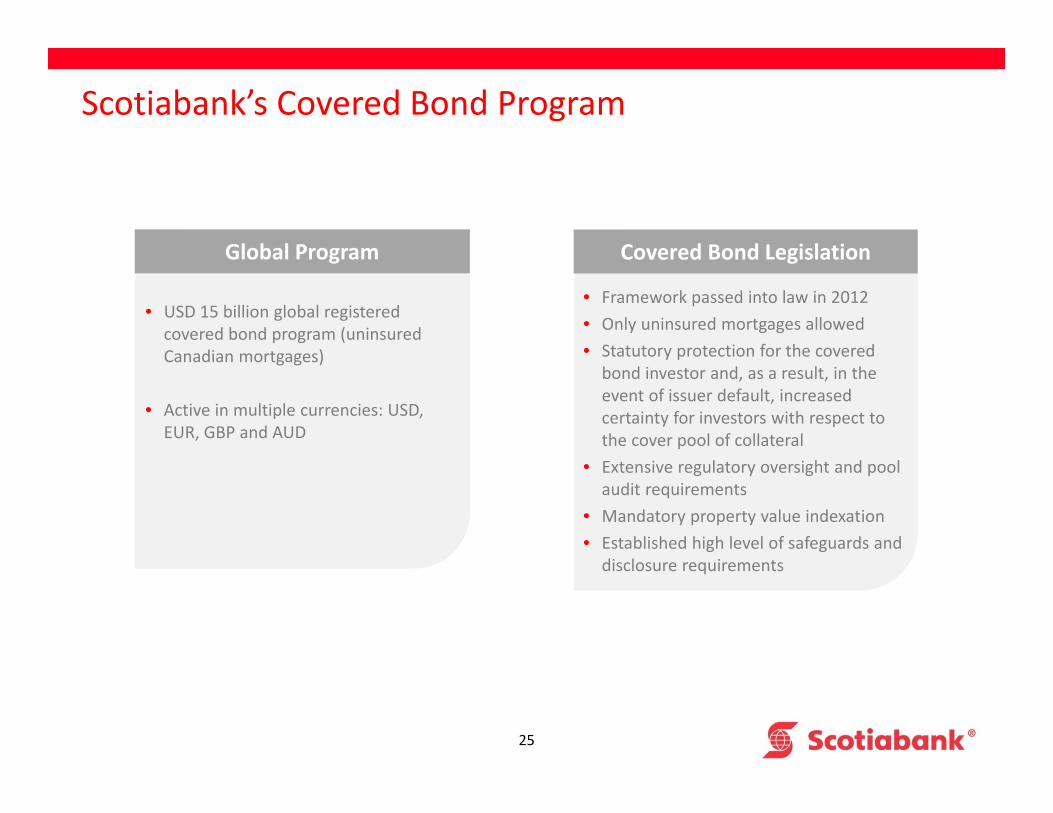
Scotiabank’s Covered Bond Program
Covered Bond Legislation
• Framework passed into law in 2012• Only uninsured mortgages allowed• Statutory protection for the covered bond investor and, as a result, in the event of issuer default, increased certainty for investors with respect to the cover pool of collateral
• Extensive regulatory oversight and pool audit requirements
• Mandatory property value indexation• Established high level of safeguards and disclosure requirements
Global Program
• USD 15 billion global registered covered bond program (uninsured Canadian mortgages)
• Active in multiple currencies: USD, EUR, GBP and AUD
26
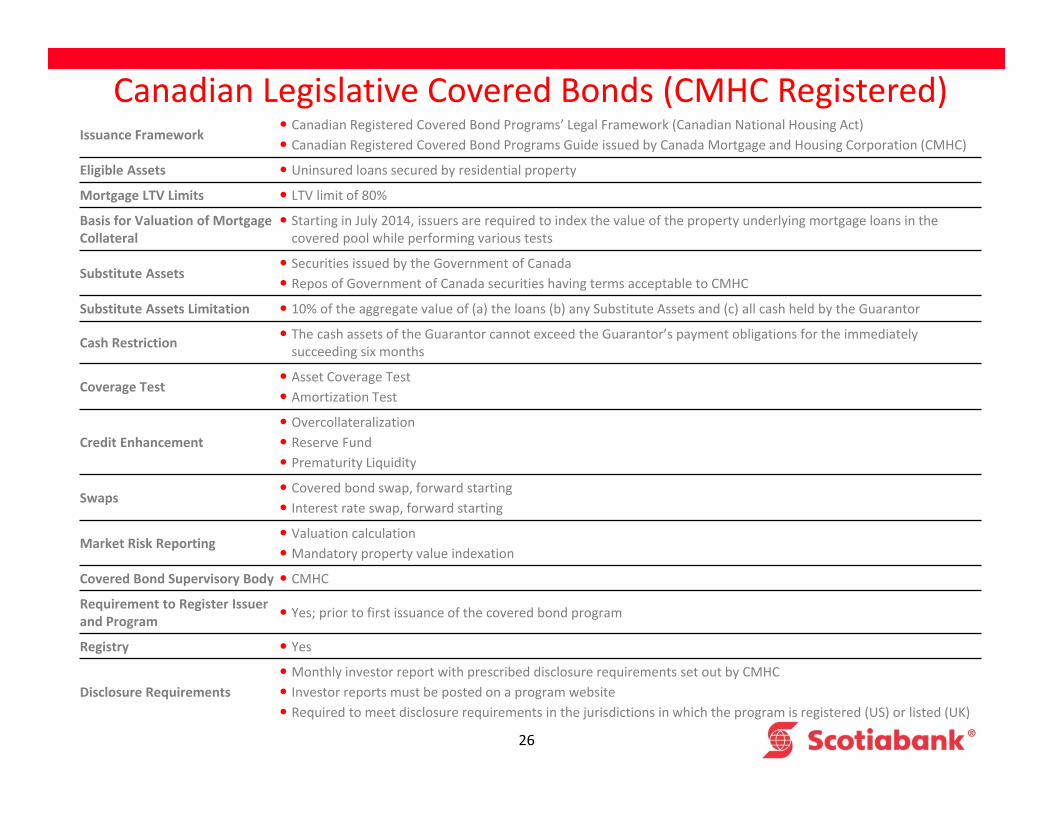
Canadian Legislative Covered Bonds (CMHC Registered)Issuance Framework
Canadian Registered Covered Bond Programs’ Legal Framework (Canadian National Housing Act) Canadian Registered Covered Bond Programs Guide issued by Canada Mortgage and Housing Corporation (CMHC)
Eligible Assets Uninsured loans secured by residential property
Mortgage LTV Limits LTV limit of 80%
Basis for Valuation of Mortgage Collateral
Starting in July 2014, issuers are required to index the value of the property underlying mortgage loans in the covered pool while performing various tests
Substitute Assets Securities issued by the Government of Canada Repos of Government of Canada securities having terms acceptable to CMHC
Substitute Assets Limitation 10% of the aggregate value of (a) the loans (b) any Substitute Assets and (c) all cash held by the Guarantor
Cash Restriction The cash assets of the Guarantor cannot exceed the Guarantor’s payment obligations for the immediately succeeding six months
Coverage Test Asset Coverage Test Amortization Test
Credit Enhancement Overcollateralization Reserve Fund Prematurity Liquidity
Swaps Covered bond swap, forward starting Interest rate swap, forward starting
Market Risk Reporting Valuation calculation Mandatory property value indexation
Covered Bond Supervisory Body CMHC
Requirement to Register Issuer and Program Yes; prior to first issuance of the covered bond program
Registry Yes
Disclosure Requirements Monthly investor report with prescribed disclosure requirements set out by CMHC Investor reports must be posted on a program website Required to meet disclosure requirements in the jurisdictions in which the program is registered (US) or listed (UK)
27
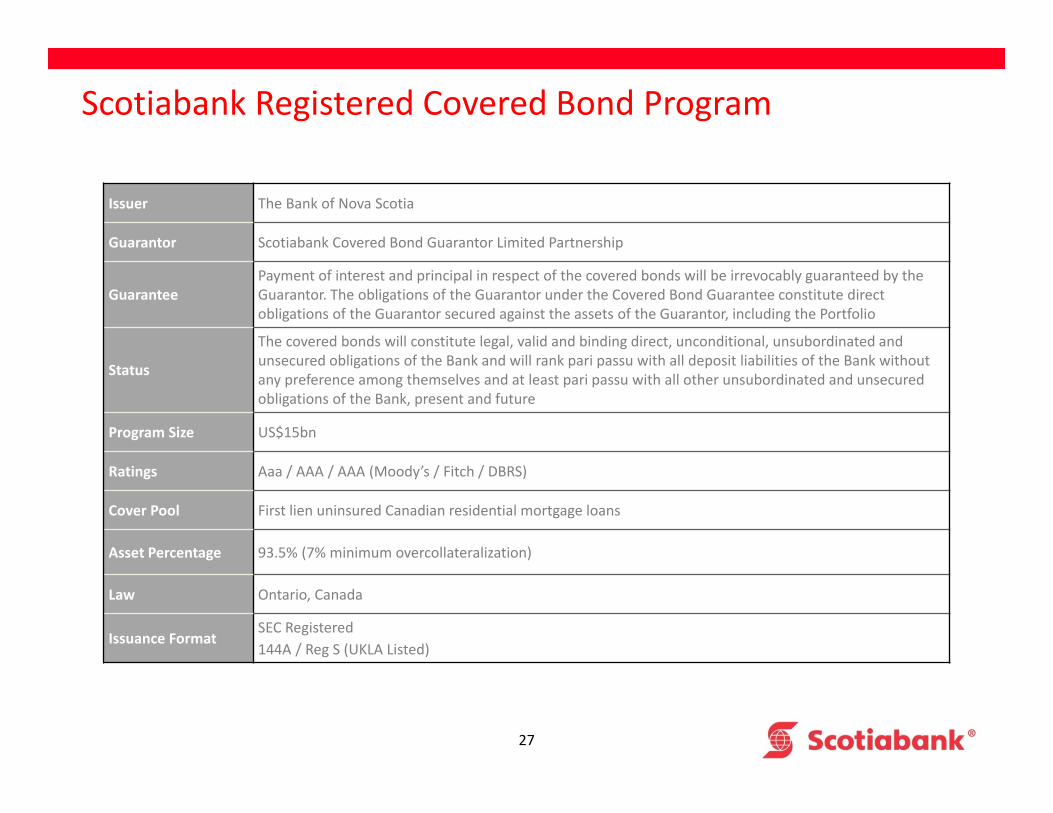
Scotiabank Registered Covered Bond Program
Issuer The Bank of Nova Scotia
Guarantor Scotiabank Covered Bond Guarantor Limited Partnership
GuaranteePayment of interest and principal in respect of the covered bonds will be irrevocably guaranteed by the Guarantor. The obligations of the Guarantor under the Covered Bond Guarantee constitute direct obligations of the Guarantor secured against the assets of the Guarantor, including the Portfolio
Status
The covered bonds will constitute legal, valid and binding direct, unconditional, unsubordinated and unsecured obligations of the Bank and will rank pari passu with all deposit liabilities of the Bank without any preference among themselves and at least pari passu with all other unsubordinated and unsecured obligations of the Bank, present and future
Program Size US$15bn
Ratings Aaa / AAA / AAA (Moody’s / Fitch / DBRS)
Cover Pool First lien uninsured Canadian residential mortgage loans
Asset Percentage 93.5% (7% minimum overcollateralization)
Law Ontario, Canada
Issuance FormatSEC Registered144A / Reg S (UKLA Listed)
28
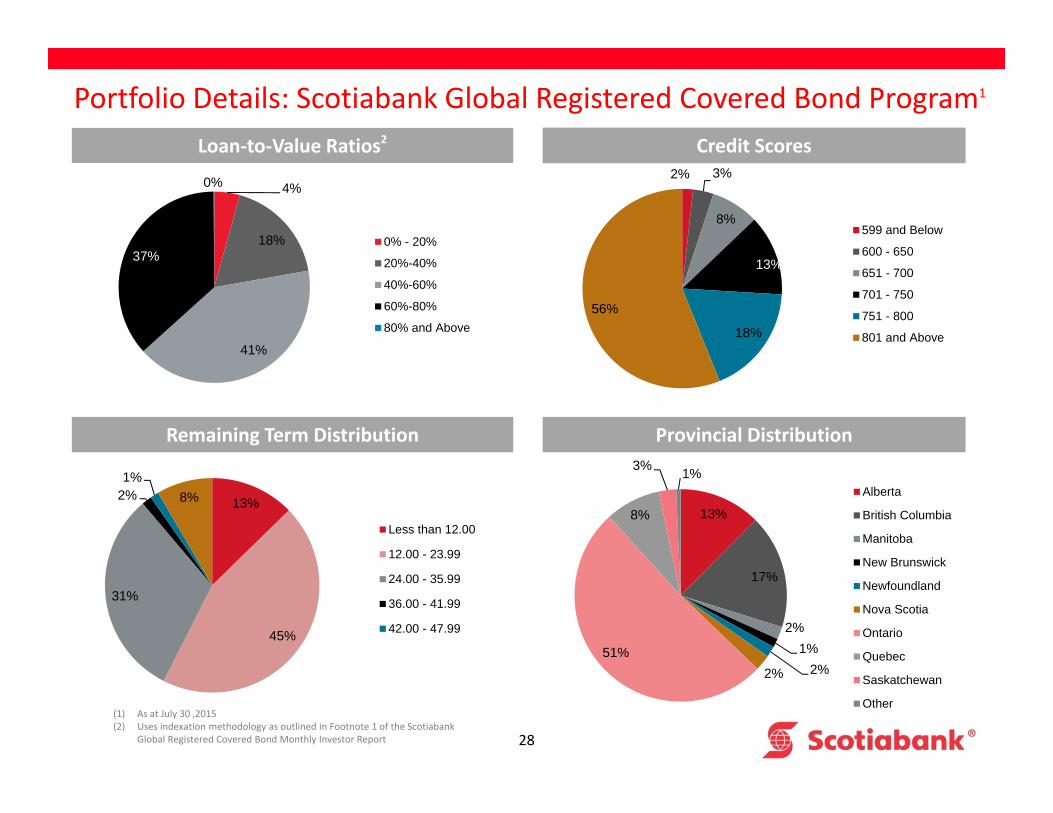
Portfolio Details: Scotiabank Global Registered Covered Bond Program1
(1) As at July 30 ,2015(2) Uses indexation methodology as outlined in Footnote 1 of the Scotiabank
Global Registered Covered Bond Monthly Investor Report
Remaining Term Distribution
Credit ScoresLoan‐to‐Value Ratios2
Provincial Distribution
2% 3%
8%
13%
18%
56%
599 and Below
600 - 650
651 - 700
701 - 750
751 - 800
801 and Above
4%
18%
41%
37%
0%
0% - 20%
20%-40%
40%-60%
60%-80%
80% and Above
13%
45%
31%
2%1%
8%
Less than 12.00
12.00 - 23.99
24.00 - 35.99
36.00 - 41.99
42.00 - 47.99
13%
17%
2%1%
2%2%51%
8%
3% 1%Alberta
British Columbia
Manitoba
New Brunswick
Newfoundland
Nova Scotia
Ontario
Quebec
Saskatchewan
Other
29
Appendix: other
Appendix 2: Additional Housing Information
30
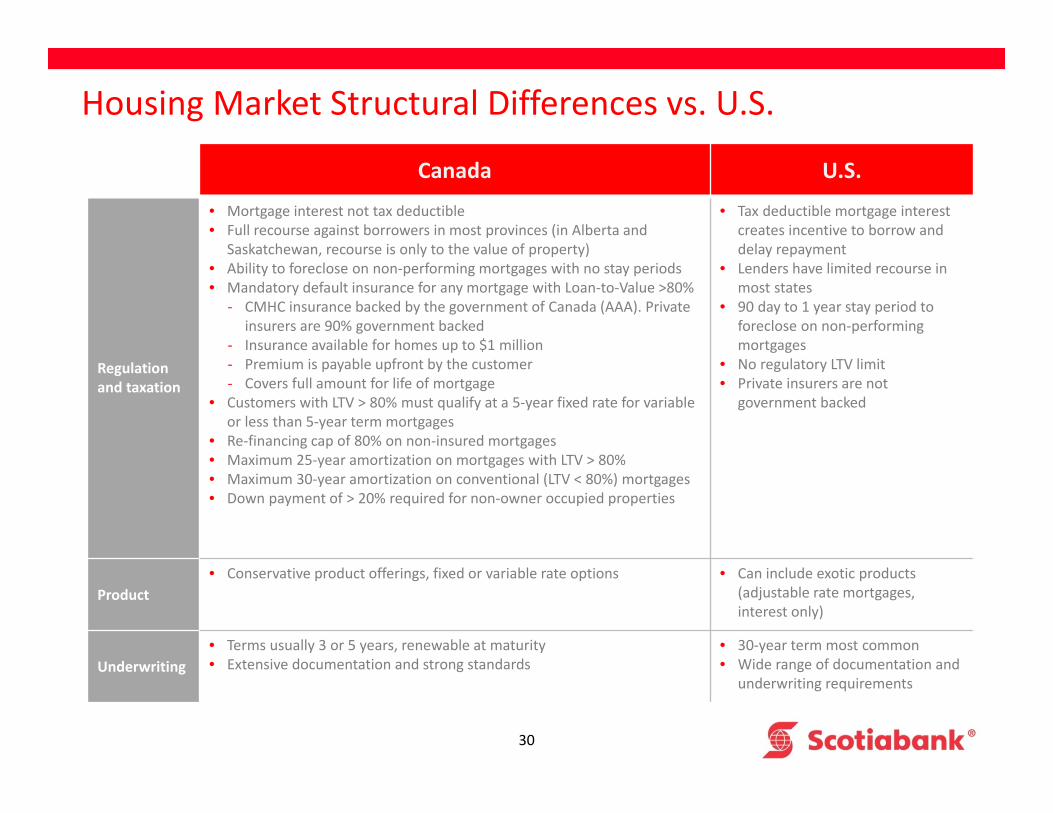
Housing Market Structural Differences vs. U.S.
Canada U.S.
Regulation and taxation
• Mortgage interest not tax deductible• Full recourse against borrowers in most provinces (in Alberta and
Saskatchewan, recourse is only to the value of property)• Ability to foreclose on non‐performing mortgages with no stay periods• Mandatory default insurance for any mortgage with Loan‐to‐Value >80%
‐ CMHC insurance backed by the government of Canada (AAA). Private insurers are 90% government backed
‐ Insurance available for homes up to $1 million‐ Premium is payable upfront by the customer‐ Covers full amount for life of mortgage
• Customers with LTV > 80% must qualify at a 5‐year fixed rate for variable or less than 5‐year term mortgages
• Re‐financing cap of 80% on non‐insured mortgages• Maximum 25‐year amortization on mortgages with LTV > 80%• Maximum 30‐year amortization on conventional (LTV < 80%) mortgages• Down payment of > 20% required for non‐owner occupied properties
• Tax deductible mortgage interest creates incentive to borrow and delay repayment
• Lenders have limited recourse in most states
• 90 day to 1 year stay period to foreclose on non‐performingmortgages
• No regulatory LTV limit• Private insurers are not
government backed
Product• Conservative product offerings, fixed or variable rate options • Can include exotic products
(adjustable rate mortgages, interest only)
Underwriting• Terms usually 3 or 5 years, renewable at maturity• Extensive documentation and strong standards
• 30‐year term most common• Wide range of documentation and
underwriting requirements
31
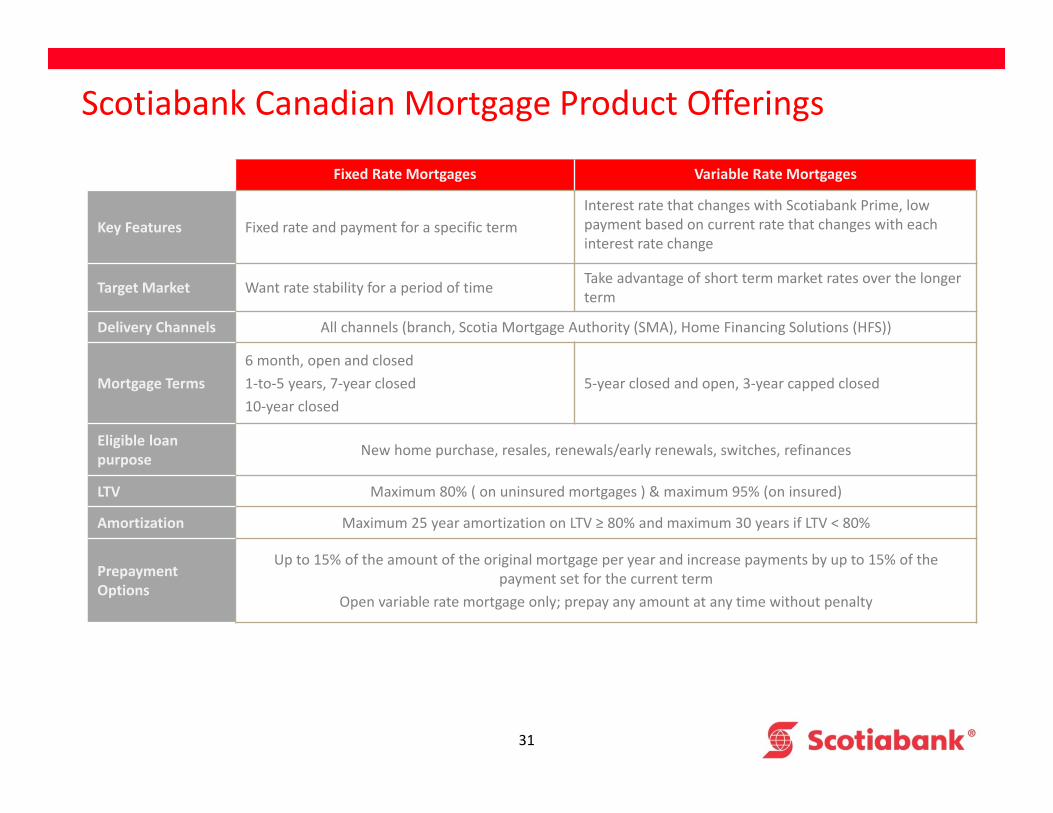
Scotiabank Canadian Mortgage Product Offerings
Fixed Rate Mortgages Variable Rate Mortgages
Key Features Fixed rate and payment for a specific termInterest rate that changes with Scotiabank Prime, low payment based on current rate that changes with each interest rate change
Target Market Want rate stability for a period of time Take advantage of short term market rates over the longer term
Delivery Channels All channels (branch, Scotia Mortgage Authority (SMA), Home Financing Solutions (HFS))
Mortgage Terms6 month, open and closed1‐to‐5 years, 7‐year closed 10‐year closed
5‐year closed and open, 3‐year capped closed
Eligible loan purpose New home purchase, resales, renewals/early renewals, switches, refinances
LTV Maximum 80% ( on uninsured mortgages ) & maximum 95% (on insured)
Amortization Maximum 25 year amortization on LTV ≥ 80% and maximum 30 years if LTV < 80%
Prepayment Options
Up to 15% of the amount of the original mortgage per year and increase payments by up to 15% of the payment set for the current term
Open variable rate mortgage only; prepay any amount at any time without penalty
32
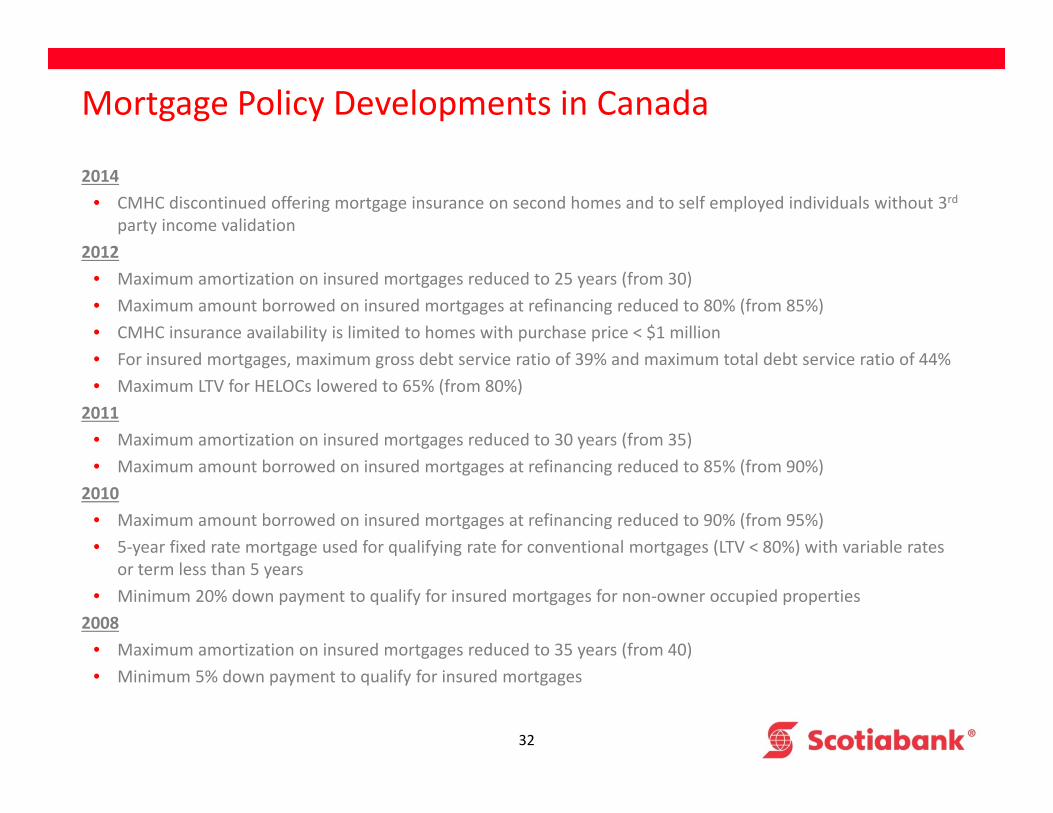
Mortgage Policy Developments in Canada
2014• CMHC discontinued offering mortgage insurance on second homes and to self employed individuals without 3rd
party income validation2012
• Maximum amortization on insured mortgages reduced to 25 years (from 30)• Maximum amount borrowed on insured mortgages at refinancing reduced to 80% (from 85%)• CMHC insurance availability is limited to homes with purchase price < $1 million• For insured mortgages, maximum gross debt service ratio of 39% and maximum total debt service ratio of 44%• Maximum LTV for HELOCs lowered to 65% (from 80%)
2011• Maximum amortization on insured mortgages reduced to 30 years (from 35)• Maximum amount borrowed on insured mortgages at refinancing reduced to 85% (from 90%)
2010• Maximum amount borrowed on insured mortgages at refinancing reduced to 90% (from 95%)• 5‐year fixed rate mortgage used for qualifying rate for conventional mortgages (LTV < 80%) with variable rates
or term less than 5 years• Minimum 20% down payment to qualify for insured mortgages for non‐owner occupied properties
2008• Maximum amortization on insured mortgages reduced to 35 years (from 40)• Minimum 5% down payment to qualify for insured mortgages

33
Appendix 3: Oil and Gas Exposures
3434
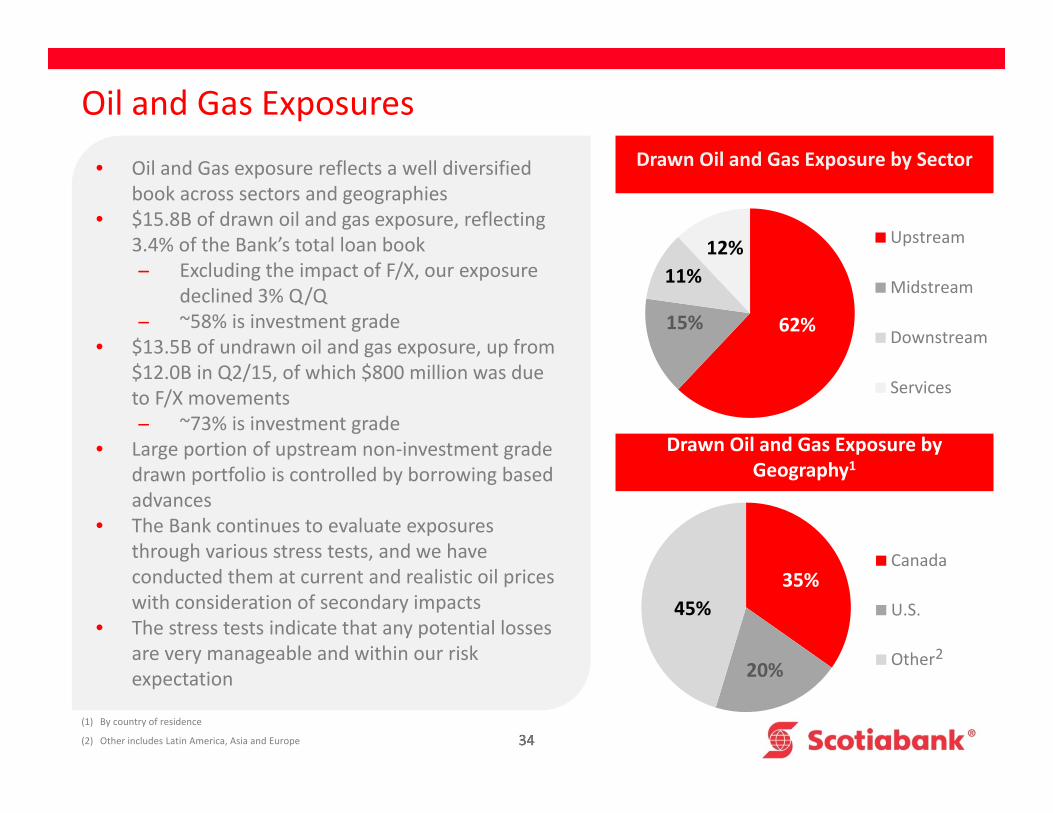
Oil and Gas Exposures
• Oil and Gas exposure reflects a well diversified book across sectors and geographies
• $15.8B of drawn oil and gas exposure, reflecting 3.4% of the Bank’s total loan book̶ Excluding the impact of F/X, our exposure
declined 3% Q/Q̶ ~58% is investment grade
• $13.5B of undrawn oil and gas exposure, up from $12.0B in Q2/15, of which $800 million was due to F/X movements ̶ ~73% is investment grade
• Large portion of upstream non‐investment grade drawn portfolio is controlled by borrowing based advances
• The Bank continues to evaluate exposures through various stress tests, and we have conducted them at current and realistic oil prices with consideration of secondary impacts
• The stress tests indicate that any potential losses are very manageable and within our risk expectation
Drawn Oil and Gas Exposure by Sector
Drawn Oil and Gas Exposure by Geography1
35%
20%
45%
Canada
U.S.
Other
62%15%
11%12% Upstream
Midstream
Downstream
Services
2
(1) By country of residence
(2) Other includes Latin America, Asia and Europe