Embed Size (px)
Citation preview

Third Quarter 2013 Results October 23, 2013

2
Forward looking information
This presentation contains certain forward-looking statements and information relating to CEMEX Latam Holdings, S.A. and its subsidiaries (collectively, “CLH”) that are based on its knowledge of present facts, expectations and projections, circumstances and assumptions about future events. Many factors could cause the actual results, performance or achievements of CLH to be materially different from any future results, performance or achievements that may be expressed or implied by such forward-looking statements, including, among others, changes in general economic, political, governmental, and business conditions globally and in the countries in which CLH and CEMEX, S.A.B. de C.V. and its subsidiaries (“CEMEX”) operate, CLH ability to comply with the framework agreement signed with CEMEX, CEMEX’s ability to comply with the terms and obligations of the facilities agreement entered into with major creditors and other debt agreements, CLH and CEMEX’s ability to achieve anticipated cost savings, changes in interest rates, changes in inflation rates, changes in exchange rates, the cyclical activity of the construction sector generally, changes in cement demand and prices, CLH and CEMEX’s ability to benefit from government economic stimulus plans, changes in raw material and energy prices, changes in business strategy, changes in the prevailing regulatory framework, natural disasters and other unforeseen events and various other factors. Should one or more of these risks or uncertainties materialize, or should underlying assumptions prove incorrect, actual results may vary materially from those described herein as anticipated, believed, estimated, expected or targeted. Forward-looking statements are made as of the date hereof, and CLH does not intend, nor is it obligated, to update these forward-looking statements, whether as a result of new information, future events or otherwise. UNLESS OTHERWISE NOTED, ALL CONSOLIDATED AND COMBINED FIGURES ARE PRESENTED IN DOLLARS AND ARE BASED ON THE FINANCIAL STATEMENTS OF EACH COUNTRY PREPARED UNDER INTERNATIONAL FINANCIAL REPORTING STANDARDS. FOR CONVENIENCE OF THE READER, SELECTED CONSOLIDATED AND COMBINED FINANCIAL INFORMATION FOR THE YEAR 2012 AND THE THIRD QUARTER OF 2012 HAS BEEN
PREPARED ON A PRO FORMA BASIS.
Copyright CEMEX Latam Holdings, S.A. and its subsidiaries.

3
3Q13 results highlights
Operating EBITDA during the third quarter increased by 24%, with net sales growing by 18%, compared to the pro forma 3Q12
Net sales growth in the quarter was driven by higher volumes in most markets and by our commercial initiatives
Operating EBITDA margin expansion was supported by our ongoing optimization of our cost structure, lower maintenance costs and higher volumes
Millions of US dollars 20132012
Proforma% var 2013
2012Proforma
% var
Net sales 1,288 1,192 8% 474 400 18%
Gross profit 668 601 11% 238 197 21%
Operating earnings before other expenses, net
405 355 14% 145 112 29%
Operating EBITDA 474 408 16% 168 135 24%
Operating EBITDA margin 36.8% 34.2% 2.6pp 35.5% 33.8% 1.7pp
Controlling interest net income
238 96
Free cash flow after maintenance capex
232 91
January – September Third Quarter

4
Cost of sales and operating expenses
Cost of sales as a percentage of net sales decreased by 1.0pp during the third quarter mainly due to lower maintenance and fuel costs
Operating expenses as a percentage of net sales declined by 1.5pp during the third quarter driven primarily by lower distribution expenses and the effect on net sales of our housing projects
During the third quarter we reached an alternative fuels substitution rate of 24% in our cement operations; we remain on track to reach our target of 40% substitution by 2015
Our distribution expenses have declined by about US$2 per ton of cement, during the first nine months of 2013, compared to the same period a year ago
Millions of US dollars 20132012
Proforma% var 2013
2012Proforma
% var
Cost of sales 620 591 5% 236 203 16%
as % net sales 48.2% 49.6% (1.4pp) 49.8% 50.8% (1.0pp)
Operating expenses 262 246 7% 93 85 10%
as % net sales 20.4% 20.6% (0.2pp) 19.6% 21.1% (1.5pp)
January – September Third Quarter

9M13 vs. 9M12 3Q13 vs. 3Q12 3Q13 vs. 2Q13Volume 1% 6% (1%)Price (USD) 2% (0%) (1%)Price (l-t-l1) 6% 4% 0%
Volume 5% 15% 10%Price (USD) 6% 5% (0%)Price (l-t-l1) 9% 9% 0%
Volume 6% 15% 14%Price (USD) (1%) (4%) (2%)Price (l-t-l1) 2% 0% (1%)
Aggregates
Domestic gray cement
Ready mix
5
Consolidated volumes and prices
During the third quarter, we reached record volumes in many of our operations driven by the strong level of construction activity in the region
Significant sequential growth in our ready-mix and aggregates volumes in 3Q
In local currency terms, our prices for cement and ready-mix in the third quarter remained stable compared to the second quarter of 2013
1 Like-to-like prices adjusted for foreign-exchange fluctuations

6
Housing Solutions
In Colombia, we are participating as developers in about 5,250 homes under the 100-thousand government-sponsored-free-home program, and 372 units with local governments in rural areas
We are also participating in the construction of more than 400 homes with private developers
Expect to complete the construction of these housing projects early 2014
This initiative allow us to capture additional value along the entire construction process
Our housing projects have high levels of return on capital employed
7
Infrastructure Solutions
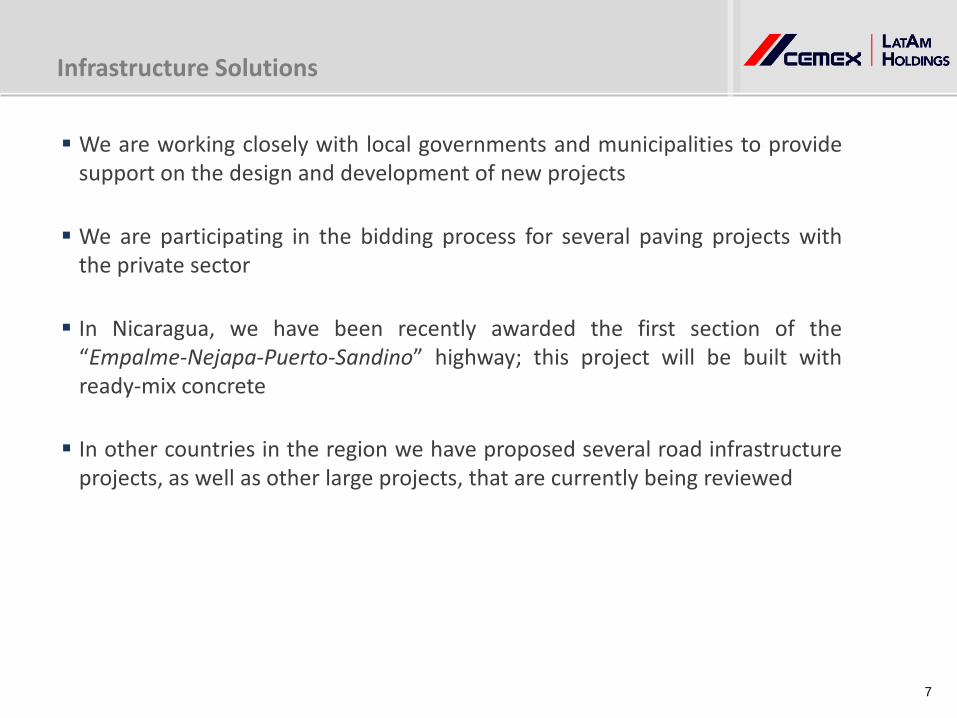
We are working closely with local governments and municipalities to provide support on the design and development of new projects
We are participating in the bidding process for several paving projects with the private sector
In Nicaragua, we have been recently awarded the first section of the “Empalme-Nejapa-Puerto-Sandino” highway; this project will be built with ready-mix concrete
In other countries in the region we have proposed several road infrastructure projects, as well as other large projects, that are currently being reviewed

8
Distribution Channel Solutions
Our Construrama network in Colombia has continued its expansion
In Colombia, we recently reached 200 stores that have agreed to join the Construrama network, including more than 110 stores already in operation
On consolidated basis, by 2015, we expect to reach about 500 stores throughout the region, including our existing network in Nicaragua and Costa Rica
This initiative enhances customer loyalty, strengthens our distribution channel, and promotes formal employment in the sector

Third Quarter 2013 Regional Highlights

Colombia
Strong volume dynamics during the quarter driven by the residential and industrial-and-commercial sectors The residential sector was supported by
the construction of the 100-thousand free-home government program Operating EBITDA margin in 3Q
incorporates results from our housing business, which has high returns but lower margins Adjusting for our housing business,
EBITDA margin in 3Q13 increased significantly compared to last year and to 2Q13 10
Millions of US dollars
Net Sales 735 672 9% 287 230 25%
Op. EBITDA 305 270 13% 115 94 22%
as % net sales 41.5% 40.2% 1.3pp 40.0% 40.9% (0.9pp)
3Q133Q12
Proforma% var 9M13
9M12Proforma
% var
Volume 9M13 vs.
9M123Q13 vs.
3Q123Q13 vs.
2Q13 Cement (1%) 8% 1%Ready mix 9% 15% 13%Aggregates 5% 15% 20%
Price (LC) 9M13 vs.
9M123Q13 vs.
3Q123Q13 vs.
2Q13 Cement 6% 3% 2%Ready mix 9% 7% 1%Aggregates 1% (1%) (1%)

11
Panama
Significant operating EBITDA margin expansion of 4.3pp during 3Q13
Strong volume growth in all three products
Activity in infrastructure was driven by the canal expansion as well as other ongoing projects like Cinta Costera
Residential sector in Panama continued its favorable trend
Millions of US dollars
Net Sales 238 221 7% 84 70 21%
Op. EBITDA 114 98 16% 40 30 33%
as % net sales 47.9% 44.3% 3.6pp 47.1% 42.8% 4.3pp
3Q133Q12
Proforma% var 9M13
9M12Proforma
% var
Volume 9M13 vs.
9M123Q13 vs.
3Q12 3Q13 vs.
2Q13Cement 4% 7% 2%Ready mix (1%) 19% 4%Aggregates 6% 13% (1%)
Price (LC) 9M13 vs.
9M123Q13 vs.
3Q12 3Q13 vs.
2Q13Cement 1% 2% (1%)Ready mix 10% 16% 1%Aggregates 9% 6% 0%

12
Costa Rica
During 3Q13, significant improvement in operating EBITDA margin Cement volumes were supported by
ongoing infrastructure projects, like the Northern Interamerican Highway Positive performance in ready-mix and
aggregates was driven by the industrial-and-commercial sector with several tourism projects, as well as office space and warehouse construction
Millions of US dollars
Net Sales 117 100 18% 40 34 19%
Op. EBITDA 52 40 28% 17 13 29%
as % net sales 44.3% 40.6% 3.7pp 43.1% 39.9% 3.2pp
3Q133Q12
Proforma% var 9M13
9M12Proforma
% var
Volume 9M13 vs.
9M123Q13 vs.
3Q12 3Q13 vs.
2Q13Cement 4% 10% 2%Ready mix (8%) 2% 3%Aggregates (3%) 7% 7%
Price (LC)9M13 vs.
9M123Q13 vs.
3Q12 3Q13 vs.
2Q13Cement 12% 11% 0%Ready mix 16% 18% 3%Aggregates (4%) (3%) (9%)

13
Rest of CLH
Volume performance in 3Q was driven by positive dynamics in Nicaragua and Guatemala In Nicaragua, the infrastructure sector
has continued its positive trend; we also continued with our paving solutions, participating in the road network improvement project “Calles para el Pueblo” In Guatemala, our cement volumes in
3Q were supported by infrastructure projects like the hydroelectric plant Renace II
1 Volume-weighted, local-currency average prices
Millions of US dollars
Net Sales 211 206 2% 65 65 0%
Op. EBITDA 59 56 6% 18 16 14%
as % net sales 28.1% 27.2% 0.9pp 28.0% 24.7% 3.3pp
3Q133Q12
Proforma% var 9M13
9M12Proforma
% var
Volume9M13 vs.
9M123Q13 vs.
3Q12 3Q13 vs.
2Q13Cement 0% 0% (9%)Ready mix 2% 9% (2%)Aggregates 46% 35% (10%)
Price (LC)1 9M13 vs. 9M12
3Q13 vs. 3Q12
3Q13 vs. 2Q13
Cement 6% 4% (1%)Ready mix 9% 8% (3%)Aggregates 17% 10% (8%)

Third Quarter 2013 2013 Outlook

15
2013 guidance
For 2013, total capital expenditures are expected to be US$112 million, US$44 million in maintenance capex and US$68 million in strategic capex
Domestic gray cement Ready mix Aggregates
Volumes Volumes Volumes
Consolidated 3% 9% 9%
Colombia 2% 12% 10%
Panama 3% 2% 3%
Costa Rica 7% 1% 2%

Third Quarter 2013 Appendix

68
256
143 143 143
668
2013 2014 2015 2016 2017 2018
17
Consolidated debt maturity profile
Total debt as of September 30, 2013 US$ 1,424 million
Millions of US dollars
Includes CEMEX Colombia short-term leases

18
Additional information on debt
Variable 41% U.S.
dollar 82%
Third Quarter Third Quarter Second Quarter2013 2012 2013
Total debt 1,424 2,613 1,479Short-term 12% 59% 12%Long-term 88% 41% 88%
Cash and cash equivalents 79 103 68Net debt 1,345 2,510 1,411
Third Quarter Third Quarter Currency Denomination 2013 2012
US Dollar 96% 100%Colombian Peso 4% 0%
Interest rateFixed 82% 90%Variable 18% 10%
Millions of US dollars

19
9M13 volume and price summary: Selected countries
Prices Prices Prices (LC) (LC) (LC)
Colombia (1%) 2% 6% 9% 4% 9% 5% (3%) 1%
Panama 4% 1% 1% (1%) 10% 10% 6% 9% 9%
Costa Rica 4% 13% 12% (8%) 16% 16% (3%) (3%) (4%)
Rest of CLH 0% 1% 6% 2% 6% 9% 46% 11% 17%
Aggregates9M13 vs. 9M12 9M13 vs. 9M12 9M13 vs. 9M12
Domestic gray cement Ready mix
Prices (USD)
VolumesPrices (USD)
VolumesPrices (USD)
Volumes
20
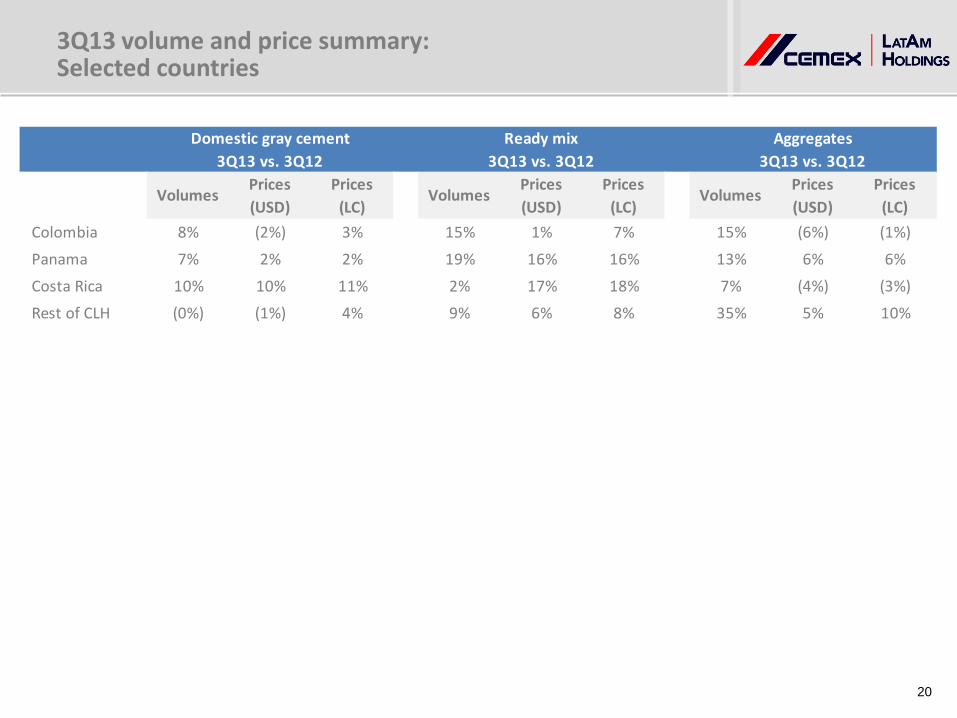
3Q13 volume and price summary: Selected countries
Prices Prices Prices (LC) (LC) (LC)
Colombia 8% (2%) 3% 15% 1% 7% 15% (6%) (1%)
Panama 7% 2% 2% 19% 16% 16% 13% 6% 6%
Costa Rica 10% 10% 11% 2% 17% 18% 7% (4%) (3%)
Rest of CLH (0%) (1%) 4% 9% 6% 8% 35% 5% 10%
Aggregates3Q13 vs. 3Q12
Domestic gray cement 3Q13 vs. 3Q12
Ready mix 3Q13 vs. 3Q12
Prices (USD)
VolumesPrices (USD)
VolumesPrices (USD)
Volumes

21
Definitions
9M13 / 9M12: results for the first nine months of the years 2013 and 2012, respectively.
Cement: When providing cement volume variations, refers to domestic gray cement operations.
LC: Local currency.
Like-to-like percentage variation (l-t-l % var): Percentage variations adjusted for investments/divestments and currency fluctuations.
Maintenance capital expenditures: investments incurred for the purpose of ensuring the company’s operational continuity. These include capital expenditures on projects required to replace obsolete assets or maintain current operational levels, and mandatory capital expenditures, which are projects required to comply with governmental regulations or company policies.
Operating EBITDA: Operating earnings before other expenses, net plus depreciation and operating amortization.
pp: percentage points.
Rest of CLH: includes Brazil, Guatemala, El Salvador and Nicaragua.
Strategic capital expenditures: investments incurred with the purpose of increasing the company’s profitability. These include capital expenditures on projects designed to increase profitability by expanding capacity, and margin improvement capital expenditures, which are projects designed to increase profitability by reducing costs.

22
For convenience of the reader, and in order to present comprehensive comparative operating information for the three and nine-month periods ended September 30, 2013, CLH prepared pro forma selected consolidated income statement information for the three and nine-month periods ended September 30, 2012, intended in all cases and to the extent possible, to present the operating performance of CLH on a like-to-like basis.
Pro forma year-to-date and third quarter 2012: CLH selected consolidated income statement information for the three and nine-month periods ended September 30, 2012, was determined by reflecting the original results of the operating subsidiaries for the three and nine-month periods ended September 30, 2012. In addition, in connection with the 5% corporate charges and royalties agreement entered into by CLH with CEMEX and that was executed during the last quarter of 2012 with retroactive effects for full year 2012, the consolidated pro forma condensed income statement information of CLH for the three and nine-month periods ended September 30, 2012 was adjusted to reflect the 5% consolidated corporate charges and royalties.
Volumes and prices
CLH changes in volumes and prices, presented for convenience of the reader, consider volumes and average prices on a pro forma basis for the three and nine-month periods ended Sep. 30, 2012.
Presentation of pro forma financial information

23
Contact information
Investor Relations
Patricio Treviño Garza Phone: +57(1) 603-9823 E-mail: [email protected]
Stock Information
Colombian Stock Exchange: CLH