Embed Size (px)
Citation preview

Making a Difference in People’s Lives
Third Quarter 2013 Report

Table of Contents
Page
Risk Factors 2
Management’s discussion and analysis of financial condition and results of
operations
3
Glossary 22
Index to financial statements F-1

2
Risk factors
Investing in our Company involves risk. You should carefully consider the discussion of risk factors beginning on page
38 of our Annual Report for the year ended December 31, 2012, which is available on our website. Subsequent to
issuance of such Annual Report, we received a warning letter from the Food and Drug Administration (“FDA”) dated May
24, 2013. See “Other Matters” within Management‟s discussion and analysis of financial condition and results of
operations within this report for further details on the warning letter from the FDA. There have been no material changes
to the risk factors included in such Annual Report. Additional risks and uncertainties not currently known to us or that we
currently deem to be immaterial also may materially adversely affect our business, financial condition or operating results.
3
Management’s discussion and analysis of financial condition and results
of operations
The following Management's Discussion and Analysis of Financial Condition and Results of Operations ("MD&A")
should be read in conjunction with our Condensed Consolidated Financial Statements and related notes beginning on
page F-1 of this report. For additional context with which to understand our financial condition and results of operations,
see the MD&A beginning on page 10 of our Annual Report for the year ended December 31, 2012, as well as the
Consolidated Financial Statements and related notes contained therein (the “2012 Annual Report”). The 2012 Annual
Report is available on our website.
Forward-looking statements
This MD&A and other sections of this report contain "forward-looking statements" as defined by the safe harbor
provisions of the United States Private Securities Litigation Reform Act of 1995. These statements include information
relating to future events, future financial performance, strategies, expectations, competitive environment, regulation and
availability of financial resources. These forward-looking statements may include, without limitation, statements
regarding: the impact of global and local operating economic conditions on our financial results; the anticipated effect of
a new tax on medical devices; the impact of health reform and new regulations on our business and our ability to offset
any related pricing pressures; anticipated seasonal fluctuations in our results of operations; the effect of pending and
future lawsuits, claims, proceedings and investigations, including those relating to environmental regulations, on our
results of operations, cash flows, financial condition or liquidity; expectations regarding the adequacy of our cash and
cash equivalents and other sources of liquidity for ongoing operations; expectations regarding investment plans and
capital expenditures; projections, predictions, expectations, estimates or forecasts as to our business, financial and
operational results and future economic performance; management's goals and objectives; and other similar matters that
are not historical facts. Forward-looking statements should not be read as a guarantee of future performance or results
and will not necessarily be accurate indications of the times at, or by, which such performance or results will be achieved.
Forward-looking statements are based on information available at the time those statements are made and management's
good faith belief as of that time with respect to future events and are subject to risks and uncertainties that could cause
actual performance or results to differ materially from those expressed in or suggested by the forward-looking statements.
We undertake no obligation to publicly update or revise any forward-looking statements, whether as a result of new
information, future events or otherwise. Please consider the disclosure of risk factors beginning on page 38 of the 2012
Annual Report along with page 2 of this Quarterly Report for a discussion of some of these risks and uncertainties.
Presentation of financial information
ConvaTec Healthcare B S.a.r.l. (“CHB”) is a wholly owned subsidiary of ConvaTec Healthcare A S.a.r.l. (the “Parent”).
We are presenting the Condensed Consolidated Financial Statements of CHB in this report. The Parent has no significant
business operations or assets other than investments in CHB. On August 12, 2013, the Parent completed a $900.0 million
Senior Payment-in-kind Notes (“PIK Notes”) offering. As a result of the PIK Notes offering, we are required to present a
summary of the primary financial statement reconciliation differences between CHB and the Parent. Please refer to
“Reconciliation to the Parent’s Financial Statements” within this Quarterly Report for further details.

4
Recent developments
On August 12, 2013, ConvaTec Finance International S.A. (“CFI”), a subsidiary of the Parent and sister entity to CHB,
successfully completed a $900.0 million PIK Notes offering, at an offering price of 99.0%, after adjustment for original
issue discount. The net proceeds from the offering were used to repay preferred equity certificates of the Parent in the
amount of $873.1 million and to pay additional related fees and expenses. The PIK Notes mature on January 15, 2019 and
are subject to cash interest payments of 8.25% every January 15 and July 15, commencing on January 15, 2014. PIK
interest, if cash interest is not elected to be paid, will accrue at 9.00% per annum.
On August 5, 2013, we executed an amendment to the Credit Facilities Agreement. The amendment provides for a
reduction in the applicable margins and floors on the EURIBOR and LIBOR base rates of our EURO and U.S. Dollar
Term Loan Facilities, as well as a reduction of the floor on Alternate Base Rate (“ABR”) borrowings. In addition, the
calculation of the amount available for restricted payments, capital expenditures, investments and prepayments of certain
indebtedness has been modified. The term loan repricing became effective on September 28, 2013 (the “Repricing”). The
outstanding borrowings of both the EURO and U.S. Dollar Term Loan Facilities at the time of the Repricing are subject to
a 1% prepayment premium of the aggregate principal amount, if any voluntary repayments or prepayments are made prior
to March 28, 2014 to refinance, replace or substitute all or a portion of the term loans with indebtedness having a lower
effective yield.
Please refer to “Liquidity and capital resources” within this Quarterly Report for further discussion of these transactions.
Overview
We are a global medical products and technologies company, with leading market positions in ostomy care, wound
therapeutics, continence and critical care, and infusion devices. Our products provide a range of clinical and economic
benefits, including infection prevention, protection of vulnerable skin, improved patient outcomes and reduced total cost
of care.
Ostomy Care. Our Ostomy Care franchise includes devices and accessories for people with an ostomy (a surgically-
created opening or “stoma” where bodily waste is discharged), commonly resulting from colorectal cancer, inflammatory
bowel disease, bladder cancer and other causes.
Wound Therapeutics. Our Wound Therapeutics franchise includes advanced wound dressings and professional skin care
products. These dressings and products are used for the management of acute and chronic wounds, such as those resulting
from traumatic injury, burns, surgery, diabetes, venous disease, immobility and other factors.
Continence and Critical Care. Our Continence and Critical Care (“CCC”) franchise includes devices and products used
in intensive care units and hospital settings. The franchise also includes products for people with continence (urinary and
bowel) issues related to spinal cord injuries, multiple sclerosis, spina bifida, aging and other causes.
Infusion Devices. Our Infusion Devices franchise, previously referred to as Infusion Devices/Industrial Sales, provides
disposable infusion sets to manufacturers of insulin pumps for diabetes and similar pumps used in continuous infusion
treatments for other conditions (e.g., Parkinson‟s disease). In addition, the franchise supplies a range of products to
hospitals and the home healthcare sector.
Key factors influencing our results of operations
Our results of operations have been, can be or will be affected by the following factors.
The economic environment and regulatory reform
Our results of operations are affected not only by global economic conditions but also by local operating and economic
conditions, which can vary substantially by market. Certain macroeconomic events, such as adverse conditions in the
global economy, can have a more wide-ranging and prolonged impact on the general business environment and thus
materially and adversely affects us.

5
The healthcare industry is subject to various government-imposed regulations and cost containment programs, which
could have far reaching impacts on our business. Increasing per capita healthcare consumption in developed markets as a
result of increased longevity, increased incidence of chronic illnesses, defensive medicine and other factors have driven
healthcare reforms in many countries where we sell our products. Combined with a slow recovery from the global
recession and government austerity programs, healthcare reforms have generally been accelerated in an effort to reduce
overall healthcare spending. As a result, there has been an increased emphasis on primary care and prevention as well as
technologies that improve health outcomes, cost effectiveness and the efficiency of care. Payment incentives that reward
“quality of care” rather than “quantity of care” are becoming more common.
In the United States (“U.S.”), reforms mandated by the Affordable Care Act (“ACA”) have, among other things, placed
increased downward pressure on hospital profitability as a result of increased regulation and risk of payment penalties.
This pressure, in turn, could reduce consumption of our products, require us to provide higher evidence of the benefits of
new technologies and create increased group purchasing organization (“GPO”) pricing pressures. Some of these impacts,
like GPO pricing, are spread over several years due to multi-year contracts.
ACA expanded the Competitive Bidding Program for Durable Medical Equipment, Prosthetics, Orthotics and Supplies
(DMEPOS) for medical devices sold in retail settings outside of the hospital. The expansion of this program to most of
the largest metropolitan areas beginning in July 2013 is accelerating consolidation of the retail supplier market. While
ConvaTec device categories are not included in the Competitive Bidding Program, some impact from supplier
consolidation is possible. The ACA has also imposed a 2.3% excise tax on medical device manufacturers‟ domestic sales
beginning January 1, 2013. We believe that many of ConvaTec‟s products meet the “retail exemption” requirements of
the Facts and Circumstances Tests, as outlined in the final rule issued by the Internal Revenue Service (“IRS”) and are,
thus, exempt from the tax. Further, the final rule also defines a “Safe Harbor” for certain classes of devices categorized as
prosthetic devices under the U.S. Social Security Act. We have determined the ostomy products category is included in
the proposed IRS Safe Harbor regulations and is thereby also excluded from the tax.
In the United Kingdom (“U.K.”), decentralization of large portions of the National Health Service (“NHS”) is encouraging
new business and contracting models involving economic decision makers. Reforms creating internal and external market
forces on healthcare delivery, shifting care “closer to home” to less expensive settings and increasing focus on prevention
and management of chronic disease are changing the landscape in which we sell. While the increased focus on quality and
efficiency provides selling opportunities for our products with strong value messages for care providers and prescribers,
this focus has yet to fully filter through to procurement bodies which still largely base decisions solely on price.
Sovereign debt issues and healthcare reforms in certain European countries are triggering government payers to implement
cost cutting measures that result in reduced recognition of brand differences for medical technologies in reimbursement
schemes, reduced consumption, slower uptake of innovations and higher clinical and health economic requirements. Also,
governmental procurement processes in certain countries are shifting away from regional tenders to national tenders. This
shift increases pressure for obtaining contracts and on pricing.
We continue to monitor the potential impact of global economic conditions as well as government healthcare reform and
the related impact on pricing discounts, creditworthiness of our customers and our ability to collect outstanding
receivables from our customers. Currently, we believe the general economic environment will not have a material impact
on our liquidity, cash flow or financial flexibility. Further, we believe our development of enhanced and innovative
product offerings provides customers with strategic business solutions to help improve quality of care, patient outcomes
and total cost of care. We believe that our product offerings are aligned with the current direction of healthcare policies
and, as such, will be viewed positively by healthcare providers.
For further information regarding the potential impact of healthcare reform on our business, please refer to “Risk Factors”.
Innovation and new products
Our business strategy includes development of innovative products that address unmet customer needs and differentiate us
from our competitors. In addition to new product development, our Research and Development (“R&D”) team strives to
optimize the life cycles of innovative products in our existing portfolio by enhancing features and leveraging technologies
6
across our franchises. Looking forward, we remain committed to producing a pipeline of innovative products to continue
to support our growth strategies and may supplement our internal development efforts with targeted scouting initiatives for
innovative late stage or developed products in the relevant areas of our business where we see opportunities for
accelerating commercial growth. Our investment expense in R&D during the three months ended September 30, 2013 and
2012 was $10.0 million and $8.8 million, or 2.3% and 2.2% of sales, respectively. Our investment expense in R&D
during the nine months ended September 30, 2013 and 2012 was $22.9 million and $30.3 million, or 1.8% and 2.6% of
sales, respectively. The split of our R&D expense by franchise changes over time dependent on the quantity, type and
stage of development of projects in the pipeline.
International and foreign exchange
We market our products in more than 100 countries and have 11 manufacturing operations located in eight countries
throughout the world. Due to the global nature of our business, our revenue and expenses are influenced by foreign
exchange movements. Increases or decreases in the value of the U.S. dollar compared to other currencies will affect our
reported results as we translate those currencies into U.S. dollars.
Acquisitions
We may selectively pursue complementary acquisitions that will allow us to expand our scope and scale to further enhance
our product offerings to our customers.
On September 28, 2012, we acquired all of the capital stock of 180 Medical Holdings, Inc. (“180 Medical”), a leading U.S.
distributor of disposable, intermittent urological catheters, for a net cash purchase price of $319.1 million. Of the
consideration paid, $31.6 million was placed in escrow, primarily to satisfy potential future indemnity obligations. The
acquisition strengthens our position in the fast-growing intermittent self-catheterization market.
On June 1, 2012, we acquired all of the capital stock of a U.K.-based company that specializes in accessory products for
ostomy care patients for a net cash purchase price of $10.9 million and funded $0.8 million of contingency escrows. The
acquisition enhances our portfolio of ostomy care products.
On May 1, 2012, we acquired all of the capital stock of a U.S.-based company that specializes in products for the critical
care marketplace and complements our Continence and Critical Care business. We acquired this U.S.-based company for
a net cash purchase price of $6.5 million, inclusive of $0.5 million of contingent consideration. Additionally, we funded
$0.5 million of indemnity escrows.
On March 1, 2012, we acquired all of the capital stock of a U.K.-based company that specializes in the home delivery of
prescribable ostomy care and continence devices. The acquisition complements our existing home delivery services
business. We acquired this U.K.-based company for a net cash purchase price of $34.0 million and funded $0.3 million of
indemnity escrows.
The operating results of each of the respective acquired entities have been included in our consolidated results from the
date they were acquired. Refer to Note 3 – Acquisitions, in our September 30, 2013 Condensed Consolidated Financial
Statements, included herein for further details.

7
Seasonality
The end-use of our products are generally not seasonal in nature because ostomy appliances, wound dressings, hospital
related products and infusion sets are non-elective, chronic related use products that are used on a routine basis by end
users. However, in any given year our sales may be weighted toward a higher percentage in the second half of the year.
We believe this trend may be impacted by the following factors: (i) distributor buy-in prior to the winter holiday season;
(ii) increased purchases from certain U.S. customers and GPOs to achieve certain contractual volume rebates or to use
their allowable allotments under U.S. healthcare programs; (iii) annual discretionary price increases in the U.S. that have
typically been made effective during the fourth quarter of the year, thereby resulting in increased purchases prior to the
effective dates of such increases; and (iv) reimbursement practices impacting purchasing trends such as in Ostomy Care, in
which customers in the U.S. can purchase up to three months of ostomy supplies in one month and customers in Japan are
given vouchers twice a year for the purchase of Ostomy care products.
Results of operations
The following table sets forth our historical net sales and expense items for each of the periods indicated.
(1) Net sales is comprised of sales of our products net of rebates and discounts.
September 30, 2013 September 30, 2012 September 30, 2013 September 30, 2012
Net sales(1) $ 435.8 $ 406.3 $ 1,240.0 $ 1,181.1
Cost of goods sold 186.8 180.7 549.4 538.5
Gross profit 249.0 225.6 690.6 642.6
Selling and marketing expenses 94.3 85.0 278.0 279.5
General and administrative expenses 44.5 68.7 146.0 172.6
Research and development expenses 10.0 8.8 22.9 30.3
Operating income 100.2 63.1 243.7 160.2
Interest expense 113.2 105.0 335.8 315.9
Foreign exchange loss 8.6 3.0 1.9 15.9
Other income, net - (4.6) (1.1) (5.0)
Loss on extinguishment of debt 4.4 - 4.4 -
Loss before income taxes (26.0) (40.3) (97.3) (166.6)
(Benefit) provision for income taxes (1.4) 10.3 11.8 9.8
Net loss $ (24.6) $ (50.6) $ (109.1) $ (176.4)
(in millions of $)
For the Three Months ended For the Nine Months ended

8
Net sales and Operations
Comparison of the three months ended September 30, 2013 and September 30, 2012
Net sales by franchise
We analyze our net sales by franchise. Net sales are comprised of the sales of our products net of returns, sales incentives
and chargebacks. The following table sets forth our historical net sales by franchise for the three months ended September
30, 2013 and 2012. The table also presents the percentage change on a reported and constant exchange rate basis. Net
sales on a constant exchange rate basis is a non-GAAP financial measure and should not be viewed as a replacement of
GAAP results. Such a measure is presented because we believe it enables us to focus on the actual performance related
changes in the results of operations from period to period without the effects of exchange rates.
Ostomy Care net sales
Net sales in our Ostomy Care franchise for the three months ended September 30, 2013 were $152.6 million, a decrease of
$10.4 million, or approximately 6.4%, from $163.0 million for the three months ended September 30, 2012. At a constant
exchange rate, Ostomy Care net sales decreased 5.4% due primarily to destocking by distributors in certain countries that
was partially offset by growth in emerging markets.
Wound Therapeutics net sales
Net sales in our Wound Therapeutics franchise for the three months ended September 30, 2013 were $136.0 million, an
increase of $4.5 million, or approximately 3.4%, from $131.5 million for the three months ended September 30, 2012. At
a constant exchange rate, Wound Therapeutics net sales increased 3.7%. The increase in net sales was primarily fueled by
new products and growth across emerging markets. Increases in net sales were partially offset by pricing strategies in
certain countries.
Continence & Critical Care net sales
Net sales in our CCC franchise for three months ended September 30, 2013 were $77.5 million, an increase of
$28.1 million, or approximately 56.9%, from $49.4 million for the three months ended September 30, 2012. At a constant
exchange rate, CCC net sales increased 57.5%. The increase in net sales was primarily related to incremental net sales
from a U.S.-based acquisition.
Infusion Devices net sales
Net sales in our Infusion Devices franchise, previously referred to as Infusion Devices/Industrial Sales, for the three
months ended September 30, 2013 were $69.7 million, an increase of $7.3 million, or approximately 11.7%, from
$62.4 million for the three months ended September 30, 2012. At a constant exchange rate, Infusion Devices net sales
increased 10.1% primarily due to a customer‟s new product inventory build and growth driven by increased market
demand.
(in millions of $) 2013 2012
As
reported
At constant
exchange rate
Net sales by franchise
Ostomy Care $ 152.6 $ 163.0 -6.4% -5.4%
Wound Therapeutics 136.0 131.5 3.4% 3.7%
Continence & Critical Care 77.5 49.4 56.9% 57.5%
Infusion Devices 69.7 62.4 11.7% 10.1%
Total net sales $ 435.8 $ 406.3 7.3% 7.6%
Three Months ended Percentage change
September 30,

9
Costs and expenses
The following is a summary of costs and expenses.
In our discussion below, we may make mention of certain costs and expenses on a constant exchange rate basis. Costs and
expenses on a constant exchange rate basis is a non-GAAP financial measure and should not be viewed as a replacement
of GAAP results. Such a measure is presented because we believe it enables us to focus on the actual performance related
changes in the results of operations from period to period without the effects of exchange rates.
Operating costs and expenses
Cost of goods sold
Cost of goods sold are primarily comprised of manufacturing and production costs, including raw materials, labor,
overhead and processing costs and any freight costs borne by us in the transport of goods to us from suppliers. Cost of
goods sold for the three months ended September 30, 2013 was $186.8 million, an increase of $6.1 million from $180.7
million for the three months ended September 30, 2012. As a percentage of net sales, Cost of goods sold decreased to
42.9% for the three months ended September 30, 2013 from 44.5% for the three months ended September 30, 2012.
Gross profit (Net sales less Cost of goods sold) increased $23.4 million, or 10.4%, for the quarter and gross profit margin
(Gross profit as a percentage of Net sales) was 57.1% in the three months ended September 30, 2013 as compared with
55.5% for the three months ended September 30, 2012. Gross profit margin excluding impacts from amortization of
certain intangible assets and certain non-recurring costs for the three months ended September 30, 2013 was 64.6%, as
compared with 63.7% in the same prior year period. The improved gross profit margin is primarily related to
manufacturing productivity resulting from benefits realized from executed cost savings initiatives and optimization efforts.
These items were partially offset by pricing pressures.
Selling and marketing
Selling and marketing expenses consisted of advertising, promotion, marketing, sales force, and distribution costs. Selling
and marketing expenses were $94.3 million and $85.0 million for the three months ended September 30, 2013 and 2012,
respectively. As a percentage of net sales, Selling and marketing expenses were 21.6% for the three months ended
September 30, 2013 as compared to 20.9% for the three months ended September 30, 2012. At a constant exchange rate,
Selling and marketing expenses increased $9.9 million as a result of incremental costs from companies acquired in 2012,
as well as additional expenses incurred to invest in and expand our sales force. These increased costs were partially offset
by the benefits realized from past cost savings and productivity initiatives.
(in millions of $) 2013 2012 2013 2012
Operating costs and expenses:
Cost of goods sold $ 186.8 $ 180.7 42.9% 44.5%
Selling and marketing 94.3 85.0 21.6% 20.9%
General and administrative 44.5 68.7 10.2% 16.9%
Research and development 10.0 8.8 2.3% 2.2%
Total operating costs and expenses $ 335.6 $ 343.2 77.0% 84.5%
Other costs and net expenses:
Interest expense $ 113.2 $ 105.0
Foreign exchange loss 8.6 3.0
Other income, net - (4.6)
Loss on extinguishment of debt 4.4 -
(Benefit) provision for income taxes (1.4) 10.3
Three Months ended September 30, Percentage of net sales
10
General and administrative expenses
General and administrative (“G&A”) expenses consisted of executive management, human resources, finance, information
management, legal, facilities and other costs. G&A expenses for the three months ended September 30, 2013 were
$44.5 million, a decrease of $24.2 million, or approximately 35.2%, from $68.7 million for the three months ended
September 30, 2012. As a percentage of net sales, G&A expenses were 10.2% for the three months ended September 30,
2013, compared to 16.9% for the three months ended September 30, 2012. At a constant exchange rate, G&A expenses
decreased $23.7 million. The decrease was primarily the result of severance costs recorded in the third quarter of 2012 in
connection to restructuring actions, coupled with benefits realized from those actions as well as other past cost savings and
productivity initiatives. The decrease in expenses was partially offset by incremental expenses from acquired companies.
Research and development expenses
R&D expenses consisted of product development and enhancement costs incurred within a centralized R&D function.
R&D spending reflects a mix of internal development efforts and in-sourcing initiatives. Internal development efforts may
also include lifecycle management of our existing technologies and products to maximize the value of our strategic
brands. Our R&D expenses for the three months ended September 30, 2013 were $10.0 million, an increase of $1.2
million from $8.8 million for the three months ended September 30, 2012. As a percentage of net sales, R&D expenses
were 2.3% for the three months ended September 30, 2013, compared to 2.2% for the three months ended September 30,
2012.
Other costs and net expenses
Interest expense
Our Interest expense for the three months ended September 30, 2013 was $113.2 million, an increase of $8.2 million from
$105.0 million for the three months ended September 30, 2012. At a constant exchange rate, the compounding effect of
accrued preferred equity certificate (“PEC”) dividends resulted in a year over year increase in interest expense of $4.2
million. Additionally, we incurred $3.7 million of incremental interest expense in connection with the $300.0 million of
additional borrowings used to finance the acquisition of 180 Medical at the end of the third quarter of 2012.
Foreign exchange loss
Foreign exchange loss is comprised of net gains and losses resulting from the re-measurement or settlement of transactions
that are denominated in a currency that is not the functional currency of a transacting company subsidiary. For the three
months ended September 30, 2013, the foreign exchange loss amounted to $8.6 million compared to a foreign exchange
loss of $3.0 million during the three months ended September 30, 2012. The foreign exchange activity during both
comparative periods was primarily driven by intercompany activities, including loans transacted in non-functional
currencies.
Other income, net
Other income represents gains and losses on transactions that are non-operating in nature, including any (gains)/losses on
the sale of businesses or long-lived assets. Other income, net for the three months ended September 30, 2013 was
nominal, while Other income, net for the three months ended September 30, 2012 was $4.6 million. During third quarter
of 2012, we recorded a gain of $4.5 million from the sale of patented technology and related property, plant and equipment
assets.
Loss on extinguishment of debt
During the three months ended September 30, 2013, we recorded a non-cash $4.4 million loss on early extinguishment of
debt, resulting from the refinancing of our term loans completed at the end of the third quarter 2013. The loss was
comprised of a $3.9 million write-off of unamortized deferred financing fees and a $0.5 million write-off of unamortized

11
original issue discount (“OID”). Refer to Note 11 – Long-Term Debt, in our September 30, 2013 Condensed Consolidated
Financial Statements, included herein for further details.
(Benefit) provision for income taxes
During the three months ended September 30, 2013, we recorded a benefit for income taxes of $1.4 million on pre-tax loss
of $26.0 million, while we recorded a provision for income taxes of $10.3 million on a pre-tax book loss of $40.3 million,
during the comparable prior year period. The benefit recorded during the third quarter of 2013 is primarily driven by a
decrease in the deferred tax rate, as a result of a tax law change in the U.K. enacted during the third quarter of 2013,
coupled with an adjustment made to an uncertain tax position, after reaching a favorable settlement with a taxing
authority. These benefits were almost entirely offset by increased profits in certain tax paying jurisdictions, as compared
to the same prior year period.
Net loss
As a result of the above, net loss decreased $26.0 million to a net loss of $24.6 million for the three months ended
September 30, 2013, compared to a net loss of $50.6 million for the three months ended September 30, 2012.
Comparison of the nine months ended September 30, 2013 and September 30, 2012
Net sales by franchise
We analyze our net sales by franchise. Net sales are comprised of the sales of our products net of returns, sales incentives
and chargebacks. The following table sets forth our historical net sales by franchise for the nine months ended September
30, 2013 and 2012. The table also presents the percentage change on a reported and constant exchange rate basis. Net
sales on a constant exchange rate basis is a non-GAAP financial measure and should not be viewed as a replacement of
GAAP results. Such a measure is presented because we believe it enables us to focus on the actual performance related
changes in the results of operations from period to period without the effects of exchange rates.
Ostomy Care net sales
Net sales in our Ostomy Care franchise for the nine months ended September 30, 2013 were $446.8 million, a decrease of
$15.4 million, or approximately 3.3%, from $462.2 million for the nine months ended September 30, 2012. At a constant
exchange rate, Ostomy Care net sales decreased 2.1% due primarily to destocking by distributors in certain countries.
This was partially offset by growth in emerging markets and incremental sales from U.K.-based acquisitions.
Wound Therapeutics net sales
Net sales in our Wound Therapeutics franchise for the nine months ended September 30, 2013 were $380.7 million, an
increase of $6.9 million, or approximately 1.8%, from $373.8 million for the nine months ended September 30, 2012. At a
constant exchange rate, Wound Therapeutics net sales increased 2.5%. The increase in net sales was primarily related to
new product sales and growth in emerging markets. Increases in net sales were partially offset by decreases primarily due
to pricing strategies and austerity measures in certain European countries.
(in millions of $) 2013 2012
As
reported
At constant
exchange rate
Net sales by franchise
Ostomy Care $ 446.8 $ 462.2 -3.3% -2.1%
Wound Therapeutics 380.7 373.8 1.8% 2.5%
Continence & Critical Care 220.8 152.7 44.6% 44.8%
Infusion Devices 191.7 192.4 -0.4% -1.0%
Total net sales $ 1,240.0 $ 1,181.1 5.0% 5.6%
Nine Months ended Percentage change
September 30,
12
Continence & Critical Care net sales
Net sales in our CCC franchise for nine months ended September 30, 2013 were $220.8 million, an increase of
$68.1 million, or approximately 44.6%, from $152.7 million for the nine months ended September 30, 2012. At a constant
exchange rate, CCC net sales increased 44.8%. The increase in net sales was primarily related to incremental net sales
from U.S.-based acquisitions. Net sales growth was partially offset by a decrease in net sales in connection with the May
31, 2012 sale of the Electrodes business.
Infusion Devices net sales
Net sales in our Infusion Devices franchise, previously referred to as Infusion Devices/Industrial Sales, for the nine
months ended September 30, 2013 were $191.7 million, a decrease of $0.7 million, or approximately 0.4%, from
$192.4 million for the nine months ended September 30, 2012. At a constant exchange rate, Infusion Devices net sales
decreased 1.0% primarily due to purchase of safety stock by a customer in the first quarter of 2012 partially offset by
increased market demand.
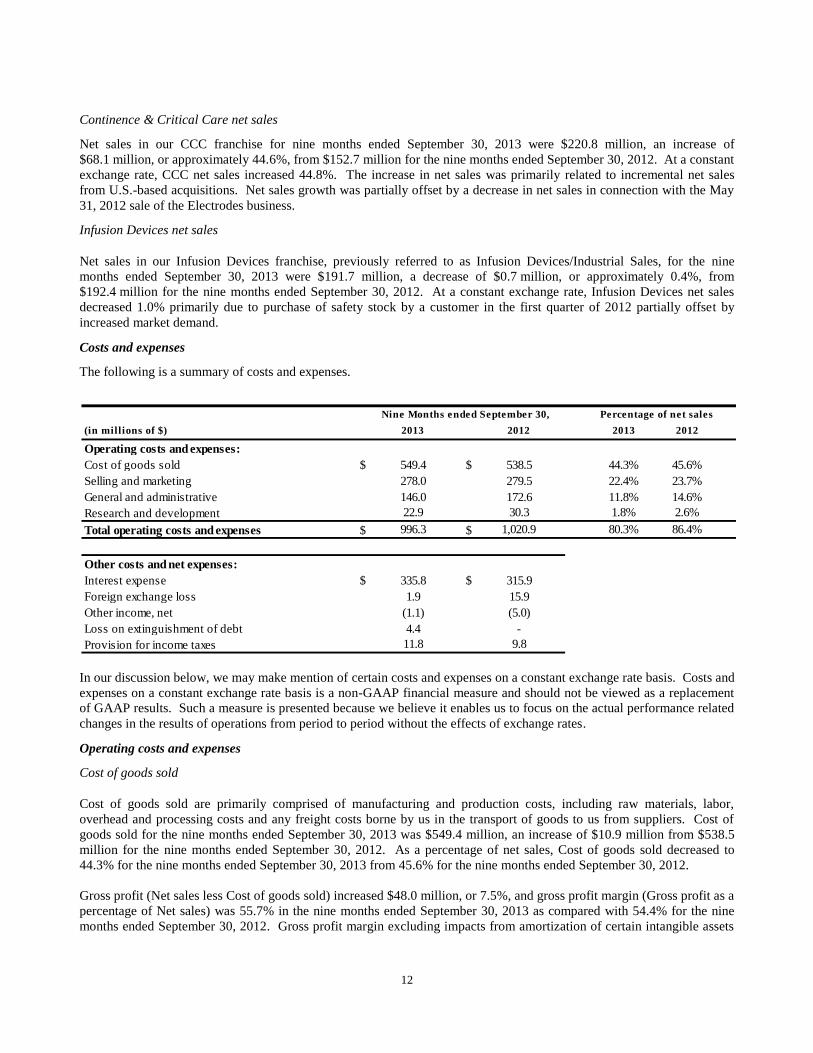
Costs and expenses
The following is a summary of costs and expenses.
In our discussion below, we may make mention of certain costs and expenses on a constant exchange rate basis. Costs and
expenses on a constant exchange rate basis is a non-GAAP financial measure and should not be viewed as a replacement
of GAAP results. Such a measure is presented because we believe it enables us to focus on the actual performance related
changes in the results of operations from period to period without the effects of exchange rates.
Operating costs and expenses
Cost of goods sold
Cost of goods sold are primarily comprised of manufacturing and production costs, including raw materials, labor,
overhead and processing costs and any freight costs borne by us in the transport of goods to us from suppliers. Cost of
goods sold for the nine months ended September 30, 2013 was $549.4 million, an increase of $10.9 million from $538.5
million for the nine months ended September 30, 2012. As a percentage of net sales, Cost of goods sold decreased to
44.3% for the nine months ended September 30, 2013 from 45.6% for the nine months ended September 30, 2012.
Gross profit (Net sales less Cost of goods sold) increased $48.0 million, or 7.5%, and gross profit margin (Gross profit as a
percentage of Net sales) was 55.7% in the nine months ended September 30, 2013 as compared with 54.4% for the nine
months ended September 30, 2012. Gross profit margin excluding impacts from amortization of certain intangible assets
(in millions of $) 2013 2012 2013 2012
Operating costs and expenses:
Cost of goods sold $ 549.4 $ 538.5 44.3% 45.6%
Selling and marketing 278.0 279.5 22.4% 23.7%
General and administrative 146.0 172.6 11.8% 14.6%
Research and development 22.9 30.3 1.8% 2.6%
Total operating costs and expenses $ 996.3 $ 1,020.9 80.3% 86.4%
Other costs and net expenses:
Interest expense $ 335.8 $ 315.9
Foreign exchange loss 1.9 15.9
Other income, net (1.1) (5.0)
Loss on extinguishment of debt 4.4 -
Provision for income taxes 11.8 9.8
Nine Months ended September 30, Percentage of net sales

13
and certain non-recurring costs for the nine months ended September 30, 2013 was 63.6%, as compared with 62.8% in the
same prior year period. The improved gross profit margin is primarily related to manufacturing productivity resulting
from benefits realized from executed cost savings initiatives and optimization efforts. These items were partially offset by
pricing pressures.
Selling and marketing
Selling and marketing expenses consisted of advertising, promotion, marketing, sales force, and distribution costs. Selling
and marketing expenses were $278.0 million and $279.5 million for the nine months ended September 30, 2013 and 2012,
respectively. As a percentage of net sales, Selling and marketing expenses were 22.4% for the nine months ended
September 30, 2013 as compared to 23.7% for the nine months ended September 30, 2012. At a constant exchange rate,
Selling and marketing expenses increased $0.9 million primarily due to incremental expenses from companies acquired in
2012 and added costs from sales force expansion. These increases were almost entirely offset by benefits realized from
executed cost savings and productivity initiatives.
General and administrative expenses
General and administrative (“G&A”) expenses consisted of executive management, human resources, finance, information
management, legal, facilities and other costs. G&A expenses for the nine months ended September 30, 2013 were
$146.0 million, a decrease of $26.6 million, or approximately 15.4%, from $172.6 million for the nine months ended
September 30, 2012. As a percentage of net sales, G&A expenses were 11.8% for the nine months ended September 30,
2013, compared to 14.6% for the nine months ended September 30, 2012. At a constant exchange rate, G&A expenses
decreased $25.4 million. The decrease was primarily the result of severance costs recorded in the third quarter of 2012 in
connection to restructuring actions, coupled with benefits realized from those actions as well as other past cost savings and
productivity initiatives. The decrease in expenses was partially offset by incremental expenses from acquired companies.
Research and development expenses
R&D expenses consisted of product development and enhancement costs incurred within a centralized R&D function.
R&D spending reflects a mix of internal development efforts and in-sourcing initiatives. Internal development efforts may
also include life cycle management of our existing technologies and products to maximize the value of our strategic
brands. Our R&D expenses for the nine months ended September 30, 2013 were $22.9 million, a decrease of $7.4 million
from $30.3 million for the nine months ended September 30, 2012. As a percentage of net sales, R&D expenses were
1.8% for the nine months ended September 30, 2013, compared to 2.6% for the nine months ended September 30, 2012.
At a constant exchange rate, R&D expenses decreased $7.2 million. Decreases in spending for the nine months ended
September 30, 2013, compared to the same prior year period, were primarily related to benefits realized from executed
cost savings and productivity initiatives.
Other costs and net expenses
Interest expense
Our Interest expense for the nine months ended September 30, 2013 was $335.8 million, an increase of $19.9 million from
$315.9 million for the nine months ended September 30, 2012. At a constant exchange rate, the compounding effect of
accrued PEC dividends resulted in a year over year increase in interest expense of $11.9 million. Additionally, we
incurred $11.2 million of incremental interest expense in connection with the $300.0 million of additional borrowings used
to finance the acquisition of 180 Medical at the end of the third quarter of 2012. These increases were partially offset by
lower interest rates on our term loans, as a result of refinancing transactions completed during the third and fourth quarters
of 2012.
Foreign exchange loss
Foreign exchange loss is comprised of net gains and losses resulting from the re-measurement or settlement of transactions
that are denominated in a currency that is not the functional currency of a transacting company subsidiary. For the nine
months ended September 30, 2013, the foreign exchange loss amounted to $1.9 million compared to a foreign exchange

14
loss of $15.9 million during the nine months ended September 30, 2012. The foreign exchange activity during both
comparative periods was primarily driven by intercompany activities, including loans transacted in non-functional
currencies.
Other income, net
Other income represents gains and losses on transactions that are non-operating in nature, including any (gains)/losses on
the sale of businesses or long-lived assets. Other income, net for the nine months ended September 30, 2013 was $1.1
million, while Other income, net for the nine months ended September 30, 2012 was $5.0 million. The gain recorded
during the nine months ended September 30, 2013 primarily related to proceeds received in the first quarter of 2013 as a
result of the demutualization of an insurance company that previously provided insurance coverage for potential product
liabilities. The gain recorded during the nine months ended September 30, 2012 primarily related to the sale of patented
technology and related property, plant and equipment assets.
Loss on extinguishment of debt
During the nine months ended September 30, 2013, we recorded a non-cash $4.4 million loss on early extinguishment of
debt, resulting from the refinancing of our term loans completed at the end of the third quarter 2013. The loss was
comprised of a $3.9 million write-off of unamortized deferred financing fees and a $0.5 million write-off of unamortized
OID. Refer to Note 11 – Long-Term Debt, in our September 30, 2013 Condensed Consolidated Financial Statements,
included herein for further details.
Provision for income taxes
During the nine months ended September 30, 2013, we recorded a provision for income taxes of $11.8 million on pre-tax
loss of $97.3 million, while we recorded a provision for income taxes of $9.8 million on a pre-tax book loss of $166.6
million, during the comparable prior year period. This increase in the income tax provision was primarily driven by a
change in profit mix among jurisdictions carrying varying tax rates. Overall, there was a significant decline in pre-tax
losses as well as an increase in profit in certain tax paying jurisdictions. Partially offsetting the increase in income tax
were benefits recorded during the third quarter of 2013. Third quarter 2013 benefits primarily resulted from a decrease in
the deferred tax rate, due to a tax law change in the U.K. enacted during the quarter and an adjustment made to an
uncertain tax position, after reaching a favorable settlement with a taxing authority. No such benefits were recorded
during the comparable year-to-date period in 2012.
Net loss
As a result of the above, net loss decreased $67.3 million to a net loss of $109.1 million for the nine months ended
September 30, 2013, compared to a net loss of $176.4 million for the nine months ended September 30, 2012.

15
EBITDA and Adjusted EBITDA
We believe that EBITDA (“Earnings before Interest, Taxes, Depreciation and Amortization”) and Adjusted EBITDA
(Adjusted to exclude income and expense items that are non-recurring in nature) are useful indicators of our ability to
incur and service our indebtedness and can assist investors and other parties to evaluate us. It should be noted that our
definition of EBITDA and Adjusted EBITDA may not be comparable to similar measures disclosed by other companies.
We believe that Adjusted EBITDA as a supplementary non-GAAP financial measure may be used to meaningfully
evaluate a company‟s future operating performance and cash flow. In addition, Management also uses EBITDA and
Adjusted EBITDA to assess and measure our recurring operating performance. Accordingly, this information has been
disclosed to permit a more complete and comprehensive analysis of our operating performance, consistent with how our
business performance is evaluated by Management.
We define EBITDA as the net (loss) earnings for the respective period before (benefit) provision for income taxes, other
expense (income), net, foreign exchange (gain) loss, interest expense, and depreciation and amortization. Adjusted
EBITDA represents EBITDA as adjusted (i) to include realized foreign exchange gains or losses and (ii) to exclude costs
or gains that are considered by management to be non-recurring in nature and other non-cash and unusual items. Any such
excluded costs or gains in deriving Adjusted EBITDA are not considered by management to be reflective of the on-going
performance of the business. EBITDA and Adjusted EBITDA are not measurements of financial performance under
GAAP, are not audited and should not replace measures of liquidity or operating profit that are derived in accordance with
GAAP. The following table reconciles net loss to EBITDA and provides a further reconciliation of EBITDA to Adjusted
EBITDA for the three and nine months ended September 30, 2013 and 2012.
(a) Represents costs incurred that are related to the integration of Unomedical, primarily systems related.
(b) Represents transactions/items that are non-recurring or unusual in nature and are not reflective of the normal
operating performance in the business. Such activity is excluded from EBITDA to derive Adjusted EBITDA, which
is our profit measure. Amounts in 2013 and 2012 include, but are not limited to, the following expense or income
items: (i) transaction costs in connection with business development and financing activities, (ii) restructuring
expenses and (iii) asset impairments.
(in millions of $)
Net loss $ $ $ $
(Benefit) provision for income taxes
Loss on extinguishment of debt
Other income, net
Foreign exchange loss
Interest expense
Depreciation and amortization
EBITDA $ $ $ $
Adjustments:
Integration-related costs (a)
Other(b)
Total adjustments
Realized foreign exchange (loss) gain
Adjusted EBITDA(1) $ $ $ $
4.4 - 4.4 -
(0.3)(2)
4.5 (2.4)(2)
5.6
146.7 108.2 384.5 293.1
- 2.2 - 3.7
148.9 139.8 393.3 340.5
2.5 24.9 11.2 38.1
2.5 27.1 11.2 41.8
113.2 105.0 335.8 315.9
46.5 45.1 140.8 132.9
- (4.6) (1.1) (5.0)
8.6 3.0 1.9 15.9
(24.6) (50.6) (109.1) (176.4)
(1.4) 10.3 11.8 9.8
Three Months Ended September 30, Nine Months Ended September 30,
2013 2012 2013 2012
(1) In September 2011, we acquired Latin American distributor BMD. Until the value of BMD acquired inventory was sold through to third party customers, our
profit margin on the sale of inventory was lower than the normal margin on inventory sales. The BMD acquired inventory was sold through by the end of the
first quarter of 2012. The gross margins recognized on acquired inventory from the acquisition date through the end of the first quarter 2012 reflect the spread between the price we sold to BMD as an intermediary distributor and the consumer sales price. Accordingly, the gross profit and EBITDA in 2012 were lower
than a normal profit margin on inventory sales by $3.7 million. Beginning in the second quarter of 2012, the gross margins on inventory sales reflected the
spread between our manufactured cost and the consumer sales price.
(2) In connection with our third quarter 2013 repricing transaction, we realized a $1.4 million foreign exchange loss that was excluded from the above calculation
of Adjusted EBITDA.

16
Liquidity and capital resources
As of September 30, 2013 and December 31, 2012, our cash and cash equivalents were $240.6 million and $129.4 million,
respectively. Additionally, as of September 30, 2013, we had $249.2 million of availability under the Revolving Credit
Facility. We believe that our business has strong cash flow generation characteristics. Our strengths include the recurring,
non-discretionary nature of our products, our diverse product offering and geographic footprint, and our strong market
positions of our leading brands. We believe that for at least the next 12 months our existing cash on hand, combined with
our operating cash flow and available borrowings under the Credit Facilities will provide sufficient liquidity to fund our
operations, debt service obligations, working capital and capital expenditure requirements, as well as future investment
opportunities.
Historically, the non-elective nature of our product offerings has resulted in significant recurring cash inflows. A principal
use of our operating cash has been to make interest payments on our long-term debt. For the nine months ended
September 30, 2013 and 2012, we generated net cash flows from operating activities, net of interest payments, of $185.7
million and $121.1 million, respectively. Total interest payments were $129.9 million and $124.2 million for the nine
months ended September 30, 2013 and 2012, respectively.
Financing and Financing Capacity
On August 12, 2013, CFI, a subsidiary of the Parent and sister entity to CHB, successfully completed a $900.0 million PIK
Notes offering, at an offering price of 99.0%, after adjustment for original issue discount. The net proceeds from the
offering were used to repay preferred equity certificates (“PECs”) of the Parent in the amount of $873.1 million and to pay
additional related fees and expenses. The PIK Notes mature on January 15, 2019 and are subject to cash interest payments
of 8.25% every January 15 and July 15, commencing on January 15, 2014. PIK interest, if cash interest is not elected to
be paid, will accrue at 9.00% per annum. All interest owed will be paid by CFI directly to the holders of the PIK Notes.
The PIK Notes are recorded on the balance sheet of CFI, whose financial information is ultimately consolidated by the
Parent. The PIK Notes are non-recourse to CHB and thus exclusively the obligation of the Parent.
In order to fund CFI‟s interest expense on the PIK Notes, it is anticipated that CHB will fund semi-annual cash interest
payments equal to the cash interest owed by CFI to the holders of the PIK Note. Such funding will be to the extent
permitted by our restricted payment capacity, a specified leverage ratio and other provisions outlined in our debt
agreements. The cash interest payments are incremental to the interest due on our long term debt and will reduce our
operating cash flows going forward. The timing of CHB‟s cash interest payments will also be on January 15 and July 15,
commencing on January 15, 2014. However, since the PIK Notes are not recorded on CHB‟s consolidated balance sheet,
the amount of the cash interest paid by CHB will instead reduce the equivalent amount of accrued PEC dividends on
CHB‟s consolidated balance sheet. As of September 30, 2013, the current portion of accrued PEC dividends on CHB‟s
consolidated balance sheet and the amount of accrued interest on the PIK Notes on the consolidated balance sheet of the
Parent was $10.1 million. For further information regarding the differences between the consolidated financial statements
of CHB and the Parent, please refer to the “Reconciliation to the Parent‟s Financial Statements” within this Quarterly
Report.
Our long term debt consists of Secured Notes and Senior Notes and the Credit Facilities Agreement (the “Credit
Facilities”), as amended during the third quarter of 2013. Refer to Note 11 – Long Term Debt and the discussion below
for additional details regarding the amendment and the repricing of our Term Loan Facilities. As of September 30, 2013,
we had total debt outstanding, excluding capital leases and other obligations, of $2,942.9 million, net of $4.6 million of
unamortized original issue discount.
As of September 30, 2013, borrowings outstanding under the Secured Notes, due 2017, were EUR 300.0 million ($405.8
million) and borrowings outstanding under the Senior Notes, due 2018, were $745.0 million and EUR 250.0 million
($338.1 million). Borrowings under the Secured Notes bear interest of 7.375% per annum. Borrowings under the U.S.
Dollar Senior Notes bear interest of 10.5% per annum, while the Euro Senior Notes bear interest of 10.875%, per annum.
Interest is payable on both the Secured Notes and Senior Notes on June 15 and December 15 of each year. The Secured
Notes and Senior Notes may be prepaid and are subject to a premium if payment is made prior to December 15, 2015.

17
The Credit Facilities consist of (i) U.S Dollar and EURO term loans (the “Term Loan Facilities”) due 2016, (ii) a
revolving credit facility due 2015 (the “Revolving Credit Facility”), (iii) and incremental unfunded term facilities (the
“Incremental Term Facilities”).
On August 5, 2013, we executed an amendment to our Credit Facilities Agreement. The amendment provides for a
reduction in the applicable margins and floors on the EURIBOR and LIBOR base rates of our EURO and U.S. Dollar
Term Loan Facilities, as well as a reduction of the floor on Alternate Base Rate (“ABR”) borrowings. In addition, the
calculation of the amount available for restricted payments, capital expenditures, investments and prepayments of certain
indebtedness have been modified. The repricing of the term loans became effective on September 28, 2013 (“the
Repricing”). The details regarding the changes in each of the applicable interest rates are discussed further below. The
outstanding borrowings of both the EURO and U.S. Dollar Term Loan Facilities at the time of the Repricing are subject to
a 1% prepayment premium of the aggregate principal amount, if any voluntary repayments or prepayments are made prior
to March 28, 2014 to refinance, replace or substitute all or a portion of the Term Loan Facilities.
Total borrowings outstanding under the Term Loan Facilities denominated in U.S. Dollars and Euros were $804.0 million
and EUR 483.9 million ($654.6 million), respectively as of September 30, 2013. The Term Loan Facilities are payable in
equal quarterly installments in an aggregate annual amount equal to approximately 1% of the original principal amount of
the Term Loan Facilities. However, as a result of mandatory prepayments discussed further below, no quarterly
installment payments are due until the Term Loan Facilities mature on December 22, 2016.
The Revolving Credit Facility of $250.0 million is available through its maturity date in certain currencies at the
borrower‟s option and is used to provide for ongoing working capital requirements, letters of credit, and for our general
corporate purposes. The Revolving Credit Facility also allows for up to $40.0 million letters of credit issuances as well as
$25.0 million for same-day borrowings, referred to as swingline loans. There were no borrowings outstanding under the
Revolving Credit Facility at September 30, 2013. Letters of credit outstanding under the Revolving Credit Facility totaled
approximately $0.8 million. As of September 30, 2013, we had $249.2 million of availability under the Revolving Credit
Facility.
The Incremental Term Facilities are unfunded commitments and are available in an amount up to $400.0 million (net of
any issuance of secured notes issued) in either U.S. Dollars and/or Euros provided that a certain leverage ratio is not
exceeded and we satisfy certain requirements, including: no default or event of default, pro forma compliance with
financial covenants, minimum borrowing amounts of $15.0 million and a maturity date and weighted average life-to-
maturity of each individual loan within the Incremental Term Facilities that is greater than the weighted average maturity
date of the Term Loan Facilities. Additionally, should the yield on the Incremental Term Facilities exceed the yield on the
Term Loans Facilities by more than 0.50%, then the yield on the Term Loan Facilities will automatically increase such
that the yield on the Incremental Term Facilities shall be 0.50% below the yield on the Term Loan Facilities. There were
no amounts funded or drawn under the amended Incremental Term Facilities as of September 30, 2013.
Borrowings and commitments under the Credit Facilities, including the Term Loan Facilities, are subject to full or partial
mandatory prepayments from the proceeds of asset sales above a specified threshold, the issuance or incurrence of debt
and from excess cash flow retained in the business. The amount and timing of the mandatory prepayments are subject to
certain criteria. During the second quarters of 2013 and 2012, we made mandatory prepayments of $45.1 million and
$23.9 million, respectively, for excess cash retained in the business. Both the 2013 and 2012 mandatory prepayments
were applied against the remaining quarterly installments due under the Term Loan Facilities, in accordance with the
terms outlined in the Credit Facilities Agreement.
Borrowings under the Credit Facilities Agreement bear interest at either a Euro (EURIBOR) or U.S. Dollar (LIBOR) base
rate, or Alternate Base Rate (“ABR”). EURIBOR interest is associated with the EUR borrowings; LIBOR interest is
associated with U.S. Dollar borrowings, while ABR, EURIBOR or LIBOR interest rates may apply to outstanding
borrowings under the Revolving Credit Facility. ABR, as defined and amended in the Credit Facilities Agreement, is the
greater of (a) the Prime Rate, (b) the Federal Funds Effective Rate plus 0.50% or (c) the Eurodollar Rate for a one-month
interest period plus 1.00%. ABR is subject to an initial margin of 3.25% on borrowings under the Revolving Credit
Facility and 2.00% on Dollar Term Loan ABR borrowings. Additionally, at no time can the ABR be less than 2.00% per
annum. As a result of the Repricing, EURIBOR and LIBOR borrowings are subject to an initial margin of 3.25% and

18
3.00%, respectively, and a floor of 1.00%. The margins on our EURIBOR and LIBOR interest rates may increase by 25
basis points if there is a decline in our corporate credit rating.
Under the original terms of the Credit Facilities Agreement, the margin on both EURIBOR and LIBOR loans was 4.25%,
subject to a floor of 1.50% to 1.75% on EURIBOR loans and a floor of 1.50% on LIBOR loans. In the third quarter and
fourth quarters of 2012, we refinanced both the EURO and U.S. Dollar Term Loan Facilities, whereby the margin on the
EURIBOR and LIBOR borrowings was reduced to 4.00% and 3.75%, respectively. The floor was also reduced to 1.25%
for both EURIBOR and LIBOR borrowings. Our borrowing arrangements contain a number of financial and non-financial
covenants. We were in compliance with all covenants as of September 30, 2013.
Cash flows
The following table sets forth consolidated cash flow data for the nine months ended September 30, 2013 and 2012:
Cash flows from operating activities
Net cash provided by operating activities was $185.7 million and $121.1 million for the nine months ended September 30,
2013 and 2012, respectively. The $64.6 million increase in our operating cash flows was driven by increased cash flows
from acquisitions and continued benefits from the savings achieved from focused productivity and cost control measures.
In addition, during 2012 there was incremental spend related to business restructuring actions, while there has been
minimal restructuring activity during the first nine months of 2013. The increase in cash from operations was partially
offset by working capital changes, primarily related to increased inventory build.
Cash flows from investing activities
For the nine months ended September 30, 2013 and 2012, net cash used in investing activities was $19.8 million and
$393.6 million, respectively. The decrease in cash used in investing activities was primarily due to the fact that we
completed multiple acquisitions during the first nine months of 2012, while none were completed during the first nine
months of 2013. The most significant of the 2012 acquisitions was 180 Medical, which was acquired on September 28,
2012 for a net cash purchase price of $318.1 million, prior to the $1.0 million working capital adjustment. In addition,
timing of capital expenditures further contributed to the decrease in cash used during the first nine months of 2013 versus
the comparative prior year period.
(in millions of $) 2013 2012
Net cash provided by operating activities $ 185.7 121.1
Net cash used in investing activities (19.8) (393.6)
Net cash (used in) provided by financing activities (53.0) 263.2
Effect of exchange rate changes on cash and cash equivalents (1.7) 1.7
Net change in cash and cash equivalents 111.2 (7.6)
Cash and cash equivalents at beginning of period 129.4 81.5
Cash and cash equivalents at end of period $ 240.6 73.9
Supplemental cash flow information
Income taxes paid $ 6.1 $ 8.2
Interest paid $ 129.9 $ 124.2
For the Nine Months ended
September 30,

19
Cash flows from financing activities
Net cash used in financing activities was $53.0 million for the nine months ended September 30, 2013 versus net cash
provided by financing activities of $263.2 million, in the comparative prior year period. The net cash used during the nine
months ended September 30, 2013 was primarily related to a $45.1 million mandatory prepayment we made on our Term
Loan Facilities for excess cash flow retained in the business, coupled with $8.0 million of deferred financing fees paid to
refinance our term loans and amend our Credit Facilities Agreement. Net cash provided by financing activities for the
nine months ended September 30, 2012 primarily resulted from the issuance of a $299.2 million term loan, after
adjustment for original issue discount, to finance the acquisition of 180 Medical. These cash proceeds were partially
offset by a $29.6 million in debt repayments, inclusive of a $23.9 million mandatory prepayment on our Term Loan
Facilities.
Contingent liabilities
We have been involved in certain lawsuits, claims, proceedings and investigations that are currently pending or have been
concluded in the last three years. In accordance with the accounting guidance related to contingencies, we record accruals
for such contingencies when it is probable that a liability will be incurred and the amount of loss can be reasonably
estimated. These matters involve intellectual property, commercial, or environmental, health and safety matters.
There can be no assurance that there will not be an increase in the scope of the pending matters or that any future lawsuits,
claims, proceedings, or investigations will not be material. Management continues to believe that during the next few
years, the aggregate impact, beyond current reserves, of these and other legal matters affecting us is not likely to be
material to our results of operations and cash flows, or our financial condition and liquidity. See “Our business – Legal
Proceedings” in our 2012 Annual Report for further discussion. Changes to Legal Proceedings that were disclosed in the
2012 Annual Report have not had a significant impact to the financial statements through September 30, 2013.
We are also a party to proceedings and other matters under various national, state and local environmental laws, and from
time to time we incur the costs of investigating and/or remediating contamination resulting from past industrial activity at
current or former company sites, or at waste disposal or reprocessing facilities operated by third parties.
With respect to environmental matters for which we are responsible under various national, state and local laws, we
typically estimate potential costs based on information obtained from the U.S. Environmental Protection Agency, or
counterpart state agencies, other national environmental agencies and/or studies prepared by independent consultants,
including total estimated costs for the site and the expected cost-sharing, if any, with other “potentially responsible
parties,” and we accrue liabilities when they are probable and reasonably estimable. As of September 30, 2013, we do not
expect to incur, and there have been no material costs for investigation and remediation for any sites for which we may be
responsible, including liabilities under the U.S. Comprehensive Environmental Response, Compensation and Liability Act
and for other remedial obligations.
See “Our business – Environmental matters” in our 2012 Annual Report for further discussion. There have not been
significant changes to the environmental matters as of September 30, 2013.
Other Matters
As a result of a recent inspection, we received a warning letter from the FDA dated May 24, 2013. The warning relates to
complaints handling and other quality management systems at our Skillman, New Jersey facility. Resources are being
added to address the FDA concerns in a timely manner. At this time, we have engaged third-party consultants to develop
remediation procedures and are working closely and cooperatively with the FDA to alleviate its concerns. We believe that
these efforts will be adequate to address the issues raised in the warning letter.
Contractual obligations
We are obligated to make future payments under various contracts such as debt agreements (including scheduled cash
interest payments), operating lease agreements, and unconditional purchase obligations. A discussion of these contractual
obligations is included in the 2012 Annual Report. There have not been significant changes to these contractual

20
obligations relating to CHB as of September 30, 2013. Additionally, please refer to “Recent Developments” section for
information regarding the PIK Note Offering completed on August 12, 2013.
Capital expenditures
Our capital expenditures were $22.7 million for the nine months ended September 30, 2013.
For the twelve month period ending December 31, 2013, we estimate our capital expenditures to be approximately
$38.0 million, which primarily relate to productivity improvements, capacity expansion, quality and compliance
initiatives, and new product development. The remaining expenditures include routine plant and facility enhancements.
Critical accounting policies
Critical accounting policies are those that require application of management‟s subjective or complex judgments, often as
a result of the need to make estimates about the effect of matters that are inherently uncertain and may change in
subsequent periods. See Note 2 – Significant Accounting Policies, included in our 2012 Annual Report, for the critical
accounting policies that we believe requires subjective and/or complex judgments and that may have an impact on the
financial statements, including the periods reported herein. The most significant assumptions are employed in estimates
used in acquisition purchase price allocations, determining values of intangible assets, restructuring charges and accruals,
sales rebates, chargebacks and return accruals, legal contingencies, tax assets and tax liabilities, stock-based compensation
costs, retirement and postretirement benefits (including the actuarial assumptions), as well as in estimates used in applying
our revenue recognition policy. There have been no significant changes to the accounting policies disclosed in our
December 31, 2012 Audited Consolidated Financial Statements contained within the 2012 Annual Report nor has there
been any change to our assessment of which accounting policies would be considered critical accounting policies.
Quantitative and qualitative disclosure about market risk
We are, in the normal course of business, exposed to a variety of market risk, including foreign exchange rate risk and
interest rate risk. Our risk management strategy aims to minimize the adverse effects of these risks on our financial
performance. Accordingly, we generally attempt to use Natural hedges within our foreign currency activities to minimize
foreign exchange risk. We have not entered into any transactions in derivative financial instruments for trading purposes.
A discussion and analysis of our market risk is included in the 2012 Annual Report. There have been no significant
changes to these market risks as of September 30, 2013. See the Economic Environment and Regulatory Reform section
shown earlier in this report for further discussion.
Reconciliation to the Parent’s Financial Statements
In connection with the PIK Notes offering, we are required to present a summary of the primary financial statement
reconciliation differences between CHB and the Parent. Please refer to the “Presentation of financial information” and
“Recent developments” in the beginning of the MD&A as well as “Financing and Financing Capacity” under “Liquidity
and capital resources” for further information regarding the PIK Notes and our financial presentation requirements. We
believe that the Condensed Consolidated Financial Statements of CHB, prepared in accordance with U.S. GAAP, fairly
represent the operating activities of the Parent, with the exception of the differences discussed below.
Prior to the PIK Notes offering, the primary differences between the consolidated financial statements of CHB and the
Parent for each period were related to the management fees paid to the Equity Sponsors, the accumulated value of the loan
between CHB and the Parent resulting from the management fees paid, the amount of accrued interest on this loan, as well
as minor foreign currency and tax related differences. The management fee, including other related fees, results in $3.0 to
$4.0 million of incremental general and administrative expenses per year on the Parent‟s consolidated statement of
operations. Further differences resulting directly from the PIK Notes offering include incremental long-term debt on the
Parent‟s consolidated balance sheet along with an incremental amount of capitalized deferred financing fees associated
with the issuance of the PIK Notes, an incremental amount of mandatorily redeemable preferred equity certificates liability
on the balance sheet of CHB, differences in related interest expense and foreign currency remeasurement gain and losses,
generated from an on-lending arrangement of a long-term-investment nature. This on-lending arrangement was created
21
between CFI and the Parent in the amount of $900.0 million, specifically as a result of the PIK Notes offering. Further
details regarding the differences noted on each of the respective financial statements are as follows:
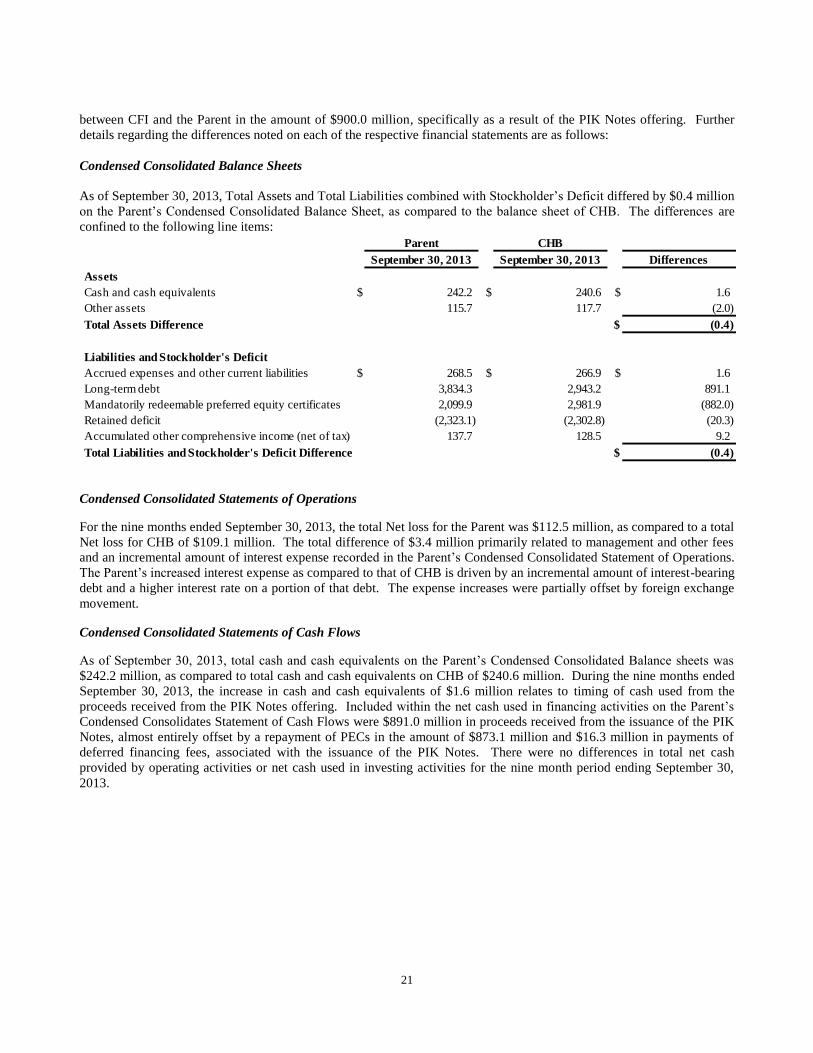
Condensed Consolidated Balance Sheets
As of September 30, 2013, Total Assets and Total Liabilities combined with Stockholder‟s Deficit differed by $0.4 million
on the Parent‟s Condensed Consolidated Balance Sheet, as compared to the balance sheet of CHB. The differences are
confined to the following line items:
Condensed Consolidated Statements of Operations
For the nine months ended September 30, 2013, the total Net loss for the Parent was $112.5 million, as compared to a total
Net loss for CHB of $109.1 million. The total difference of $3.4 million primarily related to management and other fees
and an incremental amount of interest expense recorded in the Parent‟s Condensed Consolidated Statement of Operations.
The Parent‟s increased interest expense as compared to that of CHB is driven by an incremental amount of interest-bearing
debt and a higher interest rate on a portion of that debt. The expense increases were partially offset by foreign exchange
movement.
Condensed Consolidated Statements of Cash Flows
As of September 30, 2013, total cash and cash equivalents on the Parent‟s Condensed Consolidated Balance sheets was
$242.2 million, as compared to total cash and cash equivalents on CHB of $240.6 million. During the nine months ended
September 30, 2013, the increase in cash and cash equivalents of $1.6 million relates to timing of cash used from the
proceeds received from the PIK Notes offering. Included within the net cash used in financing activities on the Parent‟s
Condensed Consolidates Statement of Cash Flows were $891.0 million in proceeds received from the issuance of the PIK
Notes, almost entirely offset by a repayment of PECs in the amount of $873.1 million and $16.3 million in payments of
deferred financing fees, associated with the issuance of the PIK Notes. There were no differences in total net cash
provided by operating activities or net cash used in investing activities for the nine month period ending September 30,
2013.
Parent CHB
September 30, 2013 September 30, 2013 Differences
Assets
Cash and cash equivalents $ 242.2 $ 240.6 $ 1.6
Other assets 115.7 117.7 (2.0)
Total Assets Difference $ (0.4)
Liabilities and Stockholder's Deficit
Accrued expenses and other current liabilities $ 268.5 $ 266.9 $ 1.6
Long-term debt 3,834.3 2,943.2 891.1
Mandatorily redeemable preferred equity certificates 2,099.9 2,981.9 (882.0)
Retained deficit (2,323.1) (2,302.8) (20.3)
Accumulated other comprehensive income (net of tax) 137.7 128.5 9.2
Total Liabilities and Stockholder's Deficit Difference $ (0.4)

22
Glossary
AQUACEL® .............................................. ConvaTec advanced wound dressing, utilizing Hydrofiber Technology
AQUACEL Ag ........................................... ConvaTec silver-based antimicrobial advanced wound dressing, utilizing Hydrofiber
Technology
chronic wound ............................................ Complex wounds that are caused by repeated insults which do not heal rapidly in the
absence of interventional therapies, and which include pressure, venous, arterial, and
diabetic foot ulcers
DuoDERM™ ............................................. ConvaTec brand of hydrocolloid dressing that provides a moist wound healing
environment and self-adheres to the skin through ConvaTec‟s patented Durahesive
Technology
effluent ....................................................... Effluent generally refers to the feces or urine coming out of the body through an
artificial opening such as a stoma
ESTEEM™ ................................................ ConvaTec brand for a One-Piece Ostomy System, closed-end or drainable pouch,
with upgraded features similar to those found on two-piece systems
exudate ....................................................... Fluid, cells or cellular debris that has filtered from the circulatory system into a
lesion or area of inflammation and deposited in tissues or on tissue surfaces and
leaking out of the wound
Flexi-Seal™ fecal management system or
FMS
ConvaTec brand of fecal containment device designed to safely and effectively
contain and divert liquid fecal matter to protect patients‟ wounds from fecal
contamination and reduce risk of skin breakdown and the spread of infection
foam............................................................ Typically, polyurethane-based dressing with foam-like feel used for wounds with
moderate to heavy exudates
GAAP .........................................................
hydrocolloid ...............................................
Accounting principles generally accepted in the United States of America (“U.S.
GAAP” or “GAAP”)
Dressing containing a polymeric hydrocolloid material which dissolves, gels, swells
(or exhibits some combination of these actions) upon interaction with water to
provide a moist wound healing environment. Hydrocolloid dressings are typically
used for wounds with light to moderate exudates
Hydrofiber Technology .............................. ConvaTec proprietary technology based on the unique gelling properties of
Hydrofiber materials; serves as the basis of the AQUACEL®, AQUACEL Ag, and
Versiva® XC® products
One-Piece Ostomy System ......................... A system that combines as a single, integrated unit the skin barrier surrounding the
stoma and the pouch collecting the effluent
ostomy ........................................................ A surgical procedure in which an opening for the passage of feces or urine is created
through the abdominal wall in patients with decreased small intestine, colon, rectum
or bladder function
skin barrier (wafer) ..................................... The adhesive-backed barrier connecting to the ostomy pouch in either an integrated
unit (one-piece ostomy system) or as a separate piece (two-piece ostomy system),
which serves to secure the pouch to the body and surround the stoma opening,
protecting the skin around the stoma from toxic effluent
Two-Piece Ostomy System ........................ ConvaTec proprietary two-piece ostomy system; includes both closed-end, drainable
and urostomy pouches
urostomy ..................................................... A surgically created opening in the abdominal wall to divert urine to the exterior.
This can be done by either diverting, using a part of the urinary tract or via a loop of
the ileum
urostomy pouches ....................................... Ostomy pouches collecting urine only, and which possess a special valve or spout
which adapts to either a leg bag or night drain tube for overnight urine collection

23
Versiva® XC® ........................................... ConvaTec proprietary “gelling” foam wound dressing utilizing Hydrofiber
Technology

Index to financial statements
Page
Condensed Consolidated Financial Statements of ConvaTec Healthcare B S.a.r.l. and
Subsidiaries (the “Company”) (Unaudited)
Condensed Consolidated Balance Sheets of the Company (unaudited) as of September 30, 2013 and
December 31, 2012
F-2
Condensed Consolidated Statements of Operations of the Company (unaudited) for the three and nine
months ended September 30, 2013 and 2012
F-3
Condensed Consolidated Statements of Comprehensive Loss of the Company (unaudited) for the three
and nine months ended September 30, 2013 and 2012
F-4
Condensed Consolidated Statements of Cash Flows of the Company (unaudited) for the nine months
ended September 30, 2013 and 2013
F-5
Notes to the Condensed Consolidated Financial Statements (unaudited) F-6

ConvaTec Healthcare B S.a.r.l. and Subsidiaries
Condensed Consolidated Balance Sheets
(in Millions, except share and per share data)
(Unaudited)
F-2
The accompanying notes are an integral part of these unaudited Condensed Consolidated Financial Statements.
September 30, 2013 December 31, 2012
Assets
Current Assets:
Cash and cash equivalents $ 240.6 $ 129.4
Receivables, net of allow ances of $30.2 in 2013 and $35.2 in 2012 291.5 285.1
Inventories, net 251.9 207.9
Prepaid expenses and other current assets 84.6 76.6
Total Current Assets 868.6 699.0
Property, plant and equipment, net of accumulated depreciation of $239.0 in 2013
and $212.7 in 2012 295.9 302.9
Goodw ill 1,169.8 1,127.8
Other intangible assets, net 2,120.3 2,235.9
Other assets 117.7 129.7
Total Assets $ 4,572.3 $ 4,495.3
Liabilities and Stockholder's Deficit
Current Liabilities:
Accounts payable $ 100.5 $ 89.8
Short-term portion of long-term debt 0.1 45.2
Accrued expenses and other current liabilities 266.9 191.3
Total Current Liabilities 367.5 326.3
Long-term debt 2,943.2 2,906.1
Mandatorily redeemable preferred equity certif icates 2,981.9 2,754.3
Deferred income taxes 246.5 276.7
Other liabilities 66.8 88.6
Total Liabilities 6,605.9 6,352.0
Commitments and contingencies (Note 15)
Stockholder's Deficit:
Preferred stock- EUR 1 ($1.25) par value as of September 30, 2013 and
December 31, 2012; 20,000 shares issued and outstanding at September 30,
2013 and December 31, 2012 - -
Common stock- EUR 1 ($1.25) par value as of September 30, 2013 and
December 31, 2012; 112,157,883 shares issued and outstanding at September
30, 2013 and December 31, 2012 140.7 140.7
Retained deficit (2,302.8) (2,193.7)
Accumulated other comprehensive income (net of tax) 128.5 196.3
Total Stockholder's Deficit (2,033.6) (1,856.7)
Total Liabilities and Stockholder's Deficit $ 4,572.3 $ 4,495.3

ConvaTec Healthcare B S.a.r.l. and Subsidiaries
Condensed Consolidated Statements of Operations
(in Millions)
(Unaudited)
F-3
The accompanying notes are an integral part of these unaudited Condensed Consolidated Financial Statements.
2013 2012 2013 2012
Net sales $ 435.8 $ 406.3 $ 1,240.0 $ 1,181.1
Cost of goods sold 186.8 180.7 549.4 538.5
Gross profit 249.0 225.6 690.6 642.6
Selling and marketing expenses 94.3 85.0 278.0 279.5
General and administrative expenses 44.5 68.7 146.0 172.6
Research and development expenses 10.0 8.8 22.9 30.3
Operating income 100.2 63.1 243.7 160.2
Interest expense 113.2 105.0 335.8 315.9
Foreign exchange loss 8.6 3.0 1.9 15.9
Other income, net - (4.6) (1.1) (5.0)
Loss on extinguishment of debt 4.4 - 4.4 -
Loss before income taxes (26.0) (40.3) (97.3) (166.6)
(Benefit) provision for income taxes (1.4) 10.3 11.8 9.8
Net loss $ (24.6) $ (50.6) $ (109.1) $ (176.4)
For the Three Months Ended
September 30,
For the Nine Months Ended
September 30,

ConvaTec Healthcare B S.a.r.l. and Subsidiaries
Condensed Consolidated Statements of Comprehensive Loss
(in Millions)
(Unaudited)
F-4
The accompanying notes are an integral part of these unaudited Condensed Consolidated Financial Statements.
2013 2012 2013 2012
Net loss $ (24.6) $ (50.6) $ (109.1) $ (176.4)
Foreign currency translation, including a tax benefit of $1.6 and and $2.1 for the
three months ended September 30, 2013 and 2012 and a tax benefit of $3.4 and
tax expense of $1.0 for the nine months ended September 30, 2013 and 2012,
respectively
(65.5) (18.1) (68.6) 34.4
Other (0.2) - 0.8 -
Total Comprehensive Loss $ (90.3) $ (68.7) $ (176.9) $ (142.0)
For the Three Months Ended
September 30,
For the Nine Months Ended
September 30,
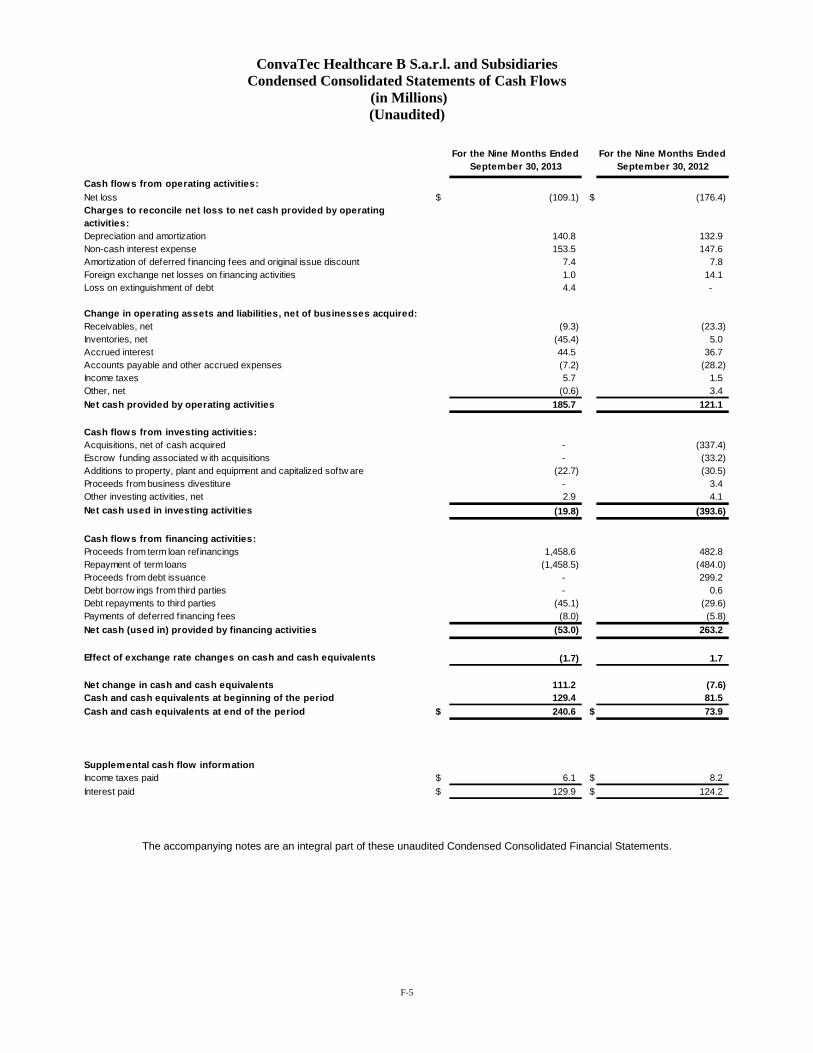
ConvaTec Healthcare B S.a.r.l. and Subsidiaries
Condensed Consolidated Statements of Cash Flows
(in Millions)
(Unaudited)
F-5
The accompanying notes are an integral part of these unaudited Condensed Consolidated Financial Statements.
For the Nine Months Ended
September 30, 2013
For the Nine Months Ended
September 30, 2012
Cash flows from operating activities:
Net loss $ (109.1) $ (176.4)
Charges to reconcile net loss to net cash provided by operating
activities:
Depreciation and amortization 140.8 132.9
Non-cash interest expense 153.5 147.6
Amortization of deferred f inancing fees and original issue discount 7.4 7.8
Foreign exchange net losses on f inancing activities 1.0 14.1
Loss on extinguishment of debt 4.4 -
Change in operating assets and liabilities, net of businesses acquired:
Receivables, net (9.3) (23.3)
Inventories, net (45.4) 5.0
Accrued interest 44.5 36.7
Accounts payable and other accrued expenses (7.2) (28.2)
Income taxes 5.7 1.5
Other, net (0.6) 3.4
Net cash provided by operating activities 185.7 121.1
Cash flows from investing activities:
Acquisitions, net of cash acquired - (337.4)
Escrow funding associated w ith acquisitions - (33.2)
Additions to property, plant and equipment and capitalized softw are (22.7) (30.5)
Proceeds from business divestiture - 3.4
Other investing activities, net 2.9 4.1
Net cash used in investing activities (19.8) (393.6)
Cash flows from financing activities:
Proceeds from term loan refinancings 1,458.6 482.8
Repayment of term loans (1,458.5) (484.0)
Proceeds from debt issuance - 299.2
Debt borrow ings from third parties - 0.6
Debt repayments to third parties (45.1) (29.6)
Payments of deferred f inancing fees (8.0) (5.8)
Net cash (used in) provided by financing activities (53.0) 263.2
Effect of exchange rate changes on cash and cash equivalents (1.7) 1.7
Net change in cash and cash equivalents 111.2 (7.6)
Cash and cash equivalents at beginning of the period 129.4 81.5
Cash and cash equivalents at end of the period $ 240.6 $ 73.9
Supplemental cash flow information
Income taxes paid $ 6.1 $ 8.2
Interest paid $ 129.9 $ 124.2
ConvaTec Healthcare B S.a.r.l. and Subsidiaries
Notes to the Condensed Consolidated Financial Statements
(Unaudited)
F-6
1. Basis of Presentation and Business Description
Basis of Presentation
These Condensed Consolidated Financial Statements of ConvaTec Healthcare B S.a.r.l. and subsidiaries (the “Company”)
have been prepared in accordance with accounting principles generally accepted in the United States of America (“U.S.
GAAP”). These financial statements should be read in conjunction with the Company‟s Audited Consolidated Financial
Statements contained in the 2012 Annual Report for the fiscal year ended December 31, 2012.
Business Description
The Company develops, manufactures and markets innovative medical technologies, in particular products for ostomy
management, advanced chronic and acute wound care, continence care, sterile single-use medical devices for hospitals,
and infusion sets used in diabetes treatment infusion devices. Principal brands include Natura®, SUR-FIT®, Esteem®,
AQUACEL®, DuoDERM®, Versiva® XC®, Flexi-Seal®, and Unomedical. These products are marketed worldwide,
primarily to hospitals, medical professionals, and medical suppliers. The Company relies on an internal sales force, and
sales are made through various distributors around the world. The Company manufactures these products in the United
States (“U.S.”), the United Kingdom (“U.K.”), the Dominican Republic, Denmark, Slovakia, Mexico, Belarus, and
Malaysia.
2. Significant Accounting Policies
Critical accounting policies are those that require application of management‟s subjective or complex judgments, often as
a result of the need to make estimates about the effect of matters that are inherently uncertain and may change in
subsequent periods. Presented within the section entitled “Significant Accounting Policies” of the Company‟s 2012
Audited Consolidated Financial Statements contained in the 2012 Annual Report are the Company‟s critical accounting
policies that the Company believes require subjective and/or complex judgments that may have an impact on the financial
statements, including the periods reported herein. Such critical accounting policies include revenue recognition, sales
rebates, chargebacks and returns, inventory valuation, goodwill and other indefinite-lived intangible assets, impairment of
long-lived assets, income taxes, foreign currency translation and transactions, and loss contingencies. There have been no
significant changes to the accounting policies disclosed in the December 31, 2012 Audited Consolidated Financial
Statements nor has there been any change to the Company‟s assessment of which accounting policies would be considered
critical accounting policies.
Basis of Consolidation
The Condensed Consolidated Financial Statements include all subsidiaries controlled by ConvaTec Healthcare B S.a.r.l.
All intercompany balances, intra-division balances and transactions within the Company have been eliminated.
Recently Issued Accounting Standards
In July 2013, the FASB (“Financial Accounting Standards Board”) issued new accounting guidance entitled, Presentation
of an Unrecognized Tax Benefit When a Net Operating Loss Carryforward, a Similar Tax Loss, or a Tax Credit
Carryforward Exists. The provisions of the rule require an unrecognized tax benefit to be presented as a reduction to a
deferred tax asset in the financial statements for a net operating loss carryforward, a similar tax loss, or a tax credit
carryforward. Exceptions to this rule exist when the carryforward, or tax loss, is not available at the reporting date under
the tax laws of the applicable jurisdiction to settle any additional income taxes or the tax law does not require the entity to
use, and the entity does not intend to use, the deferred tax asset for such purposes. When those circumstances are present,
the unrecognized tax benefit should be presented in the financial statements as a liability and should not be combined with
deferred tax assets. The new financial statement presentation provisions relating to this update are prospective and
effective for interim and annual periods beginning after December 15, 2014, with early adoption permitted. As this
standard impacts presentation requirements only, the adoption of this guidance is not expected to have a material impact
on the Company‟s Consolidated Financial Statements.

ConvaTec Healthcare B S.a.r.l. and Subsidiaries
Notes to the Condensed Consolidated Financial Statements
(Unaudited)
F-7
In March 2013, the FASB (“Financial Accounting Standards Board”) issued updated guidance titled, Parent’s Accounting
for the Cumulative Translation Adjustment upon Derecognition of Certain Subsidiaries or Groups of Assets within a
Foreign Entity or of an Investment in a Foreign Entity. Under the new guidance, an entity must recognize cumulative
translation adjustments in earnings when it ceases to have a controlling financial interest in a subsidiary or group of assets
within a consolidated foreign entity and the sale or transfer results in the complete or substantially complete liquidation of
the foreign entity in which the subsidiary or group of assets resided. However, when an entity sells either a part or all of
its investment in a consolidated foreign entity, an entity is to recognize cumulative translation adjustments in earnings only
if the parent no longer has a controlling financial interest in the foreign entity as a result of the sale. In the case of sales of
an equity method investment that is a foreign entity, a pro rata portion of cumulative translation adjustments attributable to
the equity method investment are to be recognized in earnings upon sale of the equity method investment. In addition,
cumulative translation adjustments are to be recognized in earnings upon a business combination achieved in stages such
as a step acquisition. The amendments are effective prospectively for reporting periods beginning after December 15,
2014. The Company does not expect the adoption of this new guidance to have a material impact on the Company‟s
Condensed Consolidated Financial Statements.
In February 2013, the FASB issued guidance entitled, Obligations Resulting from Joint and Several Liability
Arrangements for Which the Total Amount of the Obligation Is Fixed at the Reporting Date. The new standard provides
guidance for the recognition, measurement and disclosure of obligations resulting from joint and several liability
arrangements, for which the total amount of the obligation is fixed at the reporting date. Examples of obligations within
the scope of this guidance include debt arrangements, settled litigation and judicial rulings and other contractual
obligations. The standard is effective for fiscal years ending after December 15, 2014 and interim and annual periods
thereafter. The guidance should be applied retrospectively to all prior periods presented, for those obligations that exist at
the beginning of the fiscal year of adoption. The Company does not expect the adoption of this new guidance to have a
material impact on the Company‟s Condensed Consolidated Financial Statements.
In February 2013, the FASB issued new accounting guidance entitled, Reporting of Amounts Reclassified Out of
Accumulated Other Comprehensive Income. Under the new accounting guidance, an entity is required to provide
information about the amounts reclassified out of Accumulated Other Comprehensive Income (“AOCI”) by component.
In addition, an entity is required to present, either on the face of the financial statements or in the notes, significant
amounts reclassified out of AOCI by the respective line items of net income, but only if the amount reclassified is required
to be reclassified in its entirety in the same reporting period. For amounts that are not required to be reclassified in their
entirety to net income, an entity is required to cross-reference to other disclosures that provide additional details about
those amounts. This new accounting guidance does not change the current requirements for reporting net income or other
comprehensive income in the financial statements. The amendments are effective prospectively for reporting periods
beginning after December 15, 2013. As these standards impact presentation requirements only, the adoption of this
guidance is not expected to have a material impact on the Company‟s Condensed Consolidated Financial Statements.
3. Acquisitions
In accordance with the Company‟s business strategy to selectively pursue strategic and complementary acquisitions, the
Company has acquired the businesses described below. The acquisitions are included in the Condensed Consolidated
Financial Statements from the respective acquisition dates. Since the acquisitions were not material individually or in the
aggregate, the Company has not presented pro forma results of operations for periods prior to the acquisitions.
On September 28, 2012, the Company acquired all of the capital stock of 180 Medical Holdings, Inc. (“180 Medical”), a
leading U.S. distributor of disposable, intermittent urological catheters. 180 Medical has a distinctive business model that
emphasizes quality service, support and passion for patients. The acquisition strengthens the Company‟s position in the
fast-growing intermittent self-catheterization market. The Company purchased 180 Medical for a net cash purchase price
of $319.1 million, inclusive of $31.6 million funded into escrow primarily to satisfy potential future indemnity obligations.
To fund the acquisition, the Company borrowed $300.0 million of the availability under the Incremental Term Loans. The
preliminary purchase price allocation of the aforementioned acquisition, as disclosed in our 2012 Annual Report, is subject
to revisions as additional information is obtained about the facts and circumstances that existed as of the acquisition date.
Such revisions are not expected to have a material impact on the Condensed Consolidated Financial Statements.
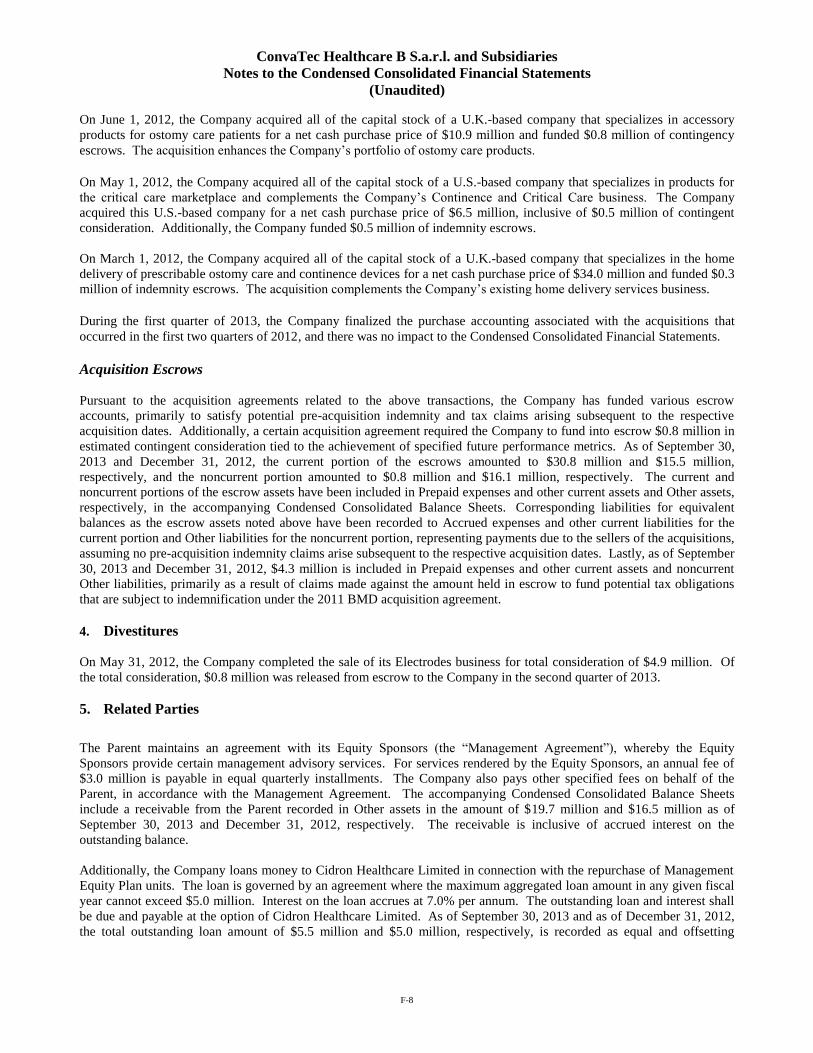
ConvaTec Healthcare B S.a.r.l. and Subsidiaries
Notes to the Condensed Consolidated Financial Statements
(Unaudited)
F-8
On June 1, 2012, the Company acquired all of the capital stock of a U.K.-based company that specializes in accessory
products for ostomy care patients for a net cash purchase price of $10.9 million and funded $0.8 million of contingency
escrows. The acquisition enhances the Company‟s portfolio of ostomy care products.
On May 1, 2012, the Company acquired all of the capital stock of a U.S.-based company that specializes in products for
the critical care marketplace and complements the Company‟s Continence and Critical Care business. The Company
acquired this U.S.-based company for a net cash purchase price of $6.5 million, inclusive of $0.5 million of contingent
consideration. Additionally, the Company funded $0.5 million of indemnity escrows.
On March 1, 2012, the Company acquired all of the capital stock of a U.K.-based company that specializes in the home
delivery of prescribable ostomy care and continence devices for a net cash purchase price of $34.0 million and funded $0.3
million of indemnity escrows. The acquisition complements the Company‟s existing home delivery services business.
During the first quarter of 2013, the Company finalized the purchase accounting associated with the acquisitions that
occurred in the first two quarters of 2012, and there was no impact to the Condensed Consolidated Financial Statements.
Acquisition Escrows
Pursuant to the acquisition agreements related to the above transactions, the Company has funded various escrow
accounts, primarily to satisfy potential pre-acquisition indemnity and tax claims arising subsequent to the respective
acquisition dates. Additionally, a certain acquisition agreement required the Company to fund into escrow $0.8 million in
estimated contingent consideration tied to the achievement of specified future performance metrics. As of September 30,
2013 and December 31, 2012, the current portion of the escrows amounted to $30.8 million and $15.5 million,
respectively, and the noncurrent portion amounted to $0.8 million and $16.1 million, respectively. The current and
noncurrent portions of the escrow assets have been included in Prepaid expenses and other current assets and Other assets,
respectively, in the accompanying Condensed Consolidated Balance Sheets. Corresponding liabilities for equivalent
balances as the escrow assets noted above have been recorded to Accrued expenses and other current liabilities for the
current portion and Other liabilities for the noncurrent portion, representing payments due to the sellers of the acquisitions,
assuming no pre-acquisition indemnity claims arise subsequent to the respective acquisition dates. Lastly, as of September
30, 2013 and December 31, 2012, $4.3 million is included in Prepaid expenses and other current assets and noncurrent
Other liabilities, primarily as a result of claims made against the amount held in escrow to fund potential tax obligations
that are subject to indemnification under the 2011 BMD acquisition agreement.
4. Divestitures
On May 31, 2012, the Company completed the sale of its Electrodes business for total consideration of $4.9 million. Of
the total consideration, $0.8 million was released from escrow to the Company in the second quarter of 2013.
5. Related Parties
The Parent maintains an agreement with its Equity Sponsors (the “Management Agreement”), whereby the Equity
Sponsors provide certain management advisory services. For services rendered by the Equity Sponsors, an annual fee of
$3.0 million is payable in equal quarterly installments. The Company also pays other specified fees on behalf of the
Parent, in accordance with the Management Agreement. The accompanying Condensed Consolidated Balance Sheets
include a receivable from the Parent recorded in Other assets in the amount of $19.7 million and $16.5 million as of
September 30, 2013 and December 31, 2012, respectively. The receivable is inclusive of accrued interest on the
outstanding balance.
Additionally, the Company loans money to Cidron Healthcare Limited in connection with the repurchase of Management
Equity Plan units. The loan is governed by an agreement where the maximum aggregated loan amount in any given fiscal
year cannot exceed $5.0 million. Interest on the loan accrues at 7.0% per annum. The outstanding loan and interest shall
be due and payable at the option of Cidron Healthcare Limited. As of September 30, 2013 and as of December 31, 2012,
the total outstanding loan amount of $5.5 million and $5.0 million, respectively, is recorded as equal and offsetting

ConvaTec Healthcare B S.a.r.l. and Subsidiaries
Notes to the Condensed Consolidated Financial Statements
(Unaudited)
F-9
amounts within Stockholder‟s equity. See Note 13 – Employee Stock Benefit Plans for further discussion regarding the
Management Equity Plan.
6. Restructuring
During the three months and nine months ended September 30, 2013, the Company recorded pre-tax charges of $0.9
million and $2.4 million, respectively, for business restructuring activities.
During the third quarter of 2013, the Company initiated a restructuring action relating to the closure of an office facility.
As a result of this action, the Company incurred costs during the quarter of $0.9 million, primarily relating to employee
involuntary termination benefits and other employee separation costs. Lease termination costs are also expected to be
incurred when the Company ceases use of the rights conveyed by the lease contract for the office facility. Such costs were
recorded in General and administrative expenses in the Condensed Consolidated Statements of Operations. Total overall
costs for this action are expected to approximate $3.0 million, and the Company expects to have recorded all remaining
charges by the end of the first quarter of 2014.
Also during the first quarter of 2013, as part of a separate restructuring action to transfer certain manufacturing functions
from one manufacturing facility to a lower cost location, the Company recorded pre-tax charges of $0.6 million in
termination benefits for involuntary workforce reductions. These costs were recorded in General and administrative
expenses in the Condensed Consolidated Statements of Operations. The Company completed this restructuring action as
of the end of the first quarter 2013, and as a result, there will be no further costs incurred.
As disclosed in the 2012 Annual Report, the Company initiated a restructuring action at the end of the second quarter 2012
to reduce its overall cost structure, further enhance productivity and increase profitability. The Company incurred $24.3
million in costs by the end of 2012, primarily relating to employee involuntary termination benefits and other employee
separation costs. The Company has recorded substantially all charges relating to this plan by the end of the third quarter
2013. For the nine months ended September 30, 2013, the total costs incurred specifically relating to this action were $0.9
million and were recorded in General and administrative expenses in the Condensed Consolidated Statements of
Operations. There were no costs incurred relating to this action during the third quarter of 2013.
Roll-forward
Restructuring charges and spending against liabilities associated with prior and current actions are as follows:
Liabilities above are included in Accrued expenses and other current liabilities in the accompanying Condensed
Consolidated Balance Sheets.
7. Income Taxes
The Company conducts business in various countries throughout the world and is subject to tax in numerous jurisdictions.
As a result of its business activities, the Company files a significant number of tax returns that are subject to examination
by various federal, state and local tax authorities. Accordingly, the Company must determine the appropriate allocation of
income to each of these jurisdictions based on current interpretations of complex income tax regulations.
Employee
Termination
Liability
Balance at January 1, 2013 $ 5.5
Charges 2.5
Spending (6.5)
Changes in estimate (0.1)
Balance at September 30, 2013 $ 1.4

ConvaTec Healthcare B S.a.r.l. and Subsidiaries
Notes to the Condensed Consolidated Financial Statements
(Unaudited)
F-10
The Company‟s effective tax rate for each of the three months ended September 30, 2013 and 2012 was 5.4% and
(25.5)%, respectively. The Company‟s effective tax rate for each of the nine months ended September 30, 2013 and 2012
was (12.1)% and (5.9)%, respectively. The effective rates during the 2013 and 2012 comparative periods deviated from
the U.S. Statutory rate of 35.0% primarily as a result of unfavorable permanent adjustments for valuation allowances
recorded in connection with deferred tax assets principally in Luxembourg and the U.S. that are not likely to be realized.
The ultimate realization of deferred tax assets is dependent on the generation of future taxable income during the periods
in which those temporary differences become deductible. The Company considers projected future taxable income and tax
planning strategies in making this assessment. At present, the Company does not have a sufficient history of income to
conclude that it is more-likely-than-not that the Company will be able to realize all of its tax benefits in the near future.
Accordingly, the Company has increased its valuation allowance by $66.2 million since December 31, 2012. A valuation
allowance will be maintained until sufficient positive evidence exists to support the reversal of any portion or all of the
valuation.
As of September 30, 2013, the total amount of the liability for unrecognized tax benefits was $40.0 million along with
$5.1 million of accrued interest and penalties. As of December 31, 2012, the liability for unrecognized tax benefits was
$48.9 million along with $4.8 million of accrued interest and penalties.
8. Inventories
The major categories of inventories follow:
9. Goodwill
Goodwill represents the excess purchase price over the fair value of identifiable net assets of businesses acquired. The
following is a summary of the change in goodwill in total:
Goodwill is tested for impairment using a two-step process on an annual basis or more frequently if events or changes in
circumstances indicate that a potential impairment may exist. The Company performs its annual goodwill impairment test
in the fourth quarter of each year. There were no events or changes in circumstances in the first nine months of 2013
leading to an additional impairment test.
September 30, 2013 December 31, 2012
Finished goods $ 164.4 $ 139.3
Work in process 31.4 23.6
Raw and packaging materials 56.1 45.0
Inventories, net $ 251.9 $ 207.9
Total
Balance as of January 1, 2013 $ 1,127.8
Changes in foreign exchange rates 42.0
Balance as of September 30, 2013 $ 1,169.8

ConvaTec Healthcare B S.a.r.l. and Subsidiaries
Notes to the Condensed Consolidated Financial Statements
(Unaudited)
F-11
10. Other Intangible Assets
As of September 30, 2013 and December 31, 2012, other intangible assets consisted of the following:
Foreign currency translation resulted in an increase in the gross carrying amount of intangible assets of $1.4 million for the
nine months ended September 30, 2013. Amortization expense for intangible assets for the three months ended September
30, 2013 and 2012 was $37.7 million and $36.9 million, respectively. Amortization expense for intangible assets for the
nine months ended September 30, 2013 and 2012 was $114.8 million and $108.4 million, respectively.
September 30, 2013
Weighted Average
Useful Life Cost
Accumulated
Amortization Net
Amortized Intangible Assets:
Patents, Trademarks, and Licenses 18 years $ 2,027.2 $ (577.7) $ 1,449.5
Technology 17 years 251.9 (72.8) 179.1
Capitalized Softw are 8 years 77.3 (44.9) 32.4
Contracts and customer relationships 16 years 248.4 (48.6) 199.8
Non-compete agreement 5 years 3.5 (1.0) 2.5
Trade Names 10 years 4.8 (0.5) 4.3
Unamortized Intangible Assets:
Trade Names 252.7 - 252.7
Total intangibles assets $ 2,865.8 $ (745.5) $ 2,120.3
December 31, 2012
Weighted Average
Useful Life Cost
Accumulated
Amortization Net
Amortized Intangible Assets:
Patents, Trademarks, and Licenses 18 years $ 2,030.1 $ (493.6) $ 1,536.5
Technology 17 years 250.8 (61.0) 189.8
Capitalized Softw are 8 years 77.4 (37.7) 39.7
Contracts and customer relationships 16 years 245.6 (35.7) 209.9
Non-compete agreement 5 years 3.5 (0.4) 3.1
Trade Names 10 years 4.8 (0.1) 4.7
Unamortized Intangible Assets:
Trade Names 252.2 - 252.2
Total intangibles assets $ 2,864.4 $ (628.5) $ 2,235.9
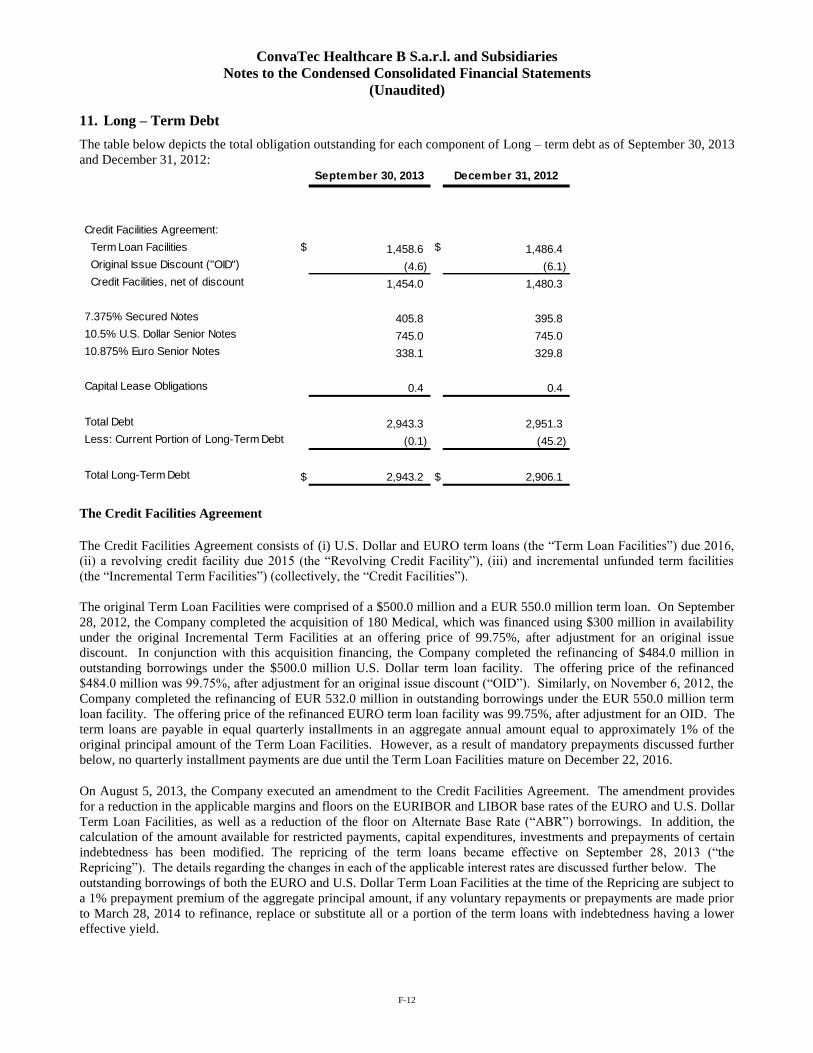
ConvaTec Healthcare B S.a.r.l. and Subsidiaries
Notes to the Condensed Consolidated Financial Statements
(Unaudited)
F-12
11. Long – Term Debt
The table below depicts the total obligation outstanding for each component of Long – term debt as of September 30, 2013
and December 31, 2012:
The Credit Facilities Agreement
The Credit Facilities Agreement consists of (i) U.S. Dollar and EURO term loans (the “Term Loan Facilities”) due 2016,
(ii) a revolving credit facility due 2015 (the “Revolving Credit Facility”), (iii) and incremental unfunded term facilities
(the “Incremental Term Facilities”) (collectively, the “Credit Facilities”).
The original Term Loan Facilities were comprised of a $500.0 million and a EUR 550.0 million term loan. On September
28, 2012, the Company completed the acquisition of 180 Medical, which was financed using $300 million in availability
under the original Incremental Term Facilities at an offering price of 99.75%, after adjustment for an original issue
discount. In conjunction with this acquisition financing, the Company completed the refinancing of $484.0 million in
outstanding borrowings under the $500.0 million U.S. Dollar term loan facility. The offering price of the refinanced
$484.0 million was 99.75%, after adjustment for an original issue discount (“OID”). Similarly, on November 6, 2012, the
Company completed the refinancing of EUR 532.0 million in outstanding borrowings under the EUR 550.0 million term
loan facility. The offering price of the refinanced EURO term loan facility was 99.75%, after adjustment for an OID. The
term loans are payable in equal quarterly installments in an aggregate annual amount equal to approximately 1% of the
original principal amount of the Term Loan Facilities. However, as a result of mandatory prepayments discussed further
below, no quarterly installment payments are due until the Term Loan Facilities mature on December 22, 2016.
On August 5, 2013, the Company executed an amendment to the Credit Facilities Agreement. The amendment provides
for a reduction in the applicable margins and floors on the EURIBOR and LIBOR base rates of the EURO and U.S. Dollar
Term Loan Facilities, as well as a reduction of the floor on Alternate Base Rate (“ABR”) borrowings. In addition, the
calculation of the amount available for restricted payments, capital expenditures, investments and prepayments of certain
indebtedness has been modified. The repricing of the term loans became effective on September 28, 2013 (“the
Repricing”). The details regarding the changes in each of the applicable interest rates are discussed further below. The
outstanding borrowings of both the EURO and U.S. Dollar Term Loan Facilities at the time of the Repricing are subject to
a 1% prepayment premium of the aggregate principal amount, if any voluntary repayments or prepayments are made prior
to March 28, 2014 to refinance, replace or substitute all or a portion of the term loans with indebtedness having a lower
effective yield.
September 30, 2013 December 31, 2012
Credit Facilities Agreement:
Term Loan Facilities $ 1,458.6 $ 1,486.4
Original Issue Discount ("OID") (4.6) (6.1)
Credit Facilities, net of discount 1,454.0 1,480.3
7.375% Secured Notes 405.8 395.8
10.5% U.S. Dollar Senior Notes 745.0 745.0
10.875% Euro Senior Notes 338.1 329.8
Capital Lease Obligations 0.4 0.4
Total Debt 2,943.3 2,951.3
Less: Current Portion of Long-Term Debt (0.1) (45.2)
Total Long-Term Debt $ 2,943.2 $ 2,906.1

ConvaTec Healthcare B S.a.r.l. and Subsidiaries
Notes to the Condensed Consolidated Financial Statements
(Unaudited)
F-13
The execution of the amendment and related Repricing required the consent of the lenders in each of our Term Loan
Facilities. While the majority of the lenders of both the EURO and U.S. Dollar term loans consented to the terms of the
amendment and the related Repricing, it was determined that certain individual lenders had extinguished their lending
positions. As a result, a loss on debt extinguishment of $4.4 million was recorded and included as a separate line item
entitled, Loss on extinguishment of debt in the Condensed Consolidated Statements of Operations. Included within the
loss on extinguishment were $3.9 million of unamortized deferred financing fees and $0.5 million of unamortized original
issue discount. The Company will continue to amortize the remaining unamortized deferred financing fees and original
issue discount, associated with the Term Loan Facilities. Additionally, in connection with the Repricing, the Company
incurred fees of approximately $9.6 million. Of this amount, $8.0 million was capitalized as deferred financing fees, and
$1.6 million was expensed and included within General and administrative expenses.
Total borrowings outstanding under the Term Loan Facilities denominated in U.S. Dollars and Euros are $804.0 million
and EUR 483.9 million ($654.6 million) at September 30, 2013 and $784.0 million and EUR 532.4 million ($702.4
million) at December 31, 2012. Immediately prior to the Repricing on September 28, 2013, borrowings outstanding under
the Term Loan Facilities denominated in U.S. Dollars and Euros were $760.2 million and EUR 516.2 million ($698.3
million). The Term Loan Facilities will mature on December 22, 2016.
The Revolving Credit Facility of $250.0 million is available through its maturity date in certain currencies at the
borrower‟s option and is used to provide for ongoing working capital requirements, letters of credit, and general corporate
purposes of the Company. The original offering price of the $250.0 million revolving credit facility was 98.5%, after
adjustment for an OID. The Revolving Credit Facility allows for up to $40.0 million of letter of credit issuances as well as
$25.0 million for borrowings on same-day notice, referred to as the swingline loans. There were no borrowings
outstanding under the Revolving Credit Facility as of September 30, 2013 or December 31, 2012. Letters of credit
outstanding under the revolving credit facility totaled $0.8 million as of September 30, 2013 and $0.5 million as of
December 31, 2012, respectively. Availability under the Revolving Credit Facility, after deducting both the outstanding
letters of credit and amounts withdrawn, totaled $249.2 million as of September 30, 2013 and $249.5 million as of
December 31, 2012, respectively.
OID is being amortized to interest expense, using the effective interest method, over the terms of the related outstanding
borrowings. Total amortization expense related to OID amounted to $0.4 million during both three month periods ended
September 30, 2013 and 2012. Total amortization expense related to OID was $1.1 million during both nine month
periods ended September 30, 2013 and 2012.
The Incremental Term Facilities, as amended, are unfunded commitments and are available in an amount up to $400.0
million (net of any issuance of secured notes) in either U.S. Dollars and/or Euros provided that a certain leverage ratio is
not exceeded and the Company satisfies certain requirements, including: no default or event of default, pro forma
compliance with financial covenants, minimum borrowing amounts of $15.0 million and a maturity date and weighted
average life-to-maturity of each individual loan within the Incremental Term Facilities that is greater than the weighted
average maturity date of the Term Loan Facilities. Additionally, should the yield on the Incremental Term Facilities
exceed the yield on the Term Loans Facilities by more than 0.50%, then the yield on the Term Loan Facilities will
automatically increase such that the yield on the Incremental Term Facilities shall be 0.50% below the yield on the Term
Loan Facilities. There were no amounts funded or drawn under the amended Incremental Term Facilities as of September
30, 2013.
Borrowings under the Credit Facilities Agreement bear interest at either a Euro (EURIBOR) or U.S. Dollar (LIBOR) base
rate, or Alternate Base Rate (“ABR”). EURIBOR interest is associated with the EUR borrowings; LIBOR interest is
associated with U.S. Dollar borrowings, while ABR, EURIBOR or LIBOR interest rates may apply to outstanding
borrowings under the Revolving Credit Facility. ABR, as defined and amended in the Credit Facilities Agreement, is the
greater of (a) the Prime Rate, (b) the Federal Funds Effective Rate plus 0.50% or (c) the Eurodollar Rate for a one-month
interest period plus 1.00%. ABR is subject to an initial margin of 3.25% on borrowings under the Revolving Credit
Facility and 2.00% on Dollar Term Loan ABR borrowings. Additionally, at no time can the ABR be less than 2.00% per
annum. As a result of the Repricing, EURIBOR and LIBOR borrowings are subject to an initial margin of 3.25% and
3.00%, respectively, and a floor of 1.00%. The margins on our EURIBOR and LIBOR interest rates may increase by 25
basis points if there is a decline in our corporate credit rating.

ConvaTec Healthcare B S.a.r.l. and Subsidiaries
Notes to the Condensed Consolidated Financial Statements
(Unaudited)
F-14
Under the original terms of the Credit Facilities Agreement, the margin on both EURIBOR and LIBOR loans was 4.25%,
subject to a floor of 1.50% to 1.75% on EURIBOR loans and a floor of 1.50% on LIBOR loans. In the third quarter and
fourth quarters of 2012, we refinanced both the EURO and U.S. Dollar Term Loan Facilities, whereby the margin on the
EURIBOR and LIBOR borrowings was reduced to 4.00% and 3.75%, respectively. The floor was also reduced to 1.25%
for both EURIBOR and LIBOR borrowings.
Borrowings and commitments under the Credit Facilities, including the Term Loan Facilities, are subject to full or partial
mandatory prepayments from the proceeds of asset sales above a specified threshold, the issuance or incurrence of debt
and from excess cash flow retained in the business. The amount and timing of the mandatory prepayments are subject to
certain criteria. During the second quarters of 2013 and 2012, the Company made mandatory prepayments of $45.1
million and $23.9 million, respectively, for excess cash retained in the business. Both the 2013 and 2012 mandatory
prepayments were applied against the remaining quarterly installments due under both the U.S. Dollar and EURO Term
Loan Facilities, in accordance with the terms outlined in the Credit Facilities Agreement. As a result, there will be no
quarterly installment payments due until the Term Loan Facilities mature on December 22, 2016.
Borrowings under the Credit Facilities Agreement are secured by substantially all of the Company‟s assets. Any loan
advances made under the Incremental Term Facilities will rank pari passu with the Term Loan Facilities and the
Revolving Credit Facility.
Secured Notes and Senior Notes
The Secured Notes consist of EUR 300.0 million ($405.8 million at September 30, 2013 and $395.8 million at December
31, 2012) senior secured notes (the “Secured Notes”) due December 15, 2017. Borrowings outstanding under the Secured
Notes were EUR 300.0 million ($405.8 million at September 30, 2013 and $395.8 million at December 31, 2012).
Borrowings under the Secured Notes bear interest of 7.375% per annum. Interest on the Secured Notes will be payable
semi-annually in arrears from the issue date or from the most recent interest payment date to which interest has been paid
or provided for, whichever is the later. Interest is payable on each Secured Note on June 15 and December 15 of each
year.
The Senior Notes consist of $745.0 million and EUR 250.0 million ($338.1 million at September 30, 2013 and $329.8
million at December 31, 2012) senior notes (the “U.S. Dollar Senior Notes” and the “Euro Senior Notes”) due December
15, 2018 (collectively the “Senior Notes”). Borrowings outstanding under the Senior Notes were $745.0 million and EUR
250.0 million ($338.1 million at September 30, 2013 and $329.8 million at December 31, 2012). Borrowings under the
U.S. Dollar Senior Notes bear interest of 10.5% per annum. Borrowings under the Euro Senior Notes bear interest of
10.875% per annum. Interest on the Senior Notes is payable semi-annually in arrears from the issue date or from the most
recent interest payment date to which interest has been paid or provided for, whichever is the later. Interest is payable on
each Secured Note on June 15 and December 15 of each year.
The Secured Notes and Senior Notes may be prepaid and are subject to a premium if payment is made prior to December
15, 2015. Mandatory redemption of the Secured Notes and Senior Notes is not required prior to their stated maturity
dates. The Secured Notes rank pari passu in right of payment with all existing and future indebtedness that are not
subordinated in right of payment to the Secured Notes. The Secured Notes are secured on a first priority basis by liens on
all assets that secure the obligations of the borrowers under the Credit Facility. The Senior Notes are unsecured
obligations of the Company and are guaranteed on a senior basis by the Company. They rank pari passu in right of
payment with all of the Company‟s existing and future obligations that are not subordinated in right of payment to the
Senior Notes.
In connection with the issuance of all of the aforementioned borrowings, including the recent Repricing transaction, the
total capitalized deferred financing fees, net of accumulated amortization and the write-off of $3.9 million recorded during
third quarter of 2013, was $48.1 million as of September 30, 2013. Deferred financing fees are included in Other assets in
the accompanying Condensed Consolidated Balance Sheets and are being amortized to interest expense over the terms of
the underlying borrowings using the effective interest method. Total amortization expense related to deferred financing

ConvaTec Healthcare B S.a.r.l. and Subsidiaries
Notes to the Condensed Consolidated Financial Statements
(Unaudited)
F-15
fees amounted to $2.1 million and $1.7 million during the three months ended September 30, 2013 and 2012, respectively.
Total amortization expense related to deferred financing fees amounted to $6.3 million and $4.9 million during the nine
months ended September 30, 2013 and 2012, respectively.
Accrued interest related to the Company‟s outstanding debt obligations was $43.3 million and $8.0 million as of
September 30, 2013 and December 31, 2012, respectively, and is recorded in Accrued expenses and other current
liabilities. Interest expense for the three months ended September 30, 2013 and 2012, associated with the Credit Facilities,
Secured Notes and Senior Notes, was $55.2 million and $52.7 million, respectively. Interest expense for the nine months
ended September 30, 2013 and 2012, associated with the Credit Facilities, Secured Notes and Senior Notes, was $165.4
million and $159.8 million, respectively. The weighted average interest rate for borrowings under the Company‟s
outstanding debt obligations was 7.5% for the nine months ended September 30, 2013 and 8.0% for the nine months ended
September 30, 2012.
The Company‟s borrowing arrangements contain a number of covenants. The more significant financial covenants include
certain ratios and a limitation on capital expenditures. The Company was in compliance with all financial covenants as of
September 30, 2013.
The aggregate maturities of debt obligations as of September 30, 2013 are as follows:
12. Mandatorily Redeemable Preferred Equity Certificates
In connection with the Company‟s initial capitalization, the Company issued Series 1, 2 and 3 preferred equity certificates
(“PECs”) for an aggregate amount of EUR 1,289.7 million. The PECs are mandatorily redeemable by the Company in
2047 or upon liquidation (which entails voluntary or involuntary liquidation, insolvency, dissolution, or winding up of the
affairs of the company), or the Company has the option to voluntarily redeem any or all of the PECs, into cash, equity
shares, new PECs or property that have an aggregate fair market value equal to the face value plus accrued unpaid
dividends. The Company shall also redeem part or all of the PECs, if prior to the maturity date, part or all of the amounts
that the Company lent to a subsidiary from the proceeds of these PECs are paid back by the subsidiary. If only part of the
intercompany obligation is paid back by the subsidiary, then the PECs will be redeemed at an amount equal to lesser of (a)
the pro rata portion of nominal principal and yield used to finance that portion of the subsidiary's obligation, or, (b) the
maximum portion of these PECs that may be prepaid from the net proceeds from the subsidiary. The PECs can only be
redeemed to the extent the Company will not become insolvent after making such payment. The PECs have been
classified as debt as the PEC holders control a majority of the board of directors and, therefore, control the redemption
rights. Further, under Luxembourg law, the PECs are considered debt instruments.
PECs have priority over the common and preferred stock in the distribution of dividends. PECs are entitled to a dividend
equivalent ranging from approximately 7% to 9% of the par value per annum on a cumulative basis. PEC dividends
accrue monthly and compound on an annual basis. The PECs, which include long-term accrued dividends, were $2,981.9
million and $2,754.3 million at September 30, 2013 and December 31, 2012, respectively. Total accrued dividends at
September 30, 2013 amounted to $1,247.5 million, of which $10.1 million were classified as Accrued Expenses and other
current liabilities in the in the accompanying Condensed Consolidated Balance Sheets. Total accrued dividends at
December 31, 2012 amounted to $1,052.8 million, all of which were included in Mandatorily redeemable preferred equity
certificates in the accompanying Condensed Consolidated Balance Sheets. Total dividends expensed during the three
months ended September 30, 2013 and 2012 were $55.5 million and $48.1 million, respectively, which were classified as
Years Ending December 31,
2013 0.1
2014 0.2
2015 0.1
2016 1,458.6
2017 405.8
Thereafter 1,083.1
Total $ 2,947.9

ConvaTec Healthcare B S.a.r.l. and Subsidiaries
Notes to the Condensed Consolidated Financial Statements
(Unaudited)
F-16
Interest expense in the accompanying Condensed Consolidated Statements of Operations. Total dividends expensed
during the nine months ended September 30, 2013 and 2012 were $163.6 million and $147.6 million, respectively. The
variance between the cumulative balances of accrued dividends and cumulative dividends expensed is due to fluctuations
in the foreign currency exchange rates. PECs are subordinate to borrowings under the Credit Facilities, Secured Notes and
Senior Notes, as well as present and future obligations of the Company whether secured or unsecured. The holders of the
PECs do not have voting rights in respect to the Company by reason of ownership of the PECs. The Series 3 PECs cannot
be transferred without prior consent of the Company or pursuant to the Company‟s third party debt agreements.
13. Employee Stock Benefit Plans
The Company‟s Parent grants stock-based compensation to employees under the Annual Equity Program (“AEP”), the
Management Executive Plan (“MEP”) and the Management Incentive Plan (“MIP”). Also, certain of our employees are
able to purchase MEP Units at more than a 5% discount off of the estimated fair value as of the purchase date. Additional
information regarding these plans is provided below.
Annual Equity Program
The AEP allows for the issuance of units (“AEP Units”) to employees for shares of common stock. The Company‟s
Parent is authorized to grant up to 1.0 million AEP Units to purchase common stock under the AEP, representing 2.0% of
the common stock in the Company‟s Parent. AEP Units are granted at the allocable fair market value of a share of stock
on the date of grant and vest upon a liquidity event.
Management Executive Plan
The MEP allows for the issuance of units (“MEP Units”) by the Company‟s Parent to employees for shares of common
stock in the Parent. The Company‟s Parent is authorized to issue up to 1.0 million MEP Units to purchase common stock
under the MEP, representing 8.0% of the common stock in the Company‟s Parent. MEP Units are granted at the allocable
fair market value of a share of stock on the date of grant and vest over five years or upon a liquidity event. Additionally,
certain employees are able to purchase MEP units at more than a 5% discount off of the estimated fair value as of the
purchase date. The purchased MEP units vest over a specified period of time or upon a liquidity event similar to the
granted MEP units.
Management Incentive Plan
The MIP allows for the issuance of units (“MIP Units”) to employees for common stock and PEC‟s of the Company‟s
Parent. The Company‟s Parent is authorized to grant up to 3.0 million MIP Units under the Plan, representing 0.3% of the
common stock and 0.4% of the PECs in the Company‟s Parent. MIP Units are granted at the allocable fair market value of
a share of stock or PECs on the date of grant and vest upon a liquidity event.
During the nine months ended September 30, 2013 there were approximately 104,000 AEP units granted, approximately
13,000 MEP units granted, approximately 48,000 MEP units purchased at more than a 5% discount off of the estimated
fair value as of the purchase date and no MIP units granted. The Company recognized total compensation expense for all
plans of $0.7 million and $0.4 million for the three months ended September 30, 2013 and 2012, respectively. The
Company recognized total compensation expense for all plans of $2.5 million and $1.3 million for the nine months ended
September 30, 2013 and 2012, respectively.

ConvaTec Healthcare B S.a.r.l. and Subsidiaries
Notes to the Condensed Consolidated Financial Statements
(Unaudited)
F-17
14. Fair Value Measurements
The Company applies the guidance related to fair value measurements for its financial assets and financial liabilities
reported or disclosed at fair value. In addition, the Company applies certain provisions of the standard relating to its non-
financial assets and liabilities recognized or disclosed at fair value in the financial statements on a recurring basis (at least
annually).
The Company‟s financial instruments and the methods used to determine fair value consist of the following:
Cash and cash equivalents, receivables, accounts payable and certain accrued expenses – Carrying amounts
approximate fair value due to the short-term maturities of these assets and liabilities.
Preferred equity certificates – Carrying amounts approximate fair value due to the holders‟ ability to redeem the
instruments at face value at issuance.
To increase consistency and comparability in fair value measures, the accounting standard relating to fair value
measurements established a three-level fair value hierarchy to prioritize inputs used in valuation techniques between
observable inputs that reflect quoted prices in actives markets, inputs other than quoted market prices with observable
market data, and unobservable data (e.g., the company‟s own data). The guidance requires disclosures detailing the extent
to which companies measure assets and liabilities at fair value, the methods and assumptions used to measure fair value
and the effect of fair value measurements on earnings. Accordingly, the Company has applied the following valuation
techniques to measure fair value:
Level 1 - Quoted market prices in active markets for identical assets or liabilities
Level 2 - Significant other observable inputs (e.g., quoted prices for similar items in active markets, quoted prices
for identical or similar items in markets that are not active, inputs other than quoted prices that are
observable such as interest rate and yield curves, and market-corroborated inputs)
Level 3 - Unobservable inputs in which there is a little or no market data, which require the reporting entity to
develop its own assumptions
The following tables summarize those financial assets and liabilities measured at fair value on a recurring basis as of
September 30, 2013 and December 31, 2012:
In accordance with the accounting guidance related to business combinations, contingent consideration is recognized at
fair value at the end of each reporting period. The Company recorded $1.3 million related to the initial fair value
assessment of contingent consideration for certain 2012 acquisitions in Other liabilities on the Condensed Consolidated
Balance Sheets. Additionally, $2.0 million of assumed contingent consideration relating to an acquisition made by 180
Medical was paid in the third quarter of 2013. This $2.0 million of assumed contingent consideration was included in
Accrued expenses and other current liabilities on the Condensed Consolidated Balance Sheets as of December 31, 2012.
September 30, 2013 Total Level 1 Level 2 Level 3
Liabilities:
Contingent consideration
associated w ith acquisitions $ 1.3 $ - $ - $ 1.3
December 31, 2012
Liabilities:
Contingent consideration
associated w ith acquisitions $ 3.3 $ - $ - $ 3.3
Recurring Fair Value Measurements
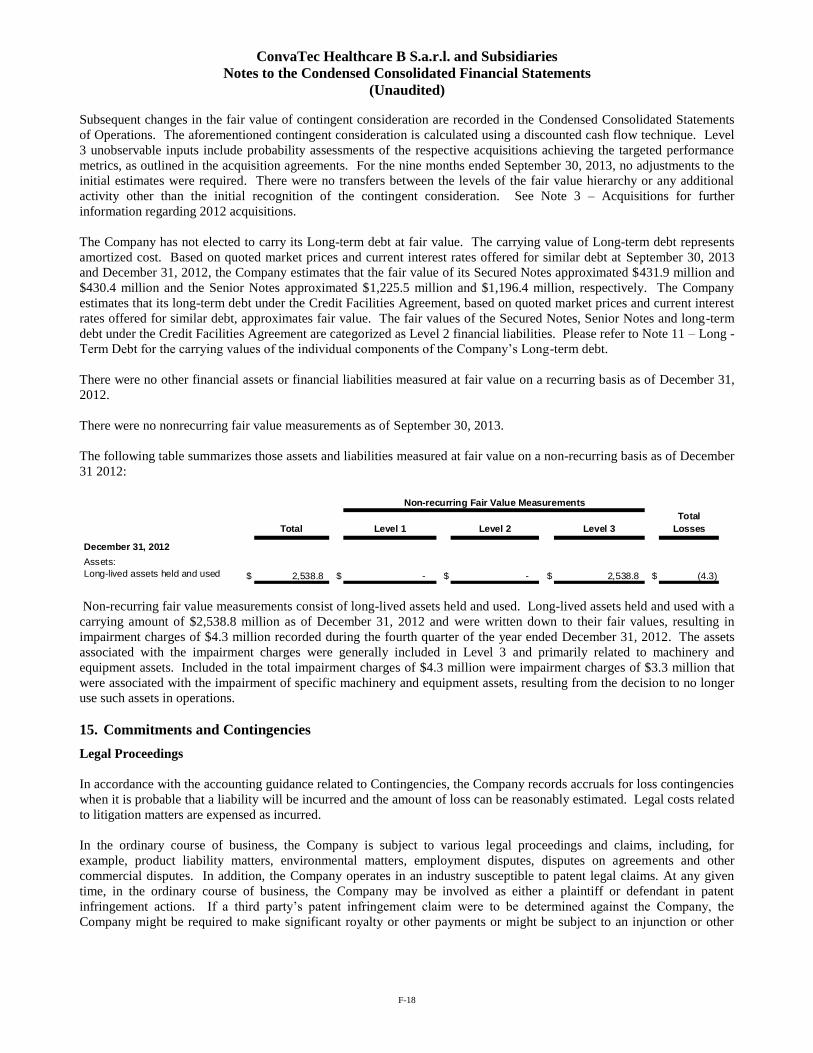
ConvaTec Healthcare B S.a.r.l. and Subsidiaries
Notes to the Condensed Consolidated Financial Statements
(Unaudited)
F-18
Subsequent changes in the fair value of contingent consideration are recorded in the Condensed Consolidated Statements
of Operations. The aforementioned contingent consideration is calculated using a discounted cash flow technique. Level
3 unobservable inputs include probability assessments of the respective acquisitions achieving the targeted performance
metrics, as outlined in the acquisition agreements. For the nine months ended September 30, 2013, no adjustments to the
initial estimates were required. There were no transfers between the levels of the fair value hierarchy or any additional
activity other than the initial recognition of the contingent consideration. See Note 3 – Acquisitions for further
information regarding 2012 acquisitions.
The Company has not elected to carry its Long-term debt at fair value. The carrying value of Long-term debt represents
amortized cost. Based on quoted market prices and current interest rates offered for similar debt at September 30, 2013
and December 31, 2012, the Company estimates that the fair value of its Secured Notes approximated $431.9 million and
$430.4 million and the Senior Notes approximated $1,225.5 million and $1,196.4 million, respectively. The Company
estimates that its long-term debt under the Credit Facilities Agreement, based on quoted market prices and current interest
rates offered for similar debt, approximates fair value. The fair values of the Secured Notes, Senior Notes and long-term
debt under the Credit Facilities Agreement are categorized as Level 2 financial liabilities. Please refer to Note 11 – Long -
Term Debt for the carrying values of the individual components of the Company‟s Long-term debt.
There were no other financial assets or financial liabilities measured at fair value on a recurring basis as of December 31,
2012.
There were no nonrecurring fair value measurements as of September 30, 2013.
The following table summarizes those assets and liabilities measured at fair value on a non-recurring basis as of December
31 2012:
Non-recurring fair value measurements consist of long-lived assets held and used. Long-lived assets held and used with a
carrying amount of $2,538.8 million as of December 31, 2012 and were written down to their fair values, resulting in
impairment charges of $4.3 million recorded during the fourth quarter of the year ended December 31, 2012. The assets
associated with the impairment charges were generally included in Level 3 and primarily related to machinery and
equipment assets. Included in the total impairment charges of $4.3 million were impairment charges of $3.3 million that
were associated with the impairment of specific machinery and equipment assets, resulting from the decision to no longer
use such assets in operations.
15. Commitments and Contingencies
Legal Proceedings
In accordance with the accounting guidance related to Contingencies, the Company records accruals for loss contingencies
when it is probable that a liability will be incurred and the amount of loss can be reasonably estimated. Legal costs related
to litigation matters are expensed as incurred.
In the ordinary course of business, the Company is subject to various legal proceedings and claims, including, for
example, product liability matters, environmental matters, employment disputes, disputes on agreements and other
commercial disputes. In addition, the Company operates in an industry susceptible to patent legal claims. At any given
time, in the ordinary course of business, the Company may be involved as either a plaintiff or defendant in patent
infringement actions. If a third party‟s patent infringement claim were to be determined against the Company, the
Company might be required to make significant royalty or other payments or might be subject to an injunction or other
Total Level 1 Level 2 Level 3
Total
Losses
December 31, 2012
Assets:
Long-lived assets held and used $ 2,538.8 $ - $ - $ 2,538.8 $ (4.3)
Non-recurring Fair Value Measurements

ConvaTec Healthcare B S.a.r.l. and Subsidiaries
Notes to the Condensed Consolidated Financial Statements
(Unaudited)
F-19
limitation on its ability to manufacture or distribute one or more products. If a patent owned by or licensed to the
Company were to be determined to be invalid or unenforceable, the Company might be required to reduce the value of the
patent on the Company‟s Condensed Consolidated Balance Sheets and to record a corresponding charge, which could be
significant in amount. There are various lawsuits, claims, proceedings and investigations which are currently pending
involving the Company.
The Company believes that it has adequately accrued for all legal matters or, for matters not requiring accrual, believes
that it will not have a material adverse impact on the results of operations, financial position or cash flows based on
information currently available. However, litigation is inherently unpredictable and, although the Company believes that
its accruals are adequate and/or that it has valid defenses in these matters, unfavorable resolutions could occur, which
could materially and adversely impact the Company‟s results of operations or cash flows in a particular reporting period.
In addition, based on the information available currently, the Company does not believe that any of these proceedings and
claims would have a material adverse effect on its business, results of operations, financial condition and/or liquidity.
Changes to Legal Proceedings that were disclosed in the 2012 Annual Report have not had a significant impact to the
financial statements through the nine months ended September 30, 2013.
Environmental Proceedings
The Company is a party to proceedings and other matters under various state, Federal and foreign environmental laws, and
from time to time incurs the costs of investigating and/or remediating contamination resulting from past industrial activity
at current or former company sites, or at waste disposal or reprocessing facilities operated by third parties.
With respect to Environmental matters for which the Company is responsible under various state, Federal and foreign
laws, the Company typically estimates potential costs based on information obtained from the U.S. Environmental
Protection Agency (EPA), or counterpart state agency and/or studies prepared by independent consultants, including total
estimated costs for the site and the expected cost-sharing, if any, with other “potentially responsible parties”, and the
Company accrues liabilities when they are probable and reasonably estimable. There have been no significant changes to
the Environmental Proceedings disclosed in the Company‟s Audited Consolidated Financial Statements contained in the
2012 Annual Report for the fiscal year ended December 31, 2012.
Other Matters
As a result of a recent inspection, the Company received a warning letter from the Food and Drug Administration
(„„FDA‟‟) dated May 24, 2013. The warning relates to complaints handling and other quality management systems at our
Skillman, New Jersey facility. Resources are being added to address the FDA concerns in a timely manner. At this time,
the Company has engaged third-party consultants to develop remediation procedures and is working closely and
cooperatively with the FDA to alleviate its concerns. The Company believes that these efforts will be adequate to address
the issues raised in the warning letter.
16. Subsequent Events
The Company has evaluated subsequent events through November 18, 2013, the date the financial statements were
available to be issued.