Embed Size (px)
Citation preview

Third Quarter 2002October 25, 2002
Note to Internet viewers: Please use “NOTES PAGES” view to access all notes and text.

Agenda - 3rd Quarter
• Highlights
• Economic Environment
• Operating Statistics
• Competitive Environment
• Revenue Highlights
• Income Highlights
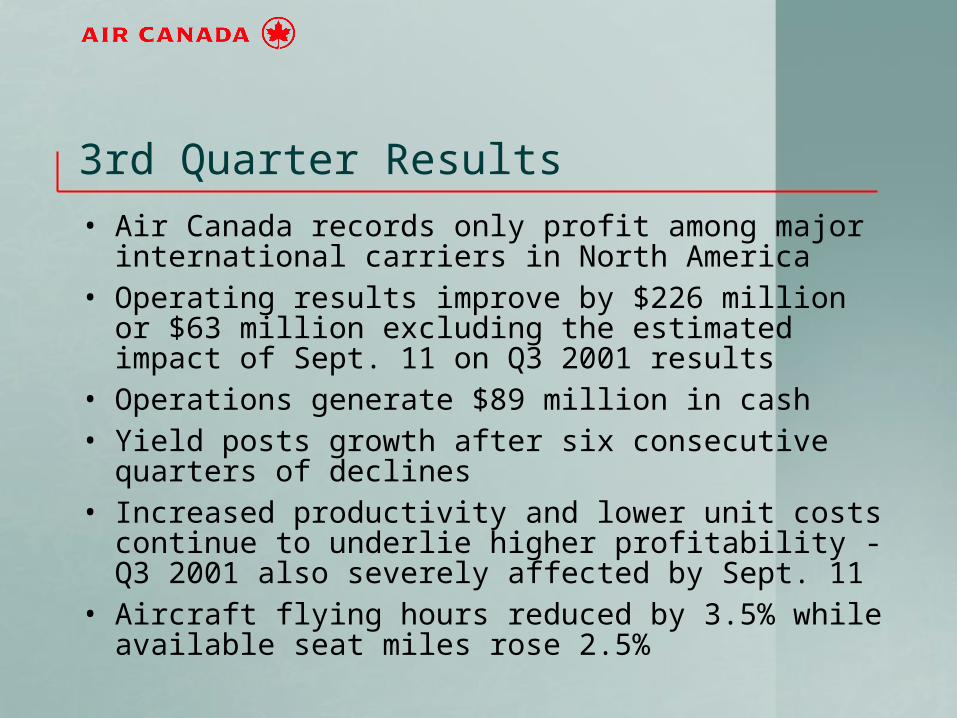
3rd Quarter Results
• Air Canada records only profit among major international carriers in North America
• Operating results improve by $226 million or $63 million excluding the estimated impact of Sept. 11 on Q3 2001 results
• Operations generate $89 million in cash• Yield posts growth after six consecutive quarters of
declines• Increased productivity and lower unit costs continue to
underlie higher profitability - Q3 2001 also severely affected by Sept. 11
• Aircraft flying hours reduced by 3.5% while available seat miles rose 2.5%

3rd Quarter Results
• Mainline scheduled load factor up 1.0 PP over adjusted Q3 2001
• Manpower level down 2,218 or 5.9% from Q3 2001
• Employee productivity up 4% over adjusted Q3 2001
• Fuel price per litre down 11%
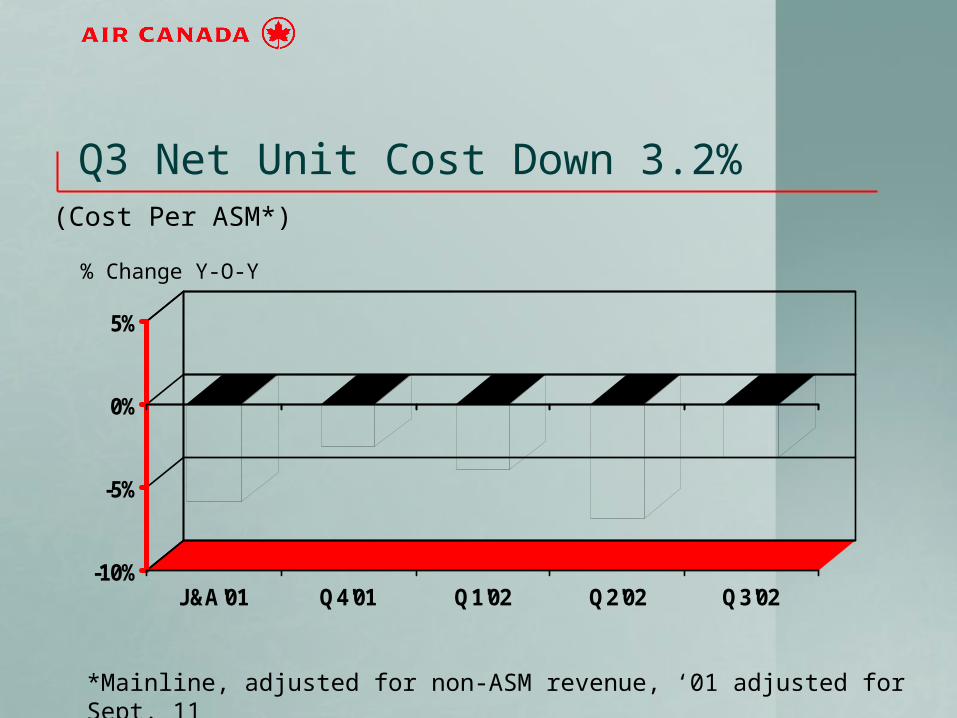
• Net unit cost down 3.2% over adjusted Q3 2001

3rd Quarter Results
• Quarter end cash of $0.7 billion
• Cash and committed financing total $0.9 billion
• $346 million in long-term debt repaid
• Additionally, $142 million of Air Canada’s yen
perpetual debt purchased for $50 million and gain of
$92 million
• $143 million in sale/leaseback proceeds primarily
from two CRJs and 11 engines
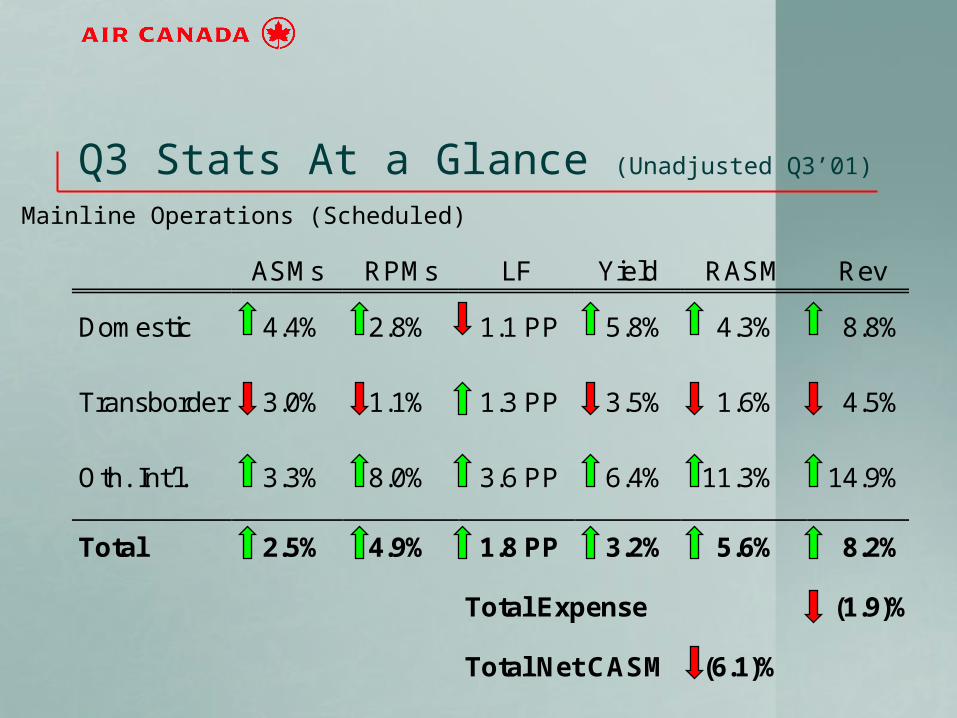
Q3 Stats At a Glance (Unadjusted Q3’01)
Mainline Operations (Scheduled)
ASMs RPMs LF Yield RASM Rev
Domestic 4.4% 2.8% 1.1 PP 5.8% 4.3% 8.8%
Transborder 3.0% 1.1% 1.3 PP 3.5% 1.6% 4.5%
Oth. Int’l. 3.3% 8.0% 3.6 PP 6.4% 11.3% 14.9%
Total 2.5% 4.9% 1.8 PP 3.2% 5.6% 8.2%
Total Expense (1.9)%
Total Net CASM (6.1)%

Q3 Stats At a Glance (Q3’01, adjusted for Sept. 11 impact)
Mainline Operations (Scheduled)
ASMs RPMs LF Yield RASM Rev
Domestic (1.0)% (2.8)% (1.4) PP 4.8% 2.9% 1.9%
Transborder (10.6)% (10.9)% (0.2) PP (6.8)% (7.1)% (17.0)%
Oth. Int’l. 0.4% 3.6% 2.6 PP 3.3% 6.6% 7.0%
Total (2.1)% (0.8)% 1.0 PP 0.2% 1.5% (0.7)%
Total Expense (3.6)%
Total Net CASM (3.2)%
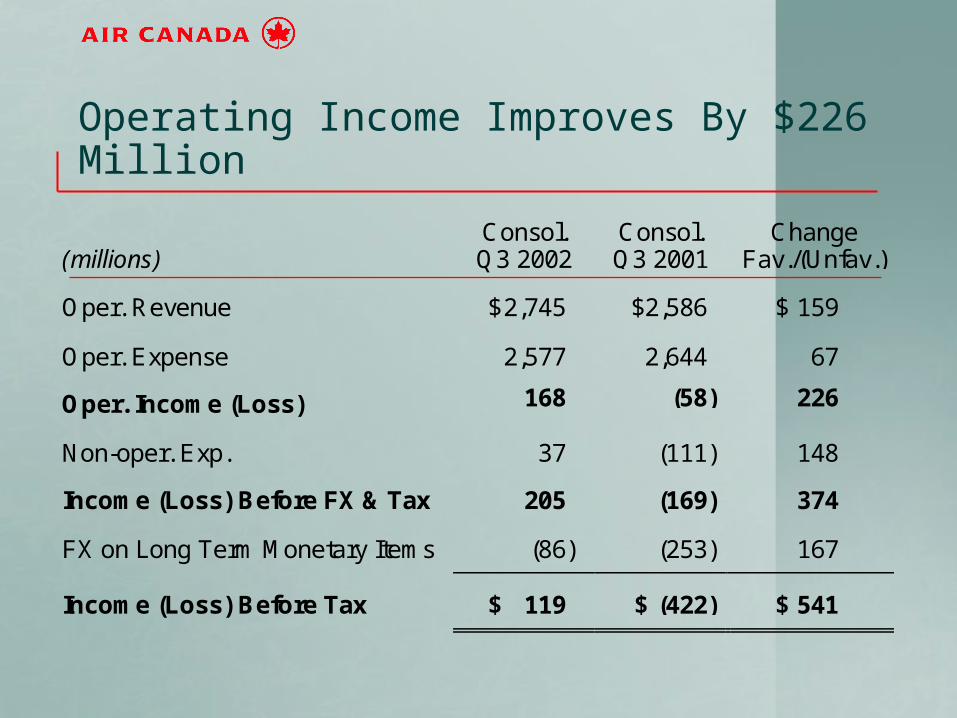
Operating Income Improves By $226 Million
(millions)Consol.Q3 2002
Consol.Q3 2001
ChangeFav./(Unfav.)
Oper. Revenue $2,745 $2,586 $ 159
Oper. Expense 2,577 2,644 67
Oper. Income (Loss) 168 (58) 226
Non-oper. Exp. 37 (111) 148
Income (Loss) Before FX & Tax 205 (169) 374
FX on Long Term Monetary Items (86) (253) 167
Income (Loss) Before Tax $ 119 $ (422) $ 541
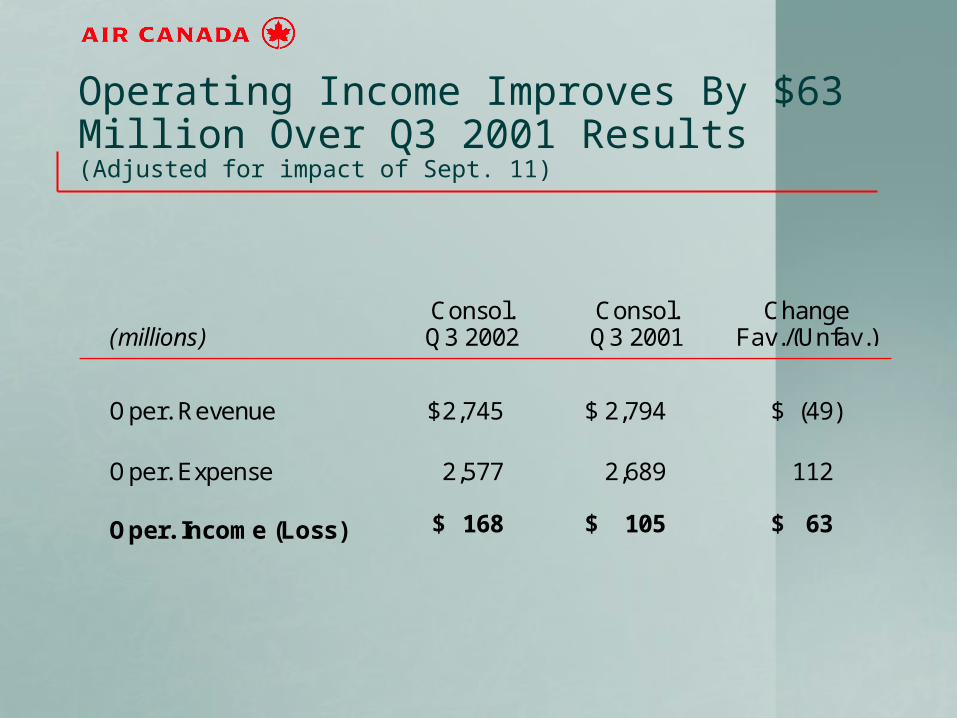
(millions)Consol.Q3 2002
Consol.Q3 2001
ChangeFav./(Unfav.)
Oper. Revenue $2,745 $ 2,794 $ (49)
Oper. Expense 2,577 2,689 112
Oper. Income (Loss) $ 168 $ 105 $ 63
Operating Income Improves By $63 Million Over Q3 2001 Results (Adjusted for impact of Sept. 11)

(millions) Q3 2002Change
Fav./(Unfav.)
Net Interest Inc. (Exp.) $ (58) $ 14
Gain (Loss) on Sale (12) 109Q3’01 acrft.retirementprovision $135million
Other Non-Operating Inc. (Exp.) 107 25
Total Non-Operating Inc. (Exp.) $ 37 $ 148
Q3’02 gain onrepurchase ofyen perpetuals$92 million.
Q3’01anticipatedGov. assist.$105 million
Q3 Net Interest Exp. Improves $14 Million
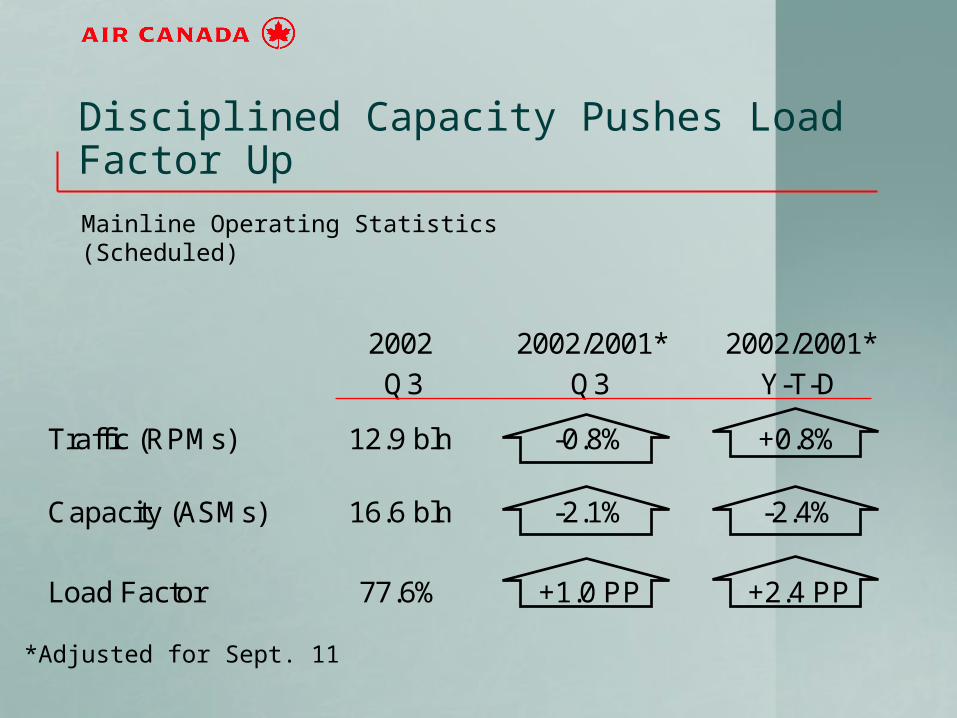
2002
Q3
2002/2001*
Q3
2002/2001*
Y-T-D
Traffic (RPMs) 12.9 bln -0.8% +0.8%
Capacity (ASMs) 16.6 bln -2.1% -2.4%
Load Factor 77.6% +1.0 PP +2.4 PP
Disciplined Capacity Pushes Load Factor Up
Mainline Operating Statistics (Scheduled)
*Adjusted for Sept. 11
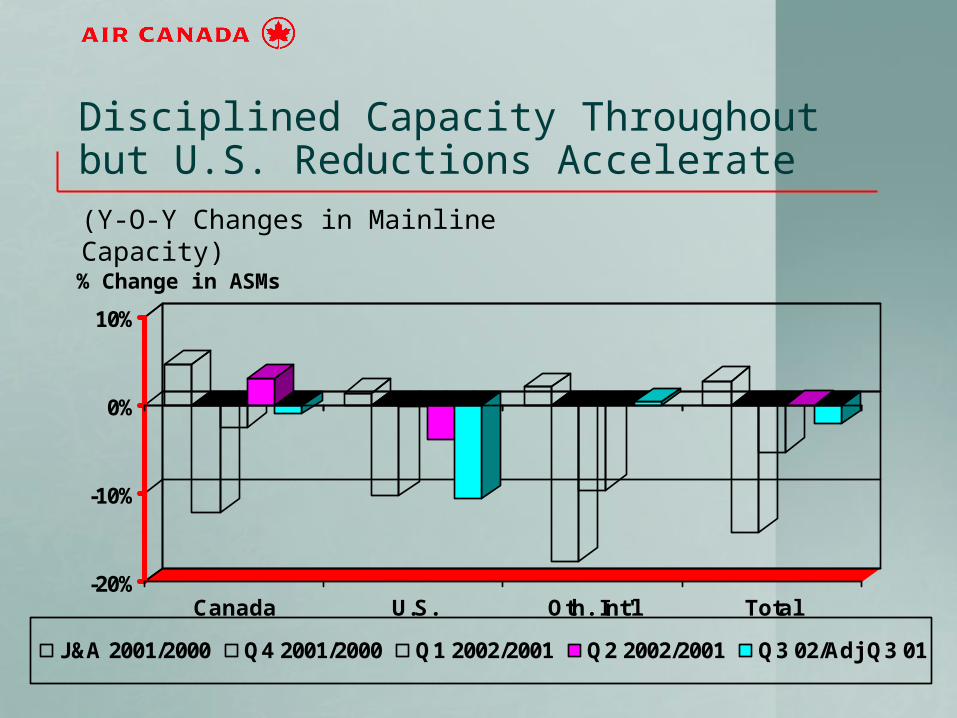
Disciplined Capacity Throughout but U.S. Reductions Accelerate(Y-O-Y Changes in Mainline Capacity)
-20%
-10%
0%
10%
Canada U.S. Oth. Int'l Total
J&A 2001/2000 Q4 2001/2000 Q1 2002/2001 Q2 2002/2001 Q3 02/Adj Q3 01
% Change in ASMs
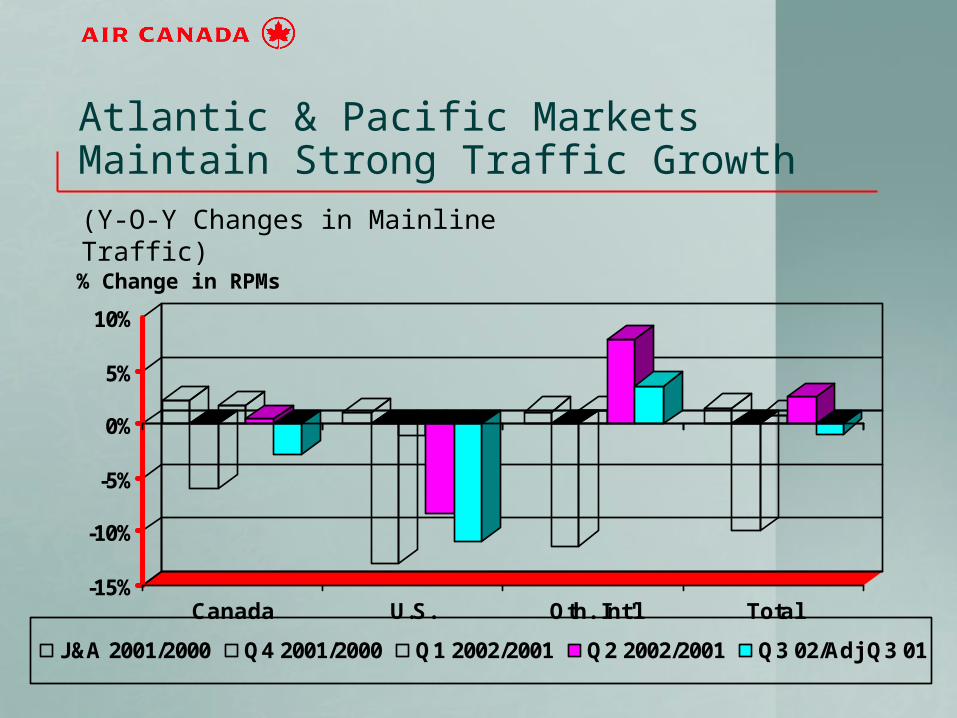
Atlantic & Pacific Markets Maintain Strong Traffic Growth(Y-O-Y Changes in Mainline Traffic)
-15%
-10%
-5%
0%
5%
10%
Canada U.S. Oth. Int'l Total
J&A 2001/2000 Q4 2001/2000 Q1 2002/2001 Q2 2002/2001 Q3 02/Adj Q3 01
% Change in RPMs

System Yield Stabilizes After Six Quarters Of Decline(Y-O-Y Changes in Mainline Passenger Yield)
-20%
-15%
-10%
-5%
0%
5%
Canada U.S. Oth. Int'l Total
J&A 2001/2000 Q4 2001/2000 Q1 2002/2001 Q2 2002/2001 Q3 02/Adj Q3 01
% Change in Yield

RASM Lifts On Very Strong Atlantic & Pacific
Performance(Y-O-Y Changes in Mainline Revenue per ASM)
-24%
-16%
-8%
0%
8%
16%
Canada U.S. Oth. Int'l Total
J&A 2001/2000 Q4 2001/2000 Q1 2002/2001 Q2 2002/2001 Q3 02/Adj Q3 01
% Change in RASM
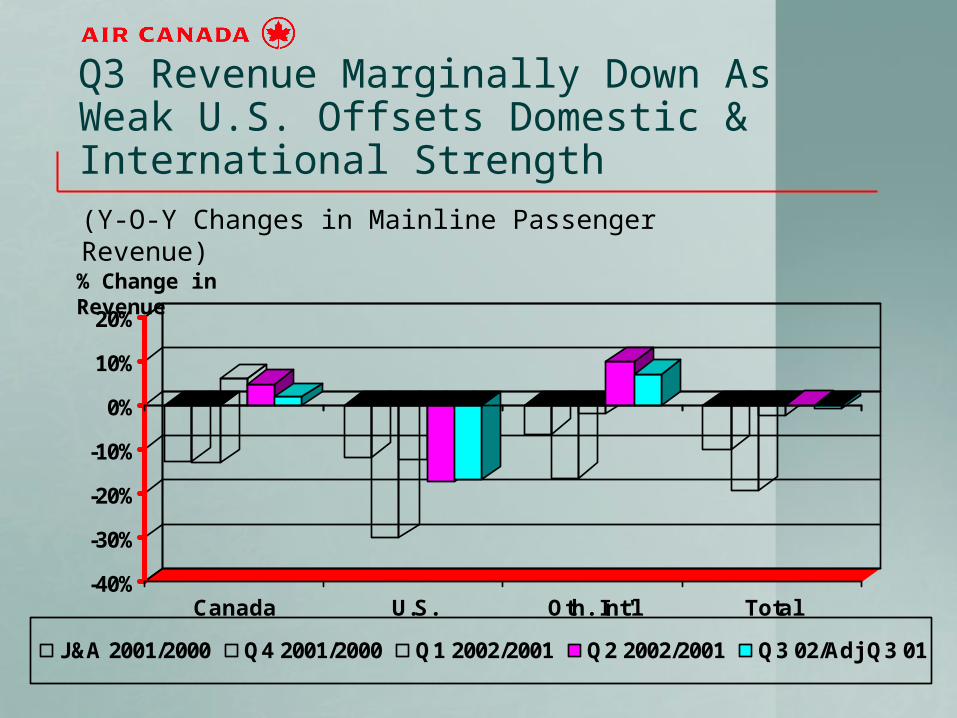
Q3 Revenue Marginally Down As Weak U.S. Offsets Domestic & International Strength(Y-O-Y Changes in Mainline Passenger Revenue)
-40%
-30%
-20%
-10%
0%
10%
20%
Canada U.S. Oth. Int'l Total
J&A 2001/2000 Q4 2001/2000 Q1 2002/2001 Q2 2002/2001 Q3 02/Adj Q3 01
% Change in Revenue
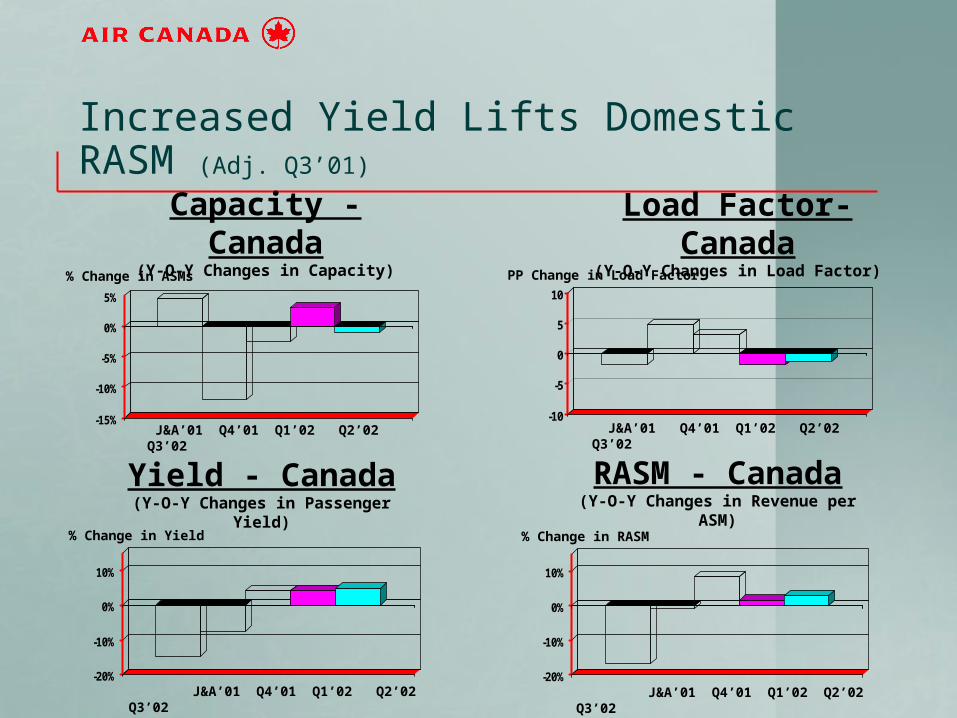
Increased Yield Lifts Domestic RASM (Adj. Q3’01)
-10
-5
0
5
10
-15%
-10%
-5%
0%
5%
J&A’01 Q4’01 Q1’02 Q2’02 Q3’02
Capacity - Canada(Y-O-Y Changes in Capacity)
% Change in ASMs
-20%
-10%
0%
10%
-20%
-10%
0%
10%
Yield - Canada(Y-O-Y Changes in Passenger Yield)
RASM - Canada(Y-O-Y Changes in Revenue per ASM)
Load Factor- Canada(Y-O-Y Changes in Load Factor)
% Change in RASM
PP Change in Load Factor
% Change in Yield
J&A’01 Q4’01 Q1’02 Q2’02 Q3’02 J&A’01 Q4’01 Q1’02 Q2’02 Q3’02
J&A’01 Q4’01 Q1’02 Q2’02 Q3’02

U.S. RASM Down On Weak Pricing (Adj. Q3’01)
-10
-5
0
5
10
-15%
-10%
-5%
0%
5%
J&A’01 Q4’01 Q1’02 Q2’02 Q3’02
Capacity - Transborder(Y-O-Y Changes in Capacity)
% Change in ASMs
-25%
-15%
-5%
5%
15%
-30%
-20%
-10%
0%
10%
Yield - Transborder(Y-O-Y Changes in Passenger Yield)
RASM - Transborder (Y-O-Y Changes in Revenue per ASM)
Load Factor- Transborder (Y-O-Y Changes in Load Factor)
% Change in RASM
PP Change in Load Factor
% Change in Yield
J&A’01 Q4’01 Q1’02 Q2’02 Q3’02 J&A’01 Q4’01 Q1’02 Q2’02 Q3’02
J&A’01 Q4’01 Q1’02 Q2’02 Q3’02

Other Int’l RASM Up On Higher Load Factor And Yield (Adj. Q3’01)
-10
-5
0
5
10
-20%
-15%
-10%
-5%
0%
5%
J&A’01 Q4’01 Q1’02 Q2’02 Q3’02
Capacity - Other Int’l(Y-O-Y Changes in Capacity)
% Change in ASMs
-10%
-5%
0%
5%
10%
15%
-10%
-5%
0%
5%
Yield - Other Int’l(Y-O-Y Changes in Passenger Yield)
RASM - Other Int’l (Y-O-Y Changes in Revenue per ASM)
Load Factor- Other Int’l (Y-O-Y Changes in Load Factor)
% Change in RASM
PP Change in Load Factor
% Change in Yield
J&A’01 Q4’01 Q1’02 Q2’02 Q3’02 J&A’01 Q4’01 Q1’02 Q2’02 Q3’02
J&A’01 Q4’01 Q1’02 Q2’02 Q3’02
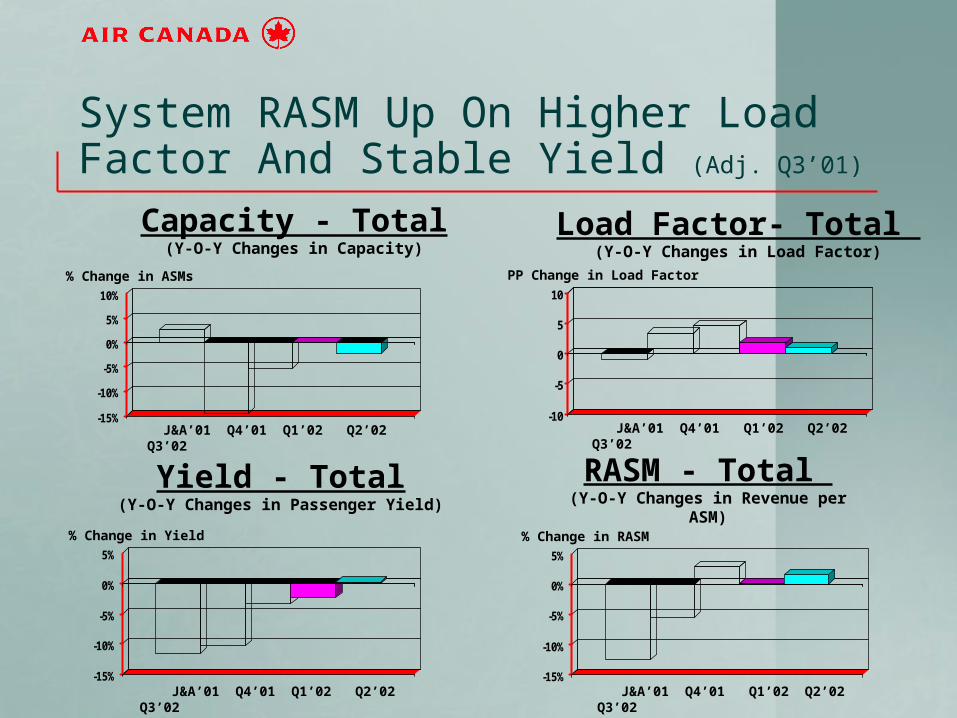
System RASM Up On Higher Load Factor And Stable Yield (Adj. Q3’01)
-10
-5
0
5
10
-15%
-10%
-5%
0%
5%
10%
J&A’01 Q4’01 Q1’02 Q2’02 Q3’02
Capacity - Total(Y-O-Y Changes in Capacity)
% Change in ASMs
-15%
-10%
-5%
0%
5%
-15%
-10%
-5%
0%
5%
Yield - Total(Y-O-Y Changes in Passenger Yield)
RASM - Total (Y-O-Y Changes in Revenue per ASM)
Load Factor- Total (Y-O-Y Changes in Load Factor)
% Change in RASM
PP Change in Load Factor
% Change in Yield
J&A’01 Q4’01 Q1’02 Q2’02 Q3’02 J&A’01 Q4’01 Q1’02 Q2’02 Q3’02
J&A’01 Q4’01 Q1’02 Q2’02 Q3’02
-25%
-20%
-15%
-10%
-5%
0%
5%
10%
-20%
-10%
0%
10%
20%
CASM RASM
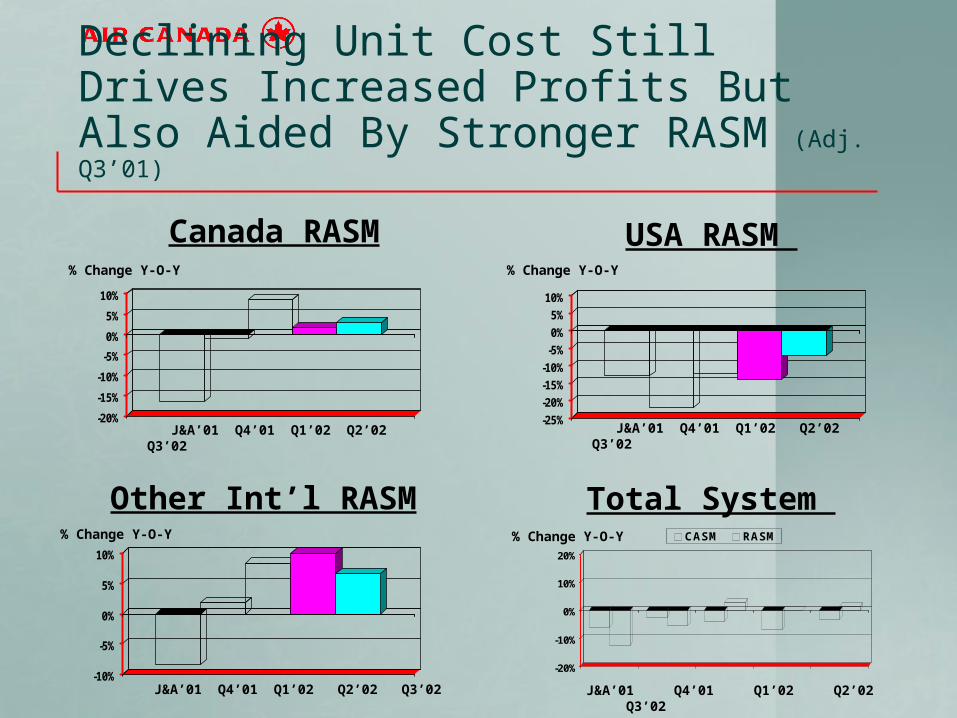
Declining Unit Cost Still Drives Increased Profits But Also Aided By Stronger RASM (Adj. Q3’01)
-20%
-15%
-10%
-5%
0%
5%
10%
J&A’01 Q4’01 Q1’02 Q2’02 Q3’02
Canada RASM% Change Y-O-Y
-10%
-5%
0%
5%
10%
Other Int’l RASM Total System
USA RASM
% Change Y-O-Y
% Change Y-O-Y
% Change Y-O-Y
J&A’01 Q4’01 Q1’02 Q2’02 Q3’02 J&A’01 Q4’01 Q1’02 Q2’02 Q3’02
J&A’01 Q4’01 Q1’02 Q2’02 Q3’02

Air Canada Continues to Record The Best Traffic Results Of Any Major N.A. Carrier (Unadjusted Q3’01)
(Y-O-Y Traffic Change)
-40%
-20%
0%
20%
AC AMR CONT DEL UAL USAIR
Q3 2001/2000 Q4 2001/2000 Q1 2002/2001 Q2 2002/2001 Q3 2002/2001
% Change in RPMs
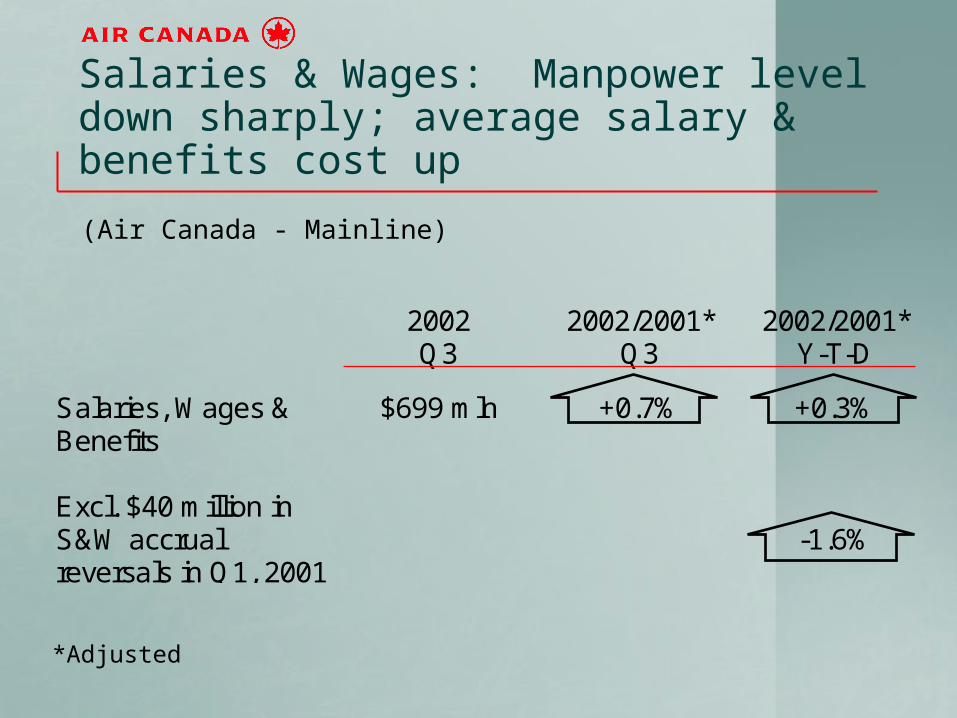
2002Q3
2002/2001*Q3
2002/2001*Y-T-D
Salaries, Wages &Benefits
$699 mln +0.7% +0.3%
Excl. $40 million inS&W accrualreversals in Q1, 2001
-1.6%
Salaries & Wages: Manpower level down sharply; average salary & benefits cost up
(Air Canada - Mainline)
*Adjusted
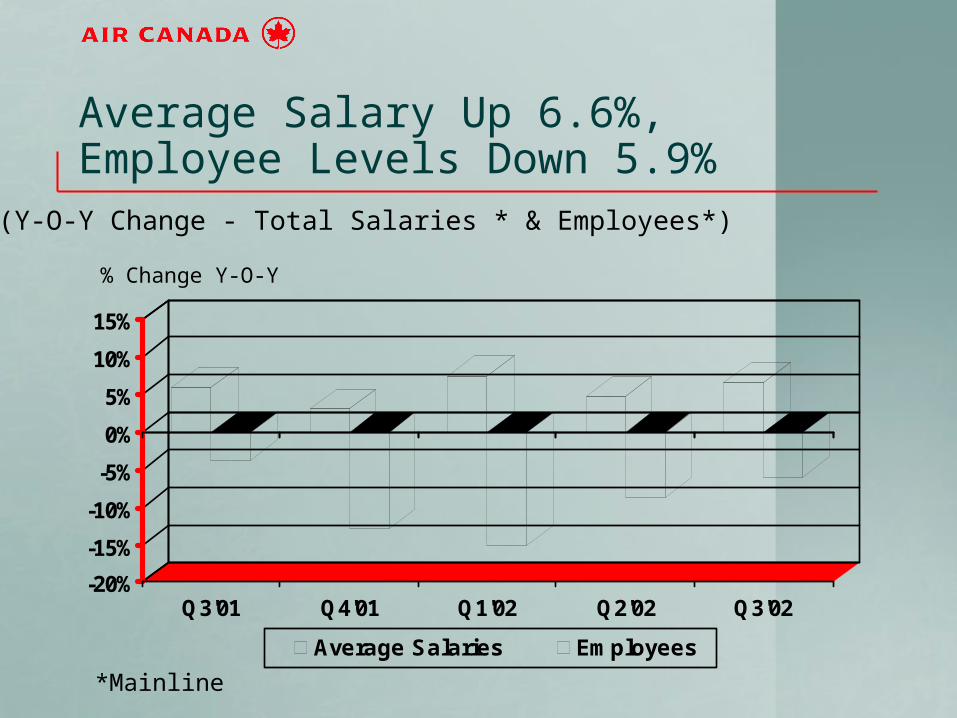
Average Salary Up 6.6%, Employee Levels Down 5.9%(Y-O-Y Change - Total Salaries * & Employees*)
-20%
-15%
-10%
-5%
0%
5%
10%
15%
Q3'01 Q4'01 Q1'02 Q2'02 Q3'02
Average Salaries Employees
*Mainline
% Change Y-O-Y
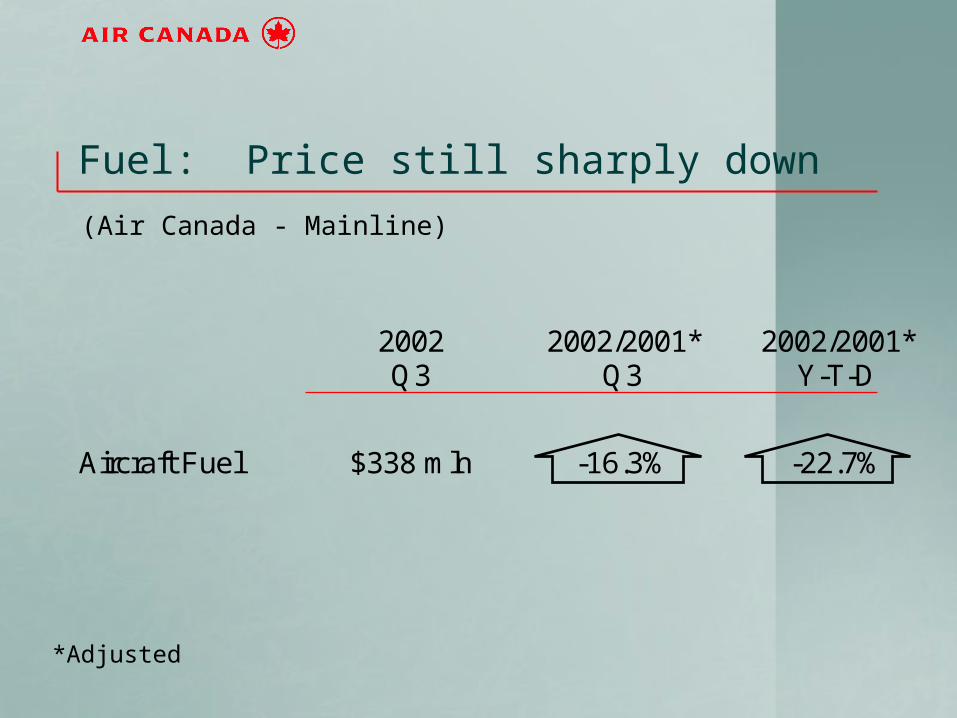
2002Q3
2002/2001*Q3
2002/2001*Y-T-D
Aircraft Fuel $338 mln -16.3% -22.7%
Fuel: Price still sharply down
(Air Canada - Mainline)
*Adjusted

-25%
-20%
-15%
-10%
-5%
0%
5%
10%
J&A'01 Q4'01 Q1'02 Q2'02 Q3'02
Fuel Productivity (ASMs/Lt) Fuel Cost (Cdn cts/Lt)
Mainline Cost Per Litre Down 11% While Productivity Up 4.4%(Fuel Productivity* & Unit Cost*)
*Mainline
% Change Y-O-Y

-30%
-20%
-10%
0%
10%
20%
All Expense Categories Down except Aircraft Rent, User Fees and Other
*Mainline, ‘01 adjusted for Sept. 11
% Change Y-O-Y
Q3 2002/2001
RPMs ASMs COMM. FOOD& BAR
A/CMTCE
USERFEES
A/CRENT
OTHERDEP.
-10%
-5%
0%
5%
J&A'01 Q4'01 Q1'02 Q2'02 Q3'02
Q3 Net Unit Cost Down 3.2%(Cost Per ASM*)
*Mainline, adjusted for non-ASM revenue, ‘01 adjusted for Sept. 11
% Change Y-O-Y

-4%
-2%
0%
2%
Fuel a Major Component Of Net CASM* Improvement Of 3.2%
*Mainline
LabourLabourFuelFuel Unit cost decrease
net of non-ASM revenue
OtherEffect of Effect of non-ASM non-ASM revenuerevenue

9.5 10.19.4 9.8
9.1 9.48.6 8.8
8.28.8
7.4 7.9 7.1 7.3
0
4
8
12
AMR UAL DEL NWEST CONT AC SWEST
Q3'02 Q3'01
Air Canada Has Lowest Net Unit Cost Of N.A. Majors
*Adjusted for non-ASM producing activity.** Not adjusted for Sept. 11
(Unit Cost* per ASM - Q3‘02 & Q3‘01**)
U.S. cents

Sept 30/02$ mlns
Dec 31/01$ mlns
%Change
Cash $ 717 $ 1,067 -32.8% Current Assets $ 2,029 $ 2,235 -9.2% Property & Equip. $ 2,516 $ 2,830 -11.1% Current Liabilities $ 2,807 $ 2,869 -2.2% Long Term Debt $ 4,234 $ 4,580 -7.6% Shareholder’s Equity $ (1,524) $ (1,460)* NM Book Value per share $ (12.68) $(12.15)* NM
Balance Sheet - Liquidity is Good(Air Canada - Consolidated)
NM - not meaningful


![Meeting Notes 2002-06-13 [Part B]](https://img.pdfslide.us/doc/110x75/61bd489261276e740b114045/meeting-notes-2002-06-13-part-b.jpg)