Embed Size (px)
Citation preview
Third International Workshop on Tokyo Metropolitan Area Convection Study
for Extreme Weather Resilient Cities (WMO/WWRP, TOMACS/RDP)
Abstracts
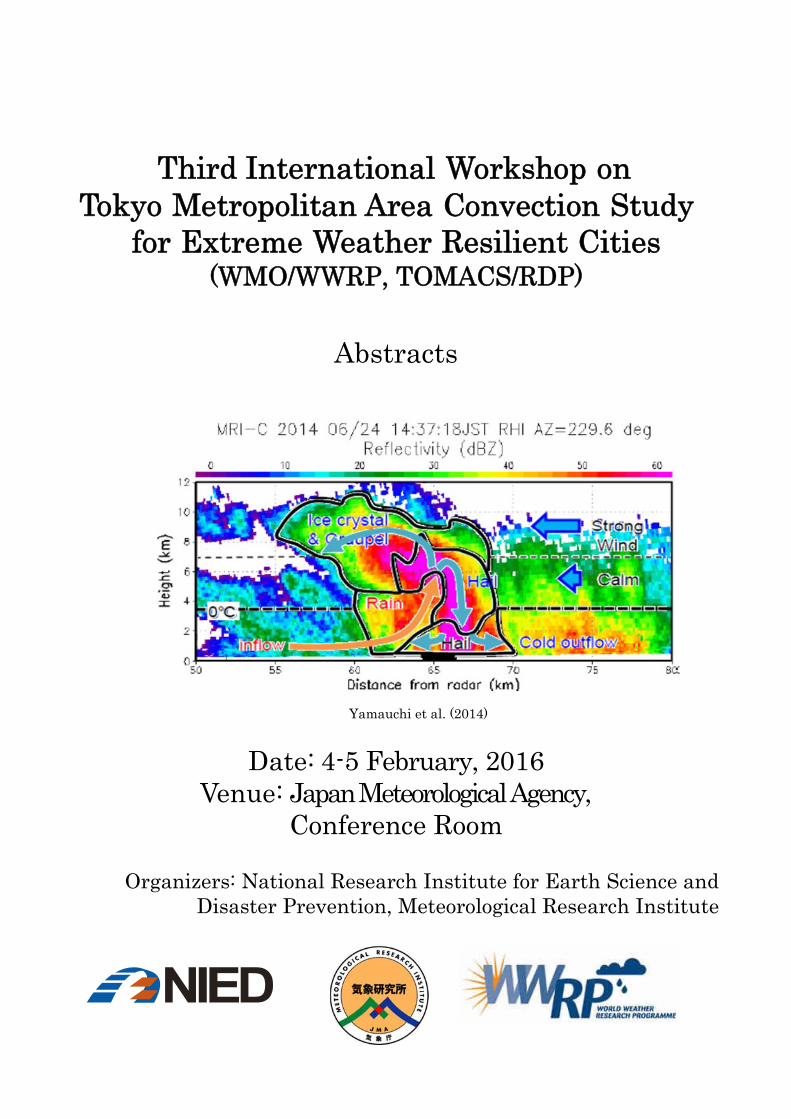
Yamauchi et al. (2014)
Date: 4-5 February, 2016 Venue: Japan Meteorological Agency,
Conference Room
Organizers: National Research Institute for Earth Science and Disaster Prevention, Meteorological Research Institute

February 4 (Thursday), 2016
11:30-13:00 Registration
13:00-13:20 Opening Session (Chair: Saito, MRI)
Opening Address Kenji Akaeda[1] [1]JMA
General Introduction of TOMACS Tsuyoshi Nakatani[1] [1]NIED
13:20-14:20 Session ‘Local High Impact Weather Projects 1’ (Chair: Misumi, NIED)
13:20-13:40
RainGain and TOMACS projects: how to improve retrieval algorithms
Daniel Schertzer[1]*, Ioulia Tchiguirinskaia[1], Auguste Gires[1], Igor Paz[1], Bruno Tisserand[2], Bernard Willinger[3], Laurent Monier[4], François Thouvenel[2], Pascal Boisson[2] [1]Ecole des Ponts ParisTech, Hydrology Meteorology and Complexity (HM&Co)
and Chair “Hydrology for Resilient Cities”. [2]Veolia Research and Innovation, Maisons-Laffitte, France [3]Veolia Water, Massy, France [4]Veolia Water, Saint Maurice, France
13:40-14:00
Observations and warnings of floods, tornadoes, hail and lightning in CASA DFW Urban Demonstration Network during 2015 V. Chandrasekar[1], Brenda Philips[1], Haonan Chen[1] and the full DFW CASA team [1] Colorado State University and CASA
14:00-14:20
Plan of the field observation in the Tokyo metropolitan area: Lifecycle of Cumulonimbus Experiment (LCbEX) Koyuru Iwanami[1], Ryohei Misumi[1], Shin-ichi Suzuki[1], Takeshi Maesaka[1], Shingo Shimizu[1], Yukari Shusse[1], Namiko Sakurai[1], Ken-ichi Shimose[1], Ryohei Kato[1], Kaori Kieda[1], and Yasushi Uji[1]
[1]NIED
14:20-15:00 Session ‘Local High Impact Weather Projects 2’ (Chair: Otsuka, MRI)
14:20-14:40
Novel observations of lower tropospheric water-vapor and temperature fields and their applications for improving short-range weather forecasting
Volker Wulfmeyer[1] and Andreas Behrendt[1]
[1]Institute of Physics and Meteorology University of Hohenheim
14:40-15:00
Big data assimilation revolutionizing numerical weather prediction Takemasa Miyoshi[1], K. Kondo[1], K. Terasaki[1], M. Kunii[2], J. Ruiz[3], G.-Y. Lien[1],S. Satoh[4], T. Ushio[5], H. Tomita[1], Y. Ishikawa[1], K. Bessho[6], and H. Seko[2] [1]RIKEN Advanced Institute for Computational Science [2]MRI [3]CIMA, CONICET-University of Buenos Aires, Buenos Aires, Argentina [4]NICT [5]Osaka University [6]Meteorological Satellite Center
15:00-15:10 Group Photo
15:10-15:25 Break
15:25-16:45 Session ‘Observation 1’ (Chair: Adachi, MRI)
15:25-15:45
What is the main factor for extreme rainfall in Busan, Korea? Jong-Hoon Jeong[1], Dong-In Lee[2], Chung-Chieh Wang[3], and In-Seong Han[4] [1]Radar Analysis Division, Weather Radar Center, KMA, Seoul, Korea [2]Department of Environmental Atmospheric Sciences, Pukyong National
University, Busan, Korea [3]Department of Earth Sciences, National Taiwan Normal University, Taipei,
Taiwan [4]Fishery and Ocean Information Division, National Fisheries Research &
Development
15:45-16:00
Three-dimensional dynamic observation of a mesocyclone and vault structure by phased array weather radar in Tsukuba Toru Adachi[1], Kenichi Kusunoki[1], Satoru Yoshida[1]
[1]MRI
16:00-16:15
Evolution of convective clouds initiated over mountains observed by Ka-band scanning Doppler radar and stereo photogrammetry Ryohei Misumi[1], Namiko Sakurai[1],Takeshi Maesaka[1], Shin-ichi Suzuki[1], Shingo Shimizu[1], and Koyuru Iwanami[1]
[1]NIED
1615-16:30
Osaka urban phased array radar network experiment Tomoo Ushio[1], Shigeharu Shimamura[1], Fumihiko Mizutani[1], Masakazu Wada[1], Shinsuke Satoh[2], Nobuhiro Takahashi[2], Toshio Iguchi[2] [1]Osaka University [2]NICT
16:30-16:45
Case study on preceding meteorological conditions of sudden appearance of convective precipitating cells on Kofu Basin in Summer Tetsuya Sano[1], Tadashi Suetsugi[1] and Satoru Oishi[2] [1]Interdisciplinary Centre for River Basin Environment, University of
Yamanashi [2]Research Center for Urban Safety and Security, Kobe University
16:45-17:20 Session ‘Urban Weather’ (Chair: Seino, MRI)
16:45-17:05
Numerical forecast of an intense precipitation event over Tokyo: role and impact of the urban environment Stephane Belair[1], Sylvie Leroyer[1], Naoko Seino[2], Lubos Spacek[1], Vanh Souvanlassy[1], and Danahe Paquin-Ricard[1] [1]Environment Canada [2]MRI
17:05-17:20
Numerical simulation of urban impact on summertime precipitation in Tokyo: How does urban temperature rise affect precipitation? Naoko Seino[1], Hirofumi Sugawara[2], Ryoko Oda[3], Toshinori Aoyagi[1], and Hiroshige Tsuguti[1] [1]MRI [2]National Defense Academy [3]Chiba Institute of Technology
18:00- Banquette ( KKR Hotel Tokyo)
February 5 (Friday), 2016
9:30-10:30 Session ‘Observation 2’ (Chair: Seko, MRI)
9:30-9:50
Overview of Japanese new generation geostationary meteorological satellite, Himawari-8 and its applications Kazuki Shimoji[1]
[1]The Meteorological Satellite Center of the Japan Meteorological Agency
9:50-10:10
4D Water vapor variation associated with severe storms estimated from the ground observation networks of specific humidity and GNSS Yoshinori Shoji[1]
[1]MRI
10:10-10:30
Relationships between cloud-to-ground lightning activity and lightning indices using X-band polarimetric radar in warm-season convective storms during LCbEX period Namiko Sakurai[1], Shingo Shimizu[1], Yukari Shusse[1], Shin-ichi Suzuki[1], Takeshi Maesaka[1], Kaori Kieda[1], and Koyuru Iwanami[1]
[1]NIED
10:30-11:30 Session ‘Numerical Simulation’ (Chair: Shoji, MRI)
10:30-10:50
Investigation of a high impact precipitation event over the Tokyo Metropolitan Area using a nested configuration of WRF-NOAHMP down to the LES scale Hans-Stefan Bauer[1], Thomas Schwitalla[1] and Volker Wulfmeyer[1]
[1]Institute of Physics and Meteorology University of Hohenheim
10:50-11:10
Diurnal cycle of convection during TOMACS and ARPS case studies
Augusto Jose Pereira Filho[1]. Felipe Vemado[1], Kazuo Saito[2], Hiromu Seko[2], Jose Luis Flores Rojas[1] and Hugo Abi Karam[3] [1]Universidade de Sao Paulo [2]Meteorological Research Institute, Japan Meteorological Agency [3]Universidade Federal do Rio de Janeiro
11:10-11:30
Cloud resolving ensemble experiment of a local heavy rainfall event on 26 August 2011 observed by TOMACS Kazuo Saito[1], Masaru Kunii[1] and Kentaro Araki[1]
[1]MRI
11:30-13:30 Lunch Break
13:30-14:20 Session ‘Nowcasting’ (Chair: Hirano, NIED )
13:30-13:50
Improving short-rage quantitative precipitation forecast by assimilating thermodynamic variables retrieved from dual sector-volume-scan observations during summer seasons from 2011 to 2013 in Tokyo metropolitan region, Japan S. Shimizu[1], K. Iwanami[1], N. Sakurai[1], T. Maesaka[1], K. Kieda[1], S. Suzuki[1], S. Shusse[1] [1]NIED
13:50-14:05
An introduction for social experiment of VIL nowcast that provides precise 10 minute ahead rainfall information of localized torrential rainfall Kohin Hirano[1], Ryohei Misumi[1], Masayuki Maki[2], Koyuru Iwanami[1], and Tsuyoshi Nakatani[1] [1]NIED [2]Kagoshima University

14:05-14:20
Rainfall Runoff Modeling Using High Resolution Radar Rainfall Data
Shakti P.C[1], R. Misumi[1], T. Nakatani[1], K. Iwanami[1], K Hirano[1]
[1]NIED 14:20-15:40 Session ‘Data Assimilation’ (Chair: Suzuki, NIED)
14:20-14:40
Study of the impact of high temporal resolution observation in the meso-scale hybrid4D-Var system
Yasutaka Ikuta[1] [1]JMA
14:40-14:55
Ensemble data assimilation of dense observations for rainfall near Tokyo on 18 July 2013 Sho Yokota[1], Le Duc[2,1], Seiji Origuchi[1], Takuya Kawabata[1], and Tadashi Tsuyuki[3,1] [1]MRI [2]JAMSTEC [3]Meteorological College
14:55-15:10
Comparison of forward operators for polarimetric radars aiming for data assimilation Takuya Kawabata[1], Hans-Stefan Bauer[2], Thomas Schwitalla[2], Volke Wulfmeyer[2] and Ahoro Adachi[1] [1]MRI [2]University of Hohenheim
15:10-15:25
Data assimilation experiments on the 26 August 2011 heavy rainfall event over Kanto Le Duc[1,2], Takuya Kawabata[2], and Kazuo Saito[2,1] [1]JAMSTEC [2]MRI
15:25-15:40
Data assimilation experiment of high resolution precipitable water vapor data using a nested NHM-LETKF system Masanori Oigawa[1], Toshitaka Tsuda[1], and Hiromu Seko[2] [1]Research Institute for Sustainable Humanosphere, Kyoto University
[2]MRI
15:40-15:55 Closing (Masayuki Maki, Kagoshima Univ.)
16:10-16:40 Business meeting (Room #141) ,
JAMSTEC: Japan Agency for Marine-Earth Science and Technology
JMA: Japan Meteorological Agency
MRI: Meteorological Research Institute, Japan Meteorological Agency
NICT: National Institute of Information and Communication Technology
NIED: National Research Institute for Earth Science and Disaster Prevention
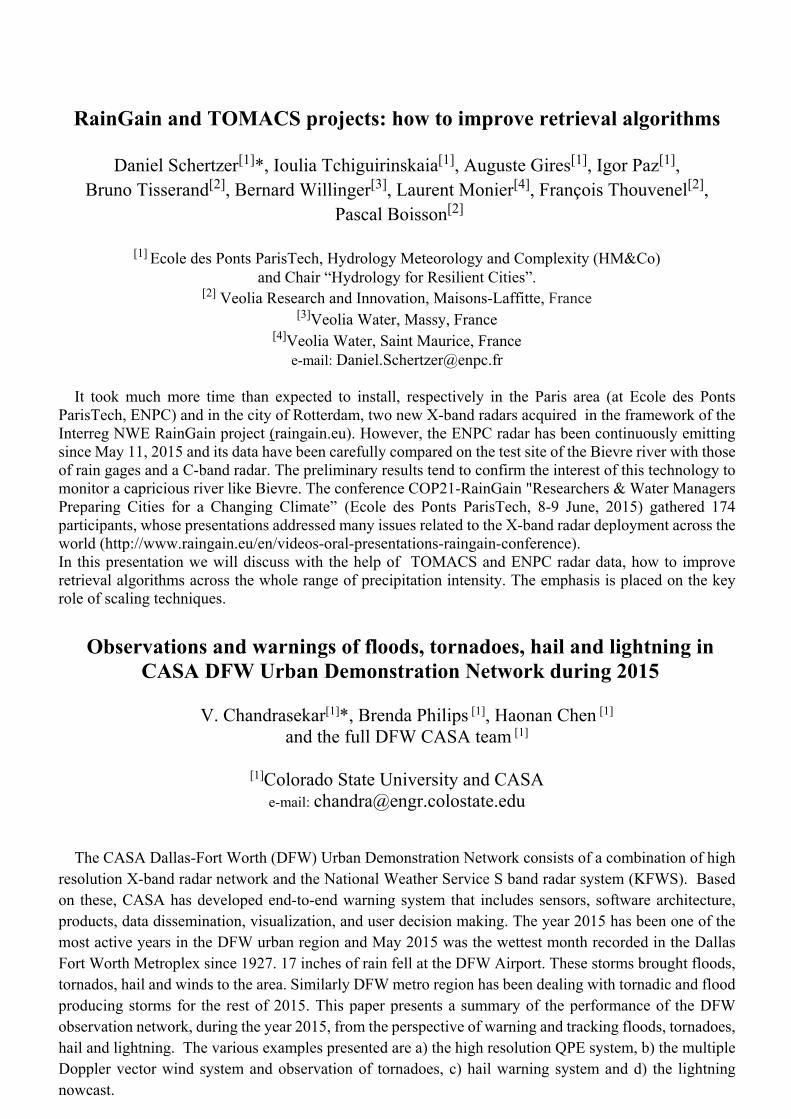
RainGain and TOMACS projects: how to improve retrieval algorithms
Daniel Schertzer[1]*, Ioulia Tchiguirinskaia[1], Auguste Gires[1], Igor Paz[1], Bruno Tisserand[2], Bernard Willinger[3], Laurent Monier[4], François Thouvenel[2],
Pascal Boisson[2]
[1] Ecole des Ponts ParisTech, Hydrology Meteorology and Complexity (HM&Co) and Chair “Hydrology for Resilient Cities”.
[2] Veolia Research and Innovation, Maisons-Laffitte, France [3]Veolia Water, Massy, France
[4]Veolia Water, Saint Maurice, France
e-mail: [email protected]
It took much more time than expected to install, respectively in the Paris area (at Ecole des Ponts ParisTech, ENPC) and in the city of Rotterdam, two new X-band radars acquired in the framework of the Interreg NWE RainGain project (raingain.eu). However, the ENPC radar has been continuously emitting since May 11, 2015 and its data have been carefully compared on the test site of the Bievre river with those of rain gages and a C-band radar. The preliminary results tend to confirm the interest of this technology to monitor a capricious river like Bievre. The conference COP21-RainGain "Researchers & Water Managers Preparing Cities for a Changing Climate” (Ecole des Ponts ParisTech, 8-9 June, 2015) gathered 174 participants, whose presentations addressed many issues related to the X-band radar deployment across the world (http://www.raingain.eu/en/videos-oral-presentations-raingain-conference). In this presentation we will discuss with the help of TOMACS and ENPC radar data, how to improve retrieval algorithms across the whole range of precipitation intensity. The emphasis is placed on the key role of scaling techniques.
Observations and warnings of floods, tornadoes, hail and lightning in CASA DFW Urban Demonstration Network during 2015
V. Chandrasekar[1]*, Brenda Philips [1], Haonan Chen [1]
and the full DFW CASA team [1]
[1]Colorado State University and CASA
e-mail: [email protected]
The CASA Dallas-Fort Worth (DFW) Urban Demonstration Network consists of a combination of high resolution X-band radar network and the National Weather Service S band radar system (KFWS). Based on these, CASA has developed end-to-end warning system that includes sensors, software architecture, products, data dissemination, visualization, and user decision making. The year 2015 has been one of the most active years in the DFW urban region and May 2015 was the wettest month recorded in the Dallas Fort Worth Metroplex since 1927. 17 inches of rain fell at the DFW Airport. These storms brought floods, tornados, hail and winds to the area. Similarly DFW metro region has been dealing with tornadic and flood producing storms for the rest of 2015. This paper presents a summary of the performance of the DFW observation network, during the year 2015, from the perspective of warning and tracking floods, tornadoes, hail and lightning. The various examples presented are a) the high resolution QPE system, b) the multiple Doppler vector wind system and observation of tornadoes, c) hail warning system and d) the lightning nowcast.
Plan of the field observation in the Tokyo metropolitan area: Lifecycle of cumulonimbus experiment (LCbEX)
Koyuru Iwanami*[1], Ryohei Misumi[1], Shin-ichi Suzuki[1], Takeshi Maesaka[1],
Shingo Shimizu[1], Yukari Shusse[1], Namiko Sakurai[1], Ken-ichi Shimose[1], Ryohei Kato[1], Kaori Kieda[1], and YasushiUji[1]
[1] National Research Institute for Earth Science and Disaster Prevention e-mail: [email protected]
We started field observation of lifecycle of Cb (Lifecycle of Cb Experiment: LCbEx I) in the Tokyo
Metropolitan Area from 2011 using a Ka-band Doppler radar, two X-band polarimetric radars, and stereo photography, etc., as we introduced in the kick-off meeting in 2012. A case study of early development stage of Cb was carried out with Ka-band Doppler radar data (Sakurai et al. 2012).From FY2013 to FY2015, ten microwave radiometers, three Doppler lidars, and five Ka-band radars were additionally set up in the Tokyo Metropolitan Area covered by the X-band polarimetric radars for the observation of environment of cumulus (Cu) initiation and Cb development, and cloud before precipitation. We can get information on water vapor, wind field in the clear air, and non-precipitating cloud, respectively. All data can be collected and processed in real-time in the NIED. The field observation (LCbEx II) using these new remote sensors will be started from the summer season in 2016 for the understanding of development process including initiation of Cu and early stage of Cb development, precipitation formation process from cloud, and prediction of Cb development using an NWP model and data assimilation.
Observations of lower tropospheric water-vapor and temperature fields and their applications
for improving short-range weather forecasting
Volker Wulfmeyer*[1] and Andreas Behrendt[1]
[1] Institute of Physics and Meteorology University of Hohenheimhiba University
e-mail: [email protected]
An overview of lower tropospheric thermodynamic profiling techniques is pesented focusing on high accuracy and high temporal-vertical resolution. Corresponding observations are essential our understanding of the Earth system with respect to radiative transfer, land-atmosphere feedback, convection initiation, and data assimilation. Suitable observing systems must resolve humidity and temperature gradients in the atmospheric surface layer, in the mixed layer, in the interfacial layer, and the lower troposphere.
Unfortunately, significant observational gaps exist so that the atmospheric boundary layer must be considered as "terra incognita". To date only water-vapor and temperature lidar systems can resolve critical WV and T gradients in the lower troposphere. These measurements can also be considered as bias-free for DA applications (Wulfmeyer et al. ROG 2015, Wulfmeyer et al. JAS 2015). Consequently, these lidar systems are very promising options for set up and operation of networks for process studies, model verification, and data assimilation. This statement is confirmed by two applications: 1) Operation of a remote sensing system synergy for studying land-atmosphere interaction and 2) the first assimilation of temperature lidar data in a mesoscale model. For a suitable mesoscale network design, corresponding profiler system developments should be intensified and dedicated observing system simulation experiments should be performed.
Big data assimilation revolutionizing numerical weather prediction
Takemasa Miyoshi*[1], K. Kondo[1], K. Terasaki[1], M. Kunii[2], J. Ruiz[3], G.-Y. Lien[1], S. Satoh[4], T. Ushio[5], H. Tomita[1], Y. Ishikawa[1], K. Bessho[6], and H. Seko[2]
[1]RIKEN Advanced Institute for Computational Science
[2]Meteorological Research Institute [3]CIMA, CONICET-University of Buenos Aires, Buenos Aires, Argentina
[4]National Institute of Information and Communications Technology [5]Osaka University
[6]Meteorological Satellite Center e-mail: [email protected]
As computer and sensor technologies advance, numerical weather prediction will face the challenge of
integrating Big Simulations and observation Big Data. We will present our perspective on the next 10-20 years of data assimilation with the future-generation sensors and post-peta-scale supercomputers, based on our own experience with the 10-petaflops “K computer”. New sensors produce orders of magnitude more data than the current sensors, and faster computers enable orders of magnitude more precise simulations, or “Big Simulations”. Data assimilation deals with the “Big Data” from both new sensors and Big Simulations. We started a “Big Data Assimilation” project, aiming to develop a revolutionary weather forecasting system to refresh 30-minute forecasts at 100-m resolution every 30 seconds, 120 times more rapidly than hourly-updated systems. We also investigated ensemble data assimilation using 10240 ensemble members, largest ever for the global atmosphere. Based on the experience using the K computer, we will discuss the future of data assimilation in the forthcoming Big Data and Big Simulation era.
What is the main factor for extreme rainfall in Busan, Korea?
Jong-Hoon Jeong[1], Dong-In Lee*[2], Chung-Chieh Wang[3], and In-Seong Han[4]
[1]Radar Analysis Division, Weather Radar Center, KMA, Seoul, Korea
[2]Department of Environmental Atmospheric Sciences, Pukyong National University, Busan, Korea [3]Department of Earth Sciences, National Taiwan Normal University, Taipei, Taiwan
[4]Fishery and Ocean Information Division, National Fisheries Research & Development e-mail: [email protected]
An extreme rainfall-producing mesoscale convective system (MCS) associated with the Changma front in southeastern Korea was investigated using observational data. This event recorded historic rainfall and led to devastating flash floods and landslides in the Busan metropolitan area on 7 July 2009. The aim of the present study is to analyze and better understand the synoptic and mesoscale environment, and find a dominant factor of quasi-stationary MCS development causing extreme rainfall. Synoptic and mesoscale analyses indicate that the MCS and heavy rainfall occurred association with a stationary front which resembled a warm front in structure. A strong southwesterly low-level jet (LLJ) transported warm and humid air and supplied the moisture toward the front, and the air rose upwards above the frontal surface. As the moist air was conditionally unstable, repeated upstream initiation of deep convection by back-building occurred at the coastline, while old cells moved downstream parallel to the convective line with training effect.
Three-dimensional dynamic observation of a mesocyclone and vault structure by phased array weather radar in Tsukuba
Toru Adachi*[1], Kenichi Kusunoki[1], and Satoru Yoshida[1]
[1]Meteorological Research Institute, Japan Meteorological Agency
e-mail: [email protected]
The Tokyo Metropolitan area is known as a region where tornados frequently occur in Japan. For mitigating damages caused by tornadoes which happen in a short time scale such as 5-10 minutes, earlier detection of their precursors by means of high-speed volumetric observations of the parent thunderstorm is essential. Phased array weather radar (PAWR) is a recently-developed instrument which, by electronically changing the beam elevation, realizes a quick volume scan in 30 seconds to spatiotemporally resolve thunderstorms within a range of 60 km. Since 8 July 2015, Meteorological Research Institute (MRI) has been operating a PAWR in Tsukuba city to cover the Tokyo Metropolitan area, and succeeded in observing a well-developed thunderstorm on the late afternoon of 12 August. The observed thunderstorm moved toward the east-southeast direction at 5-10 km north of the radar site, accompanying with a mesocyclone and vault structure at the southwest edge, which are characteristics often seen in tornadic supercells. In this presentation, we report high-speed fine-scale properties of the mesocyclone and vault structure observed by MRI-PAWR which would otherwise be difficult to resolve by a mechanically-rotating conventional radar.
Evolution of convective clouds initiated over mountains observed by Ka-band scanning Doppler radar and stereo photogrammetry
Ryohei Misumi*[1], Namiko Sakurai[1],Takeshi Maesaka[1], Shin-ichi Suzuki[1],
Shingo Shimizu[1], and Koyuru Iwanami[1]
[1]National Research Institute for Earth Science and Disaster Prevention
e-mail: [email protected]
Convective clouds initiated over mountains in Kanto, Japan on 18 August 2011 were observed with a 35 GHz scanning Doppler radar and a pair of digital cameras. The first radar echo was detected about ten minutes after the formation of a cumulus confirmed in the photographs. In the cumulus, the maximum radar reflectivity (about 10 dBZ) was found in the 2 km - 3 km levels, while the cloud top reached the 5.5 km level. After such cumuli formed three times repeatedly, a cumulonimbus that brought precipitation on the ground formed. The maximum radar reflectivity in the cumulonimbus was at about 6 km level, which suggests that the structure was different from initial cumuli.
Osaka urban phased array radar network experiment
Tomoo Ushio*[1], Shigeharu Shimamura[1], Fumihiko Mizutani[1], Masakazu Wada[1], Shinsuke Satoh[2], Nobuhiro Takahashi[2], and Toshio Iguchi[1]
[1]Osaka University
[2]National Institute of Information and Communications Technology e-mail: [email protected]
Osaka University, Toshiba and the Osaka Local Government started a new project to create the Osaka
Urban Demonstration Network. The main sensor of the Osaka Network is a 2-node Phased Array Radar Network. Data products which are created both in locally and Toshiba Computer Cloud, include single and multi-radar data, vector wind, quantitative precipitation estimation, VIL, nowcasting, and analysis. These new products are transferred to Osaka Local Government in operational mode and evaluated by several section in Osaka Prefecture.
Case study on preceding meteorological conditions of sudden appearance of convective precipitating cells on Kofu Basin in summer
Tetsuya Sano*[1], Tadashi Suetsugi[1], and Satoru Oishi[2]
[1]Interdisciplinary Centre for River Basin Environment, University of Yamanashi
[2]Research Center for Urban Safety and Security, Kobe University e-mail: [email protected]
In summer, localized heavy rainfall is caused by convective precipitating cells appeared suddenly on
Kofu Basin under a calm condition. The preceding meteorological condition of the appearance of convective precipitating cells on Kofu Basin is analyzed using surface meteorological observation (pressure, relative humidity, temperature and wind) of Japan Meteorological Agency, NTT-docomo and University of Yamanashi (UY) and X-MP radar observation of UY (UYR). On 25 July 2014, temperature increased and water vapor mixing ratio (qv) decreased with decreasing
pressure and weak wind toward surrounding mountains on Kofu Basin without synoptic disturbance from late morning to early afternoon. Until 15:00 JST, high equivalent potential temperature (θe) with decreasing potential temperature (θ) and increasing qv were observed on western region with southwesterly wind and eastern region with southeasterly wind, respectively. After 15:00 JST, θe increased at the high-θ region between both high-θe areas; a cellular echo was observed by UYR. New cellular echoes appeared on western side of existed one. The meteorological condition on Kofu Basin became conditional instability with southwesterly on western region and southeasterly wind on eastern region. Then, it is suggested that convective precipitating cells were caused by lifting almost warm and moist air on western region.
Numerical forecast of an intense precipitation event over Tokyo: Role and impact of the urban environment
Stephane Belair*[1], Sylvie Leroyer [1], Naoko Seino[2], Lubos Spacek[1], Vanh Souvanlassy[1], and Danahe Paquin-Ricard[1]
[1]Environment Canada
[2]Meteorological Research Institute, Japan Meteorological Agency e-mail: [email protected]
Urbanized areas have been shown to have a significant impact on several aspects of meteorological
forecasts, such as near-surface air conditions, lake or sea breezes, as well as clouds and precipitation. In this study the role and impact of the Greater Tokyo Area (GTA) on the development of an intense precipitation event that took place on 26 August 2011 is investigated. This is achieved with 250-m grid spacing numerical integrations of Environment Canada's Global Environmental Multi-scale (GEM) model, in which the Town Energy Balance (TEB) scheme is included.
Results demonstrate that the numerical model is able to realistically forecast this event. A sensitivity experiment in which the urban scheme is switched off shows that urban areas and its associated processes are likely to have increased the intensity of precipitation for that case. Comparing the integrations with and without TEB, it appears that the intensification of precipitation might have resulted from an increase in the lateral flow of low-level moist static energy from the Tokyo Bay in response to a low-level pressure perturbation over GTA. The propagation of low-level currents and waves associated with two breezes is also believed to have played a major role.
Numerical simulation of urban impact on summertime precipitation in Tokyo: How does urban temperature rise affect precipitation?
Naoko Seino*[1], Hirofumi Sugawara[2], Ryoko Oda[3], Toshinori Aoyagi[1],
and Hiroshige Tsuguti[1]
[1]Meteorological Research Institute [2]National Defense Academy
[3]Chiba Institute of Technology e-mail: [email protected]
To investigate how increasing heat island intensity in Tokyo affects precipitation in the metropolitan
area, numerical experiments have been made for August from 2006 to 2013 using the Non-hydrostatic Model (NHM) of Japan Meteorological Agency (JMA). Realistic urban surface condition was given in one of the experiments utilizing the urban canopy scheme SPUC (SPUC experiment). Less urbanized surface condition was assumed in the other experiment, where only slab surface scheme was used (SLAB experiment). Simulation results suggest that mean monthly precipitation amount in the central Tokyo area is approximately 10% larger in the SPUC experiment than in the SLAB experiment, which is caused by roughly one degree mean temperature rise. We also examined daily maximum precipitation amount in the urban area. On average, larger daily precipitation amounts were found in the SPUC experiment. However, differences in daily precipitation amounts and spatial distribution between the SPUC and SLAB experiments largely varied case by case.Processes associated with the simulated precipitation difference were discussed by means of composite analysis for rainy cases in the urban area, and comparison of observed/simulated atmospheric environment between two heavy rain cases in the TOMACS IOP period.
Overview of Japanese new generation geostationary meteorological satellite, Himawari-8 and its applications
Kazuki Shimoji*[1]
[1]The Meteorological Satellite Center of the Japan Meteorological Agency e-mail: [email protected]
Japan Meteorological Agency (JMA) has started the operation of new geostationary meteorological
satellite of Himawari-8 from 7 July 2015. Himawari-8 is located at 140.7 degrees east, and will observe the East Asia and Western Pacific regions as a successor to the MTSAT-2 satellite. Advanced Himawari Imager (AHI) boarding on the Himawari-8 has rich observation function comparing with MTSAT-2/Imager. AHI has 16 observation bands, whereas the MTSAT-2/Imager has five bands. The spatial resolution for AHI visible and infrared bands are twice of those of MTSAT-2/Imager. For the observation frequency, MTSAT-2/Imager performs full disk scan every hour and north hemisphere scan every half hour. On the other hand, Himawari-8/AHI takes full disk scan every 10 minutes, and regional scans such as Japan area and targeting area every 2.5 minutes. These significant improvements will bring unprecedented levels of performance in the monitoring of tropical cyclones, mesoscale features of cloud system and rapidly developing cumulonimbus clouds for the enhancement of prevention and mitigation of weather-related disasters. They will also enable to retrieve more Atmospheric Motion Vectors from consecutive satellites images with more accuracy than before. In this presentation, overview of Himawari-8 and its various applications will be introduced.
4D Water vapor variation associated with severe storms estimated from the ground observation networks of specific humidity and GNSS
Yoshinori Shoji*[1]
[1]Meteorological Research Institute
e-mail: [email protected]
A non-tomographic approach to retrieve 4D water vapor structure utilizing ground networks of humidity and GNSS will be introduced. By using surface specific humidity and precipitable water vapor (PWV) as two free variables, rough trend of vertical specific humidity profile can be analyzed. We have constructed multiple regression equation for specific humidity at every 50 m above ground level (AGL) up to 10 km utilizing five year (2010-2014) radio sonde observation data in Japan. Evaluations with independent data of year 2015 have revealed that mean errors (ME) are less than 1 g/kg and root mean square errors (RMSE) are less than 2 g/kg in summer and 0.5 g/kg in winter.
Though this approach cannot analyze detailed structure of water vapor such as inversion layer, it can bring us important information for severe weather monitoring as water vapor increase in lower atmosphere and water vapor scale height in high time resolution (e.g. every one minute). We will introduce application results of this approach for several severe storm cases.
For further improvement of this approach, we are considering to introduce water vapor information in middle and upper layer observed by Japanese meteorological satellite “Himawari-8” in the future.
Relationships between cloud-to-ground lightning activity and lightning indices using X-band polarimetric radar in
warm-season convective storms during LCbEX period
Namiko Sakurai*[1], Shingo Shimizu[1], Yukari Shusse[1], Shin-ichi Suzuki[1], Takeshi Maesaka[1], Kaori Kieda[1], and Koyuru Iwanami[1]
[1]National Research Institute for Earth Science and Disaster Prevention
e-mail: [email protected]
This study investigated the relationship between cloud-to-ground (CG) lightning activity and lightning indices (LIs) using X-band polarimetric radars (MP-X). We used data of two MP-Xs at Ebina city and Kisarazu city in the Kanto region, Japan and cloud-to-ground lightning data (CG) obtained by Japan Lightning Detection Network (JLDN) for analysis. Data from the two MP-Xs recording at a high temporal resolution (every 1-2 min.) were used. We analyzed four thunderstorms observed during the summer seasons of 2012 and 2013. The LIs of updraft volumes were found to be well correlated with CG lightning frequency for threshold values of updraft speeds of > 5 and > 10 m/s (correlation coefficient > 0.7). The LIs derived from updraft strength, updraft volumes at vertical velocities of > 0, > 5, and > 10 m/s and maximum updraft speed, were also well correlated with the occurrence of CG lightning. In the presentation, we will show results of relationships between CG lightning activity and hydrometeors in the charging zone.
Investigation of a high impact precipitation event over the Tokyo metropolitan area using a nested configuration of
WRF-NOAHMP down to the LES scale
Hans-Stefan Bauer*[1], Thomas Schwitalla[1], and Volker Wulfmeyer[1]
[1]Institute of Physics and Meteorology, University of Hohenheim [email protected]
The WRF-NOAHMP model with advanced representations of land-atmosphere exchange over complex
terrain, the atmospheric boundary layer, and convection initiation is applied to a TOMACS case. We investigate in detail land-atmosphere processes that evolved during a severe convective event in the Tokyo Metropolitan Area in the afternoon of September, 2^nd 2013. Focus is set on details of the evolution of a tornadic supercell. The simulation is initialized with the ECMWF operational analysis improved by a 3DVAR rapid update cycle in the outermost domain with 2700 m horizontal resolution. For the assimilation, observations archived in the ECMWF data archive are applied. With 3 additional nests, the resolution is refined to 100 m in the innermost domain. The model results are compared with observations available during TOMACS to characterize the short-range forecast performance of WRF at different resolutions as well as to study land-atmosphere exchange and the organization of convection leading to the development and evolution of supercells such as storm relative helicity, the rotating updraft as well as convective inflow and outflow. First results will be presented at the workshop.
Diurnal cycle of convection during TOMACS and ARPS case studies
Augusto José Pereira Filho*[1], Felipe Vemad[1], Kazuo Saito[2], Hiromu Seko[2],
José Luis Flores Rojas[1], and Hugo Abi Karam[3]
[1]Universidade de São Paulo [2]Meteorological Research Institute
[3]Universidade Federal do Rio de Janeiro e-mail: [email protected]
The diurnal cycle of convection over Japan region 31-45N; 126-148E during summer is analyzed with CMORPH datasets between 2011 and 2015. Time-longitude diagrams are used over to obtained phase speeds, durations and span of convective episodes. Three episodes of severe weather are simulated with the ARPS system. Twenty-four-hour control and assimilation runs over Japan region at 5-km resolution and over TOMACS area at 1-km resolution for 26 AUG 2011, 23 JUL and 12 AUG 2013 are analyzed as a sample of the diurnal cycle of convection. The ARPS is initialized with JMA initial and boundary conditions instead of GFS (Pereira Filho and Vemado, 2014). An urban boundary layer model Tropical Town Energy Budget or T-TEB (Karam et al., 2009) is used over TOMACS domain to represent the energy budget over Tokyo Metropolitan Area. The results are verified against JMA analyzed rainfall field with CSI, BIAs, POD and FAR statistics.
Cloud resolving ensemble experiment of a local heavy rainfall event on 26 August 2011 observed by TOMACS
Kazuo Saito*[1], Masaru Kunii[1], and Kentaro Araki[1]
[1]Meteorological Research Institute
e-mail: [email protected]
On 26 August 2011, a local heavy rainfall event occurred in the Tokyo metropolitan area. In Tokyo and Kanagawa prefectures, very intense rains more than 90 mm per hour were observed. This heavy rainfall event was caused by a mesoscale convective system which was triggered by low level convergence. A rapid scan special observation by the Geostational Meteorological Satellite of JMA and the dense surface observations of JMA and the Japanese Ministry of Environment showed that collision of the two sea breeze fronts from the east coast of the Kanto Plain and the Bay of Tokyo triggered the mesoscale convective system (MCS).
Cloud resolving ensemble experiments was conducted using the JMA nonhydrostatic model (NHM). Initial condition was given by the mesoscale 4DVAR analysis of JMA and the perturbation by the singular vectors based on NHM. The 2 km simulation captured the heavy precipitation in Tokyo and an associated cyclonic circulation around MCS. Intrusion and collision of the two sea breeze fronts from the east coast of the Kanto Plain and the Bay of Tokyo were well reproduced. Sensitivity of the simulated rainfall to the subgrid scale partial condensation determined by the turbulent closure model is also shown.
Improving short-rage quantitative precipitation forecast by assimilating thermodynamic variables retrieved from dual sector-volume-scan observations during summer seasons from 2011 to 2013 in Tokyo
metropolitan region, Japan
S. Shimizu*[1], K. Iwanami[1], N. Sakurai[1], T. Maesaka[1], K. Kieda[1], S. Suzuki[1], and S. Shusse[1]
[1]National Research Institute for Earth Science and Disaster Prevention e-mail: [email protected]
The authors applied two different traditional thermodynamic retrieval methods (2D-Poisson equation
solver (Gal-Chen, 1978) and 3D-Poisson equation solver (Roux, 1988)) to several severe convective storms (5 cases or more) observed by two X-band polarimetric radars which performed sector scans at an azimuthal width of 60 degree with 1-2 minutes temporal resolution during summer seasons from 2011 to 2013 in Tokyo metropolitan region, Japan. The retrieved thermodynamic variables were assimilated by 3DVAR with incremental analysis update filter during the first 30 minutes of forecast. We investigated the impact to precipitation forecast up to 3 hours. Positive impact on precipitation forecast up to 1 hour ~ 1 hour half are found in almost all cases. Sensitive experiments with lower temporal observation resolution (6 minutes) showed degradation of forecast especially in Gal-Chen method. The 2D/3D Poisson equation with Neumann boundary condition in large calculation domain usually takes considerable calculation times. We proposed appropriate Poisson solver and pre-conditioning method within PETSC library (Portable, Extensible Toolkit for Scientific Computation library) to achieve thermodynamic retrieval calculation within 30 seconds toward real-time application.
An introduction for social experiment of VIL nowcast that provides precise 10 minute ahead rainfall information
of localized torrential rainfall
Kohin Hirano*[1], Ryohei Misumi[1], Masayuki Maki[2], Koyuru Iwanami[1], and Tsuyoshi Nakatani[1]
[1]National Research Institute for Earth Science and Disaster Prevention
[2]Kagoshima University e-mail: [email protected]
Localized torrential rainfall is difficult to be predicted because of its small scale and fast initialization and development. A super short term nowcast system based on the use of Vertical Integrated Liquid water content (VIL) is developed to focus on the detection of initialization and development of localized torrential rainfall. This VIL nowcast system retrieves rainfall information from X-band polarimetric radar volume scan, detects the beginning of rainfall faster and try to provide more accurate rainfall amount information for the next 10 minutes. To explore the usage of VIL nowcast system, a social experiment wasconducted during the summer season of 2015 in the Tokyo metropolitan area. More than 2,000 people participated in the social experiment, and reported approximately 3,000 questionnaire. This current paper will introduce the algorithm of VIL nowcast and some preliminary results from the social experiment.
Rainfall runoff modeling using high resolution radar rainfall data
Shakti P.C*[1], R. Misumi[1], T. Nakatani[1], K. Iwanami[1], and K. Hirano[1]
[1]National Research Institute for Earth Science and Disaster Prevention e-mail: [email protected]
Information on spatial and temporal variations of rainfall is very useful for understanding the hydrological balance. In many part of world, rain gauges have traditionally been used to measure the amount of precipitation and practices for calculating spatial and temporal variations or rainfall have been derived from limited rain gauge networks and applied in many hydrological models, which can introduce large uncertainties in hydrological predictions.
Weather radar observation has been one of the alternative options to estimate spatial and temporal precipitation distribution with desired time interval. There are different types of radars has been used for operational and research purpose in Japan. In this study, high spatial and temporal resolution of radar rainfall is used in a hydrological model to predict runoff of river. We used the Hydrologic Modeling System (HEC-HMS) model, which is designed to simulate the precipitation-runoff processes of dendritic drainage basins. It is free open source model widely accepted all around the world. Our one of the objective is to use some hydrological models to predict runoff.
Study of the impact of high temporal resolution observation in the meso-
scale hybrid4D-Var system
Yasutaka Ikuta*[1,2]
[1] Japan Meteorological Agency [2]Meteorological Research Institute
e-mail: [email protected] High temporal resolution observation data such as radar, wind profiler and aircraft data have been assimilated into an operational meso-scale 4D-Var system for many years at JMA. However, these observation data are thinned in time and assimilated not on the correct observation time but on the hour because observation time slot is fixed to 1 hour. In order to take full advantage of such high temporal resolution observation data, it is necessary to upgrade the current 4D-Var system. Moreover, the traditional 4D-Var with a climatological background-error covariance which is independent of the atmospheric conditions at analysis time, cannot use the information of such high temporal resolution observation data effectively. In this regard, a new hybrid 4D-Var data assimilation system is being developed. This hybrid-4DVar enables the assimilation of observation data on the correct observation time because observation time slots are not fixed. In addition, flow-dependent background error covariance can be used. The impact of appropriate treatment of observation time by assimilating such high temporal resolution observation data using hybrid-4DVar will be presented at the workshop.
Ensemble data assimilation of dense observations for rainfall near Tokyo on 18 July 2013
Sho Yokota*[1], Le Duc[2], Seiji Origuchi[1] , Takuya Kawabata[1], and Tadashi Tsuyuki[3]
[1]Meteorological Research Institute [2]JAMSTEC / Meteorological Research Institute
[3]Meteorological College / Meteorological Research Institute e-mail: [email protected]
From the evening to the night on 18 July 2013, local rainfall occurred near Tokyo. In this case, a dense
observation network on the Kanto Plain observed the environment around the rainfall. We succeeded in forecasting local rainfall in Tokyo area through assimilating a part of these observations (upper wind, temperature, and relative humidity by 4 radiosondes at 3-hours intervals; surface wind and temperature, precipitable water vapor by GNSS, and radial wind by 3 C-band Doppler radars at 10-minutes intervals) with a local ensemble transform Kalman filter (LETKF) and an ensemble-based variational method (EnVAR) using observation localization (ensemble size: 50 members). In this workshop, we will discuss impacts of assimilating the dense observations and correlation between the rainfall in Tokyo area and initial valuables using the results of the ensemble forecasts. Acknowledgement: GNSS data were provided from the 2nd Laboratory, Meteorological Satellite and
Observation System Research Department. Radiosonde observations were conducted as a part of TOMACS program. The other observation data were from Japan Meteorological Agency. Our research was supported in part by “Strategic Program for Innovative Research (SPIRE), Field 3” (proposal number: hp140220 and hp150214) as well as TOMACS.
Comparison of forward operators for polarimetric radars aiming for data assimilation
Takuya Kawabata*[1], Hans-Stefan Bauer[2], Thomas Schwitalla[2],
Volker Wulfmeyer[2] and Ahoro Adachi[1]
[1]Meteorological Research Institute [2]University of Hohenheim
e-mail: [email protected]
Five forward operators for polarimetric radars that focus on warm rain are compared with each other and actual radar observations in terms of data assimilation. Two of the operators derive polarimetric parameters from the exponential raindrop size distribution obtained by the models. The first operator uses that the T-matrix method and the second one is based on fitting functions against scattering amplitudes. ZH and ZDR estimated with the fitting function are in fairly better agreement with those obtained by the observations. However, the remaining three converters estimates the mixing ratio of rainwater (Qr) from the measured polarimetric factors. The third converter uses both ZH and ZDR, the fourth uses the specific differential phase (KDP), and the fifth uses both KDP and ZDR. Comparisons with actual measurements showed that the accuracies of the third and fourth converters are superior to that of the fifth by less than half. Another evaluation showed that both the first and second converters have slightly higher equitable threat scores than the other three. In conclusion, the fitting function and the operator with KDP are most suitable for data assimilation.
Data assimilation experiments on the 26 August 2011 heavy rainfall event over Kanto
Le Duc*[1,2], Takuya Kawabata[2], and Kazuo Saito[2,1]
[1]Japan Agency for Marine-Earth Science and Technology
[2]Meteorological Research Institute e-mail: [email protected]
The heavy rainfall event on 26 August 2011 over Kanto is one of the test beds of TOMACS project. To
investigate the predictability of this event, data assimilation experiments using state-of-the-art data assimilation methods were carried out. The method consisted of incremental Local Ensemble Transform Kalman Filter, four-dimensional variational (4DVAR), hybrid covariance 4DVAR, and hybrid gain 4DVAR. The observations were obtained from Japan Meteorological Agency database including conventional, GPS and Doppler radial winds data. A cascading configuration was designed in running assimilation, which used two domains one nested inside another. While the nesting domain covered entire Japan and its surrounding areas, the nested domain only covered Kanto area. For each domain a dual resolution strategy was adopted, which corresponds to the use of outer loop and inner loop in 4DVAR. The resolutions were set to 15-5 km in the large domain and 2-1 km in the small one. The forecasts showed that the heavy rainfall area was predicted with a westward displacement error in all assimilation methods. Verification results for all experiments and relevant discussion will be presented.
Data assimilation experiment of high resolution precipitable water vapor data
using a nested NHM-LETKF system
Masanori Oigawa*[1], Toshitaka Tsuda[1] and Hiromu Seko[2] [1]Research Institute for Sustainable Humanosphere, Kyoto University
[2]Meteorological Research Institute
e-mail: [email protected]
Data assimilation experiment of Precipitable Water Vapor (PWV) data derived from a dense Global Navigation Satellite System (GNSS) receiver network around Uji, Kyoto, Japan (Sato et al., 2013) was conducted by using a nested NHM-LETKF system (Seko et al., 2013). To retrieve meso-γ scale PWV fluctuations, the PWV data were estimated from a single slant delay of the highest elevation satellite (Realini et al., 2012). The horizontal resolution of PWV analyzed by this method is ten times higher, i.e., about 1 km, than that of PWV analyzed by the conventional GNSS meteorology technique. From an analysis of the observed PWV data, it was found that characteristic length-scale of water vapor variability became small (1.9 -3.5 km) when it rained around the dense GNSS network.
The PWV data were assimilated into an inner LETKF (1.875 km mesh) with use of multiple horizontal localization radii which depend on observed precipitation intensity. The experiments showed that the simulation accuracy of one hour accumulated rainfall amount of the inner LETKF was most improved when the PWV data were assimilated with horizontal resolution of 3.5 km.
These results suggest that high resolution PWV assimilation (3.5 km) can improve simulation accuracy of convective precipitation.
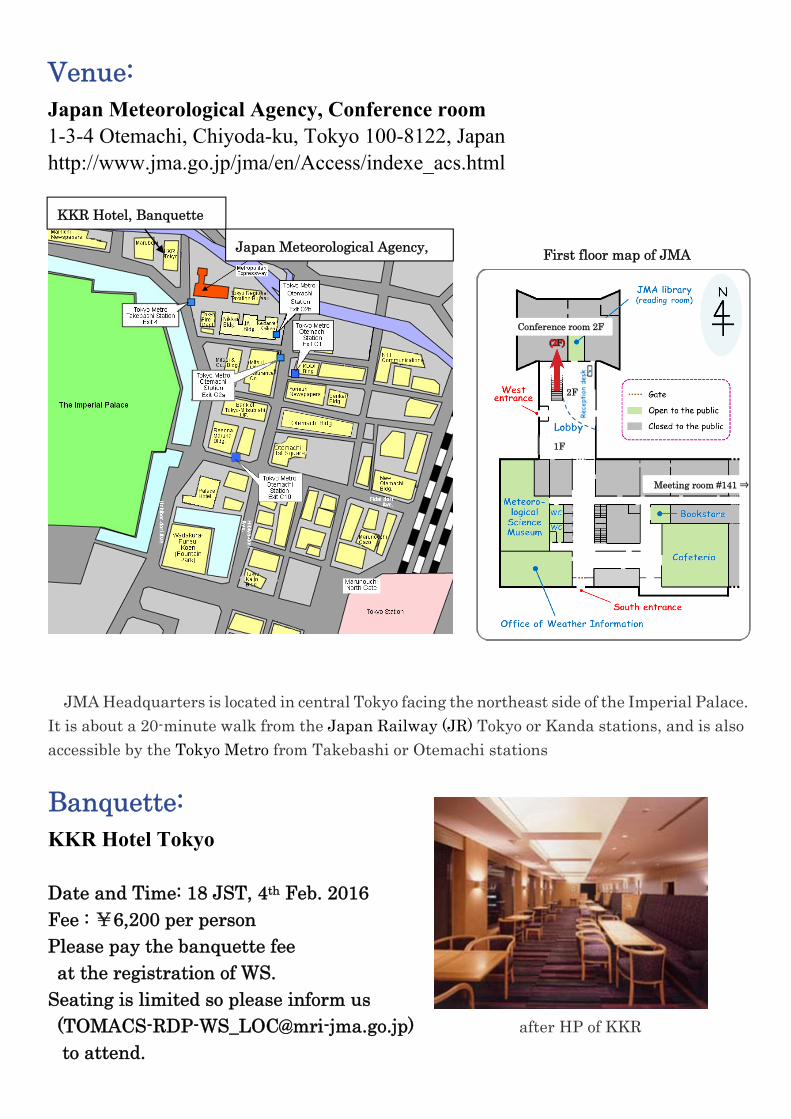
Venue: Japan Meteorological Agency, Conference room 1-3-4 Otemachi, Chiyoda-ku, Tokyo 100-8122, Japan http://www.jma.go.jp/jma/en/Access/indexe_acs.html
JMA Headquarters is located in central Tokyo facing the northeast side of the Imperial Palace. It is about a 20-minute walk from the Japan Railway (JR) Tokyo or Kanda stations, and is also accessible by the Tokyo Metro from Takebashi or Otemachi stations
Banquette: KKR Hotel Tokyo Date and Time: 18 JST, 4th Feb. 2016 Fee : ¥6,200 per person Please pay the banquette fee at the registration of WS.
Seating is limited so please inform us ([email protected]) after HP of KKR to attend.
KKR Hotel, Banquette
Japan Meteorological Agency, First floor map of JMA
Meeting room #141 ⇒
Conference room 2F
2F
1F
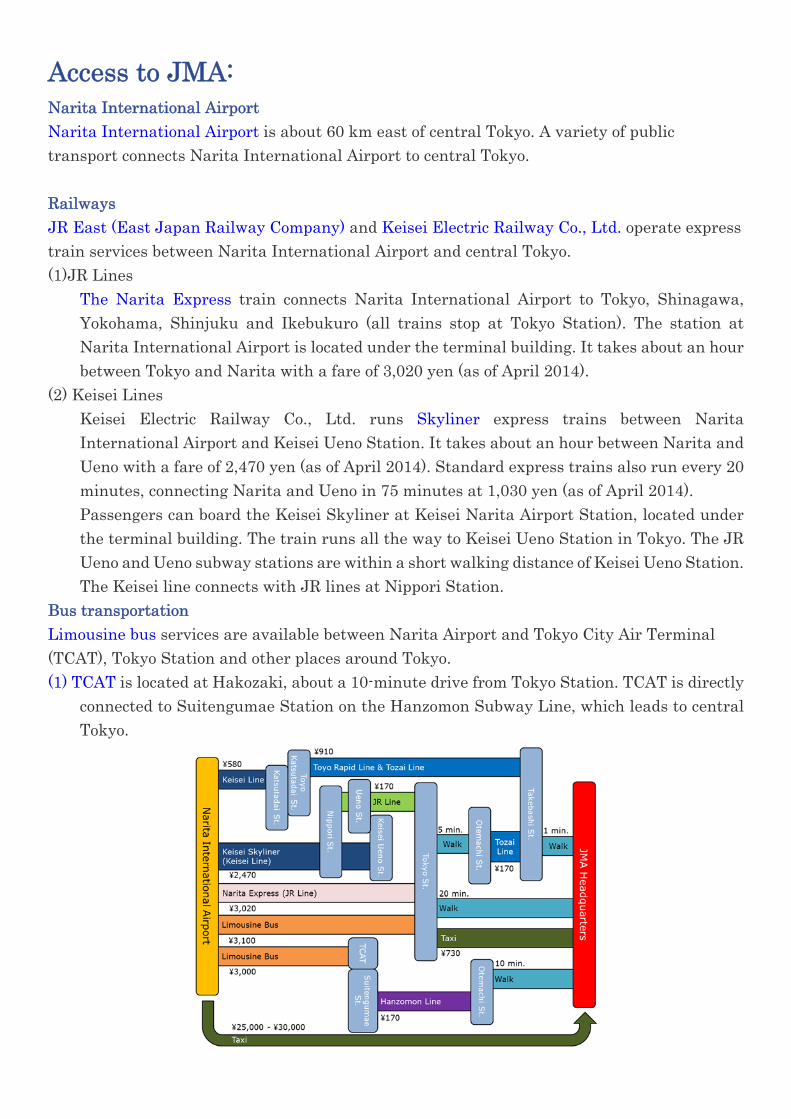
Access to JMA: Narita International Airport Narita International Airport is about 60 km east of central Tokyo. A variety of public transport connects Narita International Airport to central Tokyo. Railways JR East (East Japan Railway Company) and Keisei Electric Railway Co., Ltd. operate express train services between Narita International Airport and central Tokyo. (1)JR Lines
The Narita Express train connects Narita International Airport to Tokyo, Shinagawa, Yokohama, Shinjuku and Ikebukuro (all trains stop at Tokyo Station). The station at Narita International Airport is located under the terminal building. It takes about an hour between Tokyo and Narita with a fare of 3,020 yen (as of April 2014).
(2) Keisei Lines Keisei Electric Railway Co., Ltd. runs Skyliner express trains between Narita International Airport and Keisei Ueno Station. It takes about an hour between Narita and Ueno with a fare of 2,470 yen (as of April 2014). Standard express trains also run every 20 minutes, connecting Narita and Ueno in 75 minutes at 1,030 yen (as of April 2014). Passengers can board the Keisei Skyliner at Keisei Narita Airport Station, located under the terminal building. The train runs all the way to Keisei Ueno Station in Tokyo. The JR Ueno and Ueno subway stations are within a short walking distance of Keisei Ueno Station. The Keisei line connects with JR lines at Nippori Station.
Bus transportation Limousine bus services are available between Narita Airport and Tokyo City Air Terminal (TCAT), Tokyo Station and other places around Tokyo. (1) TCAT is located at Hakozaki, about a 10-minute drive from Tokyo Station. TCAT is directly
connected to Suitengumae Station on the Hanzomon Subway Line, which leads to central Tokyo.
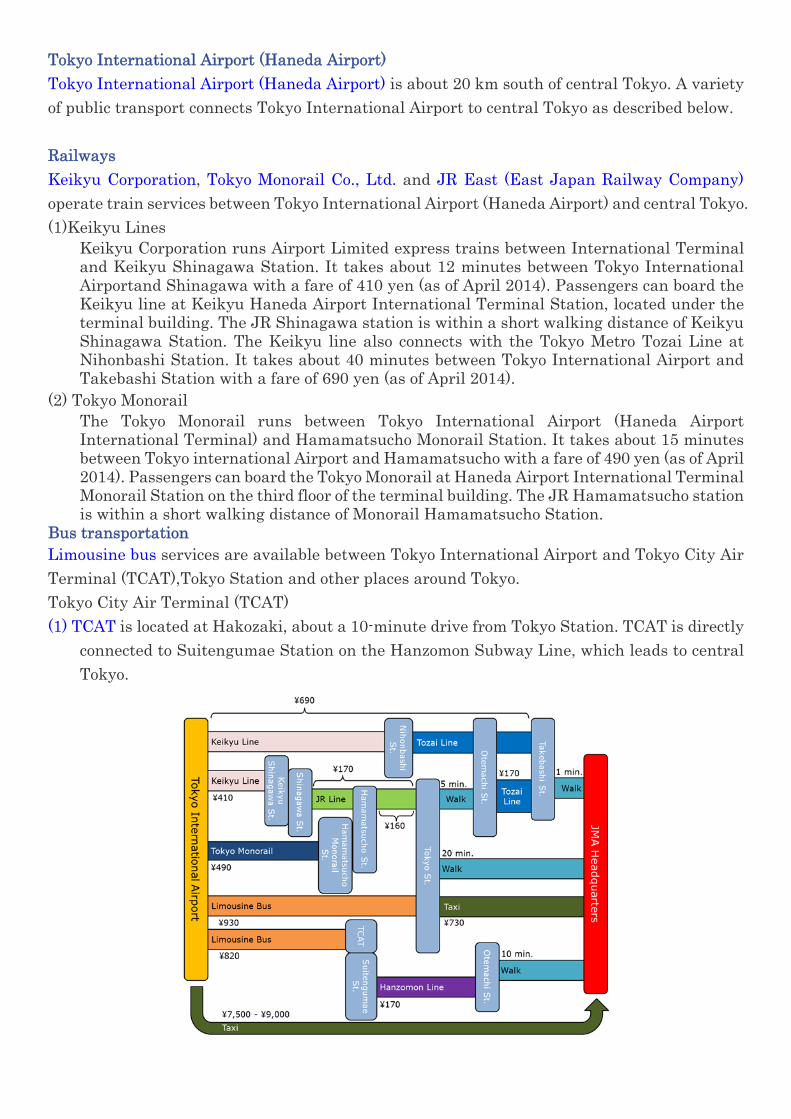
Tokyo International Airport (Haneda Airport) Tokyo International Airport (Haneda Airport) is about 20 km south of central Tokyo. A variety of public transport connects Tokyo International Airport to central Tokyo as described below. Railways Keikyu Corporation, Tokyo Monorail Co., Ltd. and JR East (East Japan Railway Company) operate train services between Tokyo International Airport (Haneda Airport) and central Tokyo. (1)Keikyu Lines
Keikyu Corporation runs Airport Limited express trains between International Terminal and Keikyu Shinagawa Station. It takes about 12 minutes between Tokyo International Airportand Shinagawa with a fare of 410 yen (as of April 2014). Passengers can board the Keikyu line at Keikyu Haneda Airport International Terminal Station, located under the terminal building. The JR Shinagawa station is within a short walking distance of Keikyu Shinagawa Station. The Keikyu line also connects with the Tokyo Metro Tozai Line at Nihonbashi Station. It takes about 40 minutes between Tokyo International Airport and Takebashi Station with a fare of 690 yen (as of April 2014).
(2) Tokyo Monorail The Tokyo Monorail runs between Tokyo International Airport (Haneda Airport International Terminal) and Hamamatsucho Monorail Station. It takes about 15 minutes between Tokyo international Airport and Hamamatsucho with a fare of 490 yen (as of April 2014). Passengers can board the Tokyo Monorail at Haneda Airport International Terminal Monorail Station on the third floor of the terminal building. The JR Hamamatsucho station is within a short walking distance of Monorail Hamamatsucho Station.
Bus transportation Limousine bus services are available between Tokyo International Airport and Tokyo City Air Terminal (TCAT),Tokyo Station and other places around Tokyo. Tokyo City Air Terminal (TCAT) (1) TCAT is located at Hakozaki, about a 10-minute drive from Tokyo Station. TCAT is directly
connected to Suitengumae Station on the Hanzomon Subway Line, which leads to central Tokyo.
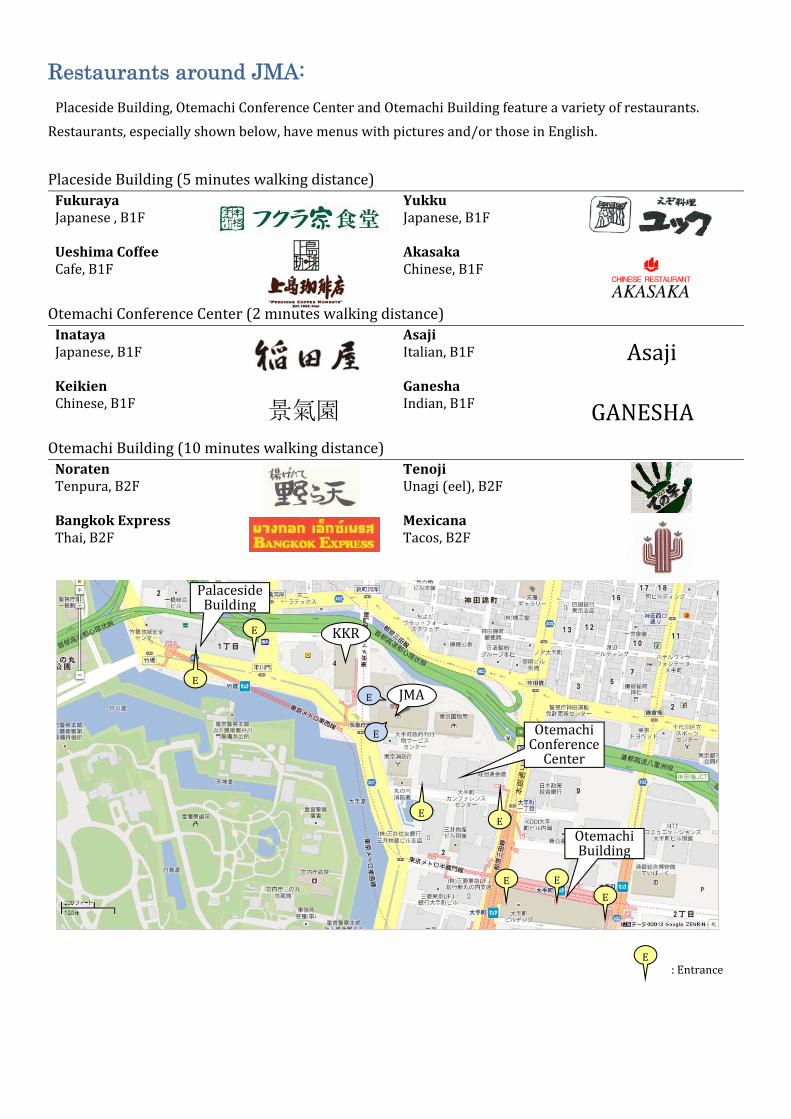
Restaurants around JMA:
PlacesideBuilding,OtemachiConferenceCenterandOtemachiBuildingfeatureavarietyofrestaurants.
Restaurants,especiallyshownbelow,havemenuswithpicturesand/orthoseinEnglish.
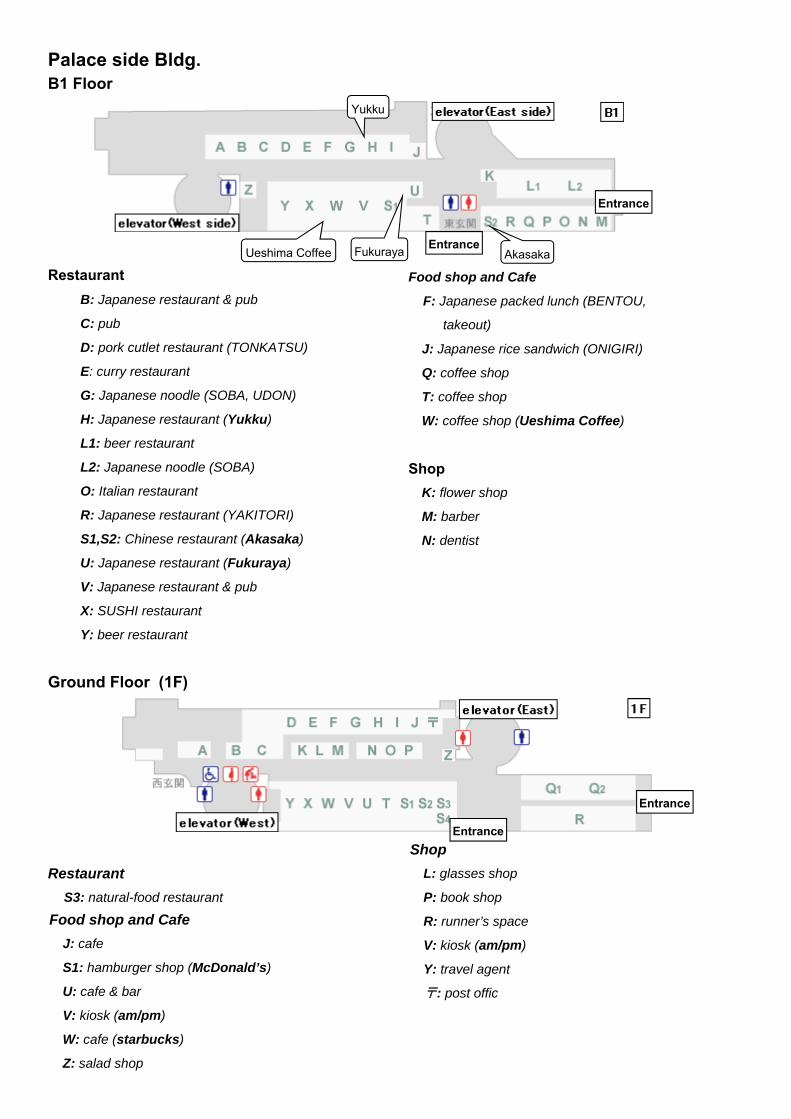
PlacesideBuilding(5minuteswalkingdistance)FukurayaJapanese,B1F
YukkuJapanese,B1F
UeshimaCoffeeCafe,B1F
AkasakaChinese,B1F
OtemachiConferenceCenter(2minuteswalkingdistance)InatayaJapanese,B1F
AsajiItalian,B1F
KeikienChinese,B1F
GaneshaIndian,B1F
OtemachiBuilding(10minuteswalkingdistance)NoratenTenpura,B2F
TenojiUnagi(eel),B2F
BangkokExpressThai,B2F
MexicanaTacos,B2F
OtemachiConferenceCenter
OtemachiBuilding
PalacesideBuilding
KKR
景氣園 GANESHA
Asaji
E
E
E
E
E
E
E
E
E JMA
E:Entrance
Entrance
Palace side Bldg. B1 Floor
Restaurant
Ground Floor (1F)
Restaurant
S3: natural-food restaurant
Shop
L: glasses shop
P: book shop
R: runner’s space
V: kiosk (am/pm)
Y: travel agent
〒: post offic
B: Japanese restaurant & pub
C: pub
D: pork cutlet restaurant (TONKATSU)
E: curry restaurant
G: Japanese noodle (SOBA, UDON)
H: Japanese restaurant (Yukku)
L1: beer restaurant
L2: Japanese noodle (SOBA)
O: Italian restaurant
R: Japanese restaurant (YAKITORI)
S1,S2: Chinese restaurant (Akasaka)
U: Japanese restaurant (Fukuraya)
V: Japanese restaurant & pub
X: SUSHI restaurant
Y: beer restaurant
Food shop and Cafe
F: Japanese packed lunch (BENTOU,
takeout)
J: Japanese rice sandwich (ONIGIRI)
Q: coffee shop
T: coffee shop
W: coffee shop (Ueshima Coffee)
Shop
K: flower shop
M: barber
N: dentist
Entrance
Food shop and Cafe
J: cafe
S1: hamburger shop (McDonald’s)
U: cafe & bar
V: kiosk (am/pm)
W: cafe (starbucks)
Z: salad shop
Akasaka
Yukku
Ueshima Coffee
Entrance
FukurayaEntrance
Entrance
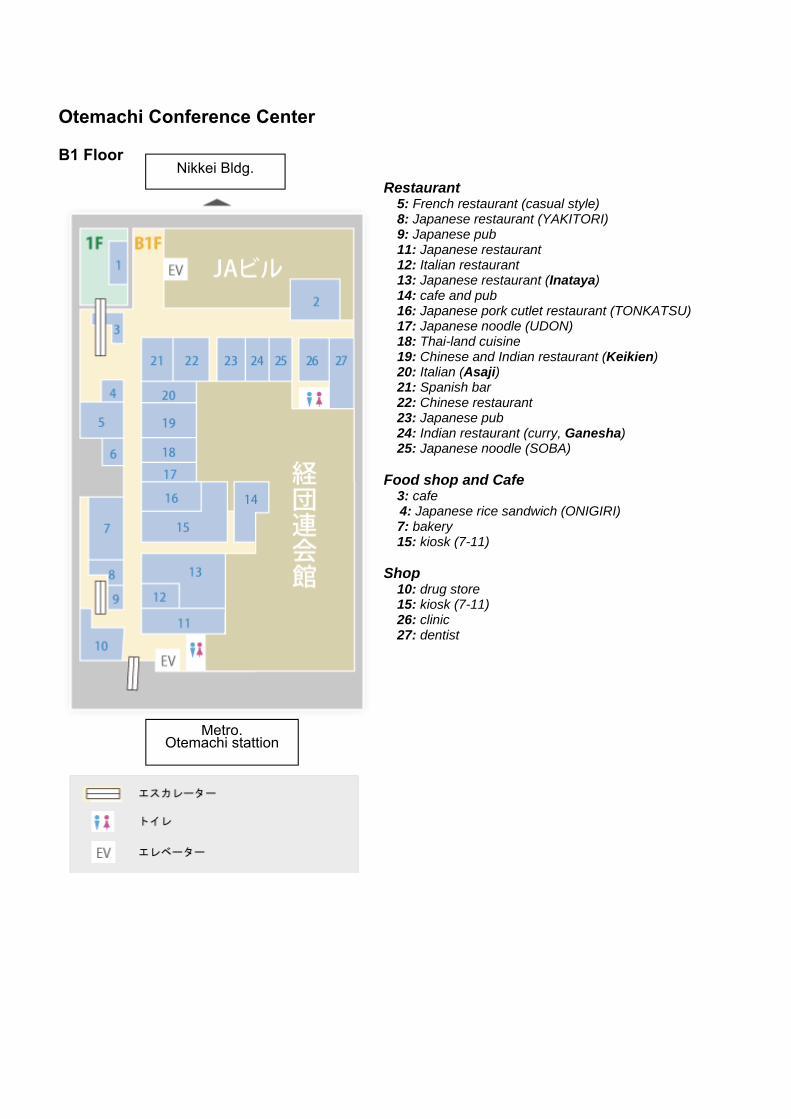
Otemachi Conference Center
B1 Floor
Restaurant
5: French restaurant (casual style) 8: Japanese restaurant (YAKITORI) 9: Japanese pub 11: Japanese restaurant 12: Italian restaurant 13: Japanese restaurant (Inataya) 14: cafe and pub 16: Japanese pork cutlet restaurant (TONKATSU) 17: Japanese noodle (UDON) 18: Thai-land cuisine 19: Chinese and Indian restaurant (Keikien) 20: Italian (Asaji) 21: Spanish bar 22: Chinese restaurant 23: Japanese pub 24: Indian restaurant (curry, Ganesha) 25: Japanese noodle (SOBA)
Food shop and Cafe 3: cafe 4: Japanese rice sandwich (ONIGIRI) 7: bakery 15: kiosk (7-11)
Shop
10: drug store 15: kiosk (7-11) 26: clinic 27: dentist
Nikkei Bldg.
Metro.Otemachi stattion