Embed Size (px)
Citation preview
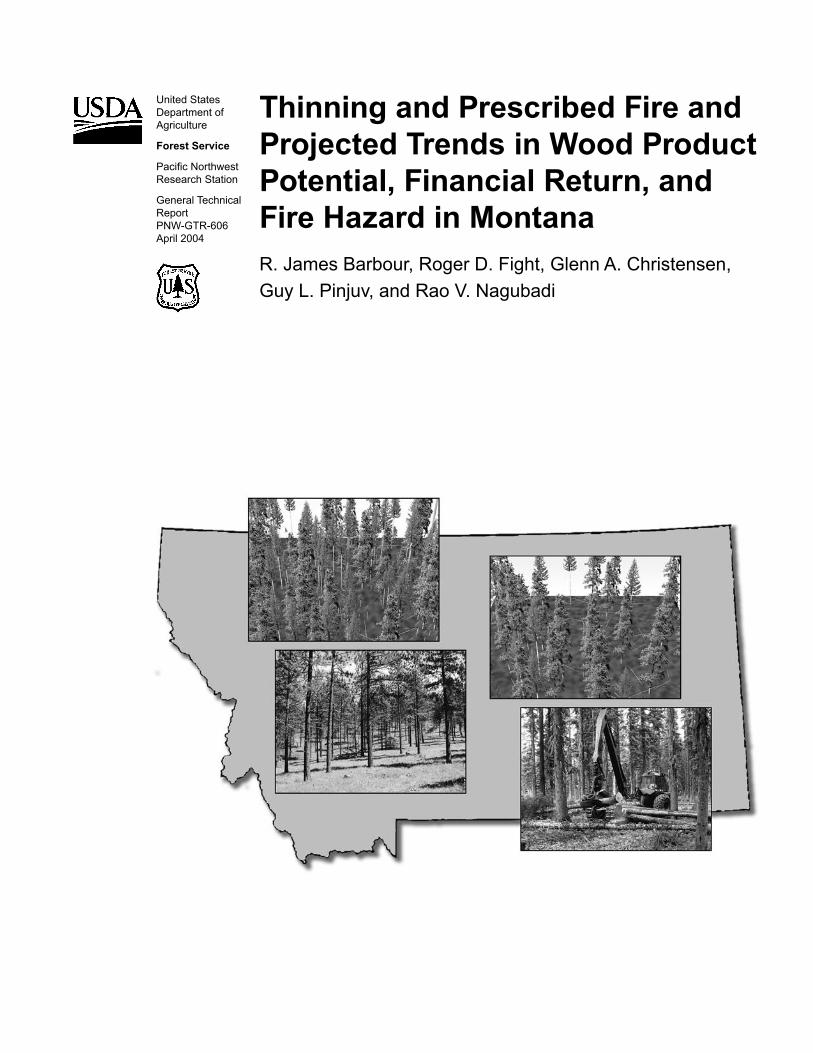
Thinning and Prescribed Fire and Projected Trends in Wood Product Potential, Financial Return, and Fire Hazard in MontanaR. James Barbour, Roger D. Fight, Glenn A. Christensen, Guy L. Pinjuv, and Rao V. Nagubadi
United States Department of Agriculture
Forest Service
Pacific Northwest Research Station
General Technical Report PNW-GTR-606 April 2004

Authors R. James Barbour is a research forest products technologist, Roger D. Fight is a research forester, Glenn A. Christensen is a research forester, and Guy L. Pinjuv and Rao V. Nagubadi were foresters, U.S. Department of Agriculture, Forest Service, Pacific Northwest Research Station, Forestry Sciences Laboratory, P.O. Box 3890, Portland, OR 97208. Pinjuv is currently a doctoral candidate, University of Canterbury, Private Bag 4800, Christchurch 8020, New Zealand; Nagubadi is currently a post-doctoral fellow, School of Forestry and Wildlife Sciences, Auburn University, Auburn, AL 36849.
Abstract Barbour, R. James; Fight, Roger D.; Christensen, Glenn A.; Pinjuv, Guy L.; and Nagubadi, Rao V. 2004. Thinning and prescribed fire and projected trends in wood product potential, financial return, and fire hazard in Montana. Gen. Tech. Rep. PNW-GTR-606. Portland, OR: U.S. Department of Agriculture, Forest Service, Pacific Northwest Research Station. 78 p.
This work was undertaken under a joint fire science project “Assessing the need, costs, and potential benefits of prescribed fire and mechanical treatments to reduce fire hazard.” This paper compares the future mix of timber products under two treat-ment scenarios for the state of Montana. We developed and demonstrated an ana-lytical method that uses readily available tools to evaluate pre- and posttreatment stand conditions; size, species, and volume of merchantable wood removed during thinnings; size and volume of submerchantable wood cut during treatments; and financial returns of prescriptions that are applied repeatedly over a 90-year period.
Keywords: Wood products, thinning, fire hazard, financial return, Montana.
This work was initiated under a Joint Fire Science Program-funded project ”Assessing the needs, costs, and potential benefits of prescribed fire and mechanical treatments to reduce fire hazard.” We developed and demonstrated an analytical method that uses readily available tools to evaluate pretreatment and posttreatment stand condi-tions; size, species, and volume of merchantable wood removed during thinnings; size and volume of submerchantable wood cut during treatments; and financial returns of prescriptions that are applied repeatedly over 90 years. In this paper we compare the potential mix of timber products recovered under two treatment scenarios applied in Montana.
The treatment scenarios simulated here were not intended as solutions to the fuel hazard problem per se. They are, however, representative of approaches that are currently being applied on the ground, and our intention was to illustrate (1) the use of existing tools to evaluate the effectiveness and cost of implementing these types of treatments and (2) the likely results of repeatedly applying these treatments over long timeframes. There are important policy issues associated with both parts of the analysis. Our analysis suggests that only a relatively small proportion of existing stands could be treated without a subsidy if either of the prescriptions modeled here is used. Even so, almost 1,000,000 acres could be treated without a subsidy. Fire hazard is initially reduced by these treatments. The effects of subsequent treatments range from barely maintaining the initial improvement to continuous improvement over a 10-decade period. Projections of repeated applications of these treatments suggest that they also could have unintended consequences by creating conditions conducive to bark beetle (Dendroctonus spp.) outbreaks or by reducing stand densities below acceptable levels. Neither option studied provided for regeneration of stands, so age-class distribution would eventually become a problem in stands managed under either prescription. Our main conclusions, therefore, are that (1) it is important to consider the long-term consequences of fuels treatments and (2) existing tools can provide use-ful information about the short- and long-term effects of many proposed treatments.
A variety of silvicultural treatments can be modeled by using these methods. One of the treatments we chose to illustrate the methods was to thin from below to 9 in diam-eter at breast height (d.b.h.) with a minimum residual basal area (BA) and follow with a prescribed burn, then every 30 years to reevaluate for thinning and to burn whether rethinned or not (TB9). The key findings of that scenario follow.
• The initial effect of this prescription on fire hazard was modest. Repeat entries did little more than maintain the initial gains.
• There was a substantial long-term downward trend in the projected basal area mortality expected during prescribed burn treatments.
• Basal area built up over time, perhaps to levels that would put the stands at risk of insect outbreaks.
• There was no merchantable volume harvested under this prescription after the first thinning.
• No cases were found where the harvested material would cover the cost of conducting the thinning either currently or in future entries given existing market conditions. (If volumes removed from skid trails or cable corridors were included in these calculations, the results might have been different.)
Executive Summary
Findings
• If the TB9 prescription were widely implemented and if policy called for utilization of the removed volume, investments in new processing capacity would be neces-sary because this prescription yields only submerchantable trees after the first entry.
The other treatment we chose was to thin from below up to 50 percent of standing basal area with a minimum residual basal area and follow with a prescribed burn, then every 30 years reevaluate for thinning and burn whether rethinned or not (50BA). The key findings of that scenario follow.
• The initial effect of this prescription on fire hazard was modest, but there was con-tinued improvement with successive entries.
• There was a substantial long-term downward trend in the projected basal area mortality expected during prescribed burn treatments.
• Basal area stabilized near the minimum residual basal area required under the prescription.
• The merchantable volume harvested was lower in future entries than in the initial entry, but the d.b.h. of harvested trees increased to greater than 16 in over the simulation period.
• The prescription made no provision for regenerating the stand, so repeated entries often lowered the number of trees per acre to well below full stocking levels. In practice, managers would almost certainly alter prescriptions to regenerate stands before this happened.
• Typically, less than 20 percent of the high-hazard plots had net financial returns of more than $100 per acre, but this amounted to more than 790,000 acres of Douglas-fir and almost 180,000 acres of ponderosa pine where this treatment could potentially be implemented without a subsidy.
• Most cases showed a positive net return from thinnings by the end of the simula-tion period.
The results suggest that both of the simulated prescriptions reduced fire hazard over the long term, but they were not equally effective. Over the course of several entries, the basal-area-limited prescription created stands that were open with a few scattered large trees, whereas the diameter-limited prescription created dense stands with many midsize trees. The diameter-limited prescription sometimes resulted in combinations of basal area, tree size, and stand age that raise concerns over insect outbreaks, specifi-cally Douglas-fir beetles (Dendroctonus pseudotsuga Hopkins), western pine beetles (D. brevicomis Le Conte), and mountain pine beetles (D. ponderosae Hopkins). In general, however, it was possible to use these treatments to develop a wide range of density and tree size combinations over the simulation period. Even with the simple prescriptions modeled here, it would be possible to select stands with different initial conditions and ages and apply the prescriptions at different times to develop a diverse set of conditions on a landscape. We did not explore such spatial or temporal arrange-ments of treatments, but this undoubtedly would be important when developing man-agement plans that consider the interactions of fuel reduction treatments with multiple resource values and episodic disturbances on large landscapes.
In terms of wood utilization, the analysis showed that the diameter-limited prescrip-tions produced only small volumes of small trees from the first entry and minimal volumes in subsequent entries. These prescriptions almost universally had negative net returns, even without considering the costs of a regular cycle of prescribed fire, so a substantial subsidy would be required to implement them. If these prescriptions were widely implemented and if industrial capacity were developed to use the wood re-moved under them, it would be important to size processing plants and develop treat-ment schedules to ensure a sustainable supply of raw material.
The basal-area-limited treatment produced more volume than the diameter-limited prescription and sometimes showed a positive net return. This prescription produced trees and logs in a variety of sizes. Although the average diameter of cut trees in-creased with successive entries, the total volume per thinning generally declined over time.
Contents 1 Introduction
2 Geographic and Forest Type Detail
2 Methods and Assumptions
4 Fire Hazard Reduction Treatments
4 Forest Vegetation Simulator Variants
4 Prescriptions
5 Effectiveness of Hazard Reduction Treatments
5 Financial Analysis
6 Results and Discussion
6 Douglas-Fir
13 Ponderosa Pine
20 Conclusion
22 Metric Equivalents
22 Literature Cited
24 Acronym Glossary
24 Appendix 1—Cost and Log Price Assumptions
26 Appendix 2—Acreage and Number of Inventory Plots
28 Appendix 3—Average Initial Stand Characteristics
32 Appendix 4—Average Residual Stand Characteristics
41 Appendix 5—Average Volume of Utilized Trees
50 Appendix 6—Average Volume of Unutilized Trees
59 Appendix 7—Average Small-End Diameter of Utilized Logs
62 Appendix 8—Average Percentage of Volume, by Species, of Utilized Trees
71 Appendix 9—Average Proportion of Stands by Net Value Category

1
Introduction This study was undertaken with funding from the Joint Fire Science Program (JFSP) to develop protocols for use in determining the magnitude of hazard reduction treatment needs, treatment cost, and associated benefits at a state level. The objectives of the study include (1) quantifying existing stand conditions for major forest types in terms of density, structure, and species composition, and prioritizing by need for hazard reduction treatment, (2) developing and comparing alternative cutting and prescribed burning prescriptions for reducing high-hazard conditions in major forest types, (3) determining potential revenue from timber products generated from the hazard reduc-tion harvest treatments, (4) comparing the future mix of timber products under alterna-tive treatment scenarios, and (5) describing the potential for analyzing noncommodity resources under treatment and no-treatment scenarios. This report demonstrates the protocols developed under JFSP funding to analyze and illustrate trends in the long-term effects of repeated hazard reduction entries in terms of the stocking, size, and species mix of residual stands and the size and species mix of trees and logs that might be removed and used for wood products.
Montana was selected as an example because recent inventories were available. Montana’s forest products industry is well established with the technological capabil-ity to process the numerous small-diameter logs expected from fuel hazard reduc-tion treatments. A similar analysis was conducted for New Mexico where the existing industry is small and not geared toward using this type of material (see Fight et al. 2004).
If widely adopted, the types of treatments proposed as a means of reducing forest fire hazards could have implications for future forest conditions as profound as past management practices, principally harvesting and fire exclusion that led to the existing conditions. Changes of that magnitude have the potential to affect many forest values such as fisheries, wildlife, timber, nontimber forest resources, environmental services, and amenities. Some of these changes will likely be considered positive and some will likely be considered negative. How they are viewed depends on the resource in ques-tion and the relative importance given to different resource values. It is neither our place nor our intent to say which changes are more important or whether they are de-sirable or undesirable. Our intent is to provide a set of protocols that use existing tools1 and data2 that are available to analysts employed by federal, state, and private land management organizations. The interpretations we provide in this report are intended as neutral examples illustrating these protocols. Our protocols can be used to conduct analyses and display information about fire hazard, stand conditions, and removed materials. We anticipate that this information will be useful to decisionmakers who for-mulate fire management policy and devise implementation strategies.
1 For example, Forest Vegetation Simulator (FVS), Fire and Fuels Extension (FFE), Financial Evaluation of Ecosystem Management Activities (FEEMA), Microsoft Access (the use of trade or firm names in this publication is for reader information and does not imply endorsement by the U.S. Department of Agriculture of any product or service), etc. (see “Methods and Assumptions” section). 2 We used forest inventory and analysis (FIA) plot-level data, but many types of stand-level data are adequate for these protocols.
2
The types of treatments proposed to reduce fire hazard could also have important implications for the volume and characteristics of timber available for the production of forest products. Significant shifts in the species or size composition, for example, could influence the economic viability of the industry and affect the economic health of the people and communities in which timber processing occurs.
This report is intended to supply information to a broad range of decisionmakers concerned with forest fire hazard including federal, state, and private forest land managers, planners, and others with an interest in the management of forests in the Western United States.
Montana was divided into western and eastern regions for analysis and reporting. The division generally follows the Continental Divide. Within each geographic area, forests were further divided into 11 forest types: Douglas-fir (Pseudotsuga menzie-sii (Mirb.) Franco), lodgepole pine (Pinus contorta Dougl. ex Loud.), ponderosa pine (Pinus ponderosa Dougl. ex Laws.), moist low-elevation mixed conifers, dry low-eleva-tion mixed conifers, upper-elevation mixed conifers, western larch (Larix occidentalis Nutt.), spruce/fir (Picea spp./Abies spp.), subalpine fir (Abies lasiocarpa (Hook.) Nutt.), quaking aspen (Populus tremuloides Michx.), and cottonwood (Populus spp.). We per-formed our analyses on the Douglas-fir and ponderosa pine forest types because they were identified by the Montana technical contact team3 (TCT) as being of high con-cern and having a high potential for hazard reduction treatments. These forest types have relatively short fire-return intervals and are likely candidates for hazard reduction treatments. They were also extensive enough to supply sufficient forest inventory and analysis (FIA) data with which to provide a meaningful illustration of our protocols. We report results by two ownership categories: national forest land and other land. These categories were chosen to make the most efficient use of the available FIA data. With additional stand exam data it would be possible to further refine ownership classes. In this report each combination of region, owner group, forest type, slope category, and hazard category is referred to as a “case” and each application of a treatment (a thin-ning or prescribed fire) within each case is referred to as an “entry.” Reporting within the two ownership classes was further broken down into current forest fire hazard condition and slope. The maximum number of reporting categories (cases) for the Montana study was 32 (2 regions by 2 owner groups by 2 forest types by 2 slope cat-egories by 2 hazard categories).
The objective of this analysis was to show the results of two stand treatment options intended to reduce fire hazard both now and in the future. Evaluations include (1) re-sidual stand structure, (2) volume, size, and characteristics of merchantable trees cut through time, (3) the volume and size of submerchantable (biomass) trees cut through time, and (4) the financial feasibility of treatments. A detailed description of our model-ing techniques is given by Christensen et al. (2002)
We used existing modeling tools and inventory data linked in a way that allowed a comprehensive analysis over a range of treatment options. Primary tools included the Forest Vegetation Simulator (FVS) growth and yield model (Crookston 1990, Stage
Geographic and Forest Type Detail
Methods and Assumptions
3 A group of experts were assembled to comment on the design of and outcomes from this analysis. They are Donald Artley, Montana Department of Natural Resources and Conservation; Danny Castillo, USDA Forest Service Northern Region; Dennis Dupuis, Salish and Kootenai Tribal Forestry; Bruce Reid, USDI Bureau of Land Management; and Gordy Sanders, Montana Tree Farmers and Pyramid Lumber.
3
1973), the Fire and Fuels Extension (FFE) model as part of FVS (Beukema et al. 1997, Scott and Reinhardt 2001), and the Financial Evaluation of Ecosystem Management Activities (FEEMA) model (Fight and Chmelik 1998). Data were stored in a Microsoft Access database, and a standard set of reports was developed within the database. Use of these tools makes the analysis portable to anywhere in the Western United States where an FVS variant with an FFE extension and a FEEMA variant are avail-able. The tools are familiar to, or can be readily learned by, forest planning and analy-sis staff within federal agencies and most state or private organizations. Where they exist, other growth models, fire models, and financial models could be substituted for the ones we used.
Measurements of current forest vegetation are from data collected by the Forest Service FIA program. Our methods are general, however, and adequate data can be obtained from a wide range of stand exam or other stand-level data that are suitable for use as input data to FVS. An important caveat here is that stand-level data should be collected in such a way that they comprise a statistically representative sample of the vegetation population on the target landscape.
We examined 678 candidate FIA plots with a sampling weight of approximately 6,000 acres each. When more than 50 plots were available for a given case,4 a sample of 50 plots was randomly selected to represent all the area in that case. When fewer than 50 plots were available for a given case, all of the plots were used in the analysis. Cases with fewer than 10 plots were not included in the analysis because there were insufficient data to adequately represent potential variation. Alternatively, it is possible to analyze all plots regardless of sample size and examine results for individual plots rather than average results. We felt that this method would be tedious and not allow us to provide a compact illustration of our methods. Individual analysts might, however, be interested in identifying plot conditions where the probability of some desired out-come, such as financially viable activities, is high. In that case, analysis of individual plots might be desirable.
Fire hazard rating is based on estimates of the crowning index for each decade pro-vided by the FFE of FVS. Crowning index is the windspeed necessary to sustain a crown fire. It is calculated from the crown bulk density for the stand. The lower the crowning index, the higher the probability that a crown fire will be sustained (Scott and Reinhardt 2001). Crowning index values reported are after thinning (if called for) and prescribed fire treatment.
Forest inventory and analysis data were converted into FVS input files, and a silvi-cultural treatment regime was simulated. The silvicultural regimes simulated in this analysis were intentionally kept simple to provide an uncomplicated illustration of the protocols and to provide benchmark results that could be used to refine treatment op-tions. In other parts of this study another more complex prescription was used, but it was not used in our analysis because we were unable to model it in FVS.5
4 Each case is the combination of ownership, forest type, fire hazard, and slope. 5 Fiedler, C.E.; Keegan, C.E., III; Woodall, C.W. [et al.] 2001. A strate-gic assessment of fire hazard in Montana; A strategic assessment of fire hazard in New Mexico. Reports submitted to the Joint Fire Science Program Board, 3833 S. Development Ave., Boise, ID 83705.

4
For each harvest made in FVS, a list of cut trees was recorded and then imported into the FEEMA model. The FEEMA model determined merchantability of each tree, based on a minimum small-end diameter (SED) of 5.0 in inside the bark and a minimum log length of 8 ft for upper logs and 16 ft for butt logs. The FEEMA model tallied individ-ual logs and produced an output file summarizing volume by species, tree diameter at breast height (d.b.h.), and log SED. These results were compiled in a database. Results from the simulations were calculated as the average of the FIA plots selected for each case (50 or fewer as described above) weighted by the appropriate plot ex-pansion factor (the number of acres represented by a plot). Whole-tree stem volumes of biomass (submerchantable) trees from 1 to 7 in d.b.h. were estimated by using FVS. We did not calculate total biomass (total stem, limbs, and foliage) volume or weight for the biomass trees.
Silvicultural prescriptions were developed in consultation with the TCT. The objective was to cover a range of treatment options. In general, a treatment can be a thinning, a thinning followed by burning (prescribed fire), or a maintenance burn (prescribed fire) without a thinning. We used thinning treatments that included thinnings from below to different diameter and basal area targets, followed by a prescribed burn. Thinning was simulated with FVS. Prescribed burning was simulated by using the FFE model. The crowning index from the FFE model was used as a surrogate for fire hazard. We segregated all plots into high, medium, and low fire hazard based on crowning indi-ces, which are expressed as windspeed of <25 mph (high hazard), 25 to <50 mph (moderate hazard), and 50+ mph (low hazard). For the ponderosa pine forest type we grouped the plots with high and medium fire hazard, and in the Douglas-fir forest type we grouped the plots with medium and low fire hazard. For reporting purposes, output tables are labeled as “high” or “low” fire hazard with the grouping indicated at the beginning of the results section for each forest type. This designation indicates the relative importance of treating stands in the indicated crowning index classes for that forest type. Treatments in plots designated as low were deferred for one treatment simulation cycle (30 years).
Three FVS variants were used for this analysis. The eastern Montana variant was used for all of eastern Montana. In western Montana, the northern Idaho variant was used except for the Kootenai National Forest and the Tally Lake Ranger District of the Flathead National Forest where the Kootenai variant was used.
Two generalized prescriptions were applied to both forest types. The first was a thin-from-below to 9 in d.b.h. It is referred to as TB9 in the text. The second is a thin-from-below to up to 50 percent of standing basal area. It is referred to as 50BA in the text. Details of the treatment for each forest type and geographic locations follow.
Douglas-fir—The thinning reentry interval is 30 years with prescribed burning imme-diately following each entry (thinning and burning included in the same FVS simulation cycle). The TB9 prescription required a minimum residual basal area of 45 ft2/ac in western Montana and 40 ft2/ac in eastern Montana. The 50BA prescription required a minimum residual basal area of 80 ft2/ac in western Montana and 70 ft2/ac in eastern Montana. Stands that did not have sufficient basal area to qualify for a thinning were burned and were reconsidered for thinning at the next thinning cycle (30 years).
Fire Hazard Reduction Treatments
Forest Vegetation Simulator Variants
Prescriptions
5
Ponderosa pine—The thinning reentry interval is 30 years with prescribed burn-ing immediately following each entry (thinning and burning included in the same FVS simulation cycle). The TB9 prescription required a minimum residual basal area of 40 ft2/ac in western Montana and 35 ft2/ac in eastern Montana. The 50BA prescription required a minimum residual basal area of 50 ft2/ac in western Montana and 40 ft2/ac in eastern Montana. Stands that did not have sufficient basal area to qualify for a thin-ning were burned and were reconsidered for thinning at the next thinning cycle (30 years).
Linear regression analysis was used to identify trends in the long-term effectiveness of treatments in lowering fire hazard. The regression tested for a time trend and a treat-ment effect in the predicted crowning index. The dependent variable in these regres-sions was the average predicted crowning index for the high-hazard plots for a given forest type and treatment. The independent variables were decades numbered from 1 to 10, dummy variable for decade of treatment, and dummy variable for the decade following treatment. Dummy variables have a value of 1 for data points that have the attribute and zero otherwise. The model form was Y = a + b(decade) + c(decade of treatment dummy) + d(decade following treatment dummy). Any of the three vari-ables that were not statistically significant at the 5-percent level were deleted from the model, and the model was rerun. Results from this analysis helped to illustrate wheth-er there was improvement in crowning index immediately after entries or during the decade following entries, how crowning index changed between entries, and whether there was a long-term trend of improvement in crowning index.
A similar analysis was used to identify trends in the average basal area mortality ex-pected from the prescribed burns. The dependent variable in these regressions was the average predicted basal area mortality (percentage) for a prescribed burn for the high-hazard plots for a given forest type and treatment.
The FEEMA model was used to rate the potential net revenue from the thinnings. The analysis was done for a single set of economic assumptions that represent mixed market conditions. The market conditions used represent a market for lumber and a market for chip logs down to 5 in SED. Although the pricing was done on a log basis rather than the tree basis used in another part of the study, the prices were made as comparable as possible (see footnote 5). The financial returns should be regarded as optimistic because of the assumed market for chip logs, but useful in identifying the relative financial feasibility of different cases and changes in feasibility of future versus current treatments. Costs included cutting small trees that are cut and treated in place and cutting trees that are used for products. Costs of other harvest-related activities such as road building or repair and environmental remediation, which can vary wide-ly, were not included, nor were revenues associated with timber removed from skid trails or cable corridors. Ground-based equipment was assigned a lower cost than cable yarding systems. Stump-to-truck costs were based on Hartsough et al. (2001). Ground-based equipment was assumed on slopes of less than 35 percent. Hauling costs were $28 per 100 ft3 for all species and areas. See appendix 1 (tables 1 through 3) for a full description of economic assumptions.
Effectiveness of Hazard Reduction Treatments
Financial Analysis
6
The total area and number of FIA inventory plots included in this analysis for the Douglas-fir forest type are shown in appendix 2 (table 4). Douglas-fir plots were segre-gated by high crowning index (<25 mph windspeed) and low/moderate crowning index (25+ mph windspeed) for the analysis presented here. For brevity, these two groups are referred to as high fire hazard and low fire hazard in all of the tables for this spe-cies.
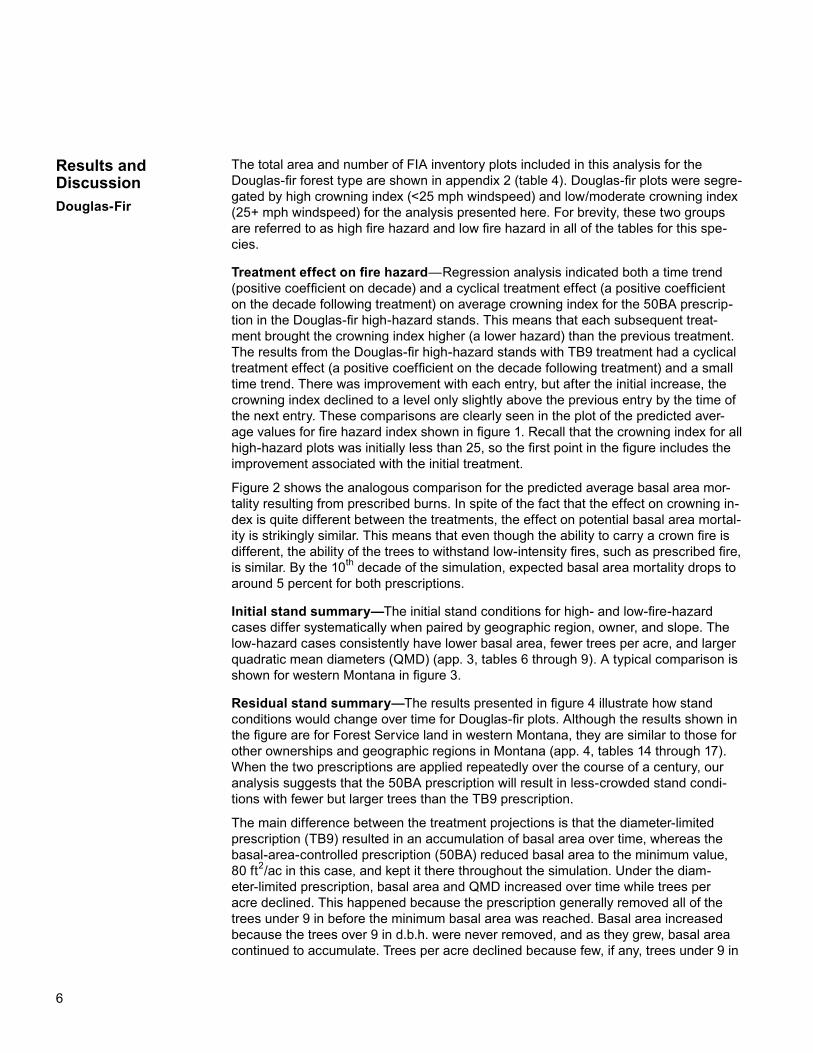
Treatment effect on fire hazard—Regression analysis indicated both a time trend (positive coefficient on decade) and a cyclical treatment effect (a positive coefficient on the decade following treatment) on average crowning index for the 50BA prescrip-tion in the Douglas-fir high-hazard stands. This means that each subsequent treat-ment brought the crowning index higher (a lower hazard) than the previous treatment. The results from the Douglas-fir high-hazard stands with TB9 treatment had a cyclical treatment effect (a positive coefficient on the decade following treatment) and a small time trend. There was improvement with each entry, but after the initial increase, the crowning index declined to a level only slightly above the previous entry by the time of the next entry. These comparisons are clearly seen in the plot of the predicted aver-age values for fire hazard index shown in figure 1. Recall that the crowning index for all high-hazard plots was initially less than 25, so the first point in the figure includes the improvement associated with the initial treatment.
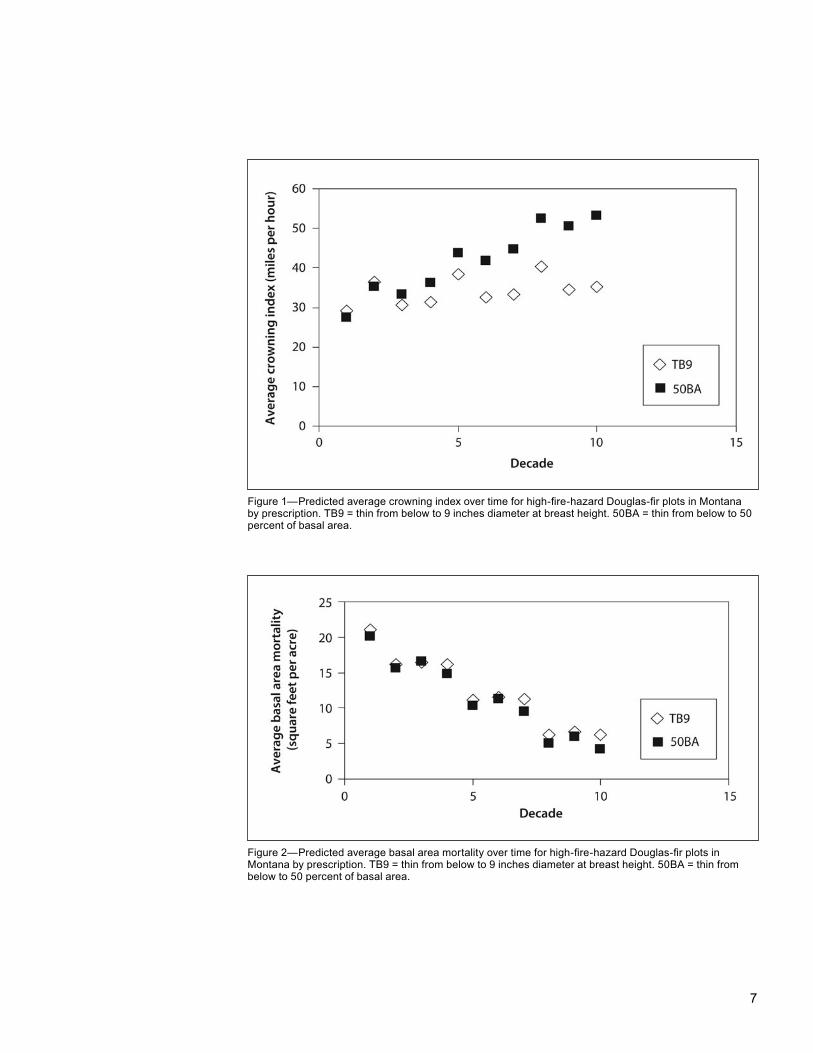
Figure 2 shows the analogous comparison for the predicted average basal area mor-tality resulting from prescribed burns. In spite of the fact that the effect on crowning in-dex is quite different between the treatments, the effect on potential basal area mortal-ity is strikingly similar. This means that even though the ability to carry a crown fire is different, the ability of the trees to withstand low-intensity fires, such as prescribed fire, is similar. By the 10th decade of the simulation, expected basal area mortality drops to around 5 percent for both prescriptions.
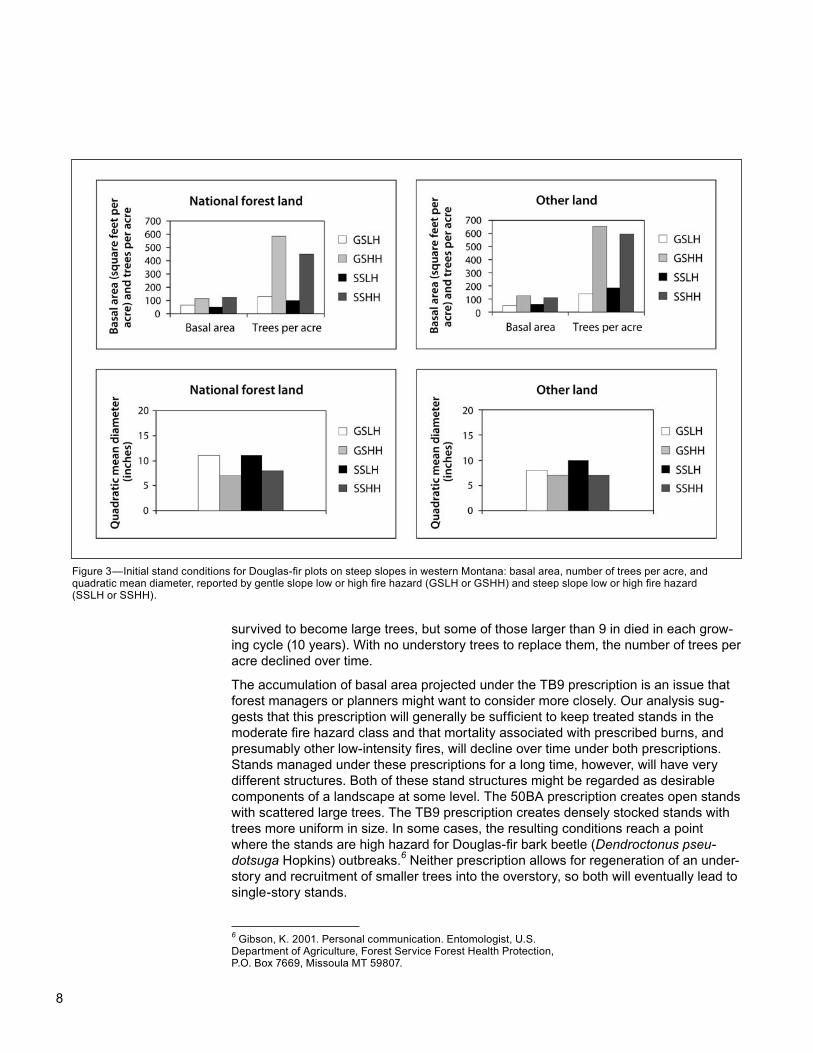
Initial stand summary—The initial stand conditions for high- and low-fire-hazard cases differ systematically when paired by geographic region, owner, and slope. The low-hazard cases consistently have lower basal area, fewer trees per acre, and larger quadratic mean diameters (QMD) (app. 3, tables 6 through 9). A typical comparison is shown for western Montana in figure 3.
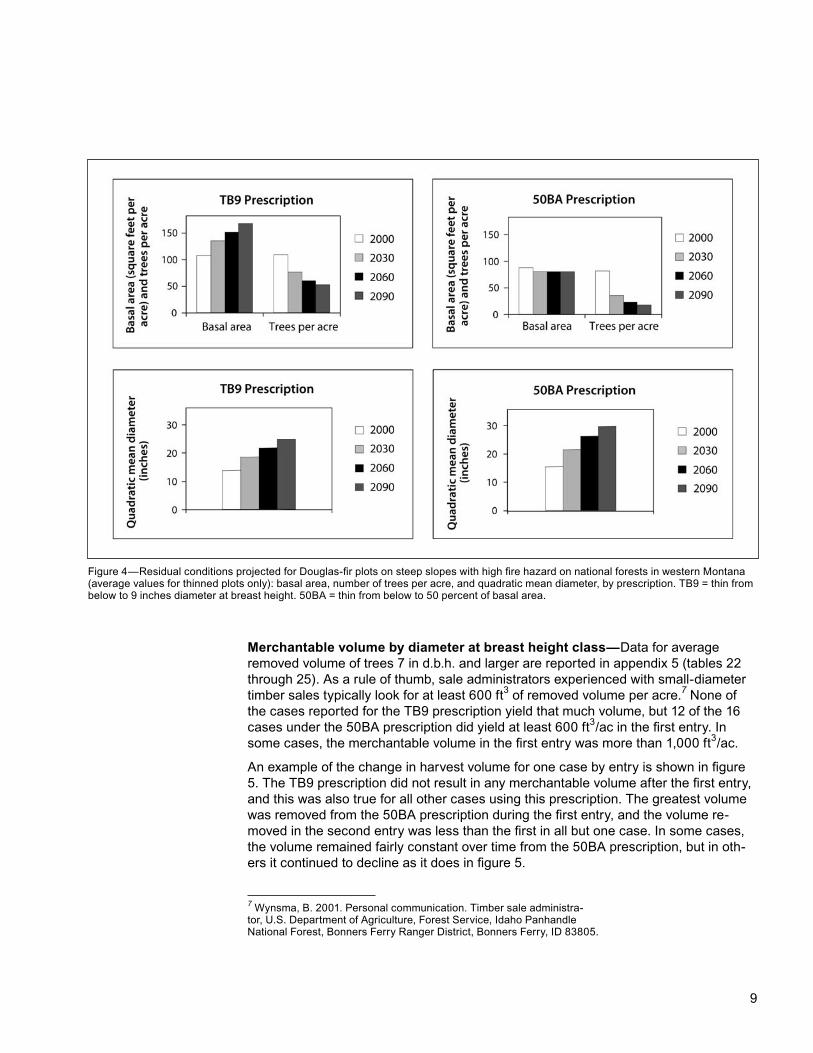
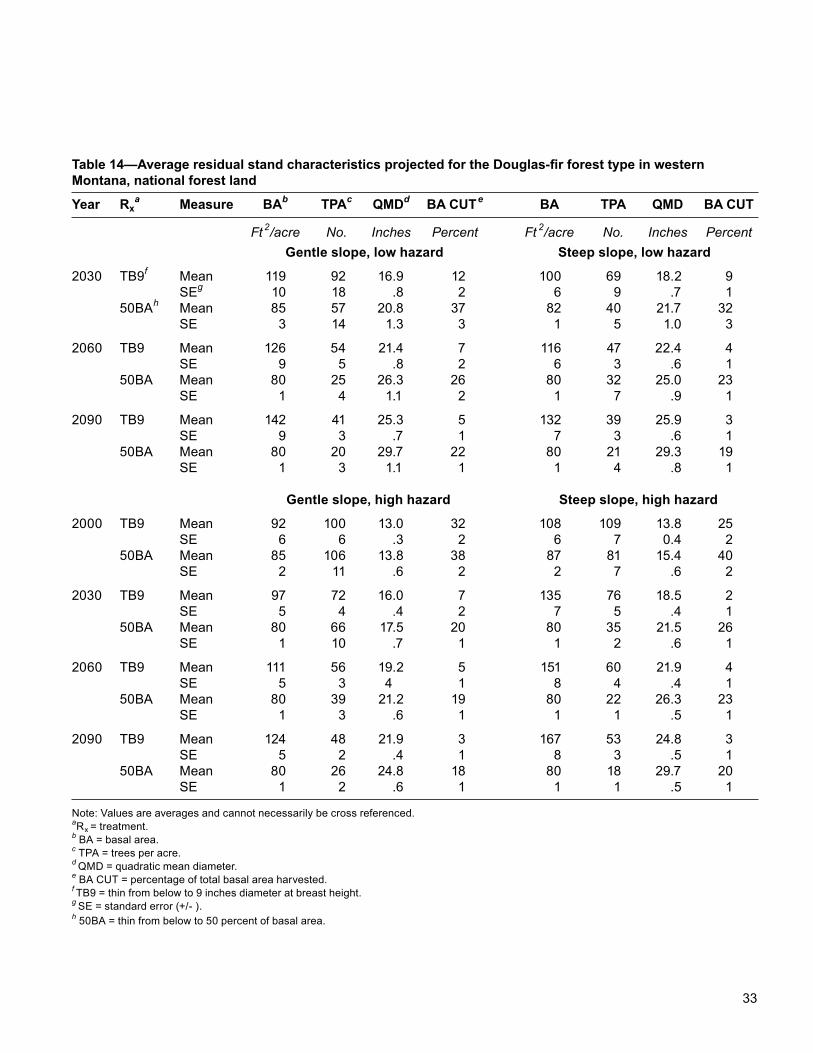
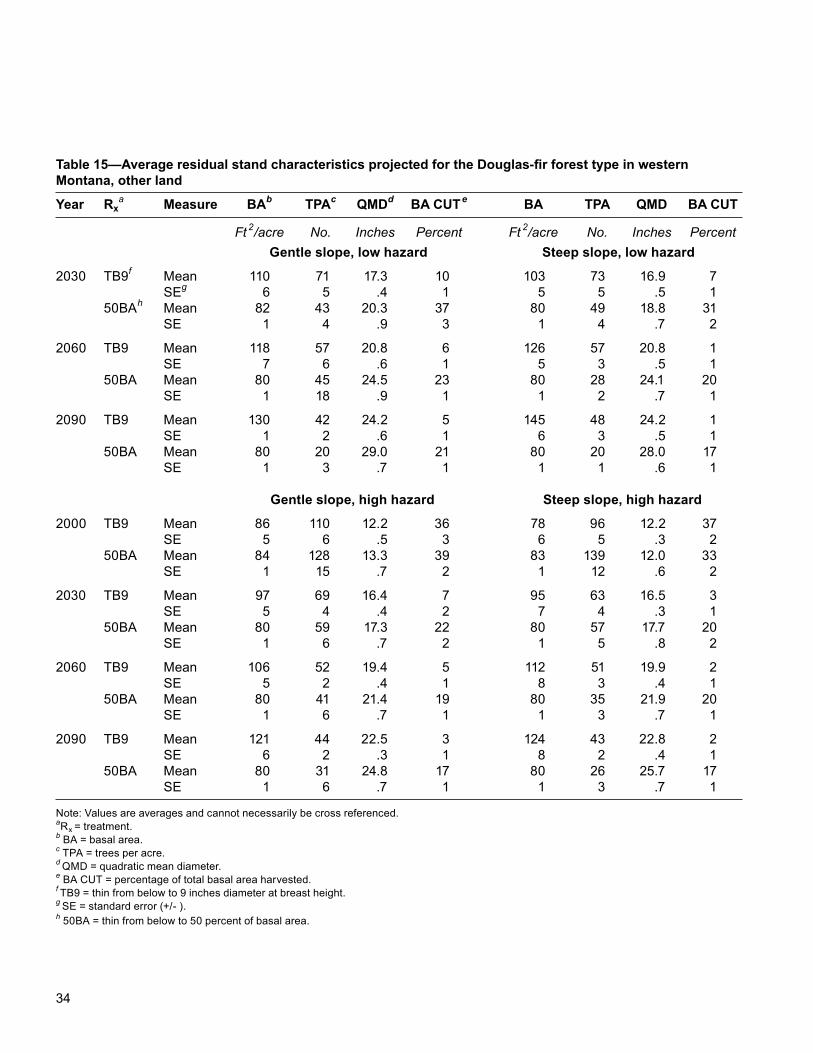
Residual stand summary—The results presented in figure 4 illustrate how stand conditions would change over time for Douglas-fir plots. Although the results shown in the figure are for Forest Service land in western Montana, they are similar to those for other ownerships and geographic regions in Montana (app. 4, tables 14 through 17). When the two prescriptions are applied repeatedly over the course of a century, our analysis suggests that the 50BA prescription will result in less-crowded stand condi-tions with fewer but larger trees than the TB9 prescription.
The main difference between the treatment projections is that the diameter-limited prescription (TB9) resulted in an accumulation of basal area over time, whereas the basal-area-controlled prescription (50BA) reduced basal area to the minimum value, 80 ft2/ac in this case, and kept it there throughout the simulation. Under the diam-eter-limited prescription, basal area and QMD increased over time while trees per acre declined. This happened because the prescription generally removed all of the trees under 9 in before the minimum basal area was reached. Basal area increased because the trees over 9 in d.b.h. were never removed, and as they grew, basal area continued to accumulate. Trees per acre declined because few, if any, trees under 9 in
Results and DiscussionDouglas-Fir
7
Figure 1—Predicted average crowning index over time for high-fire-hazard Douglas-fir plots in Montana by prescription. TB9 = thin from below to 9 inches diameter at breast height. 50BA = thin from below to 50 percent of basal area.
Figure 2—Predicted average basal area mortality over time for high-fire-hazard Douglas-fir plots in Montana by prescription. TB9 = thin from below to 9 inches diameter at breast height. 50BA = thin from below to 50 percent of basal area.
8
survived to become large trees, but some of those larger than 9 in died in each grow-ing cycle (10 years). With no understory trees to replace them, the number of trees per acre declined over time.
The accumulation of basal area projected under the TB9 prescription is an issue that forest managers or planners might want to consider more closely. Our analysis sug-gests that this prescription will generally be sufficient to keep treated stands in the moderate fire hazard class and that mortality associated with prescribed burns, and presumably other low-intensity fires, will decline over time under both prescriptions. Stands managed under these prescriptions for a long time, however, will have very different structures. Both of these stand structures might be regarded as desirable components of a landscape at some level. The 50BA prescription creates open stands with scattered large trees. The TB9 prescription creates densely stocked stands with trees more uniform in size. In some cases, the resulting conditions reach a point where the stands are high hazard for Douglas-fir bark beetle (Dendroctonus pseu-dotsuga Hopkins) outbreaks.6 Neither prescription allows for regeneration of an under-story and recruitment of smaller trees into the overstory, so both will eventually lead to single-story stands.
Figure 3—Initial stand conditions for Douglas-fir plots on steep slopes in western Montana: basal area, number of trees per acre, and quadratic mean diameter, reported by gentle slope low or high fire hazard (GSLH or GSHH) and steep slope low or high fire hazard (SSLH or SSHH).
6 Gibson, K. 2001. Personal communication. Entomologist, U.S. Department of Agriculture, Forest Service Forest Health Protection, P.O. Box 7669, Missoula MT 59807.
9
Figure 4—Residual conditions projected for Douglas-fir plots on steep slopes with high fire hazard on national forests in western Montana (average values for thinned plots only): basal area, number of trees per acre, and quadratic mean diameter, by prescription. TB9 = thin from below to 9 inches diameter at breast height. 50BA = thin from below to 50 percent of basal area.
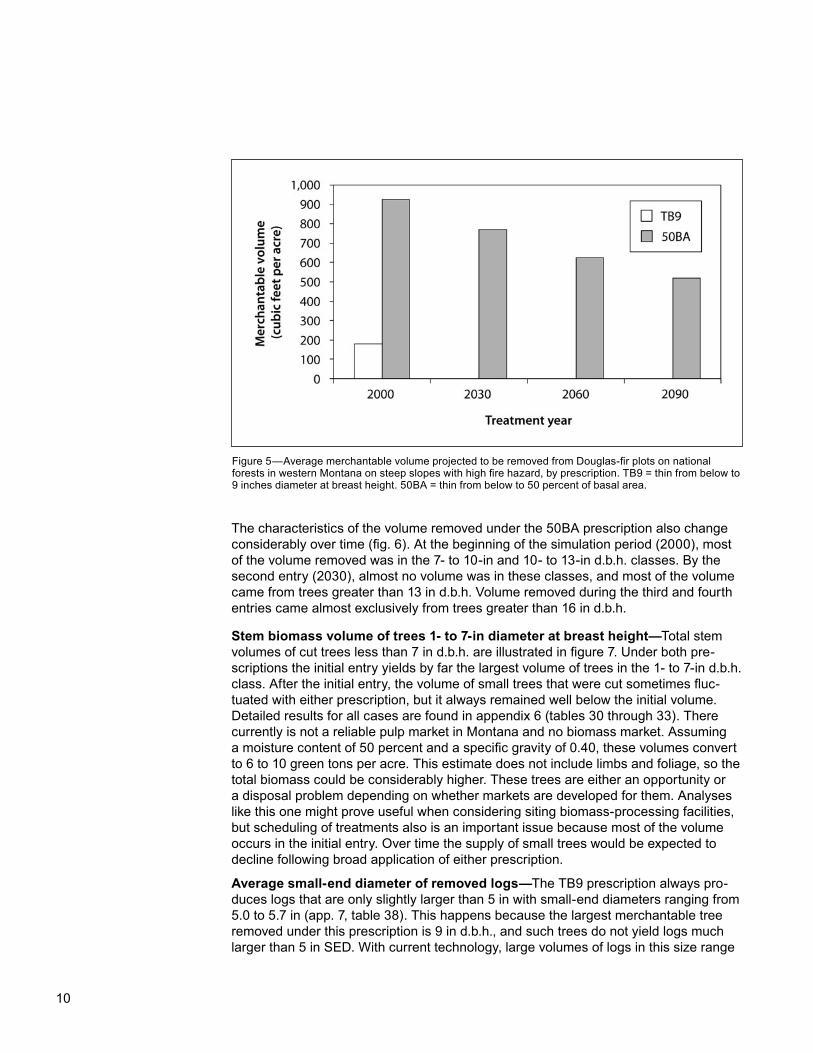
Merchantable volume by diameter at breast height class—Data for average removed volume of trees 7 in d.b.h. and larger are reported in appendix 5 (tables 22 through 25). As a rule of thumb, sale administrators experienced with small-diameter timber sales typically look for at least 600 ft3 of removed volume per acre.7 None of the cases reported for the TB9 prescription yield that much volume, but 12 of the 16 cases under the 50BA prescription did yield at least 600 ft3/ac in the first entry. In some cases, the merchantable volume in the first entry was more than 1,000 ft3/ac.
An example of the change in harvest volume for one case by entry is shown in figure 5. The TB9 prescription did not result in any merchantable volume after the first entry, and this was also true for all other cases using this prescription. The greatest volume was removed from the 50BA prescription during the first entry, and the volume re-moved in the second entry was less than the first in all but one case. In some cases, the volume remained fairly constant over time from the 50BA prescription, but in oth-ers it continued to decline as it does in figure 5.
7 Wynsma, B. 2001. Personal communication. Timber sale administra-tor, U.S. Department of Agriculture, Forest Service, Idaho Panhandle National Forest, Bonners Ferry Ranger District, Bonners Ferry, ID 83805.
10
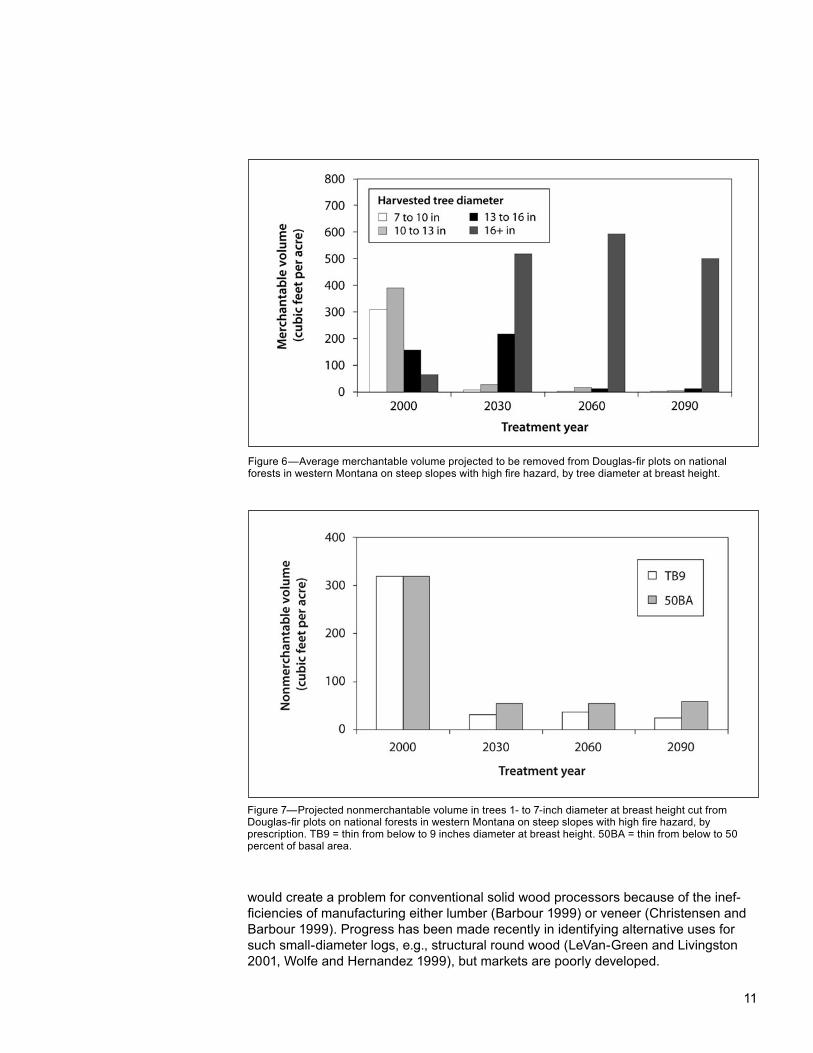
The characteristics of the volume removed under the 50BA prescription also change considerably over time (fig. 6). At the beginning of the simulation period (2000), most of the volume removed was in the 7- to 10-in and 10- to 13-in d.b.h. classes. By the second entry (2030), almost no volume was in these classes, and most of the volume came from trees greater than 13 in d.b.h. Volume removed during the third and fourth entries came almost exclusively from trees greater than 16 in d.b.h.
Stem biomass volume of trees 1- to 7-in diameter at breast height—Total stem volumes of cut trees less than 7 in d.b.h. are illustrated in figure 7. Under both pre-scriptions the initial entry yields by far the largest volume of trees in the 1- to 7-in d.b.h. class. After the initial entry, the volume of small trees that were cut sometimes fluc-tuated with either prescription, but it always remained well below the initial volume. Detailed results for all cases are found in appendix 6 (tables 30 through 33). There currently is not a reliable pulp market in Montana and no biomass market. Assuming a moisture content of 50 percent and a specific gravity of 0.40, these volumes convert to 6 to 10 green tons per acre. This estimate does not include limbs and foliage, so the total biomass could be considerably higher. These trees are either an opportunity or a disposal problem depending on whether markets are developed for them. Analyses like this one might prove useful when considering siting biomass-processing facilities, but scheduling of treatments also is an important issue because most of the volume occurs in the initial entry. Over time the supply of small trees would be expected to decline following broad application of either prescription.
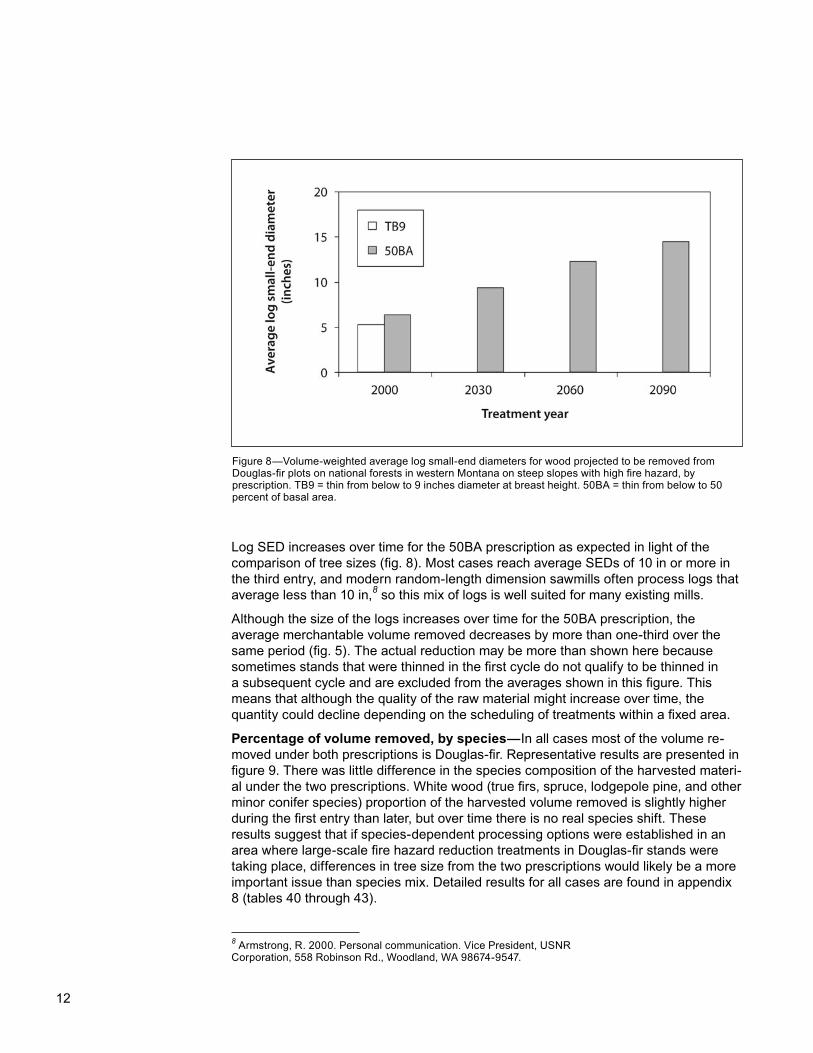
Average small-end diameter of removed logs—The TB9 prescription always pro-duces logs that are only slightly larger than 5 in with small-end diameters ranging from 5.0 to 5.7 in (app. 7, table 38). This happens because the largest merchantable tree removed under this prescription is 9 in d.b.h., and such trees do not yield logs much larger than 5 in SED. With current technology, large volumes of logs in this size range
Figure 5—Average merchantable volume projected to be removed from Douglas-fir plots on national forests in western Montana on steep slopes with high fire hazard, by prescription. TB9 = thin from below to 9 inches diameter at breast height. 50BA = thin from below to 50 percent of basal area.
11
Figure 6—Average merchantable volume projected to be removed from Douglas-fir plots on national forests in western Montana on steep slopes with high fire hazard, by tree diameter at breast height.
Figure 7—Projected nonmerchantable volume in trees 1- to 7-inch diameter at breast height cut from Douglas-fir plots on national forests in western Montana on steep slopes with high fire hazard, by prescription. TB9 = thin from below to 9 inches diameter at breast height. 50BA = thin from below to 50 percent of basal area.
would create a problem for conventional solid wood processors because of the inef-ficiencies of manufacturing either lumber (Barbour 1999) or veneer (Christensen and Barbour 1999). Progress has been made recently in identifying alternative uses for such small-diameter logs, e.g., structural round wood (LeVan-Green and Livingston 2001, Wolfe and Hernandez 1999), but markets are poorly developed.
12
Log SED increases over time for the 50BA prescription as expected in light of the comparison of tree sizes (fig. 8). Most cases reach average SEDs of 10 in or more in the third entry, and modern random-length dimension sawmills often process logs that average less than 10 in,8 so this mix of logs is well suited for many existing mills.
Although the size of the logs increases over time for the 50BA prescription, the average merchantable volume removed decreases by more than one-third over the same period (fig. 5). The actual reduction may be more than shown here because sometimes stands that were thinned in the first cycle do not qualify to be thinned in a subsequent cycle and are excluded from the averages shown in this figure. This means that although the quality of the raw material might increase over time, the quantity could decline depending on the scheduling of treatments within a fixed area.
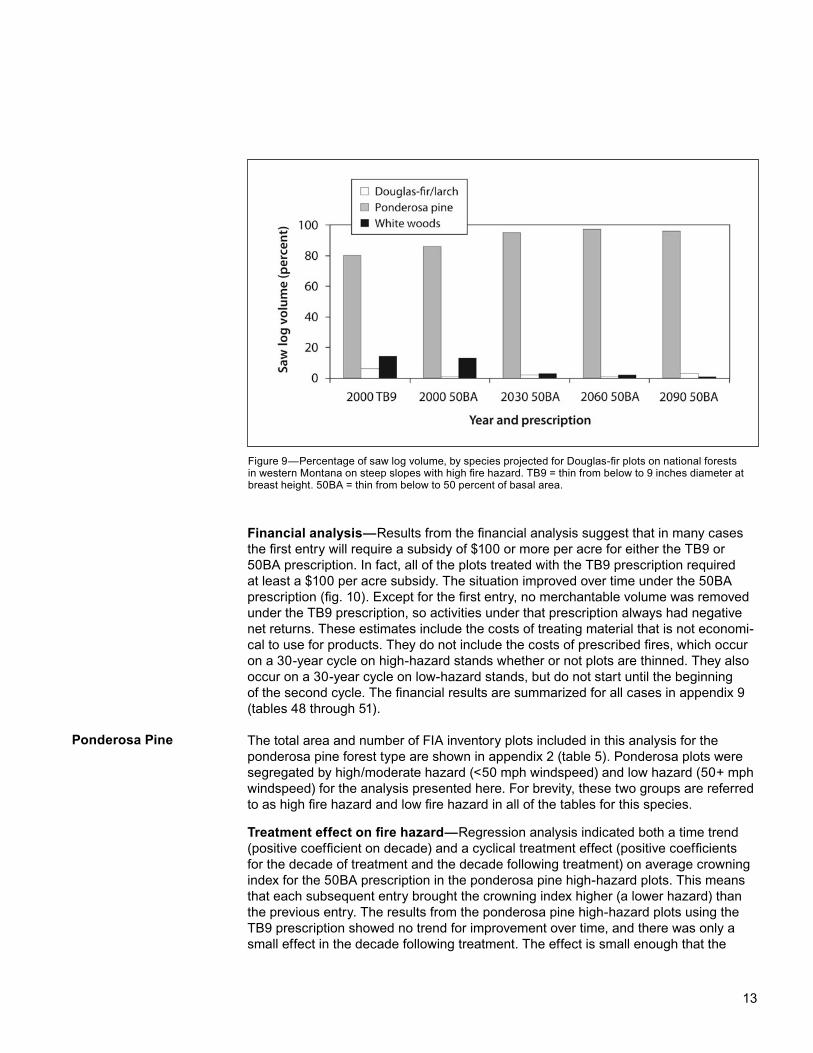
Percentage of volume removed, by species—In all cases most of the volume re-moved under both prescriptions is Douglas-fir. Representative results are presented in figure 9. There was little difference in the species composition of the harvested materi-al under the two prescriptions. White wood (true firs, spruce, lodgepole pine, and other minor conifer species) proportion of the harvested volume removed is slightly higher during the first entry than later, but over time there is no real species shift. These results suggest that if species-dependent processing options were established in an area where large-scale fire hazard reduction treatments in Douglas-fir stands were taking place, differences in tree size from the two prescriptions would likely be a more important issue than species mix. Detailed results for all cases are found in appendix 8 (tables 40 through 43).
Figure 8—Volume-weighted average log small-end diameters for wood projected to be removed from Douglas-fir plots on national forests in western Montana on steep slopes with high fire hazard, by prescription. TB9 = thin from below to 9 inches diameter at breast height. 50BA = thin from below to 50 percent of basal area.
8 Armstrong, R. 2000. Personal communication. Vice President, USNR Corporation, 558 Robinson Rd., Woodland, WA 98674-9547.
13
Figure 9—Percentage of saw log volume, by species projected for Douglas-fir plots on national forests in western Montana on steep slopes with high fire hazard. TB9 = thin from below to 9 inches diameter at breast height. 50BA = thin from below to 50 percent of basal area.
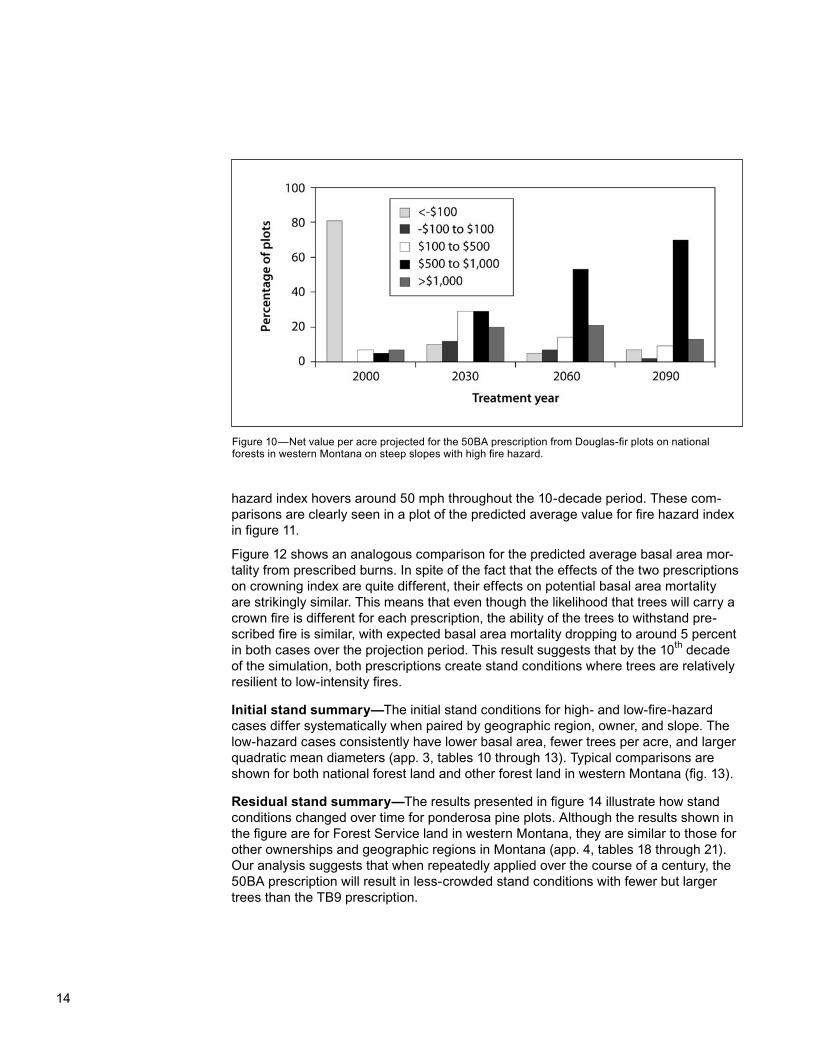
Financial analysis—Results from the financial analysis suggest that in many cases the first entry will require a subsidy of $100 or more per acre for either the TB9 or 50BA prescription. In fact, all of the plots treated with the TB9 prescription required at least a $100 per acre subsidy. The situation improved over time under the 50BA prescription (fig. 10). Except for the first entry, no merchantable volume was removed under the TB9 prescription, so activities under that prescription always had negative net returns. These estimates include the costs of treating material that is not economi-cal to use for products. They do not include the costs of prescribed fires, which occur on a 30-year cycle on high-hazard stands whether or not plots are thinned. They also occur on a 30-year cycle on low-hazard stands, but do not start until the beginning of the second cycle. The financial results are summarized for all cases in appendix 9 (tables 48 through 51).
The total area and number of FIA inventory plots included in this analysis for the ponderosa pine forest type are shown in appendix 2 (table 5). Ponderosa plots were segregated by high/moderate hazard (<50 mph windspeed) and low hazard (50+ mph windspeed) for the analysis presented here. For brevity, these two groups are referred to as high fire hazard and low fire hazard in all of the tables for this species.
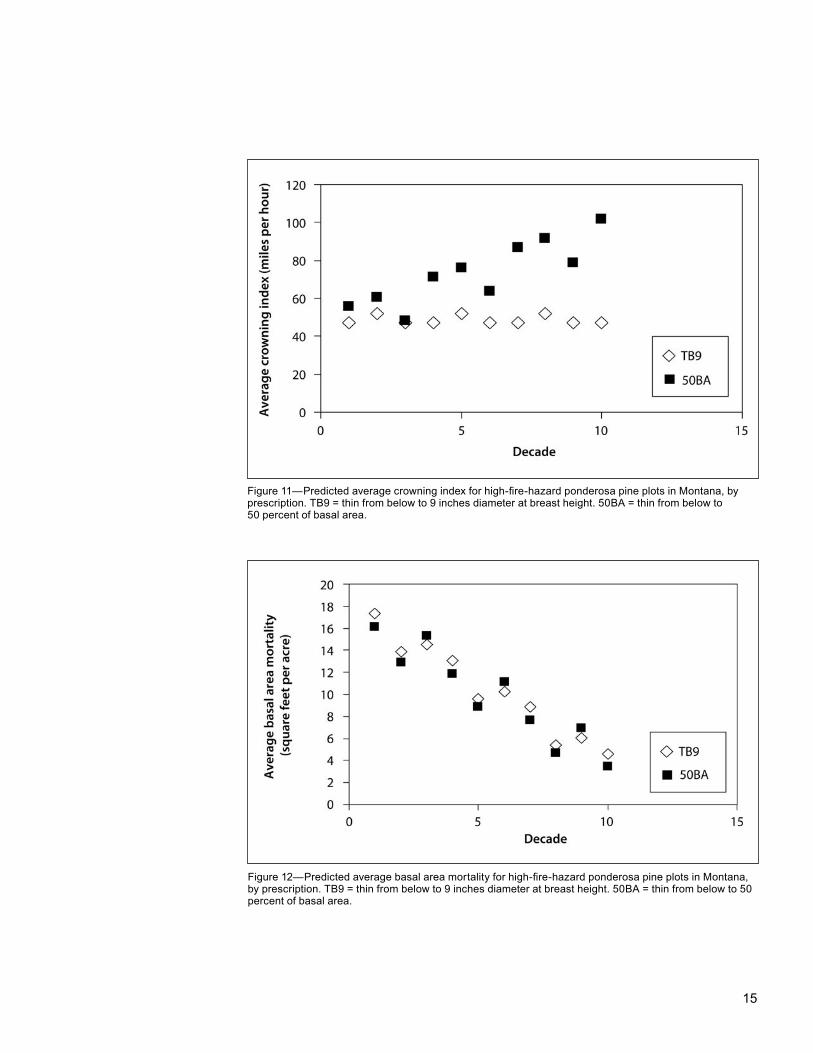
Treatment effect on fire hazard—Regression analysis indicated both a time trend (positive coefficient on decade) and a cyclical treatment effect (positive coefficients for the decade of treatment and the decade following treatment) on average crowning index for the 50BA prescription in the ponderosa pine high-hazard plots. This means that each subsequent entry brought the crowning index higher (a lower hazard) than the previous entry. The results from the ponderosa pine high-hazard plots using the TB9 prescription showed no trend for improvement over time, and there was only a small effect in the decade following treatment. The effect is small enough that the
Ponderosa Pine
14
hazard index hovers around 50 mph throughout the 10-decade period. These com-parisons are clearly seen in a plot of the predicted average value for fire hazard index in figure 11.
Figure 12 shows an analogous comparison for the predicted average basal area mor-tality from prescribed burns. In spite of the fact that the effects of the two prescriptions on crowning index are quite different, their effects on potential basal area mortality are strikingly similar. This means that even though the likelihood that trees will carry a crown fire is different for each prescription, the ability of the trees to withstand pre-scribed fire is similar, with expected basal area mortality dropping to around 5 percent in both cases over the projection period. This result suggests that by the 10th decade of the simulation, both prescriptions create stand conditions where trees are relatively resilient to low-intensity fires.
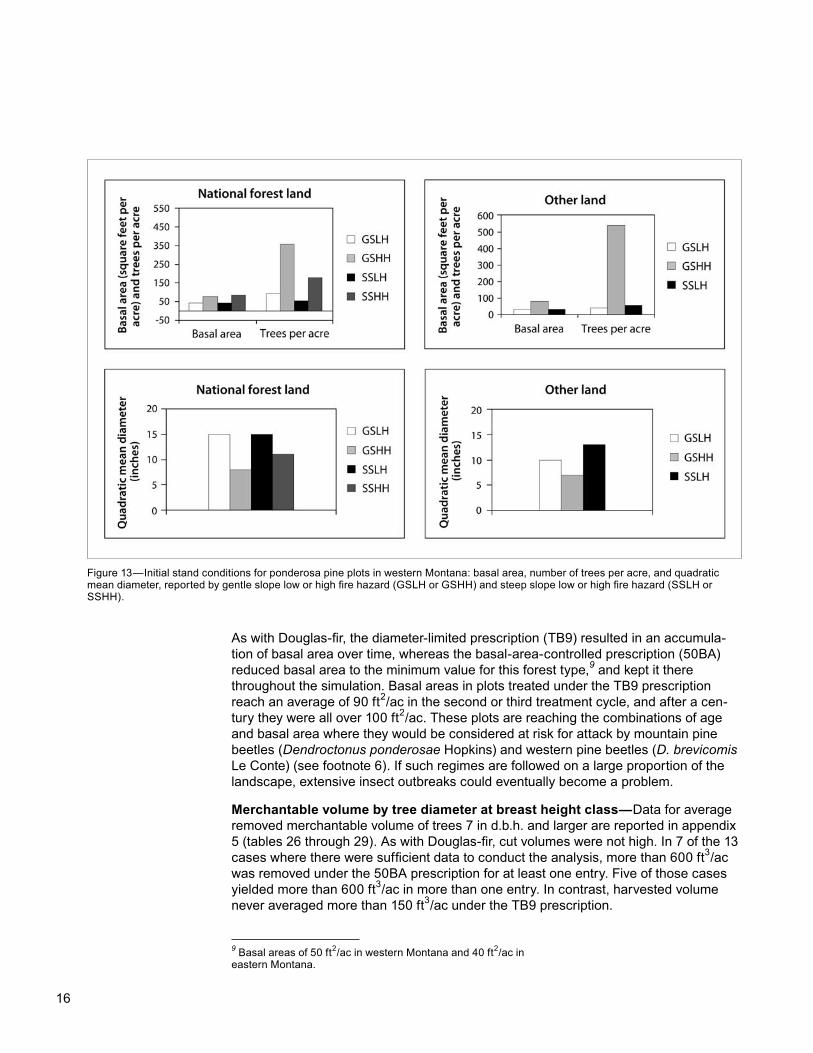
Initial stand summary—The initial stand conditions for high- and low-fire-hazard cases differ systematically when paired by geographic region, owner, and slope. The low-hazard cases consistently have lower basal area, fewer trees per acre, and larger quadratic mean diameters (app. 3, tables 10 through 13). Typical comparisons are shown for both national forest land and other forest land in western Montana (fig. 13).
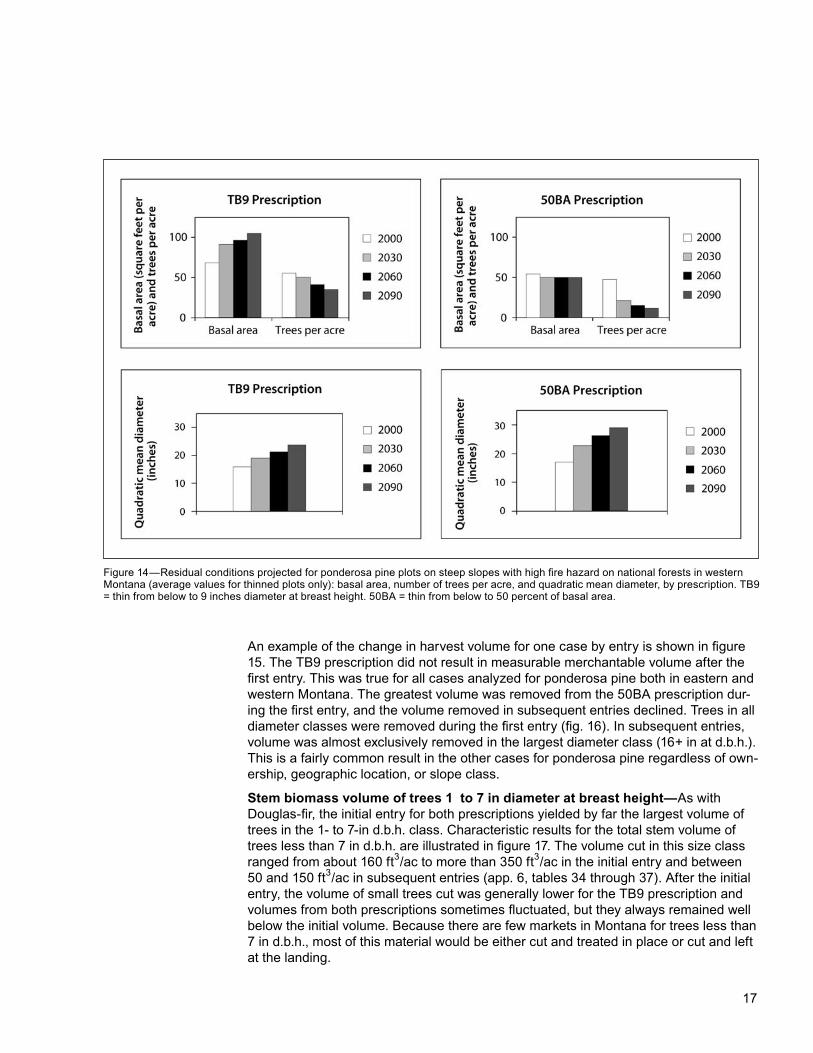
Residual stand summary—The results presented in figure 14 illustrate how stand conditions changed over time for ponderosa pine plots. Although the results shown in the figure are for Forest Service land in western Montana, they are similar to those for other ownerships and geographic regions in Montana (app. 4, tables 18 through 21). Our analysis suggests that when repeatedly applied over the course of a century, the 50BA prescription will result in less-crowded stand conditions with fewer but larger trees than the TB9 prescription.
Figure 10—Net value per acre projected for the 50BA prescription from Douglas-fir plots on national forests in western Montana on steep slopes with high fire hazard.
15
Figure 11—Predicted average crowning index for high-fire-hazard ponderosa pine plots in Montana, by prescription. TB9 = thin from below to 9 inches diameter at breast height. 50BA = thin from below to 50 percent of basal area.
Figure 12—Predicted average basal area mortality for high-fire-hazard ponderosa pine plots in Montana, by prescription. TB9 = thin from below to 9 inches diameter at breast height. 50BA = thin from below to 50 percent of basal area.
16
As with Douglas-fir, the diameter-limited prescription (TB9) resulted in an accumula-tion of basal area over time, whereas the basal-area-controlled prescription (50BA) reduced basal area to the minimum value for this forest type,9 and kept it there throughout the simulation. Basal areas in plots treated under the TB9 prescription reach an average of 90 ft2/ac in the second or third treatment cycle, and after a cen-tury they were all over 100 ft2/ac. These plots are reaching the combinations of age and basal area where they would be considered at risk for attack by mountain pine beetles (Dendroctonus ponderosae Hopkins) and western pine beetles (D. brevicomis Le Conte) (see footnote 6). If such regimes are followed on a large proportion of the landscape, extensive insect outbreaks could eventually become a problem.
Merchantable volume by tree diameter at breast height class—Data for average removed merchantable volume of trees 7 in d.b.h. and larger are reported in appendix 5 (tables 26 through 29). As with Douglas-fir, cut volumes were not high. In 7 of the 13 cases where there were sufficient data to conduct the analysis, more than 600 ft3/ac was removed under the 50BA prescription for at least one entry. Five of those cases yielded more than 600 ft3/ac in more than one entry. In contrast, harvested volume never averaged more than 150 ft3/ac under the TB9 prescription.
Figure 13—Initial stand conditions for ponderosa pine plots in western Montana: basal area, number of trees per acre, and quadratic mean diameter, reported by gentle slope low or high fire hazard (GSLH or GSHH) and steep slope low or high fire hazard (SSLH or SSHH).
9 Basal areas of 50 ft2/ac in western Montana and 40 ft2/ac in eastern Montana.
17
Figure 14—Residual conditions projected for ponderosa pine plots on steep slopes with high fire hazard on national forests in western Montana (average values for thinned plots only): basal area, number of trees per acre, and quadratic mean diameter, by prescription. TB9 = thin from below to 9 inches diameter at breast height. 50BA = thin from below to 50 percent of basal area.
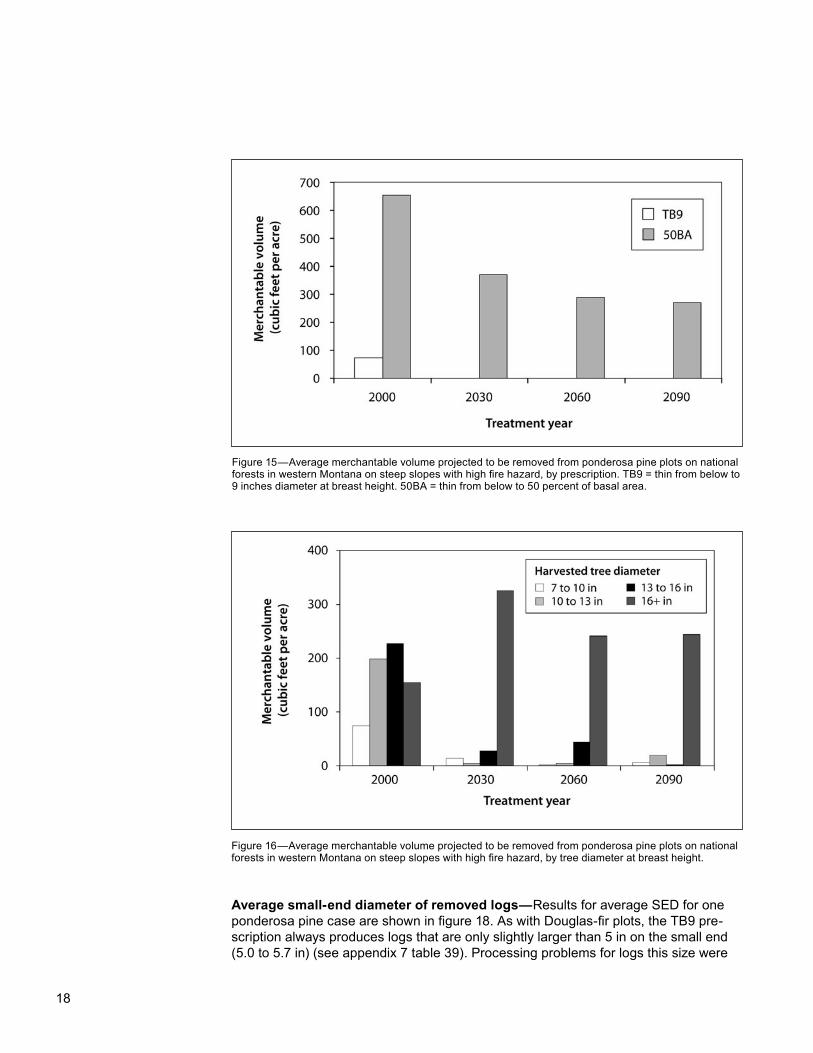
An example of the change in harvest volume for one case by entry is shown in figure 15. The TB9 prescription did not result in measurable merchantable volume after the first entry. This was true for all cases analyzed for ponderosa pine both in eastern and western Montana. The greatest volume was removed from the 50BA prescription dur-ing the first entry, and the volume removed in subsequent entries declined. Trees in all diameter classes were removed during the first entry (fig. 16). In subsequent entries, volume was almost exclusively removed in the largest diameter class (16+ in at d.b.h.). This is a fairly common result in the other cases for ponderosa pine regardless of own-ership, geographic location, or slope class.
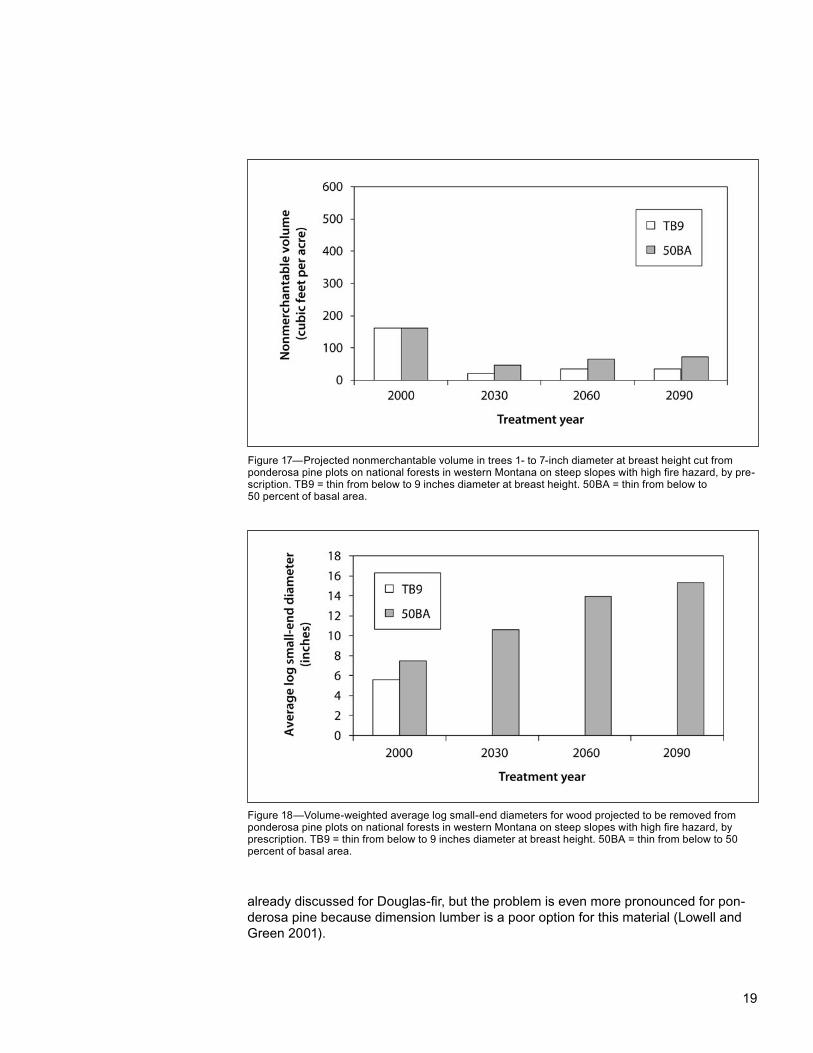
Stem biomass volume of trees 1 to 7 in diameter at breast height—As with Douglas-fir, the initial entry for both prescriptions yielded by far the largest volume of trees in the 1- to 7-in d.b.h. class. Characteristic results for the total stem volume of trees less than 7 in d.b.h. are illustrated in figure 17. The volume cut in this size class ranged from about 160 ft3/ac to more than 350 ft3/ac in the initial entry and between 50 and 150 ft3/ac in subsequent entries (app. 6, tables 34 through 37). After the initial entry, the volume of small trees cut was generally lower for the TB9 prescription and volumes from both prescriptions sometimes fluctuated, but they always remained well below the initial volume. Because there are few markets in Montana for trees less than 7 in d.b.h., most of this material would be either cut and treated in place or cut and left at the landing.
18
Figure 16—Average merchantable volume projected to be removed from ponderosa pine plots on national forests in western Montana on steep slopes with high fire hazard, by tree diameter at breast height.
Average small-end diameter of removed logs—Results for average SED for one ponderosa pine case are shown in figure 18. As with Douglas-fir plots, the TB9 pre-scription always produces logs that are only slightly larger than 5 in on the small end (5.0 to 5.7 in) (see appendix 7 table 39). Processing problems for logs this size were
Figure 15—Average merchantable volume projected to be removed from ponderosa pine plots on national forests in western Montana on steep slopes with high fire hazard, by prescription. TB9 = thin from below to 9 inches diameter at breast height. 50BA = thin from below to 50 percent of basal area.
19
Figure 17—Projected nonmerchantable volume in trees 1- to 7-inch diameter at breast height cut from ponderosa pine plots on national forests in western Montana on steep slopes with high fire hazard, by pre-scription. TB9 = thin from below to 9 inches diameter at breast height. 50BA = thin from below to 50 percent of basal area.
Figure 18—Volume-weighted average log small-end diameters for wood projected to be removed from ponderosa pine plots on national forests in western Montana on steep slopes with high fire hazard, by prescription. TB9 = thin from below to 9 inches diameter at breast height. 50BA = thin from below to 50 percent of basal area.
already discussed for Douglas-fir, but the problem is even more pronounced for pon-derosa pine because dimension lumber is a poor option for this material (Lowell and Green 2001).
20
Log SED increases over time for the 50BA prescription, often averaging greater than 15 in. If logs in these diameter classes were to become available, they would almost certainly find markets. They are small enough to be accommodated by newer high-technology mills, yet large enough, and in this situation old enough, that reasonable yields of higher valued appearance grades (particularly Factory grades) of lumber might be expected from them (Lowell and Green 2001, Plank 1982, Willits 1994).
As with Douglas-fir, there was a tradeoff between log size and average merchant-able volume removed. In the example shown in figures 15 and 17, volume removed declined by almost one-half between the first and the last entry. This means that over time the timber volume removed to maintain low fire hazard might decrease but the value of wood products might increase.
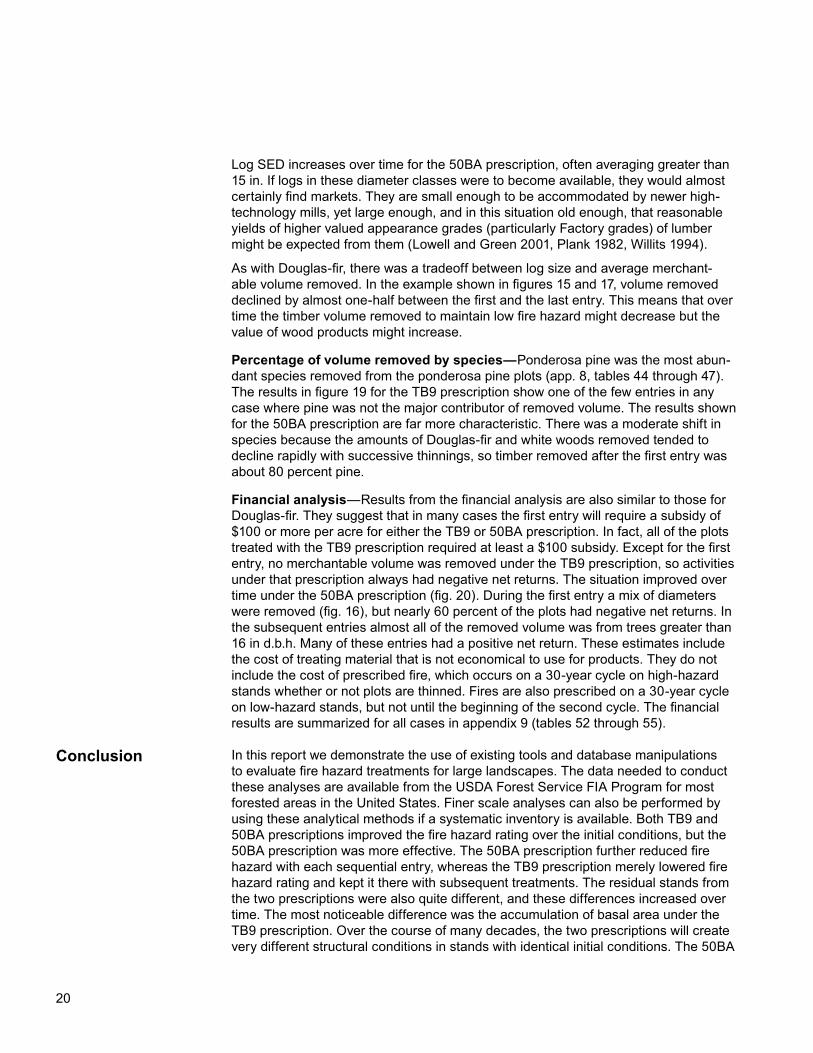
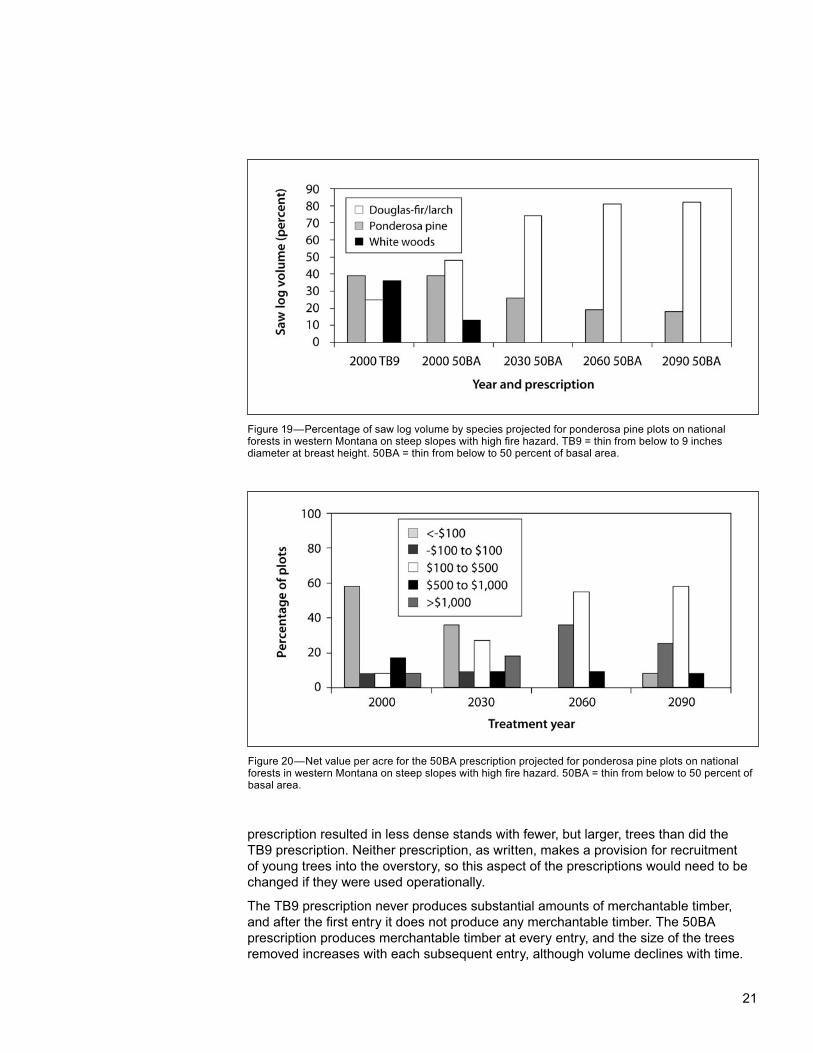
Percentage of volume removed by species—Ponderosa pine was the most abun-dant species removed from the ponderosa pine plots (app. 8, tables 44 through 47). The results in figure 19 for the TB9 prescription show one of the few entries in any case where pine was not the major contributor of removed volume. The results shown for the 50BA prescription are far more characteristic. There was a moderate shift in species because the amounts of Douglas-fir and white woods removed tended to decline rapidly with successive thinnings, so timber removed after the first entry was about 80 percent pine.
Financial analysis—Results from the financial analysis are also similar to those for Douglas-fir. They suggest that in many cases the first entry will require a subsidy of $100 or more per acre for either the TB9 or 50BA prescription. In fact, all of the plots treated with the TB9 prescription required at least a $100 subsidy. Except for the first entry, no merchantable volume was removed under the TB9 prescription, so activities under that prescription always had negative net returns. The situation improved over time under the 50BA prescription (fig. 20). During the first entry a mix of diameters were removed (fig. 16), but nearly 60 percent of the plots had negative net returns. In the subsequent entries almost all of the removed volume was from trees greater than 16 in d.b.h. Many of these entries had a positive net return. These estimates include the cost of treating material that is not economical to use for products. They do not include the cost of prescribed fire, which occurs on a 30-year cycle on high-hazard stands whether or not plots are thinned. Fires are also prescribed on a 30-year cycle on low-hazard stands, but not until the beginning of the second cycle. The financial results are summarized for all cases in appendix 9 (tables 52 through 55).
In this report we demonstrate the use of existing tools and database manipulations to evaluate fire hazard treatments for large landscapes. The data needed to conduct these analyses are available from the USDA Forest Service FIA Program for most forested areas in the United States. Finer scale analyses can also be performed by using these analytical methods if a systematic inventory is available. Both TB9 and 50BA prescriptions improved the fire hazard rating over the initial conditions, but the 50BA prescription was more effective. The 50BA prescription further reduced fire hazard with each sequential entry, whereas the TB9 prescription merely lowered fire hazard rating and kept it there with subsequent treatments. The residual stands from the two prescriptions were also quite different, and these differences increased over time. The most noticeable difference was the accumulation of basal area under the TB9 prescription. Over the course of many decades, the two prescriptions will create very different structural conditions in stands with identical initial conditions. The 50BA
Conclusion
21
Figure 19—Percentage of saw log volume by species projected for ponderosa pine plots on national forests in western Montana on steep slopes with high fire hazard. TB9 = thin from below to 9 inches diameter at breast height. 50BA = thin from below to 50 percent of basal area.
Figure 20—Net value per acre for the 50BA prescription projected for ponderosa pine plots on national forests in western Montana on steep slopes with high fire hazard. 50BA = thin from below to 50 percent of basal area.
prescription resulted in less dense stands with fewer, but larger, trees than did the TB9 prescription. Neither prescription, as written, makes a provision for recruitment of young trees into the overstory, so this aspect of the prescriptions would need to be changed if they were used operationally.
The TB9 prescription never produces substantial amounts of merchantable timber, and after the first entry it does not produce any merchantable timber. The 50BA prescription produces merchantable timber at every entry, and the size of the trees removed increases with each subsequent entry, although volume declines with time.
22
Both prescriptions yield moderate amounts (usually 100 to 400 ft3/ac) of small trees (<7 in d.b.h.) in the first entry, but in later entries they produce much less of this small timber. This is primarily a result of prescribed burning following each entry. Without the prescribed burns, small trees would probably be more abundant. The results suggest that if an interim solution to the excess fuel problem were to establish some type of biomass utilization industry and a wide-scale prescribed burning schedule were imple-mented in stands after the initial fuel reduction treatment, it would be important to plan for a declining volume of small-diameter timber over time regardless of which prescrip-tion was used.
Only small sawlogs are produced from the TB9 prescription, and none are produced after the first entry. Finding a market for these logs is likely to be difficult. The 50BA prescription produces larger logs, and their size increases over time. The fact that there was no species shift over time suggests that size presents a more important planning issue for processors than species mix.
Financial analyses suggest that at least initially, the two prescriptions examined here will require subsidies to implement in a large proportion of Montana even without considering the cost of the prescribed fire treatments. The results also suggest that by using prescriptions like the 50BA prescription, the situation could improve with time. Even though there are situations where this prescription could be applied with a posi-tive net return, there are many land use restrictions or other constraints that were not accounted for in our analysis. It seems likely that any large-scale program will treat a mix of stands with both positive and negative net returns and that it will not be possible or even desirable to simply search the landscape for those stands where a positive return is likely. If prescriptions are limited to ones similar to those evaluated here, the number of instances where negative returns were projected suggests that any large-scale fuels reduction program will likely require substantial subsidies.
When you know Multiply by: To find:
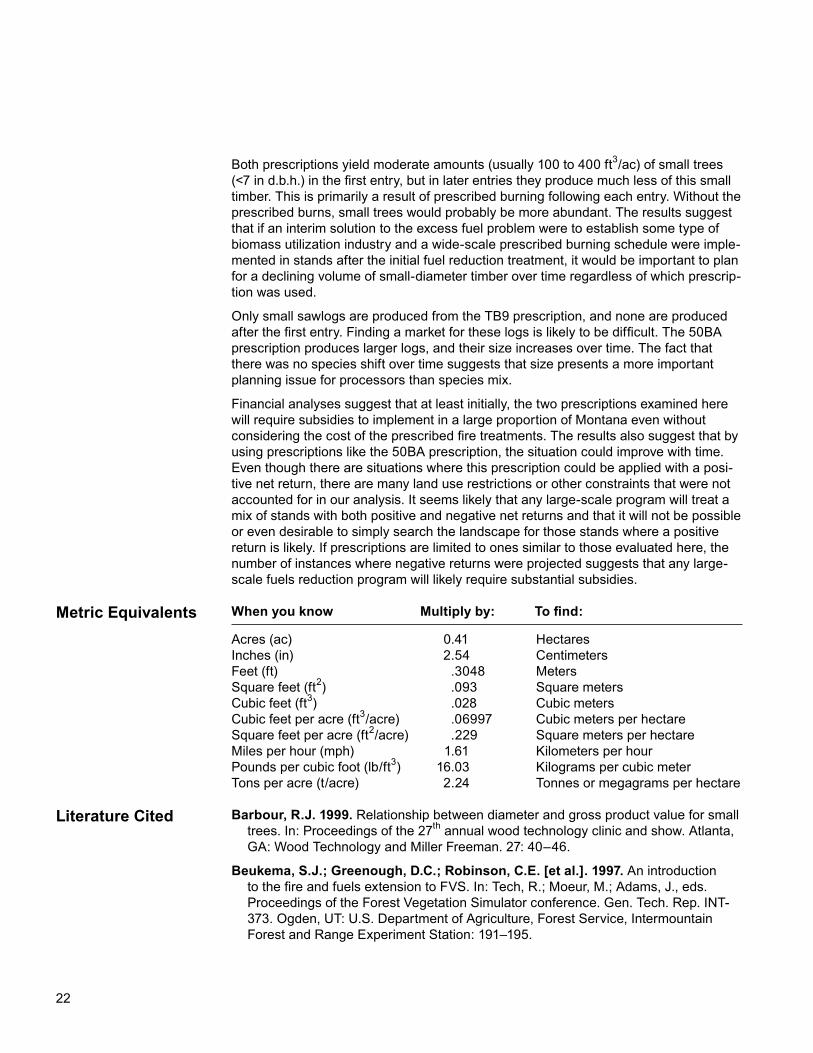
Acres (ac) 0.41 Hectares Inches (in) 2.54 Centimeters Feet (ft) .3048 Meters Square feet (ft2) .093 Square meters Cubic feet (ft3) .028 Cubic meters Cubic feet per acre (ft3/acre) .06997 Cubic meters per hectare Square feet per acre (ft2/acre) .229 Square meters per hectare Miles per hour (mph) 1.61 Kilometers per hour Pounds per cubic foot (lb/ft3) 16.03 Kilograms per cubic meter Tons per acre (t/acre) 2.24 Tonnes or megagrams per hectare
Barbour, R.J. 1999. Relationship between diameter and gross product value for small trees. In: Proceedings of the 27th annual wood technology clinic and show. Atlanta, GA: Wood Technology and Miller Freeman. 27: 40–46.
Beukema, S.J.; Greenough, D.C.; Robinson, C.E. [et al.]. 1997. An introduction to the fire and fuels extension to FVS. In: Tech, R.; Moeur, M.; Adams, J., eds. Proceedings of the Forest Vegetation Simulator conference. Gen. Tech. Rep. INT-373. Ogden, UT: U.S. Department of Agriculture, Forest Service, Intermountain Forest and Range Experiment Station: 191–195.
Metric Equivalents
Literature Cited
23
Christensen, G.; Barbour, R.J. 1999. Veneer recovery from small diameter logs. In: Proceedings, 1999 Society of American Foresters national meeting. Bethesda, MD: Society of American Foresters: 299–304.
Christensen, G.A.; Fight, R.D.; Barbour, R.J. 2002. Simulating fire hazard reduction, wood flows, and economics of fuel treatments with FVS, FEEMA, and FIA data. In: Crookston, N.L.; Havis, R.N., comps. Proceedings of the second Forest Vegetation Simulator conference. Proc. RMRS-P-25. Fort Collins, CO: U.S. Department of Agriculture, Forest Service, Rocky Mountain Research Station: 91–96.
Crookston, N.L. 1990. User’s guide to the event monitor: part of prognosis model version 6. Gen. Tech. Rep. INT-275. Ogden, UT: U.S. Department of Agriculture, Forest Service, Intermountain Forest and Range Experiment Station. 21 p.
Fight, R.D.; Barbour, R.J.; Christensen, G.A. [et al.]. 2004. Thinning and prescribed fire and projected trends in wood product potential, financial return, and fire hazard in New Mexico. Gen. Tech. Rep. PNW-GTR-605. Portland, OR: U.S. Department of Agriculture, Forest Service, Pacific Northwest Research Station. 46 p.
Fight, R.D.; Chmelik, J.T. 1998. Analysts guide to FEEMA for financial analysis of ecosystem management activities. Gen. Tech. Rep. FPL-GTR-111. Madison, WI: U.S. Department of Agriculture, Forest Service, Forest Products Laboratory. 5 p.
Hartsough, B.R.; Zhang, X.; Fight, R.D. 2001. Harvesting cost model for small trees in natural stands in the interior Northwest. Forest Products Journal. 51(4): 54–61.
LeVan-Green, S.L.; Livingston, J. 2001. Exploring the uses for small-diameter trees. Forest Products Journal. 51(9): 10–21.
Lowell, E.C.; Green, D.W. 2001. Lumber recovery from small-diameter ponderosa pine from Flagstaff, Arizona. In: Vance, R.K.; Edminster, C.B.; Covington, W.W.; Blake, J.A., comps. Ponderosa pine ecosystem restoration and conservation: steps toward stewardship. Proceedings of a conference. Proc. RMRS-P-22. Ogden, UT: U.S. Department of Agriculture, Forest Service, Rocky Mountain Research Station: 161–165.
Plank, M.E. 1982. Lumber recovery from ponderosa pine in western Montana. Res. Pap. PNW-297. Portland, OR: U.S. Department of Agriculture, Forest Service, Pacific Northwest Forest and Range Experiment Station. 24 p.
Scott, J.H.; Reinhardt, E.D. 2001. Assessing crown fire potential by linking models of surface and crown fire behavior. Res. Pap. RMRS-RP-29. Ogden, UT: U.S. Department of Agriculture, Forest Service, Rocky Mountain Research Station. 59 p.
Stage, A.R. 1973. Prognosis model for stand development. Res. Pap. INT-137. Ogden, UT: U.S. Department of Agriculture, Forest Service, Intermountain Forest and Range Experiment Station. 32 p.
Willits, S. 1994. “Black bark” ponderosa pine: tree grade definition and value comparison with old-growth trees. Western Journal of Applied Forestry. 9(1): 8–13.
Wolfe, R.W.; Hernandez, R. 1999. Trussed assemblies from small-diameter round timbers. In: Walford, G.B.; Guant, D.J., eds. Proceedings of Pacific timber engineering conference. Rotorua, New Zealand: Forest Research Bulletin. 212: 251–256. Vol. 1.
24
d.b.h.—Diameter at breast heightFEEMA—Financial evaluation of ecosystem management activitiesFFE—Fire and fuels extensionFIA—Forest inventory and analysis FVS—Forest vegetation simulator QMD—Quadratic mean breast-height diameter SED—Small-end diameter of logsTCT—Technical contact team: advisory groups representing state, private, and federal forest managers. Representatives were staff or administrators with state or regionwide responsibility.TB9—Thin from below to 9 inches d.b.h. with a minimum residual basal area50BA—Thin from below up to 50 percent of standing basal area with a minimum residual basal area
Acronym Glossary
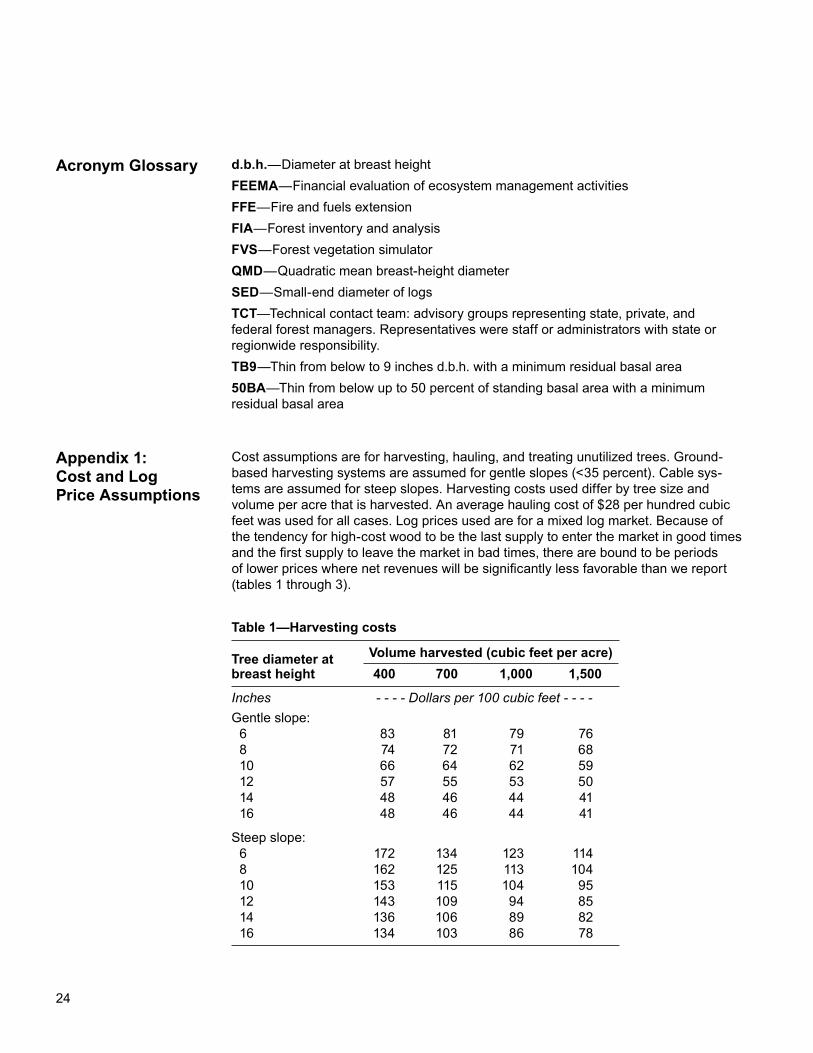
Cost assumptions are for harvesting, hauling, and treating unutilized trees. Ground-based harvesting systems are assumed for gentle slopes (<35 percent). Cable sys-tems are assumed for steep slopes. Harvesting costs used differ by tree size and volume per acre that is harvested. An average hauling cost of $28 per hundred cubic feet was used for all cases. Log prices used are for a mixed log market. Because of the tendency for high-cost wood to be the last supply to enter the market in good times and the first supply to leave the market in bad times, there are bound to be periods of lower prices where net revenues will be significantly less favorable than we report (tables 1 through 3).
Appendix 1: Cost and Log Price Assumptions
Table 1—Harvesting costs Volume harvested (cubic feet per acre)Tree diameter at
breast height 400 700 1,000 1,500
Inches - - - - Dollars per 100 cubic feet - - - -Gentle slope: 6 83 81 79 76 8 74 72 71 68 10 66 64 62 59 12 57 55 53 50 14 48 46 44 41 16 48 46 44 41
Steep slope: 6 172 134 123 114 8 162 125 113 104 10 153 115 104 95 12 143 109 94 85 14 136 106 89 82 16 134 103 86 78
25
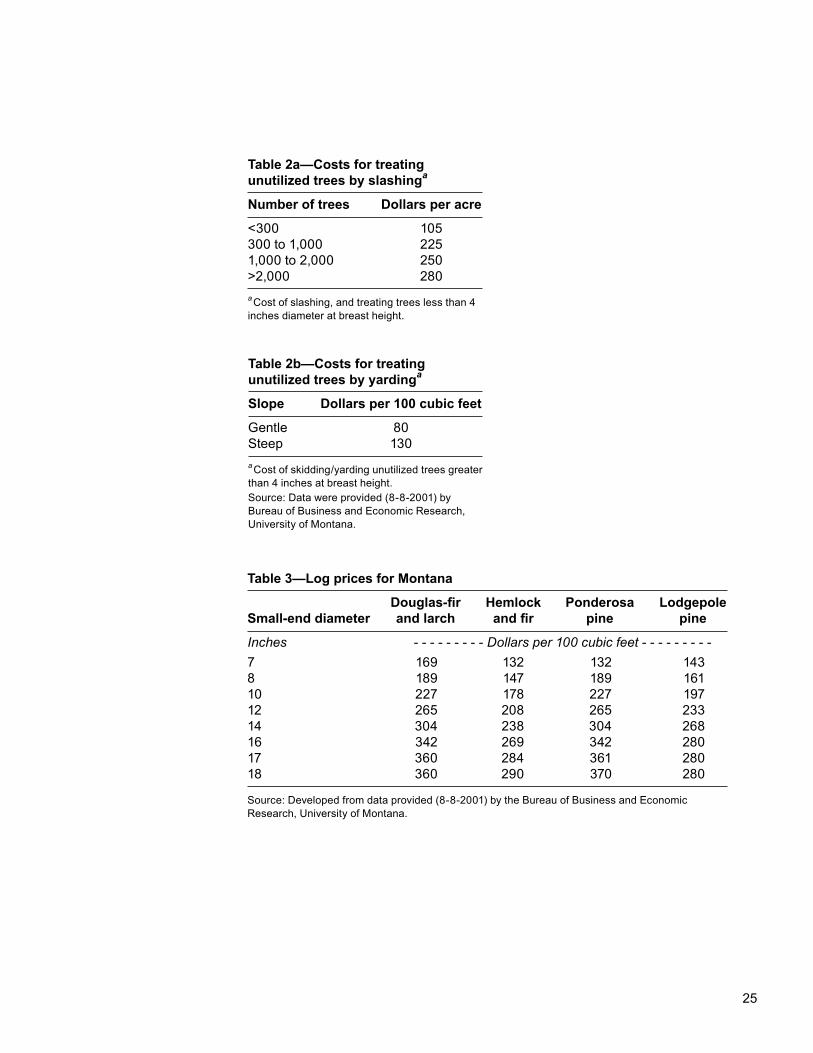
Table 2a—Costs for treating unutilized trees by slashinga
Number of trees Dollars per acre
<300 105300 to 1,000 2251,000 to 2,000 250>2,000 280a Cost of slashing, and treating trees less than 4 inches diameter at breast height.
Table 3—Log prices for Montana
Douglas-fir Hemlock Ponderosa Lodgepole Small-end diameter and larch and fir pine pine
Inches - - - - - - - - - Dollars per 100 cubic feet - - - - - - - - -7 169 132 132 1438 189 147 189 16110 227 178 227 19712 265 208 265 23314 304 238 304 26816 342 269 342 28017 360 284 361 28018 360 290 370 280
Source: Developed from data provided (8-8-2001) by the Bureau of Business and Economic Research, University of Montana.
Table 2b—Costs for treating unutilized trees by yardinga
Slope Dollars per 100 cubic feet
Gentle 80Steep 130a Cost of skidding/yarding unutilized trees greater than 4 inches at breast height.Source: Data were provided (8-8-2001) by Bureau of Business and Economic Research, University of Montana.
26
Appendix 2: Acreage and Number of Inventory Plots
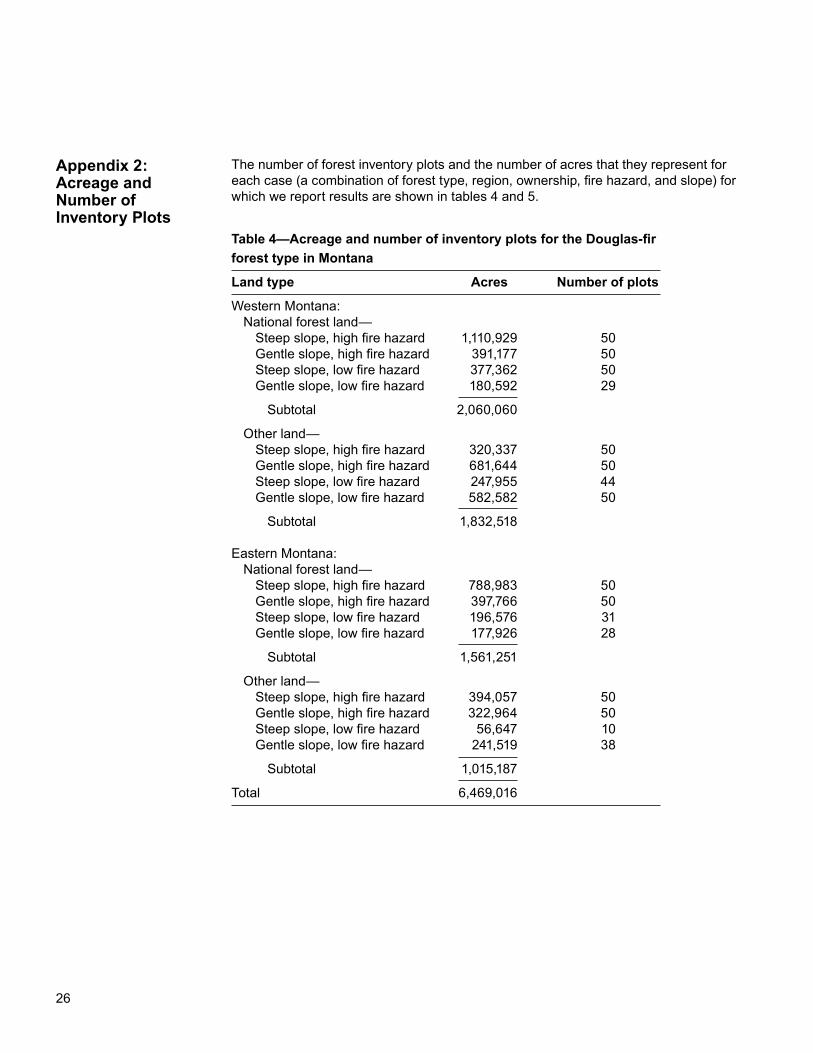
The number of forest inventory plots and the number of acres that they represent for each case (a combination of forest type, region, ownership, fire hazard, and slope) for which we report results are shown in tables 4 and 5.
Table 4—Acreage and number of inventory plots for the Douglas-fir forest type in Montana
Land type Acres Number of plots
Western Montana: National forest land— Steep slope, high fire hazard 1,110,929 50 Gentle slope, high fire hazard 391,177 50 Steep slope, low fire hazard 377,362 50 Gentle slope, low fire hazard 180,592 29
Subtotal 2,060,060
Other land— Steep slope, high fire hazard 320,337 50 Gentle slope, high fire hazard 681,644 50 Steep slope, low fire hazard 247,955 44 Gentle slope, low fire hazard 582,582 50
Subtotal 1,832,518
Eastern Montana: National forest land— Steep slope, high fire hazard 788,983 50 Gentle slope, high fire hazard 397,766 50 Steep slope, low fire hazard 196,576 31 Gentle slope, low fire hazard 177,926 28
Subtotal 1,561,251
Other land— Steep slope, high fire hazard 394,057 50 Gentle slope, high fire hazard 322,964 50 Steep slope, low fire hazard 56,647 10 Gentle slope, low fire hazard 241,519 38
Subtotal 1,015,187
Total 6,469,016
27
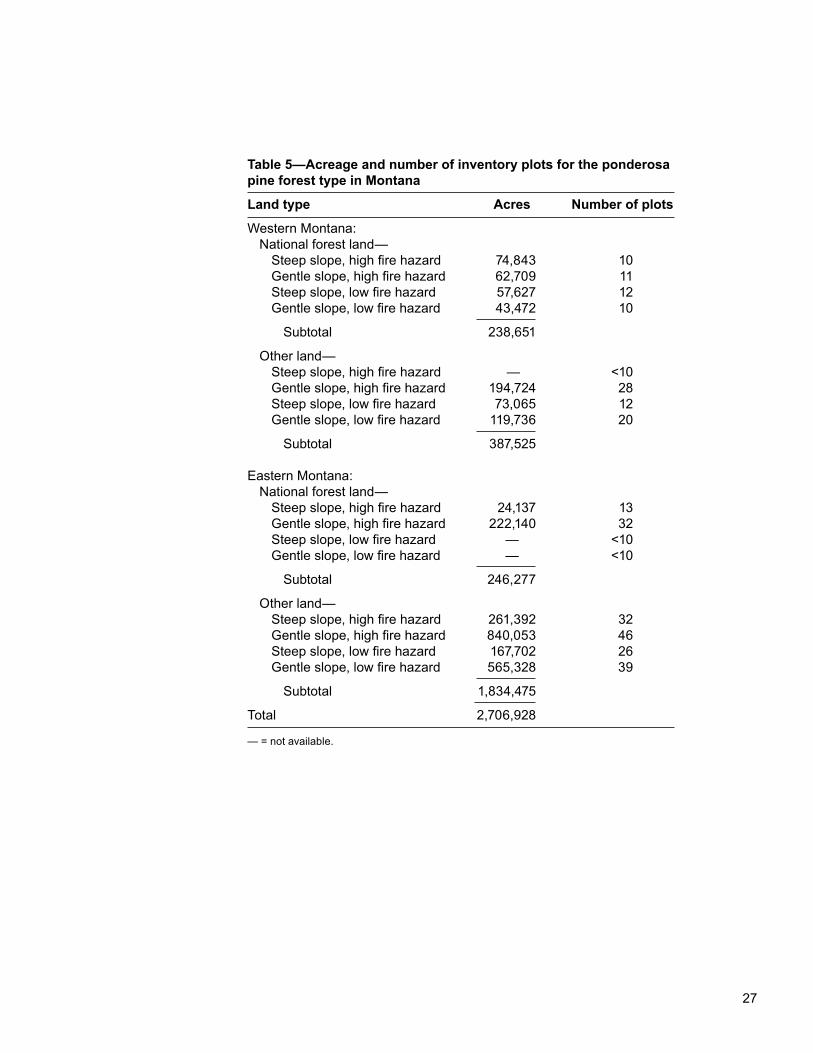
Table 5—Acreage and number of inventory plots for the ponderosa pine forest type in Montana
Land type Acres Number of plots
Western Montana: National forest land— Steep slope, high fire hazard 74,843 10 Gentle slope, high fire hazard 62,709 11 Steep slope, low fire hazard 57,627 12 Gentle slope, low fire hazard 43,472 10
Subtotal 238,651
Other land— Steep slope, high fire hazard — <10 Gentle slope, high fire hazard 194,724 28 Steep slope, low fire hazard 73,065 12 Gentle slope, low fire hazard 119,736 20
Subtotal 387,525
Eastern Montana: National forest land— Steep slope, high fire hazard 24,137 13 Gentle slope, high fire hazard 222,140 32 Steep slope, low fire hazard — <10 Gentle slope, low fire hazard — <10
Subtotal 246,277
Other land— Steep slope, high fire hazard 261,392 32 Gentle slope, high fire hazard 840,053 46 Steep slope, low fire hazard 167,702 26 Gentle slope, low fire hazard 565,328 39
Subtotal 1,834,475
Total 2,706,928
— = not available.
28
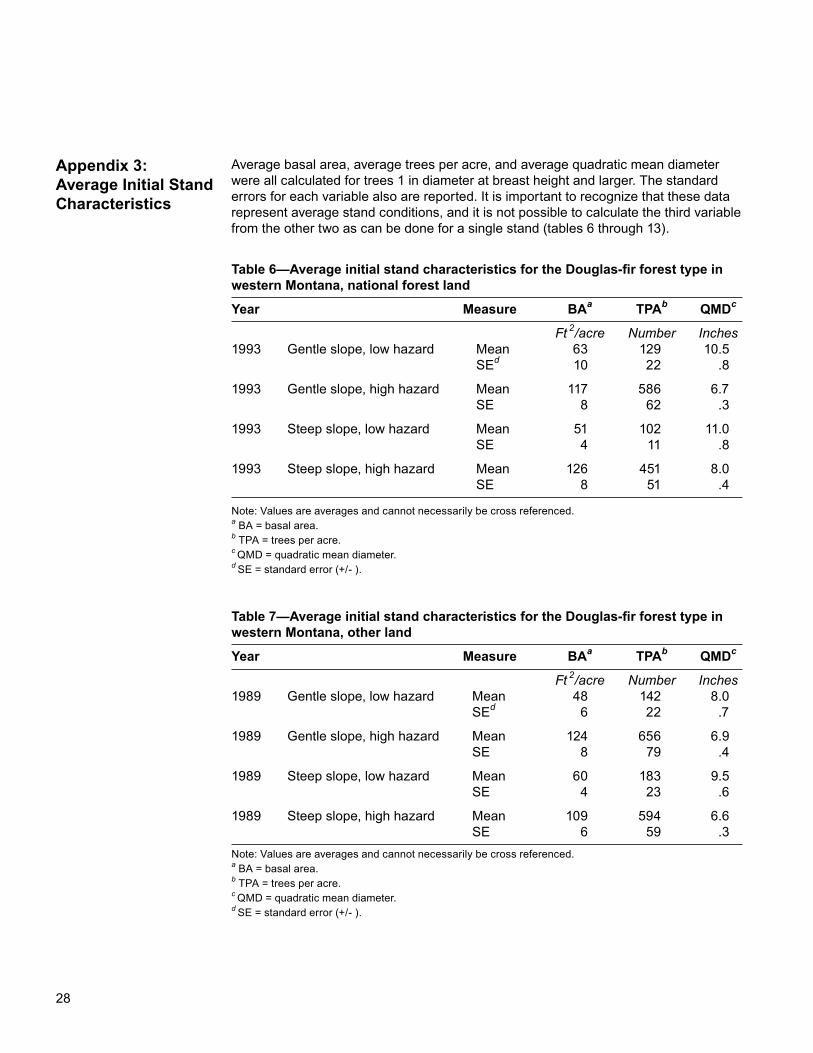
Table 6—Average initial stand characteristics for the Douglas-fir forest type in western Montana, national forest land
Year Measure BAa TPAb QMDc
Ft 2/acre Number Inches1993 Gentle slope, low hazard Mean 63 129 10.5 SEd 10 22 .8
1993 Gentle slope, high hazard Mean 117 586 6.7 SE 8 62 .3
1993 Steep slope, low hazard Mean 51 102 11.0 SE 4 11 .8
1993 Steep slope, high hazard Mean 126 451 8.0 SE 8 51 .4
Note: Values are averages and cannot necessarily be cross referenced.a BA = basal area.b TPA = trees per acre.c QMD = quadratic mean diameter.d SE = standard error (+/- ).
Average basal area, average trees per acre, and average quadratic mean diameter were all calculated for trees 1 in diameter at breast height and larger. The standard errors for each variable also are reported. It is important to recognize that these data represent average stand conditions, and it is not possible to calculate the third variable from the other two as can be done for a single stand (tables 6 through 13).
Appendix 3: Average Initial Stand Characteristics
Table 7—Average initial stand characteristics for the Douglas-fir forest type in western Montana, other land
Year Measure BAa TPAb QMDc
Ft 2/acre Number Inches1989 Gentle slope, low hazard Mean 48 142 8.0 SEd 6 22 .7
1989 Gentle slope, high hazard Mean 124 656 6.9 SE 8 79 .4
1989 Steep slope, low hazard Mean 60 183 9.5 SE 4 23 .6
1989 Steep slope, high hazard Mean 109 594 6.6 SE 6 59 .3Note: Values are averages and cannot necessarily be cross referenced.a BA = basal area.b TPA = trees per acre.c QMD = quadratic mean diameter.d SE = standard error (+/- ).
29
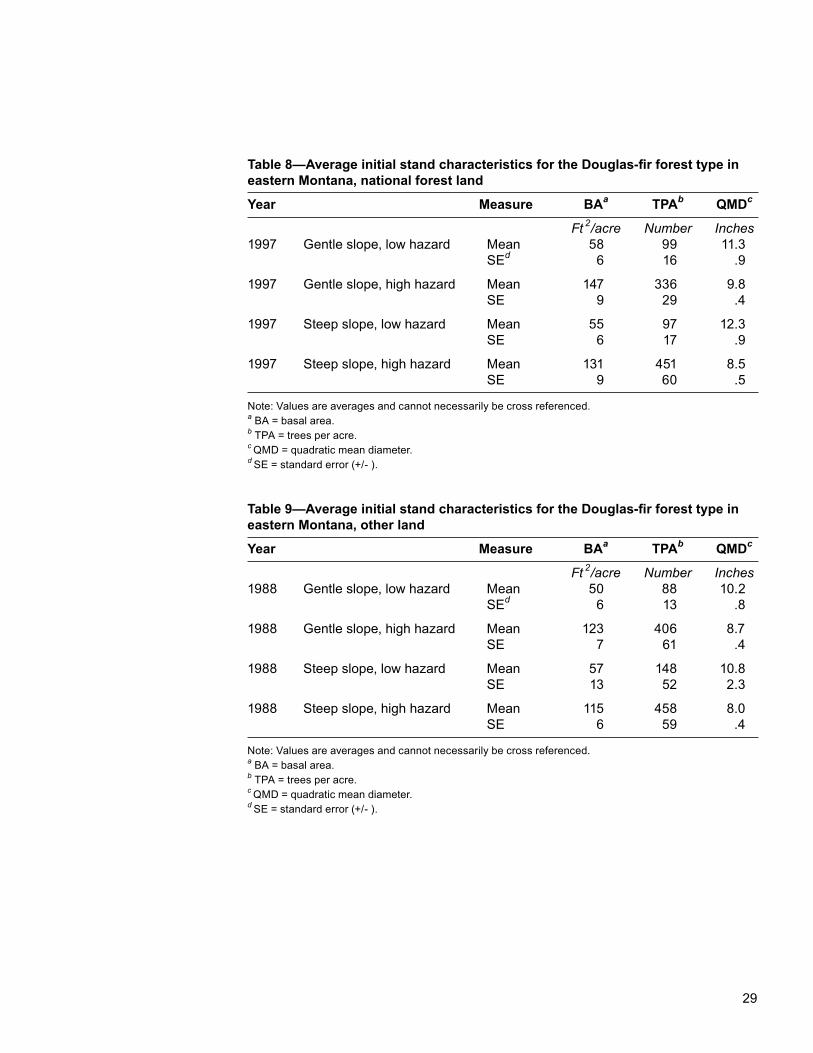
Table 8—Average initial stand characteristics for the Douglas-fir forest type in eastern Montana, national forest land
Year Measure BAa TPAb QMDc
Ft 2/acre Number Inches1997 Gentle slope, low hazard Mean 58 99 11.3 SEd 6 16 .9
1997 Gentle slope, high hazard Mean 147 336 9.8 SE 9 29 .4
1997 Steep slope, low hazard Mean 55 97 12.3 SE 6 17 .9
1997 Steep slope, high hazard Mean 131 451 8.5 SE 9 60 .5
Note: Values are averages and cannot necessarily be cross referenced.a BA = basal area.b TPA = trees per acre.c QMD = quadratic mean diameter.d SE = standard error (+/- ).
Table 9—Average initial stand characteristics for the Douglas-fir forest type in eastern Montana, other land
Year Measure BAa TPAb QMDc
Ft 2/acre Number Inches1988 Gentle slope, low hazard Mean 50 88 10.2 SEd 6 13 .8
1988 Gentle slope, high hazard Mean 123 406 8.7 SE 7 61 .4
1988 Steep slope, low hazard Mean 57 148 10.8 SE 13 52 2.3
1988 Steep slope, high hazard Mean 115 458 8.0 SE 6 59 .4
Note: Values are averages and cannot necessarily be cross referenced.a BA = basal area.b TPA = trees per acre.c QMD = quadratic mean diameter.d SE = standard error (+/- ).
30
Table 10—Average initial stand characteristics for the ponderosa pine forest in western Montana, national forest land
Year Measure BAa TPAb QMDc
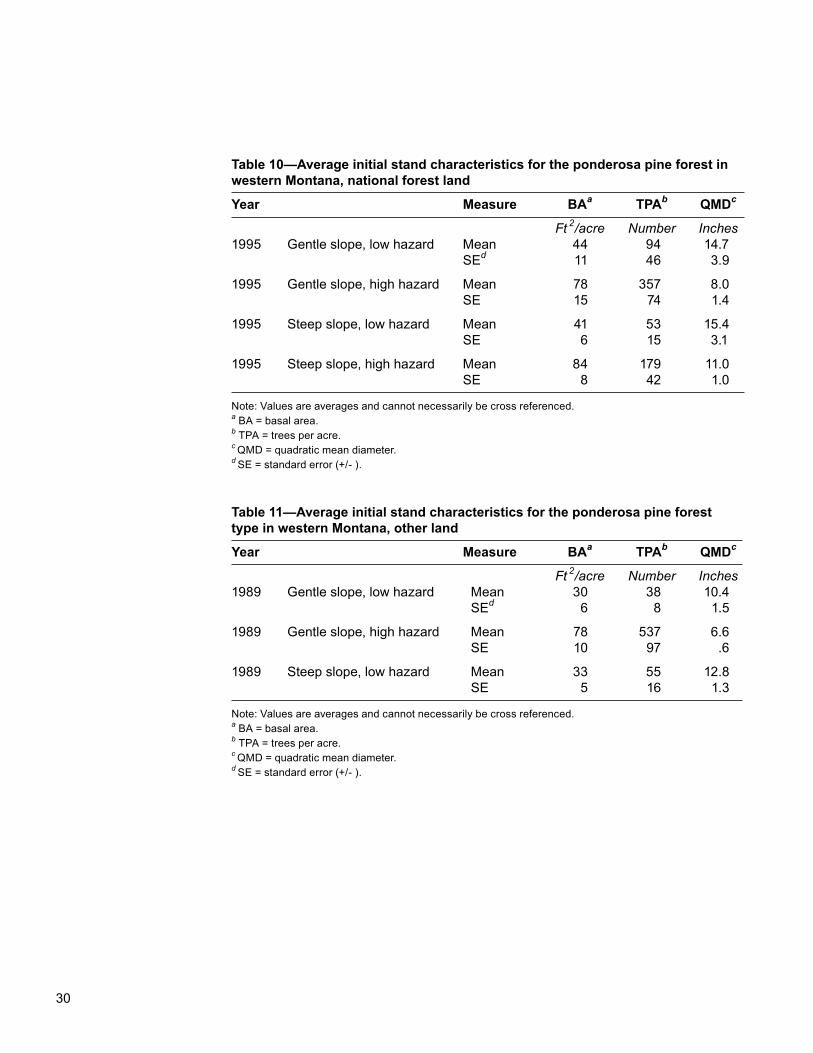
Ft 2/acre Number Inches1995 Gentle slope, low hazard Mean 44 94 14.7 SEd 11 46 3.9
1995 Gentle slope, high hazard Mean 78 357 8.0 SE 15 74 1.4
1995 Steep slope, low hazard Mean 41 53 15.4 SE 6 15 3.1
1995 Steep slope, high hazard Mean 84 179 11.0 SE 8 42 1.0
Note: Values are averages and cannot necessarily be cross referenced.a BA = basal area.b TPA = trees per acre.c QMD = quadratic mean diameter.d SE = standard error (+/- ).
Table 11—Average initial stand characteristics for the ponderosa pine forest type in western Montana, other land
Year Measure BAa TPAb QMDc
Ft 2/acre Number Inches1989 Gentle slope, low hazard Mean 30 38 10.4 SEd 6 8 1.5
1989 Gentle slope, high hazard Mean 78 537 6.6 SE 10 97 .6
1989 Steep slope, low hazard Mean 33 55 12.8 SE 5 16 1.3
Note: Values are averages and cannot necessarily be cross referenced.a BA = basal area.b TPA = trees per acre.c QMD = quadratic mean diameter.d SE = standard error (+/- ).
31
Table 12—Average initial stand characteristics for the ponderosa pine forest type in eastern Montana, national forest land
Year Measure BAa TPAb QMDc
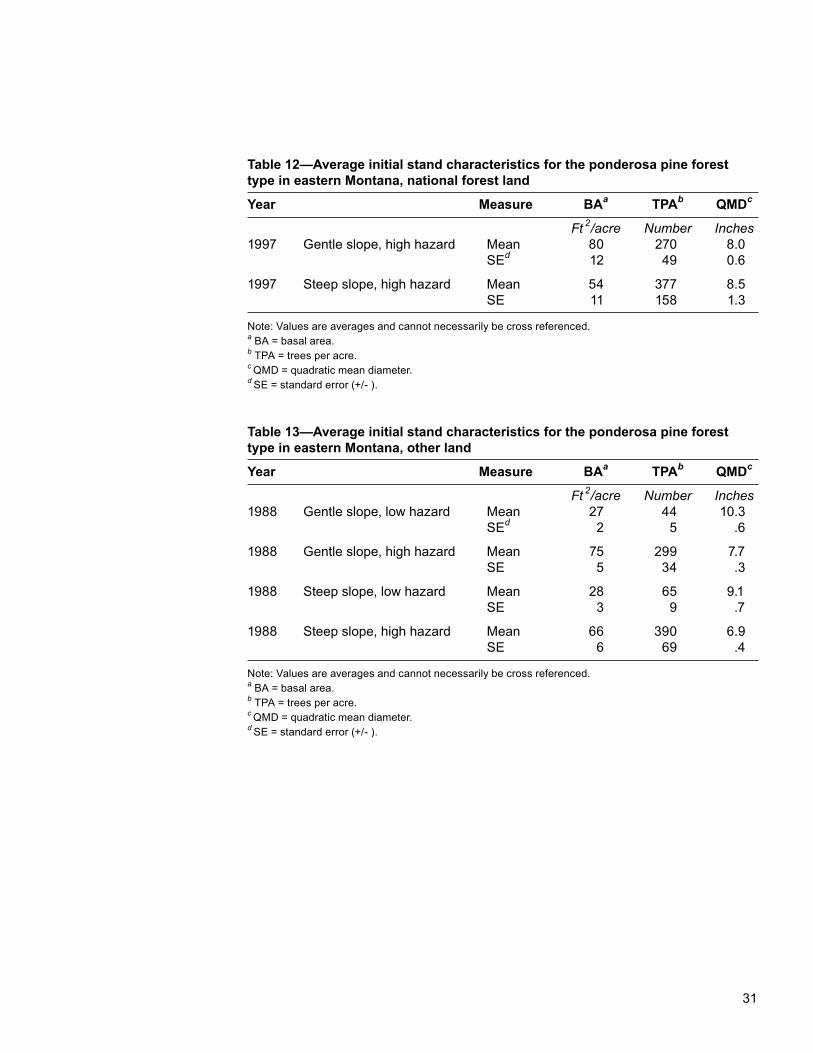
Ft 2/acre Number Inches1997 Gentle slope, high hazard Mean 80 270 8.0 SEd 12 49 0.6
1997 Steep slope, high hazard Mean 54 377 8.5 SE 11 158 1.3
Note: Values are averages and cannot necessarily be cross referenced.a BA = basal area.b TPA = trees per acre.c QMD = quadratic mean diameter.d SE = standard error (+/- ).
Table 13—Average initial stand characteristics for the ponderosa pine forest type in eastern Montana, other land
Year Measure BAa TPAb QMDc
Ft 2/acre Number Inches1988 Gentle slope, low hazard Mean 27 44 10.3 SEd 2 5 .6
1988 Gentle slope, high hazard Mean 75 299 7.7 SE 5 34 .3
1988 Steep slope, low hazard Mean 28 65 9.1 SE 3 9 .7
1988 Steep slope, high hazard Mean 66 390 6.9 SE 6 69 .4
Note: Values are averages and cannot necessarily be cross referenced.a BA = basal area.b TPA = trees per acre.c QMD = quadratic mean diameter.d SE = standard error (+/- ).
32
Average residual stand characteristics are intended to provide resource managers with an idea of the composition and structure of residual stands after each thinning entry. These summary statistics were generated by using output from the Forest Vegetation Simulation growth model simulations from the individual forest inventory and analysis plots included in each case. Average basal area, average trees per acre, and average quadratic mean diameter are averages of plot-level results weighted by the expan-sion factor (the area represented by a plot) for the plot. Trees less than 1 in diameter at breast height were eliminated from this analysis to give a more meaningful representa-tion of the overstory stand conditions.
The major focus of this analysis was the types of raw materials that might be produced from various cutting treatments. As a result, only plots where thinnings were applied in any given entry are included in the analysis presented for residual stand conditions. This makes the information reported in this appendix consistent with the other results included in this report. It is a relatively simple matter to alter the Microsoft Access re-ports to include any combination of plots so the tables and appendixes could include all plots, only the unthinned plots, or only the thinned plots as reported here (tables 14 through 21).
Appendix 4: Average Residual Stand Characteristics
33
Table 14—Average residual stand characteristics projected for the Douglas-fir forest type in western Montana, national forest land
Year Rxa Measure BAb TPAc QMDd BA CUTe BA TPA QMD BA CUT
Ft 2/acre No. Inches Percent Ft 2/acre No. Inches Percent Gentle slope, low hazard Steep slope, low hazard
2030 TB9f Mean 119 92 16.9 12 100 69 18.2 9 SEg 10 18 .8 2 6 9 .7 1 50BAh Mean 85 57 20.8 37 82 40 21.7 32 SE 3 14 1.3 3 1 5 1.0 3
2060 TB9 Mean 126 54 21.4 7 116 47 22.4 4 SE 9 5 .8 2 6 3 .6 1 50BA Mean 80 25 26.3 26 80 32 25.0 23 SE 1 4 1.1 2 1 7 .9 1
2090 TB9 Mean 142 41 25.3 5 132 39 25.9 3 SE 9 3 .7 1 7 3 .6 1 50BA Mean 80 20 29.7 22 80 21 29.3 19 SE 1 3 1.1 1 1 4 .8 1
Gentle slope, high hazard Steep slope, high hazard
2000 TB9 Mean 92 100 13.0 32 108 109 13.8 25 SE 6 6 .3 2 6 7 0.4 2 50BA Mean 85 106 13.8 38 87 81 15.4 40 SE 2 11 .6 2 2 7 .6 2
2030 TB9 Mean 97 72 16.0 7 135 76 18.5 2 SE 5 4 .4 2 7 5 .4 1 50BA Mean 80 66 17.5 20 80 35 21.5 26 SE 1 10 .7 1 1 2 .6 1
2060 TB9 Mean 111 56 19.2 5 151 60 21.9 4 SE 5 3 4 1 8 4 .4 1 50BA Mean 80 39 21.2 19 80 22 26.3 23 SE 1 3 .6 1 1 1 .5 1
2090 TB9 Mean 124 48 21.9 3 167 53 24.8 3 SE 5 2 .4 1 8 3 .5 1 50BA Mean 80 26 24.8 18 80 18 29.7 20 SE 1 2 .6 1 1 1 .5 1
Note: Values are averages and cannot necessarily be cross referenced.aRx = treatment.b BA = basal area.c TPA = trees per acre.d QMD = quadratic mean diameter.e BA CUT = percentage of total basal area harvested.f TB9 = thin from below to 9 inches diameter at breast height.g SE = standard error (+/- ).h 50BA = thin from below to 50 percent of basal area.
34
Table 15—Average residual stand characteristics projected for the Douglas-fir forest type in western Montana, other land
Year Rxa Measure BAb TPAc QMDd BA CUTe BA TPA QMD BA CUT
Ft 2/acre No. Inches Percent Ft 2/acre No. Inches Percent Gentle slope, low hazard Steep slope, low hazard
2030 TB9f Mean 110 71 17.3 10 103 73 16.9 7 SEg 6 5 .4 1 5 5 .5 1 50BAh Mean 82 43 20.3 37 80 49 18.8 31 SE 1 4 .9 3 1 4 .7 2
2060 TB9 Mean 118 57 20.8 6 126 57 20.8 1 SE 7 6 .6 1 5 3 .5 1 50BA Mean 80 45 24.5 23 80 28 24.1 20 SE 1 18 .9 1 1 2 .7 1
2090 TB9 Mean 130 42 24.2 5 145 48 24.2 1 SE 1 2 .6 1 6 3 .5 1 50BA Mean 80 20 29.0 21 80 20 28.0 17 SE 1 3 .7 1 1 1 .6 1
Gentle slope, high hazard Steep slope, high hazard
2000 TB9 Mean 86 110 12.2 36 78 96 12.2 37 SE 5 6 .5 3 6 5 .3 2 50BA Mean 84 128 13.3 39 83 139 12.0 33 SE 1 15 .7 2 1 12 .6 2
2030 TB9 Mean 97 69 16.4 7 95 63 16.5 3 SE 5 4 .4 2 7 4 .3 1 50BA Mean 80 59 17.3 22 80 57 17.7 20 SE 1 6 .7 2 1 5 .8 2
2060 TB9 Mean 106 52 19.4 5 112 51 19.9 2 SE 5 2 .4 1 8 3 .4 1 50BA Mean 80 41 21.4 19 80 35 21.9 20 SE 1 6 .7 1 1 3 .7 1
2090 TB9 Mean 121 44 22.5 3 124 43 22.8 2 SE 6 2 .3 1 8 2 .4 1 50BA Mean 80 31 24.8 17 80 26 25.7 17 SE 1 6 .7 1 1 3 .7 1
Note: Values are averages and cannot necessarily be cross referenced.aRx = treatment.b BA = basal area.c TPA = trees per acre.d QMD = quadratic mean diameter.e BA CUT = percentage of total basal area harvested.f TB9 = thin from below to 9 inches diameter at breast height.g SE = standard error (+/- ).h 50BA = thin from below to 50 percent of basal area.

35
Table 16—Average residual stand characteristics projected for the Douglas-fir forest type in eastern Montana, national forest land
Year Rxa Measure BAb TPAc QMDd BA CUTe BA TPA QMD BA CUT
Ft 2/acre No. Inches Percent Ft 2/acre No. Inches Percent Gentle slope, low hazard Steep slope, low hazard
2030 TB9f Mean 89 119 12.0 22 93 204 11.3 15 SEg 11 18 0.5 5 10 86 1.0 3 50BA Mean 71 64 17.9 32 71 47 20.6 34 SE 1 15 1.1 3 1 15 1.5 4
2060 TB9 Mean 106 164 10.9 1 113 97 14.6 3 SE — — — — — — — — 50BA Mean 70 27 23.2 20 70 26 24.0 15 SE 1 3 .9 2 1 3 1.4 1
2090 TB9 Mean 110 44 21.5 5 103 38 22.7 4 SE 6 2 .5 1 8 3 .8 1 50BA Mean 70 21 26.7 16 70 20 26.6 15 SE 1 3 1.0 1 1 2 1.2 1
Gentle slope, high hazard Steep slope, high hazard
2000 TB9 Mean 117 119 13.3 27 95 113 12.6 32 SE 9 7 .5 3 8 8 .5 3 50BA Mean 87 84 15.8 43 85 105 14.6 42 SE 3 10 .7 2 3 14 .9 2
2030 TB9 Mean 136 86 16.9 2 106 69 17.0 2 SE 10 5 .4 1 10 6 .6 1 50BA Mean 70 40 20.1 25 70 36 21.1 20 SE 1 4 .8 2 1 4 1.4 3
2060 TB9 Mean 145 68 19.6 4 114 55 19.7 3 SE 10 5 .4 1 11 5 .7 1 50BA Mean 70 29 23.2 17 70 30 23.2 15 SE 1 4 .8 1 1 4 1.3 1
2090 TB9 Mean 155 58 22.2 4 127 47 22.5 3 SE 11 4 .4 1 11 4 .7 1 50BA Mean 70 20 26.4 16 70 22 25.6 15 SE 1 1 .7 1 1 2 1.0 1
Note: Values are averages and cannot necessarily be cross referenced.aRx = treatment.b BA = basal area.c TPA = trees per acre.d QMD = quadratic mean diameter.e BA CUT = percentage of total basal area harvested.f TB9 = thin from below to 9 inches diameter at breast height.g SE = standard error (+/- ).h 50BA = thin from below to 50 percent of basal area.— = no data.
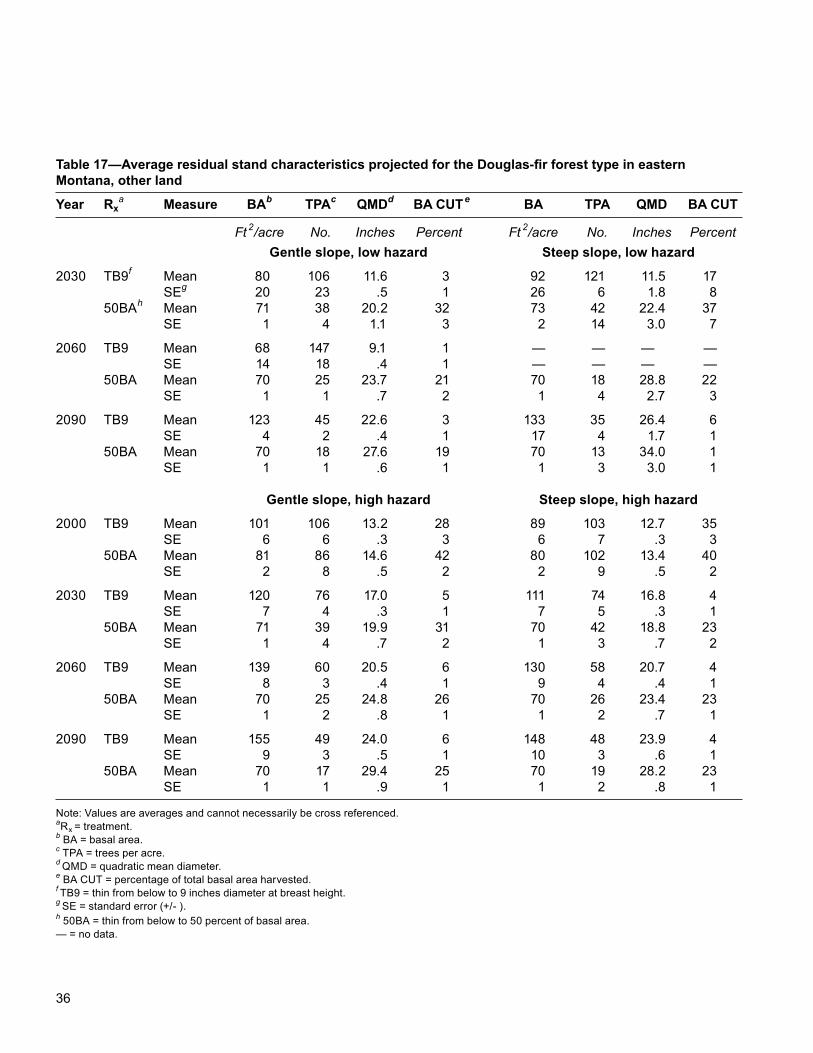
36
Table 17—Average residual stand characteristics projected for the Douglas-fir forest type in eastern Montana, other land
Year Rxa Measure BAb TPAc QMDd BA CUTe BA TPA QMD BA CUT
Ft 2/acre No. Inches Percent Ft 2/acre No. Inches Percent Gentle slope, low hazard Steep slope, low hazard
2030 TB9f Mean 80 106 11.6 3 92 121 11.5 17 SEg 20 23 .5 1 26 6 1.8 8 50BAh Mean 71 38 20.2 32 73 42 22.4 37 SE 1 4 1.1 3 2 14 3.0 7
2060 TB9 Mean 68 147 9.1 1 — — — — SE 14 18 .4 1 — — — — 50BA Mean 70 25 23.7 21 70 18 28.8 22 SE 1 1 .7 2 1 4 2.7 3
2090 TB9 Mean 123 45 22.6 3 133 35 26.4 6 SE 4 2 .4 1 17 4 1.7 1 50BA Mean 70 18 27.6 19 70 13 34.0 1 SE 1 1 .6 1 1 3 3.0 1
Gentle slope, high hazard Steep slope, high hazard
2000 TB9 Mean 101 106 13.2 28 89 103 12.7 35 SE 6 6 .3 3 6 7 .3 3 50BA Mean 81 86 14.6 42 80 102 13.4 40 SE 2 8 .5 2 2 9 .5 2
2030 TB9 Mean 120 76 17.0 5 111 74 16.8 4 SE 7 4 .3 1 7 5 .3 1 50BA Mean 71 39 19.9 31 70 42 18.8 23 SE 1 4 .7 2 1 3 .7 2
2060 TB9 Mean 139 60 20.5 6 130 58 20.7 4 SE 8 3 .4 1 9 4 .4 1 50BA Mean 70 25 24.8 26 70 26 23.4 23 SE 1 2 .8 1 1 2 .7 1
2090 TB9 Mean 155 49 24.0 6 148 48 23.9 4 SE 9 3 .5 1 10 3 .6 1 50BA Mean 70 17 29.4 25 70 19 28.2 23 SE 1 1 .9 1 1 2 .8 1
Note: Values are averages and cannot necessarily be cross referenced.aRx = treatment.b BA = basal area.c TPA = trees per acre.d QMD = quadratic mean diameter.e BA CUT = percentage of total basal area harvested.f TB9 = thin from below to 9 inches diameter at breast height.g SE = standard error (+/- ).h 50BA = thin from below to 50 percent of basal area.— = no data.
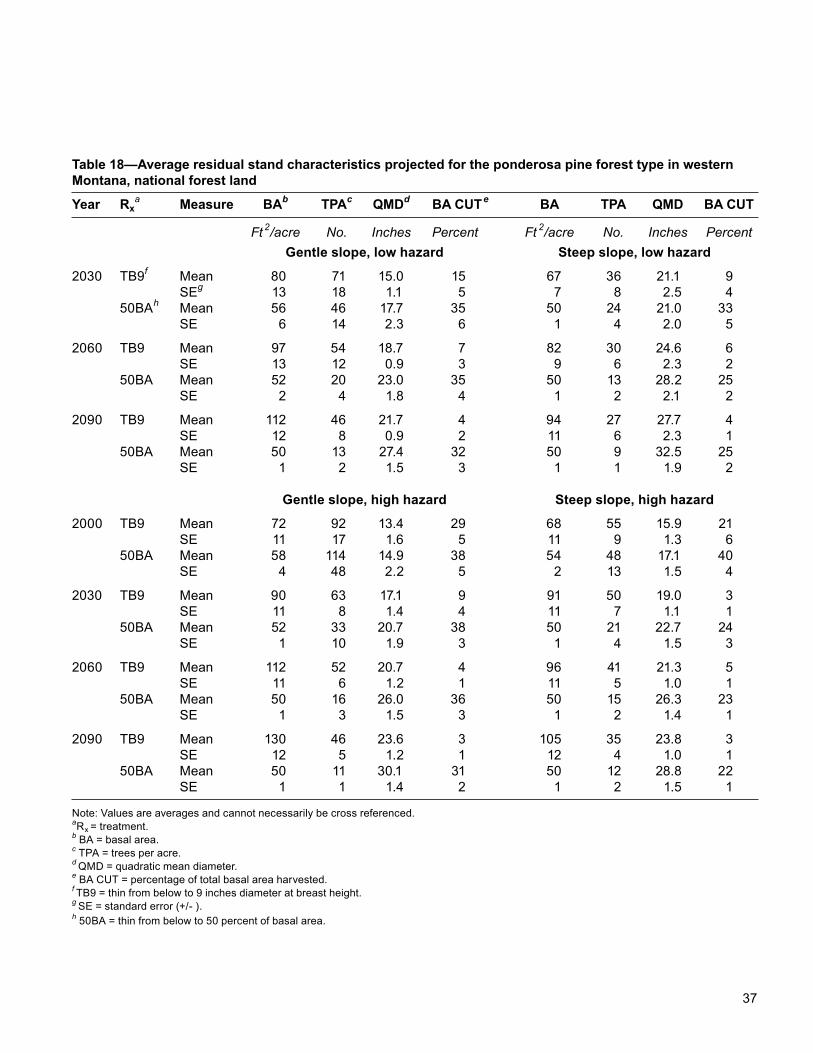
37
Table 18—Average residual stand characteristics projected for the ponderosa pine forest type in western Montana, national forest land
Year Rxa Measure BAb TPAc QMDd BA CUTe BA TPA QMD BA CUT
Ft 2/acre No. Inches Percent Ft 2/acre No. Inches Percent Gentle slope, low hazard Steep slope, low hazard
2030 TB9f Mean 80 71 15.0 15 67 36 21.1 9 SEg 13 18 1.1 5 7 8 2.5 4 50BAh Mean 56 46 17.7 35 50 24 21.0 33 SE 6 14 2.3 6 1 4 2.0 5
2060 TB9 Mean 97 54 18.7 7 82 30 24.6 6 SE 13 12 0.9 3 9 6 2.3 2 50BA Mean 52 20 23.0 35 50 13 28.2 25 SE 2 4 1.8 4 1 2 2.1 2
2090 TB9 Mean 112 46 21.7 4 94 27 27.7 4 SE 12 8 0.9 2 11 6 2.3 1 50BA Mean 50 13 27.4 32 50 9 32.5 25 SE 1 2 1.5 3 1 1 1.9 2
Gentle slope, high hazard Steep slope, high hazard
2000 TB9 Mean 72 92 13.4 29 68 55 15.9 21 SE 11 17 1.6 5 11 9 1.3 6 50BA Mean 58 114 14.9 38 54 48 17.1 40 SE 4 48 2.2 5 2 13 1.5 4
2030 TB9 Mean 90 63 17.1 9 91 50 19.0 3 SE 11 8 1.4 4 11 7 1.1 1 50BA Mean 52 33 20.7 38 50 21 22.7 24 SE 1 10 1.9 3 1 4 1.5 3
2060 TB9 Mean 112 52 20.7 4 96 41 21.3 5 SE 11 6 1.2 1 11 5 1.0 1 50BA Mean 50 16 26.0 36 50 15 26.3 23 SE 1 3 1.5 3 1 2 1.4 1
2090 TB9 Mean 130 46 23.6 3 105 35 23.8 3 SE 12 5 1.2 1 12 4 1.0 1 50BA Mean 50 11 30.1 31 50 12 28.8 22 SE 1 1 1.4 2 1 2 1.5 1
Note: Values are averages and cannot necessarily be cross referenced.aRx = treatment.b BA = basal area.c TPA = trees per acre.d QMD = quadratic mean diameter.e BA CUT = percentage of total basal area harvested.f TB9 = thin from below to 9 inches diameter at breast height.g SE = standard error (+/- ).h 50BA = thin from below to 50 percent of basal area.
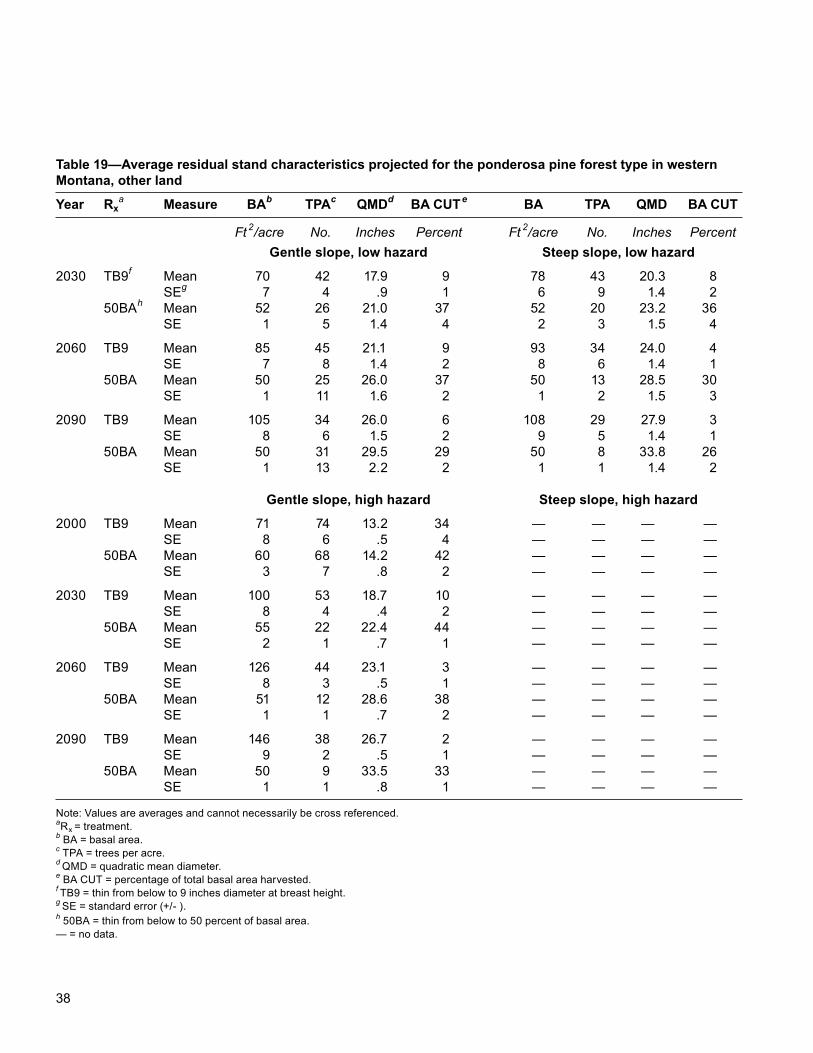
38
Table 19—Average residual stand characteristics projected for the ponderosa pine forest type in western Montana, other land
Year Rxa Measure BAb TPAc QMDd BA CUTe BA TPA QMD BA CUT
Ft 2/acre No. Inches Percent Ft 2/acre No. Inches Percent Gentle slope, low hazard Steep slope, low hazard
2030 TB9f Mean 70 42 17.9 9 78 43 20.3 8 SEg 7 4 .9 1 6 9 1.4 2 50BAh Mean 52 26 21.0 37 52 20 23.2 36 SE 1 5 1.4 4 2 3 1.5 4
2060 TB9 Mean 85 45 21.1 9 93 34 24.0 4 SE 7 8 1.4 2 8 6 1.4 1 50BA Mean 50 25 26.0 37 50 13 28.5 30 SE 1 11 1.6 2 1 2 1.5 3
2090 TB9 Mean 105 34 26.0 6 108 29 27.9 3 SE 8 6 1.5 2 9 5 1.4 1 50BA Mean 50 31 29.5 29 50 8 33.8 26 SE 1 13 2.2 2 1 1 1.4 2
Gentle slope, high hazard Steep slope, high hazard
2000 TB9 Mean 71 74 13.2 34 — — — — SE 8 6 .5 4 — — — — 50BA Mean 60 68 14.2 42 — — — — SE 3 7 .8 2 — — — —
2030 TB9 Mean 100 53 18.7 10 — — — — SE 8 4 .4 2 — — — — 50BA Mean 55 22 22.4 44 — — — — SE 2 1 .7 1 — — — —
2060 TB9 Mean 126 44 23.1 3 — — — — SE 8 3 .5 1 — — — — 50BA Mean 51 12 28.6 38 — — — — SE 1 1 .7 2 — — — —
2090 TB9 Mean 146 38 26.7 2 — — — — SE 9 2 .5 1 — — — — 50BA Mean 50 9 33.5 33 — — — — SE 1 1 .8 1 — — — —
Note: Values are averages and cannot necessarily be cross referenced.aRx = treatment.b BA = basal area.c TPA = trees per acre.d QMD = quadratic mean diameter.e BA CUT = percentage of total basal area harvested.f TB9 = thin from below to 9 inches diameter at breast height.g SE = standard error (+/- ).h 50BA = thin from below to 50 percent of basal area.— = no data.
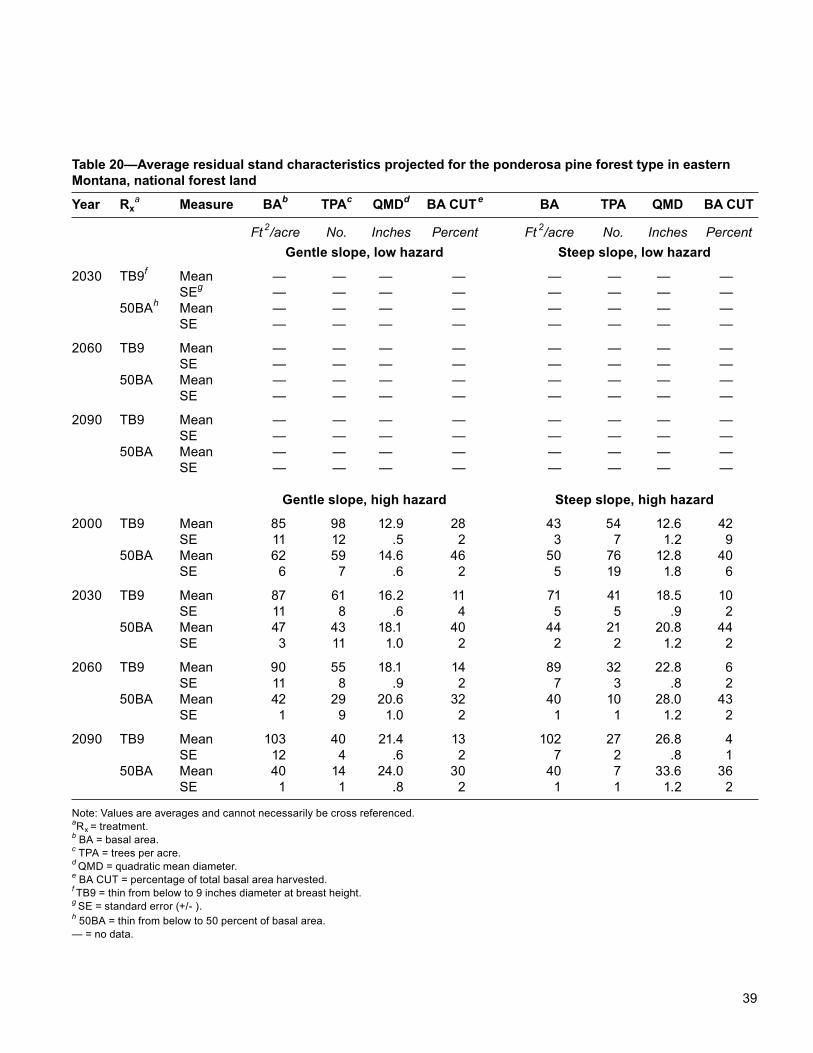
39
Table 20—Average residual stand characteristics projected for the ponderosa pine forest type in eastern Montana, national forest land
Year Rxa Measure BAb TPAc QMDd BA CUTe BA TPA QMD BA CUT
Ft 2/acre No. Inches Percent Ft 2/acre No. Inches Percent Gentle slope, low hazard Steep slope, low hazard
2030 TB9f Mean — — — — — — — — SEg — — — — — — — — 50BAh Mean — — — — — — — — SE — — — — — — — —
2060 TB9 Mean — — — — — — — — SE — — — — — — — — 50BA Mean — — — — — — — — SE — — — — — — — —
2090 TB9 Mean — — — — — — — — SE — — — — — — — — 50BA Mean — — — — — — — — SE — — — — — — — —
Gentle slope, high hazard Steep slope, high hazard
2000 TB9 Mean 85 98 12.9 28 43 54 12.6 42 SE 11 12 .5 2 3 7 1.2 9 50BA Mean 62 59 14.6 46 50 76 12.8 40 SE 6 7 .6 2 5 19 1.8 6
2030 TB9 Mean 87 61 16.2 11 71 41 18.5 10 SE 11 8 .6 4 5 5 .9 2 50BA Mean 47 43 18.1 40 44 21 20.8 44 SE 3 11 1.0 2 2 2 1.2 2
2060 TB9 Mean 90 55 18.1 14 89 32 22.8 6 SE 11 8 .9 2 7 3 .8 2 50BA Mean 42 29 20.6 32 40 10 28.0 43 SE 1 9 1.0 2 1 1 1.2 2
2090 TB9 Mean 103 40 21.4 13 102 27 26.8 4 SE 12 4 .6 2 7 2 .8 1 50BA Mean 40 14 24.0 30 40 7 33.6 36 SE 1 1 .8 2 1 1 1.2 2
Note: Values are averages and cannot necessarily be cross referenced.aRx = treatment.b BA = basal area.c TPA = trees per acre.d QMD = quadratic mean diameter.e BA CUT = percentage of total basal area harvested.f TB9 = thin from below to 9 inches diameter at breast height.g SE = standard error (+/- ).h 50BA = thin from below to 50 percent of basal area.— = no data.
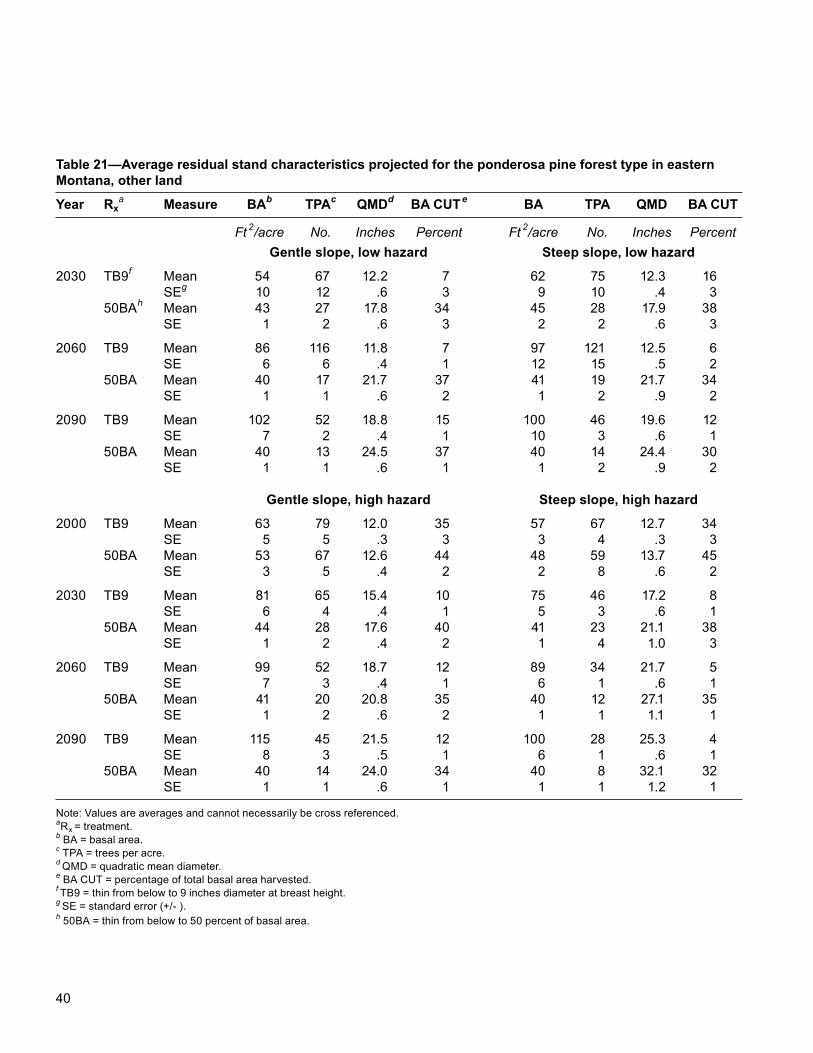
40
Table 21—Average residual stand characteristics projected for the ponderosa pine forest type in eastern Montana, other land
Year Rxa Measure BAb TPAc QMDd BA CUTe BA TPA QMD BA CUT
Ft 2/acre No. Inches Percent Ft 2/acre No. Inches Percent Gentle slope, low hazard Steep slope, low hazard
2030 TB9f Mean 54 67 12.2 7 62 75 12.3 16 SEg 10 12 .6 3 9 10 .4 3 50BAh Mean 43 27 17.8 34 45 28 17.9 38 SE 1 2 .6 3 2 2 .6 3
2060 TB9 Mean 86 116 11.8 7 97 121 12.5 6 SE 6 6 .4 1 12 15 .5 2 50BA Mean 40 17 21.7 37 41 19 21.7 34 SE 1 1 .6 2 1 2 .9 2
2090 TB9 Mean 102 52 18.8 15 100 46 19.6 12 SE 7 2 .4 1 10 3 .6 1 50BA Mean 40 13 24.5 37 40 14 24.4 30 SE 1 1 .6 1 1 2 .9 2
Gentle slope, high hazard Steep slope, high hazard
2000 TB9 Mean 63 79 12.0 35 57 67 12.7 34 SE 5 5 .3 3 3 4 .3 3 50BA Mean 53 67 12.6 44 48 59 13.7 45 SE 3 5 .4 2 2 8 .6 2
2030 TB9 Mean 81 65 15.4 10 75 46 17.2 8 SE 6 4 .4 1 5 3 .6 1 50BA Mean 44 28 17.6 40 41 23 21.1 38 SE 1 2 .4 2 1 4 1.0 3
2060 TB9 Mean 99 52 18.7 12 89 34 21.7 5 SE 7 3 .4 1 6 1 .6 1 50BA Mean 41 20 20.8 35 40 12 27.1 35 SE 1 2 .6 2 1 1 1.1 1
2090 TB9 Mean 115 45 21.5 12 100 28 25.3 4 SE 8 3 .5 1 6 1 .6 1 50BA Mean 40 14 24.0 34 40 8 32.1 32 SE 1 1 .6 1 1 1 1.2 1
Note: Values are averages and cannot necessarily be cross referenced.aRx = treatment.b BA = basal area.c TPA = trees per acre.d QMD = quadratic mean diameter.e BA CUT = percentage of total basal area harvested.f TB9 = thin from below to 9 inches diameter at breast height.g SE = standard error (+/- ).h 50BA = thin from below to 50 percent of basal area.
41
Resource managers who plan and conduct fuel mitigation treatments and contractors who bid on the treatments need information on the merchantable volume and size of trees to be removed during treatments. Such information is presented in this appendix. The tables included in this appendix summarize average cubic-foot volume harvested per acre, with standard errors (see tables 22 through 29). Reporting results by 3-in diameter classes provides a sense of the relative importance of different tree sizes. Processing output for all trees 7 in diameter at breast height and larger through the Financial Evaluation of Ecosystem Management Activities (FEEMA) model generates the data needed for tables. Merchantable volume is calculated by summing all of the logs that FEEMA recovered from each tree up to a 5-in top. All values are stand aver-ages weighted by plot expansion factors. All tree species are combined. Cases where less than 50 cubic feet of material was removed are left blank because this amount of volume is considered insignificant and including it makes the output in later appendix-es (e.g., 7 and 8) confusing.
Appendix 5: Average Volume of Utilized Trees
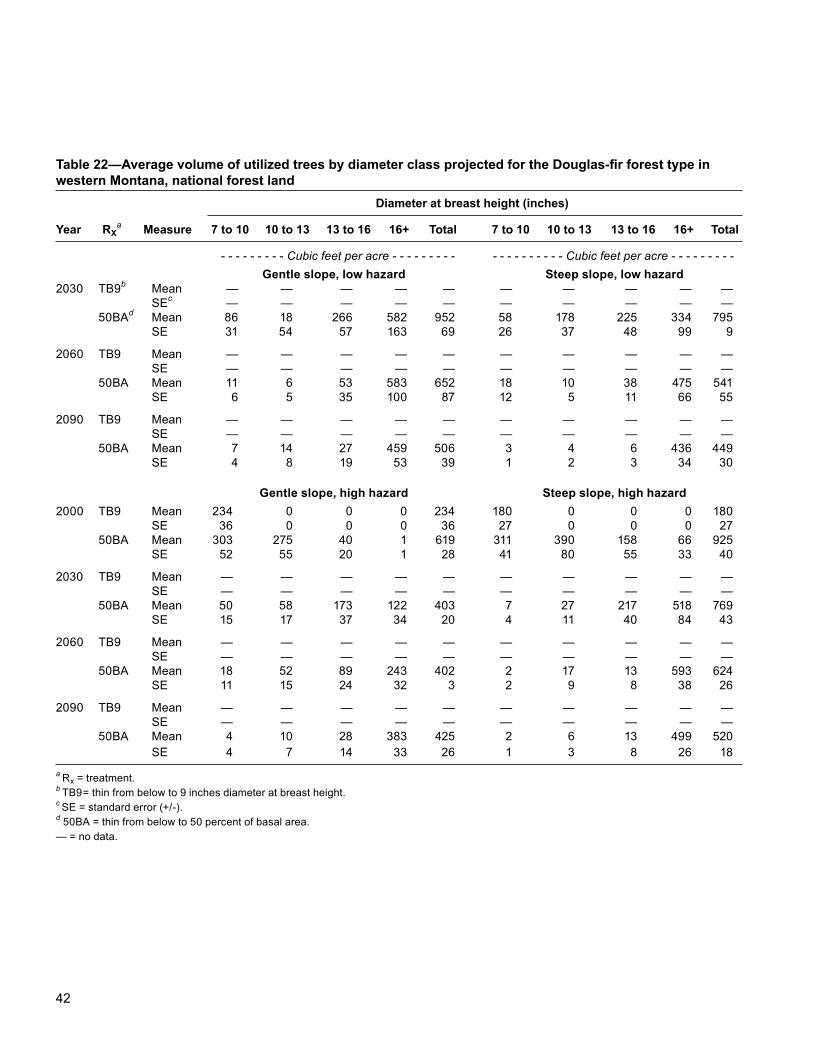
42
Table 22—Average volume of utilized trees by diameter class projected for the Douglas-fir forest type in western Montana, national forest land Diameter at breast height (inches)
Year RXa Measure 7 to 10 10 to 13 13 to 16 16+ Total 7 to 10 10 to 13 13 to 16 16+ Total
- - - - - - - - - Cubic feet per acre - - - - - - - - - - - - - - - - - - - Cubic feet per acre - - - - - - - - - Gentle slope, low hazard Steep slope, low hazard2030 TB9b Mean — — — — — — — — — — SEc — — — — — — — — — — 50BAd Mean 86 18 266 582 952 58 178 225 334 795 SE 31 54 57 163 69 26 37 48 99 9
2060 TB9 Mean — — — — — — — — — — SE — — — — — — — — — — 50BA Mean 11 6 53 583 652 18 10 38 475 541 SE 6 5 35 100 87 12 5 11 66 55
2090 TB9 Mean — — — — — — — — — — SE — — — — — — — — — — 50BA Mean 7 14 27 459 506 3 4 6 436 449 SE 4 8 19 53 39 1 2 3 34 30
Gentle slope, high hazard Steep slope, high hazard2000 TB9 Mean 234 0 0 0 234 180 0 0 0 180 SE 36 0 0 0 36 27 0 0 0 27 50BA Mean 303 275 40 1 619 311 390 158 66 925 SE 52 55 20 1 28 41 80 55 33 40
2030 TB9 Mean — — — — — — — — — — SE — — — — — — — — — — 50BA Mean 50 58 173 122 403 7 27 217 518 769 SE 15 17 37 34 20 4 11 40 84 43
2060 TB9 Mean — — — — — — — — — — SE — — — — — — — — — — 50BA Mean 18 52 89 243 402 2 17 13 593 624 SE 11 15 24 32 3 2 9 8 38 26
2090 TB9 Mean — — — — — — — — — — SE — — — — — — — — — — 50BA Mean 4 10 28 383 425 2 6 13 499 520 SE 4 7 14 33 26 1 3 8 26 18a Rx = treatment. b TB9= thin from below to 9 inches diameter at breast height.c SE = standard error (+/-).d 50BA = thin from below to 50 percent of basal area.— = no data.
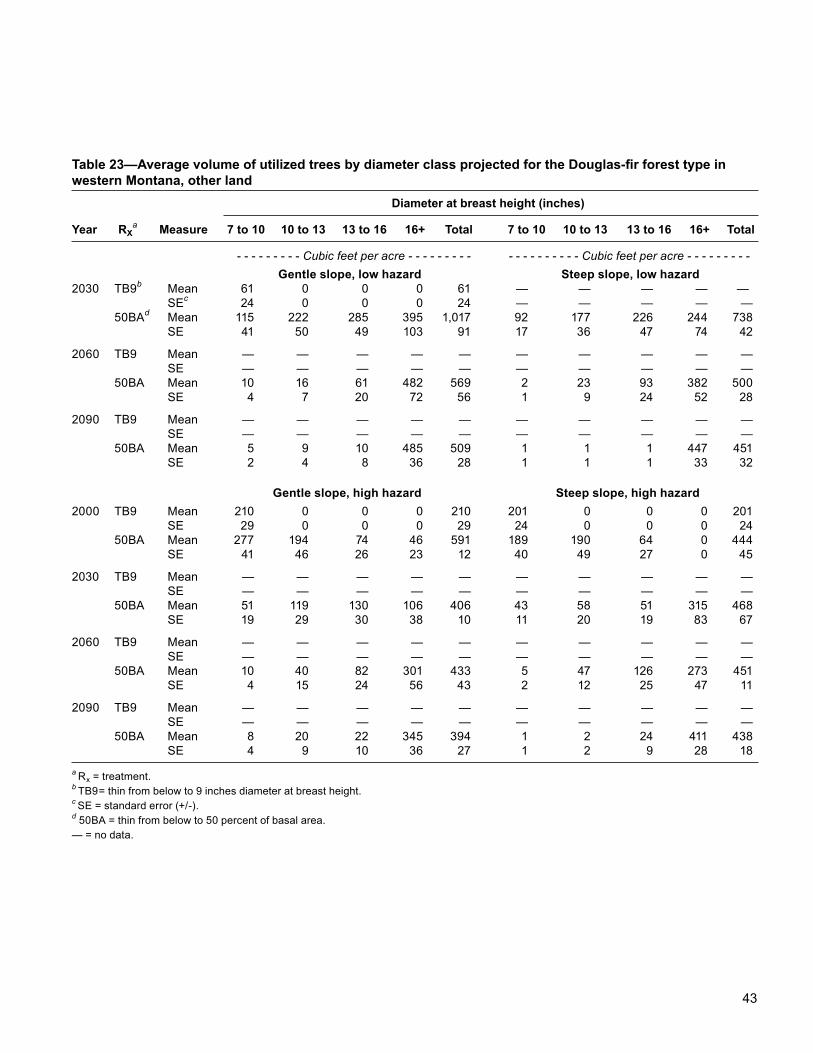
43
Table 23—Average volume of utilized trees by diameter class projected for the Douglas-fir forest type in western Montana, other land Diameter at breast height (inches)
Year RXa Measure 7 to 10 10 to 13 13 to 16 16+ Total 7 to 10 10 to 13 13 to 16 16+ Total
- - - - - - - - - Cubic feet per acre - - - - - - - - - - - - - - - - - - - Cubic feet per acre - - - - - - - - - Gentle slope, low hazard Steep slope, low hazard2030 TB9b Mean 61 0 0 0 61 — — — — — SEc 24 0 0 0 24 — — — — — 50BAd Mean 115 222 285 395 1,017 92 177 226 244 738 SE 41 50 49 103 91 17 36 47 74 42
2060 TB9 Mean — — — — — — — — — — SE — — — — — — — — — — 50BA Mean 10 16 61 482 569 2 23 93 382 500 SE 4 7 20 72 56 1 9 24 52 28
2090 TB9 Mean — — — — — — — — — — SE — — — — — — — — — — 50BA Mean 5 9 10 485 509 1 1 1 447 451 SE 2 4 8 36 28 1 1 1 33 32
Gentle slope, high hazard Steep slope, high hazard2000 TB9 Mean 210 0 0 0 210 201 0 0 0 201 SE 29 0 0 0 29 24 0 0 0 24 50BA Mean 277 194 74 46 591 189 190 64 0 444 SE 41 46 26 23 12 40 49 27 0 45
2030 TB9 Mean — — — — — — — — — — SE — — — — — — — — — — 50BA Mean 51 119 130 106 406 43 58 51 315 468 SE 19 29 30 38 10 11 20 19 83 67
2060 TB9 Mean — — — — — — — — — — SE — — — — — — — — — — 50BA Mean 10 40 82 301 433 5 47 126 273 451 SE 4 15 24 56 43 2 12 25 47 11
2090 TB9 Mean — — — — — — — — — — SE — — — — — — — — — — 50BA Mean 8 20 22 345 394 1 2 24 411 438 SE 4 9 10 36 27 1 2 9 28 18a Rx = treatment. b TB9= thin from below to 9 inches diameter at breast height.c SE = standard error (+/-).d 50BA = thin from below to 50 percent of basal area.— = no data.
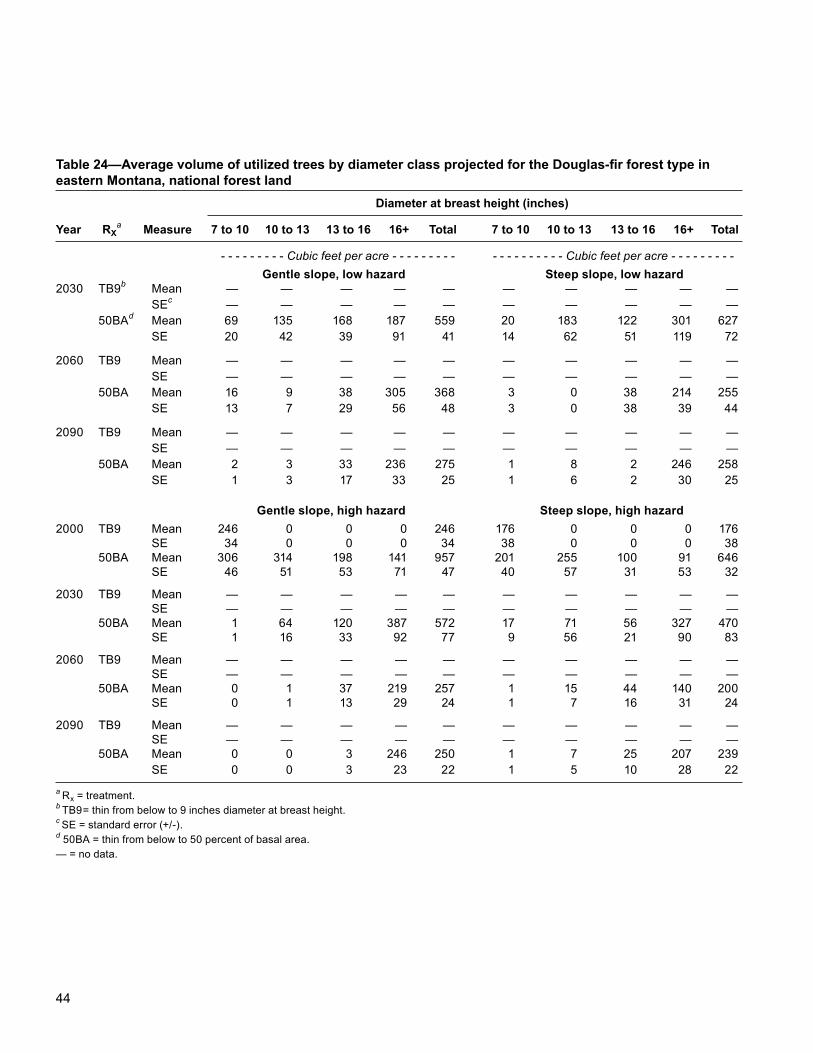
44
Table 24—Average volume of utilized trees by diameter class projected for the Douglas-fir forest type in eastern Montana, national forest land Diameter at breast height (inches)
Year RXa Measure 7 to 10 10 to 13 13 to 16 16+ Total 7 to 10 10 to 13 13 to 16 16+ Total
- - - - - - - - - Cubic feet per acre - - - - - - - - - - - - - - - - - - - Cubic feet per acre - - - - - - - - - Gentle slope, low hazard Steep slope, low hazard2030 TB9b Mean — — — — — — — — — — SEc — — — — — — — — — — 50BAd Mean 69 135 168 187 559 20 183 122 301 627 SE 20 42 39 91 41 14 62 51 119 72
2060 TB9 Mean — — — — — — — — — — SE — — — — — — — — — — 50BA Mean 16 9 38 305 368 3 0 38 214 255 SE 13 7 29 56 48 3 0 38 39 44
2090 TB9 Mean — — — — — — — — — — SE — — — — — — — — — — 50BA Mean 2 3 33 236 275 1 8 2 246 258 SE 1 3 17 33 25 1 6 2 30 25
Gentle slope, high hazard Steep slope, high hazard2000 TB9 Mean 246 0 0 0 246 176 0 0 0 176 SE 34 0 0 0 34 38 0 0 0 38 50BA Mean 306 314 198 141 957 201 255 100 91 646 SE 46 51 53 71 47 40 57 31 53 32
2030 TB9 Mean — — — — — — — — — — SE — — — — — — — — — — 50BA Mean 1 64 120 387 572 17 71 56 327 470 SE 1 16 33 92 77 9 56 21 90 83
2060 TB9 Mean — — — — — — — — — — SE — — — — — — — — — — 50BA Mean 0 1 37 219 257 1 15 44 140 200 SE 0 1 13 29 24 1 7 16 31 24
2090 TB9 Mean — — — — — — — — — — SE — — — — — — — — — — 50BA Mean 0 0 3 246 250 1 7 25 207 239 SE 0 0 3 23 22 1 5 10 28 22a Rx = treatment. b TB9= thin from below to 9 inches diameter at breast height.c SE = standard error (+/-).d 50BA = thin from below to 50 percent of basal area.— = no data.
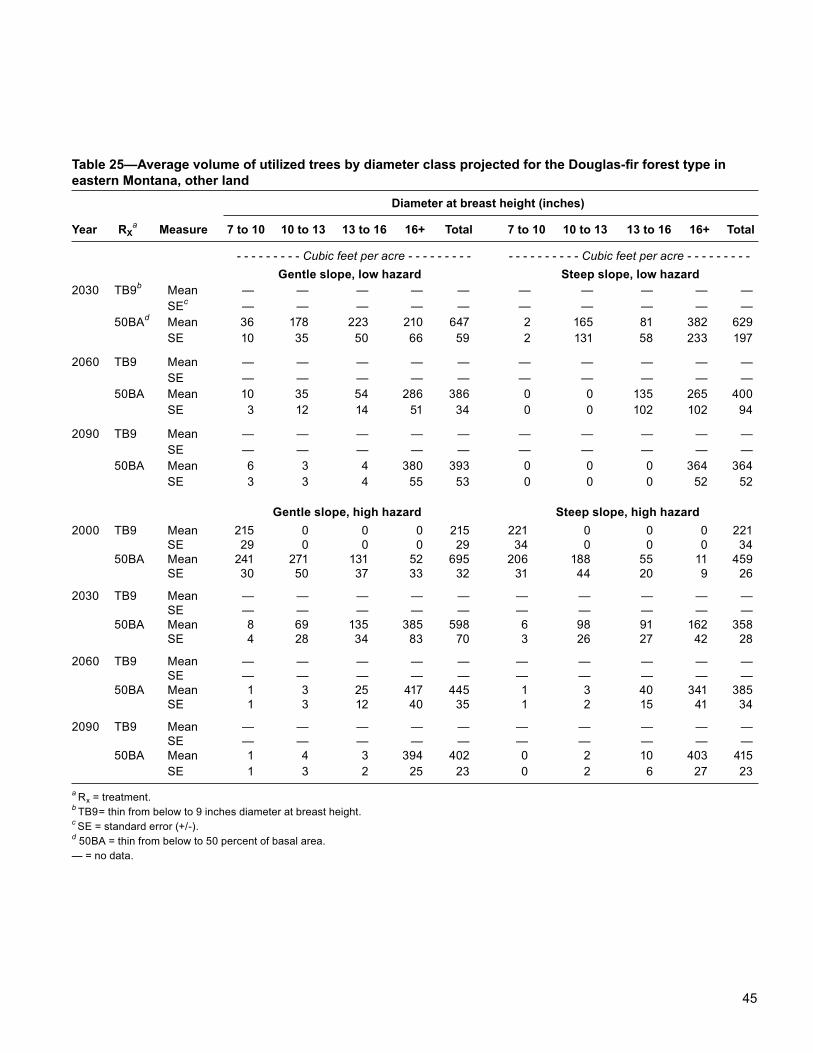
45
Table 25—Average volume of utilized trees by diameter class projected for the Douglas-fir forest type in eastern Montana, other land Diameter at breast height (inches)
Year RXa Measure 7 to 10 10 to 13 13 to 16 16+ Total 7 to 10 10 to 13 13 to 16 16+ Total
- - - - - - - - - Cubic feet per acre - - - - - - - - - - - - - - - - - - - Cubic feet per acre - - - - - - - - - Gentle slope, low hazard Steep slope, low hazard2030 TB9b Mean — — — — — — — — — — SEc — — — — — — — — — — 50BAd Mean 36 178 223 210 647 2 165 81 382 629 SE 10 35 50 66 59 2 131 58 233 197
2060 TB9 Mean — — — — — — — — — — SE — — — — — — — — — — 50BA Mean 10 35 54 286 386 0 0 135 265 400 SE 3 12 14 51 34 0 0 102 102 94
2090 TB9 Mean — — — — — — — — — — SE — — — — — — — — — — 50BA Mean 6 3 4 380 393 0 0 0 364 364 SE 3 3 4 55 53 0 0 0 52 52
Gentle slope, high hazard Steep slope, high hazard2000 TB9 Mean 215 0 0 0 215 221 0 0 0 221 SE 29 0 0 0 29 34 0 0 0 34 50BA Mean 241 271 131 52 695 206 188 55 11 459 SE 30 50 37 33 32 31 44 20 9 26
2030 TB9 Mean — — — — — — — — — — SE — — — — — — — — — — 50BA Mean 8 69 135 385 598 6 98 91 162 358 SE 4 28 34 83 70 3 26 27 42 28
2060 TB9 Mean — — — — — — — — — — SE — — — — — — — — — — 50BA Mean 1 3 25 417 445 1 3 40 341 385 SE 1 3 12 40 35 1 2 15 41 34
2090 TB9 Mean — — — — — — — — — — SE — — — — — — — — — — 50BA Mean 1 4 3 394 402 0 2 10 403 415 SE 1 3 2 25 23 0 2 6 27 23a Rx = treatment. b TB9= thin from below to 9 inches diameter at breast height.c SE = standard error (+/-).d 50BA = thin from below to 50 percent of basal area.— = no data.
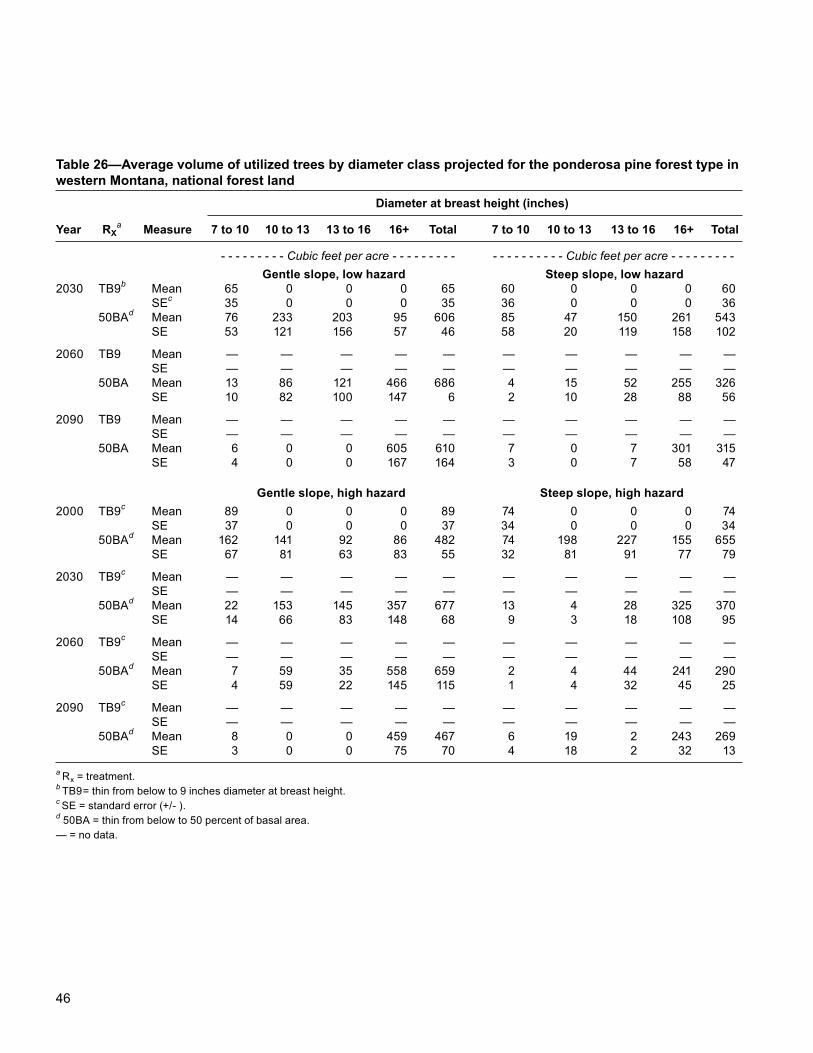
46
Table 26—Average volume of utilized trees by diameter class projected for the ponderosa pine forest type in western Montana, national forest land Diameter at breast height (inches)
Year RXa Measure 7 to 10 10 to 13 13 to 16 16+ Total 7 to 10 10 to 13 13 to 16 16+ Total
- - - - - - - - - Cubic feet per acre - - - - - - - - - - - - - - - - - - - Cubic feet per acre - - - - - - - - - Gentle slope, low hazard Steep slope, low hazard2030 TB9b Mean 65 0 0 0 65 60 0 0 0 60 SEc 35 0 0 0 35 36 0 0 0 36 50BAd Mean 76 233 203 95 606 85 47 150 261 543 SE 53 121 156 57 46 58 20 119 158 102
2060 TB9 Mean — — — — — — — — — — SE — — — — — — — — — — 50BA Mean 13 86 121 466 686 4 15 52 255 326 SE 10 82 100 147 6 2 10 28 88 56
2090 TB9 Mean — — — — — — — — — — SE — — — — — — — — — — 50BA Mean 6 0 0 605 610 7 0 7 301 315 SE 4 0 0 167 164 3 0 7 58 47
Gentle slope, high hazard Steep slope, high hazard2000 TB9c Mean 89 0 0 0 89 74 0 0 0 74 SE 37 0 0 0 37 34 0 0 0 34 50BAd Mean 162 141 92 86 482 74 198 227 155 655 SE 67 81 63 83 55 32 81 91 77 79
2030 TB9c Mean — — — — — — — — — — SE — — — — — — — — — — 50BAd Mean 22 153 145 357 677 13 4 28 325 370 SE 14 66 83 148 68 9 3 18 108 95
2060 TB9c Mean — — — — — — — — — — SE — — — — — — — — — — 50BAd Mean 7 59 35 558 659 2 4 44 241 290 SE 4 59 22 145 115 1 4 32 45 25
2090 TB9c Mean — — — — — — — — — — SE — — — — — — — — — — 50BAd Mean 8 0 0 459 467 6 19 2 243 269 SE 3 0 0 75 70 4 18 2 32 13a Rx = treatment. b TB9= thin from below to 9 inches diameter at breast height.c SE = standard error (+/- ).d 50BA = thin from below to 50 percent of basal area.— = no data.
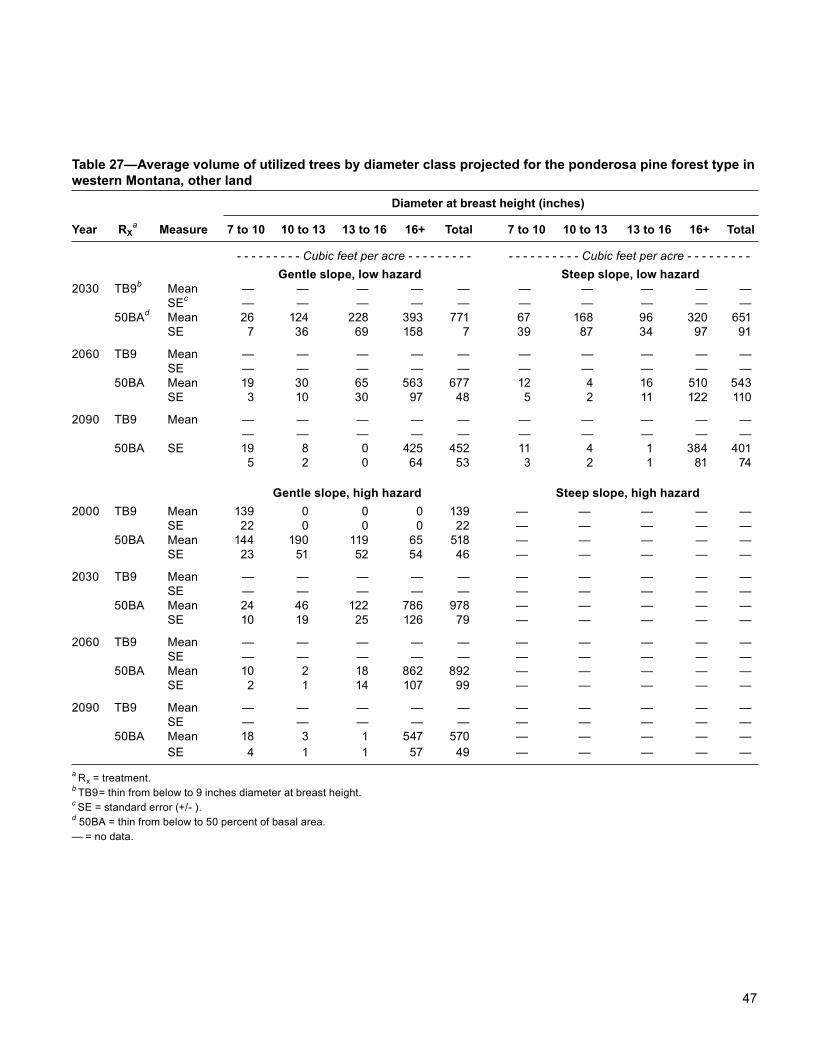
47
Table 27—Average volume of utilized trees by diameter class projected for the ponderosa pine forest type in western Montana, other land Diameter at breast height (inches)
Year RXa Measure 7 to 10 10 to 13 13 to 16 16+ Total 7 to 10 10 to 13 13 to 16 16+ Total
- - - - - - - - - Cubic feet per acre - - - - - - - - - - - - - - - - - - - Cubic feet per acre - - - - - - - - - Gentle slope, low hazard Steep slope, low hazard2030 TB9b Mean — — — — — — — — — — SEc — — — — — — — — — — 50BAd Mean 26 124 228 393 771 67 168 96 320 651 SE 7 36 69 158 7 39 87 34 97 91
2060 TB9 Mean — — — — — — — — — — SE — — — — — — — — — — 50BA Mean 19 30 65 563 677 12 4 16 510 543 SE 3 10 30 97 48 5 2 11 122 110
2090 TB9 Mean — — — — — — — — — — — — — — — — — — — — 50BA SE 19 8 0 425 452 11 4 1 384 401 5 2 0 64 53 3 2 1 81 74
Gentle slope, high hazard Steep slope, high hazard2000 TB9 Mean 139 0 0 0 139 — — — — — SE 22 0 0 0 22 — — — — — 50BA Mean 144 190 119 65 518 — — — — — SE 23 51 52 54 46 — — — — —
2030 TB9 Mean — — — — — — — — — — SE — — — — — — — — — — 50BA Mean 24 46 122 786 978 — — — — — SE 10 19 25 126 79 — — — — —
2060 TB9 Mean — — — — — — — — — — SE — — — — — — — — — — 50BA Mean 10 2 18 862 892 — — — — — SE 2 1 14 107 99 — — — — —
2090 TB9 Mean — — — — — — — — — — SE — — — — — — — — — — 50BA Mean 18 3 1 547 570 — — — — — SE 4 1 1 57 49 — — — — —a Rx = treatment. b TB9= thin from below to 9 inches diameter at breast height.c SE = standard error (+/- ).d 50BA = thin from below to 50 percent of basal area.— = no data.
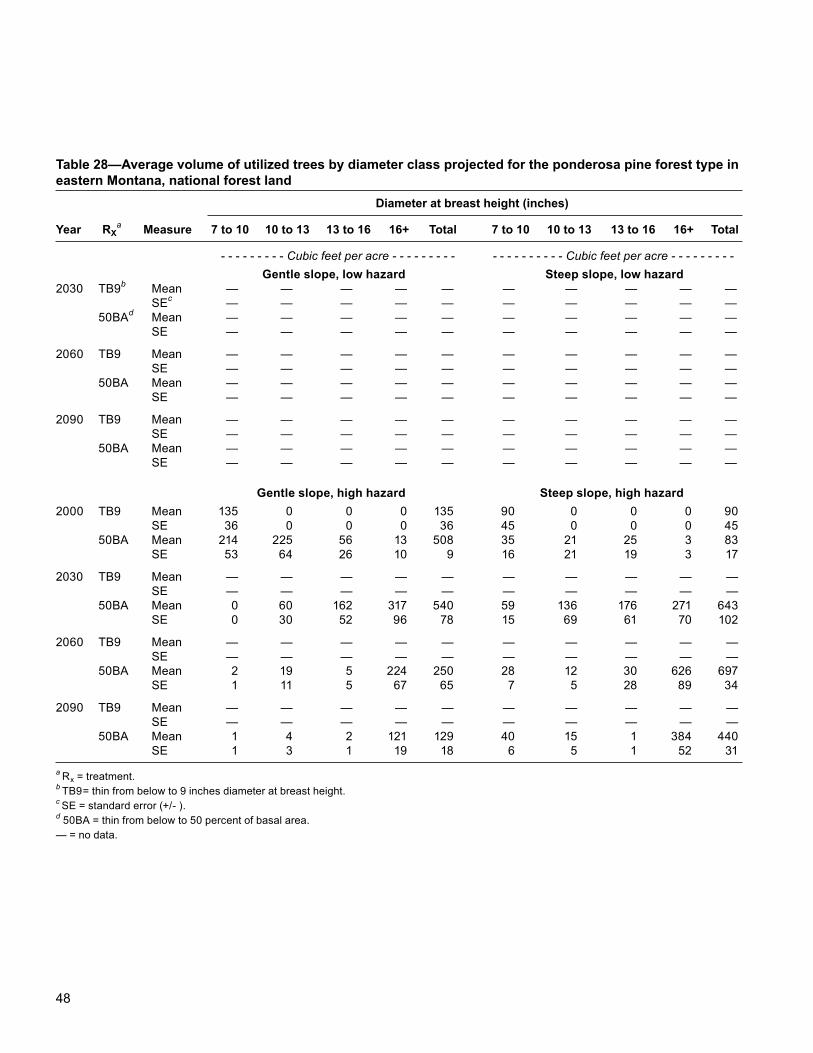
48
Table 28—Average volume of utilized trees by diameter class projected for the ponderosa pine forest type in eastern Montana, national forest land Diameter at breast height (inches)
Year RXa Measure 7 to 10 10 to 13 13 to 16 16+ Total 7 to 10 10 to 13 13 to 16 16+ Total
- - - - - - - - - Cubic feet per acre - - - - - - - - - - - - - - - - - - - Cubic feet per acre - - - - - - - - - Gentle slope, low hazard Steep slope, low hazard2030 TB9b Mean — — — — — — — — — — SEc — — — — — — — — — — 50BAd Mean — — — — — — — — — — SE — — — — — — — — — —
2060 TB9 Mean — — — — — — — — — — SE — — — — — — — — — — 50BA Mean — — — — — — — — — — SE — — — — — — — — — —
2090 TB9 Mean — — — — — — — — — — SE — — — — — — — — — — 50BA Mean — — — — — — — — — — SE — — — — — — — — — —
Gentle slope, high hazard Steep slope, high hazard2000 TB9 Mean 135 0 0 0 135 90 0 0 0 90 SE 36 0 0 0 36 45 0 0 0 45 50BA Mean 214 225 56 13 508 35 21 25 3 83 SE 53 64 26 10 9 16 21 19 3 17
2030 TB9 Mean — — — — — — — — — — SE — — — — — — — — — — 50BA Mean 0 60 162 317 540 59 136 176 271 643 SE 0 30 52 96 78 15 69 61 70 102
2060 TB9 Mean — — — — — — — — — — SE — — — — — — — — — — 50BA Mean 2 19 5 224 250 28 12 30 626 697 SE 1 11 5 67 65 7 5 28 89 34
2090 TB9 Mean — — — — — — — — — — SE — — — — — — — — — — 50BA Mean 1 4 2 121 129 40 15 1 384 440 SE 1 3 1 19 18 6 5 1 52 31a Rx = treatment. b TB9= thin from below to 9 inches diameter at breast height.c SE = standard error (+/- ).d 50BA = thin from below to 50 percent of basal area.— = no data.
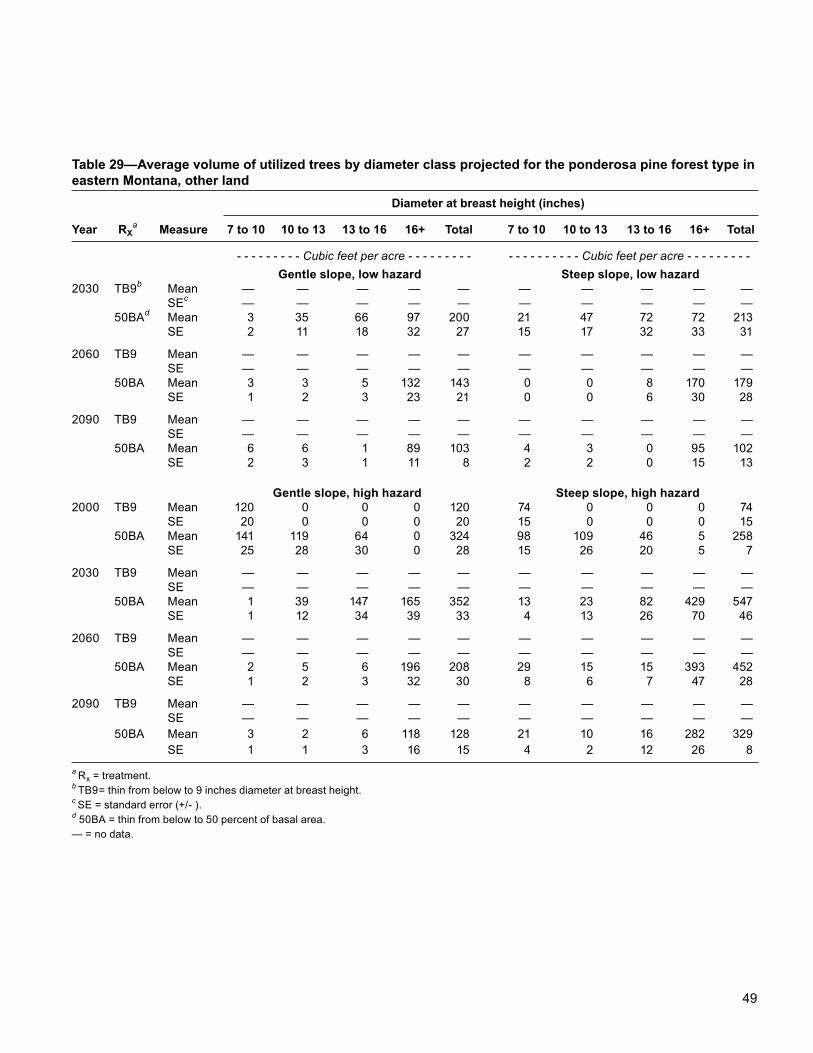
49
Table 29—Average volume of utilized trees by diameter class projected for the ponderosa pine forest type in eastern Montana, other land Diameter at breast height (inches)
Year RXa Measure 7 to 10 10 to 13 13 to 16 16+ Total 7 to 10 10 to 13 13 to 16 16+ Total
- - - - - - - - - Cubic feet per acre - - - - - - - - - - - - - - - - - - - Cubic feet per acre - - - - - - - - - Gentle slope, low hazard Steep slope, low hazard2030 TB9b Mean — — — — — — — — — — SEc — — — — — — — — — — 50BAd Mean 3 35 66 97 200 21 47 72 72 213 SE 2 11 18 32 27 15 17 32 33 31
2060 TB9 Mean — — — — — — — — — — SE — — — — — — — — — — 50BA Mean 3 3 5 132 143 0 0 8 170 179 SE 1 2 3 23 21 0 0 6 30 28
2090 TB9 Mean — — — — — — — — — — SE — — — — — — — — — — 50BA Mean 6 6 1 89 103 4 3 0 95 102 SE 2 3 1 11 8 2 2 0 15 13
Gentle slope, high hazard Steep slope, high hazard2000 TB9 Mean 120 0 0 0 120 74 0 0 0 74 SE 20 0 0 0 20 15 0 0 0 15 50BA Mean 141 119 64 0 324 98 109 46 5 258 SE 25 28 30 0 28 15 26 20 5 7
2030 TB9 Mean — — — — — — — — — — SE — — — — — — — — — — 50BA Mean 1 39 147 165 352 13 23 82 429 547 SE 1 12 34 39 33 4 13 26 70 46
2060 TB9 Mean — — — — — — — — — — SE — — — — — — — — — — 50BA Mean 2 5 6 196 208 29 15 15 393 452 SE 1 2 3 32 30 8 6 7 47 28
2090 TB9 Mean — — — — — — — — — — SE — — — — — — — — — — 50BA Mean 3 2 6 118 128 21 10 16 282 329 SE 1 1 3 16 15 4 2 12 26 8a Rx = treatment. b TB9= thin from below to 9 inches diameter at breast height.c SE = standard error (+/- ).d 50BA = thin from below to 50 percent of basal area.— = no data.
50
Volumes for trees in the 1- to <4-in and 4- to <7-in diameter at breast height classes are reported in this appendix. These biomass volumes are total tree volume estimates taken directly from the Forest Vegetation Simulation model. Unutilized tree volumes are reported to provide information on the total amount of bole wood biomass that needs to be processed to accomplish the fuel reduction treatment. This material is generally too small to be handled commercially, but occasionally price spikes in either hog fuel or pulp chips make removal of some of these trees financially viable. Also, as new technologies arise, alternative uses might be found for these trees, so information on their volume is useful for planning (tables 30 through 37).
Appendix 6: Average Volume of Unutilized Trees
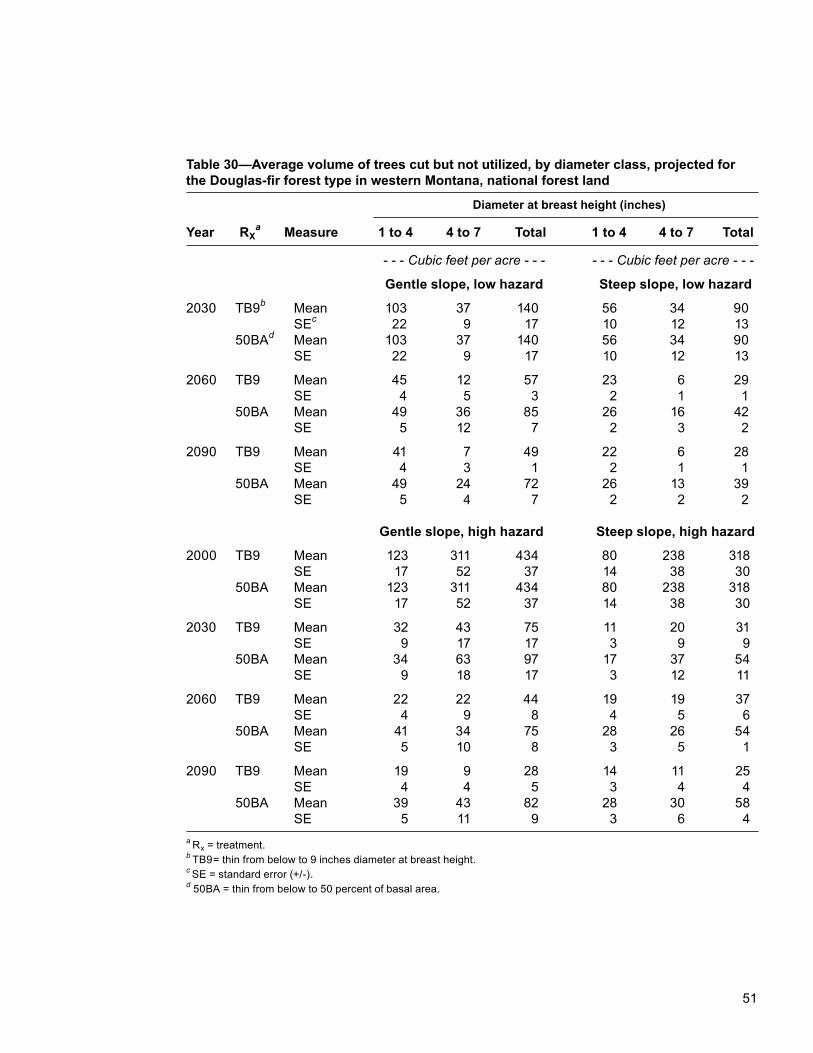
51
Table 30—Average volume of trees cut but not utilized, by diameter class, projected for the Douglas-fir forest type in western Montana, national forest land
Diameter at breast height (inches)
Year RXa Measure 1 to 4 4 to 7 Total 1 to 4 4 to 7 Total
- - - Cubic feet per acre - - - - - - Cubic feet per acre - - -
Gentle slope, low hazard Steep slope, low hazard
2030 TB9b Mean 103 37 140 56 34 90 SEc 22 9 17 10 12 13 50BAd Mean 103 37 140 56 34 90 SE 22 9 17 10 12 13
2060 TB9 Mean 45 12 57 23 6 29 SE 4 5 3 2 1 1 50BA Mean 49 36 85 26 16 42 SE 5 12 7 2 3 2
2090 TB9 Mean 41 7 49 22 6 28 SE 4 3 1 2 1 1 50BA Mean 49 24 72 26 13 39 SE 5 4 7 2 2 2
Gentle slope, high hazard Steep slope, high hazard
2000 TB9 Mean 123 311 434 80 238 318 SE 17 52 37 14 38 30 50BA Mean 123 311 434 80 238 318 SE 17 52 37 14 38 30
2030 TB9 Mean 32 43 75 11 20 31 SE 9 17 17 3 9 9 50BA Mean 34 63 97 17 37 54 SE 9 18 17 3 12 11
2060 TB9 Mean 22 22 44 19 19 37 SE 4 9 8 4 5 6 50BA Mean 41 34 75 28 26 54 SE 5 10 8 3 5 1
2090 TB9 Mean 19 9 28 14 11 25 SE 4 4 5 3 4 4 50BA Mean 39 43 82 28 30 58 SE 5 11 9 3 6 4a Rx = treatment.b TB9= thin from below to 9 inches diameter at breast height.c SE = standard error (+/-).d 50BA = thin from below to 50 percent of basal area.
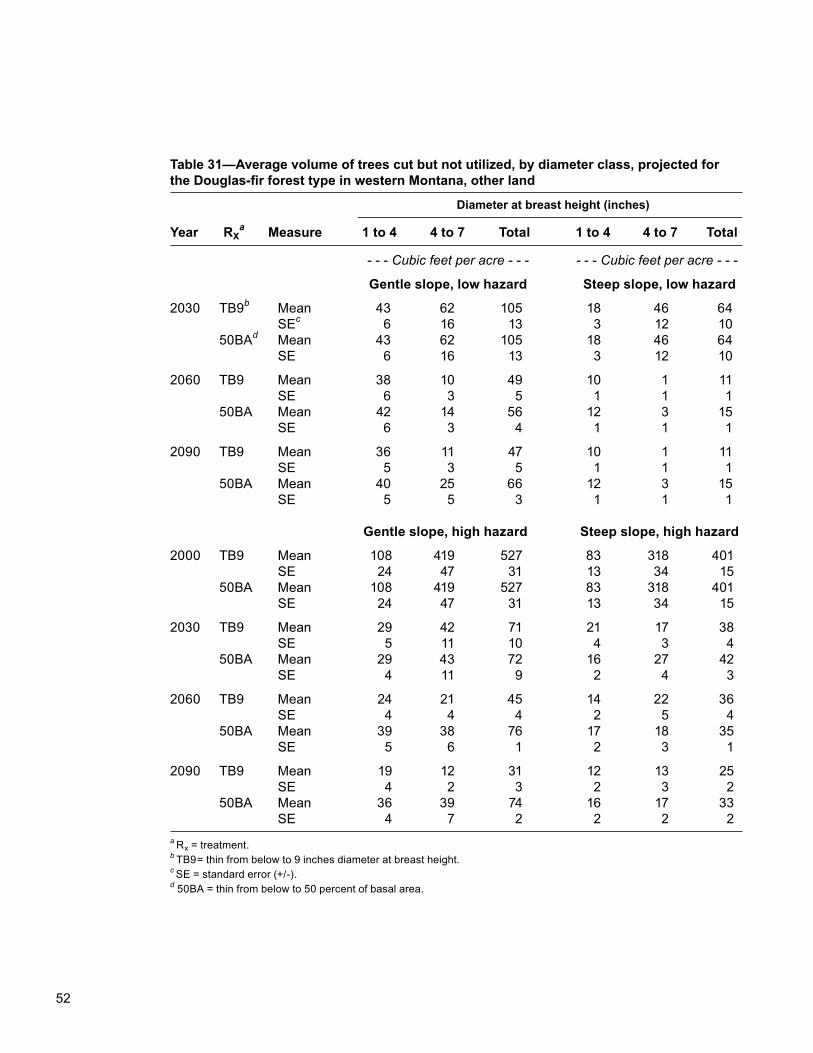
52
Table 31—Average volume of trees cut but not utilized, by diameter class, projected for the Douglas-fir forest type in western Montana, other land
Diameter at breast height (inches)
Year RXa Measure 1 to 4 4 to 7 Total 1 to 4 4 to 7 Total
- - - Cubic feet per acre - - - - - - Cubic feet per acre - - -
Gentle slope, low hazard Steep slope, low hazard
2030 TB9b Mean 43 62 105 18 46 64 SEc 6 16 13 3 12 10 50BAd Mean 43 62 105 18 46 64 SE 6 16 13 3 12 10
2060 TB9 Mean 38 10 49 10 1 11 SE 6 3 5 1 1 1 50BA Mean 42 14 56 12 3 15 SE 6 3 4 1 1 1
2090 TB9 Mean 36 11 47 10 1 11 SE 5 3 5 1 1 1 50BA Mean 40 25 66 12 3 15 SE 5 5 3 1 1 1
Gentle slope, high hazard Steep slope, high hazard
2000 TB9 Mean 108 419 527 83 318 401 SE 24 47 31 13 34 15 50BA Mean 108 419 527 83 318 401 SE 24 47 31 13 34 15
2030 TB9 Mean 29 42 71 21 17 38 SE 5 11 10 4 3 4 50BA Mean 29 43 72 16 27 42 SE 4 11 9 2 4 3
2060 TB9 Mean 24 21 45 14 22 36 SE 4 4 4 2 5 4 50BA Mean 39 38 76 17 18 35 SE 5 6 1 2 3 1
2090 TB9 Mean 19 12 31 12 13 25 SE 4 2 3 2 3 2 50BA Mean 36 39 74 16 17 33 SE 4 7 2 2 2 2a Rx = treatment.b TB9= thin from below to 9 inches diameter at breast height.c SE = standard error (+/-).d 50BA = thin from below to 50 percent of basal area.
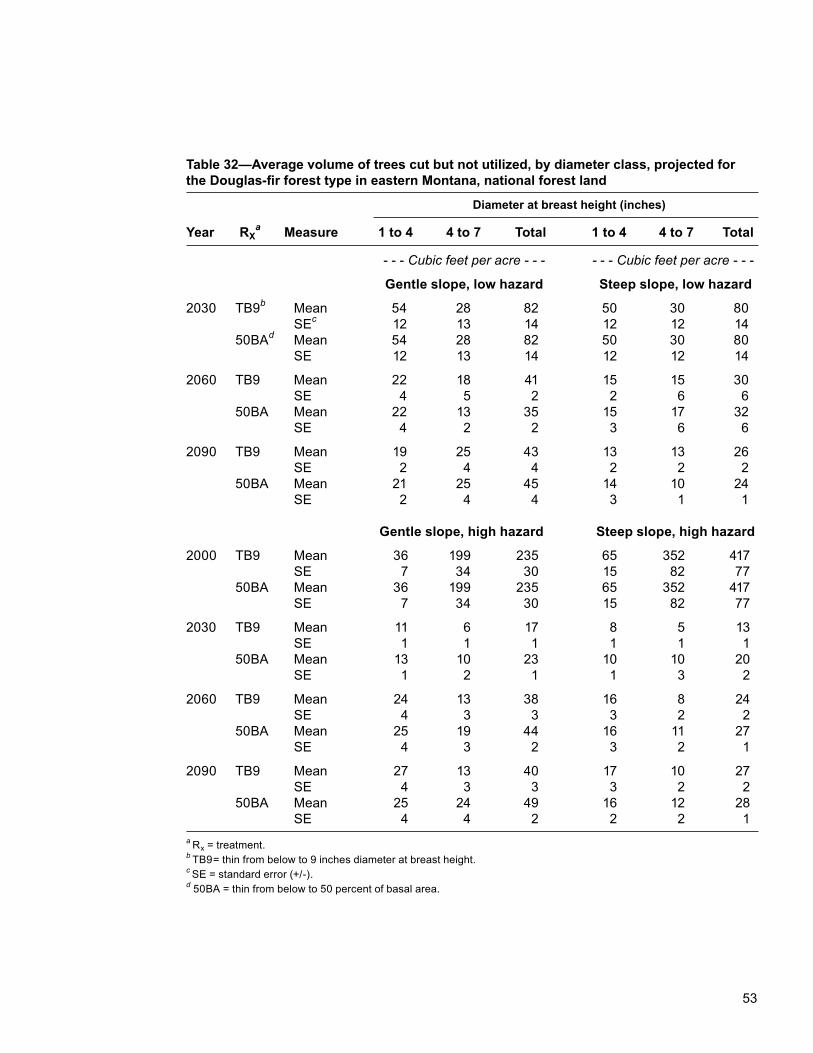
53
Table 32—Average volume of trees cut but not utilized, by diameter class, projected for the Douglas-fir forest type in eastern Montana, national forest land
Diameter at breast height (inches)
Year RXa Measure 1 to 4 4 to 7 Total 1 to 4 4 to 7 Total
- - - Cubic feet per acre - - - - - - Cubic feet per acre - - -
Gentle slope, low hazard Steep slope, low hazard
2030 TB9b Mean 54 28 82 50 30 80 SEc 12 13 14 12 12 14 50BAd Mean 54 28 82 50 30 80 SE 12 13 14 12 12 14
2060 TB9 Mean 22 18 41 15 15 30 SE 4 5 2 2 6 6 50BA Mean 22 13 35 15 17 32 SE 4 2 2 3 6 6
2090 TB9 Mean 19 25 43 13 13 26 SE 2 4 4 2 2 2 50BA Mean 21 25 45 14 10 24 SE 2 4 4 3 1 1
Gentle slope, high hazard Steep slope, high hazard
2000 TB9 Mean 36 199 235 65 352 417 SE 7 34 30 15 82 77 50BA Mean 36 199 235 65 352 417 SE 7 34 30 15 82 77
2030 TB9 Mean 11 6 17 8 5 13 SE 1 1 1 1 1 1 50BA Mean 13 10 23 10 10 20 SE 1 2 1 1 3 2
2060 TB9 Mean 24 13 38 16 8 24 SE 4 3 3 3 2 2 50BA Mean 25 19 44 16 11 27 SE 4 3 2 3 2 1
2090 TB9 Mean 27 13 40 17 10 27 SE 4 3 3 3 2 2 50BA Mean 25 24 49 16 12 28 SE 4 4 2 2 2 1a Rx = treatment.b TB9= thin from below to 9 inches diameter at breast height.c SE = standard error (+/-).d 50BA = thin from below to 50 percent of basal area.
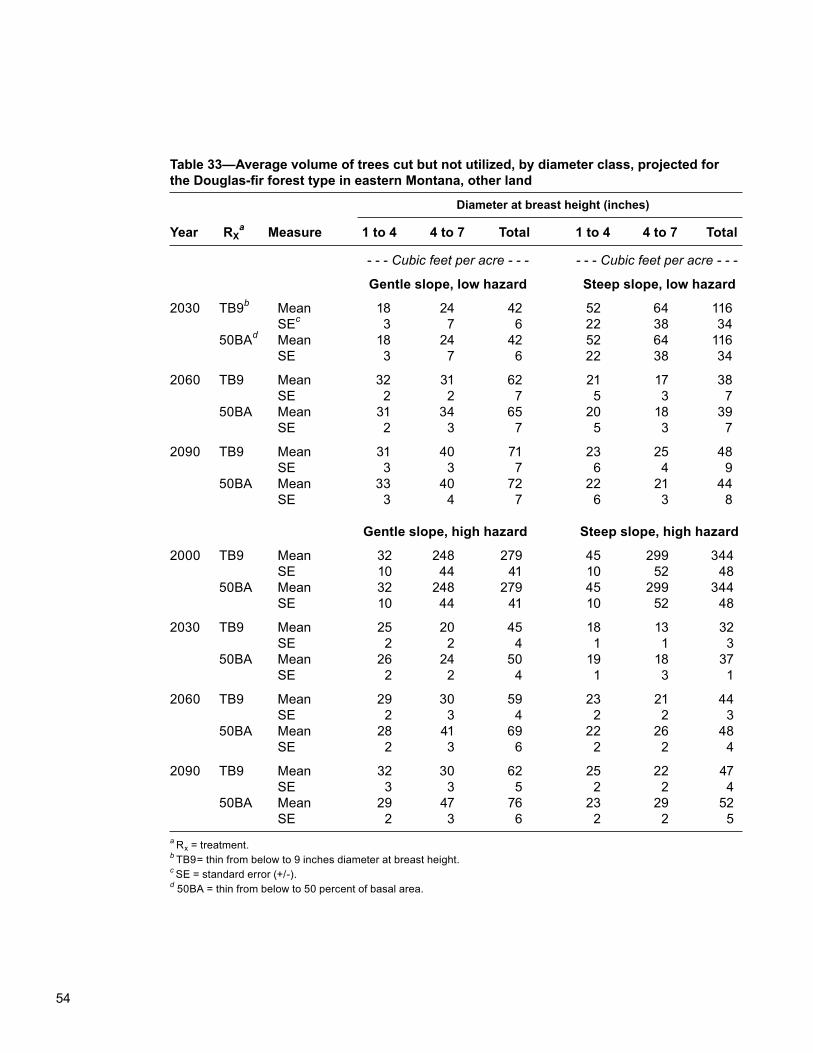
54
Table 33—Average volume of trees cut but not utilized, by diameter class, projected for the Douglas-fir forest type in eastern Montana, other land
Diameter at breast height (inches)
Year RXa Measure 1 to 4 4 to 7 Total 1 to 4 4 to 7 Total
- - - Cubic feet per acre - - - - - - Cubic feet per acre - - -
Gentle slope, low hazard Steep slope, low hazard
2030 TB9b Mean 18 24 42 52 64 116 SEc 3 7 6 22 38 34 50BAd Mean 18 24 42 52 64 116 SE 3 7 6 22 38 34
2060 TB9 Mean 32 31 62 21 17 38 SE 2 2 7 5 3 7 50BA Mean 31 34 65 20 18 39 SE 2 3 7 5 3 7
2090 TB9 Mean 31 40 71 23 25 48 SE 3 3 7 6 4 9 50BA Mean 33 40 72 22 21 44 SE 3 4 7 6 3 8
Gentle slope, high hazard Steep slope, high hazard
2000 TB9 Mean 32 248 279 45 299 344 SE 10 44 41 10 52 48 50BA Mean 32 248 279 45 299 344 SE 10 44 41 10 52 48
2030 TB9 Mean 25 20 45 18 13 32 SE 2 2 4 1 1 3 50BA Mean 26 24 50 19 18 37 SE 2 2 4 1 3 1
2060 TB9 Mean 29 30 59 23 21 44 SE 2 3 4 2 2 3 50BA Mean 28 41 69 22 26 48 SE 2 3 6 2 2 4
2090 TB9 Mean 32 30 62 25 22 47 SE 3 3 5 2 2 4 50BA Mean 29 47 76 23 29 52 SE 2 3 6 2 2 5a Rx = treatment.b TB9= thin from below to 9 inches diameter at breast height.c SE = standard error (+/-).d 50BA = thin from below to 50 percent of basal area.
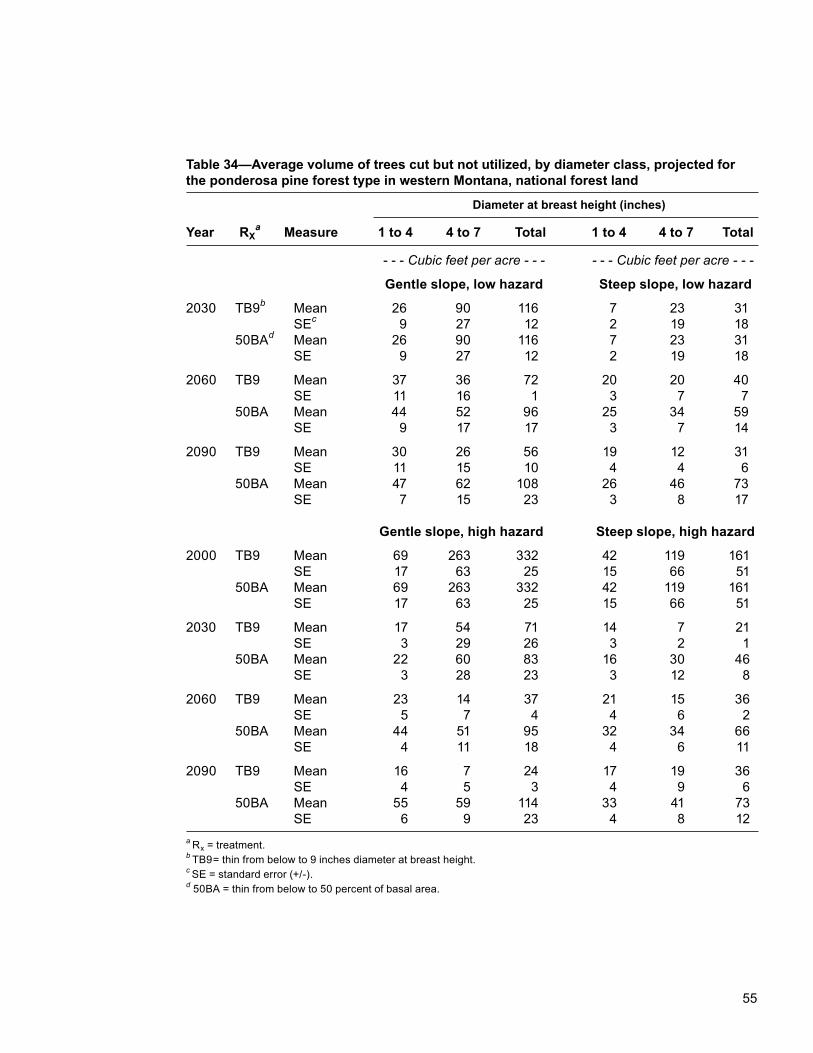
55
Table 34—Average volume of trees cut but not utilized, by diameter class, projected for the ponderosa pine forest type in western Montana, national forest land
Diameter at breast height (inches)
Year RXa Measure 1 to 4 4 to 7 Total 1 to 4 4 to 7 Total
- - - Cubic feet per acre - - - - - - Cubic feet per acre - - -
Gentle slope, low hazard Steep slope, low hazard
2030 TB9b Mean 26 90 116 7 23 31 SEc 9 27 12 2 19 18 50BAd Mean 26 90 116 7 23 31 SE 9 27 12 2 19 18
2060 TB9 Mean 37 36 72 20 20 40 SE 11 16 1 3 7 7 50BA Mean 44 52 96 25 34 59 SE 9 17 17 3 7 14
2090 TB9 Mean 30 26 56 19 12 31 SE 11 15 10 4 4 6 50BA Mean 47 62 108 26 46 73 SE 7 15 23 3 8 17
Gentle slope, high hazard Steep slope, high hazard
2000 TB9 Mean 69 263 332 42 119 161 SE 17 63 25 15 66 51 50BA Mean 69 263 332 42 119 161 SE 17 63 25 15 66 51
2030 TB9 Mean 17 54 71 14 7 21 SE 3 29 26 3 2 1 50BA Mean 22 60 83 16 30 46 SE 3 28 23 3 12 8
2060 TB9 Mean 23 14 37 21 15 36 SE 5 7 4 4 6 2 50BA Mean 44 51 95 32 34 66 SE 4 11 18 4 6 11
2090 TB9 Mean 16 7 24 17 19 36 SE 4 5 3 4 9 6 50BA Mean 55 59 114 33 41 73 SE 6 9 23 4 8 12a Rx = treatment.b TB9= thin from below to 9 inches diameter at breast height.c SE = standard error (+/-).d 50BA = thin from below to 50 percent of basal area.
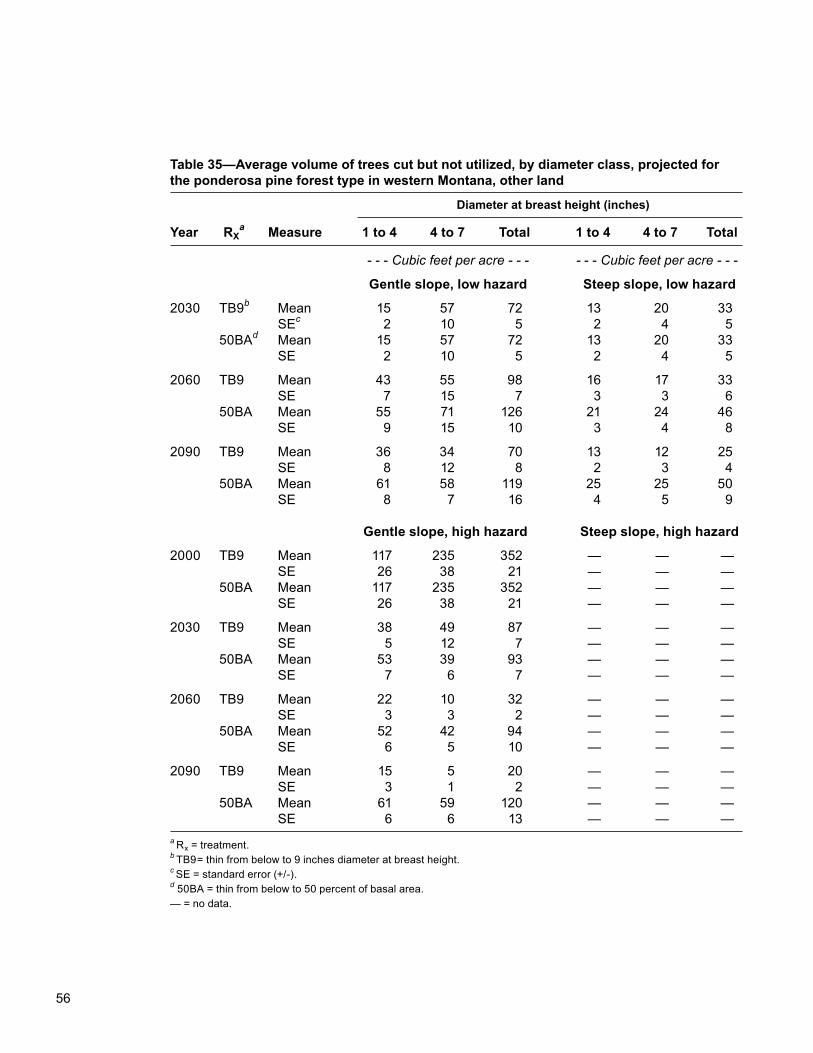
56
Table 35—Average volume of trees cut but not utilized, by diameter class, projected for the ponderosa pine forest type in western Montana, other land
Diameter at breast height (inches)
Year RXa Measure 1 to 4 4 to 7 Total 1 to 4 4 to 7 Total
- - - Cubic feet per acre - - - - - - Cubic feet per acre - - -
Gentle slope, low hazard Steep slope, low hazard
2030 TB9b Mean 15 57 72 13 20 33 SEc 2 10 5 2 4 5 50BAd Mean 15 57 72 13 20 33 SE 2 10 5 2 4 5
2060 TB9 Mean 43 55 98 16 17 33 SE 7 15 7 3 3 6 50BA Mean 55 71 126 21 24 46 SE 9 15 10 3 4 8
2090 TB9 Mean 36 34 70 13 12 25 SE 8 12 8 2 3 4 50BA Mean 61 58 119 25 25 50 SE 8 7 16 4 5 9
Gentle slope, high hazard Steep slope, high hazard
2000 TB9 Mean 117 235 352 — — — SE 26 38 21 — — — 50BA Mean 117 235 352 — — — SE 26 38 21 — — —
2030 TB9 Mean 38 49 87 — — — SE 5 12 7 — — — 50BA Mean 53 39 93 — — — SE 7 6 7 — — —
2060 TB9 Mean 22 10 32 — — — SE 3 3 2 — — — 50BA Mean 52 42 94 — — — SE 6 5 10 — — —
2090 TB9 Mean 15 5 20 — — — SE 3 1 2 — — — 50BA Mean 61 59 120 — — — SE 6 6 13 — — —a Rx = treatment.b TB9= thin from below to 9 inches diameter at breast height.c SE = standard error (+/-).d 50BA = thin from below to 50 percent of basal area.— = no data.
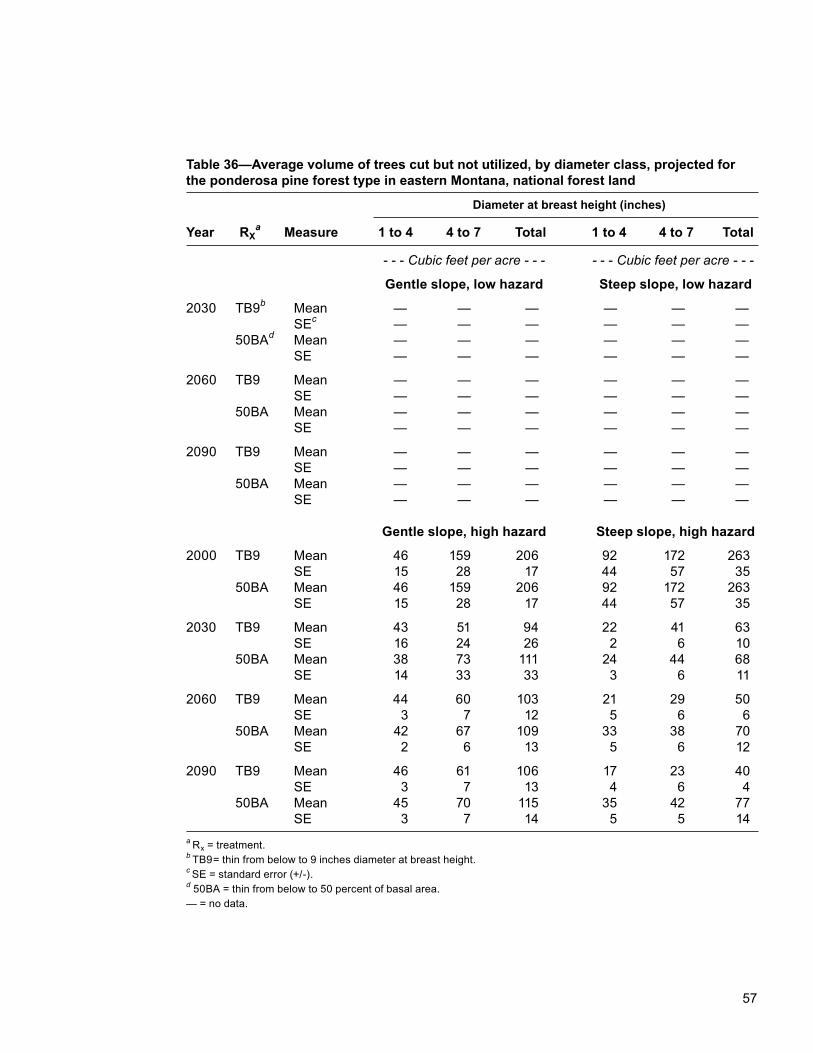
57
Table 36—Average volume of trees cut but not utilized, by diameter class, projected for the ponderosa pine forest type in eastern Montana, national forest land
Diameter at breast height (inches)
Year RXa Measure 1 to 4 4 to 7 Total 1 to 4 4 to 7 Total
- - - Cubic feet per acre - - - - - - Cubic feet per acre - - -
Gentle slope, low hazard Steep slope, low hazard
2030 TB9b Mean — — — — — — SEc — — — — — — 50BAd Mean — — — — — — SE — — — — — —
2060 TB9 Mean — — — — — — SE — — — — — — 50BA Mean — — — — — — SE — — — — — —
2090 TB9 Mean — — — — — — SE — — — — — — 50BA Mean — — — — — — SE — — — — — —
Gentle slope, high hazard Steep slope, high hazard
2000 TB9 Mean 46 159 206 92 172 263 SE 15 28 17 44 57 35 50BA Mean 46 159 206 92 172 263 SE 15 28 17 44 57 35
2030 TB9 Mean 43 51 94 22 41 63 SE 16 24 26 2 6 10 50BA Mean 38 73 111 24 44 68 SE 14 33 33 3 6 11
2060 TB9 Mean 44 60 103 21 29 50 SE 3 7 12 5 6 6 50BA Mean 42 67 109 33 38 70 SE 2 6 13 5 6 12
2090 TB9 Mean 46 61 106 17 23 40 SE 3 7 13 4 6 4 50BA Mean 45 70 115 35 42 77 SE 3 7 14 5 5 14a Rx = treatment.b TB9= thin from below to 9 inches diameter at breast height.c SE = standard error (+/-).d 50BA = thin from below to 50 percent of basal area.— = no data.
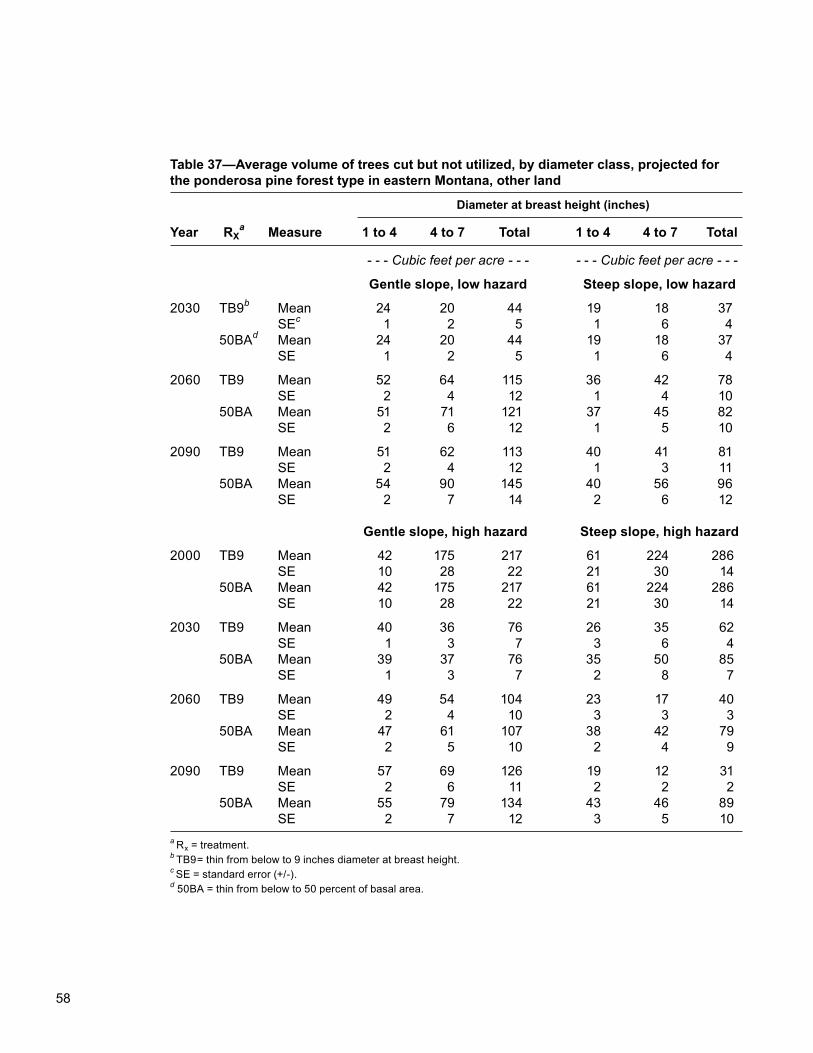
58
Table 37—Average volume of trees cut but not utilized, by diameter class, projected for the ponderosa pine forest type in eastern Montana, other land
Diameter at breast height (inches)
Year RXa Measure 1 to 4 4 to 7 Total 1 to 4 4 to 7 Total
- - - Cubic feet per acre - - - - - - Cubic feet per acre - - -
Gentle slope, low hazard Steep slope, low hazard
2030 TB9b Mean 24 20 44 19 18 37 SEc 1 2 5 1 6 4 50BAd Mean 24 20 44 19 18 37 SE 1 2 5 1 6 4
2060 TB9 Mean 52 64 115 36 42 78 SE 2 4 12 1 4 10 50BA Mean 51 71 121 37 45 82 SE 2 6 12 1 5 10
2090 TB9 Mean 51 62 113 40 41 81 SE 2 4 12 1 3 11 50BA Mean 54 90 145 40 56 96 SE 2 7 14 2 6 12
Gentle slope, high hazard Steep slope, high hazard
2000 TB9 Mean 42 175 217 61 224 286 SE 10 28 22 21 30 14 50BA Mean 42 175 217 61 224 286 SE 10 28 22 21 30 14
2030 TB9 Mean 40 36 76 26 35 62 SE 1 3 7 3 6 4 50BA Mean 39 37 76 35 50 85 SE 1 3 7 2 8 7
2060 TB9 Mean 49 54 104 23 17 40 SE 2 4 10 3 3 3 50BA Mean 47 61 107 38 42 79 SE 2 5 10 2 4 9
2090 TB9 Mean 57 69 126 19 12 31 SE 2 6 11 2 2 2 50BA Mean 55 79 134 43 46 89 SE 2 7 12 3 5 10a Rx = treatment.b TB9= thin from below to 9 inches diameter at breast height.c SE = standard error (+/-).d 50BA = thin from below to 50 percent of basal area.
59
Information on average sawlog size is reported in this appendix. These data provide millowners with information on how the size of logs generated from fuel reduction treatments might be expected to change over time. Tables 38 and 39 show the aver-age small-end diameter (SED) of logs removed during treatments, by entry. The SEDs of individual logs are output from Financial Evaluation of Ecosystem Management Activities (FEEMA) weighted by volume and plot expansion factor. The minimum diam-eter log included in FEEMA output is 5 in. All tree species are combined.
Appendix 7: Average Small-End Diameter of Utilized Logs
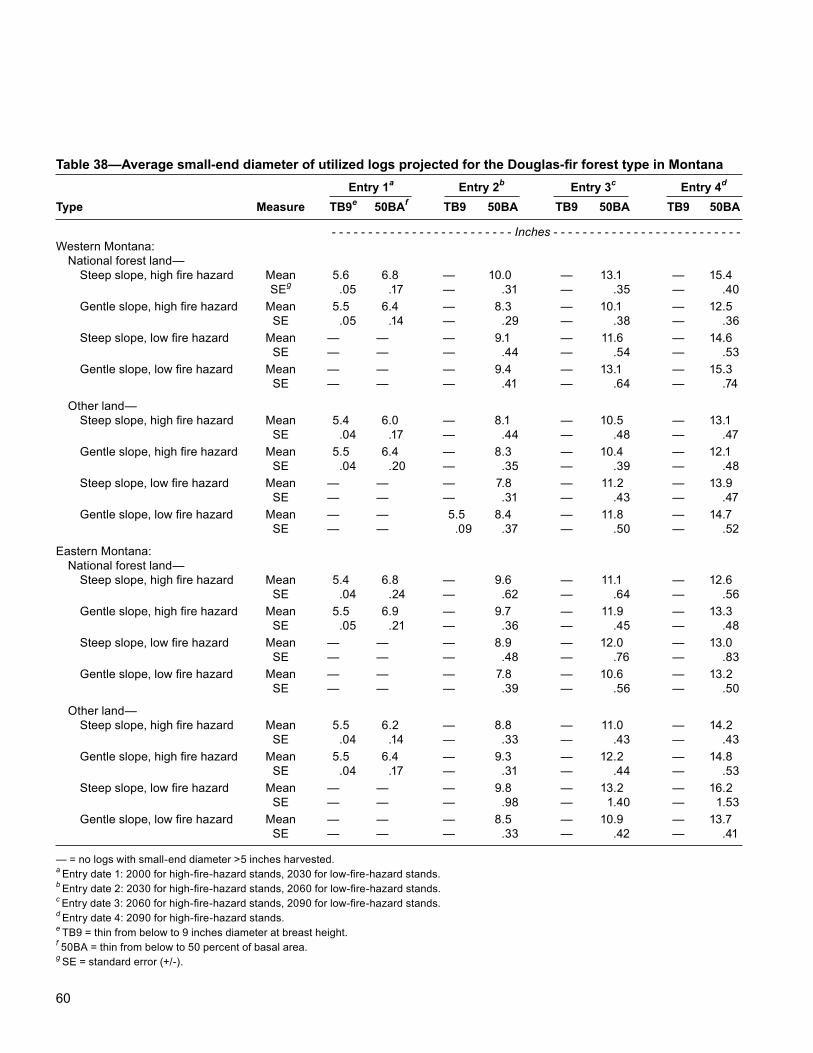
60
Table 38—Average small-end diameter of utilized logs projected for the Douglas-fir forest type in Montana Entry 1a Entry 2b Entry 3c Entry 4d
Type Measure TB9e 50BAf TB9 50BA TB9 50BA TB9 50BA
- - - - - - - - - - - - - - - - - - - - - - - - - Inches - - - - - - - - - - - - - - - - - - - - - - - - - -Western Montana: National forest land— Steep slope, high fire hazard Mean 5.6 6.8 — 10.0 — 13.1 — 15.4 SEg .05 .17 — .31 — .35 — .40 Gentle slope, high fire hazard Mean 5.5 6.4 — 8.3 — 10.1 — 12.5 SE .05 .14 — .29 — .38 — .36 Steep slope, low fire hazard Mean — — — 9.1 — 11.6 — 14.6 SE — — — .44 — .54 — .53 Gentle slope, low fire hazard Mean — — — 9.4 — 13.1 — 15.3 SE — — — .41 — .64 — .74
Other land— Steep slope, high fire hazard Mean 5.4 6.0 — 8.1 — 10.5 — 13.1 SE .04 .17 — .44 — .48 — .47 Gentle slope, high fire hazard Mean 5.5 6.4 — 8.3 — 10.4 — 12.1 SE .04 .20 — .35 — .39 — .48 Steep slope, low fire hazard Mean — — — 7.8 — 11.2 — 13.9 SE — — — .31 — .43 — .47 Gentle slope, low fire hazard Mean — — 5.5 8.4 — 11.8 — 14.7 SE — — .09 .37 — .50 — .52
Eastern Montana: National forest land— Steep slope, high fire hazard Mean 5.4 6.8 — 9.6 — 11.1 — 12.6 SE .04 .24 — .62 — .64 — .56 Gentle slope, high fire hazard Mean 5.5 6.9 — 9.7 — 11.9 — 13.3 SE .05 .21 — .36 — .45 — .48 Steep slope, low fire hazard Mean — — — 8.9 — 12.0 — 13.0 SE — — — .48 — .76 — .83 Gentle slope, low fire hazard Mean — — — 7.8 — 10.6 — 13.2 SE — — — .39 — .56 — .50
Other land— Steep slope, high fire hazard Mean 5.5 6.2 — 8.8 — 11.0 — 14.2 SE .04 .14 — .33 — .43 — .43 Gentle slope, high fire hazard Mean 5.5 6.4 — 9.3 — 12.2 — 14.8 SE .04 .17 — .31 — .44 — .53 Steep slope, low fire hazard Mean — — — 9.8 — 13.2 — 16.2 SE — — — .98 — 1.40 — 1.53 Gentle slope, low fire hazard Mean — — — 8.5 — 10.9 — 13.7 SE — — — .33 — .42 — .41
— = no logs with small-end diameter >5 inches harvested. a Entry date 1: 2000 for high-fire-hazard stands, 2030 for low-fire-hazard stands.b Entry date 2: 2030 for high-fire-hazard stands, 2060 for low-fire-hazard stands.c Entry date 3: 2060 for high-fire-hazard stands, 2090 for low-fire-hazard stands.d Entry date 4: 2090 for high-fire-hazard stands.e TB9 = thin from below to 9 inches diameter at breast height.f 50BA = thin from below to 50 percent of basal area.g SE = standard error (+/-).
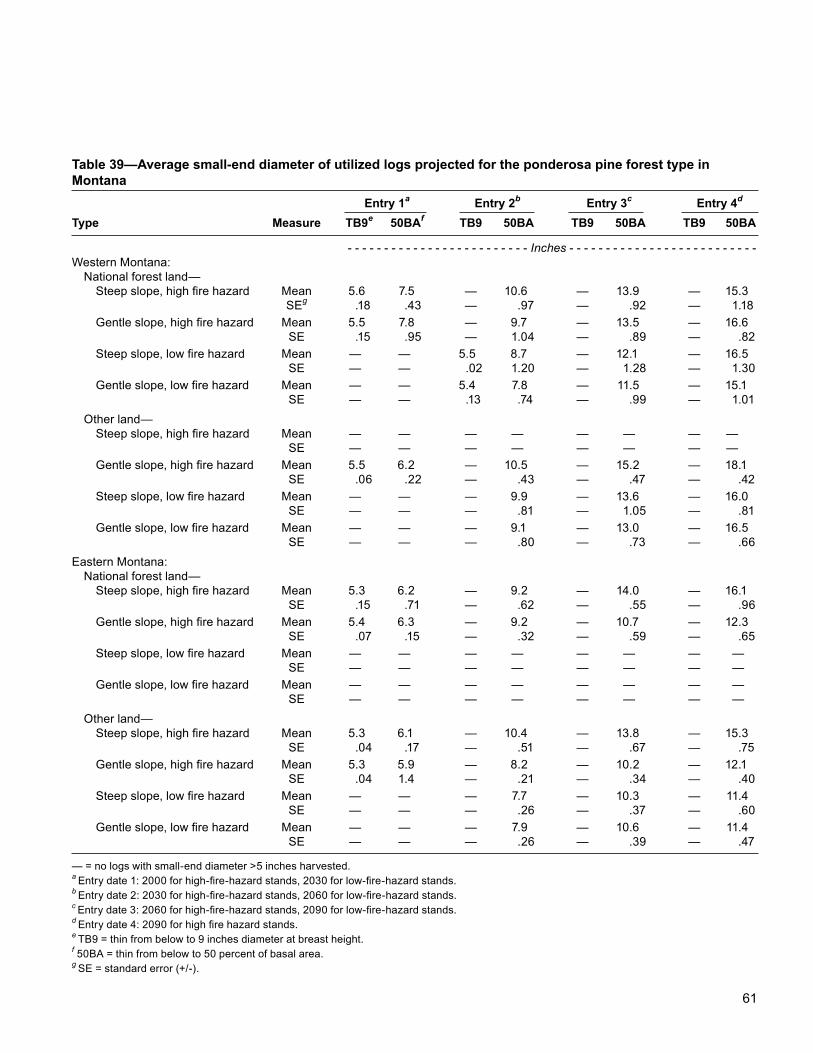
61
Table 39—Average small-end diameter of utilized logs projected for the ponderosa pine forest type in Montana Entry 1a Entry 2b Entry 3c Entry 4d
Type Measure TB9e 50BAf TB9 50BA TB9 50BA TB9 50BA
- - - - - - - - - - - - - - - - - - - - - - - - - Inches - - - - - - - - - - - - - - - - - - - - - - - - - -Western Montana: National forest land— Steep slope, high fire hazard Mean 5.6 7.5 — 10.6 — 13.9 — 15.3 SEg .18 .43 — .97 — .92 — 1.18 Gentle slope, high fire hazard Mean 5.5 7.8 — 9.7 — 13.5 — 16.6 SE .15 .95 — 1.04 — .89 — .82 Steep slope, low fire hazard Mean — — 5.5 8.7 — 12.1 — 16.5 SE — — .02 1.20 — 1.28 — 1.30 Gentle slope, low fire hazard Mean — — 5.4 7.8 — 11.5 — 15.1 SE — — .13 .74 — .99 — 1.01 Other land— Steep slope, high fire hazard Mean — — — — — — — — SE — — — — — — — — Gentle slope, high fire hazard Mean 5.5 6.2 — 10.5 — 15.2 — 18.1 SE .06 .22 — .43 — .47 — .42 Steep slope, low fire hazard Mean — — — 9.9 — 13.6 — 16.0 SE — — — .81 — 1.05 — .81 Gentle slope, low fire hazard Mean — — — 9.1 — 13.0 — 16.5 SE — — — .80 — .73 — .66Eastern Montana: National forest land— Steep slope, high fire hazard Mean 5.3 6.2 — 9.2 — 14.0 — 16.1 SE .15 .71 — .62 — .55 — .96 Gentle slope, high fire hazard Mean 5.4 6.3 — 9.2 — 10.7 — 12.3 SE .07 .15 — .32 — .59 — .65 Steep slope, low fire hazard Mean — — — — — — — — SE — — — — — — — — Gentle slope, low fire hazard Mean — — — — — — — — SE — — — — — — — — Other land— Steep slope, high fire hazard Mean 5.3 6.1 — 10.4 — 13.8 — 15.3 SE .04 .17 — .51 — .67 — .75 Gentle slope, high fire hazard Mean 5.3 5.9 — 8.2 — 10.2 — 12.1 SE .04 1.4 — .21 — .34 — .40 Steep slope, low fire hazard Mean — — — 7.7 — 10.3 — 11.4 SE — — — .26 — .37 — .60 Gentle slope, low fire hazard Mean — — — 7.9 — 10.6 — 11.4 SE — — — .26 — .39 — .47
— = no logs with small-end diameter >5 inches harvested. a Entry date 1: 2000 for high-fire-hazard stands, 2030 for low-fire-hazard stands.b Entry date 2: 2030 for high-fire-hazard stands, 2060 for low-fire-hazard stands.c Entry date 3: 2060 for high-fire-hazard stands, 2090 for low-fire-hazard stands.d Entry date 4: 2090 for high fire hazard stands.e TB9 = thin from below to 9 inches diameter at breast height.f 50BA = thin from below to 50 percent of basal area.g SE = standard error (+/-).
62
Appendix 8: Average Percentage of Volume, by Species, of Utilized Trees
Information presented in this appendix provides estimates of the species mix of logs removed during various treatment entries. The average percentage of volume in each of the three main groups, Douglas-fir/larch, ponderosa pine, and white woods, is displayed. Calculation is based on the average merchantable harvest volume (cubic feet/acre) from Financial Evaluation of Ecosystem Management Activities (FEEMA), weighted by the expansion factor (tables 40 through 47).
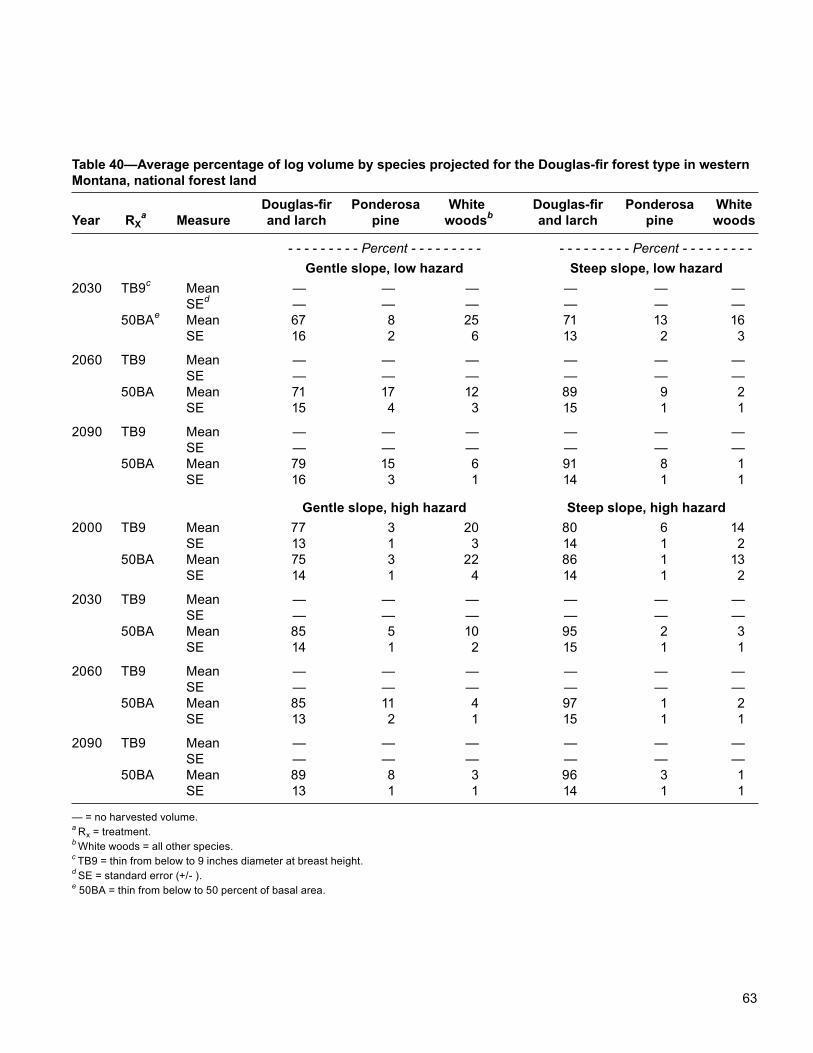
63
Table 40—Average percentage of log volume by species projected for the Douglas-fir forest type in western Montana, national forest land
Douglas-fir Ponderosa White Douglas-fir Ponderosa White Year RX
a Measure and larch pine woodsb and larch pine woods
- - - - - - - - - Percent - - - - - - - - - - - - - - - - - - Percent - - - - - - - - - Gentle slope, low hazard Steep slope, low hazard2030 TB9c Mean — — — — — — SEd — — — — — — 50BAe Mean 67 8 25 71 13 16 SE 16 2 6 13 2 3
2060 TB9 Mean — — — — — — SE — — — — — — 50BA Mean 71 17 12 89 9 2 SE 15 4 3 15 1 1
2090 TB9 Mean — — — — — — SE — — — — — — 50BA Mean 79 15 6 91 8 1 SE 16 3 1 14 1 1
Gentle slope, high hazard Steep slope, high hazard2000 TB9 Mean 77 3 20 80 6 14 SE 13 1 3 14 1 2 50BA Mean 75 3 22 86 1 13 SE 14 1 4 14 1 2
2030 TB9 Mean — — — — — — SE — — — — — — 50BA Mean 85 5 10 95 2 3 SE 14 1 2 15 1 1
2060 TB9 Mean — — — — — — SE — — — — — — 50BA Mean 85 11 4 97 1 2 SE 13 2 1 15 1 1
2090 TB9 Mean — — — — — — SE — — — — — — 50BA Mean 89 8 3 96 3 1 SE 13 1 1 14 1 1
— = no harvested volume.a Rx = treatment.b White woods = all other species.c TB9 = thin from below to 9 inches diameter at breast height.d SE = standard error (+/- ).e 50BA = thin from below to 50 percent of basal area.
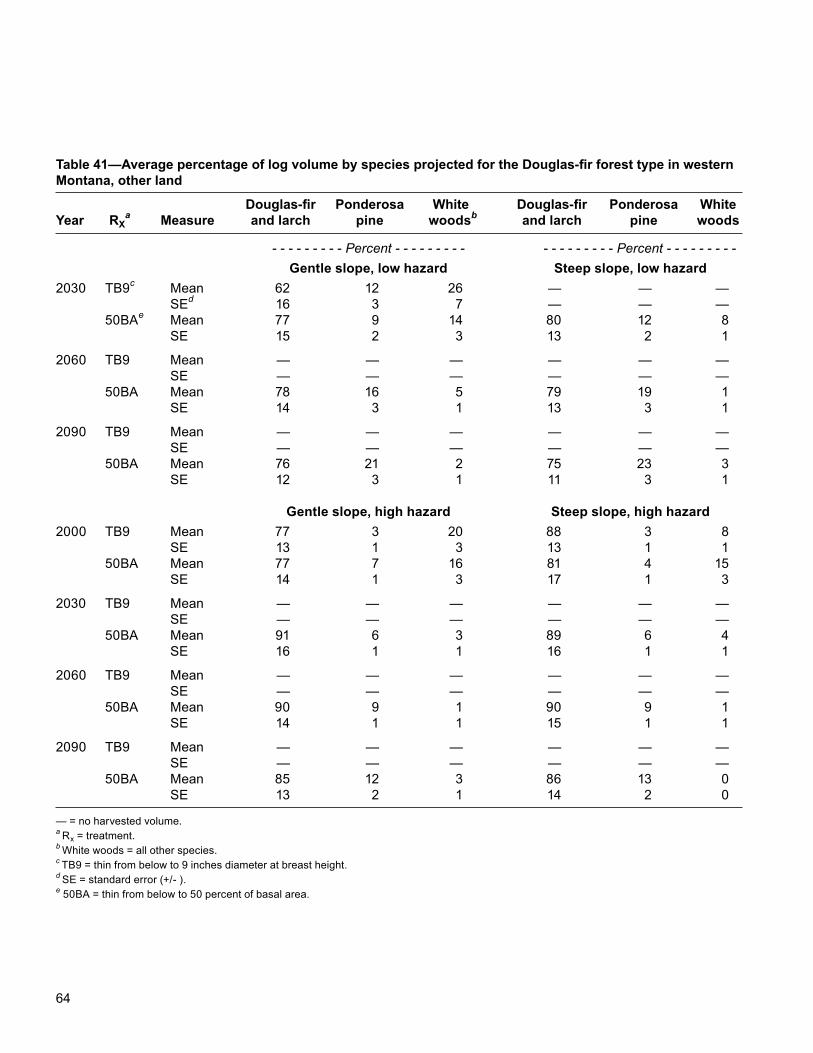
64
Table 41—Average percentage of log volume by species projected for the Douglas-fir forest type in western Montana, other land
Douglas-fir Ponderosa White Douglas-fir Ponderosa White Year RX
a Measure and larch pine woodsb and larch pine woods
- - - - - - - - - Percent - - - - - - - - - - - - - - - - - - Percent - - - - - - - - - Gentle slope, low hazard Steep slope, low hazard2030 TB9c Mean 62 12 26 — — — SEd 16 3 7 — — — 50BAe Mean 77 9 14 80 12 8 SE 15 2 3 13 2 1
2060 TB9 Mean — — — — — — SE — — — — — — 50BA Mean 78 16 5 79 19 1 SE 14 3 1 13 3 1
2090 TB9 Mean — — — — — — SE — — — — — — 50BA Mean 76 21 2 75 23 3 SE 12 3 1 11 3 1
Gentle slope, high hazard Steep slope, high hazard2000 TB9 Mean 77 3 20 88 3 8 SE 13 1 3 13 1 1 50BA Mean 77 7 16 81 4 15 SE 14 1 3 17 1 3
2030 TB9 Mean — — — — — — SE — — — — — — 50BA Mean 91 6 3 89 6 4 SE 16 1 1 16 1 1
2060 TB9 Mean — — — — — — SE — — — — — — 50BA Mean 90 9 1 90 9 1 SE 14 1 1 15 1 1
2090 TB9 Mean — — — — — — SE — — — — — — 50BA Mean 85 12 3 86 13 0 SE 13 2 1 14 2 0
— = no harvested volume.a Rx = treatment.b White woods = all other species.c TB9 = thin from below to 9 inches diameter at breast height.d SE = standard error (+/- ).e 50BA = thin from below to 50 percent of basal area.

65
Table 42—Average percentage of log volume by species projected for the Douglas-fir forest type in eastern Montana, national forest land
Douglas-fir Ponderosa White Douglas-fir Ponderosa White Year RX
a Measure and larch pine woodsb and larch pine woods
- - - - - - - - - Percent - - - - - - - - - - - - - - - - - - Percent - - - - - - - - Gentle slope, low hazard Steep slope, low hazard2030 TB9c Mean — — — — — — SEd — — — — — — 50BAe Mean 79 0 21 89 0 11 SE 19 0 5 24 0 3
2060 TB9 Mean — — — — — — SE — — — — — — 50BA Mean 99 0 0 86 0 14 SE 22 0 0 22 0 4
2090 TB9 Mean — — — — — — SE — — — — — — 50BA Mean 96 4 0 95 4 1 SE 20 1 0 21 1 1
Gentle slope, high hazard Steep slope, high hazard2000 TB9 Mean 86 2 12 97 0 3 SE 15 1 2 17 0 1 50BA Mean 83 2 16 90 0 10 SE 13 1 2 17 0 2
2030 TB9 Mean — — — — — — SE — — — — — — 50BA Mean 93 1 6 95 0 5 SE 15 1 1 21 0 1
2060 TB9 Mean — — — — — — SE — — — — — — 50BA Mean 98 0 2 92 4 3 SE 16 0 1 18 1 1
2090 TB9 Mean — — — — — — SE — — — — — — 50BA Mean 96 2 1 95 2 4 SE 15 1 1 17 1 1
— = no harvested volume.a Rx = treatment.b White woods = all other species.c TB9 = thin from below to 9 inches diameter at breast height.d SE = standard error (+/- ).e 50BA = thin from below to 50 percent of basal area.

66
Table 43—Average percentage of log volume by species projected for the Douglas-fir forest type in eastern Montana, other land
Douglas-fir Ponderosa White Douglas-fir Ponderosa White Year RX
a Measure and larch pine woodsb and larch pine woods
- - - - - - - - - Percent - - - - - - - - - - - - - - - - - - Percent - - - - - - - - - Gentle slope, low hazard Steep slope, low hazard2030 TB9c Mean — — — — — — SEd — — — — — — 50BAe Mean 87 6 7 79 0 21 SE 18 1 1 35 0 9
2060 TB9 Mean — — — — — — SE — — — — — — 50BA Mean 80 16 4 91 0 9 SE 14 3 1 37 0 4
2090 TB9 Mean — — — — — — SE — — — — — — 50BA Mean 88 10 2 95 5 0 SE 15 2 1 39 2 0
Gentle slope, high hazard Steep slope, high hazard2000 TB9 Mean 87 4 9 88 5 8 SE 13 1 1 13 1 1 50BA Mean 90 3 7 91 1 8 SE 13 1 1 15 1 1
2030 TB9 Mean — — — — — — SE — — — — — — 50BA Mean 90 5 5 89 3 7 SE 13 1 1 16 1 1
2060 TB9 Mean — — — — — — SE — — — — — — 50BA Mean 91 8 1 84 12 4 SE 13 1 1 13 2 1
2090 TB9 Mean — — — — — — SE — — — — — — 50BA Mean 90 8 2 92 7 1 SE 13 1 1 14 1 1
— = no harvested volume.a Rx = treatment.b White woods = all other species.c TB9 = thin from below to 9 inches diameter at breast height.d SE = standard error (+/- ).e 50BA = thin from below to 50 percent of basal area.
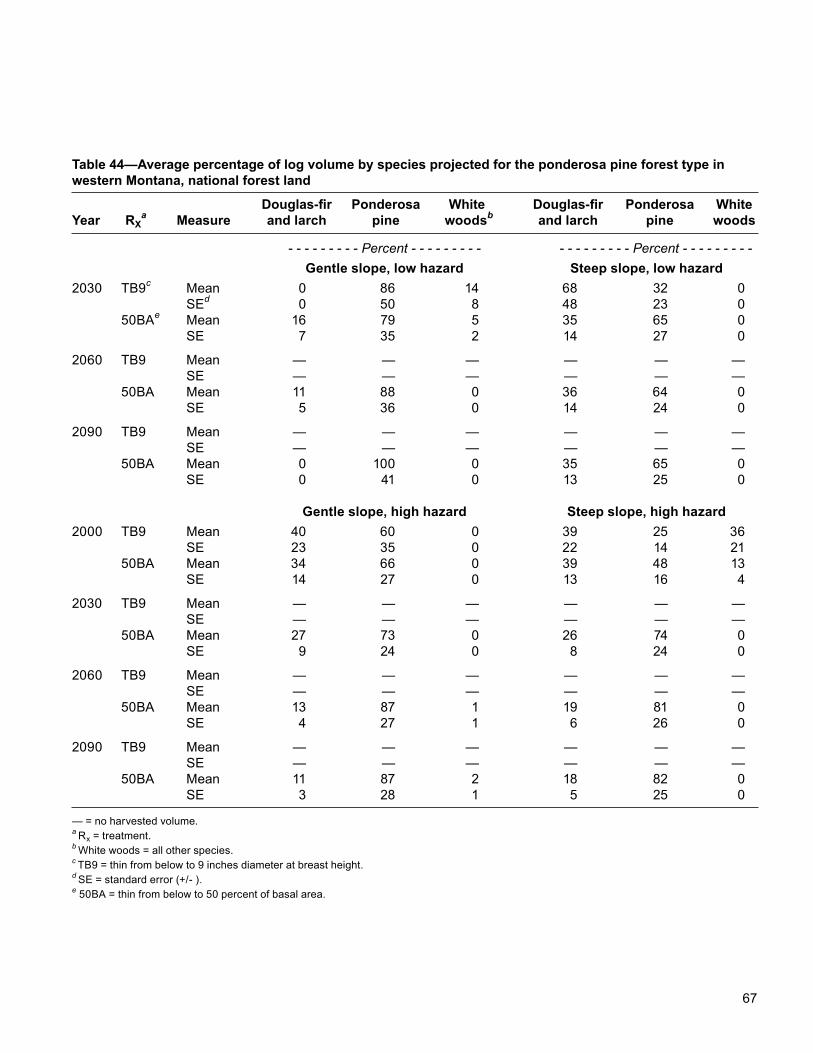
67
Table 44—Average percentage of log volume by species projected for the ponderosa pine forest type in western Montana, national forest land
Douglas-fir Ponderosa White Douglas-fir Ponderosa White Year RX
a Measure and larch pine woodsb and larch pine woods
- - - - - - - - - Percent - - - - - - - - - - - - - - - - - - Percent - - - - - - - - - Gentle slope, low hazard Steep slope, low hazard2030 TB9c Mean 0 86 14 68 32 0 SEd 0 50 8 48 23 0 50BAe Mean 16 79 5 35 65 0 SE 7 35 2 14 27 0
2060 TB9 Mean — — — — — — SE — — — — — — 50BA Mean 11 88 0 36 64 0 SE 5 36 0 14 24 0
2090 TB9 Mean — — — — — — SE — — — — — — 50BA Mean 0 100 0 35 65 0 SE 0 41 0 13 25 0
Gentle slope, high hazard Steep slope, high hazard2000 TB9 Mean 40 60 0 39 25 36 SE 23 35 0 22 14 21 50BA Mean 34 66 0 39 48 13 SE 14 27 0 13 16 4
2030 TB9 Mean — — — — — — SE — — — — — — 50BA Mean 27 73 0 26 74 0 SE 9 24 0 8 24 0
2060 TB9 Mean — — — — — — SE — — — — — — 50BA Mean 13 87 1 19 81 0 SE 4 27 1 6 26 0
2090 TB9 Mean — — — — — — SE — — — — — — 50BA Mean 11 87 2 18 82 0 SE 3 28 1 5 25 0
— = no harvested volume.a Rx = treatment.b White woods = all other species.c TB9 = thin from below to 9 inches diameter at breast height.d SE = standard error (+/- ).e 50BA = thin from below to 50 percent of basal area.
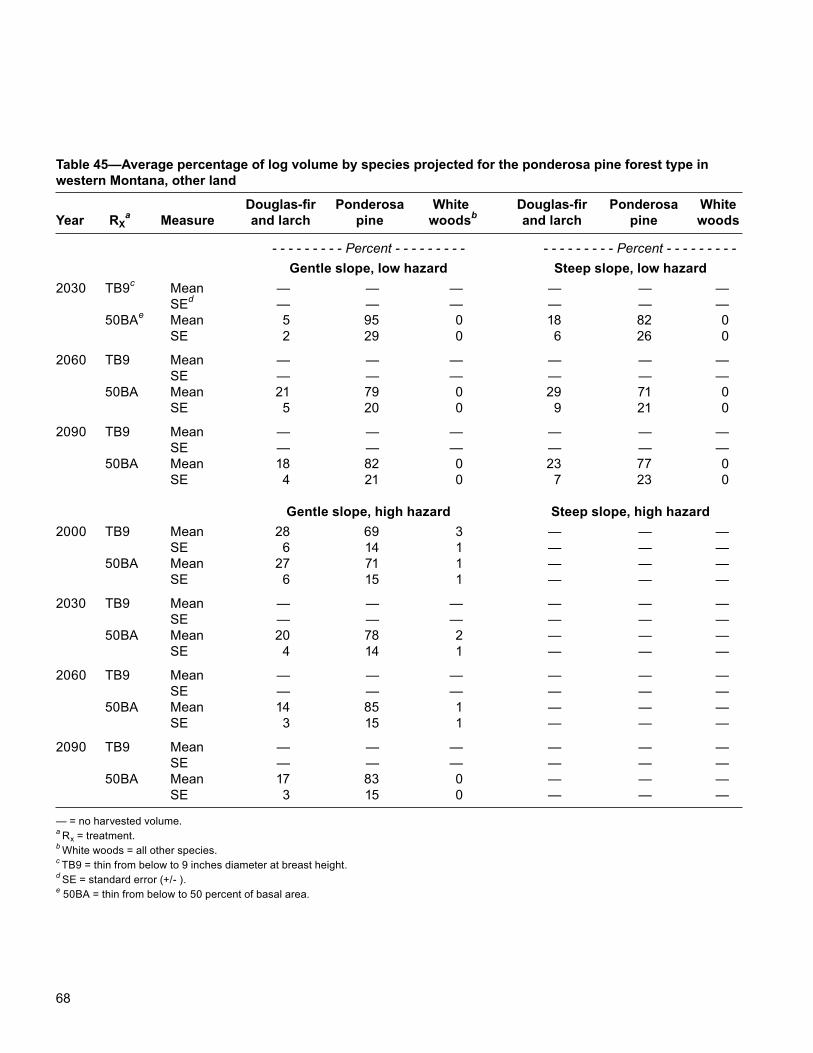
68
Table 45—Average percentage of log volume by species projected for the ponderosa pine forest type in western Montana, other land
Douglas-fir Ponderosa White Douglas-fir Ponderosa White Year RX
a Measure and larch pine woodsb and larch pine woods
- - - - - - - - - Percent - - - - - - - - - - - - - - - - - - Percent - - - - - - - - - Gentle slope, low hazard Steep slope, low hazard2030 TB9c Mean — — — — — — SEd — — — — — — 50BAe Mean 5 95 0 18 82 0 SE 2 29 0 6 26 0
2060 TB9 Mean — — — — — — SE — — — — — — 50BA Mean 21 79 0 29 71 0 SE 5 20 0 9 21 0
2090 TB9 Mean — — — — — — SE — — — — — — 50BA Mean 18 82 0 23 77 0 SE 4 21 0 7 23 0
Gentle slope, high hazard Steep slope, high hazard2000 TB9 Mean 28 69 3 — — — SE 6 14 1 — — — 50BA Mean 27 71 1 — — — SE 6 15 1 — — —
2030 TB9 Mean — — — — — — SE — — — — — — 50BA Mean 20 78 2 — — — SE 4 14 1 — — —
2060 TB9 Mean — — — — — — SE — — — — — — 50BA Mean 14 85 1 — — — SE 3 15 1 — — —
2090 TB9 Mean — — — — — — SE — — — — — — 50BA Mean 17 83 0 — — — SE 3 15 0 — — —
— = no harvested volume.a Rx = treatment.b White woods = all other species.c TB9 = thin from below to 9 inches diameter at breast height.d SE = standard error (+/- ).e 50BA = thin from below to 50 percent of basal area.
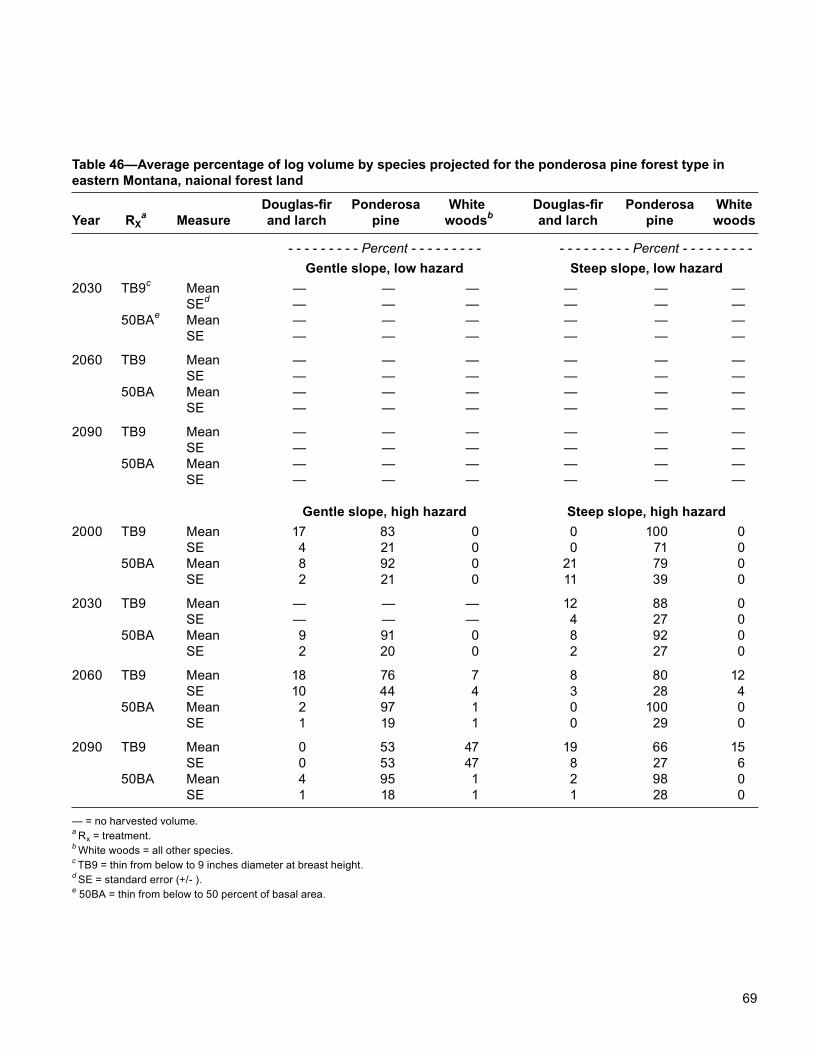
69
Table 46—Average percentage of log volume by species projected for the ponderosa pine forest type in eastern Montana, naional forest land
Douglas-fir Ponderosa White Douglas-fir Ponderosa White Year RX
a Measure and larch pine woodsb and larch pine woods
- - - - - - - - - Percent - - - - - - - - - - - - - - - - - - Percent - - - - - - - - - Gentle slope, low hazard Steep slope, low hazard2030 TB9c Mean — — — — — — SEd — — — — — — 50BAe Mean — — — — — — SE — — — — — —
2060 TB9 Mean — — — — — — SE — — — — — — 50BA Mean — — — — — — SE — — — — — —
2090 TB9 Mean — — — — — — SE — — — — — — 50BA Mean — — — — — — SE — — — — — —
Gentle slope, high hazard Steep slope, high hazard2000 TB9 Mean 17 83 0 0 100 0 SE 4 21 0 0 71 0 50BA Mean 8 92 0 21 79 0 SE 2 21 0 11 39 0
2030 TB9 Mean — — — 12 88 0 SE — — — 4 27 0 50BA Mean 9 91 0 8 92 0 SE 2 20 0 2 27 0
2060 TB9 Mean 18 76 7 8 80 12 SE 10 44 4 3 28 4 50BA Mean 2 97 1 0 100 0 SE 1 19 1 0 29 0
2090 TB9 Mean 0 53 47 19 66 15 SE 0 53 47 8 27 6 50BA Mean 4 95 1 2 98 0 SE 1 18 1 1 28 0
— = no harvested volume.a Rx = treatment.b White woods = all other species.c TB9 = thin from below to 9 inches diameter at breast height.d SE = standard error (+/- ).e 50BA = thin from below to 50 percent of basal area.
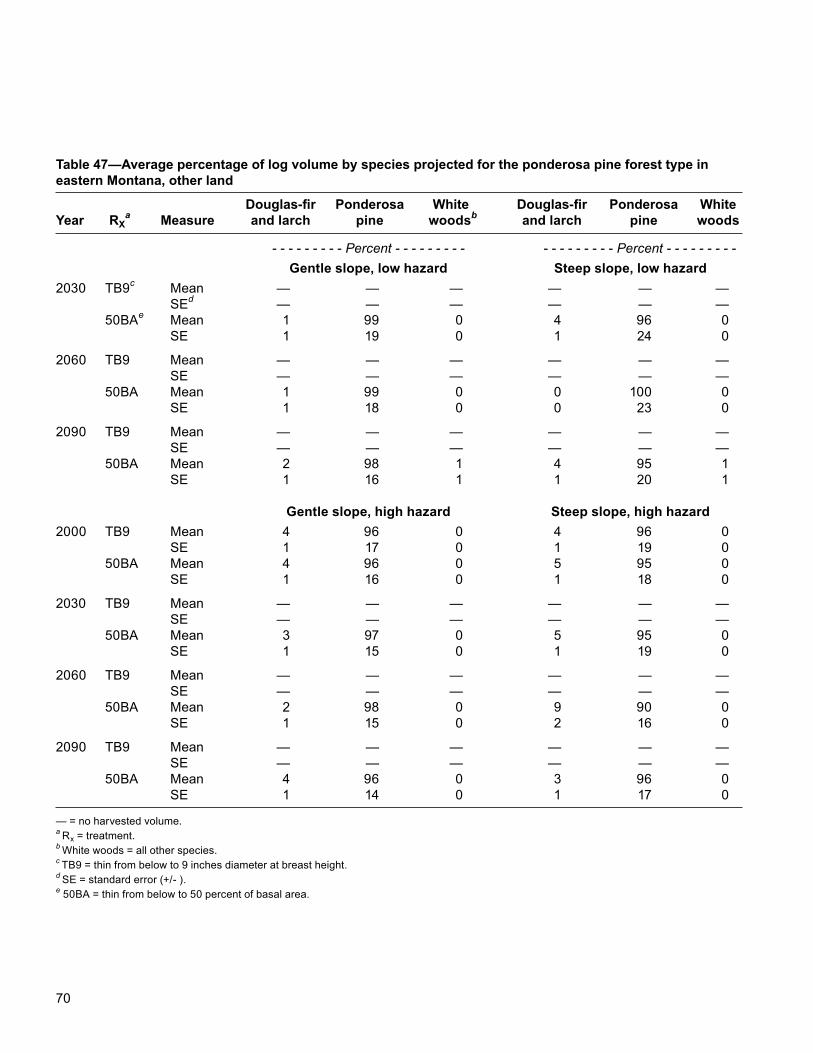
70
Table 47—Average percentage of log volume by species projected for the ponderosa pine forest type in eastern Montana, other land
Douglas-fir Ponderosa White Douglas-fir Ponderosa White Year RX
a Measure and larch pine woodsb and larch pine woods
- - - - - - - - - Percent - - - - - - - - - - - - - - - - - - Percent - - - - - - - - - Gentle slope, low hazard Steep slope, low hazard2030 TB9c Mean — — — — — — SEd — — — — — — 50BAe Mean 1 99 0 4 96 0 SE 1 19 0 1 24 0
2060 TB9 Mean — — — — — — SE — — — — — — 50BA Mean 1 99 0 0 100 0 SE 1 18 0 0 23 0
2090 TB9 Mean — — — — — — SE — — — — — — 50BA Mean 2 98 1 4 95 1 SE 1 16 1 1 20 1
Gentle slope, high hazard Steep slope, high hazard2000 TB9 Mean 4 96 0 4 96 0 SE 1 17 0 1 19 0 50BA Mean 4 96 0 5 95 0 SE 1 16 0 1 18 0
2030 TB9 Mean — — — — — — SE — — — — — — 50BA Mean 3 97 0 5 95 0 SE 1 15 0 1 19 0
2060 TB9 Mean — — — — — — SE — — — — — — 50BA Mean 2 98 0 9 90 0 SE 1 15 0 2 16 0
2090 TB9 Mean — — — — — — SE — — — — — — 50BA Mean 4 96 0 3 96 0 SE 1 14 0 1 17 0
— = no harvested volume.a Rx = treatment.b White woods = all other species.c TB9 = thin from below to 9 inches diameter at breast height.d SE = standard error (+/- ).e 50BA = thin from below to 50 percent of basal area.
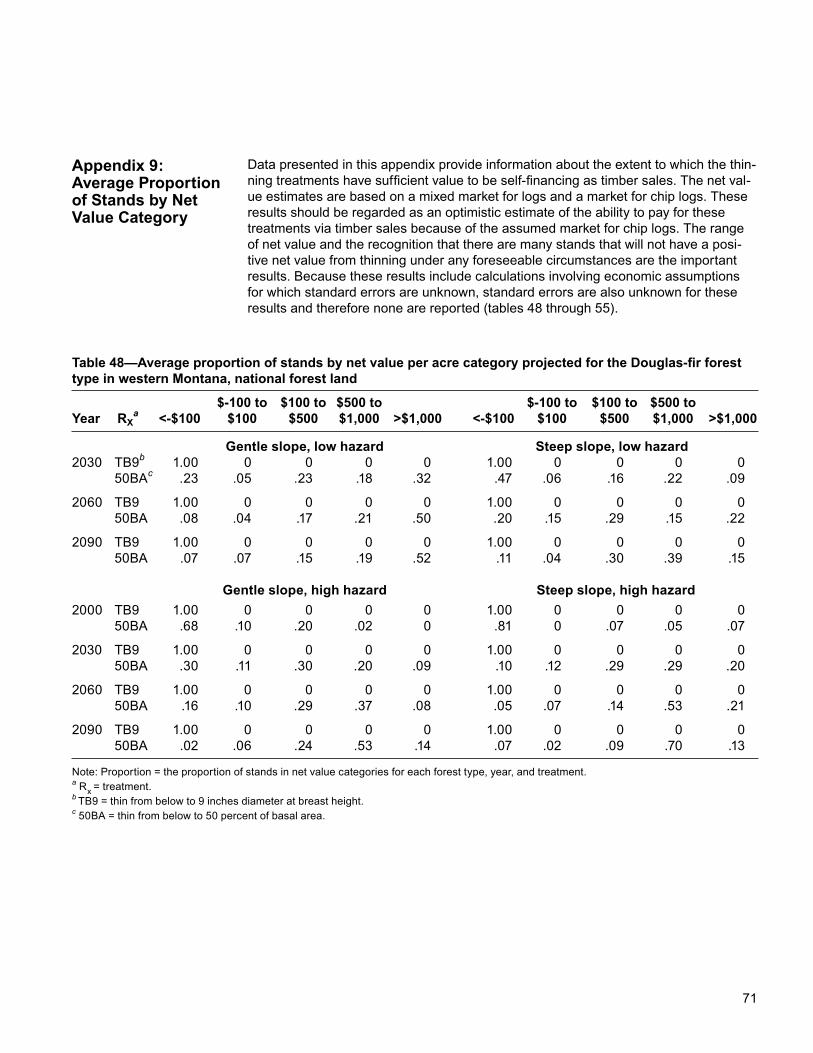
71
Data presented in this appendix provide information about the extent to which the thin-ning treatments have sufficient value to be self-financing as timber sales. The net val-ue estimates are based on a mixed market for logs and a market for chip logs. These results should be regarded as an optimistic estimate of the ability to pay for these treatments via timber sales because of the assumed market for chip logs. The range of net value and the recognition that there are many stands that will not have a posi-tive net value from thinning under any foreseeable circumstances are the important results. Because these results include calculations involving economic assumptions for which standard errors are unknown, standard errors are also unknown for these results and therefore none are reported (tables 48 through 55).
Appendix 9: Average Proportion of Stands by Net Value Category
Table 48—Average proportion of stands by net value per acre category projected for the Douglas-fir forest type in western Montana, national forest land
$-100 to $100 to $500 to $-100 to $100 to $500 to Year RX
a <-$100 $100 $500 $1,000 >$1,000 <-$100 $100 $500 $1,000 >$1,000
Gentle slope, low hazard Steep slope, low hazard2030 TB9b 1.00 0 0 0 0 1.00 0 0 0 0 50BAc .23 .05 .23 .18 .32 .47 .06 .16 .22 .09
2060 TB9 1.00 0 0 0 0 1.00 0 0 0 0 50BA .08 .04 .17 .21 .50 .20 .15 .29 .15 .22
2090 TB9 1.00 0 0 0 0 1.00 0 0 0 0 50BA .07 .07 .15 .19 .52 .11 .04 .30 .39 .15
Gentle slope, high hazard Steep slope, high hazard2000 TB9 1.00 0 0 0 0 1.00 0 0 0 0 50BA .68 .10 .20 .02 0 .81 0 .07 .05 .07
2030 TB9 1.00 0 0 0 0 1.00 0 0 0 0 50BA .30 .11 .30 .20 .09 .10 .12 .29 .29 .20
2060 TB9 1.00 0 0 0 0 1.00 0 0 0 0 50BA .16 .10 .29 .37 .08 .05 .07 .14 .53 .21
2090 TB9 1.00 0 0 0 0 1.00 0 0 0 0 50BA .02 .06 .24 .53 .14 .07 .02 .09 .70 .13
Note: Proportion = the proportion of stands in net value categories for each forest type, year, and treatment.a Rx = treatment.b TB9 = thin from below to 9 inches diameter at breast height.c 50BA = thin from below to 50 percent of basal area.

72
Table 49—Average proportion of stands by net value per acre category projected for the Douglas-fir forest type in western Montana, other land
$-100 to $100 to $500 to $-100 to $100 to $500 to Year RX
a <-$100 $100 $500 $1,000 >$1,000 <-$100 $100 $500 $1,000 >$1,000
Gentle slope, low hazard Steep slope, low hazard2030 TB9b 1.00 0 0 0 0 1.00 0 0 0 0 50BAc .27 .07 .17 .00 .50 .54 .08 .11 .11 .16
2060 TB9 1.00 0 0 0 0 1.00 0 0 0 0 50BA .08 .14 .14 .17 .47 .05 .29 .32 .13 .21
2090 TB9 1.00 0 0 0 0 1.00 0 0 0 0 50BA .05 .05 .07 .34 .49 .07 .09 .34 .39 .11
Gentle slope, high hazard Steep slope, high hazard2000 TB9 1.00 0 0 0 0 1.00 0 0 0 0 50BA .76 .07 .07 .04 .07 .93 .04 0 .02 0
2030 TB9 1.00 0 0 0 0 1.00 0 0 0 0 50BA .25 .11 .42 .14 .08 .60 .06 .06 .14 .14
2060 TB9 1.00 0 0 0 0 1.00 0 0 0 0 50BA .12 .14 .30 .23 .21 .23 .25 .15 .28 .10
2090 TB9 1.00 0 0 0 0 1.00 0 0 0 0 50BA .13 .06 .25 .23 .33 .07 .07 .45 .33 .07
Note: Proportion = the proportion of stands in net value categories for each forest type, year, and treatment.a Rx = treatment.b TB9 = thin from below to 9 inches diameter at breast height.c 50BA = thin from below to 50 percent of basal area.
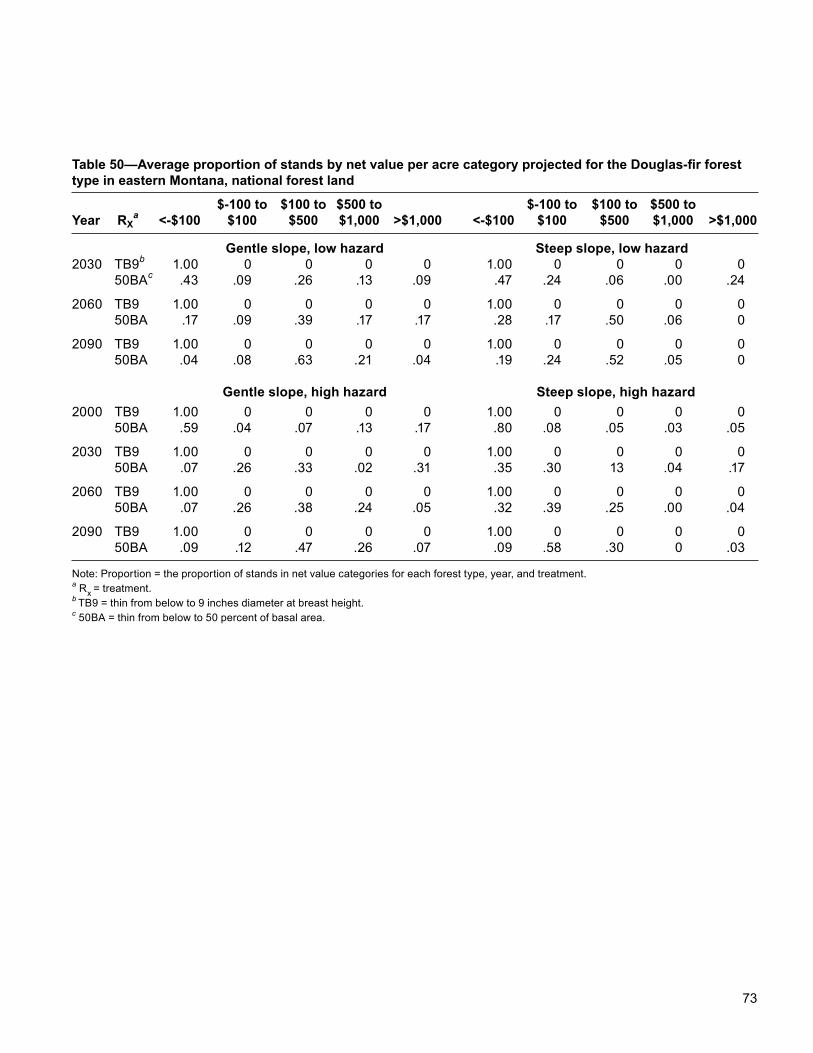
73
Table 50—Average proportion of stands by net value per acre category projected for the Douglas-fir forest type in eastern Montana, national forest land
$-100 to $100 to $500 to $-100 to $100 to $500 to Year RX
a <-$100 $100 $500 $1,000 >$1,000 <-$100 $100 $500 $1,000 >$1,000
Gentle slope, low hazard Steep slope, low hazard2030 TB9b 1.00 0 0 0 0 1.00 0 0 0 0 50BAc .43 .09 .26 .13 .09 .47 .24 .06 .00 .24
2060 TB9 1.00 0 0 0 0 1.00 0 0 0 0 50BA .17 .09 .39 .17 .17 .28 .17 .50 .06 0
2090 TB9 1.00 0 0 0 0 1.00 0 0 0 0 50BA .04 .08 .63 .21 .04 .19 .24 .52 .05 0
Gentle slope, high hazard Steep slope, high hazard2000 TB9 1.00 0 0 0 0 1.00 0 0 0 0 50BA .59 .04 .07 .13 .17 .80 .08 .05 .03 .05
2030 TB9 1.00 0 0 0 0 1.00 0 0 0 0 50BA .07 .26 .33 .02 .31 .35 .30 13 .04 .17
2060 TB9 1.00 0 0 0 0 1.00 0 0 0 0 50BA .07 .26 .38 .24 .05 .32 .39 .25 .00 .04
2090 TB9 1.00 0 0 0 0 1.00 0 0 0 0 50BA .09 .12 .47 .26 .07 .09 .58 .30 0 .03
Note: Proportion = the proportion of stands in net value categories for each forest type, year, and treatment.a Rx = treatment.b TB9 = thin from below to 9 inches diameter at breast height.c 50BA = thin from below to 50 percent of basal area.
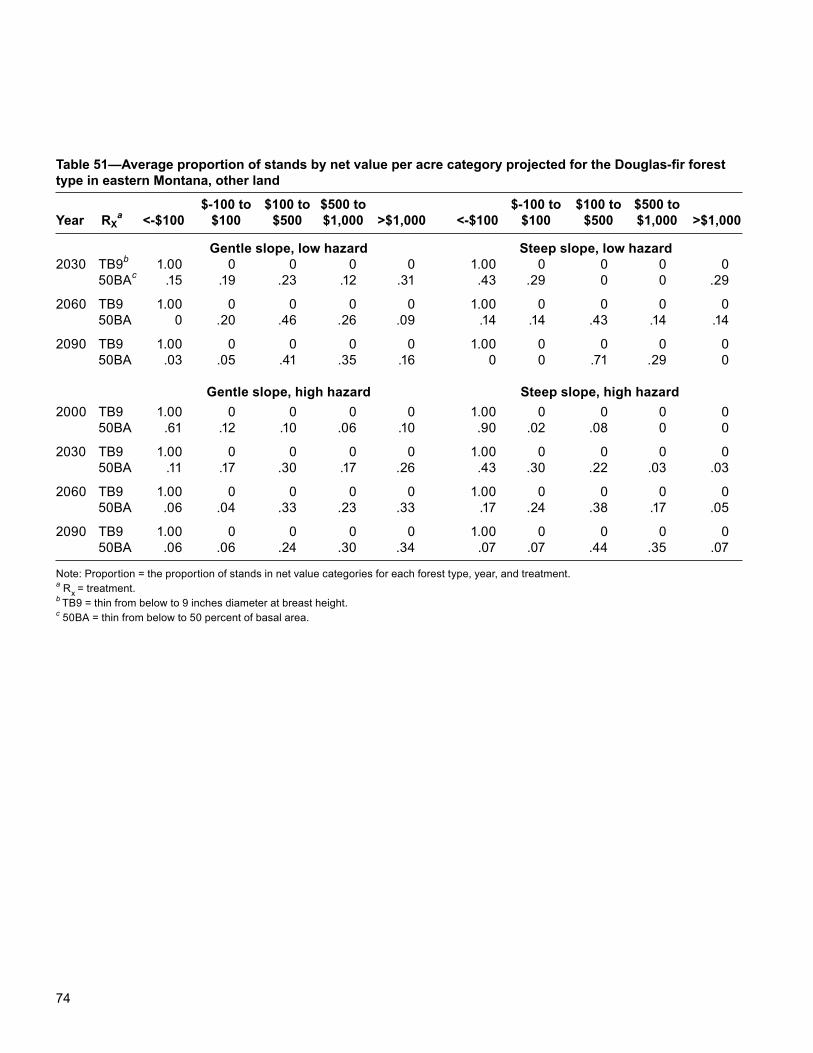
74
Table 51—Average proportion of stands by net value per acre category projected for the Douglas-fir forest type in eastern Montana, other land
$-100 to $100 to $500 to $-100 to $100 to $500 to Year RX
a <-$100 $100 $500 $1,000 >$1,000 <-$100 $100 $500 $1,000 >$1,000
Gentle slope, low hazard Steep slope, low hazard2030 TB9b 1.00 0 0 0 0 1.00 0 0 0 0 50BAc .15 .19 .23 .12 .31 .43 .29 0 0 .29
2060 TB9 1.00 0 0 0 0 1.00 0 0 0 0 50BA 0 .20 .46 .26 .09 .14 .14 .43 .14 .14
2090 TB9 1.00 0 0 0 0 1.00 0 0 0 0 50BA .03 .05 .41 .35 .16 0 0 .71 .29 0
Gentle slope, high hazard Steep slope, high hazard2000 TB9 1.00 0 0 0 0 1.00 0 0 0 0 50BA .61 .12 .10 .06 .10 .90 .02 .08 0 0
2030 TB9 1.00 0 0 0 0 1.00 0 0 0 0 50BA .11 .17 .30 .17 .26 .43 .30 .22 .03 .03
2060 TB9 1.00 0 0 0 0 1.00 0 0 0 0 50BA .06 .04 .33 .23 .33 .17 .24 .38 .17 .05
2090 TB9 1.00 0 0 0 0 1.00 0 0 0 0 50BA .06 .06 .24 .30 .34 .07 .07 .44 .35 .07
Note: Proportion = the proportion of stands in net value categories for each forest type, year, and treatment.a Rx = treatment.b TB9 = thin from below to 9 inches diameter at breast height.c 50BA = thin from below to 50 percent of basal area.
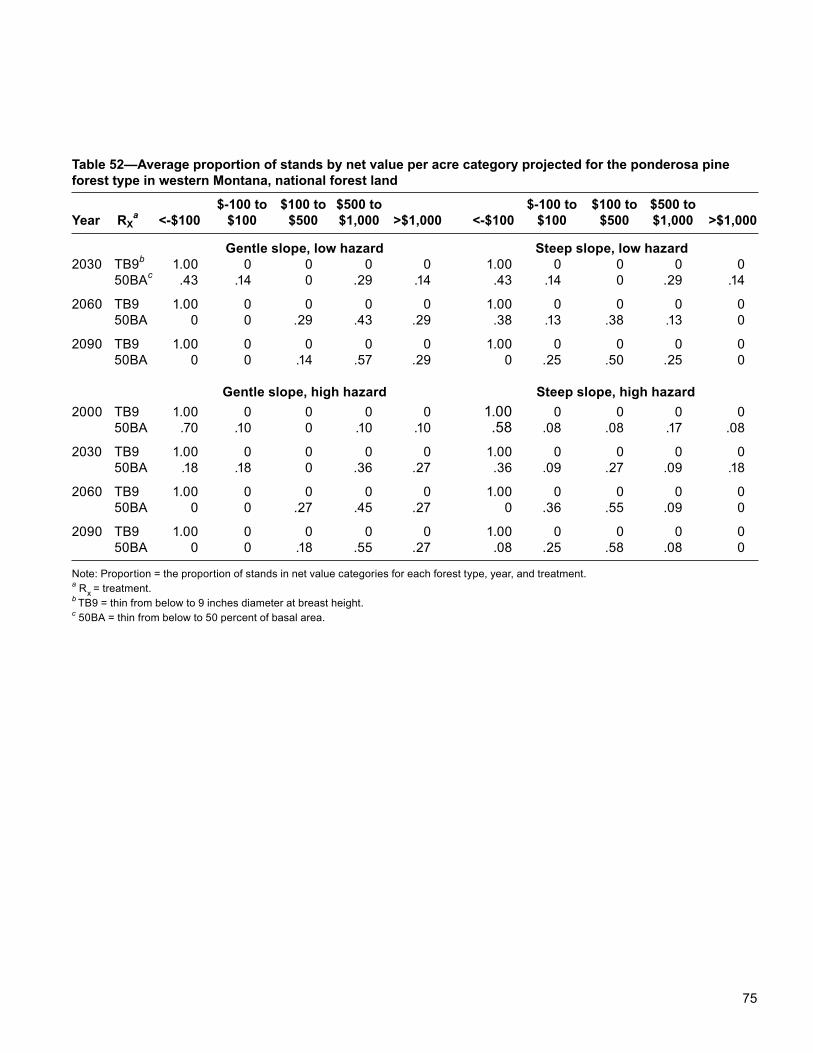
75
Table 52—Average proportion of stands by net value per acre category projected for the ponderosa pine forest type in western Montana, national forest land
$-100 to $100 to $500 to $-100 to $100 to $500 to Year RX
a <-$100 $100 $500 $1,000 >$1,000 <-$100 $100 $500 $1,000 >$1,000
Gentle slope, low hazard Steep slope, low hazard2030 TB9b 1.00 0 0 0 0 1.00 0 0 0 0 50BAc .43 .14 0 .29 .14 .43 .14 0 .29 .14
2060 TB9 1.00 0 0 0 0 1.00 0 0 0 0 50BA 0 0 .29 .43 .29 .38 .13 .38 .13 0
2090 TB9 1.00 0 0 0 0 1.00 0 0 0 0 50BA 0 0 .14 .57 .29 0 .25 .50 .25 0
Gentle slope, high hazard Steep slope, high hazard2000 TB9 1.00 0 0 0 0 1.00 0 0 0 0 50BA .70 .10 0 .10 .10 .58 .08 .08 .17 .08
2030 TB9 1.00 0 0 0 0 1.00 0 0 0 0 50BA .18 .18 0 .36 .27 .36 .09 .27 .09 .18
2060 TB9 1.00 0 0 0 0 1.00 0 0 0 0 50BA 0 0 .27 .45 .27 0 .36 .55 .09 0
2090 TB9 1.00 0 0 0 0 1.00 0 0 0 0 50BA 0 0 .18 .55 .27 .08 .25 .58 .08 0
Note: Proportion = the proportion of stands in net value categories for each forest type, year, and treatment.a Rx = treatment.b TB9 = thin from below to 9 inches diameter at breast height.c 50BA = thin from below to 50 percent of basal area.
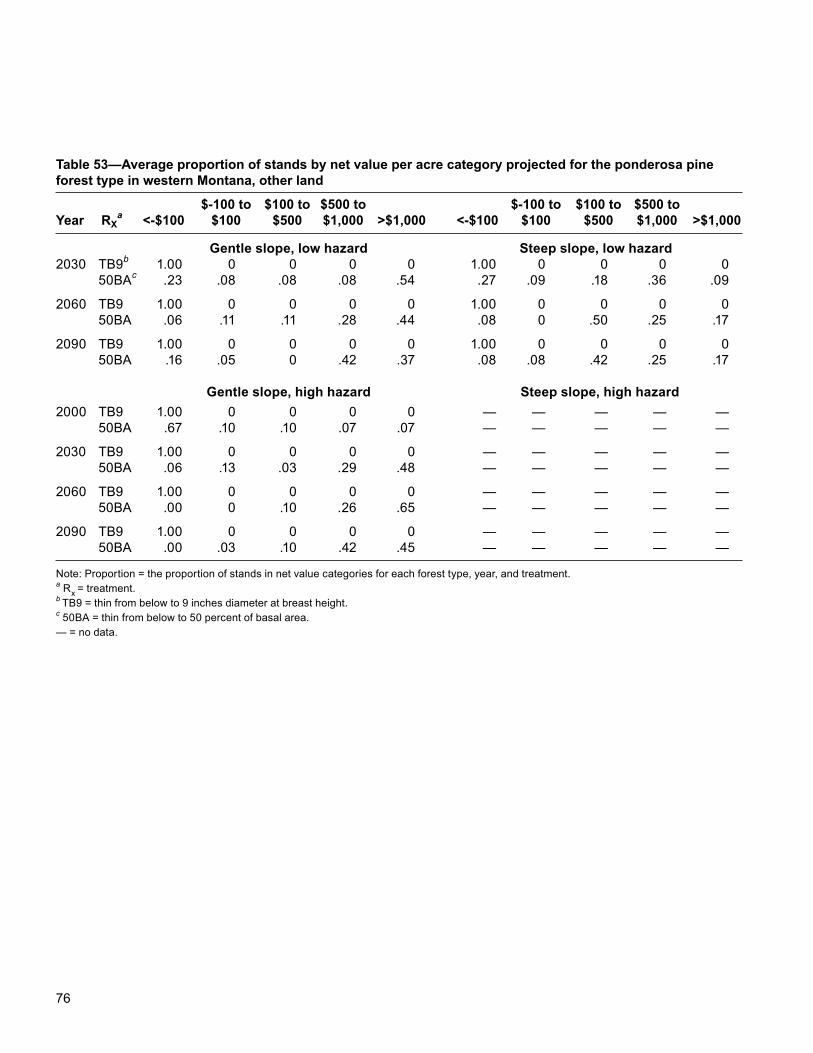
76
Table 53—Average proportion of stands by net value per acre category projected for the ponderosa pine forest type in western Montana, other land
$-100 to $100 to $500 to $-100 to $100 to $500 to Year RX
a <-$100 $100 $500 $1,000 >$1,000 <-$100 $100 $500 $1,000 >$1,000
Gentle slope, low hazard Steep slope, low hazard2030 TB9b 1.00 0 0 0 0 1.00 0 0 0 0 50BAc .23 .08 .08 .08 .54 .27 .09 .18 .36 .09
2060 TB9 1.00 0 0 0 0 1.00 0 0 0 0 50BA .06 .11 .11 .28 .44 .08 0 .50 .25 .17
2090 TB9 1.00 0 0 0 0 1.00 0 0 0 0 50BA .16 .05 0 .42 .37 .08 .08 .42 .25 .17
Gentle slope, high hazard Steep slope, high hazard2000 TB9 1.00 0 0 0 0 — — — — — 50BA .67 .10 .10 .07 .07 — — — — —
2030 TB9 1.00 0 0 0 0 — — — — — 50BA .06 .13 .03 .29 .48 — — — — —
2060 TB9 1.00 0 0 0 0 — — — — — 50BA .00 0 .10 .26 .65 — — — — —
2090 TB9 1.00 0 0 0 0 — — — — — 50BA .00 .03 .10 .42 .45 — — — — —
Note: Proportion = the proportion of stands in net value categories for each forest type, year, and treatment.a Rx = treatment.b TB9 = thin from below to 9 inches diameter at breast height.c 50BA = thin from below to 50 percent of basal area.— = no data.
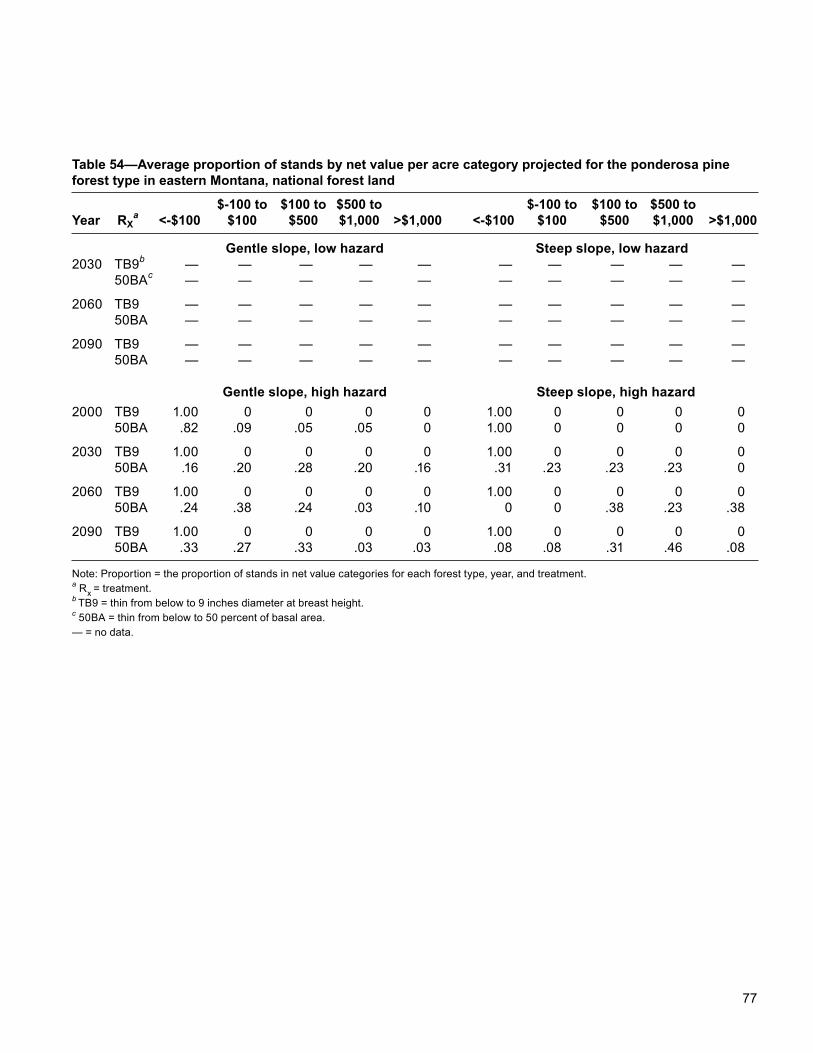
77
Table 54—Average proportion of stands by net value per acre category projected for the ponderosa pine forest type in eastern Montana, national forest land
$-100 to $100 to $500 to $-100 to $100 to $500 to Year RX
a <-$100 $100 $500 $1,000 >$1,000 <-$100 $100 $500 $1,000 >$1,000
Gentle slope, low hazard Steep slope, low hazard2030 TB9b — — — — — — — — — — 50BAc — — — — — — — — — —
2060 TB9 — — — — — — — — — — 50BA — — — — — — — — — —
2090 TB9 — — — — — — — — — — 50BA — — — — — — — — — —
Gentle slope, high hazard Steep slope, high hazard2000 TB9 1.00 0 0 0 0 1.00 0 0 0 0 50BA .82 .09 .05 .05 0 1.00 0 0 0 0
2030 TB9 1.00 0 0 0 0 1.00 0 0 0 0 50BA .16 .20 .28 .20 .16 .31 .23 .23 .23 0
2060 TB9 1.00 0 0 0 0 1.00 0 0 0 0 50BA .24 .38 .24 .03 .10 0 0 .38 .23 .38
2090 TB9 1.00 0 0 0 0 1.00 0 0 0 0 50BA .33 .27 .33 .03 .03 .08 .08 .31 .46 .08
Note: Proportion = the proportion of stands in net value categories for each forest type, year, and treatment.a Rx = treatment.b TB9 = thin from below to 9 inches diameter at breast height.c 50BA = thin from below to 50 percent of basal area.— = no data.
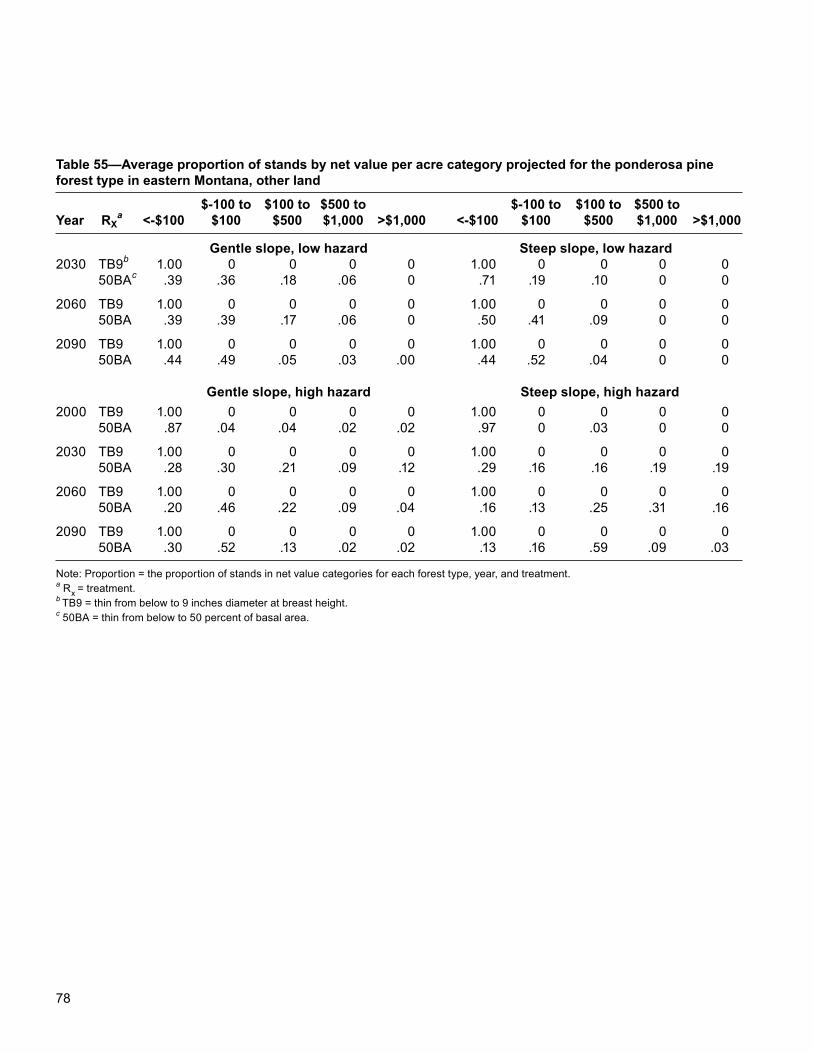
78
Table 55—Average proportion of stands by net value per acre category projected for the ponderosa pine forest type in eastern Montana, other land
$-100 to $100 to $500 to $-100 to $100 to $500 to Year RX
a <-$100 $100 $500 $1,000 >$1,000 <-$100 $100 $500 $1,000 >$1,000
Gentle slope, low hazard Steep slope, low hazard2030 TB9b 1.00 0 0 0 0 1.00 0 0 0 0 50BAc .39 .36 .18 .06 0 .71 .19 .10 0 0
2060 TB9 1.00 0 0 0 0 1.00 0 0 0 0 50BA .39 .39 .17 .06 0 .50 .41 .09 0 0
2090 TB9 1.00 0 0 0 0 1.00 0 0 0 0 50BA .44 .49 .05 .03 .00 .44 .52 .04 0 0
Gentle slope, high hazard Steep slope, high hazard2000 TB9 1.00 0 0 0 0 1.00 0 0 0 0 50BA .87 .04 .04 .02 .02 .97 0 .03 0 0
2030 TB9 1.00 0 0 0 0 1.00 0 0 0 0 50BA .28 .30 .21 .09 .12 .29 .16 .16 .19 .19
2060 TB9 1.00 0 0 0 0 1.00 0 0 0 0 50BA .20 .46 .22 .09 .04 .16 .13 .25 .31 .16
2090 TB9 1.00 0 0 0 0 1.00 0 0 0 0 50BA .30 .52 .13 .02 .02 .13 .16 .59 .09 .03
Note: Proportion = the proportion of stands in net value categories for each forest type, year, and treatment.a Rx = treatment.b TB9 = thin from below to 9 inches diameter at breast height.c 50BA = thin from below to 50 percent of basal area.
The Forest Service of the U.S. Department of Agriculture is dedicated to the principle of multiple use management of the Nation’s forest resources for sustained yields of wood, water, forage, wildlife, and recreation. Through forestry research, cooperation with the States and private forest owners, and management of the National Forests and National Grasslands, it strives—as directed by Congress—to provide increasingly greater service to a growing Nation.
The U.S. Department of Agriculture (USDA) prohibits discrimination in all its programs and activities on the basis of race, color, national origin, gender, religion, age, disabil-ity, political beliefs, sexual orientation, or marital or family status. (Not all prohibited bases apply to all programs.) Persons with disabilities who require alternative means for communication of program information (Braille, large print, audiotape, etc.) should contact USDA’s TARGET Center at (202) 720-2600 (voice and TDD).
To file a complaint of discrimination, write USDA, Director, Office of Civil Rights, Room 326-W, Whitten Building, 14th and Independence Avenue, SW, Washington, DC 20250-9410 or call (202) 720-5964 (voice and TDD). USDA is an equal opportu-nity provider and employer.
USDA is committed to making its information materials accessible to all USDA customers and employees.
Pacific Northwest Research Station
Web site http://www.fs.fed.us/pnwTelephone (503) 808-2592Publication requests (503) 808-2138FAX (503) 808-2130E-mail [email protected] address Publications Distribution Pacific Northwest Research Station P.O. Box 3890 Portland, OR 97208-3890
U.S. Department of Agriculture Pacific Northwest Research Station 333 SW First Avenue P.O. Box 3890 Portland, OR 97208-3890
Official Business Penalty for Private Use, $300


![Thinning - [email protected] Home](https://img.pdfslide.us/doc/110x75/613d1c55736caf36b7596fee/thinning-emailprotected-home.jpg)