Embed Size (px)
DESCRIPTION
Thinking Interactively with Visualizations. Remco Chang UNC Charlotte Charlotte Visualization Center. Role of Interaction. Most people in the visualization community believe that interactivity is essential for visualization and visual analytics: - PowerPoint PPT Presentation
Citation preview
ProvenanceIntro Urban Vis Analytics Wrap-up
Thinking Interactively with Visualizations
Remco Chang
UNC CharlotteCharlotte Visualization Center
ProvenanceIntro Urban Vis Analytics Wrap-up
Role of Interaction
• Most people in the visualization community believe that interactivity is essential for visualization and visual analytics:– “A [visual] analysis session is more of a dialog between
the analyst and the data… the manifestation of this dialog is the analyst’s interactions with the data representation” [Thomas & Cook 2005]
– “Without interaction, [a visualization] technique or system becomes a static image or autonomously animated images” [Yi et al. 2007]
ProvenanceIntro Urban Vis Analytics Wrap-up
Role of Interaction
• However, there has been limited research in visualization specific to interaction and techniques [Yi et al. 2007]– “Interaction is often relegated to a secondary role in these
articles. Interaction rarely is the main focus of research efforts in the field, essentially making it the “little brother” of Infovis”
• The goal of this talk is to consider the role of interaction in computer graphics, information visualization, and visual analytics.
• First, we think about what interactivity is and how to make a visualization interactive.
ProvenanceIntro Urban Vis Analytics Wrap-up
Offline Rendering
ProvenanceIntro Urban Vis Analytics Wrap-up
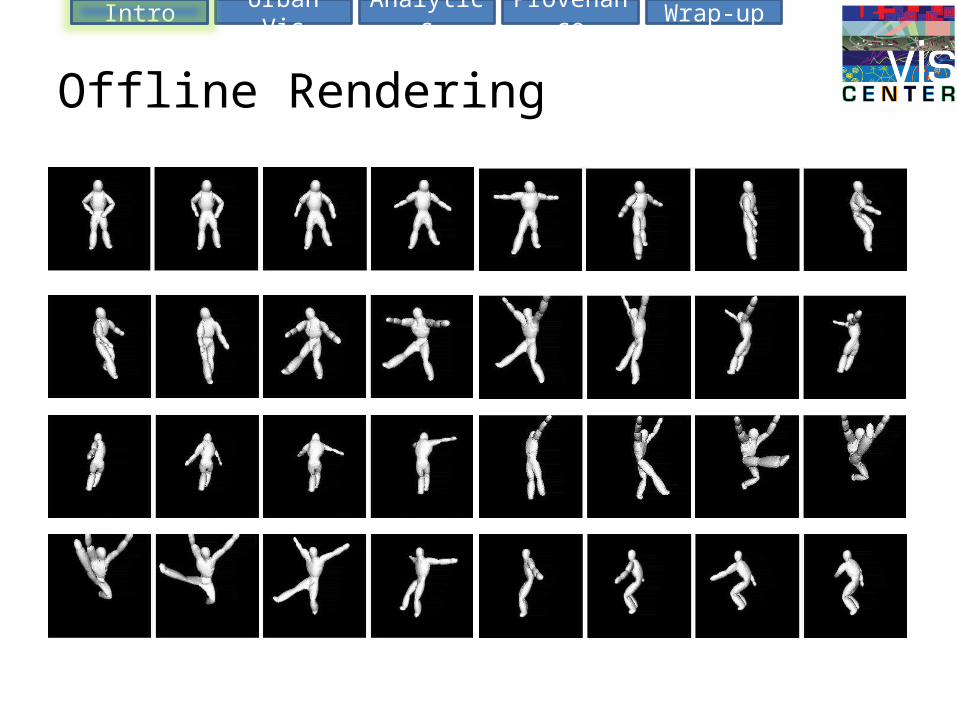
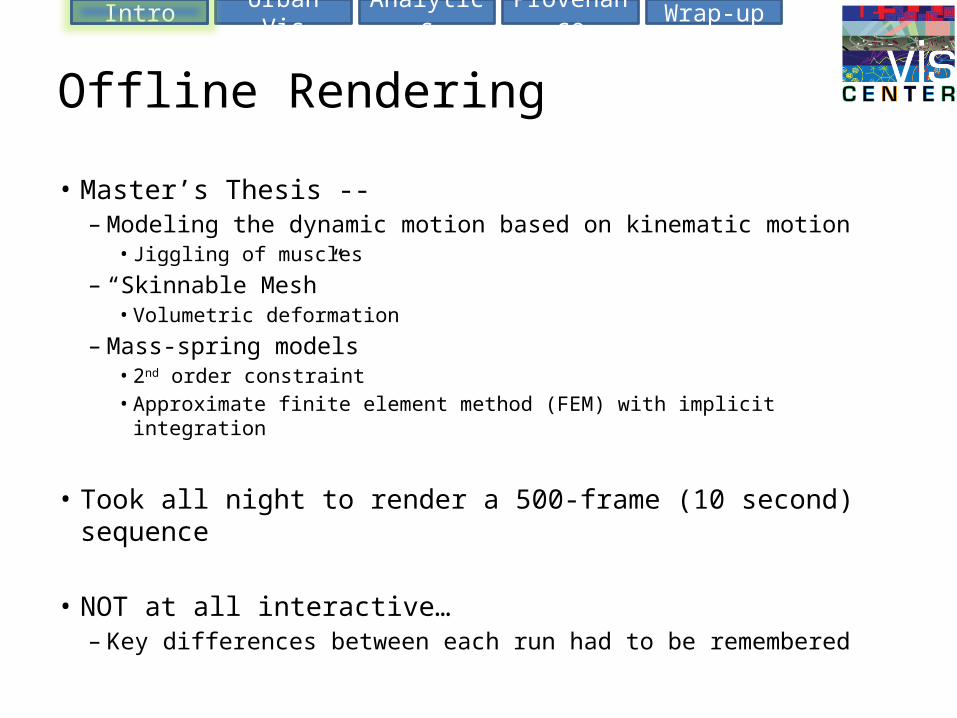
Offline Rendering
• Master’s Thesis -- – Modeling the dynamic motion based on kinematic motion
• Jiggling of muscles
– “Skinnable Mesh” • Volumetric deformation
– Mass-spring models• 2nd order constraint• Approximate finite element method (FEM) with implicit integration
• Took all night to render a 500-frame (10 second) sequence
• NOT at all interactive…– Key differences between each run had to be remembered
ProvenanceIntro Urban Vis Analytics Wrap-up
Thinking about Interactivity in Graphics
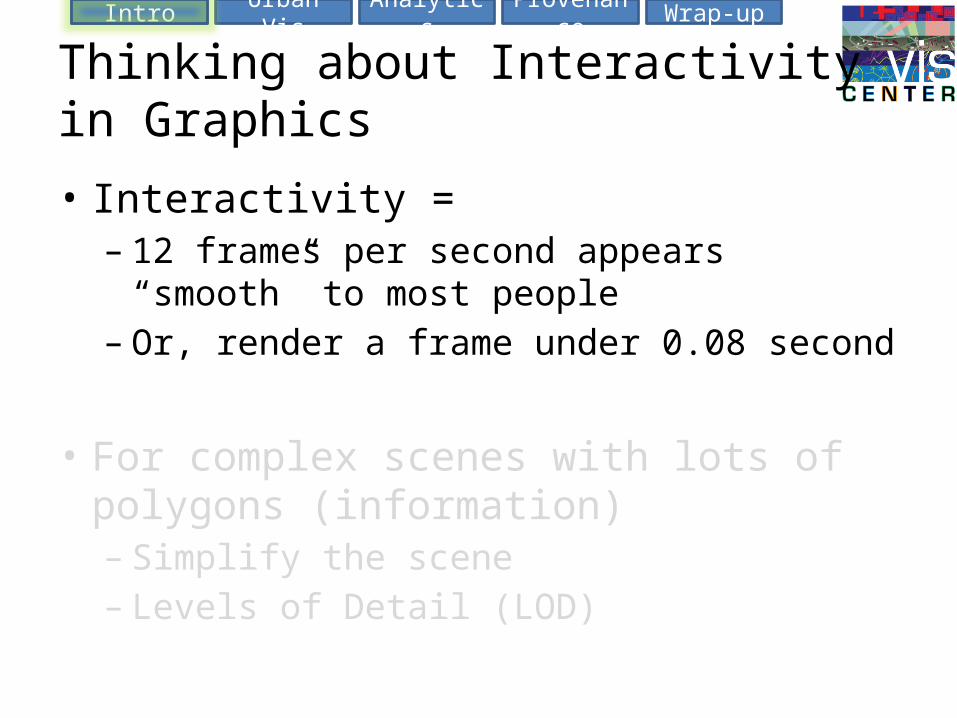
• Interactivity =– 12 frames per second appears “smooth” to most
people– Or, render a frame under 0.08 second
• For complex scenes with lots of polygons (information)– Simplify the scene– Levels of Detail (LOD)
ProvenanceIntro Urban Vis Analytics Wrap-up
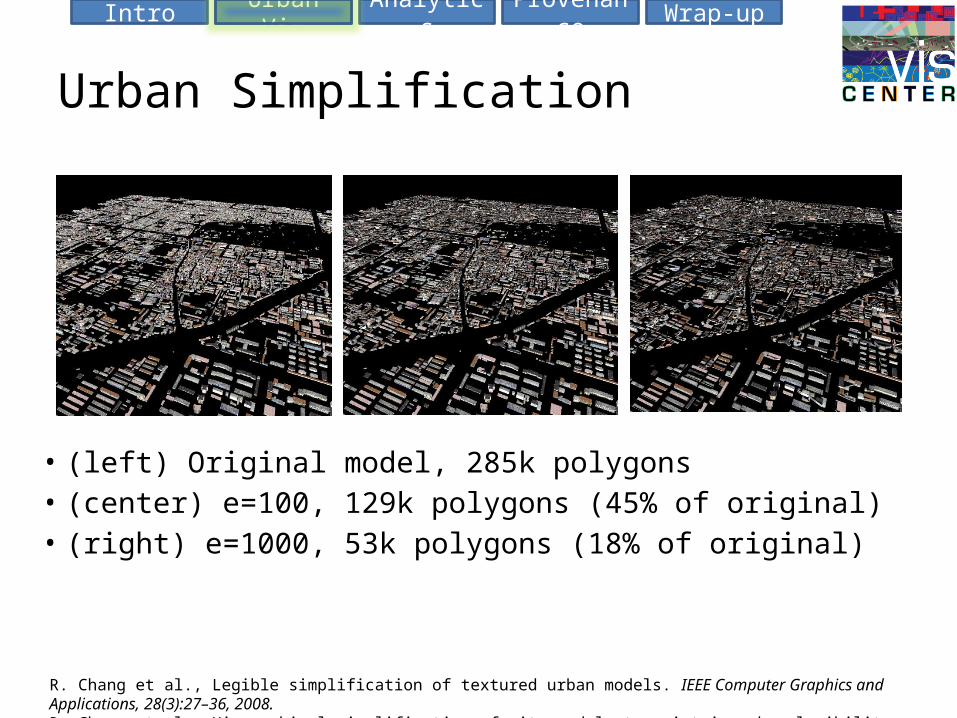
Urban Simplification
• (left) Original model, 285k polygons• (center) e=100, 129k polygons (45% of original)• (right) e=1000, 53k polygons (18% of original)
R. Chang et al., Legible simplification of textured urban models. IEEE Computer Graphics and Applications, 28(3):27–36, 2008.R. Chang et al., Hierarchical simplification of city models to maintain urban legibility. ACM SIGGRAPH 2006 Sketches, page 130 , 2006.
ProvenanceIntro Urban Vis Analytics Wrap-up
Urban Simplification
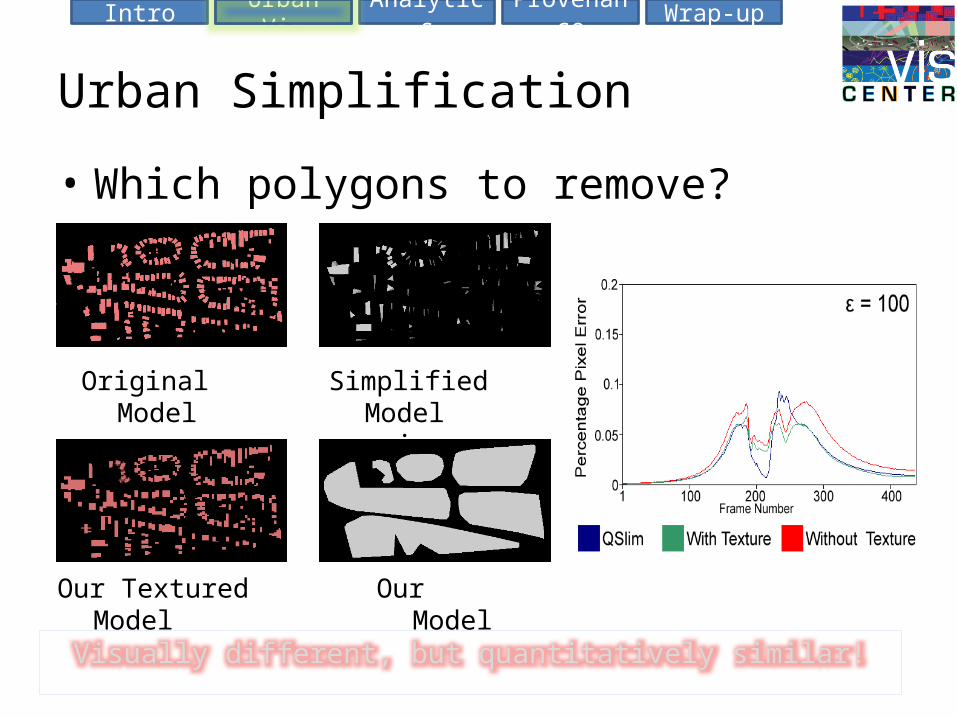
• Which polygons to remove?
Original Model Simplified Model using QSlim
Our Textured Model Our Model
Visually different, but quantitatively similar!
ProvenanceIntro Urban Vis Analytics Wrap-up
Urban Simplification
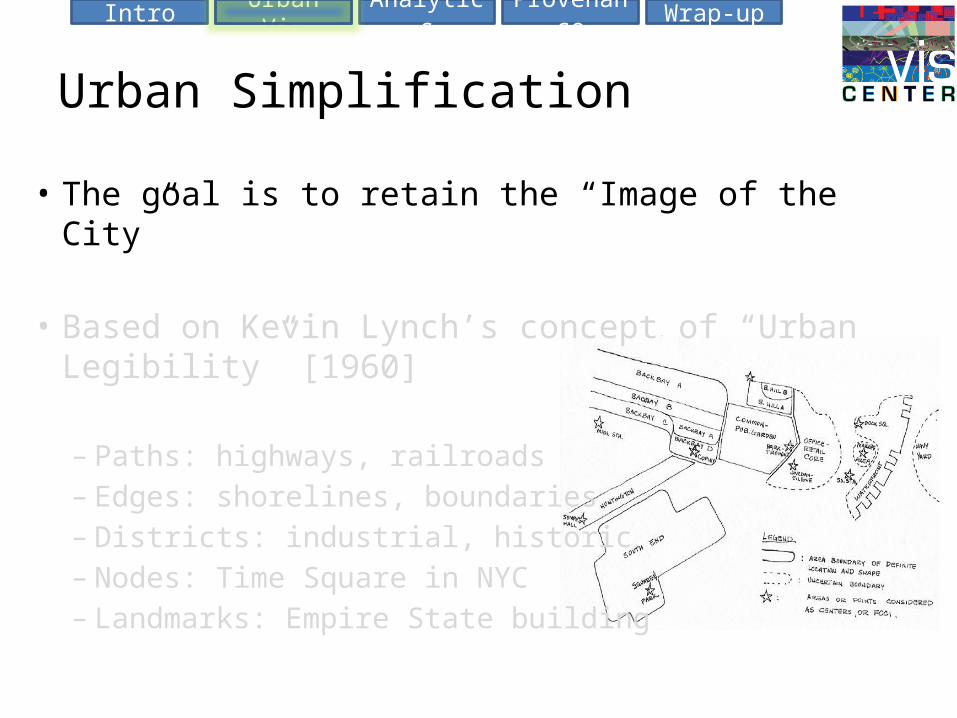
• The goal is to retain the “Image of the City”
• Based on Kevin Lynch’s concept of “Urban Legibility” [1960]
– Paths: highways, railroads– Edges: shorelines, boundaries– Districts: industrial, historic– Nodes: Time Square in NYC– Landmarks: Empire State building
ProvenanceIntro Urban Vis Analytics Wrap-up
Urban Visualization with Semantics
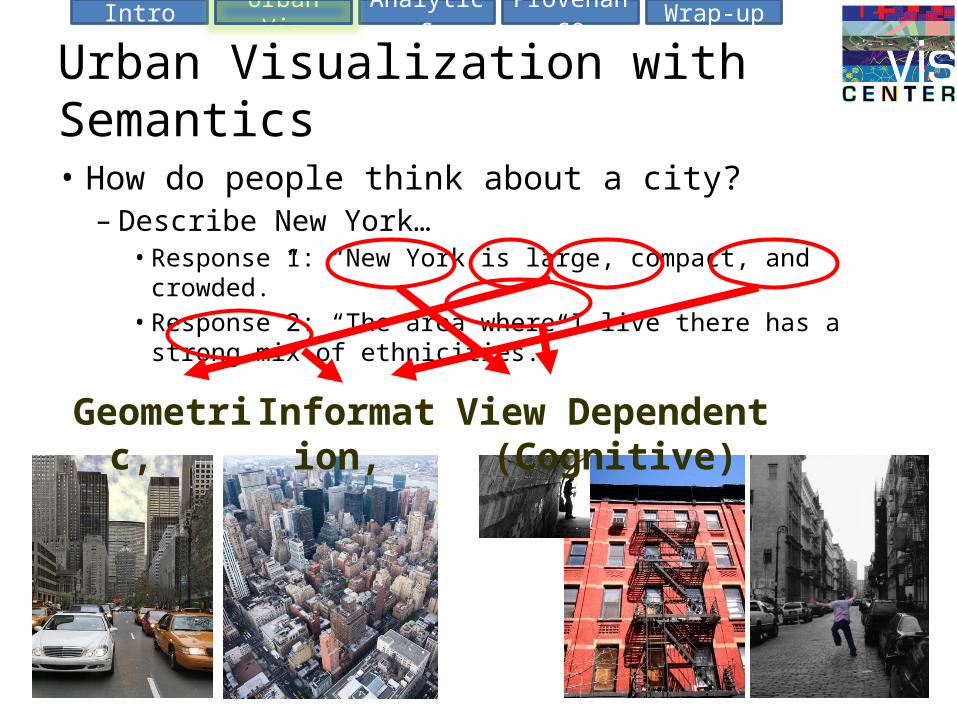
• How do people think about a city?– Describe New York…
• Response 1: “New York is large, compact, and crowded.”• Response 2: “The area where I live there has a strong mix of
ethnicities.”
Geometric, Information, View Dependent (Cognitive)
ProvenanceIntro Urban Vis Analytics Wrap-up
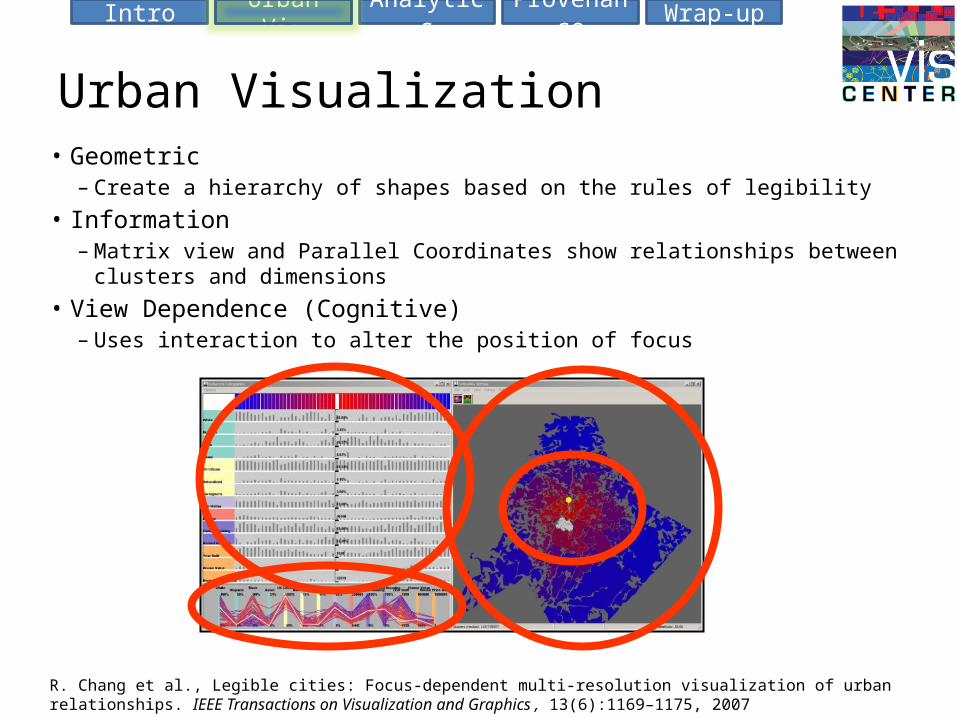
Urban Visualization• Geometric
– Create a hierarchy of shapes based on the rules of legibility• Information
– Matrix view and Parallel Coordinates show relationships between clusters and dimensions
• View Dependence (Cognitive)– Uses interaction to alter the position of focus
R. Chang et al., Legible cities: Focus-dependent multi-resolution visualization of urban relationships. IEEE Transactions on Visualization and Graphics , 13(6):1169–1175, 2007
ProvenanceIntro Urban Vis Analytics Wrap-up
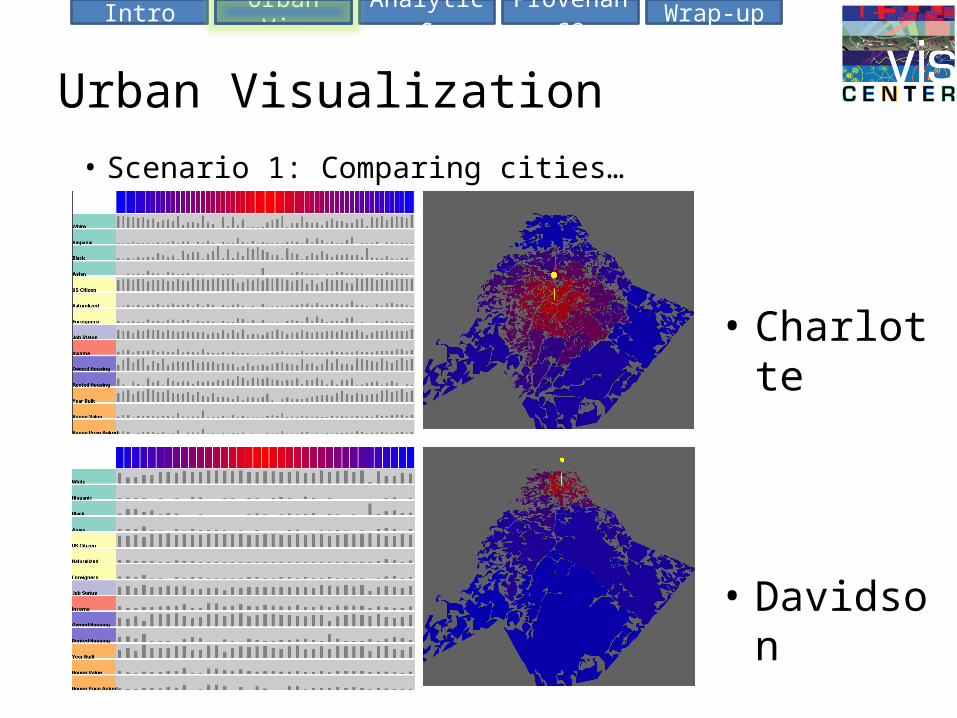
Urban Visualization
• Charlotte
• Davidson
• Scenario 1: Comparing cities…
ProvenanceIntro Urban Vis Analytics Wrap-up
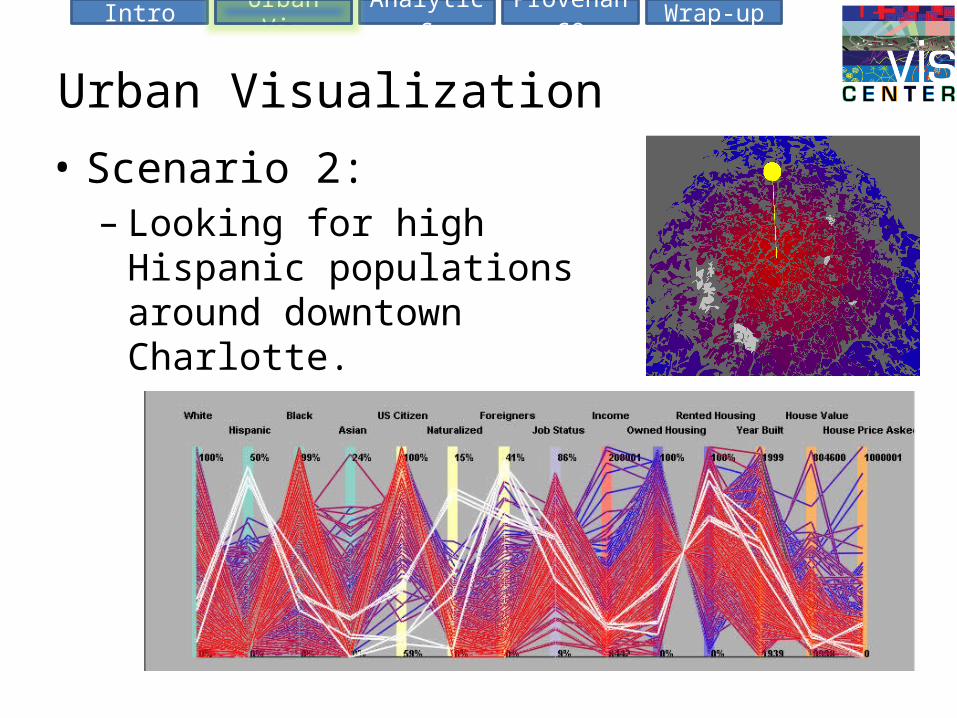
Urban Visualization
• Scenario 2:– Looking for high Hispanic
populations around downtown Charlotte.
ProvenanceIntro Urban Vis Analytics Wrap-up
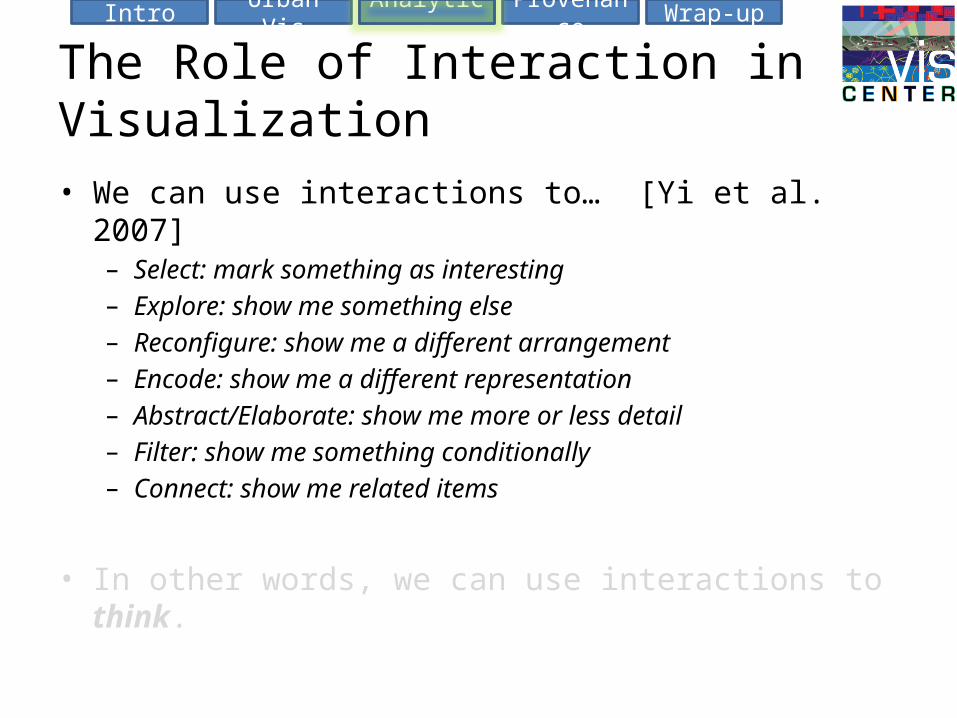
The Role of Interaction in Visualization
• We can use interactions to… [Yi et al. 2007]– Select: mark something as interesting– Explore: show me something else– Reconfigure: show me a different arrangement– Encode: show me a different representation– Abstract/Elaborate: show me more or less detail– Filter: show me something conditionally– Connect: show me related items
• In other words, we can use interactions to think.
ProvenanceIntro Urban Vis Analytics Wrap-up
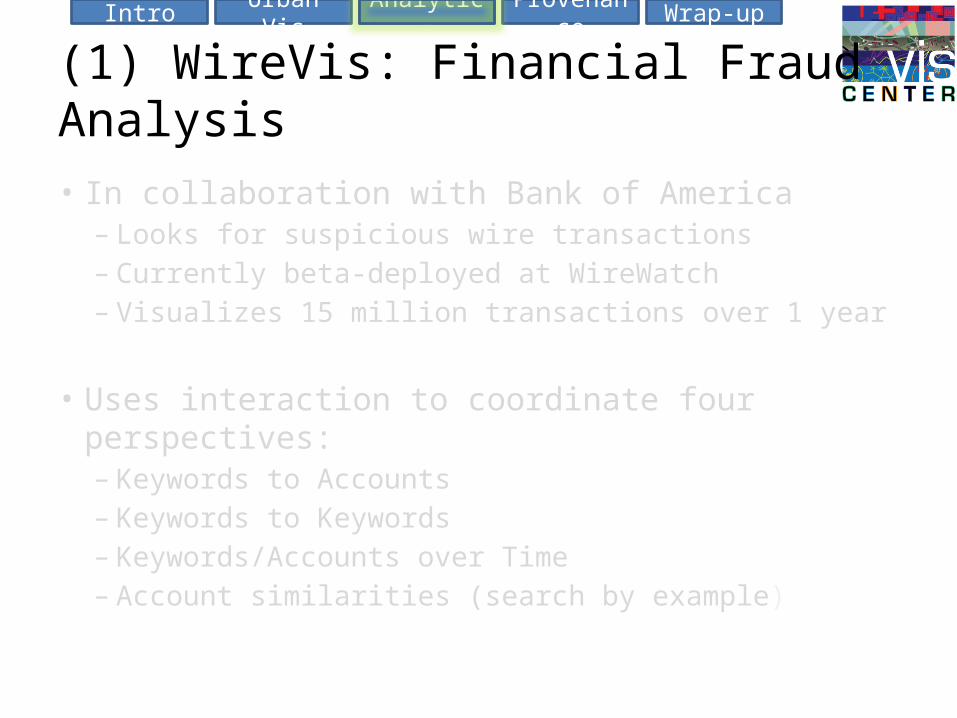
(1) WireVis: Financial Fraud Analysis
• In collaboration with Bank of America– Looks for suspicious wire transactions– Currently beta-deployed at WireWatch– Visualizes 15 million transactions over 1 year
• Uses interaction to coordinate four perspectives:– Keywords to Accounts– Keywords to Keywords– Keywords/Accounts over Time– Account similarities (search by example)
ProvenanceIntro Urban Vis Analytics Wrap-up
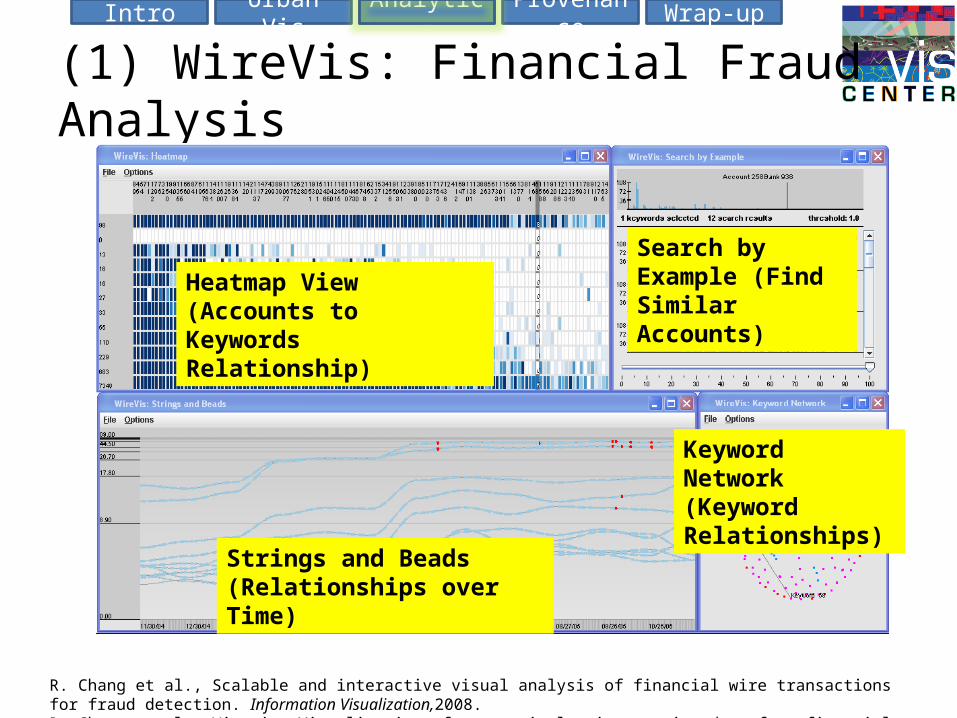
(1) WireVis: Financial Fraud Analysis
Heatmap View(Accounts to Keywords Relationship)
Strings and Beads(Relationships over Time)
Search by Example (Find Similar Accounts)
Keyword Network(Keyword Relationships)
R. Chang et al., Scalable and interactive visual analysis of financial wire transactions for fraud detection. Information Visualization,2008.R. Chang et al., Wirevis: Visualization of categorical, time-varying data from financial transactions. IEEE VAST, 2007.
ProvenanceIntro Urban Vis Analytics Wrap-up
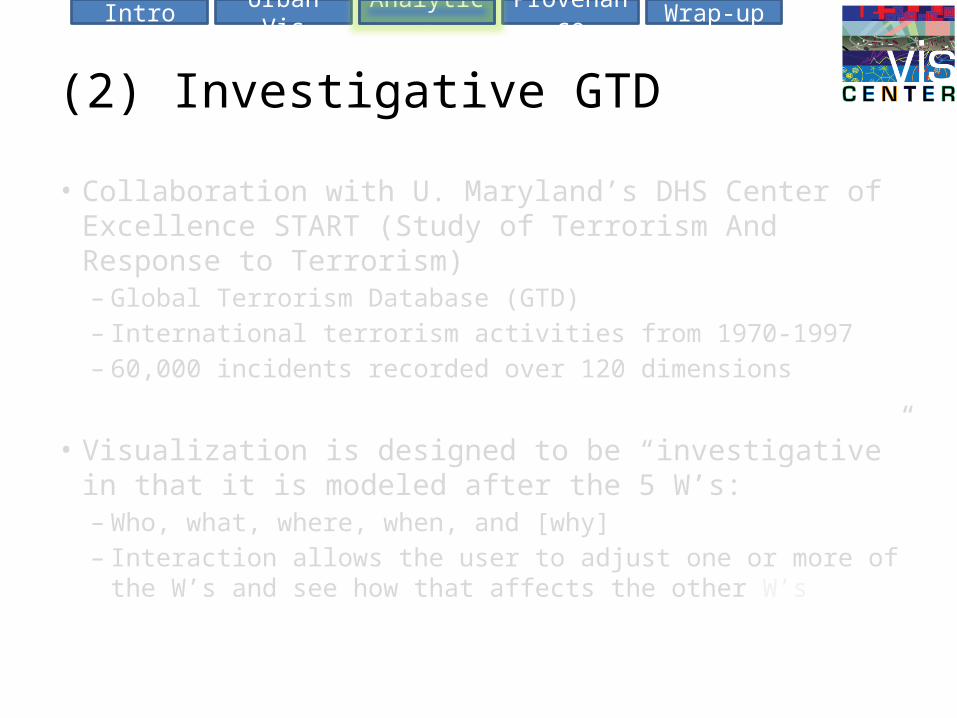
(2) Investigative GTD
• Collaboration with U. Maryland’s DHS Center of Excellence START (Study of Terrorism And Response to Terrorism)– Global Terrorism Database (GTD)– International terrorism activities from 1970-1997– 60,000 incidents recorded over 120 dimensions
• Visualization is designed to be “investigative” in that it is modeled after the 5 W’s:– Who, what, where, when, and [why]– Interaction allows the user to adjust one or more of the W’s and
see how that affects the other W’s
ProvenanceIntro Urban Vis Analytics Wrap-up
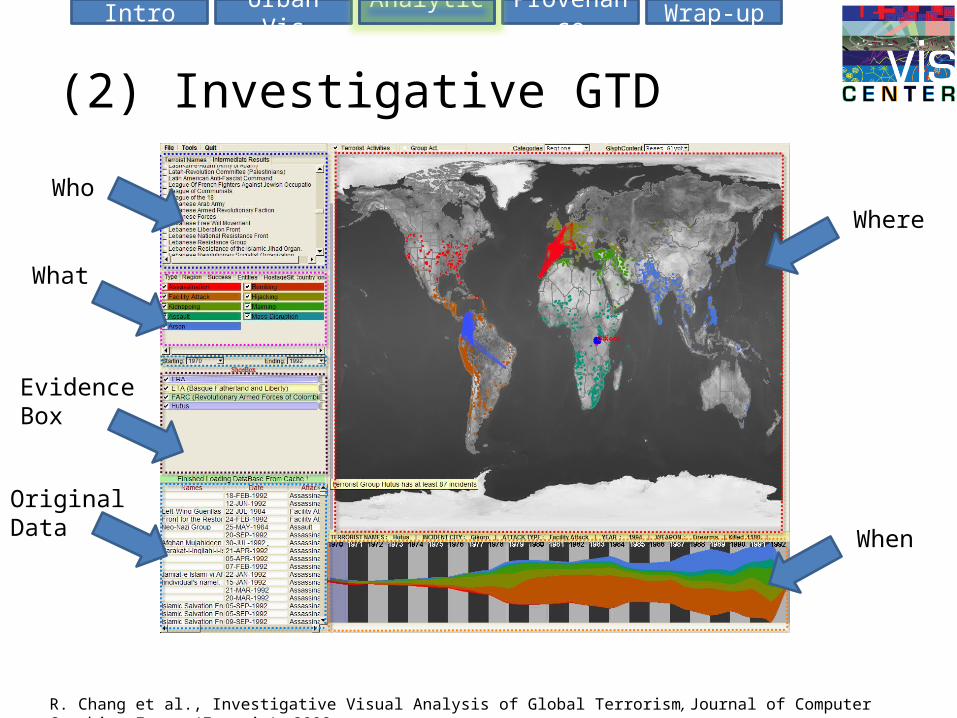
(2) Investigative GTD
Where
When
Who
What
Original Data
EvidenceBox
R. Chang et al., Investigative Visual Analysis of Global Terrorism, Journal of Computer Graphics Forum (Eurovis), 2008.
ProvenanceIntro Urban Vis Analytics Wrap-up
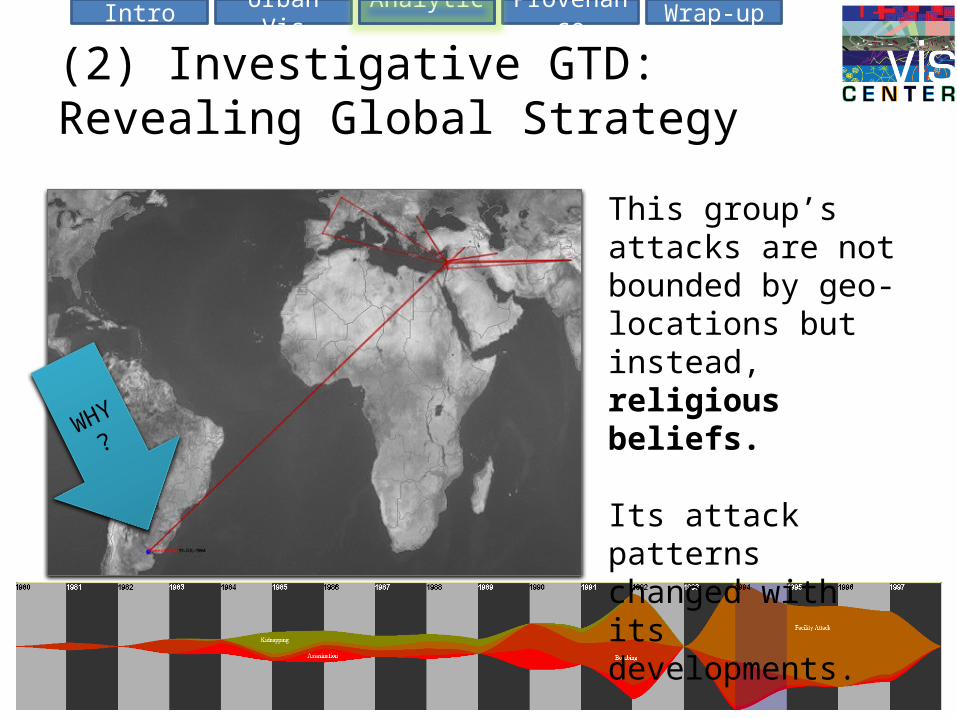
WHY?
This group’s attacks are not bounded by geo-locations but instead, religious beliefs.
Its attack patterns changed with its developments.
(2) Investigative GTD: Revealing Global Strategy
ProvenanceIntro Urban Vis Analytics Wrap-up
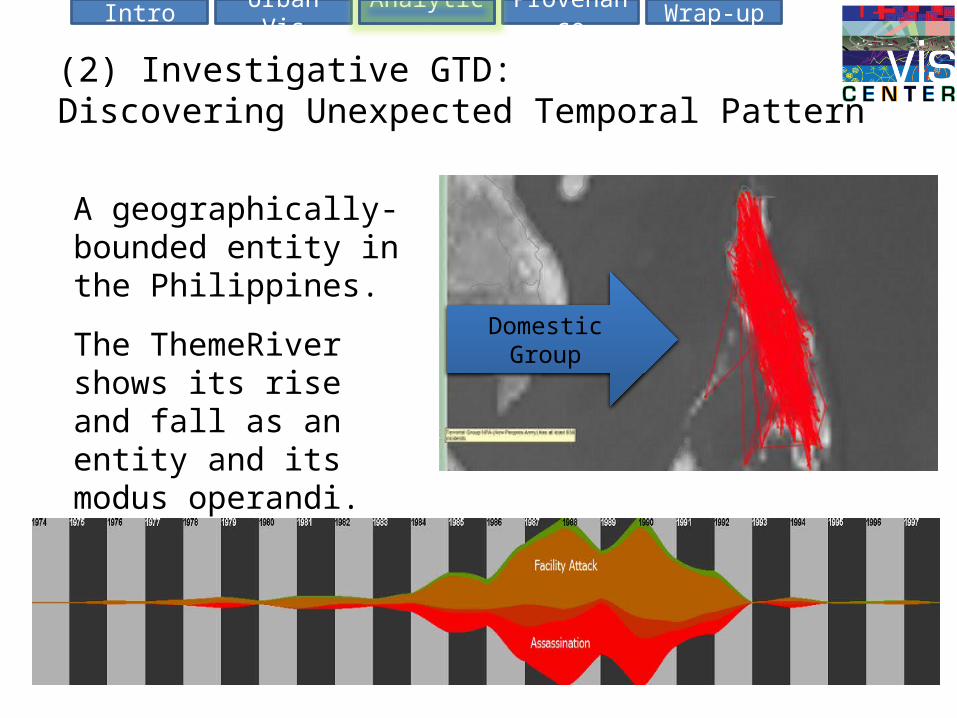
Domestic Group
A geographically-bounded entity in the Philippines.
The ThemeRiver shows its rise and fall as an entity and its modus operandi.
(2) Investigative GTD:Discovering Unexpected Temporal Pattern
ProvenanceIntro Urban Vis Analytics Wrap-up
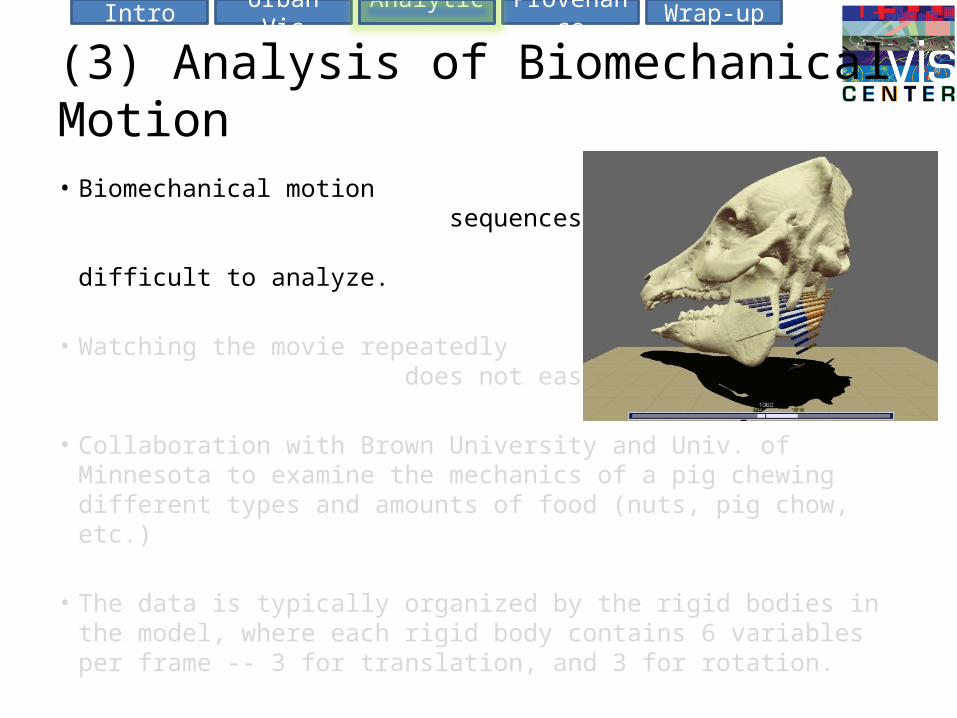
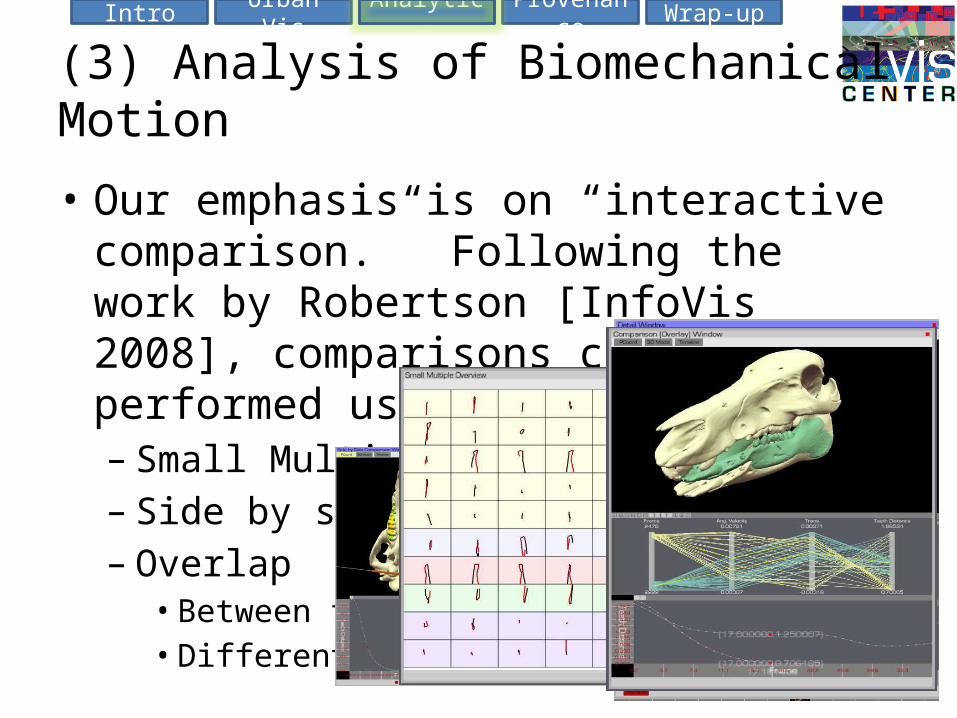
(3) Analysis of Biomechanical Motion
• Biomechanical motion sequences (animation) are difficult to analyze.
• Watching the movie repeatedly does not easily lead to insight.
• Collaboration with Brown University and Univ. of Minnesota to examine the mechanics of a pig chewing different types and amounts of food (nuts, pig chow, etc.)
• The data is typically organized by the rigid bodies in the model, where each rigid body contains 6 variables per frame -- 3 for translation, and 3 for rotation.
ProvenanceIntro Urban Vis Analytics Wrap-up
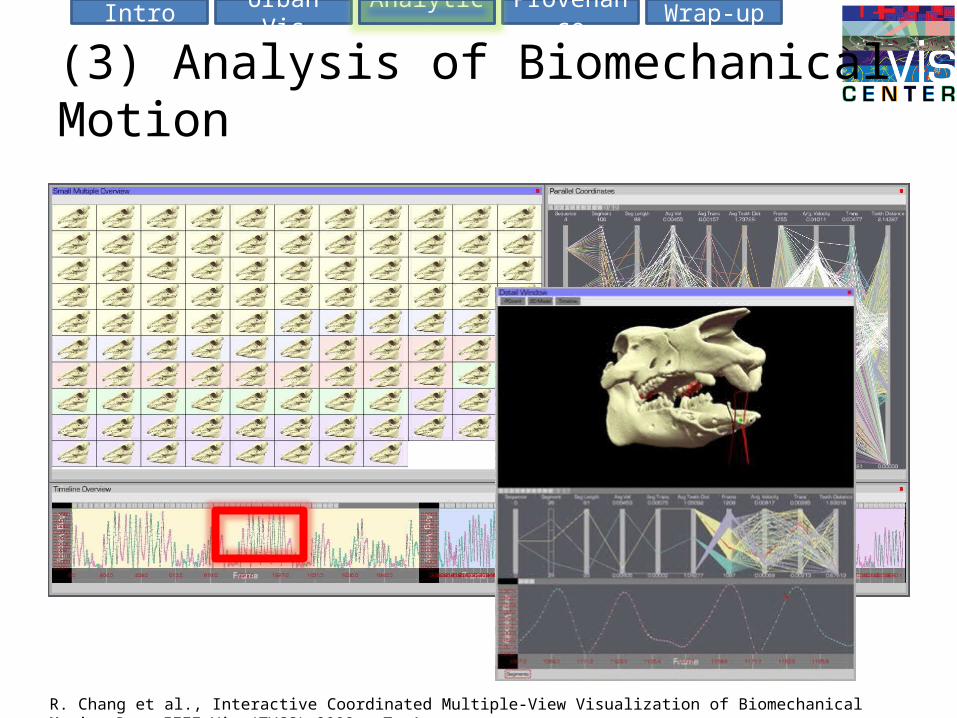
(3) Analysis of Biomechanical Motion
R. Chang et al., Interactive Coordinated Multiple-View Visualization of Biomechanical Motion Data , IEEE Vis (TVCG) 2009. To Appear.
ProvenanceIntro Urban Vis Analytics Wrap-up
• Our emphasis is on “interactive comparison.” Following the work by Robertson [InfoVis 2008], comparisons can be performed using:– Small Multiples– Side by side comparison– Overlap • Between two datasets• Different cycles in the same data
(3) Analysis of Biomechanical Motion
ProvenanceIntro Urban Vis Analytics Wrap-up
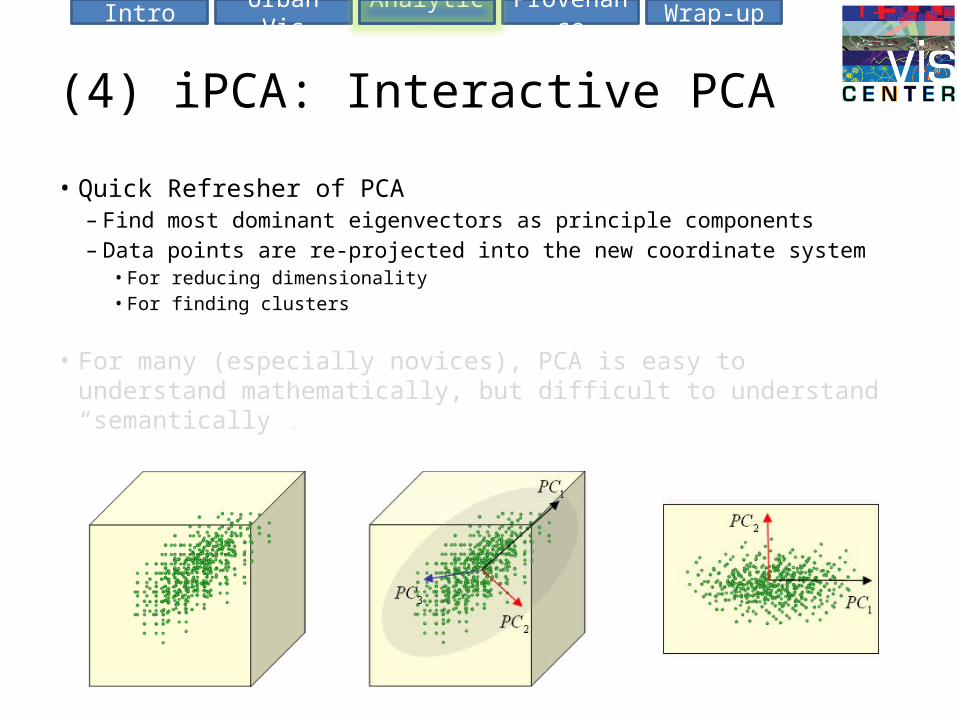
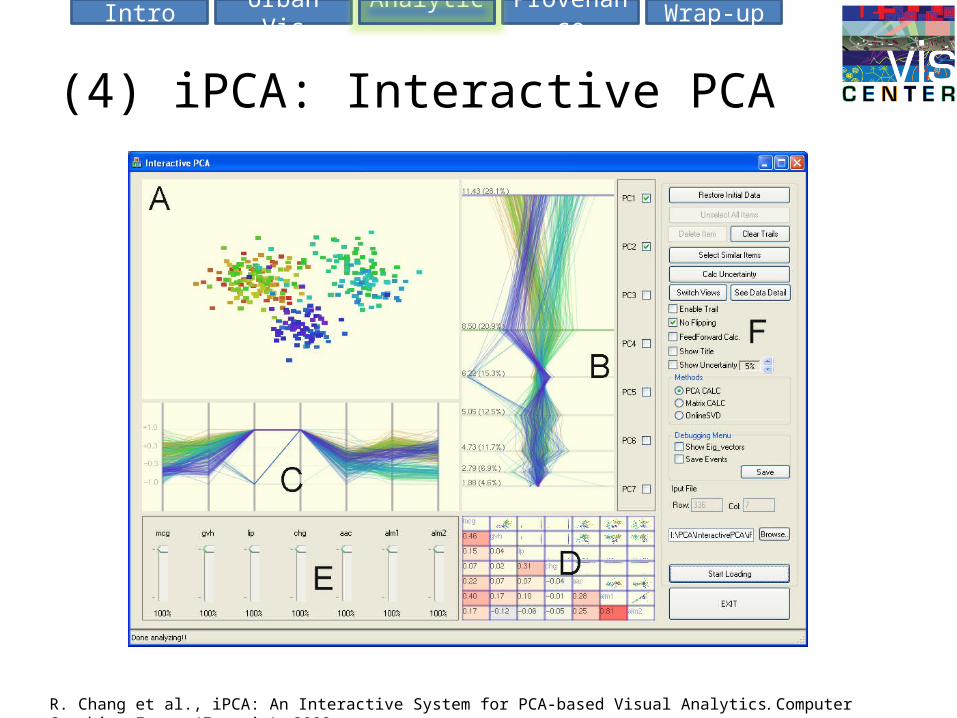
(4) iPCA: Interactive PCA
• Quick Refresher of PCA– Find most dominant eigenvectors as principle components– Data points are re-projected into the new coordinate system
• For reducing dimensionality• For finding clusters
• For many (especially novices), PCA is easy to understand mathematically, but difficult to understand “semantically”.
ProvenanceIntro Urban Vis Analytics Wrap-up
(4) iPCA: Interactive PCA
R. Chang et al., iPCA: An Interactive System for PCA-based Visual Analytics. Computer Graphics Forum (Eurovis), 2009.
ProvenanceIntro Urban Vis Analytics Wrap-up
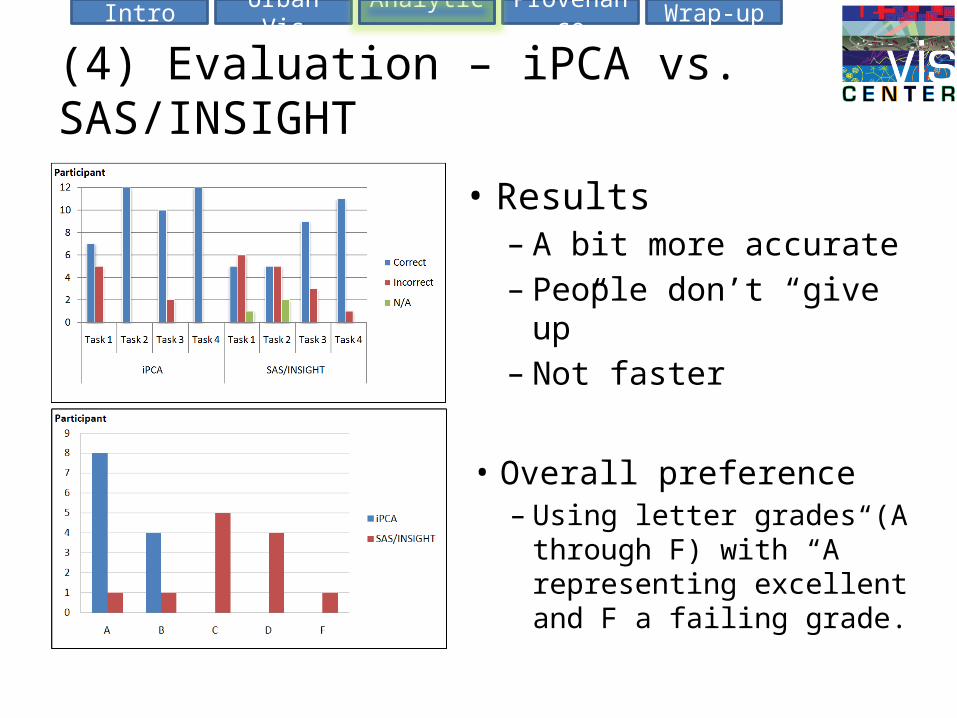
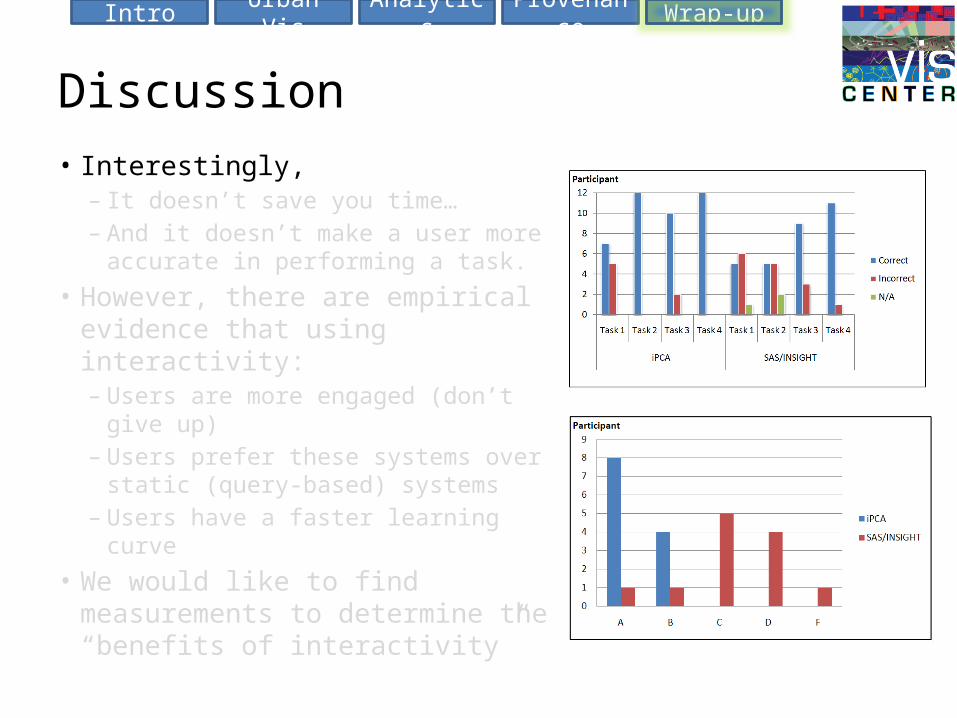
(4) Evaluation – iPCA vs. SAS/INSIGHT
• Results– A bit more accurate– People don’t “give up”– Not faster
• Overall preference– Using letter grades (A
through F) with “A” representing excellent and F a failing grade.
ProvenanceIntro Urban Vis Analytics Wrap-up
If (Interactions == Thinking)…
• What is in a user’s interactions?
• If (interactions == thinking), what can we learn from the user’s interactions?
• Is it possible to extract “thinking” from “interactions”?
ProvenanceIntro Urban Vis Analytics Wrap-up
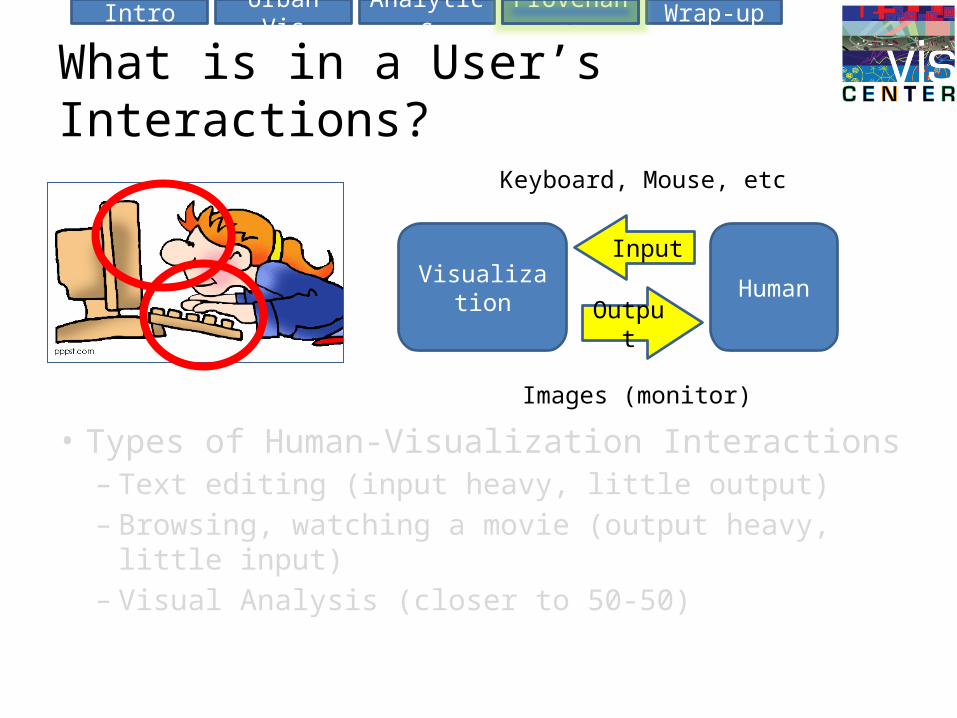
What is in a User’s Interactions?
• Types of Human-Visualization Interactions– Text editing (input heavy, little output)– Browsing, watching a movie (output heavy, little input)– Visual Analysis (closer to 50-50)
Visualization HumanOutput
Input
Keyboard, Mouse, etc
Images (monitor)
ProvenanceIntro Urban Vis Analytics Wrap-up
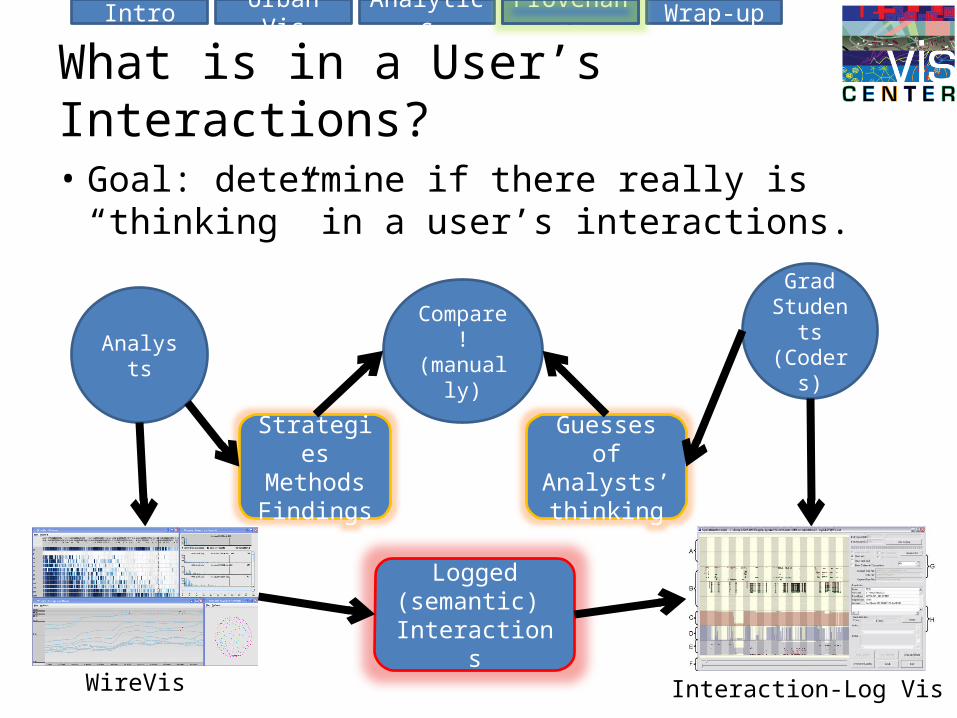
What is in a User’s Interactions?
• Goal: determine if there really is “thinking” in a user’s interactions.
Analysts
GradStudents(Coders)
Logged(semantic) Interactions
Compare!(manually)
StrategiesMethodsFindings
Guesses ofAnalysts’ thinking
WireVis Interaction-Log Vis
ProvenanceIntro Urban Vis Analytics Wrap-up
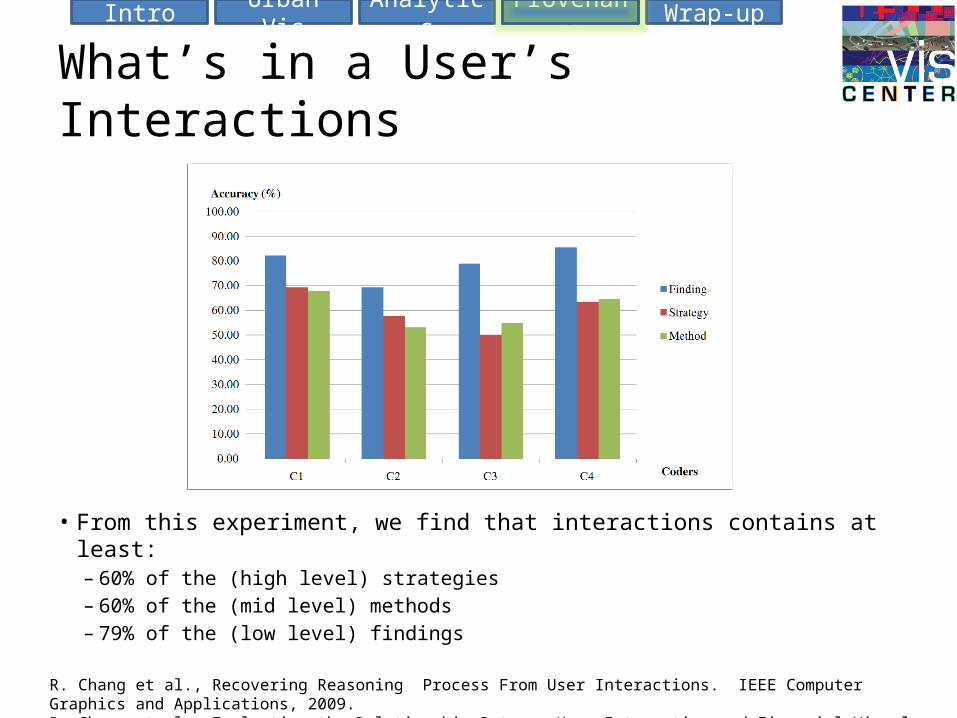
What’s in a User’s Interactions
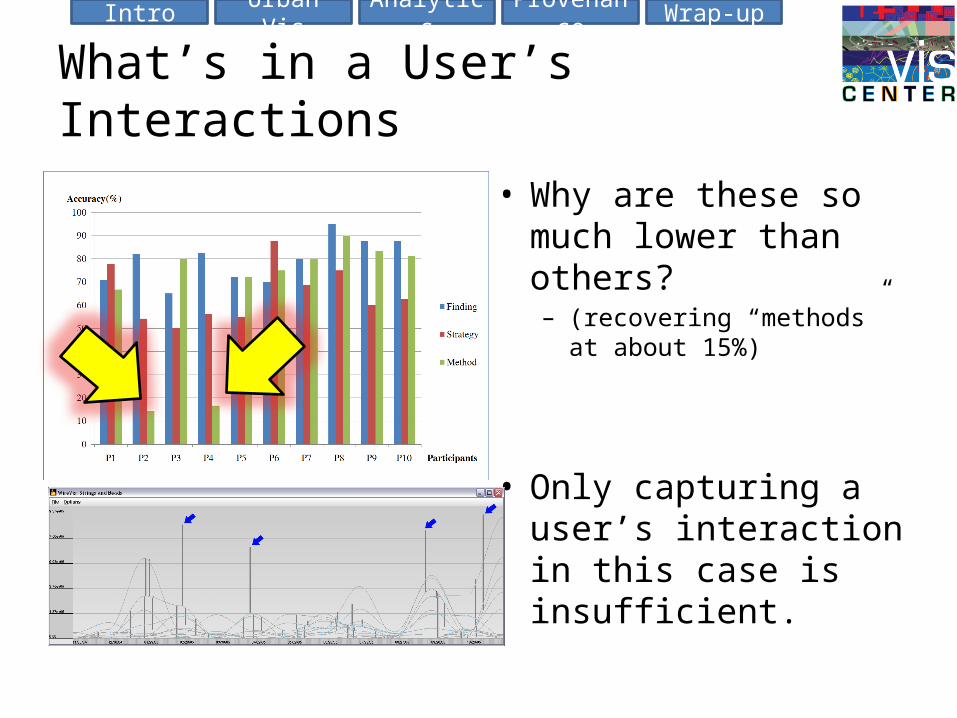
• From this experiment, we find that interactions contains at least:– 60% of the (high level) strategies– 60% of the (mid level) methods– 79% of the (low level) findings
R. Chang et al., Recovering Reasoning Process From User Interactions. IEEE Computer Graphics and Applications, 2009.R. Chang et al., Evaluating the Relationship Between User Interaction and Financial Visual Analysis. IEEE Symposium on VAST, 2009.
ProvenanceIntro Urban Vis Analytics Wrap-up
What’s in a User’s Interactions
• Why are these so much lower than others?– (recovering “methods” at
about 15%)
• Only capturing a user’s interaction in this case is insufficient.
ProvenanceIntro Urban Vis Analytics Wrap-up
Lessons Learned• We have proven that a great deal of an analyst’s “thinking” in using a
visualization is capturable and extractable.
• Using semantic interaction capturing, we might be able to collect all the thinking of expert analysts and create a knowledge database that is useful for – Training: many domain specific analytics tasks are difficult to teach– Guidance: use existing knowledge to guide future analyses– Verification, and validation: go back and check to see if everything was done
right.
• But not all visualizations are interactive, and not all thinking is reflected in the interactions.– A model of how and what to capture in a visualization for extracting an
analyst’s thinking process is necessary.– Work is currently in preparation for publication.
ProvenanceIntro Urban Vis Analytics Wrap-up
Conclusion
• Interactions are important for visualization and visual analysis– In considering interactions, one must be aware of the necessary
speed and frame rate of the displays.• Simplification, LOD, and approximation methods can be used, but they
must retain the salient features in the original data.
– Interactions have been proven to help the understanding of complex problems.• Relevant interactions have been integrated in multiple visualizations for
different domains and demonstrated significant impact.
– Capturing and storing analysts’ interactions have great potential• They can be aggregated to become a “knowledge database” that has
traditionally been difficult to create manually.
ProvenanceIntro Urban Vis Analytics Wrap-up
Discussion
• What interactivity is not good for:– Presentation– YMMV = “your mileage may vary”• Reproducibility: Users behave differently each time.• Evaluation is difficult due to opportunistic discoveries..
– Often sacrifices accuracy• iPCA – SVD takes time on large datasets, use iterative
approximation algorithms such as onlineSVD.• WireVis – Clustering of large datasets is slow. Either
pre-compute or use more trivial “binning” methods.
ProvenanceIntro Urban Vis Analytics Wrap-up
Discussion• Interestingly,
– It doesn’t save you time…– And it doesn’t make a user more
accurate in performing a task.• However, there are empirical
evidence that using interactivity:– Users are more engaged (don’t give
up)– Users prefer these systems over
static (query-based) systems– Users have a faster learning curve
• We would like to find measurements to determine the “benefits of interactivity”
ProvenanceIntro Urban Vis Analytics Wrap-up
Future Work
• Interactive Urban Visualization– Visualizing a Semantic City. An ideal goal would be to have a “semantic”
Google Map that shows more than street layouts, but describes neighborhood characteristics.
– Further studies on what a “cognitive map” is and how a person gains and maintains spatial awareness.
• Applying Interaction in visualizations– Funded NSF proposal applies visualization to studying science policies– Another funded NSF proposal applies visualization to discovering the causes
and effects of civil strife– Funded DHS proposal to evaluate “the benefits of interactions”…
• Interaction Capturing (Provenance)– Semi-automatic method for analyzing what’s in the interaction logs.– Look to collaborate with PNNL on developing generalizable structures for
recording provenance.
ProvenanceIntro Urban Vis Analytics Wrap-up
Thank you!
[email protected]://www.viscenter.uncc.edu/~rchang
ProvenanceIntro Urban Vis Analytics Wrap-up
Backup Slides
ProvenanceIntro Urban Vis Analytics Wrap-up
Journal Publications (11)
• Visualization– Urban Visualization
• Remco Chang, Thomas Butkiewicz, Caroline Ziemkiewicz, Zachary Wartell, Nancy Pollard, and William Ribarsky. Legible simplification of textured urban models. IEEE Computer Graphics and Applications, 28(3):27–36, 2008.
• Thomas Butkiewicz, Remco Chang, Zachary Wartell, and William Ribarsky. Visual analysis of urban change. Computer Graaphics Forum, 27(3):903–910, 2008.
• Thomas Butkiewicz, Remco Chang, William Ribarsky, and Zachary Wartell. Understanding Dynamics of Geographic Domains, chapter Visual Analysis of Urban Terrain Dynamics, pages 151– 169. CRC Press/Taylor and Francis, 2007.
• Remco Chang, Ginette Wessel, Robert Kosara, Eric Sauda, and William Ribarsky. Legible cities: Focus-dependent multi-resolution visualization of urban relationships. Visualization and Computer Graaphics, IEEE Transactions on, 13(6):1169–1175, Nov.-Dec. 2007.
– Visualization and Visual Analytics• Dong Hyun Jeong, Caroline Ziemkiewicz, Brian Fisher, William Ribarsky, and Remco Chang. iPCA: An interactive system for PCA-based
visual analytics. Computer Graphics Forum, 2009. to appear.• Remco Chang, Caroline Ziemkiewicz, Tera Marie Green, and William Ribarsky. Defining insight for visual analytics. IEEE Computer Graphics
and Applications, 29(2):14–17, 2009.• Remco Chang, Alvin Lee, Mohammad Ghoniem, Robert Kosara, William Ribarsky, Jing Yang, Evan Suma, Caroline Ziemkiewicz, Daniel
Kern, and Agus Sudjianto. Scalable and interactive visual analysis of financial wire transactions for fraud detection. Information Visualization, 7:63–76(14), 2008.
• Xiaoyu Wang, Erin Miller, Kathleen Smarick, William Ribarsky, and Remco Chang. Investigative visual analysis of global terrorism database. Computer Graphics Forum, 27(3):919–926, 2008.
– Provenance• Wenwen Dou, Dong Hyun Jeong, Felesia Stukes, William Ribarsky, Heather Richter Lipford, and Remco Chang. Recovering reasoning
process from user interactions. IEEE Computer Graphics and Applications, 2009. to appear
• Graphics, Virtual Reality, and Interface Designs• Thomas Butkiewicz, Wenwen Dou, Zachary Wartell, William Ribarsky, and Remco Chang. Multi-focused geospatial analysis using probes.
Visualization and Computer Graphics, IEEE Transactions on, 14(6):1165–1172, Nov.-Dec. 2008.• Dong Hyun Jeong, Chang Song, Remco Chang, and Larry Hodges. User experimentation: An evaluation of velocity control techniques in
immersive virtual environments. Springer-Verlag Virtual Reality, 13(1):41–50, Mar. 2009.
ProvenanceIntro Urban Vis Analytics Wrap-up
Conference/Workshop (19)• Wenwen Dou, Dong Hyun Jeong, Felesia Stukes, William Ribarsky, Heather Richter Lipford, and Remco Chang. Comparing usage patterns of domain experts and
novices in visual analytical tasks. In ACM SIGCHI Sensemaking Workshop 2009, 2009.• Xiaoyu Wang, Wenwen Dou, Rashna Vatcha, Wanqiu Liu, Shen-En Chen, Seok-Won Lee, Remco Chang, and William Ribarsky. Knowledge integrated visual analysis of
bridge safety and maintenance. In Defense, Security and Sensing 2009, 2009. to appear.• Xiaoyu Wang, Wenwen Dou, William Ribarsky, and Remco Chang. Integration of heterogeneous processes through visual analytics. In Defense, Security and Sensing
2009, 2009. to appear.• Michael Butkiewicz, Thomas Butkiewicz, William Ribarsky, and Remco Chang. Integrating timeseries visualizations within parallel coordinates for exploratory analysis
of incident databases. In Defense, Security and Sensing 2009, 2009. to appear.• Thomas Butkiewicz, Dong Hyun Jeong, William Ribarsky, and Remco Chang. Hierarchical multitouch selection techniques for collaborative geospatial analysis. In
Defense, Security and Sensing 2009, 2009. to appear.• Dong Hyun Jeong, Remco Chang, and William Ribarsky. An alternative definition and model for knowledge visualization. In IEEE Visualization Workshop on Knowledge
Assisted Visualization, 2008.• Xiaoyu Wang, Wenwen Dou, Seok won Lee, William Ribarsky, and Remco Chang. Integrating visual analysis with ontological knowledge structure. In IEEE Visualization
Workshop on Knowledge Assisted Visualization, 2008.• Dong Hyun Jeong, Wenwen Dou, Felesia Stukes, William Ribarsky, Heather Richter Lipford, and Remco Chang. Evaluating the relationship between user interaction
and financial visual analysis. In Visual Analytics Science and Technology, 2008. VAST 2008. IEEE Symposium on, 2008.• Ginette Wessel, Remco Chang, and Eric Sauda. Towards a new (mapping of the) city: Interactive, data rich modes of urban legibility. In Association for Computer Aided
Design in Architecture, 2008.• Ginette Wessel, Remco Chang, and Eric Sauda. Visualizing gis: Urban form and data structure. In Dietmar Froehlick and Michaele Pride, editors, Seeking the City:
Visionaries on the Margins, 96th Annual Conference of Association of Collegiate Schools of Architecture (ACSA), pages 378–384. Association of Collegiate Schools of Architecture, 2008.
• Ginette Wessel, Eric Sauda, and Remco Chang. Urban visualization: Urban design and computer visualization. In CAADRIA 2008 Proceedings of the 13th International Conference on Computer Aided Architectural Design Research in Asia, pages 409–416, Chiang Mai, Thailand, April 9-12, 2008.
• Thomas Butkiewicz, Remco Chang, Zachary Wartell, and William Ribarsky. Visual analysis for live lidar battlefield change detection. volume 6983, page 69830B. SPIE, 2008.
• Josh Jones, Remco Chang, Thomas Butkiewicz, and William Ribarsky. Visualizing uncertainty for geographical information in the global terrorism database. volume 6983, page 69830E. SPIE, 2008.
• Alex Godwin, Remco Chang, Robert Kosara, and William Ribarsky. Visual analysis of entity relationships in the global terrorism database. volume 6983, page 69830G. SPIE, 2008.
• Thomas Butkiewicz, Remco Chang, Zachary Wartell, and William Ribarsky. Analyzing sampled terrain volumetrically with regard to error and geologic variation. volume 6495, page 64950O. SPIE, 2007.
• Remco Chang, Mohammad Ghoniem, Robert Kosara, William Ribarsky, Jing Yang, Evan Suma, Caroline Ziemkiewicz, Daniel Kern, and Agus Sudjianto. Wirevis: Visualization of categorical, time-varying data from financial transactions. In Visual Analytics Science and Technology, 2007. VAST 2007. IEEE Symposium on, pages 155–162, 30 2007-Nov. 1 2007.
• Remco Chang, Thomas Butkiewicz, Caroline Ziemkiewicz, Zachary Wartell, Nancy Pollard, and William Ribarsky. Hierarchical simplification of city models to maintain urban legibility. In SIGGRAPH ’06: ACM SIGGRAPH 2006 Sketches, page 130, New York, NY, USA, 2006. ACM.
• Remco Chang, Robert Kosara, Alex Godwin, and William Ribarsky. Towards a role of visualization in social modeling. AAAI 2009 Spring Symposium on Technosocial Predictive Analytics, 2009. to appear.
• Ginette Wessel, Eric Sauda, and Remco Chang. Mapping understanding:Transforming topographic maps into cognitive maps. GeoVis Hamburg Workshop, 2009.
ProvenanceIntro Urban Vis Analytics Wrap-up
Grants Awarded (3)
• NSF SciSIP: – A Visual Analytics Approach to Science and Innovation Policy.
• PI: William Ribarsky, Co-PIs: Jim Thomas, Remco Chang, Jing Yang. • $746,567. 2009-2012 (3 years).
• NSF BCS: – Collaborative Project: Terror, Conflict Processes, Organizations, & Ideologies: Completing the Picture.
• PI: Remco Chang• $100,000. 2009-2010 (2 years).
• DHS International Program: – Deriving and Applying Cognitive Principles for Human/Computer Approaches to Complex Analytical
Problems. • PI: William Ribarsky, Co-PIs: Brian Fisher, Remco Chang, John Dill. • $200,000. 2009-2010 (1 year).
• In Submission / Preparation– 1 other NSF proposal is pending reviews– 1 NSF and 1 NIH proposals are currently under preparation
ProvenanceIntro Urban Vis Analytics Wrap-up
Professional Activities
• Committee / Panelists– Committee Member: AAAI Spring-09 Symposium on Technosocial Predictive Analytics– Panelist: 3rd Annual DHS University Summit. Panel: Research to Reality– 3rd Annual DHS University Summit. Panel: Visual Analytics and Discrete Science Integration into the
DHS Center of Excellence Program• Invited Talks
– Dec 13, 2006 Google Inc. Simplification of Urban Models based on Urban Legibility– July 6, 2007 Naval Research Lab. Urban Visualization– Oct 4, 2007 Charlotte Viscenter. Urban Visualization– Oct 17, 2007 Charlotte Metropolitan GIS Users Group. GIS and Urban Visualization– Nov 19, 2007 START Center at University of Maryland. Integrated Visual Analysis of the Global
Terrorism Database– Nov 29, 2007 Charlotte Viscenter. Integrated Visual Analysis of the Global Terrorism Database– Jan 25, 2008 DoD/DHS Social Science Modeling and Information Visualization Symposium. Social
Science and Information Visualization on Terrorism and Multimedia– May 14, 2008 Charlotte Metropolitan GIS User Group. Multi-Focused Geospatial Analysis Using Probes– Aug 27, 2008 DoD/DHS Symposium for Overcoming the Information Challenge in Federated Analysis:
From Concept to Practice. Roadmap of Visualization– Mar 19, 2009 DHS University Summit. Panel: Research to Reality– Mar 19, 2009 DHS University Summit. Panel: Visual Analytics and Discrete Science Integration into the
DHS Center of Excellence Program
ProvenanceIntro Urban Vis Analytics Wrap-up
Introduction
• The common thread between all the journals and conference papers, talks, grants, etc. is the use of interactivity in graphics, visualization, and visual analytics.
• This presentation will focus on select projects and publications due to time constraint. For more information, see my website: www.viscenter.uncc.edu/~rchang
ProvenanceIntro Urban Vis Analytics Wrap-up
What is in a User’s Interactions?
• Approach: – Using WireVis, we captured 10 financial analysts’ interactions in
performing fraud detection.• Financial analysts are from Bank of America, (previous) Wachovia, etc.• Manufactured test dataset that has embedded known threat scenarios• The sessions are captured using screen-capturing, video camcorder, and
semantic interaction logging.
– The sessions were then converted (manually) to a text document:• High level: Strategies• Mid Level: Methods of implementation• Low Level: Findings
– We then hired 4 graduate students to “interpret” the financial analysts’ interactions• Using proprietary visualizations to examine the interaction logs
ProvenanceIntro Urban Vis Analytics Wrap-up
In a Tribute to Randy Pausch
• Here are my “head fakes”
– Visualizations are very useful for analysis of complex problems with large datasets.
– The Charlotte Visualization Center is a leader in the visual analytics community.