Embed Size (px)
Citation preview
HULAMIN SUSTAINABILITY REPORT for the year ended 31 December 2020 A
INTRODUCTION SOCIAL CAPITAL NATURAL CAPITAL HUMAN CAPITAL
Think future. Think aluminium.
SUSTAINABILITY REPORTFOR THE YEAR ENDED 31 DECEMBER 2020
HULAMIN SUSTAINABILITY REPORT for the year ended 31 December 2020
01 02
CONTENTS
INTRODUCTION
Chief Executive Officer’s report 2
About this report 4
Our key relationships 7
Independent assurance 8
SOCIAL CAPITAL
Preferential procurement 13
Enterprise and supplier development 17
Corporate social investment 18
Aluminium beneficiation initiative 22
HULAMIN SUSTAINABILITY REPORT for the year ended 31 December 2020 1
03 04 NATURAL CAPITAL
Natural capital 44
Scrap metal recycling 57
HUMAN CAPITAL
Human capital 60
Employee engagement 63
Employment equity 71
Safety 74
Health 76
image to go here
HULAMIN SUSTAINABILITY REPORT for the year ended 31 December 20202
INTRODUCTIONChief Executive Officer’s report 2
About this report 4
Our key relationships 7
Independent assurance 8
CHIEF EXECUTIVE OFFICER’S REPORT
01
In 2020, Hulamin showed its mettle in getting back onto its feet after the prior year challenges. Sustainability covers all aspects of business health and resilience, and starts with the internal desire to survive and thrive and to recover from adversity. Hulamin’s sustainability is driven by many medium- and longer-term actions such as energy consumption, waste disposal and carbon footprint, yet comes directly into focus during high risk periods such as experienced during the 2020 COVID-19 pandemic.
HULAMIN SUSTAINABILITY REPORT for the year ended 31 December 2020 3
INTRODUCTION SOCIAL CAPITAL NATURAL CAPITAL HUMAN CAPITAL
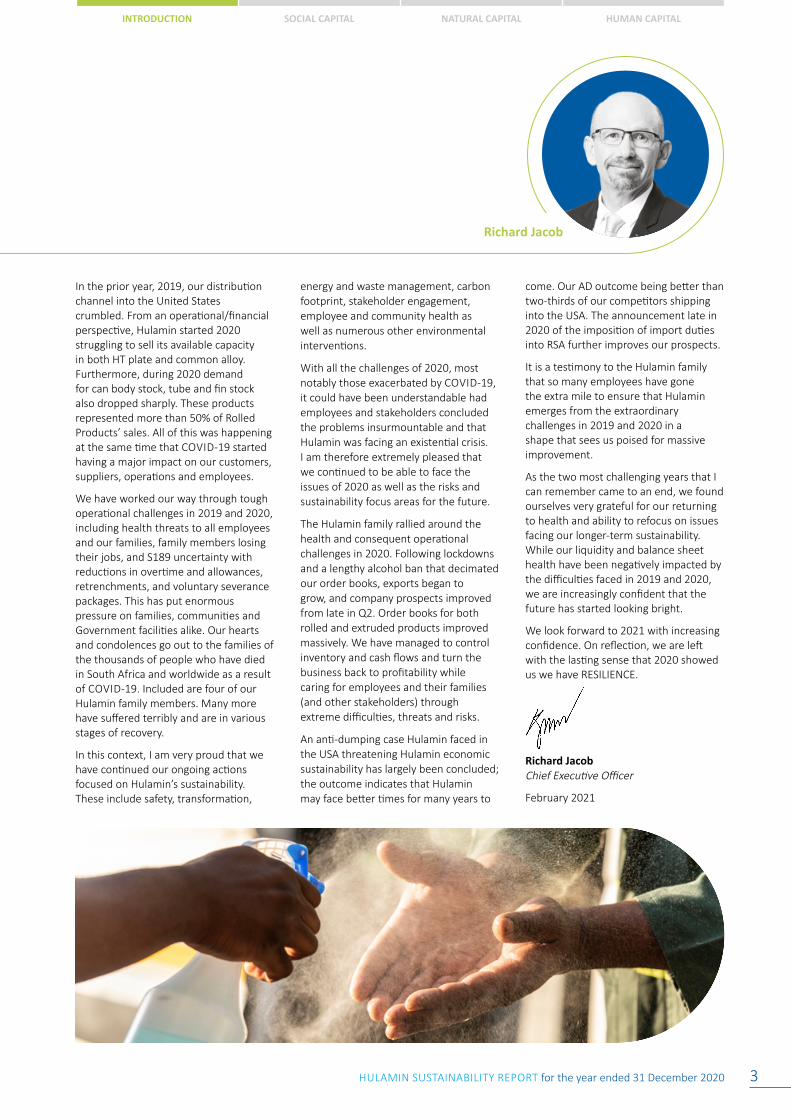
Richard Jacob
In the prior year, 2019, our distribution channel into the United States crumbled. From an operational/financial perspective, Hulamin started 2020 struggling to sell its available capacity in both HT plate and common alloy. Furthermore, during 2020 demand for can body stock, tube and fin stock also dropped sharply. These products represented more than 50% of Rolled Products’ sales. All of this was happening at the same time that COVID-19 started having a major impact on our customers, suppliers, operations and employees.
We have worked our way through tough operational challenges in 2019 and 2020, including health threats to all employees and our families, family members losing their jobs, and S189 uncertainty with reductions in overtime and allowances, retrenchments, and voluntary severance packages. This has put enormous pressure on families, communities and Government facilities alike. Our hearts and condolences go out to the families of the thousands of people who have died in South Africa and worldwide as a result of COVID-19. Included are four of our Hulamin family members. Many more have suffered terribly and are in various stages of recovery.
In this context, I am very proud that we have continued our ongoing actions focused on Hulamin’s sustainability. These include safety, transformation,
energy and waste management, carbon footprint, stakeholder engagement, employee and community health as well as numerous other environmental interventions.
With all the challenges of 2020, most notably those exacerbated by COVID-19, it could have been understandable had employees and stakeholders concluded the problems insurmountable and that Hulamin was facing an existential crisis. I am therefore extremely pleased that we continued to be able to face the issues of 2020 as well as the risks and sustainability focus areas for the future.
The Hulamin family rallied around the health and consequent operational challenges in 2020. Following lockdowns and a lengthy alcohol ban that decimated our order books, exports began to grow, and company prospects improved from late in Q2. Order books for both rolled and extruded products improved massively. We have managed to control inventory and cash flows and turn the business back to profitability while caring for employees and their families (and other stakeholders) through extreme difficulties, threats and risks.
An anti-dumping case Hulamin faced in the USA threatening Hulamin economic sustainability has largely been concluded; the outcome indicates that Hulamin may face better times for many years to
come. Our AD outcome being better than two-thirds of our competitors shipping into the USA. The announcement late in 2020 of the imposition of import duties into RSA further improves our prospects.
It is a testimony to the Hulamin family that so many employees have gone the extra mile to ensure that Hulamin emerges from the extraordinary challenges in 2019 and 2020 in a shape that sees us poised for massive improvement.
As the two most challenging years that I can remember came to an end, we found ourselves very grateful for our returning to health and ability to refocus on issues facing our longer-term sustainability. While our liquidity and balance sheet health have been negatively impacted by the difficulties faced in 2019 and 2020, we are increasingly confident that the future has started looking bright.
We look forward to 2021 with increasing confidence. On reflection, we are left with the lasting sense that 2020 showed us we have RESILIENCE.
Richard JacobChief Executive Officer
February 2021
HULAMIN SUSTAINABILITY REPORT for the year ended 31 December 20204
ABOUT THIS REPORT
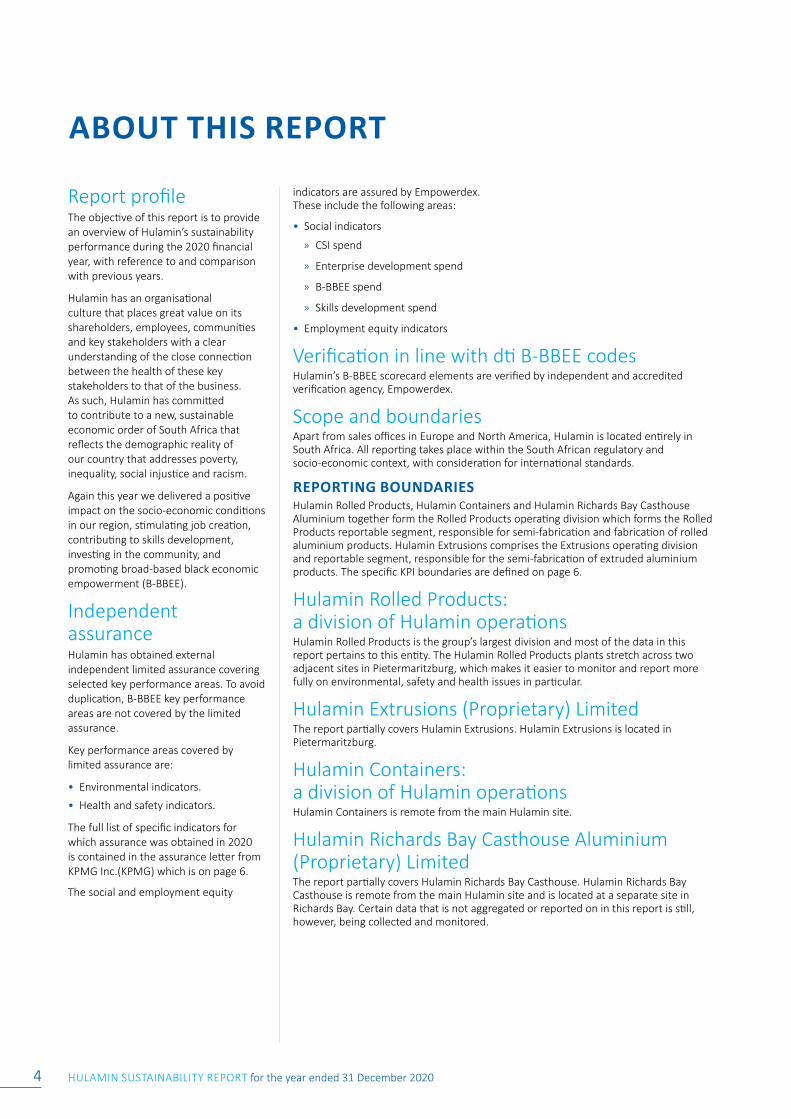
Report profileThe objective of this report is to provide an overview of Hulamin’s sustainability performance during the 2020 financial year, with reference to and comparison with previous years.
Hulamin has an organisational culture that places great value on its shareholders, employees, communities and key stakeholders with a clear understanding of the close connection between the health of these key stakeholders to that of the business. As such, Hulamin has committed to contribute to a new, sustainable economic order of South Africa that reflects the demographic reality of our country that addresses poverty, inequality, social injustice and racism.
Again this year we delivered a positive impact on the socio-economic conditions in our region, stimulating job creation, contributing to skills development, investing in the community, and promoting broad-based black economic empowerment (B-BBEE).
Independent assuranceHulamin has obtained external independent limited assurance covering selected key performance areas. To avoid duplication, B-BBEE key performance areas are not covered by the limited assurance.
Key performance areas covered by limited assurance are:
• Environmental indicators.
• Health and safety indicators.
The full list of specific indicators for which assurance was obtained in 2020 is contained in the assurance letter from KPMG Inc.(KPMG) which is on page 6.
The social and employment equity
indicators are assured by Empowerdex. These include the following areas:
• Social indicators
» CSI spend
» Enterprise development spend
» B-BBEE spend
» Skills development spend
• Employment equity indicators
Verification in line with dti B-BBEE codesHulamin’s B-BBEE scorecard elements are verified by independent and accredited verification agency, Empowerdex.
Scope and boundariesApart from sales offices in Europe and North America, Hulamin is located entirely in South Africa. All reporting takes place within the South African regulatory and socio-economic context, with consideration for international standards.
REPORTING BOUNDARIESHulamin Rolled Products, Hulamin Containers and Hulamin Richards Bay Casthouse Aluminium together form the Rolled Products operating division which forms the Rolled Products reportable segment, responsible for semi-fabrication and fabrication of rolled aluminium products. Hulamin Extrusions comprises the Extrusions operating division and reportable segment, responsible for the semi-fabrication of extruded aluminium products. The specific KPI boundaries are defined on page 6.
Hulamin Rolled Products: a division of Hulamin operationsHulamin Rolled Products is the group’s largest division and most of the data in this report pertains to this entity. The Hulamin Rolled Products plants stretch across two adjacent sites in Pietermaritzburg, which makes it easier to monitor and report more fully on environmental, safety and health issues in particular.
Hulamin Extrusions (Proprietary) LimitedThe report partially covers Hulamin Extrusions. Hulamin Extrusions is located in Pietermaritzburg.
Hulamin Containers: a division of Hulamin operationsHulamin Containers is remote from the main Hulamin site.
Hulamin Richards Bay Casthouse Aluminium (Proprietary) LimitedThe report partially covers Hulamin Richards Bay Casthouse. Hulamin Richards Bay Casthouse is remote from the main Hulamin site and is located at a separate site in Richards Bay. Certain data that is not aggregated or reported on in this report is still, however, being collected and monitored.
HULAMIN SUSTAINABILITY REPORT for the year ended 31 December 2020 5
INTRODUCTION SOCIAL CAPITAL NATURAL CAPITAL HUMAN CAPITAL
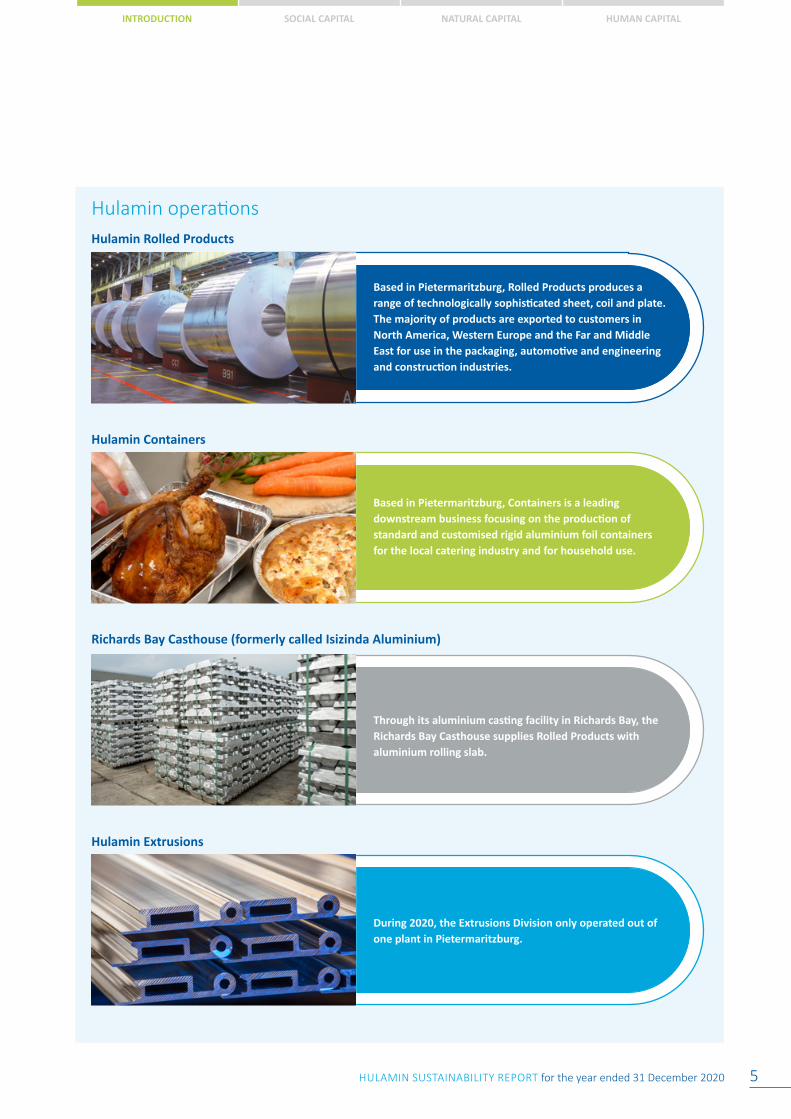
Hulamin operations
Hulamin Containers
Based in Pietermaritzburg, Containers is a leading downstream business focusing on the production of standard and customised rigid aluminium foil containers for the local catering industry and for household use.
Hulamin Extrusions
During 2020, the Extrusions Division only operated out of one plant in Pietermaritzburg.
Richards Bay Casthouse (formerly called Isizinda Aluminium)
Through its aluminium casting facility in Richards Bay, the Richards Bay Casthouse supplies Rolled Products with aluminium rolling slab.
Hulamin Rolled Products
Based in Pietermaritzburg, Rolled Products produces a range of technologically sophisticated sheet, coil and plate. The majority of products are exported to customers in North America, Western Europe and the Far and Middle East for use in the packaging, automotive and engineering and construction industries.
HULAMIN SUSTAINABILITY REPORT for the year ended 31 December 20206
ABOUT THIS REPORT continued
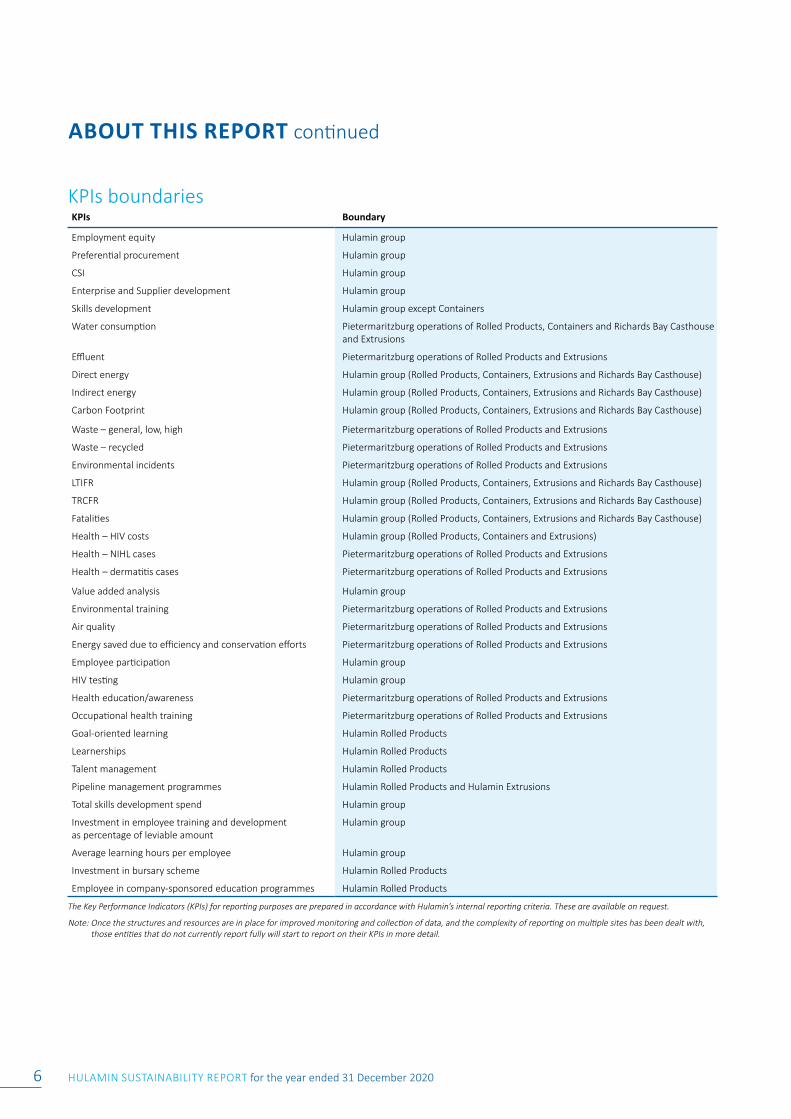
KPIs Boundary
Employment equity Hulamin group
Preferential procurement Hulamin group
CSI Hulamin group
Enterprise and Supplier development Hulamin group
Skills development Hulamin group except Containers
Water consumption Pietermaritzburg operations of Rolled Products, Containers and Richards Bay Casthouse and Extrusions
Effluent Pietermaritzburg operations of Rolled Products and Extrusions
Direct energy Hulamin group (Rolled Products, Containers, Extrusions and Richards Bay Casthouse)
Indirect energy Hulamin group (Rolled Products, Containers, Extrusions and Richards Bay Casthouse)
Carbon Footprint Hulamin group (Rolled Products, Containers, Extrusions and Richards Bay Casthouse)
Waste – general, low, high Pietermaritzburg operations of Rolled Products and Extrusions
Waste – recycled Pietermaritzburg operations of Rolled Products and Extrusions
Environmental incidents Pietermaritzburg operations of Rolled Products and Extrusions
LTIFR Hulamin group (Rolled Products, Containers, Extrusions and Richards Bay Casthouse)
TRCFR Hulamin group (Rolled Products, Containers, Extrusions and Richards Bay Casthouse)
Fatalities Hulamin group (Rolled Products, Containers, Extrusions and Richards Bay Casthouse)
Health – HIV costs Hulamin group (Rolled Products, Containers and Extrusions)
Health – NIHL cases Pietermaritzburg operations of Rolled Products and Extrusions
Health – dermatitis cases Pietermaritzburg operations of Rolled Products and Extrusions
Value added analysis Hulamin group
Environmental training Pietermaritzburg operations of Rolled Products and Extrusions
Air quality Pietermaritzburg operations of Rolled Products and Extrusions
Energy saved due to efficiency and conservation efforts Pietermaritzburg operations of Rolled Products and Extrusions
Employee participation Hulamin group
HIV testing Hulamin group
Health education/awareness Pietermaritzburg operations of Rolled Products and Extrusions
Occupational health training Pietermaritzburg operations of Rolled Products and Extrusions
Goal-oriented learning Hulamin Rolled Products
Learnerships Hulamin Rolled Products
Talent management Hulamin Rolled Products
Pipeline management programmes Hulamin Rolled Products and Hulamin Extrusions
Total skills development spend Hulamin group
Investment in employee training and development as percentage of leviable amount
Hulamin group
Average learning hours per employee Hulamin group
Investment in bursary scheme Hulamin Rolled Products
Employee in company-sponsored education programmes Hulamin Rolled Products
The Key Performance Indicators (KPIs) for reporting purposes are prepared in accordance with Hulamin’s internal reporting criteria. These are available on request.
Note: Once the structures and resources are in place for improved monitoring and collection of data, and the complexity of reporting on multiple sites has been dealt with, those entities that do not currently report fully will start to report on their KPIs in more detail.
KPIs boundaries
HULAMIN SUSTAINABILITY REPORT for the year ended 31 December 2020 7
INTRODUCTION SOCIAL CAPITAL NATURAL CAPITAL HUMAN CAPITAL
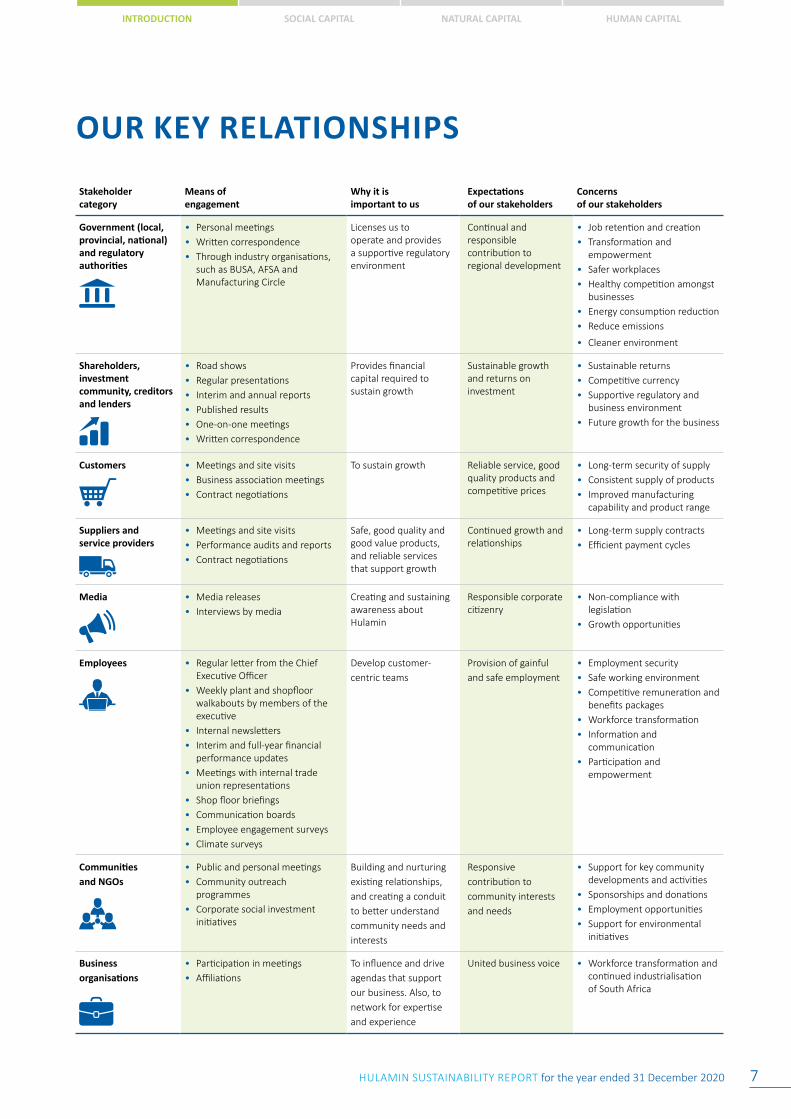
OUR KEY RELATIONSHIPS
Stakeholder category
Means of engagement
Why it is important to us
Expectations of our stakeholders
Concerns of our stakeholders
Government (local, provincial, national) and regulatory authorities
• Personal meetings• Written correspondence• Through industry organisations,
such as BUSA, AFSA and Manufacturing Circle
Licenses us to operate and provides a supportive regulatory environment
Continual and responsible contribution to regional development
• Job retention and creation• Transformation and
empowerment• Safer workplaces• Healthy competition amongst
businesses• Energy consumption reduction• Reduce emissions
• Cleaner environment
Shareholders, investment community, creditors and lenders
• Road shows• Regular presentations• Interim and annual reports• Published results• One-on-one meetings• Written correspondence
Provides financial capital required to sustain growth
Sustainable growth and returns on investment
• Sustainable returns• Competitive currency• Supportive regulatory and
business environment• Future growth for the business
Customers • Meetings and site visits• Business association meetings• Contract negotiations
To sustain growth Reliable service, good quality products and competitive prices
• Long-term security of supply• Consistent supply of products• Improved manufacturing
capability and product range
Suppliers and service providers
• Meetings and site visits• Performance audits and reports• Contract negotiations
Safe, good quality and good value products, and reliable services that support growth
Continued growth and relationships
• Long-term supply contracts• Efficient payment cycles
Media • Media releases• Interviews by media
Creating and sustaining awareness about Hulamin
Responsible corporate citizenry
• Non-compliance with legislation
• Growth opportunities
Employees • Regular letter from the Chief Executive Officer
• Weekly plant and shopfloor walkabouts by members of the executive
• Internal newsletters• Interim and full-year financial
performance updates• Meetings with internal trade
union representations• Shop floor briefings• Communication boards• Employee engagement surveys• Climate surveys
Develop customer-centric teams
Provision of gainful and safe employment
• Employment security• Safe working environment• Competitive remuneration and
benefits packages• Workforce transformation• Information and
communication• Participation and
empowerment
Communities and NGOs
• Public and personal meetings• Community outreach
programmes• Corporate social investment
initiatives
Building and nurturing existing relationships, and creating a conduit to better understand community needs and interests
Responsive contribution to community interests and needs
• Support for key community developments and activities
• Sponsorships and donations• Employment opportunities• Support for environmental
initiatives
Business organisations
• Participation in meetings• Affiliations
To influence and drive agendas that support our business. Also, to network for expertise and experience
United business voice • Workforce transformation and continued industrialisation of South Africa
HULAMIN SUSTAINABILITY REPORT for the year ended 31 December 20208
INDEPENDENT ASSURANCE
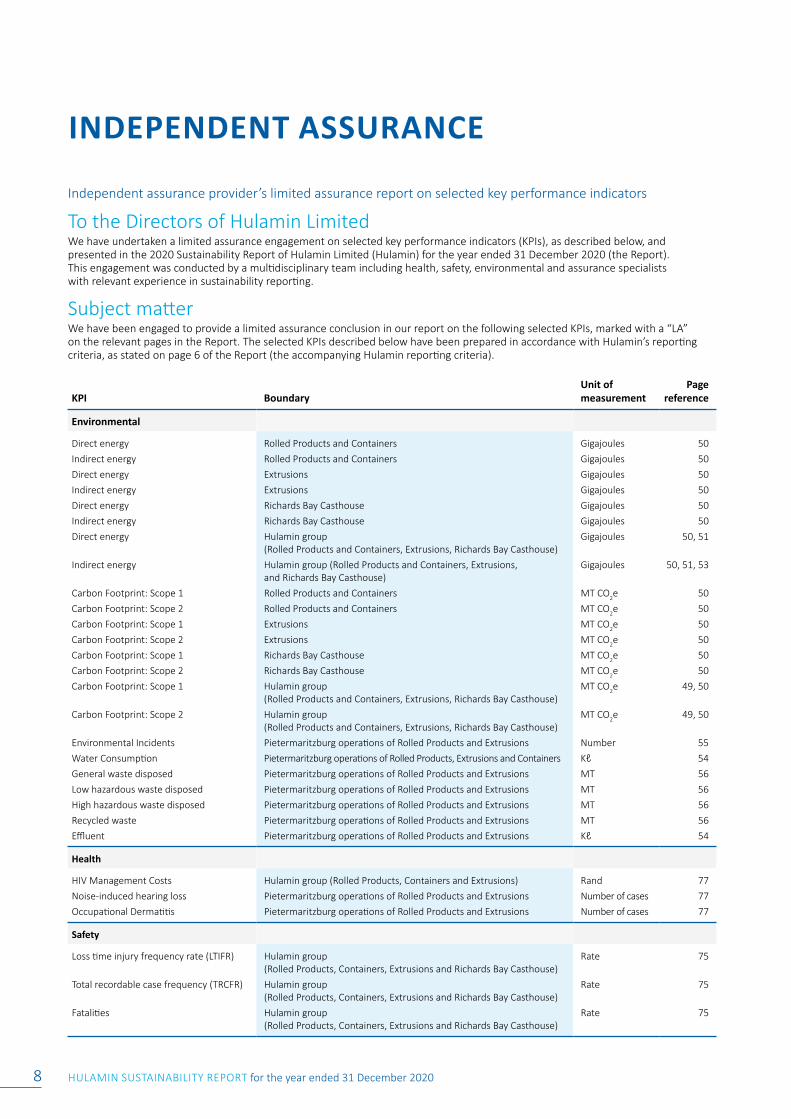
Independent assurance provider’s limited assurance report on selected key performance indicators
To the Directors of Hulamin LimitedWe have undertaken a limited assurance engagement on selected key performance indicators (KPIs), as described below, and presented in the 2020 Sustainability Report of Hulamin Limited (Hulamin) for the year ended 31 December 2020 (the Report). This engagement was conducted by a multidisciplinary team including health, safety, environmental and assurance specialists with relevant experience in sustainability reporting.
Subject matterWe have been engaged to provide a limited assurance conclusion in our report on the following selected KPIs, marked with a “LA” on the relevant pages in the Report. The selected KPIs described below have been prepared in accordance with Hulamin’s reporting criteria, as stated on page 6 of the Report (the accompanying Hulamin reporting criteria).
KPI BoundaryUnit of measurement
Page reference
Environmental
Direct energy Rolled Products and Containers Gigajoules 50
Indirect energy Rolled Products and Containers Gigajoules 50
Direct energy Extrusions Gigajoules 50
Indirect energy Extrusions Gigajoules 50
Direct energy Richards Bay Casthouse Gigajoules 50
Indirect energy Richards Bay Casthouse Gigajoules 50
Direct energy Hulamin group (Rolled Products and Containers, Extrusions, Richards Bay Casthouse)
Gigajoules 50, 51
Indirect energy Hulamin group (Rolled Products and Containers, Extrusions, and Richards Bay Casthouse)
Gigajoules 50, 51, 53
Carbon Footprint: Scope 1 Rolled Products and Containers MT CO2e 50
Carbon Footprint: Scope 2 Rolled Products and Containers MT CO2e 50
Carbon Footprint: Scope 1 Extrusions MT CO2e 50
Carbon Footprint: Scope 2 Extrusions MT CO2e 50
Carbon Footprint: Scope 1 Richards Bay Casthouse MT CO2e 50
Carbon Footprint: Scope 2 Richards Bay Casthouse MT CO2e 50
Carbon Footprint: Scope 1 Hulamin group (Rolled Products and Containers, Extrusions, Richards Bay Casthouse)
MT CO2e 49, 50
Carbon Footprint: Scope 2 Hulamin group (Rolled Products and Containers, Extrusions, Richards Bay Casthouse)
MT CO2e 49, 50
Environmental Incidents Pietermaritzburg operations of Rolled Products and Extrusions Number 55
Water Consumption Pietermaritzburg operations of Rolled Products, Extrusions and Containers Kℓ 54
General waste disposed Pietermaritzburg operations of Rolled Products and Extrusions MT 56
Low hazardous waste disposed Pietermaritzburg operations of Rolled Products and Extrusions MT 56
High hazardous waste disposed Pietermaritzburg operations of Rolled Products and Extrusions MT 56
Recycled waste Pietermaritzburg operations of Rolled Products and Extrusions MT 56
Effluent Pietermaritzburg operations of Rolled Products and Extrusions Kℓ 54
Health
HIV Management Costs Hulamin group (Rolled Products, Containers and Extrusions) Rand 77
Noise-induced hearing loss Pietermaritzburg operations of Rolled Products and Extrusions Number of cases 77
Occupational Dermatitis Pietermaritzburg operations of Rolled Products and Extrusions Number of cases 77
Safety
Loss time injury frequency rate (LTIFR) Hulamin group (Rolled Products, Containers, Extrusions and Richards Bay Casthouse)
Rate 75
Total recordable case frequency (TRCFR) Hulamin group (Rolled Products, Containers, Extrusions and Richards Bay Casthouse)
Rate 75
Fatalities Hulamin group (Rolled Products, Containers, Extrusions and Richards Bay Casthouse)
Rate 75
HULAMIN SUSTAINABILITY REPORT for the year ended 31 December 2020 9
INTRODUCTION SOCIAL CAPITAL NATURAL CAPITAL HUMAN CAPITAL
Directors’ responsibilities The Directors are responsible for the selection, preparation and presentation of the selected KPIs in accordance with the accompanying Hulamin reporting criteria. This responsibility includes the identification of stakeholders and stakeholder requirements, material issues, commitments with respect to sustainability performance and the design, implementation and maintenance of internal control relevant to the preparation of the Report that is free from material misstatement, whether due to fraud or error. The Directors are also responsible for determining the appropriateness of the measurement and reporting criteria in view of the intended users of the selected KPIs and for ensuring that those criteria are publicly available to the Report users.
Inherent limitationsCarbon emission quantification is subject to inherent uncertainty because of incomplete scientific knowledge used to determine emission factors and the values needed to combine emissions of different gases.
Our independence and quality controlWe have complied with the independence and other ethical requirements of the Code of Professional Conduct for Registered Auditors issued by the Independent Regulatory Board for Auditors (IRBA Code), which is founded on fundamental principles of integrity, objectivity, professional competence and due care, confidentiality and professional behaviour. The IRBA Code is consistent with the corresponding sections of the International Ethics Standards Board for Accountants’ International Code of Ethics for Professional Accountants (including International Independence Standards).
KPMG Inc. applies the International Standard on Quality Control 1, and accordingly maintains a comprehensive system of quality control including documented policies and procedures regarding compliance with ethical requirements, professional standards and applicable legal and regulatory requirements.
Practitioner’s responsibilityOur responsibility is to express a limited assurance conclusion on the selected sustainability KPIs based on the procedures we have performed and the evidence we have obtained. We conducted our assurance engagement in accordance with the International Standard on Assurance Engagements (ISAE) 3000 (Revised), Assurance Engagements other than Audits or Reviews of Historical Financial Information and, in respect of greenhouse gas emissions, in accordance with ISAE 3410, Assurance Engagements on Greenhouse Gas Statements. These standards require that we plan and perform our engagement to obtain limited assurance about whether the selected sustainability KPIs are free from material misstatement.
A limited assurance engagement undertaken in accordance with ISAE 3000 (Revised) and ISAE 3410 involves assessing the suitability in the circumstances of Hulamin’s use of its reporting criteria as the basis of preparation for the selected KPIs, assessing the risks of material misstatement of the selected KPIs whether due to fraud or error, responding to the assessed risks as necessary in the circumstances, and evaluating the overall presentation of the selected KPIs. A limited assurance engagement is substantially less in scope than a reasonable assurance engagement in relation to both risk assessment procedures, including an understanding of internal control, and the procedures performed in response to the assessed risks. The procedures we performed were based on our professional judgement and included inquiries, observation of processes followed, inspection of documents, analytical procedures, evaluating the appropriateness of quantification methods and reporting policies, and agreeing or reconciling with underlying records.
Given the circumstances of the engagement, in performing the procedures listed above we:
• Interviewed management and senior executives to obtain an understanding of the internal control environment, risk assessment process and information systems relevant to the sustainability reporting process.
• Inspected documentation to corroborate the statements of management and senior executives in our interviews.
• Tested the processes and systems to generate, collate, aggregate, monitor and report the selected KPIs.
• Performed a controls walkthrough of identified key controls.
• Inspected supporting documentation on a sample basis and performed analytical procedures to evaluate the data generation and reporting processes against the reporting criteria.
• Evaluated the reasonableness and appropriateness of significant estimates and judgments made by the directors in the preparation of the selected KPIs.
• Evaluated whether the selected KPIs presented in the Report are consistent with our overall knowledge and experience of sustainability management and performance at Hulamin.
The procedures performed in a limited assurance engagement vary in nature and timing, and are less in extent then for a reasonable assurance engagement. As a result, the level of assurance obtained in a limited assurance engagement is substantially lower than the assurance that would have been obtained had we performed a reasonable assurance engagement. Accordingly, we do not express a reasonable assurance opinion about whether Hulamin’s selected KPIs have been prepared, in all material respects, in accordance with the accompanying Hulamin reporting criteria.
HULAMIN SUSTAINABILITY REPORT for the year ended 31 December 202010
Limited assurance conclusionBased on the procedures we have performed and the evidence we have obtained and subject to the inherent limitations outlined elsewhere in this report, nothing has come to our attention that causes us to believe that the selected KPIs as set out in the Subject Matter paragraph for the year ended 31 December 2020 are not prepared, in all material respects, in accordance with the reporting criteria.
Other mattersThe maintenance and integrity of Hulamin’s website is the responsibility of Hulamin management. Our procedures did not involve consideration of these matters and, accordingly we accept no responsibility for any changes to either the information in the Report or our independent assurance report that may have occurred since the initial date of presentation on the Hulamin Website.
Restriction of liabilityOur work has been undertaken to enable us to express a limited assurance conclusion on the selected KPIs to the Directors of Hulamin in accordance with the terms of our engagement, and for no other purpose. We do not accept or assume liability to any party other than Hulamin, for our work, for this report, or for the conclusion we have reached.
KPMG Inc.Registered Auditor
Per PAH LallaChartered Accountant (SA)Registered AuditorDirector
8 March 2021
KPMG Crescent85 Empire RoadParktownJohannesburgSouth Africa2193
INDEPENDENT ASSURANCE continued
HULAMIN SUSTAINABILITY REPORT for the year ended 31 December 2020 11
INTRODUCTION SOCIAL CAPITAL NATURAL CAPITAL HUMAN CAPITAL
INTRODUCING HULAMIN
Executive summary We, at Hulamin have an organisational culture that places great value on our shareholders, employees, communities and key stakeholders with a clear understanding of the close connection between the health of these key stakeholders to that of the business. As such, we are committed to the following goal for Transformation:
“To contribute to a new, sustainable economic order in South Africa that reflects the demographic reality of our country and that addresses poverty, inequality, social injustice and racism.”
Our social and economic impact as a business is assessed by an independent agency through our sustainability initiatives targeted at socio-economic development and environmental sustainability. The need for such an assessment stemmed from our desire to better understand our actual and potential value creation to other stakeholders, in order to “prove” or “improve” our contribution.
We recently embarked on a journey with an independent agency to establish:
• where we stand in terms of our societal value creation and transformation, in order to appropriately report achievements, as well as reflect on the effectiveness of the interventions undertaken to achieve the desired impact;
• what we have retrospectively established as a baseline that supports the establishment of future societal value creation and transformation strategies and targets, as well as ongoing monitoring and evaluation; and
• our impact of societal and environmental value creation initiatives we delivered in the past and in other areas – a mindful reflection of the “distance travelled” between the “baseline” for each initiative since inception and current state, i.e. a look back.
A combination of economic and social impact assessment methodologies were used for the assessment as guided by the impact assessment rationale for each initiative. In the case of a macroeconomic impact assessment (EIA) being conducted, the Social Accounting Matrix (SAM), which is an input-output model that derives impacts on GDP, government taxes, employment and income creation, and trade balances, was used. The economic impact was determined by analysing the linkages between different sectors in the economy as well as associated multipliers. The Social Return on Investment (SROI) methodology, a framework that combines traditional impact assessment measurement using the theory of change concept to assess social and economic outcomes, which are then expressed in monetary terms, was used for selected programmes. The product of an SROI assessment is a ratio and a narrative.
Where the programme design or data availability did not merit use of the SROI methodology, a social impact assessment was conducted. This entailed using the theory of change to understand and assess social and economic outcomes as far as possible, and consider any potential outputs, outcomes or impacts that have been experienced on key indicators. Case studies were included for these social impact assessments. Where applicable, the analysis to understand impacts also considered the environment as a key stakeholder.
The following pages speak to key results of our societal impact through various capitals. For more insights on our social and economic footprint, please feel free to make contact with our Corporate Affairs team on 033 395 6911 or [email protected]
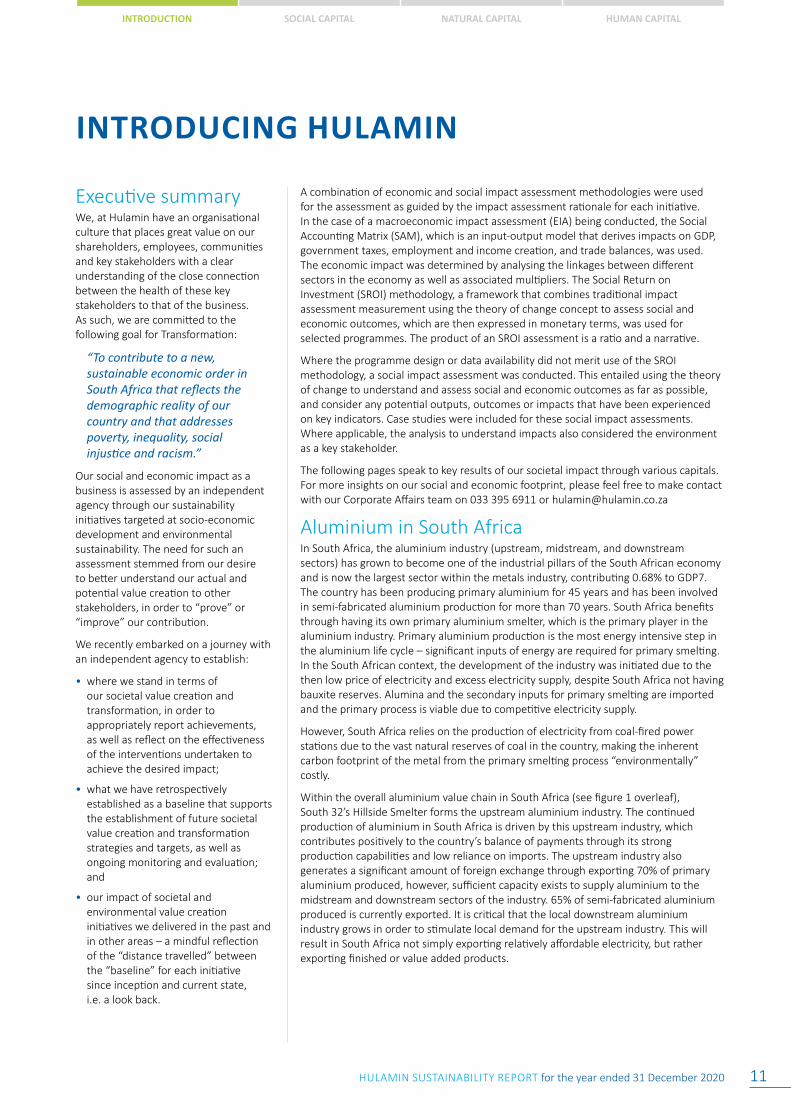
Aluminium in South AfricaIn South Africa, the aluminium industry (upstream, midstream, and downstream sectors) has grown to become one of the industrial pillars of the South African economy and is now the largest sector within the metals industry, contributing 0.68% to GDP7. The country has been producing primary aluminium for 45 years and has been involved in semi-fabricated aluminium production for more than 70 years. South Africa benefits through having its own primary aluminium smelter, which is the primary player in the aluminium industry. Primary aluminium production is the most energy intensive step in the aluminium life cycle – significant inputs of energy are required for primary smelting. In the South African context, the development of the industry was initiated due to the then low price of electricity and excess electricity supply, despite South Africa not having bauxite reserves. Alumina and the secondary inputs for primary smelting are imported and the primary process is viable due to competitive electricity supply.
However, South Africa relies on the production of electricity from coal-fired power stations due to the vast natural reserves of coal in the country, making the inherent carbon footprint of the metal from the primary smelting process “environmentally” costly.
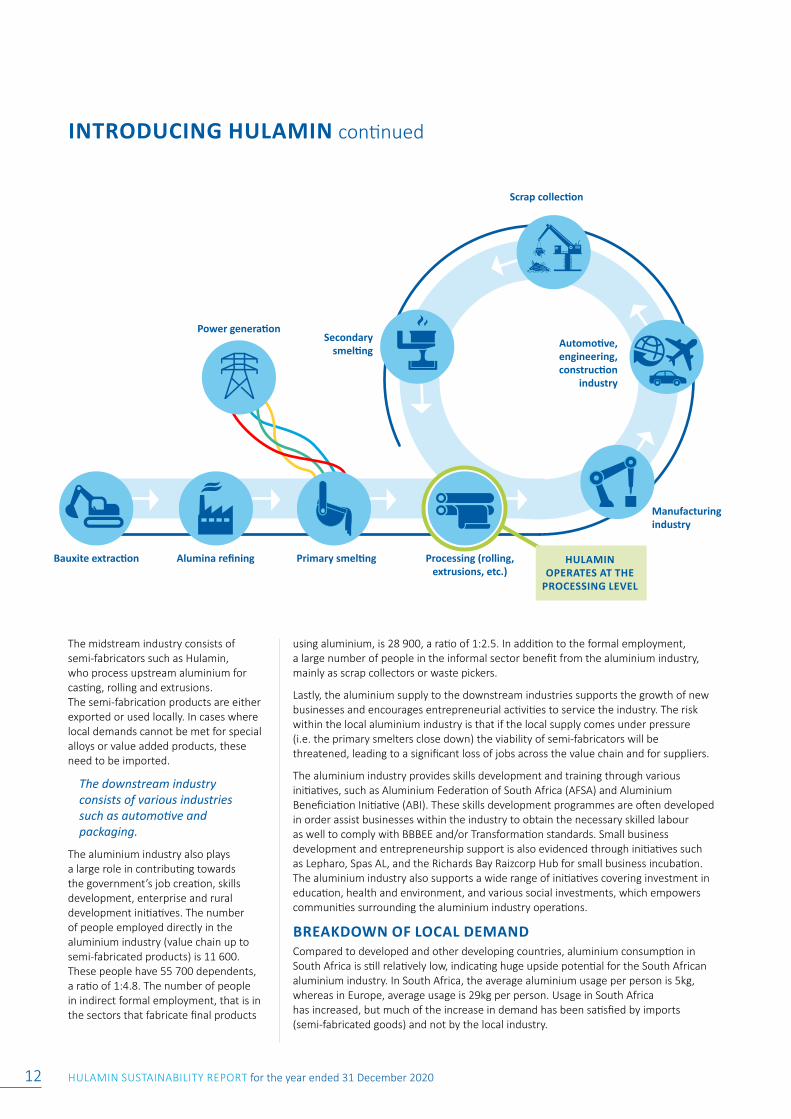
Within the overall aluminium value chain in South Africa (see figure 1 overleaf), South 32’s Hillside Smelter forms the upstream aluminium industry. The continued production of aluminium in South Africa is driven by this upstream industry, which contributes positively to the country’s balance of payments through its strong production capabilities and low reliance on imports. The upstream industry also generates a significant amount of foreign exchange through exporting 70% of primary aluminium produced, however, sufficient capacity exists to supply aluminium to the midstream and downstream sectors of the industry. 65% of semi-fabricated aluminium produced is currently exported. It is critical that the local downstream aluminium industry grows in order to stimulate local demand for the upstream industry. This will result in South Africa not simply exporting relatively affordable electricity, but rather exporting finished or value added products.
HULAMIN SUSTAINABILITY REPORT for the year ended 31 December 202012
The midstream industry consists of semi-fabricators such as Hulamin, who process upstream aluminium for casting, rolling and extrusions. The semi-fabrication products are either exported or used locally. In cases where local demands cannot be met for special alloys or value added products, these need to be imported.
The downstream industry consists of various industries such as automotive and packaging.
The aluminium industry also plays a large role in contributing towards the government’s job creation, skills development, enterprise and rural development initiatives. The number of people employed directly in the aluminium industry (value chain up to semi-fabricated products) is 11 600. These people have 55 700 dependents, a ratio of 1:4.8. The number of people in indirect formal employment, that is in the sectors that fabricate final products
using aluminium, is 28 900, a ratio of 1:2.5. In addition to the formal employment, a large number of people in the informal sector benefit from the aluminium industry, mainly as scrap collectors or waste pickers.
Lastly, the aluminium supply to the downstream industries supports the growth of new businesses and encourages entrepreneurial activities to service the industry. The risk within the local aluminium industry is that if the local supply comes under pressure (i.e. the primary smelters close down) the viability of semi-fabricators will be threatened, leading to a significant loss of jobs across the value chain and for suppliers.
The aluminium industry provides skills development and training through various initiatives, such as Aluminium Federation of South Africa (AFSA) and Aluminium Beneficiation Initiative (ABI). These skills development programmes are often developed in order assist businesses within the industry to obtain the necessary skilled labour as well to comply with BBBEE and/or Transformation standards. Small business development and entrepreneurship support is also evidenced through initiatives such as Lepharo, Spas AL, and the Richards Bay Raizcorp Hub for small business incubation. The aluminium industry also supports a wide range of initiatives covering investment in education, health and environment, and various social investments, which empowers communities surrounding the aluminium industry operations.
BREAKDOWN OF LOCAL DEMANDCompared to developed and other developing countries, aluminium consumption in South Africa is still relatively low, indicating huge upside potential for the South African aluminium industry. In South Africa, the average aluminium usage per person is 5kg, whereas in Europe, average usage is 29kg per person. Usage in South Africa has increased, but much of the increase in demand has been satisfied by imports (semi-fabricated goods) and not by the local industry.
INTRODUCING HULAMIN continued
Bauxite extraction
Scrap collection
Secondary smelting
Power generation
Alumina refining Primary smelting Processing (rolling, extrusions, etc.)
Manufacturing industry
Automotive, engineering, construction
industry
HULAMIN OPERATES AT THE
PROCESSING LEVEL
HULAMIN SUSTAINABILITY REPORT for the year ended 31 December 2020 13
INTRODUCTION SOCIAL CAPITAL NATURAL CAPITAL HUMAN CAPITAL
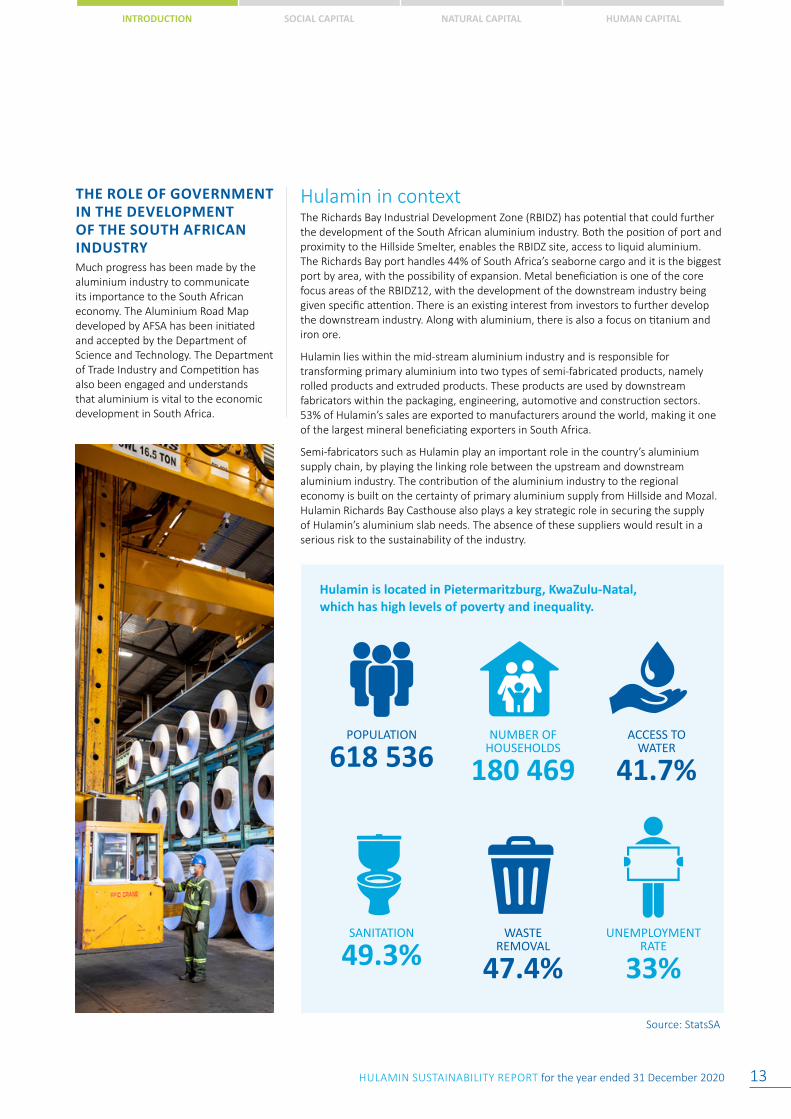
Hulamin is located in Pietermaritzburg, KwaZulu-Natal, which has high levels of poverty and inequality.
THE ROLE OF GOVERNMENT IN THE DEVELOPMENT OF THE SOUTH AFRICAN INDUSTRYMuch progress has been made by the aluminium industry to communicate its importance to the South African economy. The Aluminium Road Map developed by AFSA has been initiated and accepted by the Department of Science and Technology. The Department of Trade Industry and Competition has also been engaged and understands that aluminium is vital to the economic development in South Africa.
Hulamin in contextThe Richards Bay Industrial Development Zone (RBIDZ) has potential that could further the development of the South African aluminium industry. Both the position of port and proximity to the Hillside Smelter, enables the RBIDZ site, access to liquid aluminium. The Richards Bay port handles 44% of South Africa’s seaborne cargo and it is the biggest port by area, with the possibility of expansion. Metal beneficiation is one of the core focus areas of the RBIDZ12, with the development of the downstream industry being given specific attention. There is an existing interest from investors to further develop the downstream industry. Along with aluminium, there is also a focus on titanium and iron ore.
Hulamin lies within the mid-stream aluminium industry and is responsible for transforming primary aluminium into two types of semi-fabricated products, namely rolled products and extruded products. These products are used by downstream fabricators within the packaging, engineering, automotive and construction sectors. 53% of Hulamin’s sales are exported to manufacturers around the world, making it one of the largest mineral beneficiating exporters in South Africa.
Semi-fabricators such as Hulamin play an important role in the country’s aluminium supply chain, by playing the linking role between the upstream and downstream aluminium industry. The contribution of the aluminium industry to the regional economy is built on the certainty of primary aluminium supply from Hillside and Mozal. Hulamin Richards Bay Casthouse also plays a key strategic role in securing the supply of Hulamin’s aluminium slab needs. The absence of these suppliers would result in a serious risk to the sustainability of the industry.
POPULATION
618 536NUMBER OF
HOUSEHOLDS
180 469
SANITATION
49.3%WASTE
REMOVAL
47.4%
ACCESS TO WATER
41.7%
UNEMPLOYMENT RATE
33%
Source: StatsSA
HULAMIN SUSTAINABILITY REPORT for the year ended 31 December 202014
We have committed ourselves to playing a positive role in addressing these problems through Hulamin’s values the manner in which we conduct business, and through our transformation actions. In 2016, the Hulamin board approved a revised Transformation plan that focuses on preferential procurement, employment equity, ownership and control as well as enterprise and supplier development. We also create value within the local community by employing more than 1 800 permanent employees across our various business units. The lives of these employees are enriched by Hulamin through various self-development opportunities such as talent management and development programmes, as well as career development through the offering of bursary schemes. We are also a major contributor to the economic activity of Pietermaritzburg and therefore feel that we have a moral obligation to create value within the community in which they operate.
The impact that we have, by virtue of our existence cannot be overstated. Hulamin’s contribution to the South African and provincial economy in terms of GDP, jobs, household income, tax revenue for the government and balance of payments, is adequately captured in the Business’ Economic Impact Assessment Chapter. Additionally, to fulfil our transformation objectives, we seek to facilitate the development of sustainable businesses that will create jobs and stimulate the economy. Within the 2020 financial year, R3.149 million was contributed towards various supplier development and enterprise development initiatives. The company also spent R2 840 976.88 on various Corporate Social Investment initiatives, focusing specifically on community development, education, health and environment.
LOOKING AHEAD/TRENDS IN THE ALUMINIUM SECTORIn South Africa, the competition of cheap imports, the volatile rand, increased electricity costs, and a subdued economy pose challenges to the local aluminium producing sector. The government has emphasised the need for an economic turnaround, having recently announced an economic stimulus package. Effective partnership between the government and a variety of stakeholders is required for this initiative to come to life.
Furthermore, Hulamin is pleased to have concluded discussions with the South African Government regarding the 15% import protection against aluminium products that have flooded South Africa – this will be critical to protect the local industry.
In comparison to developed and other developing countries, aluminium consumption in South Africa is still low, indicating huge upside potential for the South African aluminium industry. The growing use of aluminium in the automotive sector, the packaging sector, and expansions around infrastructure projects and electricity reticulation allow for opportunities to arise within this sector. In order to maximise these opportunities, collaboration between the private and government sector, regulatory competitiveness, and stable financial markets is required to enable the capital raising necessary for growth.
The nature of trade barriers in emerging economies and the level of taxation on imported goods has resulted in an influx of products from low cost markets. The global conversation around trade barriers may be reaching a breaking point and the impacts of the decisions by economies such as United States will have far-reaching consequences due to the nature of global supply chains. While this may result in economies such as China seeking other markets for the propagation of their goods, other aluminium producers may also find opportunity in the US marketplace.
From Hulamin’s point-of-view, whilst certain products remain competitive in the international market, the focus for growth remains in South Africa and the wider continent.
INTRODUCING HULAMIN continued
HULAMIN SUSTAINABILITY REPORT for the year ended 31 December 2020 15
INTRODUCTION SOCIAL CAPITAL NATURAL CAPITAL HUMAN CAPITAL
OPPORTUNITIES FOR GROWTH IN THE SOUTH AFRICAN ALUMINIUM INDUSTRYOne of the key areas for growth in the aluminium sector is the automotive sub-sector. The automotive sub-sector falls within the manufacturing sub-sector and currently contributes approximately 7% of South Africa’s GDP.
Further industries that were identified are packaging, engineering, construction, boats, and piping for oil and gas. Due to aluminium’s lightweight quality, it is easy and relatively cost effective to transport, meaning that exports (taking into account the current geo-political environment) offer another channel for growth in the sector.
THE AUTOMOTIVE INDUSTRYThe automotive industry is the largest driver for growth in the downstream sector and the growing use of aluminium in the automotive sector (particularly the luxury car market such as BMW, Mercedes Benz and Jaguar, and hybrid vehicles which will add more to the requirements for light-weighting), allows for opportunities to arise within this sector.
The key challenge in growing the automotive industry is that the Original Equipment Manufacturers (OEMs) source globally from their head offices, which are often based in Europe. These head offices generally have seven-year plans for the development of vehicles. Thus, while South Africa is attempting to increase the total finished or value-added products it exports, the international head office and timelines of automotive production are constraints. There is, however, along with the special economic zone, an Automotive Incentive Scheme (AIS) at the RBIDZ.
The current Automotive Production and Development Plan expired in 2020. The new automotive plan will be an opportunity to re-strategise and will place emphasis on black-owned companies.
CHALLENGES FACED BY THE SOUTH AFRICAN ALUMINIUM INDUSTRYThe cost and security of energy supply in South Africa to the Hillside Smelter is a pivotal part of the foundation of the South African industry, which comes with numerous other challenges. The renegotiation of the electricity pricing agreement is a priority for the industry.
The capability of any electricity-reliant industry in South Africa to “go green” is hindered by the country’s chosen energy mix at present. Eskom’s nominal capacity is still built on coal, with 82.6% of electricity generated coming from coal-fired power stations in relation to the 1.6% coming from a combination of hydro-electric stations and a wind power facility, which are Eskom controlled assets. The debate around renewable energy supply is ongoing and increasing generation capacity through renewables has been proposed by numerous people and organisations. In the South African context, organised labour is strongly opposed to changing the energy generation landscape in favour of renewables, primarily due to the number of jobs that a renewable plant is able to sustain long-term versus the long-term job volume and security offered by a coal-fired power station.
While the renewables discussion has progressed beyond its infancy, there are hurdles that currently hinder growth and the impact on South African society, the South African environment, and South Africa ability to remain competitive in a globalised supply chain. Most recently, however, small inroads are being made with the $100 million loan granted to Eskom at the end of June 2018 by a German Government-owned bank.
HULAMIN SUSTAINABILITY REPORT for the year ended 31 December 202016
A NEW NORMAL: 2020 AND THE COVID-19 PANDEMIC
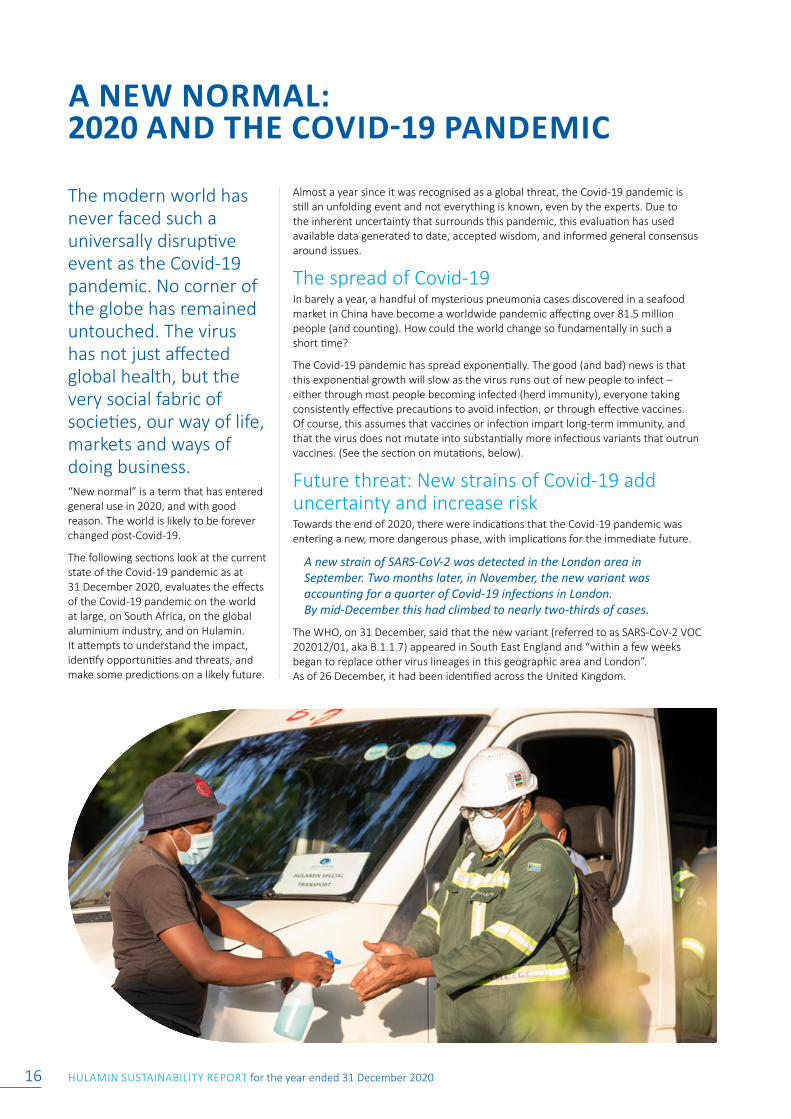
The modern world has never faced such a universally disruptive event as the Covid-19 pandemic. No corner of the globe has remained untouched. The virus has not just affected global health, but the very social fabric of societies, our way of life, markets and ways of doing business. “New normal” is a term that has entered general use in 2020, and with good reason. The world is likely to be forever changed post-Covid-19.
The following sections look at the current state of the Covid-19 pandemic as at 31 December 2020, evaluates the effects of the Covid-19 pandemic on the world at large, on South Africa, on the global aluminium industry, and on Hulamin. It attempts to understand the impact, identify opportunities and threats, and make some predictions on a likely future.
Almost a year since it was recognised as a global threat, the Covid-19 pandemic is still an unfolding event and not everything is known, even by the experts. Due to the inherent uncertainty that surrounds this pandemic, this evaluation has used available data generated to date, accepted wisdom, and informed general consensus around issues.
The spread of Covid-19 In barely a year, a handful of mysterious pneumonia cases discovered in a seafood market in China have become a worldwide pandemic affecting over 81.5 million people (and counting). How could the world change so fundamentally in such a short time?
The Covid-19 pandemic has spread exponentially. The good (and bad) news is that this exponential growth will slow as the virus runs out of new people to infect –either through most people becoming infected (herd immunity), everyone taking consistently effective precautions to avoid infection, or through effective vaccines. Of course, this assumes that vaccines or infection impart long-term immunity, and that the virus does not mutate into substantially more infectious variants that outrun vaccines. (See the section on mutations, below).
Future threat: New strains of Covid-19 add uncertainty and increase riskTowards the end of 2020, there were indications that the Covid-19 pandemic was entering a new, more dangerous phase, with implications for the immediate future.
A new strain of SARS-CoV-2 was detected in the London area in September. Two months later, in November, the new variant was accounting for a quarter of Covid-19 infections in London. By mid-December this had climbed to nearly two-thirds of cases.
The WHO, on 31 December, said that the new variant (referred to as SARS-CoV-2 VOC 202012/01, aka B.1.1.7) appeared in South East England and “within a few weeks began to replace other virus lineages in this geographic area and London”. As of 26 December, it had been identified across the United Kingdom.
HULAMIN SUSTAINABILITY REPORT for the year ended 31 December 2020 17
INTRODUCTION SOCIAL CAPITAL NATURAL CAPITAL HUMAN CAPITAL
“Whilst the full significance of the mutations is yet to be determined,” said the authors, “the genomic data, showing the rapid displacement of other lineages, suggest that this lineage may be associated with increased transmissibility.”
The WHO commented on 31 December that while the South African variant has the same “N501Y mutation” as the UK variant, “phylogenetic analysis has shown that 501Y.V2 from South Africa is a different virus variant”.
The South African authorities have found that the new variant has largely replaced other SARS-CoV-2 viruses circulating in the Eastern Cape, Western Cape and KwaZulu-Natal provinces, and is rapidly replacing other lineages circulating in South Africa.
The WHO also revealed that “the variant is associated with a higher viral load, which may suggest potential for increased transmissibility” but that this was subject to further investigation.
“At this stage, there is no clear evidence of the new variant being associated with more severe disease or worse outcomes. Further investigations are needed to understand the impact on transmission, clinical severity of infection, laboratory diagnostics, or public health preventive measures,” they said.
As of 30 December, the 501Y.V2 variant from South Africa had been reported in four other countries.
The impact of Covid-19 on South AfricaIn South Africa, economic activity fell sharply in the first half of the year and inflation crept up. According to Statistics South Africa (Stats SA), annual consumer inflation hit a seven-month high in October, driven largely by rising prices for food and non-alcoholic beverages. Stats SA reported headline inflation as 3.3%, the biggest annual rise since March, when the rate was 4.1%.
The World Bank forecast that South Africa’s output would contract by 7.1% this year, the deepest contraction in a century, and Stats SA reported a significant slump of 16.6% (annualised: -51.7%) in the second quarter (the most restrictive months of the Covid-19 lockdown in April, May and June). GDP did grow by an estimated 13.5% in the third quarter (July to September), however, for an annualised growth rate of 66.1%. This Q3 growth off a very low Q2 base means that the economy was still effectively 5.8% smaller at the end of Q3 than it was at the end of 2019. There is still a long way to go for South African industries to reach pre-pandemic production levels.
The champion drivers of growth in Q3 were manufacturing, as well as trade and mining. The manufacturing industry rose at an annualised rate of 210.2%, mostly driven by increases in the production of basic metal products, petroleum, vehicles, and food and beverages.
There have been job losses in all industries in 2020, with a year-on-year decrease of 616 000 employees in September 2020 compared with September 2019, as reported by the quarterly employment statistics (QES) survey released by Stats SA.
“Preliminary epidemiologic modelling, phylogenetic and clinical findings suggest that SARS-CoV-2 VOC 202012/01 has increased transmissibility,” said the WHO. “However, preliminary analyses also indicate that there is no change in disease severity.”
Dr Erik Volz, from Imperial College London, estimated the variant to be 70% more transmissible, while admitting that it was still too early to tell conclusively. Some scientists had quoted potentially higher figures than 70%, others lower. “But,” said Dr Volz, “from what we see so far it is growing very quickly, it is growing faster than a previous variant ever grew”.
This enhanced infectiousness is due to mutations in the virus – in this case 23 mutations that arose “without prior notice and faster than anyone expected”, a National Geographic article explained in its December 2020 Covid-19 coverage.
“That’s a very striking and unusual finding,” said Nick Loman, who is part of the Covid-19 Genomics Consortium UK.
In October, similar mutations were found in the SARS-CoV-2 virus in South Africa which described a new SARS-CoV-2 lineage (501Y.V2) with mutations “that may have functional significance”.
This variant emerged in South Africa after the first epidemic wave in the severely affected Nelson Mandela Bay area in the Eastern Cape Province, from where it rapidly spread within weeks to become the dominant variant in the Eastern Cape and Western Cape Provinces.

HULAMIN SUSTAINABILITY REPORT for the year ended 31 December 202018
A NEW NORMAL: 2020 AND THE COVID-19 PANDEMIC continued
The impact of Covid-19 on HulaminAs with most companies across the world, the Covid-19 pandemic created major disruptions to demand and manufacturing operations at Hulamin, and the first half of 2020 was a challenging period.
Hulamin had to cease operations in late March, following President Ramaphosa’s announcement of a countrywide Level 5 lockdown under the Disaster Management Act. In April the company was able to restart manufacturing of certain product lines that were deemed essential goods, but this only represented less than 50% of Hulamin’s product portfolio.
Protecting the health of employees and safeguarding the liquidity of the business was Hulamin’s focus during this time. Curtailing the procurement of primary aluminium, reducing inventory levels and focusing on the conversion of existing inventory to cash were prioritised. Manufacturing centres without sufficient work were shut down, and those employees who could work from home were issued with computers and data to continue working normal hours as meetings were moved online. Seven enabling pillars (as shown in figure 1), manned by dedicated, empowered teams were identified in order to provide a structure to support the new working arrangements and promote rapid problem solving and execution while functioning in highly stressed and sometimes uncertain conditions.
As at 31 December 2020, Hulamin had spent R26 679 005 towards Covid-19-related initiatives such as employee transport, wellness (including return to site professional coaching for employees who tested positive), employee-awareness-programme, communication, education and safety protocols.
In September further measures were put in place:
• An updated operational framework was adopted, with the objective of guiding our actions as we transitioned through the various lockdown levels in South Africa (figure 1).
• The full time returning to site of employees was identified as a key enabler to drive enhanced business operational performance.
• The main triggers enabling the full time returning to site for employees included the number of active cases being experienced during a week, as well as the country lockdown level.
• The updated guiding principles were transitioned from mainly social distancing principles to a broader set of principles including active management, embracing technological advancements and the appropriate allocation of resources.
• The main update of Hulamin’s approach towards Covid-19 testing for employees had moved from routine PCR (swab) testing towards testing employees who show symptoms and employees who are identified as being direct contacts of an individual who tested positive.
• A sample of 40 employees had undergone the anti-body testing, and the results showed that the employees with anti-bodies present, were employees who had previously displayed symptoms. The results also showed that employees who tested positive previously, but were asymptomatic, did not have anti-bodies present. These results had a direct impact on the herd immunity that may exist at Hulamin, causing our approach to remain conservative towards employees with comorbidities and maintain our strict approach towards site physical distancing.
• A phased approach towards employees returning to site full time was undertaken from 28 September 2020.
STRATEGIC Updated business metrics
SYSTEMIC Social distancing business work arrangements (Area physical distancing plans)
ENABLING PILLARS Transport
Health and wellbeing
Communication and wellbeing
Contractors and visitors
CostDeep cleaning
Employee payment
FOUNDATIONALCovid-19 resources (Secondment)
Shop floor involvement (Unions and shop stewards)
Figure 1: Operational framework – Covid-19 enablement
HULAMIN SUSTAINABILITY REPORT for the year ended 31 December 2020 19
INTRODUCTION SOCIAL CAPITAL NATURAL CAPITAL HUMAN CAPITAL
Weekly Symptomatic Covid-19 cases
0
5
10
15
20
25
2020
-17
2020
-18
2020
-19
2020
-20
2020
-21
2020
-22
2020
-23
2020
-24
2020
-25
2020
-26
2020
-27
2020
-28
2020
-29
2020
-30
2020
-31
2020
-32
2020
-33
2020
-34
2020
-35
2020
-36
2020
-37
2020
-38
2020
-39
2020
-40
2020
-41
2020
-42
2020
-43
2020
-44
2020
-45
2020
-46
2020
-47
2020
-48
2020
-49
2020
-50
2020
-51
2020
-52
2020
-16
2 Week AveSymptomatic
Monthly Covid-19 Positive Cases
0
50
100
150
200
250
300
350
400
DecNovOctSepAugJulJunMayApr
Hulamin Covid-19 Statistics for 2020
Number of employees and contractors tested positive
Recovered
Employees who have passed away from Covid-19
523
4
490
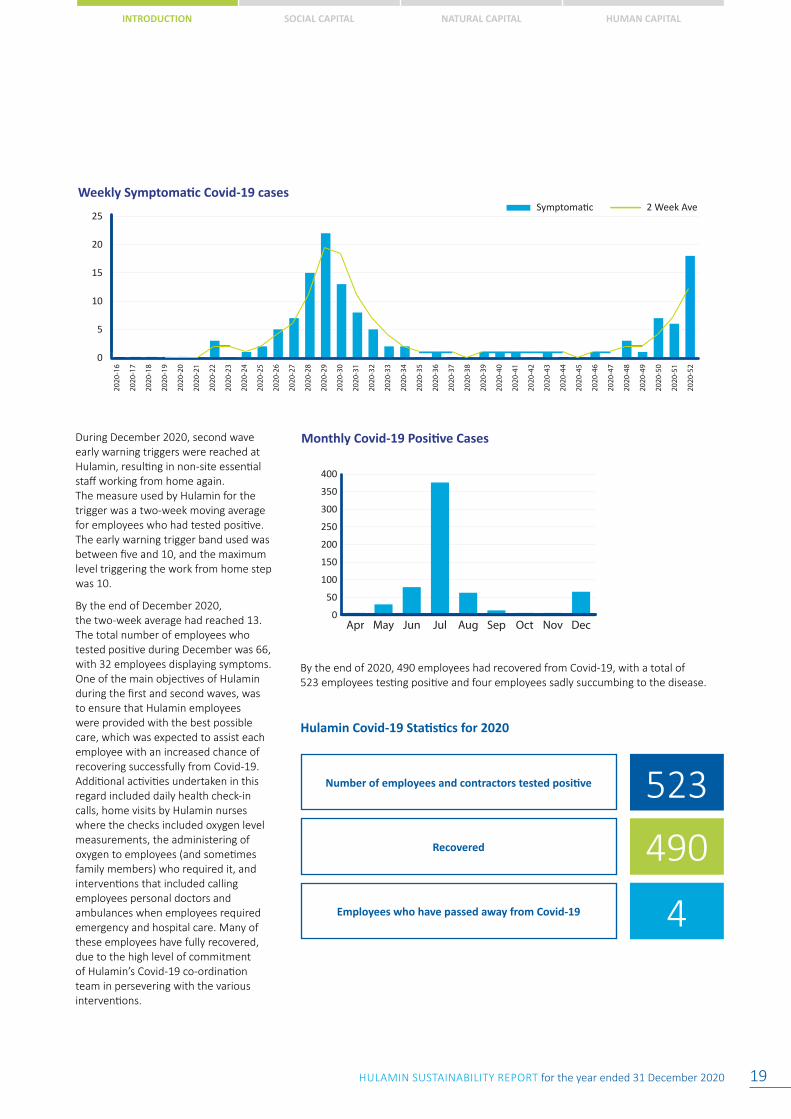
During December 2020, second wave early warning triggers were reached at Hulamin, resulting in non-site essential staff working from home again. The measure used by Hulamin for the trigger was a two-week moving average for employees who had tested positive. The early warning trigger band used was between five and 10, and the maximum level triggering the work from home step was 10.
By the end of December 2020, the two-week average had reached 13. The total number of employees who tested positive during December was 66, with 32 employees displaying symptoms. One of the main objectives of Hulamin during the first and second waves, was to ensure that Hulamin employees were provided with the best possible care, which was expected to assist each employee with an increased chance of recovering successfully from Covid-19. Additional activities undertaken in this regard included daily health check-in calls, home visits by Hulamin nurses where the checks included oxygen level measurements, the administering of oxygen to employees (and sometimes family members) who required it, and interventions that included calling employees personal doctors and ambulances when employees required emergency and hospital care. Many of these employees have fully recovered, due to the high level of commitment of Hulamin’s Covid-19 co-ordination team in persevering with the various interventions.
By the end of 2020, 490 employees had recovered from Covid-19, with a total of 523 employees testing positive and four employees sadly succumbing to the disease.
HULAMIN SUSTAINABILITY REPORT for the year ended 31 December 202020
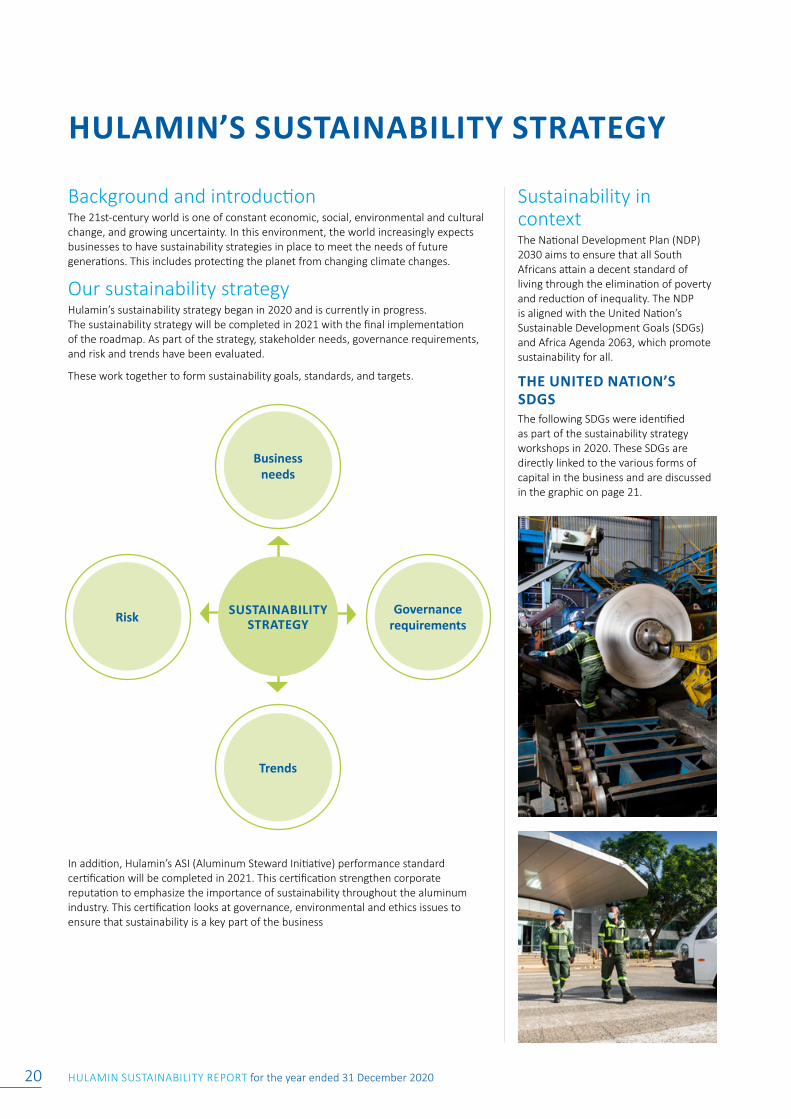
HULAMIN’S SUSTAINABILITY STRATEGY
Background and introductionThe 21st-century world is one of constant economic, social, environmental and cultural change, and growing uncertainty. In this environment, the world increasingly expects businesses to have sustainability strategies in place to meet the needs of future generations. This includes protecting the planet from changing climate changes.
Our sustainability strategyHulamin’s sustainability strategy began in 2020 and is currently in progress. The sustainability strategy will be completed in 2021 with the final implementation of the roadmap. As part of the strategy, stakeholder needs, governance requirements, and risk and trends have been evaluated.
These work together to form sustainability goals, standards, and targets.
In addition, Hulamin’s ASI (Aluminum Steward Initiative) performance standard certification will be completed in 2021. This certification strengthen corporate reputation to emphasize the importance of sustainability throughout the aluminum industry. This certification looks at governance, environmental and ethics issues to ensure that sustainability is a key part of the business
Sustainability in context The National Development Plan (NDP) 2030 aims to ensure that all South Africans attain a decent standard of living through the elimination of poverty and reduction of inequality. The NDP is aligned with the United Nation’s Sustainable Development Goals (SDGs) and Africa Agenda 2063, which promote sustainability for all.
THE UNITED NATION’S SDGS The following SDGs were identified as part of the sustainability strategy workshops in 2020. These SDGs are directly linked to the various forms of capital in the business and are discussed in the graphic on page 21.
Business needs
Governance requirements
Trends
Risk SUSTAINABILITY STRATEGY
HULAMIN SUSTAINABILITY REPORT for the year ended 31 December 2020 21
INTRODUCTION SOCIAL CAPITAL NATURAL CAPITAL HUMAN CAPITAL
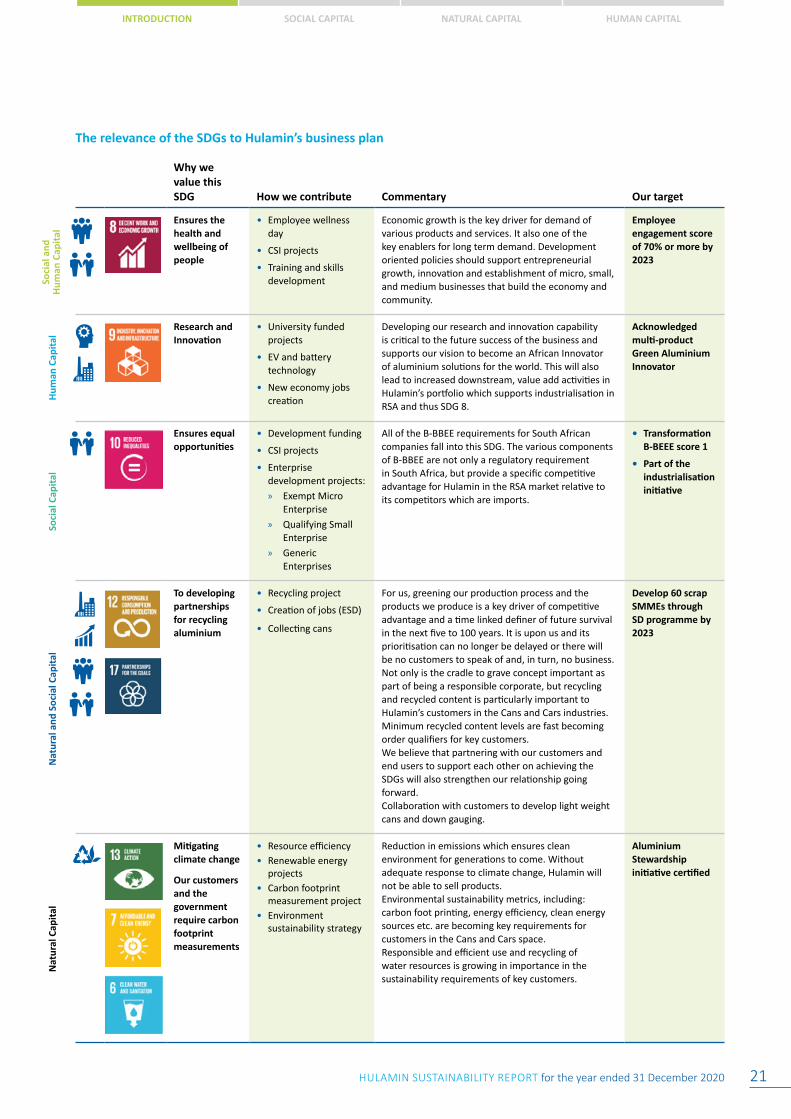
The relevance of the SDGs to Hulamin’s business plan
Why we value this SDG How we contribute Commentary Our target
Ensures the health and wellbeing of people
• Employee wellness day
• CSI projects
• Training and skills development
Economic growth is the key driver for demand of various products and services. It also one of the key enablers for long term demand. Development oriented policies should support entrepreneurial growth, innovation and establishment of micro, small, and medium businesses that build the economy and community.
Employee engagement score of 70% or more by 2023
Research and Innovation
• University funded projects
• EV and battery technology
• New economy jobs creation
Developing our research and innovation capability is critical to the future success of the business and supports our vision to become an African Innovator of aluminium solutions for the world. This will also lead to increased downstream, value add activities in Hulamin’s portfolio which supports industrialisation in RSA and thus SDG 8.
Acknowledged multi-product Green Aluminium Innovator
Ensures equal opportunities
• Development funding
• CSI projects
• Enterprise development projects: » Exempt Micro
Enterprise » Qualifying Small
Enterprise » Generic
Enterprises
All of the B-BBEE requirements for South African companies fall into this SDG. The various components of B-BBEE are not only a regulatory requirement in South Africa, but provide a specific competitive advantage for Hulamin in the RSA market relative to its competitors which are imports.
• Transformation B-BEEE score 1
• Part of the industrialisation initiative
To developing partnerships for recycling aluminium
• Recycling project
• Creation of jobs (ESD)
• Collecting cans
For us, greening our production process and the products we produce is a key driver of competitive advantage and a time linked definer of future survival in the next five to 100 years. It is upon us and its prioritisation can no longer be delayed or there will be no customers to speak of and, in turn, no business. Not only is the cradle to grave concept important as part of being a responsible corporate, but recycling and recycled content is particularly important to Hulamin’s customers in the Cans and Cars industries. Minimum recycled content levels are fast becoming order qualifiers for key customers.We believe that partnering with our customers and end users to support each other on achieving the SDGs will also strengthen our relationship going forward.Collaboration with customers to develop light weight cans and down gauging.
Develop 60 scrap SMMEs through SD programme by 2023
Mitigating climate change
Our customers and the government require carbon footprint measurements
• Resource efficiency• Renewable energy
projects• Carbon footprint
measurement project• Environment
sustainability strategy
Reduction in emissions which ensures clean environment for generations to come. Without adequate response to climate change, Hulamin will not be able to sell products.Environmental sustainability metrics, including: carbon foot printing, energy efficiency, clean energy sources etc. are becoming key requirements for customers in the Cans and Cars space. Responsible and efficient use and recycling of water resources is growing in importance in the sustainability requirements of key customers.
Aluminium Stewardship initiative certified
Soci
al a
nd
Hum
an C
apit
alH
uman
Cap
ital
Soci
al C
apit
alN
atur
al a
nd S
ocia
l Cap
ital
Nat
ural
Cap
ital
HULAMIN SUSTAINABILITY REPORT for the year ended 31 December 202022
HULAMIN’S SUSTAINABILITY STRATEGY continued
Risk managementThe implementation of an effective and efficient risk management process is critical to Hulamin achieving its strategic, operational and sustainability goals, particularly in the current environment of change and uncertainty. Hulamin recognises that risk is intrinsic to the business and that there is a balance to be struck between managing risk and exploiting opportunities. The group’s response to identified risks includes acceptance, avoidance, transfer and mitigation, as informed by the group’s risk appetite and tolerance levels.
It is Hulamin’s policy that risks should be understood and managed through a relevant and formal structure to facilitate the achievement of the business’s long-term objectives, which recognise the interests of all stakeholders.
The formal structure assists in:
• Identifying and evaluating risks
• Setting acceptable risk limits
• Monitoring risk management actions and controls
• Assessing the effectiveness of risk management
SUSTAINABILITY RISK MANAGEMENTSustainability risks are identified and evaluated in the teams chaired by the executives responsible for the various capitals. These risks are reviewed by the Board subcommittees of Remuneration Social Ethics and Sustainability and audit. These subcommittees provide direction and assurance to the main risk committee that the risks are being reviewed and mitigated.
As part of this assurance, the following trends and uncertainties were identified and reviewed in 2020.
Trends Specific Uncertainties for Hulamin
Stable Covid-19 pandemic for South Africa whilst increasing risk of second wave in December 2020
Increased risk of not meeting forecast performance and extended lockdown of manufacturing due to second wave of Covid-19.
Social bankruptcy Due to increasing local protest, metal supply and logistics to customers could be affected.
Sustainability Sustainability and the green economy are a big post-Covid-19 requirement from consumers and government. Hulamin’s sustainability strategy and ASI certification will address this risk.
HULAMIN SUSTAINABILITY REPORT for the year ended 31 December 2020 23
INTRODUCTION SOCIAL CAPITAL NATURAL CAPITAL HUMAN CAPITAL
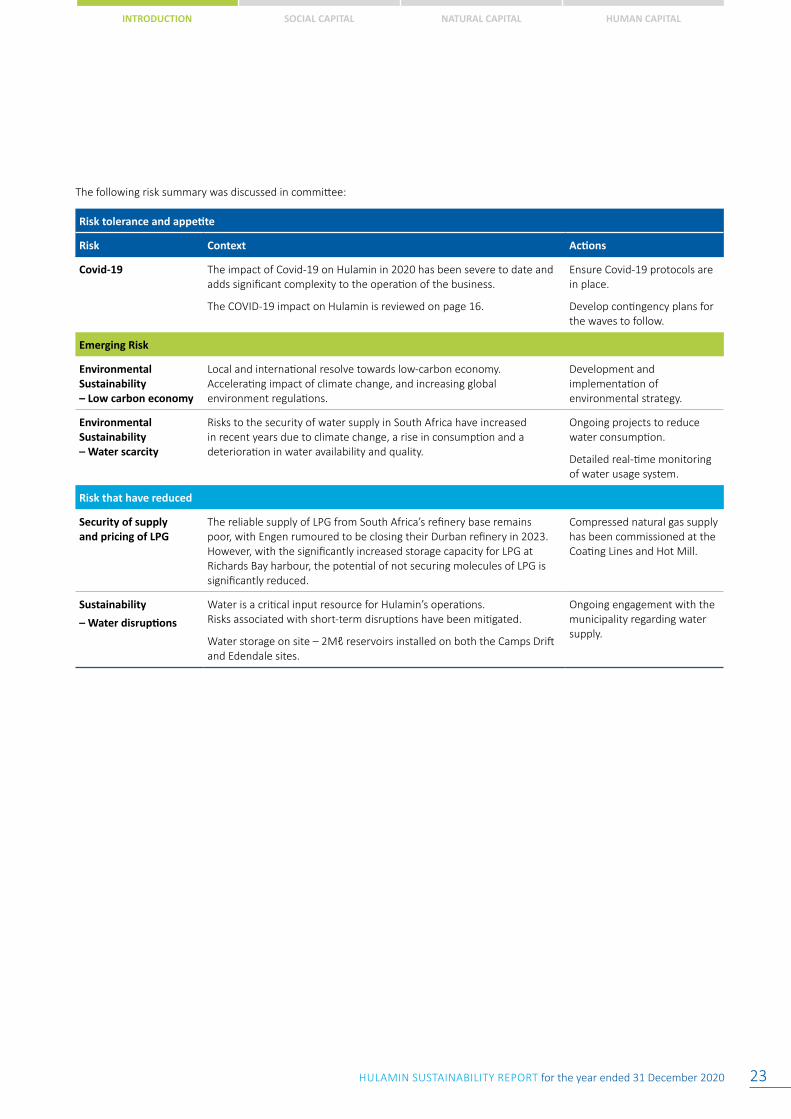
The following risk summary was discussed in committee:
Risk tolerance and appetite
Risk Context Actions
Covid-19 The impact of Covid-19 on Hulamin in 2020 has been severe to date and adds significant complexity to the operation of the business.
The COVID-19 impact on Hulamin is reviewed on page 16.
Ensure Covid-19 protocols are in place.
Develop contingency plans for the waves to follow.
Emerging Risk
Environmental Sustainability – Low carbon economy
Local and international resolve towards low-carbon economy. Accelerating impact of climate change, and increasing global environment regulations.
Development and implementation of environmental strategy.
Environmental Sustainability – Water scarcity
Risks to the security of water supply in South Africa have increased in recent years due to climate change, a rise in consumption and a deterioration in water availability and quality.
Ongoing projects to reduce water consumption.
Detailed real-time monitoring of water usage system.
Risk that have reduced
Security of supply and pricing of LPG
The reliable supply of LPG from South Africa’s refinery base remains poor, with Engen rumoured to be closing their Durban refinery in 2023. However, with the significantly increased storage capacity for LPG at Richards Bay harbour, the potential of not securing molecules of LPG is significantly reduced.
Compressed natural gas supply has been commissioned at the Coating Lines and Hot Mill.
Sustainability
– Water disruptions
Water is a critical input resource for Hulamin’s operations. Risks associated with short-term disruptions have been mitigated.
Water storage on site – 2Mℓ reservoirs installed on both the Camps Drift and Edendale sites.
Ongoing engagement with the municipality regarding water supply.
HULAMIN SUSTAINABILITY REPORT for the year ended 31 December 202024
PREFERENTIAL PROCUREMENT
SOCIAL CAPITALPreferential procurement 24
Enterprise and supplier development 30
Corporate social investment 32
Aluminium beneficiation 40
02
The context of Enterprise and Supplier Development for Hulamin in South Africa The aluminium industry in South Africa largely comprises a few large organisations who have yet to adequately transform in accordance with South Africa’s social and economic inclusion agenda. The Broad-Based Black Economic Empowerment (B-BBEE) Code of Good Conduct seeks to address the historical injustices in South Africa by encouraging business to actively incorporate previously marginalised and disadvantaged individuals (primarily, black South Africans) into the economy, to ensure that it is more reflective of the demographics of the country. South African businesses serve as primary implementers of the B-BBEE codes to achieve the desired outcomes for Transformation.
The new B-BBEE Codes seek to obtain five developmental objectives; skills development, job creation, localisation, industrialisation and supplier development. Transformation in the aluminium industry requires improvement and given the current B-BBEE status of the upstream businesses on which there is immense dependency by all other players in the value chain, Enterprise and Supplier Development (ESD) is one of the ways in which the industry could significantly contribute to the developmental objectives and transformation agenda of the country as a whole.
When the Broad-Based Black Economic Empowerment Codes of Good Practice were amended in 2012, Preferential Procurement (PP) and ESD merged into one element on the scorecard. This element has elevated the significance of ESD and PP, emphasising how the integration enables shared value as ESD now contributes to the transformation of the supply chain. Over time this can
INTRODUCTION SOCIAL CAPITAL NATURAL CAPITAL HUMAN CAPITAL
HULAMIN SUSTAINABILITY REPORT for the year ended 31 December 2020 25
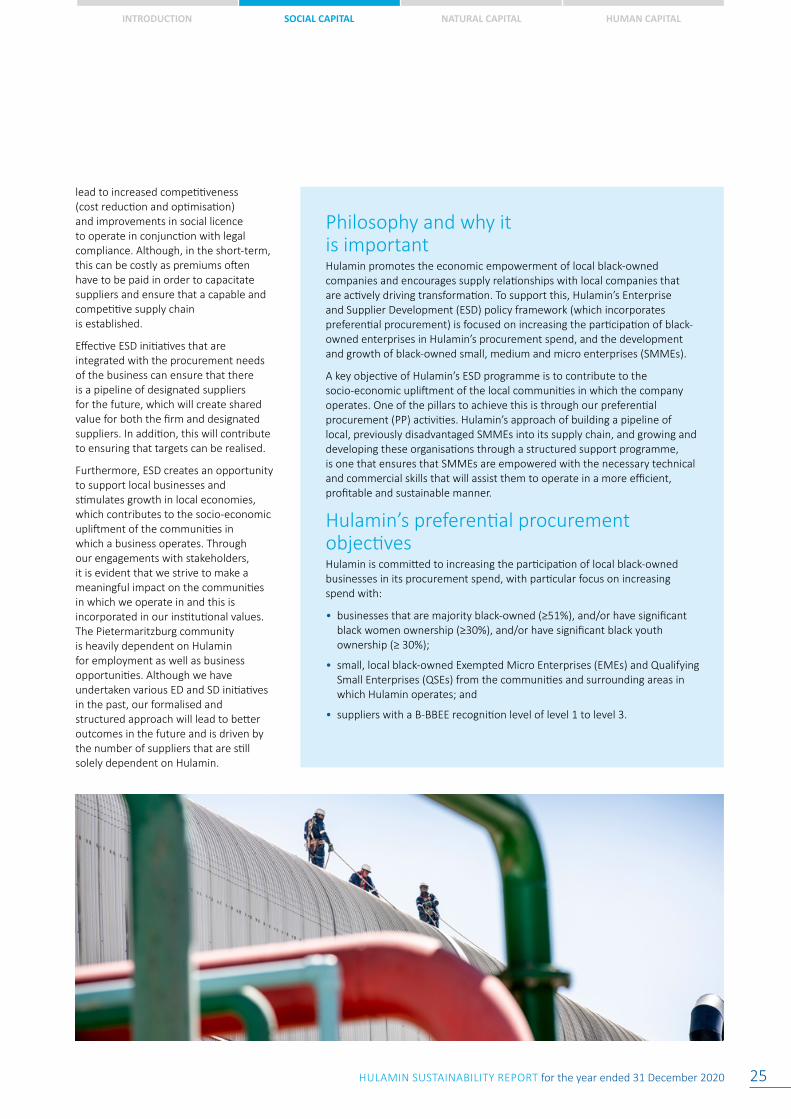
Philosophy and why it is importantHulamin promotes the economic empowerment of local black-owned companies and encourages supply relationships with local companies that are actively driving transformation. To support this, Hulamin’s Enterprise and Supplier Development (ESD) policy framework (which incorporates preferential procurement) is focused on increasing the participation of black-owned enterprises in Hulamin’s procurement spend, and the development and growth of black-owned small, medium and micro enterprises (SMMEs).
A key objective of Hulamin’s ESD programme is to contribute to the socio-economic upliftment of the local communities in which the company operates. One of the pillars to achieve this is through our preferential procurement (PP) activities. Hulamin’s approach of building a pipeline of local, previously disadvantaged SMMEs into its supply chain, and growing and developing these organisations through a structured support programme, is one that ensures that SMMEs are empowered with the necessary technical and commercial skills that will assist them to operate in a more efficient, profitable and sustainable manner.
Hulamin’s preferential procurement objectivesHulamin is committed to increasing the participation of local black-owned businesses in its procurement spend, with particular focus on increasing spend with:
• businesses that are majority black-owned (≥51%), and/or have significant black women ownership (≥30%), and/or have significant black youth ownership (≥ 30%);
• small, local black-owned Exempted Micro Enterprises (EMEs) and Qualifying Small Enterprises (QSEs) from the communities and surrounding areas in which Hulamin operates; and
• suppliers with a B-BBEE recognition level of level 1 to level 3.
lead to increased competitiveness (cost reduction and optimisation) and improvements in social licence to operate in conjunction with legal compliance. Although, in the short-term, this can be costly as premiums often have to be paid in order to capacitate suppliers and ensure that a capable and competitive supply chain is established.
Effective ESD initiatives that are integrated with the procurement needs of the business can ensure that there is a pipeline of designated suppliers for the future, which will create shared value for both the firm and designated suppliers. In addition, this will contribute to ensuring that targets can be realised.
Furthermore, ESD creates an opportunity to support local businesses and stimulates growth in local economies, which contributes to the socio-economic upliftment of the communities in which a business operates. Through our engagements with stakeholders, it is evident that we strive to make a meaningful impact on the communities in which we operate in and this is incorporated in our institutional values. The Pietermaritzburg community is heavily dependent on Hulamin for employment as well as business opportunities. Although we have undertaken various ED and SD initiatives in the past, our formalised and structured approach will lead to better outcomes in the future and is driven by the number of suppliers that are still solely dependent on Hulamin.
HULAMIN SUSTAINABILITY REPORT for the year ended 31 December 202026
PREFERENTIAL PROCUREMENT continued
Preferential procurement approachTo achieve its PP objectives, Hulamin:
• gives preference to competitive B-BBEE compliant suppliers (level 1 to level 3), and majority black-owned enterprises in particular, in request for quote (RFQ) evaluation criteria and adjudications;
• may, for certain spend categories, ring fence RFQs/tenders, partially or fully, for majority black-owned enterprises, particularly black-owned EMEs and QSEs from the communities and surrounding areas in which Hulamin operates;
• actively encourages suppliers to improve their B-BBEE recognition levels, and in some instances initiates joint initiatives with strategic suppliers to drive transformation in the supply chain for the applicable goods or services; and
• encourages and supports joint ventures or partnerships and subcontracting arrangements between small majority black-owned suppliers and large incumbent suppliers, in order to effect knowledge and skills transfer and provide entry opportunities for the smaller black-owned suppliers into larger scope contracts.
GovernanceHulamin’s Enterprise and Supplier Development (ESD) committee oversees the company’s activities and progress in PP, Enterprise Development and Supplier Development, and reports to the Social, Ethics and Sustainability Committee, a sub-committee of the Board. The mandate of the ESD committee includes:
• overseeing the development and execution of Hulamin’s ESD strategy, policy and procedures;
• overseeing the company’s ESD programme and associated activities, and investments; and
• reviewing and taking decisions on supplier disputes and appeals, particularly in relation to the EME and QSE supplier base.
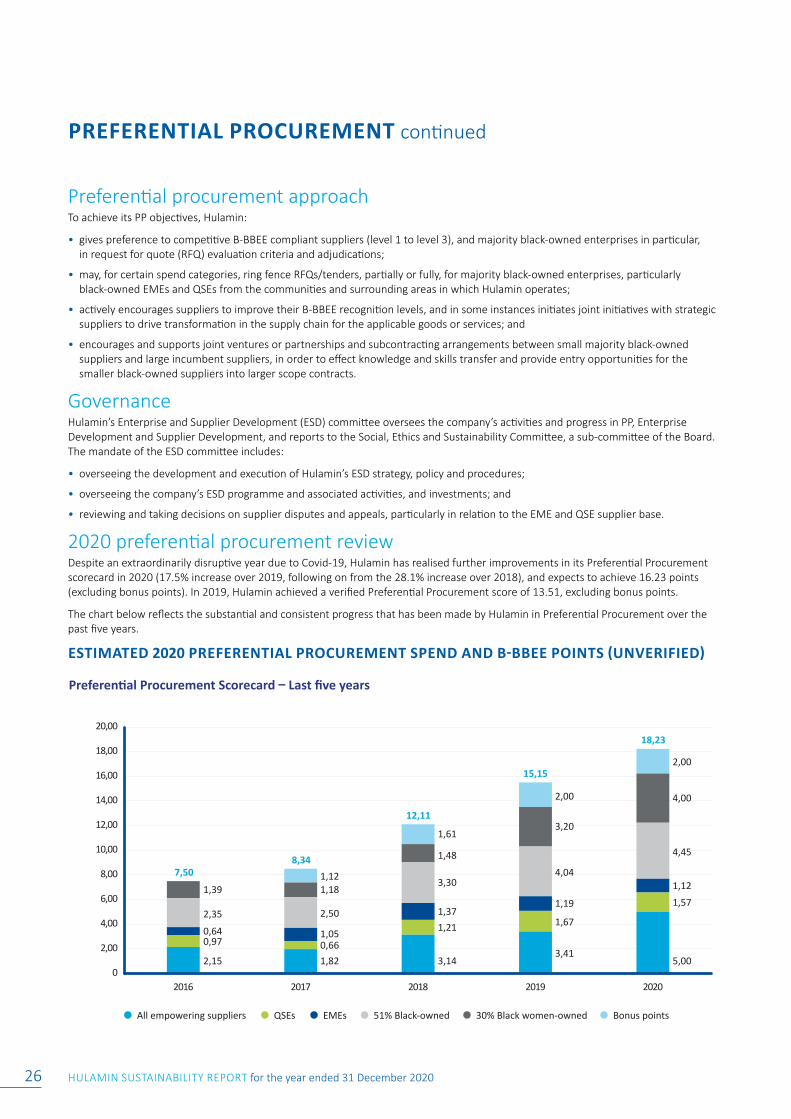
2020 preferential procurement review Despite an extraordinarily disruptive year due to Covid-19, Hulamin has realised further improvements in its Preferential Procurement scorecard in 2020 (17.5% increase over 2019, following on from the 28.1% increase over 2018), and expects to achieve 16.23 points (excluding bonus points). In 2019, Hulamin achieved a verified Preferential Procurement score of 13.51, excluding bonus points.
The chart below reflects the substantial and consistent progress that has been made by Hulamin in Preferential Procurement over the past five years.
ESTIMATED 2020 PREFERENTIAL PROCUREMENT SPEND AND B-BBEE POINTS (UNVERIFIED)
All empowering suppliers QSEs EMEs 51% Black-owned 30% Black women-owned Bonus points
Preferential Procurement Scorecard – Last five years
0
2,00
4,00
6,00
8,00
10,00
12,00
14,00
16,00
18,00
20,00
20202019201820172016
2,15
0,970,64
2,35
1,39
1,820,661,05
2,50
1,181,12
3,14
1,61
1,211,37
3,30
1,48
3,41
1,67
1,19
4,04
3,20
2,00
5,00
1,571,12
4,45
4,00
2,00
7,508,34
12,11
15,15
18,23
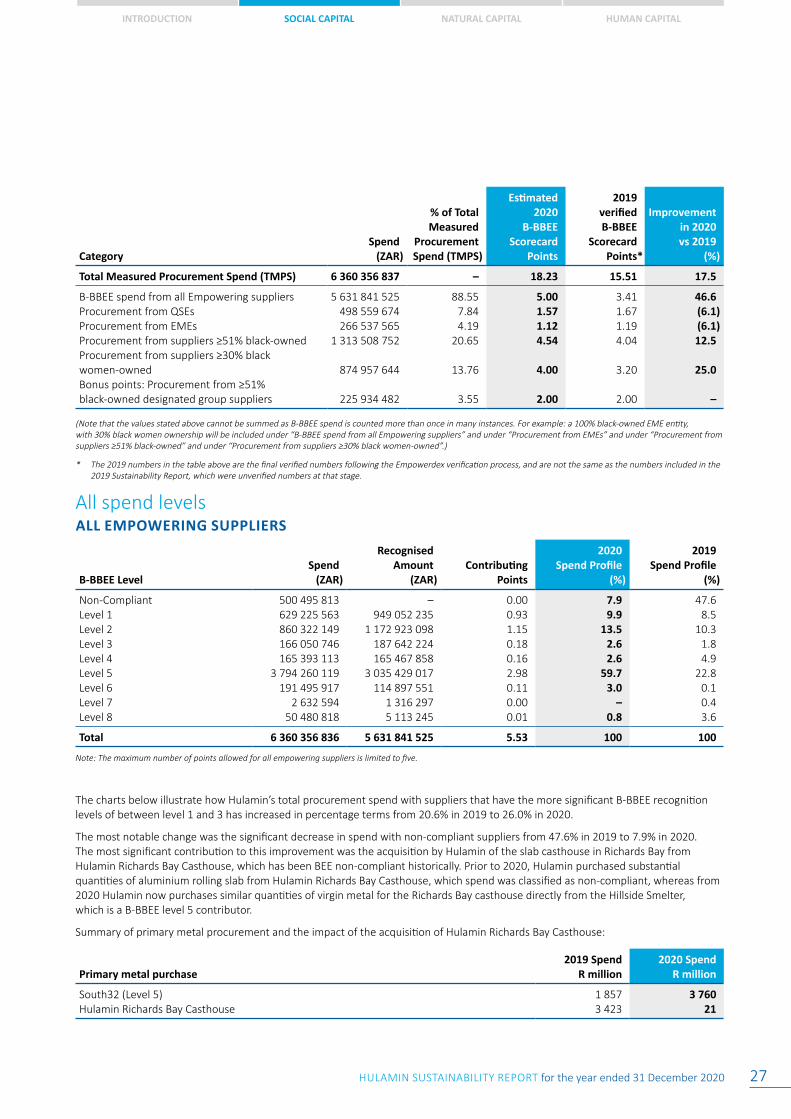
INTRODUCTION SOCIAL CAPITAL NATURAL CAPITAL HUMAN CAPITAL
HULAMIN SUSTAINABILITY REPORT for the year ended 31 December 2020 27
The charts below illustrate how Hulamin’s total procurement spend with suppliers that have the more significant B-BBEE recognition levels of between level 1 and 3 has increased in percentage terms from 20.6% in 2019 to 26.0% in 2020.
The most notable change was the significant decrease in spend with non-compliant suppliers from 47.6% in 2019 to 7.9% in 2020. The most significant contribution to this improvement was the acquisition by Hulamin of the slab casthouse in Richards Bay from Hulamin Richards Bay Casthouse, which has been BEE non-compliant historically. Prior to 2020, Hulamin purchased substantial quantities of aluminium rolling slab from Hulamin Richards Bay Casthouse, which spend was classified as non-compliant, whereas from 2020 Hulamin now purchases similar quantities of virgin metal for the Richards Bay casthouse directly from the Hillside Smelter, which is a B-BBEE level 5 contributor.
Summary of primary metal procurement and the impact of the acquisition of Hulamin Richards Bay Casthouse:
Primary metal purchase2019 Spend
R million2020 Spend
R million
South32 (Level 5) 1 857 3 760Hulamin Richards Bay Casthouse 3 423 21
CategorySpend
(ZAR)
% of TotalMeasured
ProcurementSpend (TMPS)
Estimated 2020
B-BBEEScorecard
Points
2019 verifiedB-BBEE
ScorecardPoints*
Improvementin 2020vs 2019
(%)
Total Measured Procurement Spend (TMPS) 6 360 356 837 – 18.23 15.51 17.5
B-BBEE spend from all Empowering suppliers 5 631 841 525 88.55 5.00 3.41 46.6Procurement from QSEs 498 559 674 7.84 1.57 1.67 (6.1)Procurement from EMEs 266 537 565 4.19 1.12 1.19 (6.1)Procurement from suppliers ≥51% black-owned 1 313 508 752 20.65 4.54 4.04 12.5Procurement from suppliers ≥30% black women-owned 874 957 644 13.76 4.00 3.20 25.0Bonus points: Procurement from ≥51% black-owned designated group suppliers 225 934 482 3.55 2.00 2.00 –
(Note that the values stated above cannot be summed as B-BBEE spend is counted more than once in many instances. For example: a 100% black-owned EME entity, with 30% black women ownership will be included under “B-BBEE spend from all Empowering suppliers” and under “Procurement from EMEs” and under “Procurement from suppliers ≥51% black-owned” and under “Procurement from suppliers ≥30% black women-owned”.)
* The 2019 numbers in the table above are the final verified numbers following the Empowerdex verification process, and are not the same as the numbers included in the 2019 Sustainability Report, which were unverified numbers at that stage.
All spend levelsALL EMPOWERING SUPPLIERS
B-BBEE LevelSpend
(ZAR)
RecognisedAmount
(ZAR)Contributing
Points
2020Spend Profile
(%)
2019Spend Profile
(%)
Non-Compliant 500 495 813 – 0.00 7.9 47.6Level 1 629 225 563 949 052 235 0.93 9.9 8.5Level 2 860 322 149 1 172 923 098 1.15 13.5 10.3Level 3 166 050 746 187 642 224 0.18 2.6 1.8Level 4 165 393 113 165 467 858 0.16 2.6 4.9Level 5 3 794 260 119 3 035 429 017 2.98 59.7 22.8Level 6 191 495 917 114 897 551 0.11 3.0 0.1Level 7 2 632 594 1 316 297 0.00 – 0.4Level 8 50 480 818 5 113 245 0.01 0.8 3.6
Total 6 360 356 836 5 631 841 525 5.53 100 100
Note: The maximum number of points allowed for all empowering suppliers is limited to five.
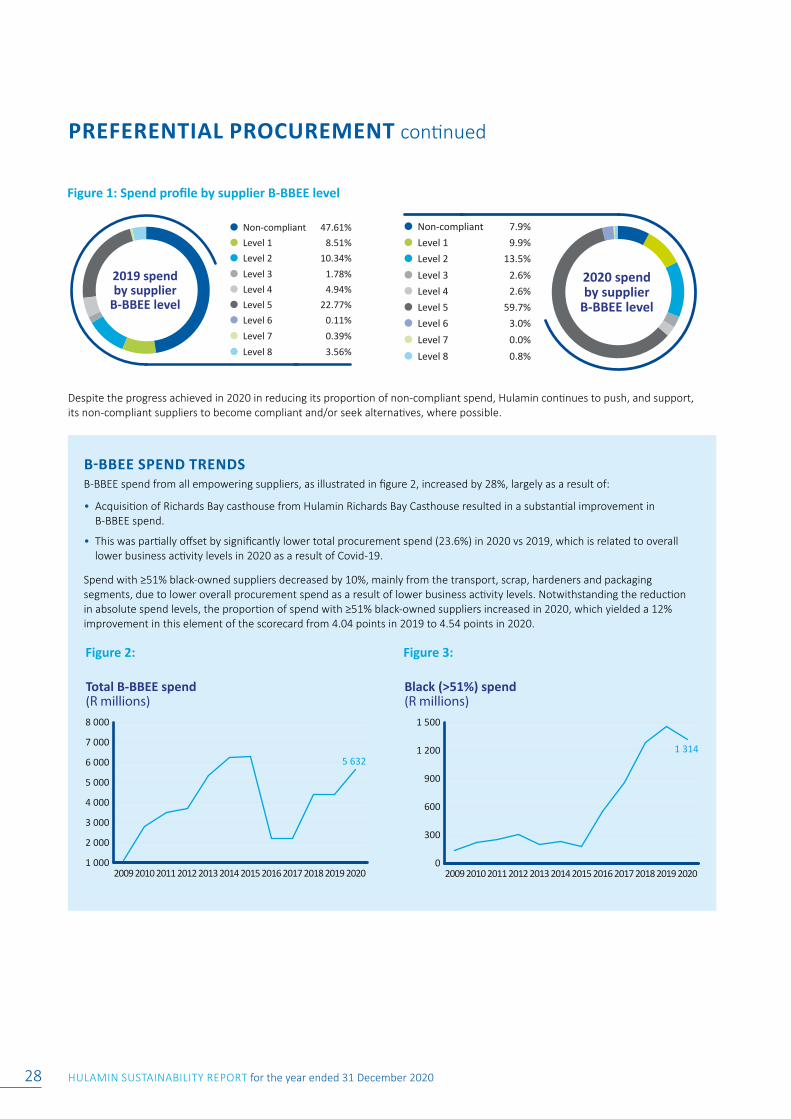
HULAMIN SUSTAINABILITY REPORT for the year ended 31 December 202028
PREFERENTIAL PROCUREMENT continued
Non-compliant 7.9%
Level 3 2.6%
Level 1 9.9%
Level 2 13.5%
Level 4 2.6%
Level 7 0.0%
Level 8 0.8%
Level 5 59.7%
Level 6 3.0%
2020 spend by supplier
B-BBEE level
2019 spend by supplier
B-BBEE level
Non-compliant 47.61%
Level 3 1.78%
Level 1 8.51%
Level 2 10.34%
Level 4 4.94%
Level 7 0.39%
Level 8 3.56%
Level 5 22.77%
Level 6 0.11%
Figure 1: Spend profile by supplier B-BBEE level
B-BBEE SPEND TRENDSB-BBEE spend from all empowering suppliers, as illustrated in figure 2, increased by 28%, largely as a result of:
• Acquisition of Richards Bay casthouse from Hulamin Richards Bay Casthouse resulted in a substantial improvement in B-BBEE spend.
• This was partially offset by significantly lower total procurement spend (23.6%) in 2020 vs 2019, which is related to overall lower business activity levels in 2020 as a result of Covid-19.
Spend with ≥51% black-owned suppliers decreased by 10%, mainly from the transport, scrap, hardeners and packaging segments, due to lower overall procurement spend as a result of lower business activity levels. Notwithstanding the reduction in absolute spend levels, the proportion of spend with ≥51% black-owned suppliers increased in 2020, which yielded a 12% improvement in this element of the scorecard from 4.04 points in 2019 to 4.54 points in 2020.
Black (>51%) spend(R millions)
0
300
600
900
1 200
1 500
202020192018201720162015201420132012201120102009
1 314
Figure 3: Figure 2:
Total B-BBEE spend (R millions)
1 000
2 000
3 000
4 000
5 000
6 000
7 000
8 000
202020192018201720162015201420132012201120102009
5 632
Despite the progress achieved in 2020 in reducing its proportion of non-compliant spend, Hulamin continues to push, and support, its non-compliant suppliers to become compliant and/or seek alternatives, where possible.
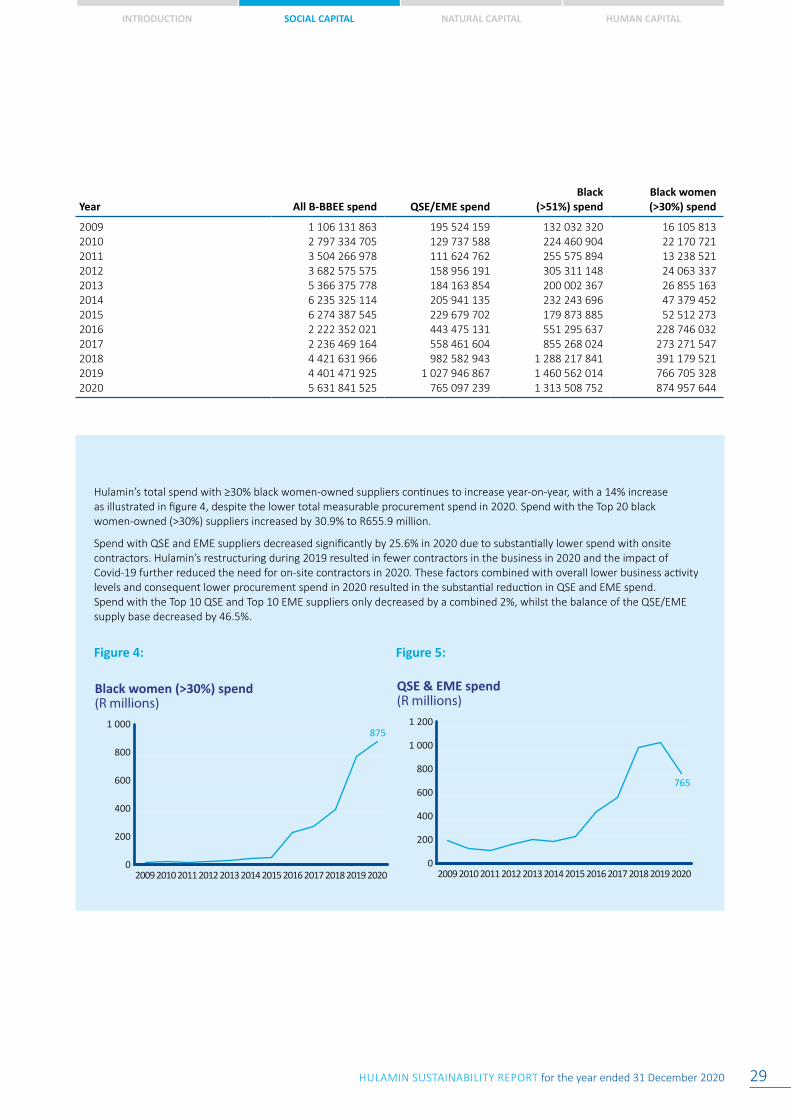
INTRODUCTION SOCIAL CAPITAL NATURAL CAPITAL HUMAN CAPITAL
HULAMIN SUSTAINABILITY REPORT for the year ended 31 December 2020 29
Year All B-BBEE spend QSE/EME spendBlack
(>51%) spendBlack women (>30%) spend
2009 1 106 131 863 195 524 159 132 032 320 16 105 8132010 2 797 334 705 129 737 588 224 460 904 22 170 7212011 3 504 266 978 111 624 762 255 575 894 13 238 5212012 3 682 575 575 158 956 191 305 311 148 24 063 3372013 5 366 375 778 184 163 854 200 002 367 26 855 1632014 6 235 325 114 205 941 135 232 243 696 47 379 4522015 6 274 387 545 229 679 702 179 873 885 52 512 2732016 2 222 352 021 443 475 131 551 295 637 228 746 0322017 2 236 469 164 558 461 604 855 268 024 273 271 5472018 4 421 631 966 982 582 943 1 288 217 841 391 179 5212019 4 401 471 925 1 027 946 867 1 460 562 014 766 705 3282020 5 631 841 525 765 097 239 1 313 508 752 874 957 644
Hulamin’s total spend with ≥30% black women-owned suppliers continues to increase year-on-year, with a 14% increase as illustrated in figure 4, despite the lower total measurable procurement spend in 2020. Spend with the Top 20 black women-owned (>30%) suppliers increased by 30.9% to R655.9 million.
Spend with QSE and EME suppliers decreased significantly by 25.6% in 2020 due to substantially lower spend with onsite contractors. Hulamin’s restructuring during 2019 resulted in fewer contractors in the business in 2020 and the impact of Covid-19 further reduced the need for on-site contractors in 2020. These factors combined with overall lower business activity levels and consequent lower procurement spend in 2020 resulted in the substantial reduction in QSE and EME spend. Spend with the Top 10 QSE and Top 10 EME suppliers only decreased by a combined 2%, whilst the balance of the QSE/EME supply base decreased by 46.5%.
QSE & EME spend(R millions)
0
200
400
600
800
1 000
1 200
202020192018201720162015201420132012201120102009
765
Black women (>30%) spend(R millions)
0
200
400
600
800
1 000
202020192018201720162015201420132012201120102009
875
Figure 4: Figure 5:
HULAMIN SUSTAINABILITY REPORT for the year ended 31 December 202030
ENTERPRISE AND SUPPLIER DEVELOPMENT
We value our role in developing the local community In 2020, Hulamin has continued to focus on driving the implementation of its Enterprise and supplier Development (ESD) policy, which it first developed in 2018.
A particular emphasis has been placed on executing needed skills development training with the beneficiaries, and thereby strengthening the current base of ESD beneficiaries to better withstand the very challenging business environment of 2020 and beyond. The objective is to identify and build a pipeline of strong local entrepreneurs who can participate in our supply chain spend and grow over time to become sustainable suppliers to Hulamin and other organisations in the region.
In 2020, Covid-19 forced the Hulamin ESD development programme to adapt its approach to skills development to be completely online. The challenges this initially posed for SMMEs were successfully overcome, resulting in 12 online workshops being held from July to December 2020. By the end of 2020, the three key modules that were identified as critical for beneficiaries to navigate the challenges of Covid-19 lockdowns (Effective Leadership, Entrepreneurship and Marketing) were made available to all the ESD beneficiaries.
Given the disproportionately high burden faced by many SMMEs as a direct result of Covid-19 lockdown regulations, combined with depressed business conditions, Hulamin rolled out a “Covid-19 relief package” to all of its ESD beneficiaries, through our ESD programme partner. This package contained a diverse information on how to apply for government funding support options along with other health and business advice.
Hulamin’s ESD objectives We are committed to developing local, black-owned businesses that can participate in the company’s procurement spend, and develop and grow into sustainable, value adding suppliers.
The specific objectives of Hulamin’s ESD programme are as follows:
• We contribute to the development of small, local businesses EMEs (Exempt Micro Enterprise) and QSEs (Qualifying Small Enterprise) that have a majority black shareholding and that can become sustainable suppliers of goods and services to Hulamin, and to other businesses in the region.
• We grow the economic participation of majority black-owned enterprises in Hulamin’s procurement spend, so as to more accurately reflect the demographic realities of the country.
• We promote job creation in the KwaZulu-Natal region.
ESD approachHulamin’s ESD approach focuses on the development of small, local, majority black-owned enterprises that are relevant to our supply chain requirements. We grow these entities into sustainable suppliers that can contribute to the economy in South Africa.
Qualifying beneficiaries for ESD must therefore be EMEs or QSEs that are at least 51% black-owned and/or 30% black women-owned.
Certain strategic interventions that we have implemented include:
• Favourable payment terms for emerging SD (Supplier Development) beneficiaries;
• Monetary and non-monetary support for majority black-owned enterprises, with the objective of improving their ability to compete at a larger scale within the procurement value chain;
• Management time devoted to conceptualising, guiding and rolling out various elements of ESD;
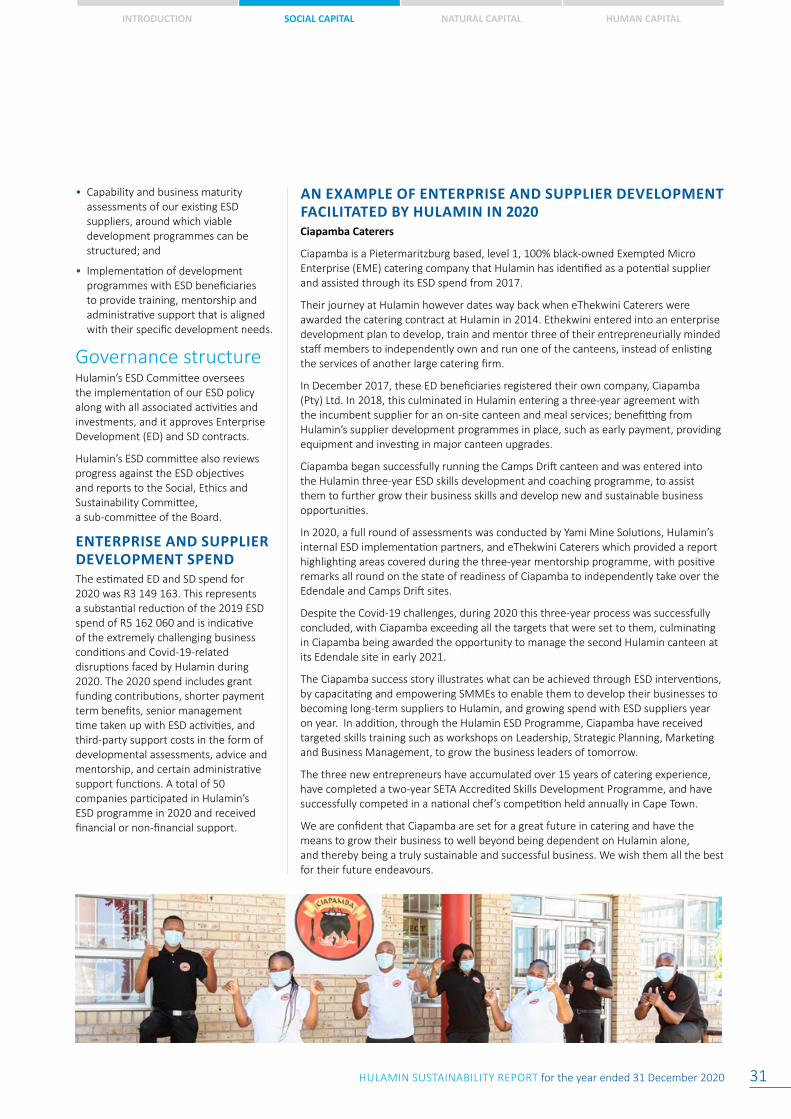
INTRODUCTION SOCIAL CAPITAL NATURAL CAPITAL HUMAN CAPITAL
HULAMIN SUSTAINABILITY REPORT for the year ended 31 December 2020 31
• Capability and business maturity assessments of our existing ESD suppliers, around which viable development programmes can be structured; and
• Implementation of development programmes with ESD beneficiaries to provide training, mentorship and administrative support that is aligned with their specific development needs.
Governance structureHulamin’s ESD Committee oversees the implementation of our ESD policy along with all associated activities and investments, and it approves Enterprise Development (ED) and SD contracts.
Hulamin’s ESD committee also reviews progress against the ESD objectives and reports to the Social, Ethics and Sustainability Committee, a sub-committee of the Board.
ENTERPRISE AND SUPPLIER DEVELOPMENT SPENDThe estimated ED and SD spend for 2020 was R3 149 163. This represents a substantial reduction of the 2019 ESD spend of R5 162 060 and is indicative of the extremely challenging business conditions and Covid-19-related disruptions faced by Hulamin during 2020. The 2020 spend includes grant funding contributions, shorter payment term benefits, senior management time taken up with ESD activities, and third-party support costs in the form of developmental assessments, advice and mentorship, and certain administrative support functions. A total of 50 companies participated in Hulamin’s ESD programme in 2020 and received financial or non-financial support.
AN EXAMPLE OF ENTERPRISE AND SUPPLIER DEVELOPMENT FACILITATED BY HULAMIN IN 2020 Ciapamba Caterers
Ciapamba is a Pietermaritzburg based, level 1, 100% black-owned Exempted Micro Enterprise (EME) catering company that Hulamin has identified as a potential supplier and assisted through its ESD spend from 2017.
Their journey at Hulamin however dates way back when eThekwini Caterers were awarded the catering contract at Hulamin in 2014. Ethekwini entered into an enterprise development plan to develop, train and mentor three of their entrepreneurially minded staff members to independently own and run one of the canteens, instead of enlisting the services of another large catering firm.
In December 2017, these ED beneficiaries registered their own company, Ciapamba (Pty) Ltd. In 2018, this culminated in Hulamin entering a three-year agreement with the incumbent supplier for an on-site canteen and meal services; benefitting from Hulamin’s supplier development programmes in place, such as early payment, providing equipment and investing in major canteen upgrades.
Ciapamba began successfully running the Camps Drift canteen and was entered into the Hulamin three-year ESD skills development and coaching programme, to assist them to further grow their business skills and develop new and sustainable business opportunities.
In 2020, a full round of assessments was conducted by Yami Mine Solutions, Hulamin’s internal ESD implementation partners, and eThekwini Caterers which provided a report highlighting areas covered during the three-year mentorship programme, with positive remarks all round on the state of readiness of Ciapamba to independently take over the Edendale and Camps Drift sites.
Despite the Covid-19 challenges, during 2020 this three-year process was successfully concluded, with Ciapamba exceeding all the targets that were set to them, culminating in Ciapamba being awarded the opportunity to manage the second Hulamin canteen at its Edendale site in early 2021.
The Ciapamba success story illustrates what can be achieved through ESD interventions, by capacitating and empowering SMMEs to enable them to develop their businesses to becoming long-term suppliers to Hulamin, and growing spend with ESD suppliers year on year. In addition, through the Hulamin ESD Programme, Ciapamba have received targeted skills training such as workshops on Leadership, Strategic Planning, Marketing and Business Management, to grow the business leaders of tomorrow.
The three new entrepreneurs have accumulated over 15 years of catering experience, have completed a two-year SETA Accredited Skills Development Programme, and have successfully competed in a national chef’s competition held annually in Cape Town.
We are confident that Ciapamba are set for a great future in catering and have the means to grow their business to well beyond being dependent on Hulamin alone, and thereby being a truly sustainable and successful business. We wish them all the best for their future endeavours.
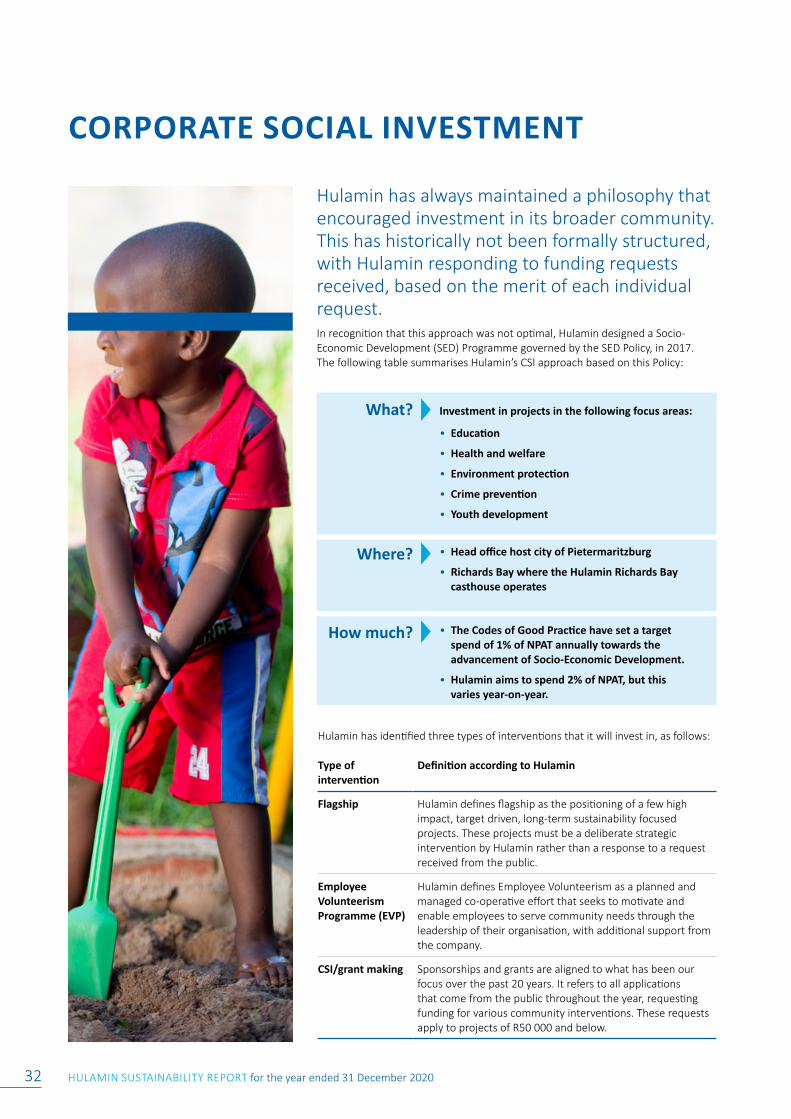
HULAMIN SUSTAINABILITY REPORT for the year ended 31 December 202032
What? Investment in projects in the following focus areas:
• Education
• Health and welfare
• Environment protection
• Crime prevention
• Youth development
Where? • Head office host city of Pietermaritzburg
• Richards Bay where the Hulamin Richards Bay casthouse operates
How much? • The Codes of Good Practice have set a target spend of 1% of NPAT annually towards the advancement of Socio-Economic Development.
• Hulamin aims to spend 2% of NPAT, but this varies year-on-year.
CORPORATE SOCIAL INVESTMENT
Hulamin has always maintained a philosophy that encouraged investment in its broader community. This has historically not been formally structured, with Hulamin responding to funding requests received, based on the merit of each individual request.In recognition that this approach was not optimal, Hulamin designed a Socio-Economic Development (SED) Programme governed by the SED Policy, in 2017. The following table summarises Hulamin’s CSI approach based on this Policy:
Hulamin has identified three types of interventions that it will invest in, as follows:
Type of intervention
Definition according to Hulamin
Flagship Hulamin defines flagship as the positioning of a few high impact, target driven, long-term sustainability focused projects. These projects must be a deliberate strategic intervention by Hulamin rather than a response to a request received from the public.
Employee Volunteerism Programme (EVP)
Hulamin defines Employee Volunteerism as a planned and managed co-operative effort that seeks to motivate and enable employees to serve community needs through the leadership of their organisation, with additional support from the company.
CSI/grant making Sponsorships and grants are aligned to what has been our focus over the past 20 years. It refers to all applications that come from the public throughout the year, requesting funding for various community interventions. These requests apply to projects of R50 000 and below.
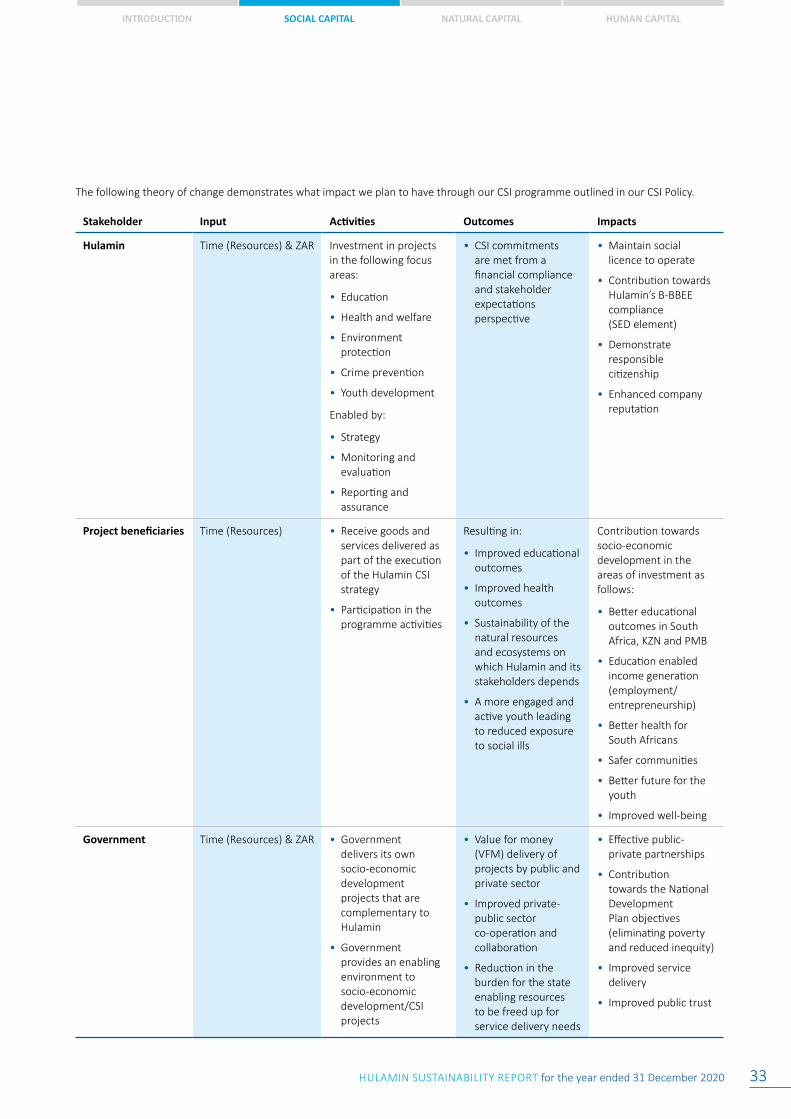
INTRODUCTION SOCIAL CAPITAL NATURAL CAPITAL HUMAN CAPITAL
HULAMIN SUSTAINABILITY REPORT for the year ended 31 December 2020 33
The following theory of change demonstrates what impact we plan to have through our CSI programme outlined in our CSI Policy.
Stakeholder Input Activities Outcomes Impacts
Hulamin Time (Resources) & ZAR Investment in projects in the following focus areas:
• Education
• Health and welfare
• Environment protection
• Crime prevention
• Youth development
Enabled by:
• Strategy
• Monitoring and evaluation
• Reporting and assurance
• CSI commitments are met from a financial compliance and stakeholder expectations perspective
• Maintain social licence to operate
• Contribution towards Hulamin’s B-BBEE compliance (SED element)
• Demonstrate responsible citizenship
• Enhanced company reputation
Project beneficiaries Time (Resources) • Receive goods and services delivered as part of the execution of the Hulamin CSI strategy
• Participation in the programme activities
Resulting in:
• Improved educational outcomes
• Improved health outcomes
• Sustainability of the natural resources and ecosystems on which Hulamin and its stakeholders depends
• A more engaged and active youth leading to reduced exposure to social ills
Contribution towards socio-economic development in the areas of investment as follows:
• Better educational outcomes in South Africa, KZN and PMB
• Education enabled income generation (employment/entrepreneurship)
• Better health for South Africans
• Safer communities
• Better future for the youth
• Improved well-being
Government Time (Resources) & ZAR • Government delivers its own socio-economic development projects that are complementary to Hulamin
• Government provides an enabling environment to socio-economic development/CSI projects
• Value for money (VFM) delivery of projects by public and private sector
• Improved private-public sector co-operation and collaboration
• Reduction in the burden for the state enabling resources to be freed up for service delivery needs
• Effective public-private partnerships
• Contribution towards the National Development Plan objectives (eliminating poverty and reduced inequity)
• Improved service delivery
• Improved public trust
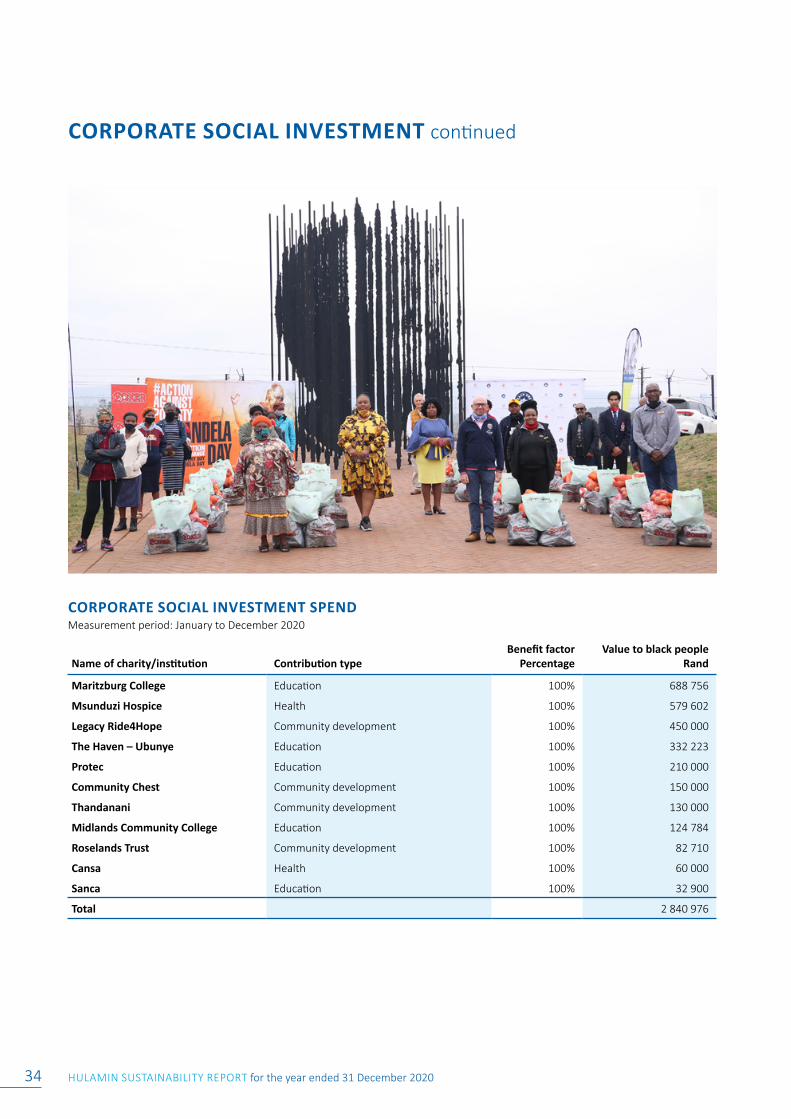
HULAMIN SUSTAINABILITY REPORT for the year ended 31 December 202034
CORPORATE SOCIAL INVESTMENT continued
CORPORATE SOCIAL INVESTMENT SPEND Measurement period: January to December 2020
Name of charity/institution Contribution typeBenefit factor
PercentageValue to black people
Rand
Maritzburg College Education 100% 688 756
Msunduzi Hospice Health 100% 579 602
Legacy Ride4Hope Community development 100% 450 000
The Haven – Ubunye Education 100% 332 223
Protec Education 100% 210 000
Community Chest Community development 100% 150 000
Thandanani Community development 100% 130 000
Midlands Community College Education 100% 124 784
Roselands Trust Community development 100% 82 710
Cansa Health 100% 60 000
Sanca Education 100% 32 900
Total 2 840 976
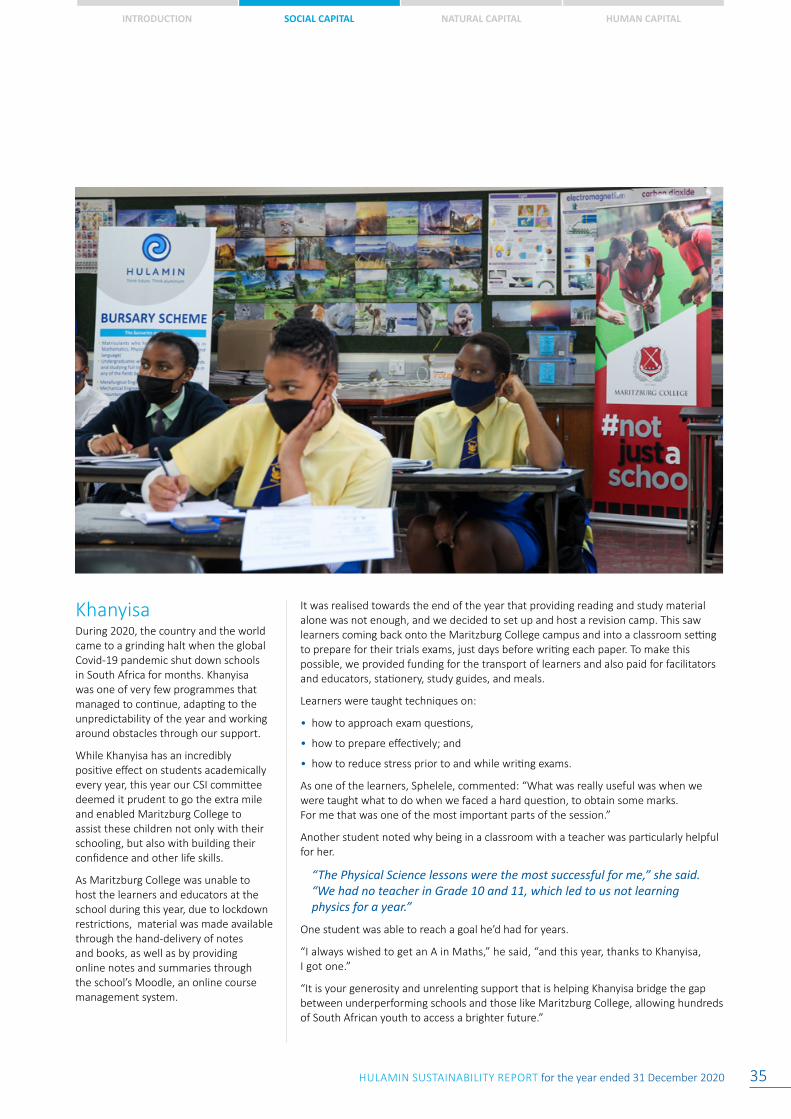
INTRODUCTION SOCIAL CAPITAL NATURAL CAPITAL HUMAN CAPITAL
HULAMIN SUSTAINABILITY REPORT for the year ended 31 December 2020 35
KhanyisaDuring 2020, the country and the world came to a grinding halt when the global Covid-19 pandemic shut down schools in South Africa for months. Khanyisa was one of very few programmes that managed to continue, adapting to the unpredictability of the year and working around obstacles through our support.
While Khanyisa has an incredibly positive effect on students academically every year, this year our CSI committee deemed it prudent to go the extra mile and enabled Maritzburg College to assist these children not only with their schooling, but also with building their confidence and other life skills.
As Maritzburg College was unable to host the learners and educators at the school during this year, due to lockdown restrictions, material was made available through the hand-delivery of notes and books, as well as by providing online notes and summaries through the school’s Moodle, an online course management system.
It was realised towards the end of the year that providing reading and study material alone was not enough, and we decided to set up and host a revision camp. This saw learners coming back onto the Maritzburg College campus and into a classroom setting to prepare for their trials exams, just days before writing each paper. To make this possible, we provided funding for the transport of learners and also paid for facilitators and educators, stationery, study guides, and meals.
Learners were taught techniques on:
• how to approach exam questions,
• how to prepare effectively; and
• how to reduce stress prior to and while writing exams.
As one of the learners, Sphelele, commented: “What was really useful was when we were taught what to do when we faced a hard question, to obtain some marks. For me that was one of the most important parts of the session.”
Another student noted why being in a classroom with a teacher was particularly helpful for her.
“The Physical Science lessons were the most successful for me,” she said. “We had no teacher in Grade 10 and 11, which led to us not learning physics for a year.”
One student was able to reach a goal he’d had for years.
“I always wished to get an A in Maths,” he said, “and this year, thanks to Khanyisa, I got one.”
“It is your generosity and unrelenting support that is helping Khanyisa bridge the gap between underperforming schools and those like Maritzburg College, allowing hundreds of South African youth to access a brighter future.”
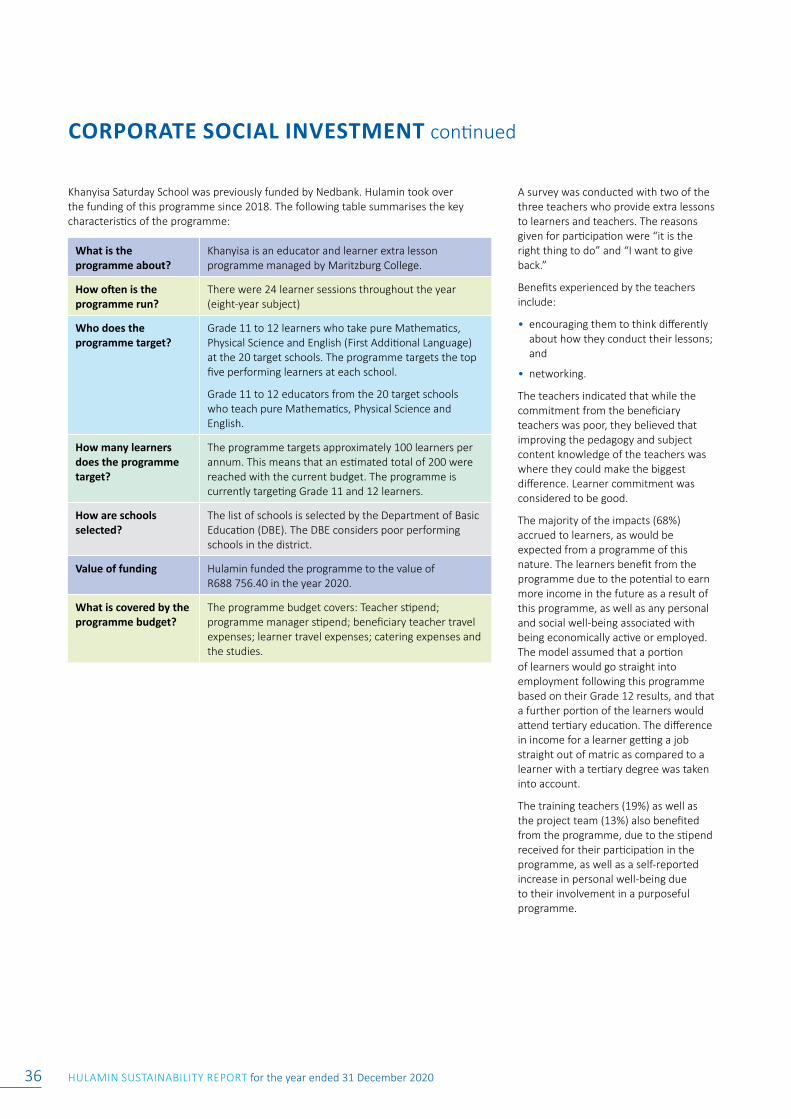
HULAMIN SUSTAINABILITY REPORT for the year ended 31 December 202036
CORPORATE SOCIAL INVESTMENT continued
A survey was conducted with two of the three teachers who provide extra lessons to learners and teachers. The reasons given for participation were “it is the right thing to do” and “I want to give back.”
Benefits experienced by the teachers include:
• encouraging them to think differently about how they conduct their lessons; and
• networking.
The teachers indicated that while the commitment from the beneficiary teachers was poor, they believed that improving the pedagogy and subject content knowledge of the teachers was where they could make the biggest difference. Learner commitment was considered to be good.
The majority of the impacts (68%) accrued to learners, as would be expected from a programme of this nature. The learners benefit from the programme due to the potential to earn more income in the future as a result of this programme, as well as any personal and social well-being associated with being economically active or employed. The model assumed that a portion of learners would go straight into employment following this programme based on their Grade 12 results, and that a further portion of the learners would attend tertiary education. The difference in income for a learner getting a job straight out of matric as compared to a learner with a tertiary degree was taken into account.
The training teachers (19%) as well as the project team (13%) also benefited from the programme, due to the stipend received for their participation in the programme, as well as a self-reported increase in personal well-being due to their involvement in a purposeful programme.
Khanyisa Saturday School was previously funded by Nedbank. Hulamin took over the funding of this programme since 2018. The following table summarises the key characteristics of the programme:
What is the programme about?
Khanyisa is an educator and learner extra lesson programme managed by Maritzburg College.
How often is the programme run?
There were 24 learner sessions throughout the year (eight-year subject)
Who does the programme target?
Grade 11 to 12 learners who take pure Mathematics, Physical Science and English (First Additional Language) at the 20 target schools. The programme targets the top five performing learners at each school.
Grade 11 to 12 educators from the 20 target schools who teach pure Mathematics, Physical Science and English.
How many learners does the programme target?
The programme targets approximately 100 learners per annum. This means that an estimated total of 200 were reached with the current budget. The programme is currently targeting Grade 11 and 12 learners.
How are schools selected?
The list of schools is selected by the Department of Basic Education (DBE). The DBE considers poor performing schools in the district.
Value of funding Hulamin funded the programme to the value of R688 756.40 in the year 2020.
What is covered by the programme budget?
The programme budget covers: Teacher stipend; programme manager stipend; beneficiary teacher travel expenses; learner travel expenses; catering expenses and the studies.
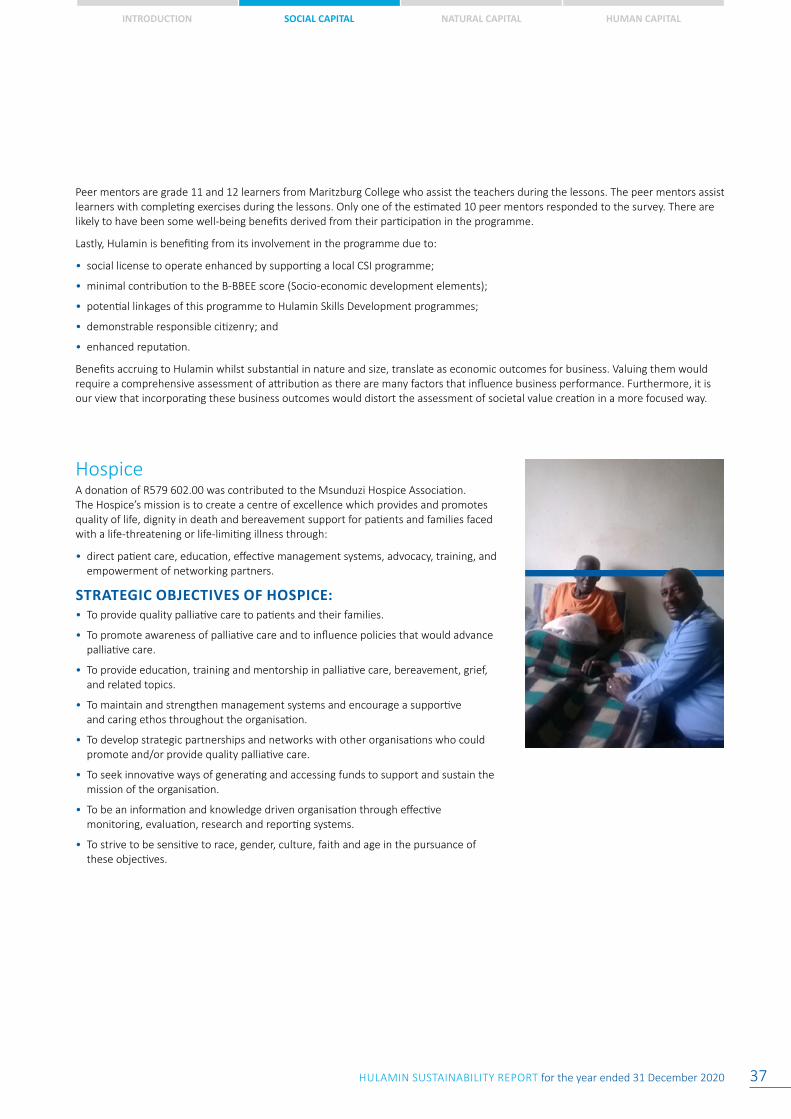
INTRODUCTION SOCIAL CAPITAL NATURAL CAPITAL HUMAN CAPITAL
HULAMIN SUSTAINABILITY REPORT for the year ended 31 December 2020 37
Peer mentors are grade 11 and 12 learners from Maritzburg College who assist the teachers during the lessons. The peer mentors assist learners with completing exercises during the lessons. Only one of the estimated 10 peer mentors responded to the survey. There are likely to have been some well-being benefits derived from their participation in the programme.
Lastly, Hulamin is benefiting from its involvement in the programme due to:
• social license to operate enhanced by supporting a local CSI programme;
• minimal contribution to the B-BBEE score (Socio-economic development elements);
• potential linkages of this programme to Hulamin Skills Development programmes;
• demonstrable responsible citizenry; and
• enhanced reputation.
Benefits accruing to Hulamin whilst substantial in nature and size, translate as economic outcomes for business. Valuing them would require a comprehensive assessment of attribution as there are many factors that influence business performance. Furthermore, it is our view that incorporating these business outcomes would distort the assessment of societal value creation in a more focused way.
HospiceA donation of R579 602.00 was contributed to the Msunduzi Hospice Association.The Hospice’s mission is to create a centre of excellence which provides and promotes quality of life, dignity in death and bereavement support for patients and families faced with a life-threatening or life-limiting illness through:
• direct patient care, education, effective management systems, advocacy, training, and empowerment of networking partners.
STRATEGIC OBJECTIVES OF HOSPICE:• To provide quality palliative care to patients and their families.
• To promote awareness of palliative care and to influence policies that would advance palliative care.
• To provide education, training and mentorship in palliative care, bereavement, grief, and related topics.
• To maintain and strengthen management systems and encourage a supportive and caring ethos throughout the organisation.
• To develop strategic partnerships and networks with other organisations who could promote and/or provide quality palliative care.
• To seek innovative ways of generating and accessing funds to support and sustain the mission of the organisation.
• To be an information and knowledge driven organisation through effective monitoring, evaluation, research and reporting systems.
• To strive to be sensitive to race, gender, culture, faith and age in the pursuance of these objectives.
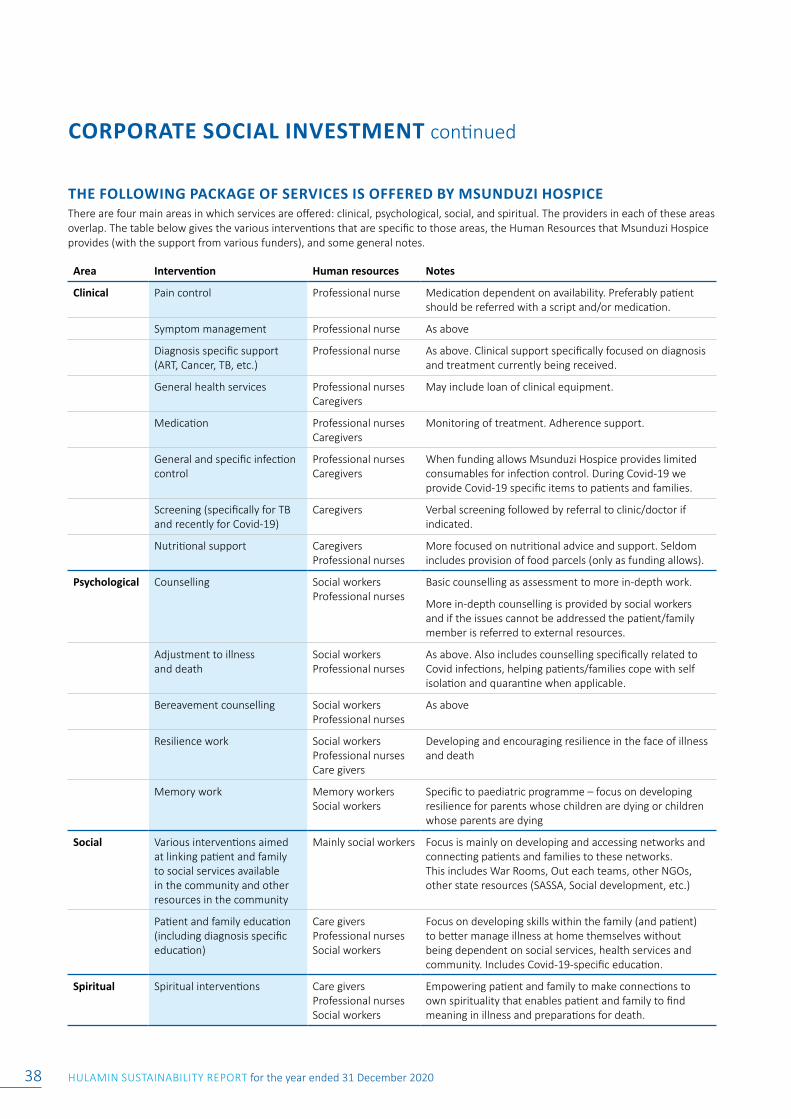
HULAMIN SUSTAINABILITY REPORT for the year ended 31 December 202038
CORPORATE SOCIAL INVESTMENT continued
THE FOLLOWING PACKAGE OF SERVICES IS OFFERED BY MSUNDUZI HOSPICEThere are four main areas in which services are offered: clinical, psychological, social, and spiritual. The providers in each of these areas overlap. The table below gives the various interventions that are specific to those areas, the Human Resources that Msunduzi Hospice provides (with the support from various funders), and some general notes.
Area Intervention Human resources Notes
Clinical Pain control Professional nurse Medication dependent on availability. Preferably patient should be referred with a script and/or medication.
Symptom management Professional nurse As above
Diagnosis specific support (ART, Cancer, TB, etc.)
Professional nurse As above. Clinical support specifically focused on diagnosis and treatment currently being received.
General health services Professional nurses Caregivers
May include loan of clinical equipment.
Medication Professional nurses Caregivers
Monitoring of treatment. Adherence support.
General and specific infection control
Professional nurses Caregivers
When funding allows Msunduzi Hospice provides limited consumables for infection control. During Covid-19 we provide Covid-19 specific items to patients and families.
Screening (specifically for TB and recently for Covid-19)
Caregivers Verbal screening followed by referral to clinic/doctor if indicated.
Nutritional support CaregiversProfessional nurses
More focused on nutritional advice and support. Seldom includes provision of food parcels (only as funding allows).
Psychological Counselling Social workersProfessional nurses
Basic counselling as assessment to more in-depth work.
More in-depth counselling is provided by social workers and if the issues cannot be addressed the patient/family member is referred to external resources.
Adjustment to illness and death
Social workersProfessional nurses
As above. Also includes counselling specifically related to Covid infections, helping patients/families cope with self isolation and quarantine when applicable.
Bereavement counselling Social workersProfessional nurses
As above
Resilience work Social workers Professional nurses Care givers
Developing and encouraging resilience in the face of illness and death
Memory work Memory workers Social workers
Specific to paediatric programme – focus on developing resilience for parents whose children are dying or children whose parents are dying
Social Various interventions aimed at linking patient and family to social services available in the community and other resources in the community
Mainly social workers Focus is mainly on developing and accessing networks and connecting patients and families to these networks. This includes War Rooms, Out each teams, other NGOs, other state resources (SASSA, Social development, etc.)
Patient and family education (including diagnosis specific education)
Care givers Professional nursesSocial workers
Focus on developing skills within the family (and patient) to better manage illness at home themselves without being dependent on social services, health services and community. Includes Covid-19-specific education.
Spiritual Spiritual interventions Care givers Professional nursesSocial workers
Empowering patient and family to make connections to own spirituality that enables patient and family to find meaning in illness and preparations for death.
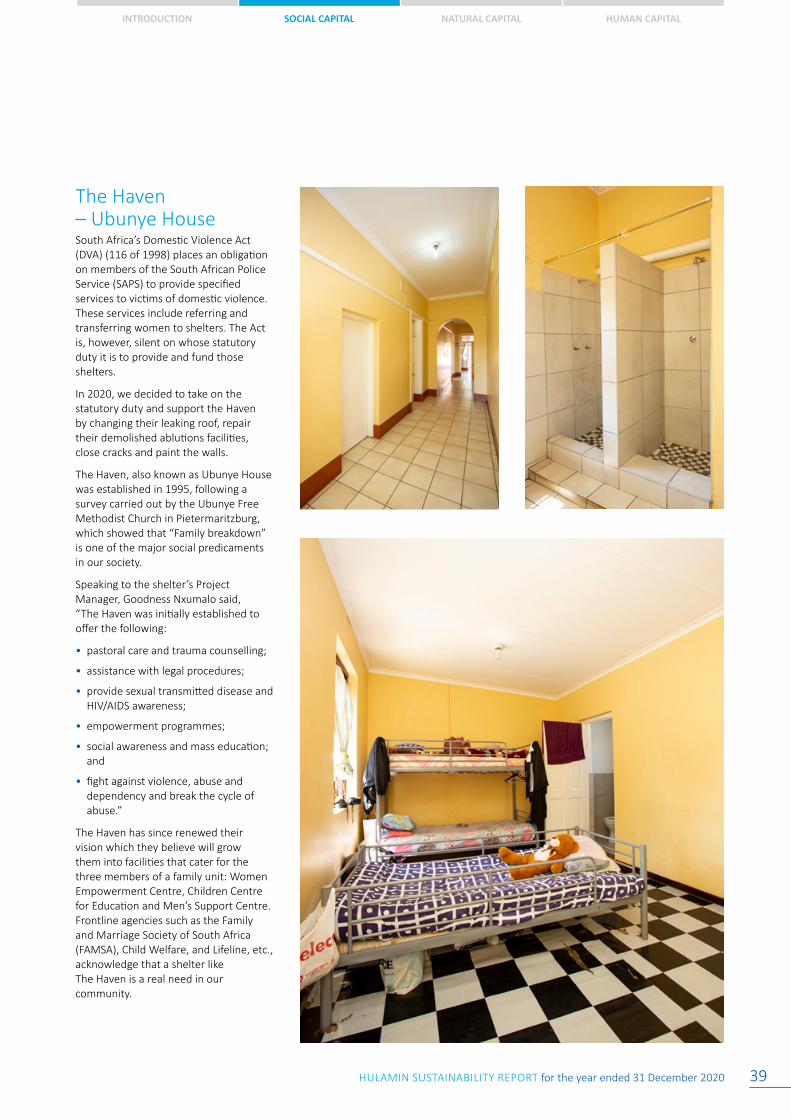
INTRODUCTION SOCIAL CAPITAL NATURAL CAPITAL HUMAN CAPITAL
HULAMIN SUSTAINABILITY REPORT for the year ended 31 December 2020 39
The Haven – Ubunye HouseSouth Africa’s Domestic Violence Act (DVA) (116 of 1998) places an obligation on members of the South African Police Service (SAPS) to provide specified services to victims of domestic violence. These services include referring and transferring women to shelters. The Act is, however, silent on whose statutory duty it is to provide and fund those shelters.
In 2020, we decided to take on the statutory duty and support the Haven by changing their leaking roof, repair their demolished ablutions facilities, close cracks and paint the walls.
The Haven, also known as Ubunye House was established in 1995, following a survey carried out by the Ubunye Free Methodist Church in Pietermaritzburg, which showed that “Family breakdown” is one of the major social predicaments in our society.
Speaking to the shelter’s Project Manager, Goodness Nxumalo said, “The Haven was initially established to offer the following:
• pastoral care and trauma counselling;
• assistance with legal procedures;
• provide sexual transmitted disease and HIV/AIDS awareness;
• empowerment programmes;
• social awareness and mass education; and
• fight against violence, abuse and dependency and break the cycle of abuse.”
The Haven has since renewed their vision which they believe will grow them into facilities that cater for the three members of a family unit: Women Empowerment Centre, Children Centre for Education and Men’s Support Centre. Frontline agencies such as the Family and Marriage Society of South Africa (FAMSA), Child Welfare, and Lifeline, etc., acknowledge that a shelter like The Haven is a real need in our community.
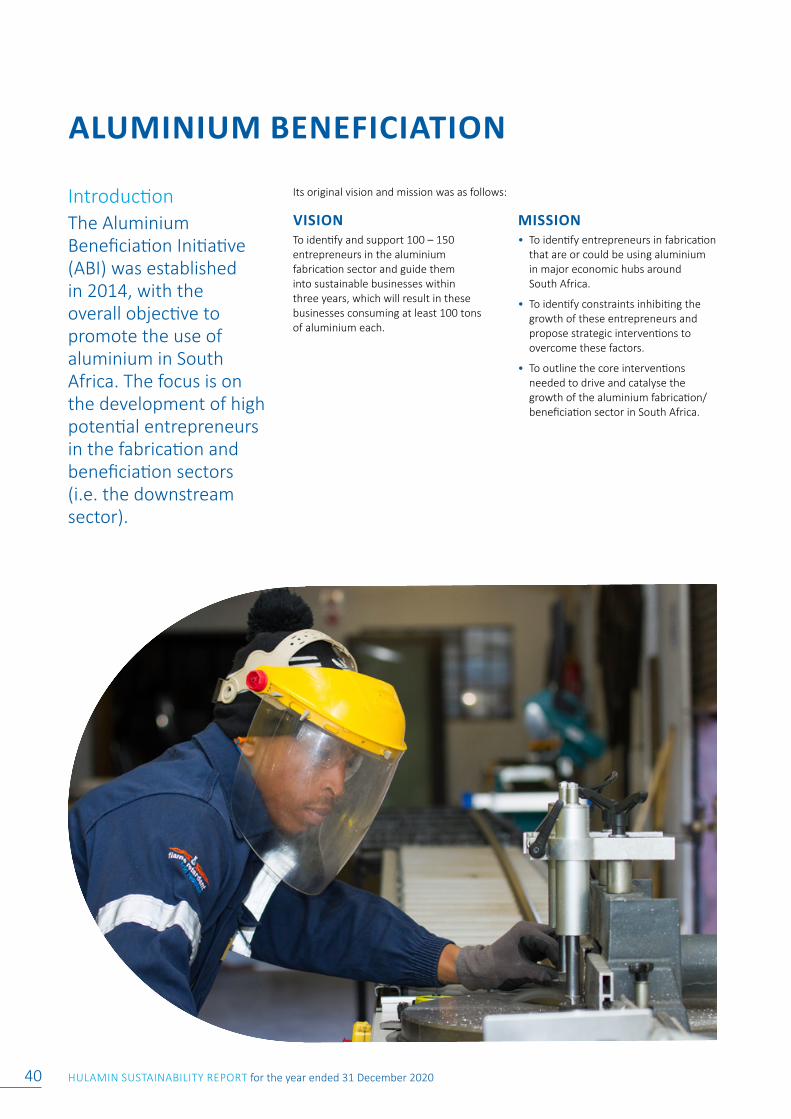
HULAMIN SUSTAINABILITY REPORT for the year ended 31 December 202040
ALUMINIUM BENEFICIATION
IntroductionThe Aluminium Beneficiation Initiative (ABI) was established in 2014, with the overall objective to promote the use of aluminium in South Africa. The focus is on the development of high potential entrepreneurs in the fabrication and beneficiation sectors (i.e. the downstream sector).
Its original vision and mission was as follows:
VISIONTo identify and support 100 – 150 entrepreneurs in the aluminium fabrication sector and guide them into sustainable businesses within three years, which will result in these businesses consuming at least 100 tons of aluminium each.
MISSION• To identify entrepreneurs in fabrication
that are or could be using aluminium in major economic hubs around South Africa.
• To identify constraints inhibiting the growth of these entrepreneurs and propose strategic interventions to overcome these factors.
• To outline the core interventions needed to drive and catalyse the growth of the aluminium fabrication/beneficiation sector in South Africa.
INTRODUCTION SOCIAL CAPITAL NATURAL CAPITAL HUMAN CAPITAL
HULAMIN SUSTAINABILITY REPORT for the year ended 31 December 2020 41
ABI regards itself as a third-generation business support initiative, which aims to contribute to economic development by providing a portfolio of services, including:
Supporting the creation of high-growth companies.
Providing expert business assistance to selected companies.
Facilitating direct financial investments into selected companies.
Accelerating the modernisation of companies at a mature level of growth.
ABI context to dateABI was launched to drive the vision and mission above. Besides the ABI website, the historical context of ABI was provided to the KPMG team by Hulamin management. Essentially, the ambition of ABI is well understood across a variety of stakeholders and there is consensus that such an initiative is needed. This is even captured in the aluminium industry roadmap citing the focus on downstream as a priority in the medium- to long-term. The lack of structure and formalisation in how it was delivered in the past appeared to have been the primary reason that it was not able to realise its ambition for industrialisation and beneficiation of the downstream industry (i.e. 100 entrepreneurs consuming 100 tons per annum in three years).
ABI was dormant for 18 months before March 2017, when the Board of ABI made a decision to re-launch the programme. The ABI Operating Guideline (July 2017) clearly sets the objectives, governance structure, business model, implementation actions and organisational structure of the programme. In August 2017, Engeli, a specialist enterprise development advisory firm conducted a needs analysis to establish the entrepreneurs deserving of support. During this process, it was clear that the initial 43 companies that had been pre-selected by the ABI Board for Phase I had high attrition and as such, the needs assessment was conducted over all 93 companies in the original database. In this same process, it became apparent that very few companies had high potential or had capacity to use 100 tons or more aluminium per annum. The Engeli study revealed that 12 companies could process the 100 tons per annum target, reducing the ambition in the second iteration of the programme to 15 companies instead.
The section that follows provides a basic overview of how the intended multi-dimensional components within ABI work together to deliver specific activities that generate outcomes and impacts across a variety of stakeholders. Through applying this lens towards generating impact, we are able to determine whether or not, it is in fact achievable and the key dependencies it relies on.
Theory of changeThe theory of change below demonstrates what impact ABI is likely to have in the near future, when ABI is re-launched, following the appointment of the new ABI Chief Executive Officer in 2018.
As can be seen, key stakeholders, their anticipated roles in the re-launched ABI programme and benefits likely to accrue, are outlined. Hulamin and South32 have committed to fund the initiative for the next three years. Whilst Hulamin’s primary driver in delivering this initiative is to promote domestic aluminium consumption through advancing downstream industry players as a means to advance Transformation and socio-economic development objectives, Hulamin will be able to recognise its contribution on ABI as enterprise and supplier development from a B-BBEE perspective for the time and funding that they contribute.
Also, in the long run, a sizeable downstream industry will inevitably result in demand from the upstream and midstream aluminium value chain, thus an indirect benefit to Hulamin and South32 in the very long term. AFSA has also committed to taking over the operations of ABI in three years, following proof of concept by Hulamin and South32’s programme in the next coming years. Multiple government agencies have committed to provide funding as detailed below.
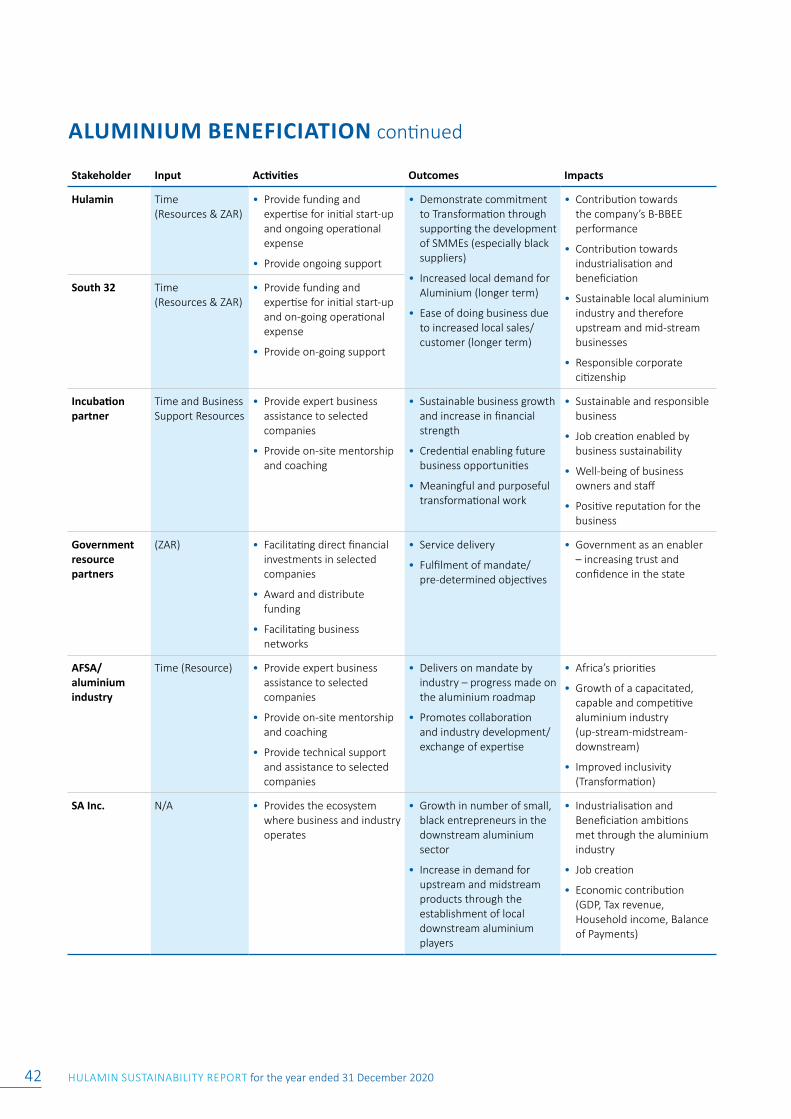
HULAMIN SUSTAINABILITY REPORT for the year ended 31 December 202042
ALUMINIUM BENEFICIATION continued
Stakeholder Input Activities Outcomes Impacts
Hulamin Time (Resources & ZAR)
• Provide funding and expertise for initial start-up and ongoing operational expense
• Provide ongoing support
• Demonstrate commitment to Transformation through supporting the development of SMMEs (especially black suppliers)
• Increased local demand for Aluminium (longer term)
• Ease of doing business due to increased local sales/customer (longer term)
• Contribution towards the company’s B-BBEE performance
• Contribution towards industrialisation and beneficiation
• Sustainable local aluminium industry and therefore upstream and mid-stream businesses
• Responsible corporate citizenship
South 32 Time (Resources & ZAR)
• Provide funding and expertise for initial start-up and on-going operational expense
• Provide on-going support
Incubation partner
Time and Business Support Resources
• Provide expert business assistance to selected companies
• Provide on-site mentorship and coaching
• Sustainable business growth and increase in financial strength
• Credential enabling future business opportunities
• Meaningful and purposeful transformational work
• Sustainable and responsible business
• Job creation enabled by business sustainability
• Well-being of business owners and staff
• Positive reputation for the business
Government resource partners
(ZAR) • Facilitating direct financial investments in selected companies
• Award and distribute funding
• Facilitating business networks
• Service delivery
• Fulfilment of mandate/ pre-determined objectives
• Government as an enabler – increasing trust and confidence in the state
AFSA/aluminium industry
Time (Resource) • Provide expert business assistance to selected companies
• Provide on-site mentorship and coaching
• Provide technical support and assistance to selected companies
• Delivers on mandate by industry – progress made on the aluminium roadmap
• Promotes collaboration and industry development/exchange of expertise
• Africa’s priorities
• Growth of a capacitated, capable and competitive aluminium industry (up-stream-midstream-downstream)
• Improved inclusivity (Transformation)
SA Inc. N/A • Provides the ecosystem where business and industry operates
• Growth in number of small, black entrepreneurs in the downstream aluminium sector
• Increase in demand for upstream and midstream products through the establishment of local downstream aluminium players
• Industrialisation and Beneficiation ambitions met through the aluminium industry
• Job creation
• Economic contribution (GDP, Tax revenue, Household income, Balance of Payments)
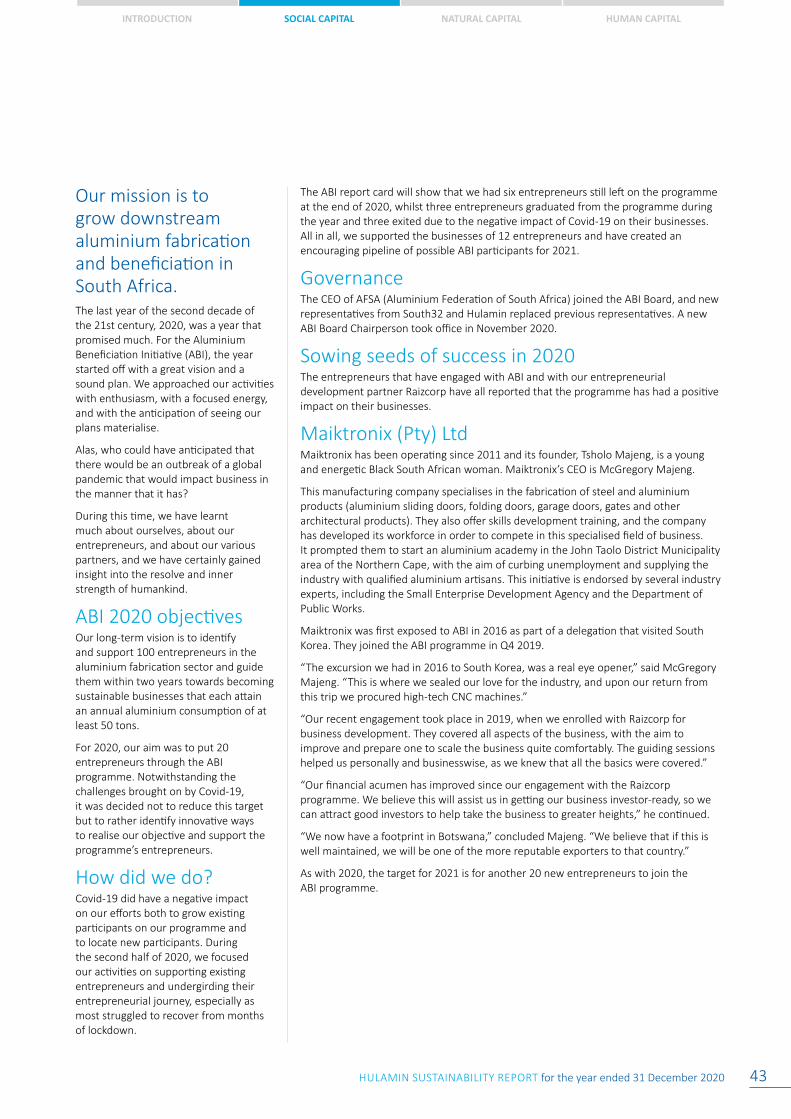
INTRODUCTION SOCIAL CAPITAL NATURAL CAPITAL HUMAN CAPITAL
HULAMIN SUSTAINABILITY REPORT for the year ended 31 December 2020 43
Our mission is to grow downstream aluminium fabrication and beneficiation in South Africa.The last year of the second decade of the 21st century, 2020, was a year that promised much. For the Aluminium Beneficiation Initiative (ABI), the year started off with a great vision and a sound plan. We approached our activities with enthusiasm, with a focused energy, and with the anticipation of seeing our plans materialise.
Alas, who could have anticipated that there would be an outbreak of a global pandemic that would impact business in the manner that it has?
During this time, we have learnt much about ourselves, about our entrepreneurs, and about our various partners, and we have certainly gained insight into the resolve and inner strength of humankind.
ABI 2020 objectivesOur long-term vision is to identify and support 100 entrepreneurs in the aluminium fabrication sector and guide them within two years towards becoming sustainable businesses that each attain an annual aluminium consumption of at least 50 tons.
For 2020, our aim was to put 20 entrepreneurs through the ABI programme. Notwithstanding the challenges brought on by Covid-19, it was decided not to reduce this target but to rather identify innovative ways to realise our objective and support the programme’s entrepreneurs.
How did we do?Covid-19 did have a negative impact on our efforts both to grow existing participants on our programme and to locate new participants. During the second half of 2020, we focused our activities on supporting existing entrepreneurs and undergirding their entrepreneurial journey, especially as most struggled to recover from months of lockdown.
The ABI report card will show that we had six entrepreneurs still left on the programme at the end of 2020, whilst three entrepreneurs graduated from the programme during the year and three exited due to the negative impact of Covid-19 on their businesses. All in all, we supported the businesses of 12 entrepreneurs and have created an encouraging pipeline of possible ABI participants for 2021.
Governance The CEO of AFSA (Aluminium Federation of South Africa) joined the ABI Board, and new representatives from South32 and Hulamin replaced previous representatives. A new ABI Board Chairperson took office in November 2020.
Sowing seeds of success in 2020The entrepreneurs that have engaged with ABI and with our entrepreneurial development partner Raizcorp have all reported that the programme has had a positive impact on their businesses.
Maiktronix (Pty) LtdMaiktronix has been operating since 2011 and its founder, Tsholo Majeng, is a young and energetic Black South African woman. Maiktronix’s CEO is McGregory Majeng.
This manufacturing company specialises in the fabrication of steel and aluminium products (aluminium sliding doors, folding doors, garage doors, gates and other architectural products). They also offer skills development training, and the company has developed its workforce in order to compete in this specialised field of business. It prompted them to start an aluminium academy in the John Taolo District Municipality area of the Northern Cape, with the aim of curbing unemployment and supplying the industry with qualified aluminium artisans. This initiative is endorsed by several industry experts, including the Small Enterprise Development Agency and the Department of Public Works.
Maiktronix was first exposed to ABI in 2016 as part of a delegation that visited South Korea. They joined the ABI programme in Q4 2019.
“The excursion we had in 2016 to South Korea, was a real eye opener,” said McGregory Majeng. “This is where we sealed our love for the industry, and upon our return from this trip we procured high-tech CNC machines.”
“Our recent engagement took place in 2019, when we enrolled with Raizcorp for business development. They covered all aspects of the business, with the aim to improve and prepare one to scale the business quite comfortably. The guiding sessions helped us personally and businesswise, as we knew that all the basics were covered.”
“Our financial acumen has improved since our engagement with the Raizcorp programme. We believe this will assist us in getting our business investor-ready, so we can attract good investors to help take the business to greater heights,” he continued.
“We now have a footprint in Botswana,” concluded Majeng. “We believe that if this is well maintained, we will be one of the more reputable exporters to that country.”
As with 2020, the target for 2021 is for another 20 new entrepreneurs to join the ABI programme.
HULAMIN SUSTAINABILITY REPORT for the year ended 31 December 202044
NATURAL CAPITALNatural capital 44
Scrap metal recycling 57
03
ENVIRONMENTAL SUSTAINABILITY
IntroductionAt Hulamin, we are committed to the responsible stewardship of natural resources. Our drive for continuous improvement in reducing emissions and the consumption of key natural resources is demonstrated by our recent public commitment to reduce Greenhouse Gases (GHG) emissions by 30% by 2030. Hulamin is proud to have become the first aluminium semi-fabricator to have its greenhouse gas emission reduction targets validated by the Science Based Targets initiative (SBTi) during 2020.Being a large, capital intensive manufacturing business, processes that emit greenhouse gases and reduce water reserves are inherent to our various operations. Our challenge, and indeed our commitment, is to minimise the impact of these operations on the environment and to ensure that we have the necessary management systems in place to continually improve in this respect.
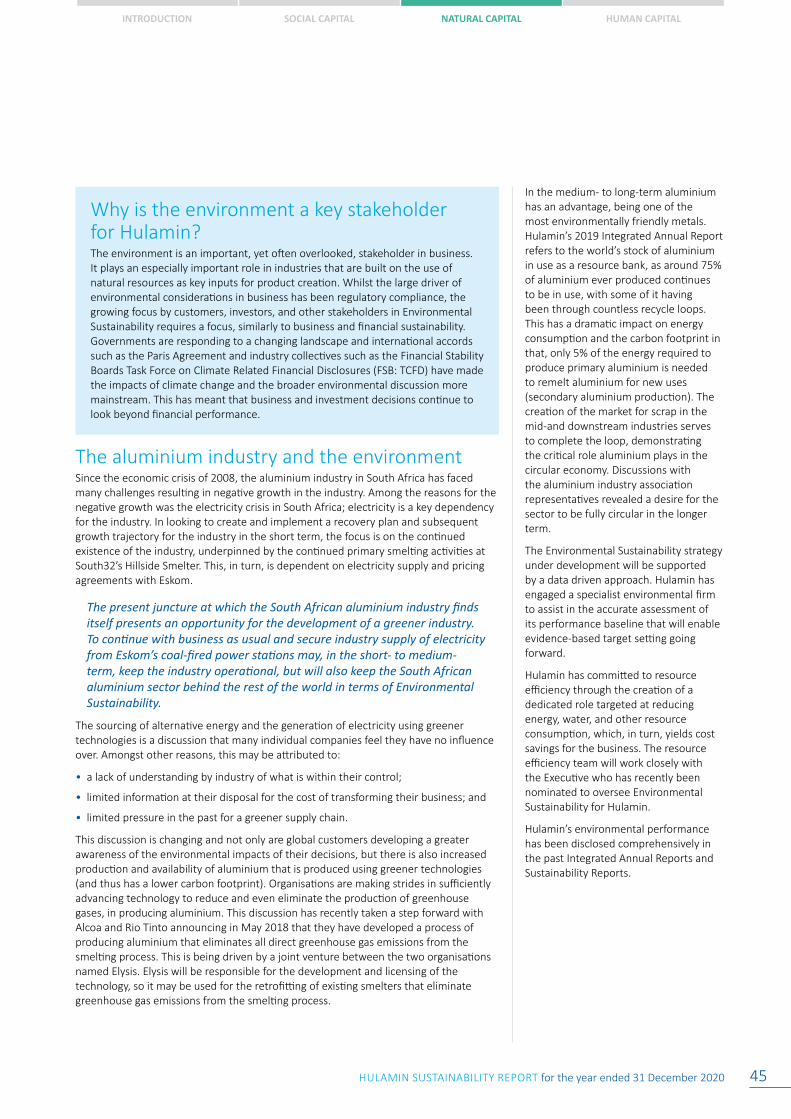
INTRODUCTION SOCIAL CAPITAL NATURAL CAPITAL HUMAN CAPITAL
HULAMIN SUSTAINABILITY REPORT for the year ended 31 December 2020 45
Why is the environment a key stakeholder for Hulamin?The environment is an important, yet often overlooked, stakeholder in business. It plays an especially important role in industries that are built on the use of natural resources as key inputs for product creation. Whilst the large driver of environmental considerations in business has been regulatory compliance, the growing focus by customers, investors, and other stakeholders in Environmental Sustainability requires a focus, similarly to business and financial sustainability. Governments are responding to a changing landscape and international accords such as the Paris Agreement and industry collectives such as the Financial Stability Boards Task Force on Climate Related Financial Disclosures (FSB: TCFD) have made the impacts of climate change and the broader environmental discussion more mainstream. This has meant that business and investment decisions continue to look beyond financial performance.
The aluminium industry and the environmentSince the economic crisis of 2008, the aluminium industry in South Africa has faced many challenges resulting in negative growth in the industry. Among the reasons for the negative growth was the electricity crisis in South Africa; electricity is a key dependency for the industry. In looking to create and implement a recovery plan and subsequent growth trajectory for the industry in the short term, the focus is on the continued existence of the industry, underpinned by the continued primary smelting activities at South32’s Hillside Smelter. This, in turn, is dependent on electricity supply and pricing agreements with Eskom.
The present juncture at which the South African aluminium industry finds itself presents an opportunity for the development of a greener industry. To continue with business as usual and secure industry supply of electricity from Eskom’s coal-fired power stations may, in the short- to medium-term, keep the industry operational, but will also keep the South African aluminium sector behind the rest of the world in terms of Environmental Sustainability.
The sourcing of alternative energy and the generation of electricity using greener technologies is a discussion that many individual companies feel they have no influence over. Amongst other reasons, this may be attributed to:
• a lack of understanding by industry of what is within their control;
• limited information at their disposal for the cost of transforming their business; and
• limited pressure in the past for a greener supply chain.
This discussion is changing and not only are global customers developing a greater awareness of the environmental impacts of their decisions, but there is also increased production and availability of aluminium that is produced using greener technologies (and thus has a lower carbon footprint). Organisations are making strides in sufficiently advancing technology to reduce and even eliminate the production of greenhouse gases, in producing aluminium. This discussion has recently taken a step forward with Alcoa and Rio Tinto announcing in May 2018 that they have developed a process of producing aluminium that eliminates all direct greenhouse gas emissions from the smelting process. This is being driven by a joint venture between the two organisations named Elysis. Elysis will be responsible for the development and licensing of the technology, so it may be used for the retrofitting of existing smelters that eliminate greenhouse gas emissions from the smelting process.
In the medium- to long-term aluminium has an advantage, being one of the most environmentally friendly metals. Hulamin’s 2019 Integrated Annual Report refers to the world’s stock of aluminium in use as a resource bank, as around 75% of aluminium ever produced continues to be in use, with some of it having been through countless recycle loops. This has a dramatic impact on energy consumption and the carbon footprint in that, only 5% of the energy required to produce primary aluminium is needed to remelt aluminium for new uses (secondary aluminium production). The creation of the market for scrap in the mid-and downstream industries serves to complete the loop, demonstrating the critical role aluminium plays in the circular economy. Discussions with the aluminium industry association representatives revealed a desire for the sector to be fully circular in the longer term.
The Environmental Sustainability strategy under development will be supported by a data driven approach. Hulamin has engaged a specialist environmental firm to assist in the accurate assessment of its performance baseline that will enable evidence-based target setting going forward.
Hulamin has committed to resource efficiency through the creation of a dedicated role targeted at reducing energy, water, and other resource consumption, which, in turn, yields cost savings for the business. The resource efficiency team will work closely with the Executive who has recently been nominated to oversee Environmental Sustainability for Hulamin.
Hulamin’s environmental performance has been disclosed comprehensively in the past Integrated Annual Reports and Sustainability Reports.
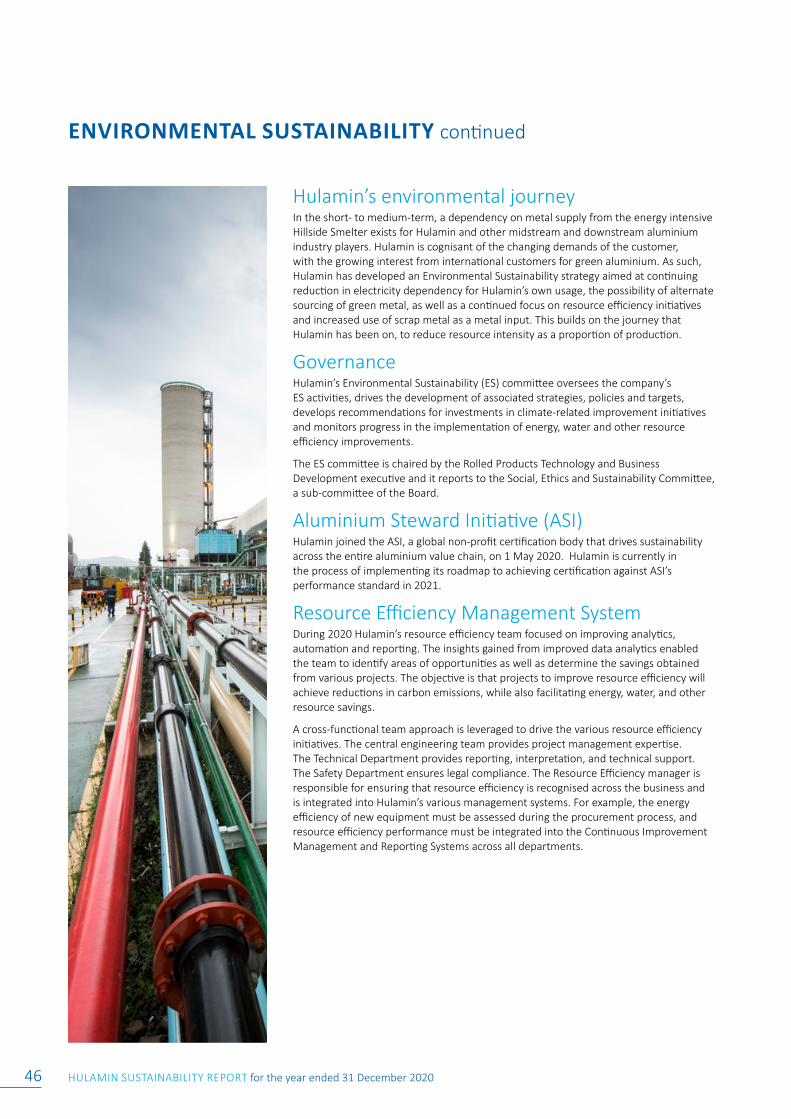
HULAMIN SUSTAINABILITY REPORT for the year ended 31 December 202046
ENVIRONMENTAL SUSTAINABILITY continued
Hulamin’s environmental journeyIn the short- to medium-term, a dependency on metal supply from the energy intensive Hillside Smelter exists for Hulamin and other midstream and downstream aluminium industry players. Hulamin is cognisant of the changing demands of the customer, with the growing interest from international customers for green aluminium. As such, Hulamin has developed an Environmental Sustainability strategy aimed at continuing reduction in electricity dependency for Hulamin’s own usage, the possibility of alternate sourcing of green metal, as well as a continued focus on resource efficiency initiatives and increased use of scrap metal as a metal input. This builds on the journey that Hulamin has been on, to reduce resource intensity as a proportion of production.
GovernanceHulamin’s Environmental Sustainability (ES) committee oversees the company’s ES activities, drives the development of associated strategies, policies and targets, develops recommendations for investments in climate-related improvement initiatives and monitors progress in the implementation of energy, water and other resource efficiency improvements.
The ES committee is chaired by the Rolled Products Technology and Business Development executive and it reports to the Social, Ethics and Sustainability Committee, a sub-committee of the Board.
Aluminium Steward Initiative (ASI)Hulamin joined the ASI, a global non-profit certification body that drives sustainability across the entire aluminium value chain, on 1 May 2020. Hulamin is currently in the process of implementing its roadmap to achieving certification against ASI’s performance standard in 2021.
Resource Efficiency Management SystemDuring 2020 Hulamin’s resource efficiency team focused on improving analytics, automation and reporting. The insights gained from improved data analytics enabled the team to identify areas of opportunities as well as determine the savings obtained from various projects. The objective is that projects to improve resource efficiency will achieve reductions in carbon emissions, while also facilitating energy, water, and other resource savings.
A cross-functional team approach is leveraged to drive the various resource efficiency initiatives. The central engineering team provides project management expertise. The Technical Department provides reporting, interpretation, and technical support. The Safety Department ensures legal compliance. The Resource Efficiency manager is responsible for ensuring that resource efficiency is recognised across the business and is integrated into Hulamin’s various management systems. For example, the energy efficiency of new equipment must be assessed during the procurement process, and resource efficiency performance must be integrated into the Continuous Improvement Management and Reporting Systems across all departments.
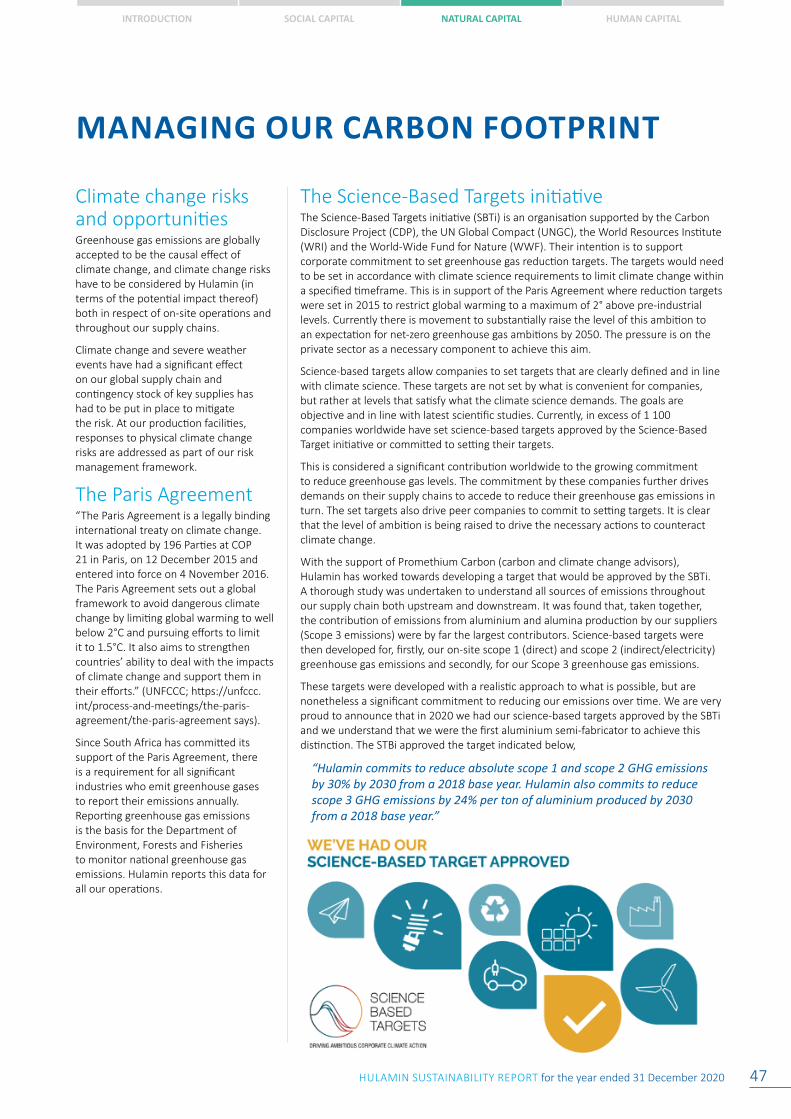
INTRODUCTION SOCIAL CAPITAL NATURAL CAPITAL HUMAN CAPITAL
HULAMIN SUSTAINABILITY REPORT for the year ended 31 December 2020 47
MANAGING OUR CARBON FOOTPRINT
Climate change risks and opportunitiesGreenhouse gas emissions are globally accepted to be the causal effect of climate change, and climate change risks have to be considered by Hulamin (in terms of the potential impact thereof) both in respect of on-site operations and throughout our supply chains.
Climate change and severe weather events have had a significant effect on our global supply chain and contingency stock of key supplies has had to be put in place to mitigate the risk. At our production facilities, responses to physical climate change risks are addressed as part of our risk management framework.
The Paris Agreement“The Paris Agreement is a legally binding international treaty on climate change. It was adopted by 196 Parties at COP 21 in Paris, on 12 December 2015 and entered into force on 4 November 2016. The Paris Agreement sets out a global framework to avoid dangerous climate change by limiting global warming to well below 2°C and pursuing efforts to limit it to 1.5°C. It also aims to strengthen countries’ ability to deal with the impacts of climate change and support them in their efforts.” (UNFCCC; https://unfccc.int/process-and-meetings/the-paris-agreement/the-paris-agreement says).
Since South Africa has committed its support of the Paris Agreement, there is a requirement for all significant industries who emit greenhouse gases to report their emissions annually. Reporting greenhouse gas emissions is the basis for the Department of Environment, Forests and Fisheries to monitor national greenhouse gas emissions. Hulamin reports this data for all our operations.
The Science-Based Targets initiativeThe Science-Based Targets initiative (SBTi) is an organisation supported by the Carbon Disclosure Project (CDP), the UN Global Compact (UNGC), the World Resources Institute (WRI) and the World-Wide Fund for Nature (WWF). Their intention is to support corporate commitment to set greenhouse gas reduction targets. The targets would need to be set in accordance with climate science requirements to limit climate change within a specified timeframe. This is in support of the Paris Agreement where reduction targets were set in 2015 to restrict global warming to a maximum of 2° above pre-industrial levels. Currently there is movement to substantially raise the level of this ambition to an expectation for net-zero greenhouse gas ambitions by 2050. The pressure is on the private sector as a necessary component to achieve this aim.
Science-based targets allow companies to set targets that are clearly defined and in line with climate science. These targets are not set by what is convenient for companies, but rather at levels that satisfy what the climate science demands. The goals are objective and in line with latest scientific studies. Currently, in excess of 1 100 companies worldwide have set science-based targets approved by the Science-Based Target initiative or committed to setting their targets.
This is considered a significant contribution worldwide to the growing commitment to reduce greenhouse gas levels. The commitment by these companies further drives demands on their supply chains to accede to reduce their greenhouse gas emissions in turn. The set targets also drive peer companies to commit to setting targets. It is clear that the level of ambition is being raised to drive the necessary actions to counteract climate change.
With the support of Promethium Carbon (carbon and climate change advisors), Hulamin has worked towards developing a target that would be approved by the SBTi. A thorough study was undertaken to understand all sources of emissions throughout our supply chain both upstream and downstream. It was found that, taken together, the contribution of emissions from aluminium and alumina production by our suppliers (Scope 3 emissions) were by far the largest contributors. Science-based targets were then developed for, firstly, our on-site scope 1 (direct) and scope 2 (indirect/electricity) greenhouse gas emissions and secondly, for our Scope 3 greenhouse gas emissions.
These targets were developed with a realistic approach to what is possible, but are nonetheless a significant commitment to reducing our emissions over time. We are very proud to announce that in 2020 we had our science-based targets approved by the SBTi and we understand that we were the first aluminium semi-fabricator to achieve this distinction. The STBi approved the target indicated below,
“Hulamin commits to reduce absolute scope 1 and scope 2 GHG emissions by 30% by 2030 from a 2018 base year. Hulamin also commits to reduce scope 3 GHG emissions by 24% per ton of aluminium produced by 2030 from a 2018 base year.”
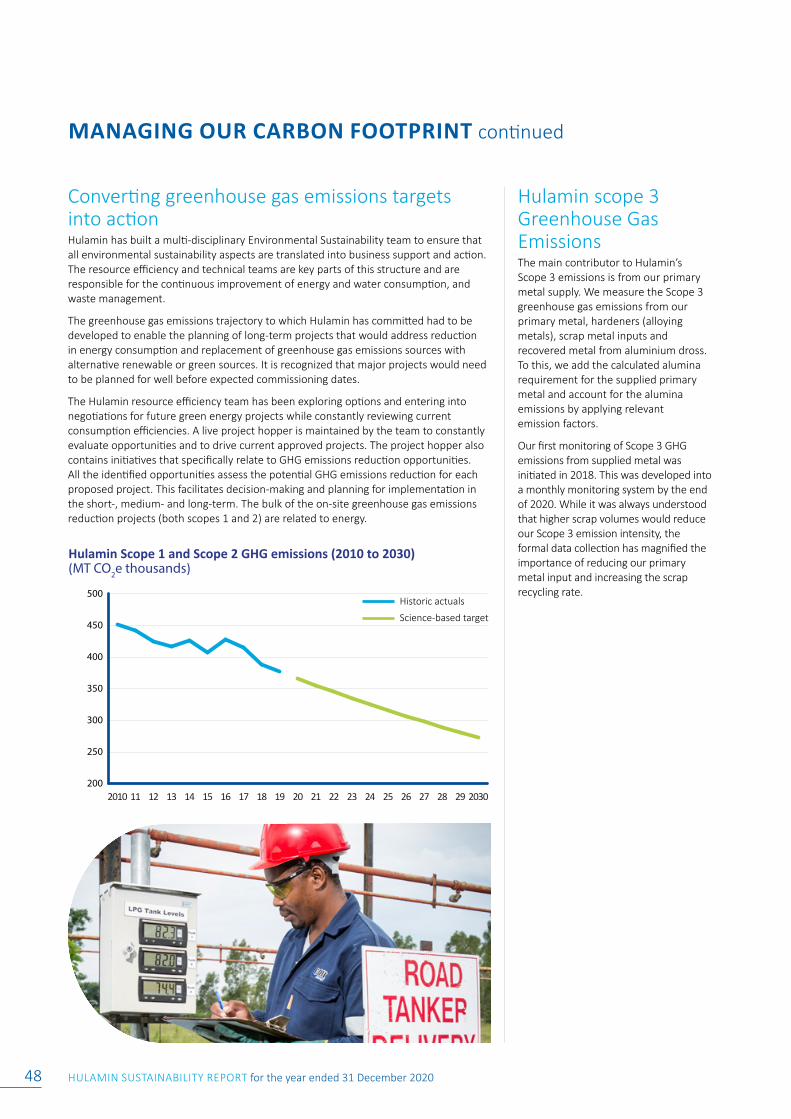
HULAMIN SUSTAINABILITY REPORT for the year ended 31 December 202048
Converting greenhouse gas emissions targets into actionHulamin has built a multi-disciplinary Environmental Sustainability team to ensure that all environmental sustainability aspects are translated into business support and action. The resource efficiency and technical teams are key parts of this structure and are responsible for the continuous improvement of energy and water consumption, and waste management.
The greenhouse gas emissions trajectory to which Hulamin has committed had to be developed to enable the planning of long-term projects that would address reduction in energy consumption and replacement of greenhouse gas emissions sources with alternative renewable or green sources. It is recognized that major projects would need to be planned for well before expected commissioning dates.
The Hulamin resource efficiency team has been exploring options and entering into negotiations for future green energy projects while constantly reviewing current consumption efficiencies. A live project hopper is maintained by the team to constantly evaluate opportunities and to drive current approved projects. The project hopper also contains initiatives that specifically relate to GHG emissions reduction opportunities. All the identified opportunities assess the potential GHG emissions reduction for each proposed project. This facilitates decision-making and planning for implementation in the short-, medium- and long-term. The bulk of the on-site greenhouse gas emissions reduction projects (both scopes 1 and 2) are related to energy.
Hulamin Scope 1 and Scope 2 GHG emissions (2010 to 2030)(MT CO2e thousands)
200
250
300
350
400
450
500
2030292827262524232221201918171615141312112010
Historic Science-based target
Hulamin scope 3 Greenhouse Gas EmissionsThe main contributor to Hulamin’s Scope 3 emissions is from our primary metal supply. We measure the Scope 3 greenhouse gas emissions from our primary metal, hardeners (alloying metals), scrap metal inputs and recovered metal from aluminium dross. To this, we add the calculated alumina requirement for the supplied primary metal and account for the alumina emissions by applying relevant emission factors.
Our first monitoring of Scope 3 GHG emissions from supplied metal was initiated in 2018. This was developed into a monthly monitoring system by the end of 2020. While it was always understood that higher scrap volumes would reduce our Scope 3 emission intensity, the formal data collection has magnified the importance of reducing our primary metal input and increasing the scrap recycling rate.
MANAGING OUR CARBON FOOTPRINT continued
Historic actuals
Science-based target
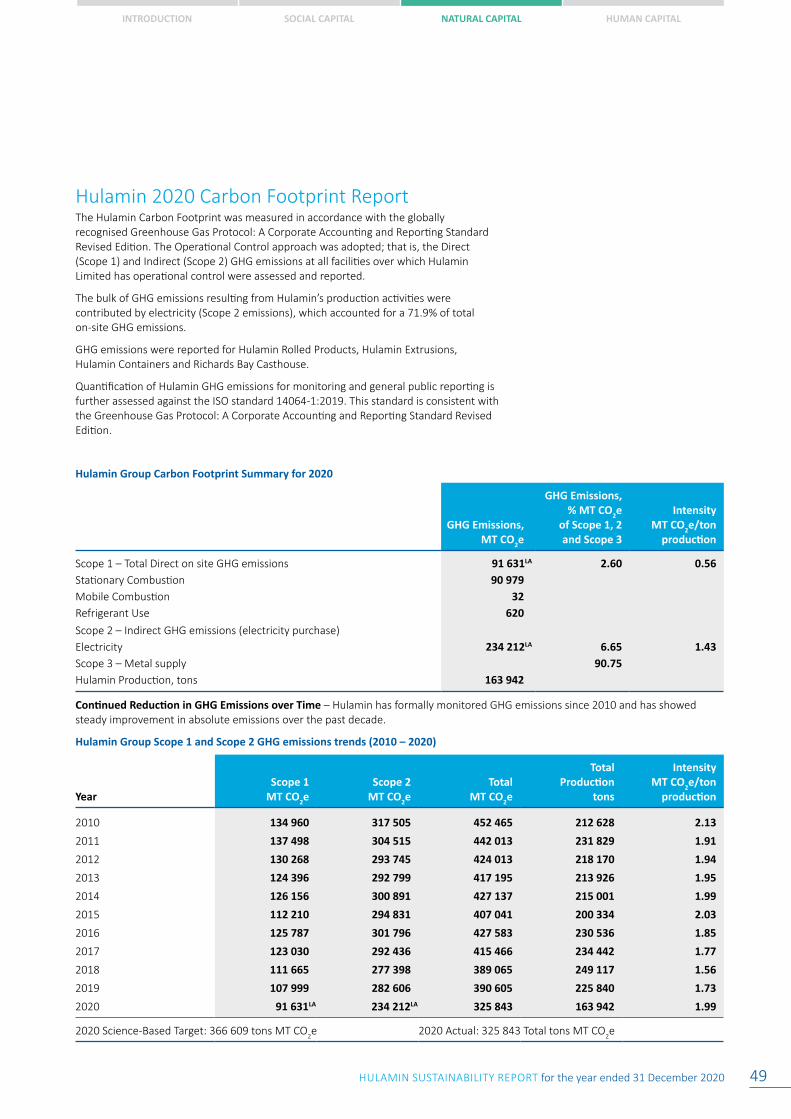
INTRODUCTION SOCIAL CAPITAL NATURAL CAPITAL HUMAN CAPITAL
HULAMIN SUSTAINABILITY REPORT for the year ended 31 December 2020 49
Hulamin Group Carbon Footprint Summary for 2020
GHG Emissions,MT CO2e
GHG Emissions,% MT CO2e
of Scope 1, 2 and Scope 3
IntensityMT CO2e/ton
production
Scope 1 – Total Direct on site GHG emissions 91 631LA 2.60 0.56Stationary Combustion 90 979Mobile Combustion 32Refrigerant Use 620
Scope 2 – Indirect GHG emissions (electricity purchase)Electricity 234 212LA 6.65 1.43Scope 3 – Metal supply 90.75Hulamin Production, tons 163 942
Continued Reduction in GHG Emissions over Time – Hulamin has formally monitored GHG emissions since 2010 and has showed steady improvement in absolute emissions over the past decade.
Hulamin Group Scope 1 and Scope 2 GHG emissions trends (2010 – 2020)
YearScope 1
MT CO2eScope 2
MT CO2eTotal
MT CO2e
Total Production
tons
IntensityMT CO2e/ton
production
2010 134 960 317 505 452 465 212 628 2.13
2011 137 498 304 515 442 013 231 829 1.91
2012 130 268 293 745 424 013 218 170 1.94
2013 124 396 292 799 417 195 213 926 1.95
2014 126 156 300 891 427 137 215 001 1.99
2015 112 210 294 831 407 041 200 334 2.03
2016 125 787 301 796 427 583 230 536 1.85
2017 123 030 292 436 415 466 234 442 1.77
2018 111 665 277 398 389 065 249 117 1.56
2019 107 999 282 606 390 605 225 840 1.73
2020 91 631LA 234 212LA 325 843 163 942 1.99
2020 Science-Based Target: 366 609 tons MT CO2e 2020 Actual: 325 843 Total tons MT CO2e
Hulamin 2020 Carbon Footprint ReportThe Hulamin Carbon Footprint was measured in accordance with the globally recognised Greenhouse Gas Protocol: A Corporate Accounting and Reporting Standard Revised Edition. The Operational Control approach was adopted; that is, the Direct (Scope 1) and Indirect (Scope 2) GHG emissions at all facilities over which Hulamin Limited has operational control were assessed and reported.
The bulk of GHG emissions resulting from Hulamin’s production activities were contributed by electricity (Scope 2 emissions), which accounted for a 71.9% of total on-site GHG emissions.
GHG emissions were reported for Hulamin Rolled Products, Hulamin Extrusions, Hulamin Containers and Richards Bay Casthouse.
Quantification of Hulamin GHG emissions for monitoring and general public reporting is further assessed against the ISO standard 14064-1:2019. This standard is consistent with the Greenhouse Gas Protocol: A Corporate Accounting and Reporting Standard Revised Edition.
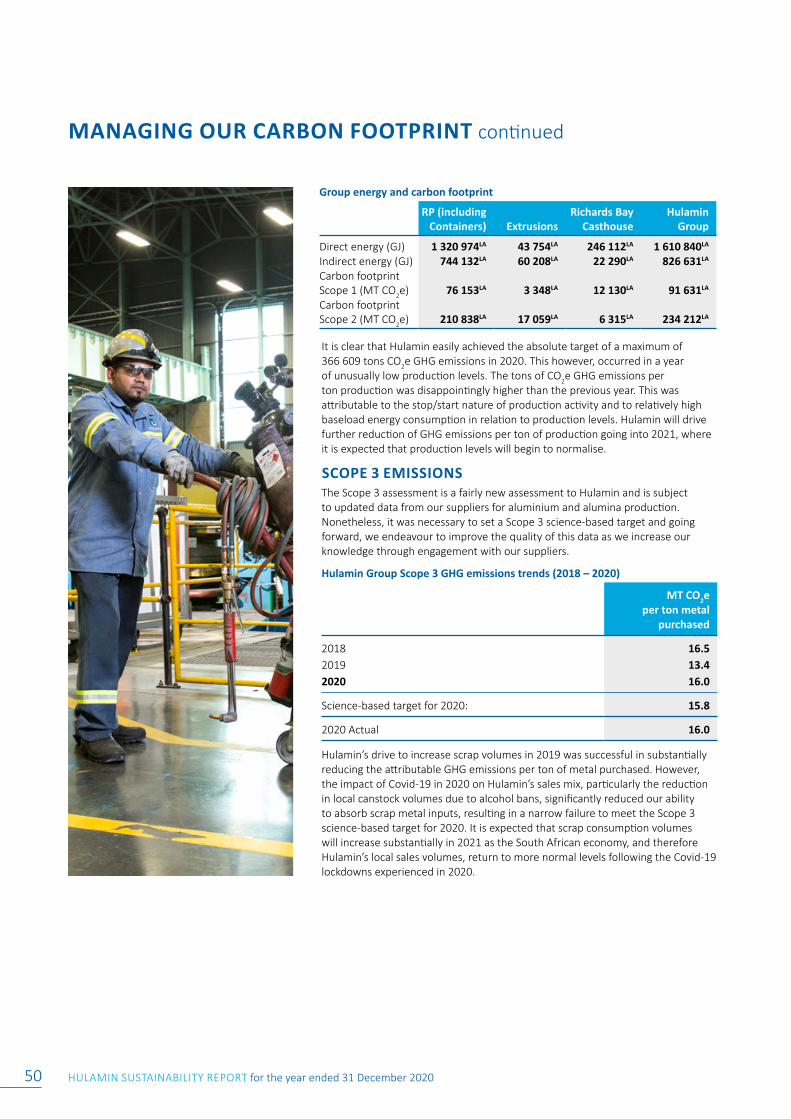
HULAMIN SUSTAINABILITY REPORT for the year ended 31 December 202050
It is clear that Hulamin easily achieved the absolute target of a maximum of 366 609 tons CO2e GHG emissions in 2020. This however, occurred in a year of unusually low production levels. The tons of CO2e GHG emissions per ton production was disappointingly higher than the previous year. This was attributable to the stop/start nature of production activity and to relatively high baseload energy consumption in relation to production levels. Hulamin will drive further reduction of GHG emissions per ton of production going into 2021, where it is expected that production levels will begin to normalise.
SCOPE 3 EMISSIONSThe Scope 3 assessment is a fairly new assessment to Hulamin and is subject to updated data from our suppliers for aluminium and alumina production. Nonetheless, it was necessary to set a Scope 3 science-based target and going forward, we endeavour to improve the quality of this data as we increase our knowledge through engagement with our suppliers.
Hulamin Group Scope 3 GHG emissions trends (2018 – 2020)
MT CO2e per ton metal
purchased
2018 16.52019 13.42020 16.0
Science-based target for 2020: 15.8
2020 Actual 16.0
Hulamin’s drive to increase scrap volumes in 2019 was successful in substantially reducing the attributable GHG emissions per ton of metal purchased. However, the impact of Covid-19 in 2020 on Hulamin’s sales mix, particularly the reduction in local canstock volumes due to alcohol bans, significantly reduced our ability to absorb scrap metal inputs, resulting in a narrow failure to meet the Scope 3 science-based target for 2020. It is expected that scrap consumption volumes will increase substantially in 2021 as the South African economy, and therefore Hulamin’s local sales volumes, return to more normal levels following the Covid-19 lockdowns experienced in 2020.
MANAGING OUR CARBON FOOTPRINT continued
Group energy and carbon footprint
RP (including Containers) Extrusions
Richards Bay Casthouse
Hulamin Group
Direct energy (GJ) 1 320 974LA 43 754LA 246 112LA 1 610 840LA
Indirect energy (GJ) 744 132LA 60 208LA 22 290LA 826 631LA
Carbon footprint Scope 1 (MT CO2e) 76 153LA 3 348LA 12 130LA 91 631LA
Carbon footprint Scope 2 (MT CO2e) 210 838LA 17 059LA 6 315LA 234 212LA
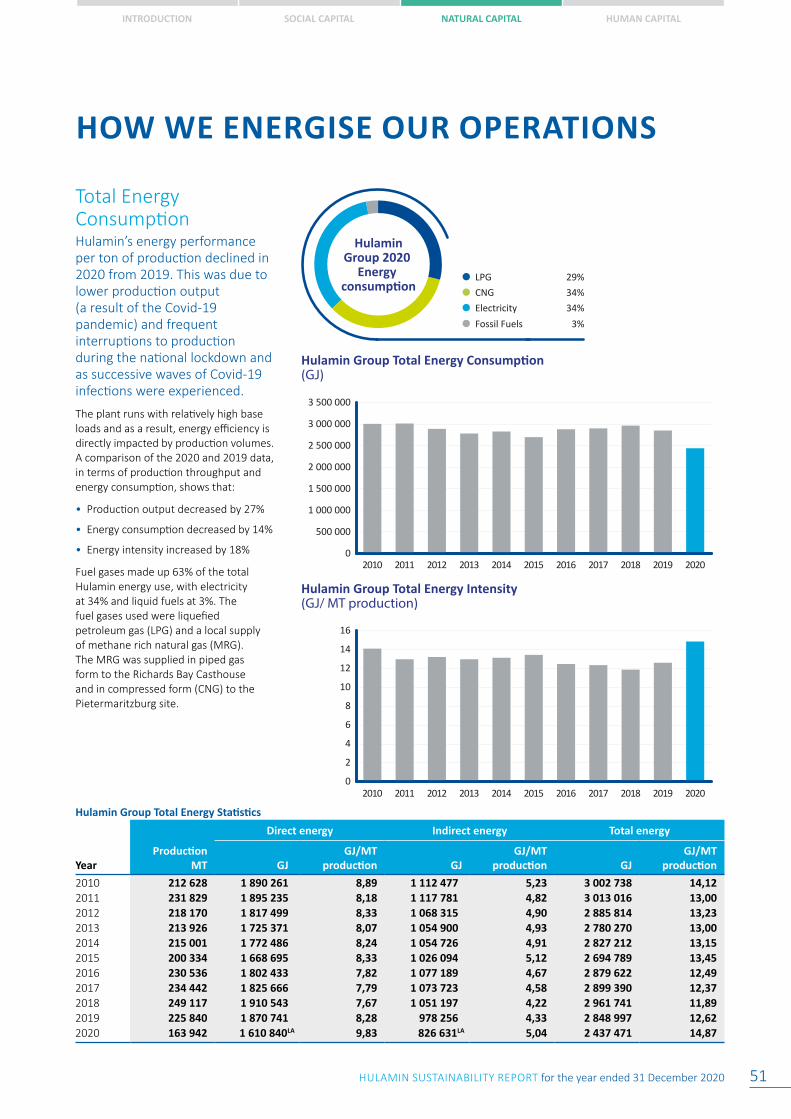
INTRODUCTION SOCIAL CAPITAL NATURAL CAPITAL HUMAN CAPITAL
HULAMIN SUSTAINABILITY REPORT for the year ended 31 December 2020 51
HOW WE ENERGISE OUR OPERATIONS
Total Energy ConsumptionHulamin’s energy performance per ton of production declined in 2020 from 2019. This was due to lower production output (a result of the Covid-19 pandemic) and frequent interruptions to production during the national lockdown and as successive waves of Covid-19 infections were experienced.
The plant runs with relatively high base loads and as a result, energy efficiency is directly impacted by production volumes. A comparison of the 2020 and 2019 data, in terms of production throughput and energy consumption, shows that:
• Production output decreased by 27%
• Energy consumption decreased by 14%
• Energy intensity increased by 18%
Fuel gases made up 63% of the total Hulamin energy use, with electricity at 34% and liquid fuels at 3%. The fuel gases used were liquefied petroleum gas (LPG) and a local supply of methane rich natural gas (MRG). The MRG was supplied in piped gas form to the Richards Bay Casthouse and in compressed form (CNG) to the Pietermaritzburg site.
HulaminGroup 2020
Energy consumption
LPG 29%
Fossil Fuels 3%
CNG 34%Electricity 34%
Hulamin Group Total Energy Consumption (GJ)
0
500 000
1 000 000
1 500 000
2 000 000
2 500 000
3 000 000
3 500 000
20202019201820172016201520142013201220112010
Hulamin Group Total Energy Intensity (GJ/ MT production)
0
2
4
6
8
10
12
14
16
20202019201820172016201520142013201220112010
Hulamin Group Total Energy Statistics
Year
Direct energy Indirect energy Total energy
Production MT GJ
GJ/MT production GJ
GJ/MT production GJ
GJ/MT production
2010 212 628 1 890 261 8,89 1 112 477 5,23 3 002 738 14,122011 231 829 1 895 235 8,18 1 117 781 4,82 3 013 016 13,002012 218 170 1 817 499 8,33 1 068 315 4,90 2 885 814 13,232013 213 926 1 725 371 8,07 1 054 900 4,93 2 780 270 13,002014 215 001 1 772 486 8,24 1 054 726 4,91 2 827 212 13,152015 200 334 1 668 695 8,33 1 026 094 5,12 2 694 789 13,452016 230 536 1 802 433 7,82 1 077 189 4,67 2 879 622 12,492017 234 442 1 825 666 7,79 1 073 723 4,58 2 899 390 12,372018 249 117 1 910 543 7,67 1 051 197 4,22 2 961 741 11,892019 225 840 1 870 741 8,28 978 256 4,33 2 848 997 12,622020 163 942 1 610 840LA 9,83 826 631LA 5,04 2 437 471 14,87
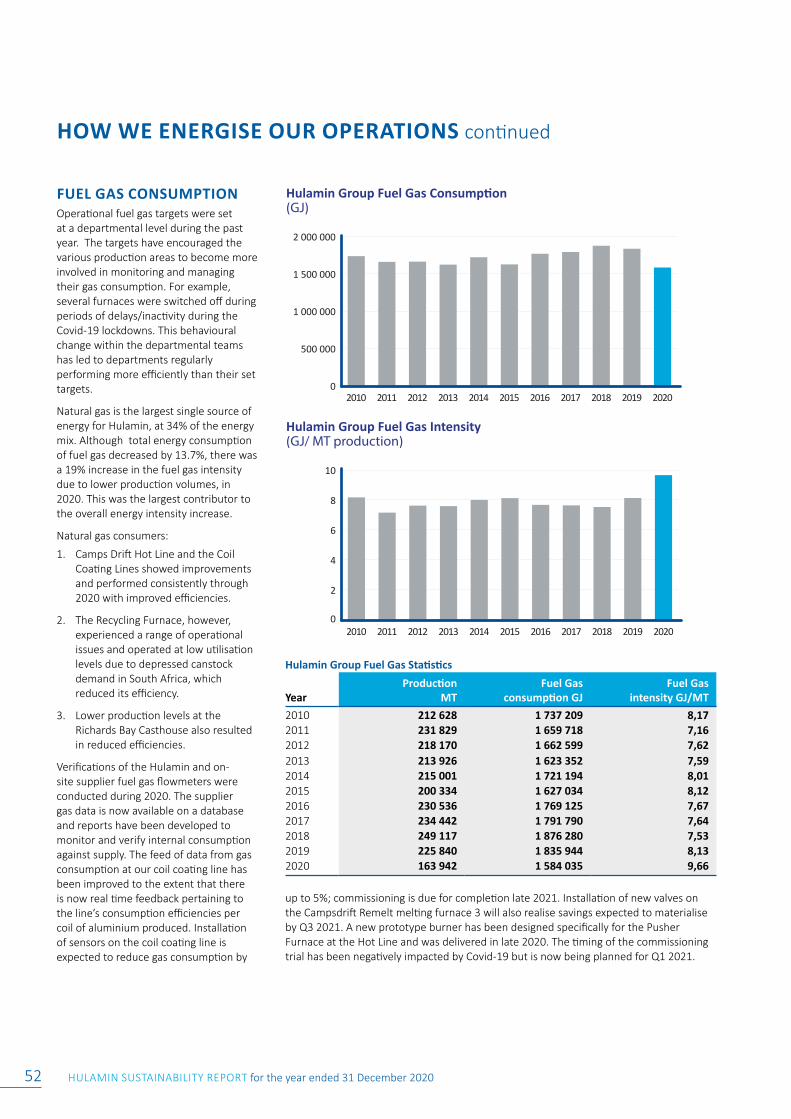
HULAMIN SUSTAINABILITY REPORT for the year ended 31 December 202052
HOW WE ENERGISE OUR OPERATIONS continued
FUEL GAS CONSUMPTIONOperational fuel gas targets were set at a departmental level during the past year. The targets have encouraged the various production areas to become more involved in monitoring and managing their gas consumption. For example, several furnaces were switched off during periods of delays/inactivity during the Covid-19 lockdowns. This behavioural change within the departmental teams has led to departments regularly performing more efficiently than their set targets.
Natural gas is the largest single source of energy for Hulamin, at 34% of the energy mix. Although total energy consumption of fuel gas decreased by 13.7%, there was a 19% increase in the fuel gas intensity due to lower production volumes, in 2020. This was the largest contributor to the overall energy intensity increase.
Natural gas consumers:
1. Camps Drift Hot Line and the Coil Coating Lines showed improvements and performed consistently through 2020 with improved efficiencies.
2. The Recycling Furnace, however, experienced a range of operational issues and operated at low utilisation levels due to depressed canstock demand in South Africa, which reduced its efficiency.
3. Lower production levels at the Richards Bay Casthouse also resulted in reduced efficiencies.
Verifications of the Hulamin and on-site supplier fuel gas flowmeters were conducted during 2020. The supplier gas data is now available on a database and reports have been developed to monitor and verify internal consumption against supply. The feed of data from gas consumption at our coil coating line has been improved to the extent that there is now real time feedback pertaining to the line’s consumption efficiencies per coil of aluminium produced. Installation of sensors on the coil coating line is expected to reduce gas consumption by
Hulamin Group Fuel Gas Consumption (GJ)
0
500 000
1 000 000
1 500 000
2 000 000
20202019201820172016201520142013201220112010
Hulamin Group Fuel Gas Intensity (GJ/ MT production)
0
2
4
6
8
10
20202019201820172016201520142013201220112010
Hulamin Group Fuel Gas Statistics
Year Production
MTFuel Gas
consumption GJFuel Gas
intensity GJ/MT
2010 212 628 1 737 209 8,172011 231 829 1 659 718 7,162012 218 170 1 662 599 7,622013 213 926 1 623 352 7,592014 215 001 1 721 194 8,012015 200 334 1 627 034 8,122016 230 536 1 769 125 7,672017 234 442 1 791 790 7,642018 249 117 1 876 280 7,532019 225 840 1 835 944 8,132020 163 942 1 584 035 9,66
up to 5%; commissioning is due for completion late 2021. Installation of new valves on the Campsdrift Remelt melting furnace 3 will also realise savings expected to materialise by Q3 2021. A new prototype burner has been designed specifically for the Pusher Furnace at the Hot Line and was delivered in late 2020. The timing of the commissioning trial has been negatively impacted by Covid-19 but is now being planned for Q1 2021.
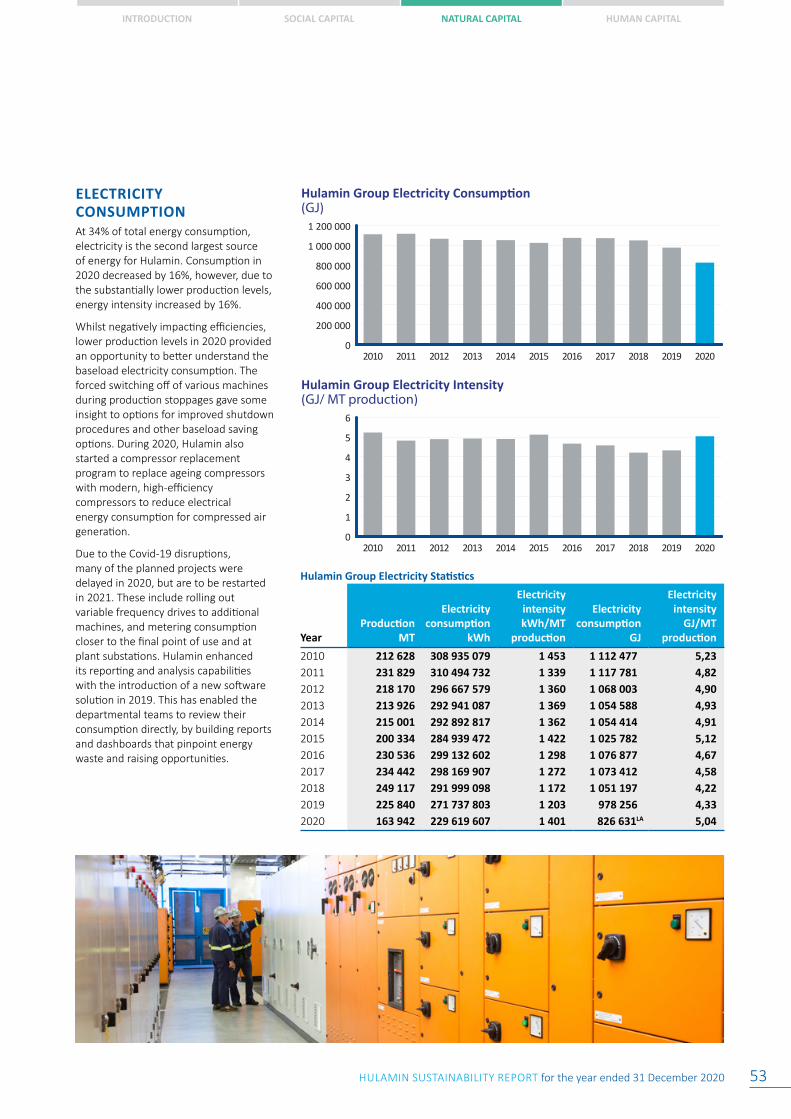
INTRODUCTION SOCIAL CAPITAL NATURAL CAPITAL HUMAN CAPITAL
HULAMIN SUSTAINABILITY REPORT for the year ended 31 December 2020 53
Hulamin Group Electricity Consumption (GJ)
0
200 000
400 000
600 000
800 000
1 000 000
1 200 000
20202019201820172016201520142013201220112010
Hulamin Group Electricity Intensity (GJ/ MT production)
0
1
2
3
4
5
6
20202019201820172016201520142013201220112010
ELECTRICITY CONSUMPTIONAt 34% of total energy consumption, electricity is the second largest source of energy for Hulamin. Consumption in 2020 decreased by 16%, however, due to the substantially lower production levels, energy intensity increased by 16%.
Whilst negatively impacting efficiencies, lower production levels in 2020 provided an opportunity to better understand the baseload electricity consumption. The forced switching off of various machines during production stoppages gave some insight to options for improved shutdown procedures and other baseload saving options. During 2020, Hulamin also started a compressor replacement program to replace ageing compressors with modern, high-efficiency compressors to reduce electrical energy consumption for compressed air generation.
Due to the Covid-19 disruptions, many of the planned projects were delayed in 2020, but are to be restarted in 2021. These include rolling out variable frequency drives to additional machines, and metering consumption closer to the final point of use and at plant substations. Hulamin enhanced its reporting and analysis capabilities with the introduction of a new software solution in 2019. This has enabled the departmental teams to review their consumption directly, by building reports and dashboards that pinpoint energy waste and raising opportunities.
Hulamin Group Electricity Statistics
YearProduction
MT
Electricity consumption
kWh
Electricity intensitykWh/MT
production
Electricity consumption
GJ
Electricity intensity
GJ/MT production
2010 212 628 308 935 079 1 453 1 112 477 5,232011 231 829 310 494 732 1 339 1 117 781 4,822012 218 170 296 667 579 1 360 1 068 003 4,902013 213 926 292 941 087 1 369 1 054 588 4,932014 215 001 292 892 817 1 362 1 054 414 4,912015 200 334 284 939 472 1 422 1 025 782 5,122016 230 536 299 132 602 1 298 1 076 877 4,672017 234 442 298 169 907 1 272 1 073 412 4,582018 249 117 291 999 098 1 172 1 051 197 4,222019 225 840 271 737 803 1 203 978 256 4,332020 163 942 229 619 607 1 401 826 631LA 5,04
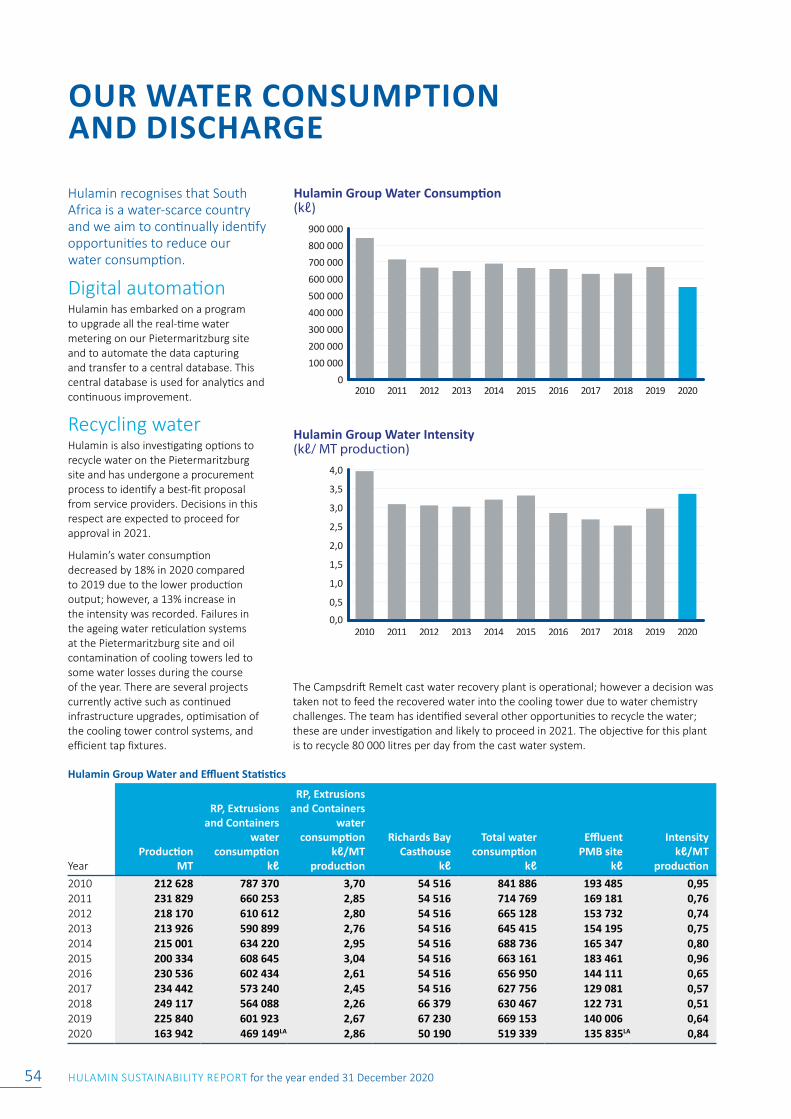
HULAMIN SUSTAINABILITY REPORT for the year ended 31 December 202054
OUR WATER CONSUMPTION AND DISCHARGE
Hulamin recognises that South Africa is a water-scarce country and we aim to continually identify opportunities to reduce our water consumption.
Digital automationHulamin has embarked on a program to upgrade all the real-time water metering on our Pietermaritzburg site and to automate the data capturing and transfer to a central database. This central database is used for analytics and continuous improvement.
Recycling waterHulamin is also investigating options to recycle water on the Pietermaritzburg site and has undergone a procurement process to identify a best-fit proposal from service providers. Decisions in this respect are expected to proceed for approval in 2021.
Hulamin’s water consumption decreased by 18% in 2020 compared to 2019 due to the lower production output; however, a 13% increase in the intensity was recorded. Failures in the ageing water reticulation systems at the Pietermaritzburg site and oil contamination of cooling towers led to some water losses during the course of the year. There are several projects currently active such as continued infrastructure upgrades, optimisation of the cooling tower control systems, and efficient tap fixtures.
Hulamin Group Water Consumption (kℓ)
0100 000200 000300 000400 000500 000600 000700 000800 000900 000
20202019201820172016201520142013201220112010
Hulamin Group Water Intensity(kℓ/ MT production)
0,0
0,5
1,0
1,5
2,0
2,5
3,0
3,5
4,0
20202019201820172016201520142013201220112010
Hulamin Group Water and Effluent Statistics
YearProduction
MT
RP, Extrusions and Containers
water consumption
kℓ
RP, Extrusions and Containers
water consumption
kℓ/MT production
Richards Bay Casthouse
kℓ
Total water consumption
kℓ
Effluent PMB site
kℓ
Intensity kℓ/MT
production
2010 212 628 787 370 3,70 54 516 841 886 193 485 0,952011 231 829 660 253 2,85 54 516 714 769 169 181 0,762012 218 170 610 612 2,80 54 516 665 128 153 732 0,742013 213 926 590 899 2,76 54 516 645 415 154 195 0,752014 215 001 634 220 2,95 54 516 688 736 165 347 0,802015 200 334 608 645 3,04 54 516 663 161 183 461 0,962016 230 536 602 434 2,61 54 516 656 950 144 111 0,652017 234 442 573 240 2,45 54 516 627 756 129 081 0,572018 249 117 564 088 2,26 66 379 630 467 122 731 0,512019 225 840 601 923 2,67 67 230 669 153 140 006 0,642020 163 942 469 149LA 2,86 50 190 519 339 135 835LA 0,84
The Campsdrift Remelt cast water recovery plant is operational; however a decision was taken not to feed the recovered water into the cooling tower due to water chemistry challenges. The team has identified several other opportunities to recycle the water; these are under investigation and likely to proceed in 2021. The objective for this plant is to recycle 80 000 litres per day from the cast water system.
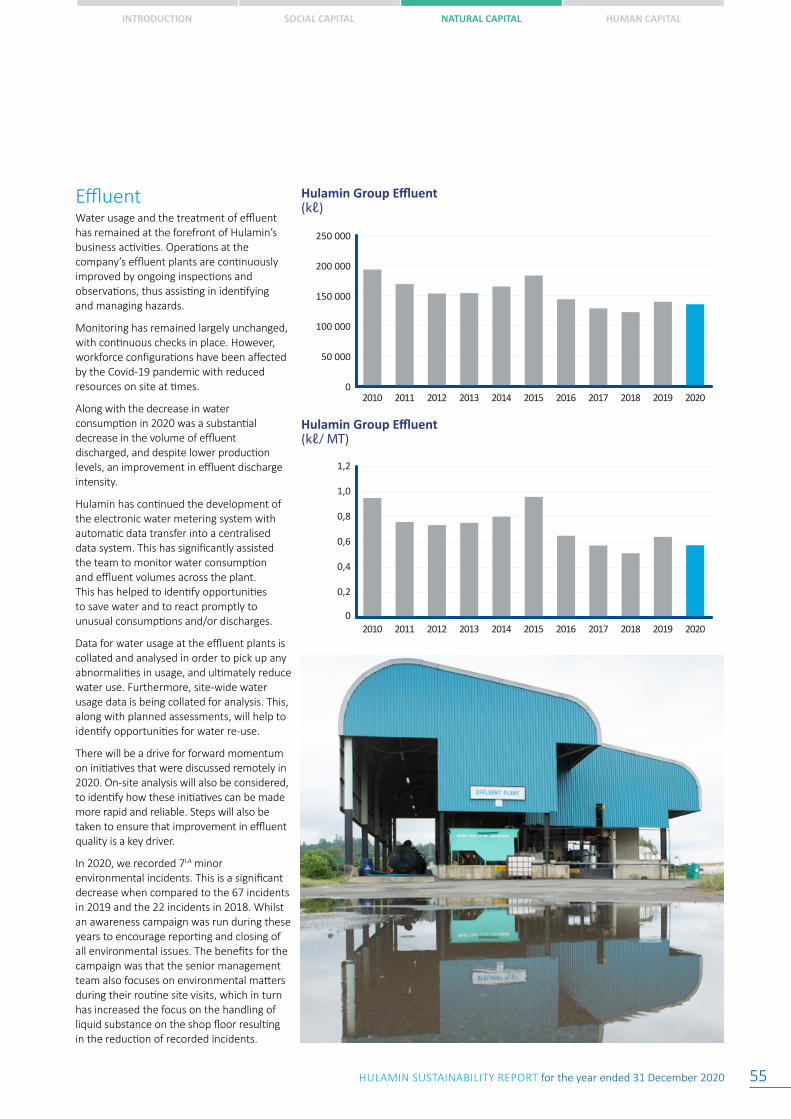
INTRODUCTION SOCIAL CAPITAL NATURAL CAPITAL HUMAN CAPITAL
HULAMIN SUSTAINABILITY REPORT for the year ended 31 December 2020 55
Hulamin Group Effluent (kℓ)
0
50 000
100 000
150 000
200 000
250 000
20202019201820172016201520142013201220112010
Hulamin Group Effluent (kℓ/ MT)
0
0,2
0,4
0,6
0,8
1,0
1,2
20202019201820172016201520142013201220112010
EffluentWater usage and the treatment of effluent has remained at the forefront of Hulamin’s business activities. Operations at the company’s effluent plants are continuously improved by ongoing inspections and observations, thus assisting in identifying and managing hazards.
Monitoring has remained largely unchanged, with continuous checks in place. However, workforce configurations have been affected by the Covid-19 pandemic with reduced resources on site at times.
Along with the decrease in water consumption in 2020 was a substantial decrease in the volume of effluent discharged, and despite lower production levels, an improvement in effluent discharge intensity.
Hulamin has continued the development of the electronic water metering system with automatic data transfer into a centralised data system. This has significantly assisted the team to monitor water consumption and effluent volumes across the plant. This has helped to identify opportunities to save water and to react promptly to unusual consumptions and/or discharges.
Data for water usage at the effluent plants is collated and analysed in order to pick up any abnormalities in usage, and ultimately reduce water use. Furthermore, site-wide water usage data is being collated for analysis. This, along with planned assessments, will help to identify opportunities for water re-use.
There will be a drive for forward momentum on initiatives that were discussed remotely in 2020. On-site analysis will also be considered, to identify how these initiatives can be made more rapid and reliable. Steps will also be taken to ensure that improvement in effluent quality is a key driver.
In 2020, we recorded 7LA minor environmental incidents. This is a significant decrease when compared to the 67 incidents in 2019 and the 22 incidents in 2018. Whilst an awareness campaign was run during these years to encourage reporting and closing of all environmental issues. The benefits for the campaign was that the senior management team also focuses on environmental matters during their routine site visits, which in turn has increased the focus on the handling of liquid substance on the shop floor resulting in the reduction of recorded incidents.
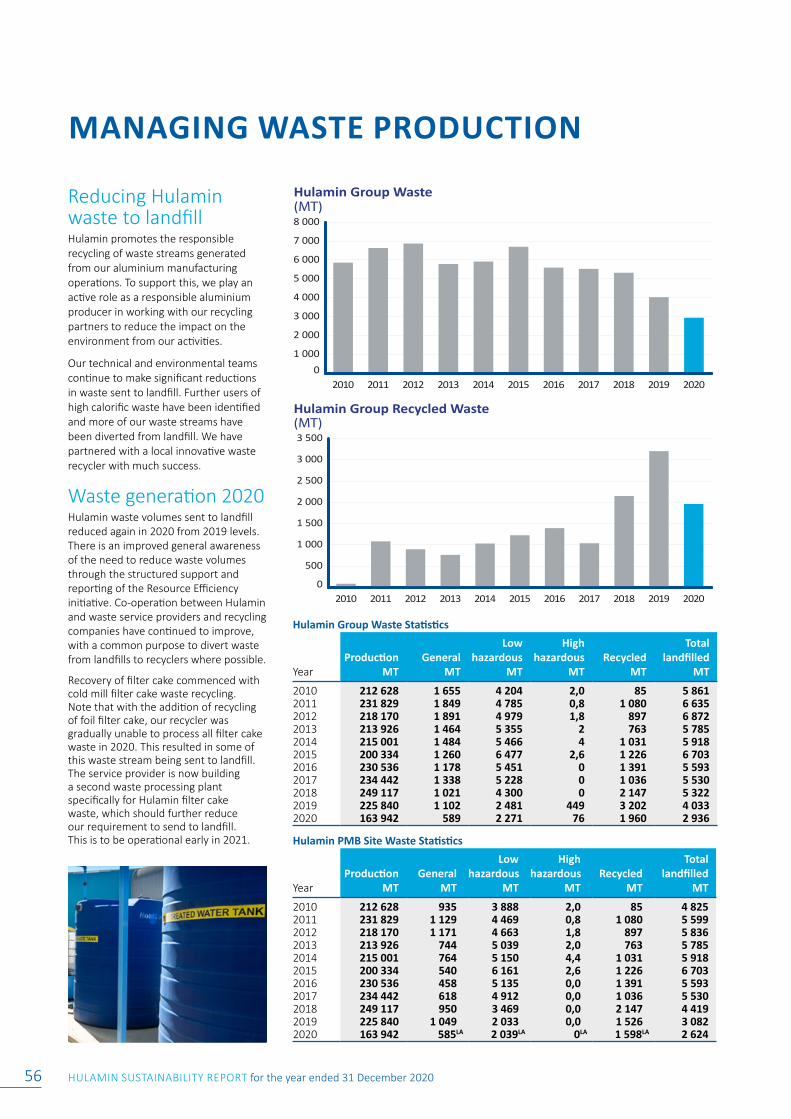
HULAMIN SUSTAINABILITY REPORT for the year ended 31 December 202056
MANAGING WASTE PRODUCTION
Reducing Hulamin waste to landfillHulamin promotes the responsible recycling of waste streams generated from our aluminium manufacturing operations. To support this, we play an active role as a responsible aluminium producer in working with our recycling partners to reduce the impact on the environment from our activities.
Our technical and environmental teams continue to make significant reductions in waste sent to landfill. Further users of high calorific waste have been identified and more of our waste streams have been diverted from landfill. We have partnered with a local innovative waste recycler with much success.
Waste generation 2020Hulamin waste volumes sent to landfill reduced again in 2020 from 2019 levels. There is an improved general awareness of the need to reduce waste volumes through the structured support and reporting of the Resource Efficiency initiative. Co-operation between Hulamin and waste service providers and recycling companies have continued to improve, with a common purpose to divert waste from landfills to recyclers where possible.
Recovery of filter cake commenced with cold mill filter cake waste recycling. Note that with the addition of recycling of foil filter cake, our recycler was gradually unable to process all filter cake waste in 2020. This resulted in some of this waste stream being sent to landfill. The service provider is now building a second waste processing plant specifically for Hulamin filter cake waste, which should further reduce our requirement to send to landfill. This is to be operational early in 2021.
Hulamin Group Waste(MT)
01 000
2 000
3 000
4 000
5 000
6 000
7 000
8 000
20202019201820172016201520142013201220112010
Hulamin Group Recycled Waste(MT)
0
500
1 000
1 500
2 000
2 500
3 000
3 500
20202019201820172016201520142013201220112010
Hulamin Group Waste Statistics
YearProduction
MTGeneral
MT
Low hazardous
MT
High hazardous
MTRecycled
MT
Total landfilled
MT
2010 212 628 1 655 4 204 2,0 85 5 8612011 231 829 1 849 4 785 0,8 1 080 6 6352012 218 170 1 891 4 979 1,8 897 6 8722013 213 926 1 464 5 355 2 763 5 7852014 215 001 1 484 5 466 4 1 031 5 9182015 200 334 1 260 6 477 2,6 1 226 6 7032016 230 536 1 178 5 451 0 1 391 5 5932017 234 442 1 338 5 228 0 1 036 5 5302018 249 117 1 021 4 300 0 2 147 5 3222019 225 840 1 102 2 481 449 3 202 4 0332020 163 942 589 2 271 76 1 960 2 936
Hulamin PMB Site Waste Statistics
YearProduction
MTGeneral
MT
Low hazardous
MT
High hazardous
MTRecycled
MT
Total landfilled
MT
2010 212 628 935 3 888 2,0 85 4 8252011 231 829 1 129 4 469 0,8 1 080 5 5992012 218 170 1 171 4 663 1,8 897 5 8362013 213 926 744 5 039 2,0 763 5 7852014 215 001 764 5 150 4,4 1 031 5 9182015 200 334 540 6 161 2,6 1 226 6 7032016 230 536 458 5 135 0,0 1 391 5 5932017 234 442 618 4 912 0,0 1 036 5 5302018 249 117 950 3 469 0,0 2 147 4 4192019 225 840 1 049 2 033 0,0 1 526 3 0822020 163 942 585LA 2 039LA 0LA 1 598LA 2 624
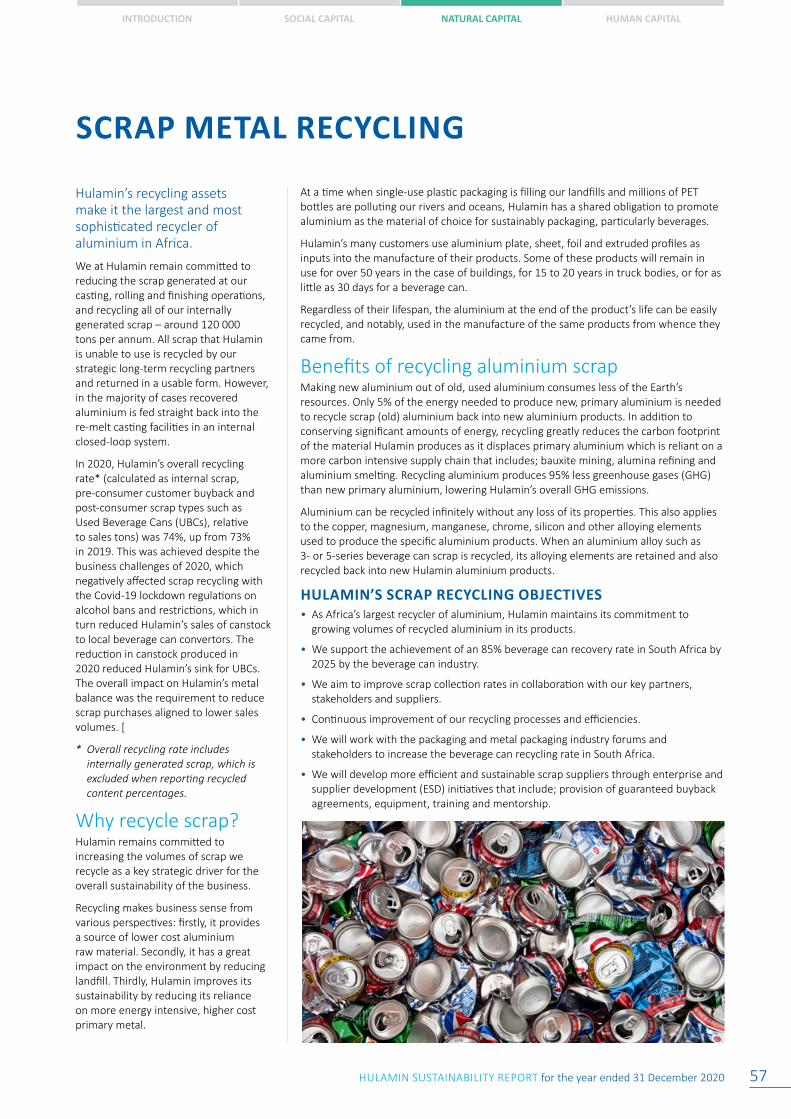
INTRODUCTION SOCIAL CAPITAL NATURAL CAPITAL HUMAN CAPITAL
HULAMIN SUSTAINABILITY REPORT for the year ended 31 December 2020 57
SCRAP METAL RECYCLING
Hulamin’s recycling assets make it the largest and most sophisticated recycler of aluminium in Africa.
We at Hulamin remain committed to reducing the scrap generated at our casting, rolling and finishing operations, and recycling all of our internally generated scrap – around 120 000 tons per annum. All scrap that Hulamin is unable to use is recycled by our strategic long-term recycling partners and returned in a usable form. However, in the majority of cases recovered aluminium is fed straight back into the re-melt casting facilities in an internal closed-loop system.
In 2020, Hulamin’s overall recycling rate* (calculated as internal scrap, pre-consumer customer buyback and post-consumer scrap types such as Used Beverage Cans (UBCs), relative to sales tons) was 74%, up from 73% in 2019. This was achieved despite the business challenges of 2020, which negatively affected scrap recycling with the Covid-19 lockdown regulations on alcohol bans and restrictions, which in turn reduced Hulamin’s sales of canstock to local beverage can convertors. The reduction in canstock produced in 2020 reduced Hulamin’s sink for UBCs. The overall impact on Hulamin’s metal balance was the requirement to reduce scrap purchases aligned to lower sales volumes. [
* Overall recycling rate includes internally generated scrap, which is excluded when reporting recycled content percentages.
Why recycle scrap?Hulamin remains committed to increasing the volumes of scrap we recycle as a key strategic driver for the overall sustainability of the business.
Recycling makes business sense from various perspectives: firstly, it provides a source of lower cost aluminium raw material. Secondly, it has a great impact on the environment by reducing landfill. Thirdly, Hulamin improves its sustainability by reducing its reliance on more energy intensive, higher cost primary metal.
At a time when single-use plastic packaging is filling our landfills and millions of PET bottles are polluting our rivers and oceans, Hulamin has a shared obligation to promote aluminium as the material of choice for sustainably packaging, particularly beverages.
Hulamin’s many customers use aluminium plate, sheet, foil and extruded profiles as inputs into the manufacture of their products. Some of these products will remain in use for over 50 years in the case of buildings, for 15 to 20 years in truck bodies, or for as little as 30 days for a beverage can.
Regardless of their lifespan, the aluminium at the end of the product’s life can be easily recycled, and notably, used in the manufacture of the same products from whence they came from.
Benefits of recycling aluminium scrapMaking new aluminium out of old, used aluminium consumes less of the Earth’s resources. Only 5% of the energy needed to produce new, primary aluminium is needed to recycle scrap (old) aluminium back into new aluminium products. In addition to conserving significant amounts of energy, recycling greatly reduces the carbon footprint of the material Hulamin produces as it displaces primary aluminium which is reliant on a more carbon intensive supply chain that includes; bauxite mining, alumina refining and aluminium smelting. Recycling aluminium produces 95% less greenhouse gases (GHG) than new primary aluminium, lowering Hulamin’s overall GHG emissions.
Aluminium can be recycled infinitely without any loss of its properties. This also applies to the copper, magnesium, manganese, chrome, silicon and other alloying elements used to produce the specific aluminium products. When an aluminium alloy such as 3- or 5-series beverage can scrap is recycled, its alloying elements are retained and also recycled back into new Hulamin aluminium products.
HULAMIN’S SCRAP RECYCLING OBJECTIVES• As Africa’s largest recycler of aluminium, Hulamin maintains its commitment to
growing volumes of recycled aluminium in its products.
• We support the achievement of an 85% beverage can recovery rate in South Africa by 2025 by the beverage can industry.
• We aim to improve scrap collection rates in collaboration with our key partners, stakeholders and suppliers.
• Continuous improvement of our recycling processes and efficiencies.
• We will work with the packaging and metal packaging industry forums and stakeholders to increase the beverage can recycling rate in South Africa.
• We will develop more efficient and sustainable scrap suppliers through enterprise and supplier development (ESD) initiatives that include; provision of guaranteed buyback agreements, equipment, training and mentorship.
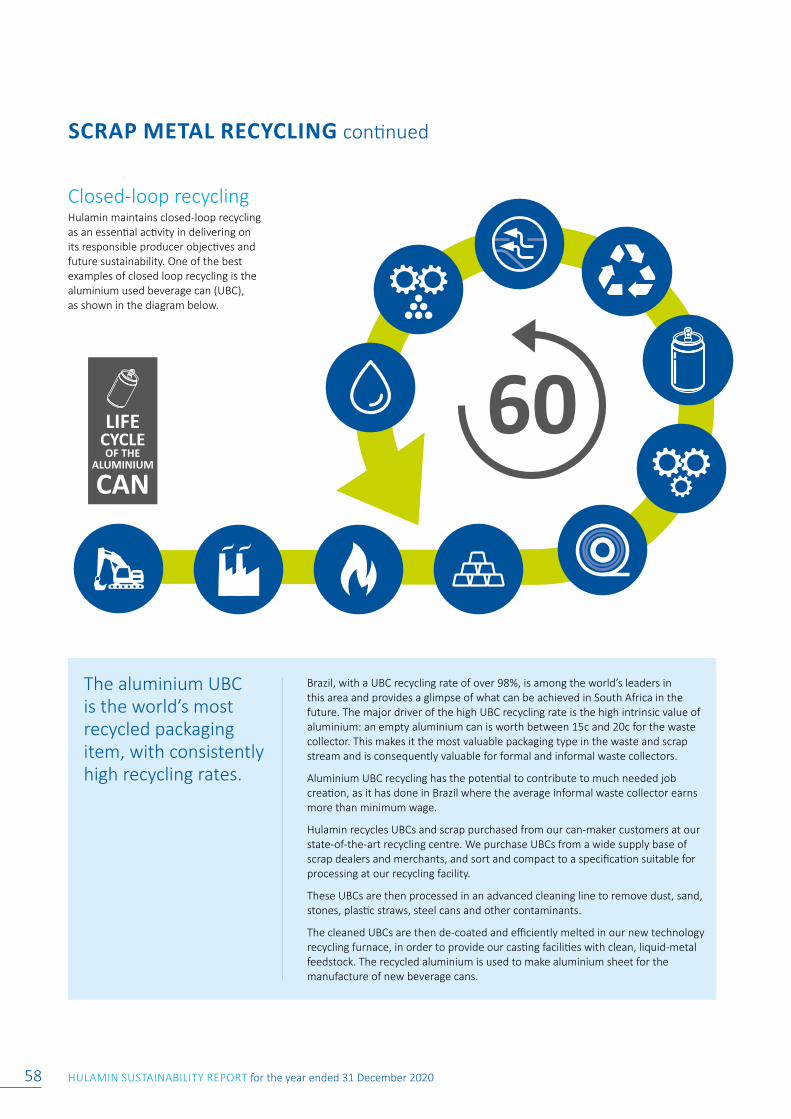
HULAMIN SUSTAINABILITY REPORT for the year ended 31 December 202058
SCRAP METAL RECYCLING continued
LIFE
CAN
CYCLEOF THE
ALUMINIUM
60
Closed-loop recyclingHulamin maintains closed-loop recycling as an essential activity in delivering on its responsible producer objectives and future sustainability. One of the best examples of closed loop recycling is the aluminium used beverage can (UBC), as shown in the diagram below.
Brazil, with a UBC recycling rate of over 98%, is among the world’s leaders in this area and provides a glimpse of what can be achieved in South Africa in the future. The major driver of the high UBC recycling rate is the high intrinsic value of aluminium: an empty aluminium can is worth between 15c and 20c for the waste collector. This makes it the most valuable packaging type in the waste and scrap stream and is consequently valuable for formal and informal waste collectors.
Aluminium UBC recycling has the potential to contribute to much needed job creation, as it has done in Brazil where the average informal waste collector earns more than minimum wage.
Hulamin recycles UBCs and scrap purchased from our can-maker customers at our state-of-the-art recycling centre. We purchase UBCs from a wide supply base of scrap dealers and merchants, and sort and compact to a specification suitable for processing at our recycling facility.
These UBCs are then processed in an advanced cleaning line to remove dust, sand, stones, plastic straws, steel cans and other contaminants.
The cleaned UBCs are then de-coated and efficiently melted in our new technology recycling furnace, in order to provide our casting facilities with clean, liquid-metal feedstock. The recycled aluminium is used to make aluminium sheet for the manufacture of new beverage cans.
The aluminium UBC is the world’s most recycled packaging item, with consistently high recycling rates.
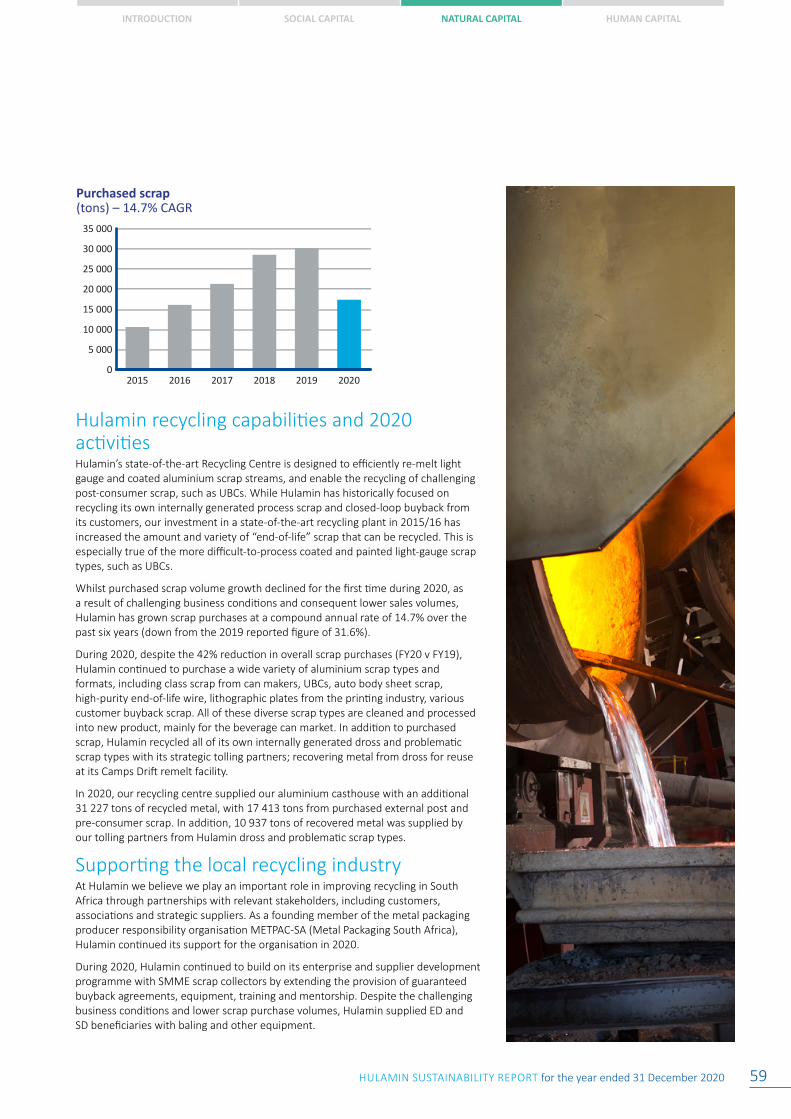
INTRODUCTION SOCIAL CAPITAL NATURAL CAPITAL HUMAN CAPITAL
HULAMIN SUSTAINABILITY REPORT for the year ended 31 December 2020 59
Hulamin recycling capabilities and 2020 activitiesHulamin’s state-of-the-art Recycling Centre is designed to efficiently re-melt light gauge and coated aluminium scrap streams, and enable the recycling of challenging post-consumer scrap, such as UBCs. While Hulamin has historically focused on recycling its own internally generated process scrap and closed-loop buyback from its customers, our investment in a state-of-the-art recycling plant in 2015/16 has increased the amount and variety of “end-of-life” scrap that can be recycled. This is especially true of the more difficult-to-process coated and painted light-gauge scrap types, such as UBCs.
Whilst purchased scrap volume growth declined for the first time during 2020, as a result of challenging business conditions and consequent lower sales volumes, Hulamin has grown scrap purchases at a compound annual rate of 14.7% over the past six years (down from the 2019 reported figure of 31.6%).
During 2020, despite the 42% reduction in overall scrap purchases (FY20 v FY19), Hulamin continued to purchase a wide variety of aluminium scrap types and formats, including class scrap from can makers, UBCs, auto body sheet scrap, high-purity end-of-life wire, lithographic plates from the printing industry, various customer buyback scrap. All of these diverse scrap types are cleaned and processed into new product, mainly for the beverage can market. In addition to purchased scrap, Hulamin recycled all of its own internally generated dross and problematic scrap types with its strategic tolling partners; recovering metal from dross for reuse at its Camps Drift remelt facility.
In 2020, our recycling centre supplied our aluminium casthouse with an additional 31 227 tons of recycled metal, with 17 413 tons from purchased external post and pre-consumer scrap. In addition, 10 937 tons of recovered metal was supplied by our tolling partners from Hulamin dross and problematic scrap types.
Supporting the local recycling industryAt Hulamin we believe we play an important role in improving recycling in South Africa through partnerships with relevant stakeholders, including customers, associations and strategic suppliers. As a founding member of the metal packaging producer responsibility organisation METPAC-SA (Metal Packaging South Africa), Hulamin continued its support for the organisation in 2020.
During 2020, Hulamin continued to build on its enterprise and supplier development programme with SMME scrap collectors by extending the provision of guaranteed buyback agreements, equipment, training and mentorship. Despite the challenging business conditions and lower scrap purchase volumes, Hulamin supplied ED and SD beneficiaries with baling and other equipment.
Purchased scrap (tons) – 14.7% CAGRPurchased scrap (tons) – 14.7% CAGR
0
5 000
10 000
15 000
20 000
25 000
30 000
35 000
202020192018201720162015
HULAMIN SUSTAINABILITY REPORT for the year ended 31 December 202060
OUR PEOPLE
HUMAN CAPITALHuman capital 60
Employee engagement 63
Employment equity 71
Safety 74
Health 76
04
Change has always been a constant driver in our approach to our people management philosophy. However, in 2020 there has been a profound shift in the pace and extent of this change. Covid-19 has seriously impacted all traditional ways of working and this has called for the business to urgently adapt and to implement new work place protocols and practices, which include a refocus of the human capital delivery to the business.As the pandemic evolves, a significant focus area for the human capital has been geared towards implementing plans and measures that support and prioritise employees’ physical and mental well-being.
This support is extended to employees directly and indirectly affected by Covid-19 and to managers in order to assist them to deal with the increased anxiety, concerns, and dynamic conditions of the workplace.
Measures applied include:
• Flexible and remote work options
• Effective communication structures with employees.
• Covid-19 guidelines to access the workplace.
• Professional assistance to all affected parties.
• A Covid-19-compliant workplace
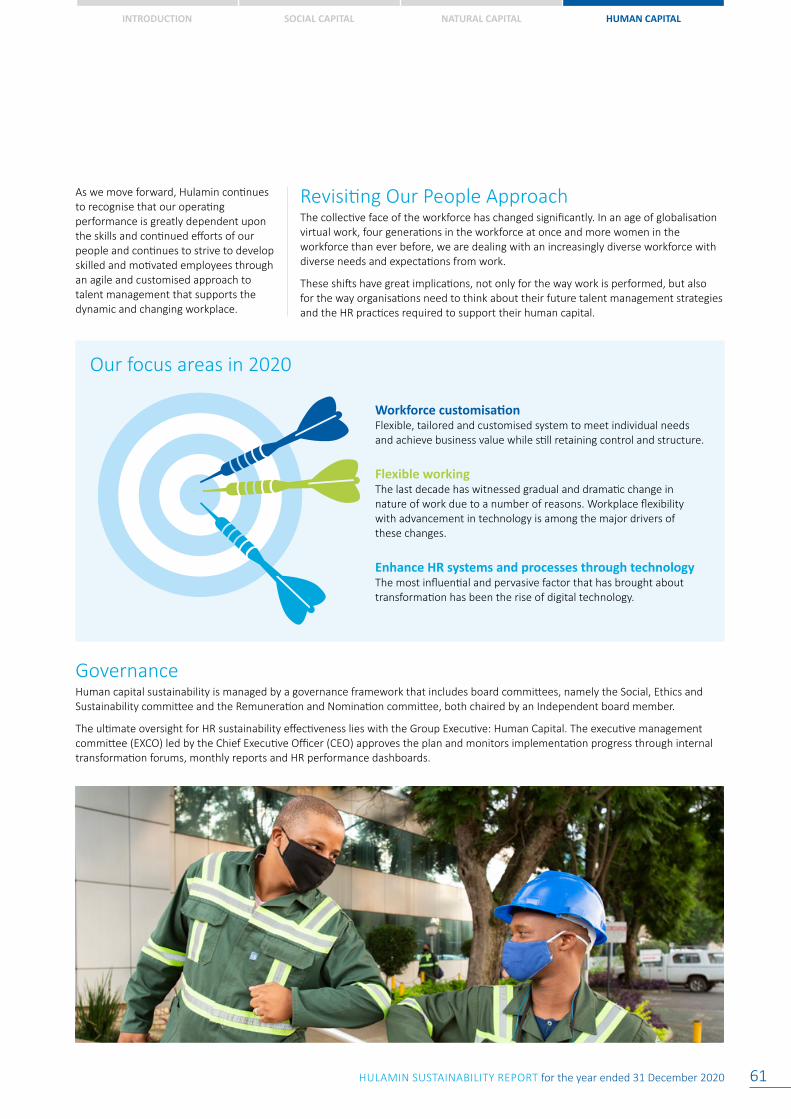
INTRODUCTION SOCIAL CAPITAL NATURAL CAPITAL HUMAN CAPITAL
HULAMIN SUSTAINABILITY REPORT for the year ended 31 December 2020 61
Revisiting Our People ApproachThe collective face of the workforce has changed significantly. In an age of globalisation virtual work, four generations in the workforce at once and more women in the workforce than ever before, we are dealing with an increasingly diverse workforce with diverse needs and expectations from work.
These shifts have great implications, not only for the way work is performed, but also for the way organisations need to think about their future talent management strategies and the HR practices required to support their human capital.
Workforce customisationFlexible, tailored and customised system to meet individual needs and achieve business value while still retaining control and structure.
Our focus areas in 2020
Enhance HR systems and processes through technologyThe most influential and pervasive factor that has brought about transformation has been the rise of digital technology.
Flexible workingThe last decade has witnessed gradual and dramatic change in nature of work due to a number of reasons. Workplace flexibility with advancement in technology is among the major drivers of these changes.
GovernanceHuman capital sustainability is managed by a governance framework that includes board committees, namely the Social, Ethics and Sustainability committee and the Remuneration and Nomination committee, both chaired by an Independent board member.
The ultimate oversight for HR sustainability effectiveness lies with the Group Executive: Human Capital. The executive management committee (EXCO) led by the Chief Executive Officer (CEO) approves the plan and monitors implementation progress through internal transformation forums, monthly reports and HR performance dashboards.
As we move forward, Hulamin continues to recognise that our operating performance is greatly dependent upon the skills and continued efforts of our people and continues to strive to develop skilled and motivated employees through an agile and customised approach to talent management that supports the dynamic and changing workplace.
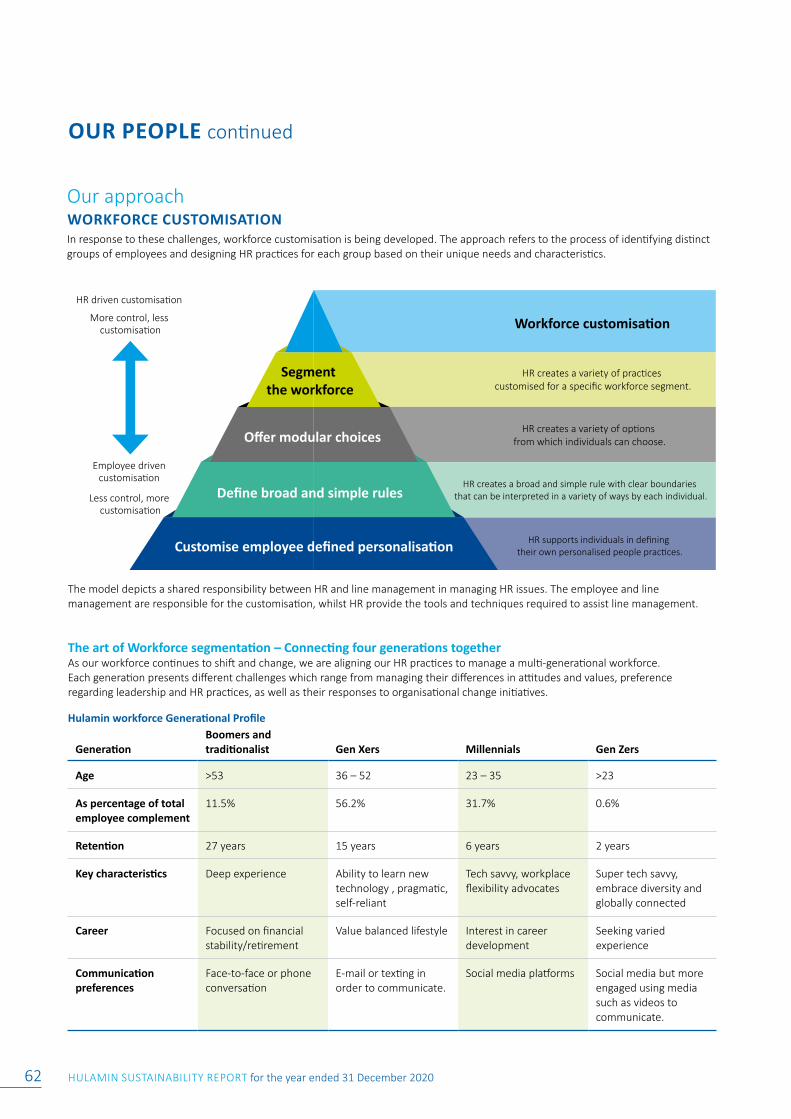
HULAMIN SUSTAINABILITY REPORT for the year ended 31 December 202062
OUR PEOPLE continued
Employee driven customisation
Less control, more customisation
HR driven customisation
More control, less customisation Workforce customisation
Segment the workforce
HR creates a variety of practices customised for a specific workforce segment.
Offer modular choicesHR creates a variety of options
from which individuals can choose.
Define broad and simple rulesHR creates a broad and simple rule with clear boundaries
that can be interpreted in a variety of ways by each individual.
Customise employee defined personalisation HR supports individuals in defining their own personalised people practices.
Our approach WORKFORCE CUSTOMISATIONIn response to these challenges, workforce customisation is being developed. The approach refers to the process of identifying distinct groups of employees and designing HR practices for each group based on their unique needs and characteristics.
The model depicts a shared responsibility between HR and line management in managing HR issues. The employee and line management are responsible for the customisation, whilst HR provide the tools and techniques required to assist line management.
The art of Workforce segmentation – Connecting four generations togetherAs our workforce continues to shift and change, we are aligning our HR practices to manage a multi-generational workforce. Each generation presents different challenges which range from managing their differences in attitudes and values, preference regarding leadership and HR practices, as well as their responses to organisational change initiatives.
Hulamin workforce Generational Profile
GenerationBoomers and traditionalist Gen Xers Millennials Gen Zers
Age >53 36 – 52 23 – 35 >23
As percentage of total employee complement
11.5% 56.2% 31.7% 0.6%
Retention 27 years 15 years 6 years 2 years
Key characteristics Deep experience Ability to learn new technology , pragmatic, self-reliant
Tech savvy, workplace flexibility advocates
Super tech savvy, embrace diversity and globally connected
Career Focused on financial stability/retirement
Value balanced lifestyle Interest in career development
Seeking varied experience
Communication preferences
Face-to-face or phone conversation
E-mail or texting in order to communicate.
Social media platforms Social media but more engaged using media such as videos to communicate.
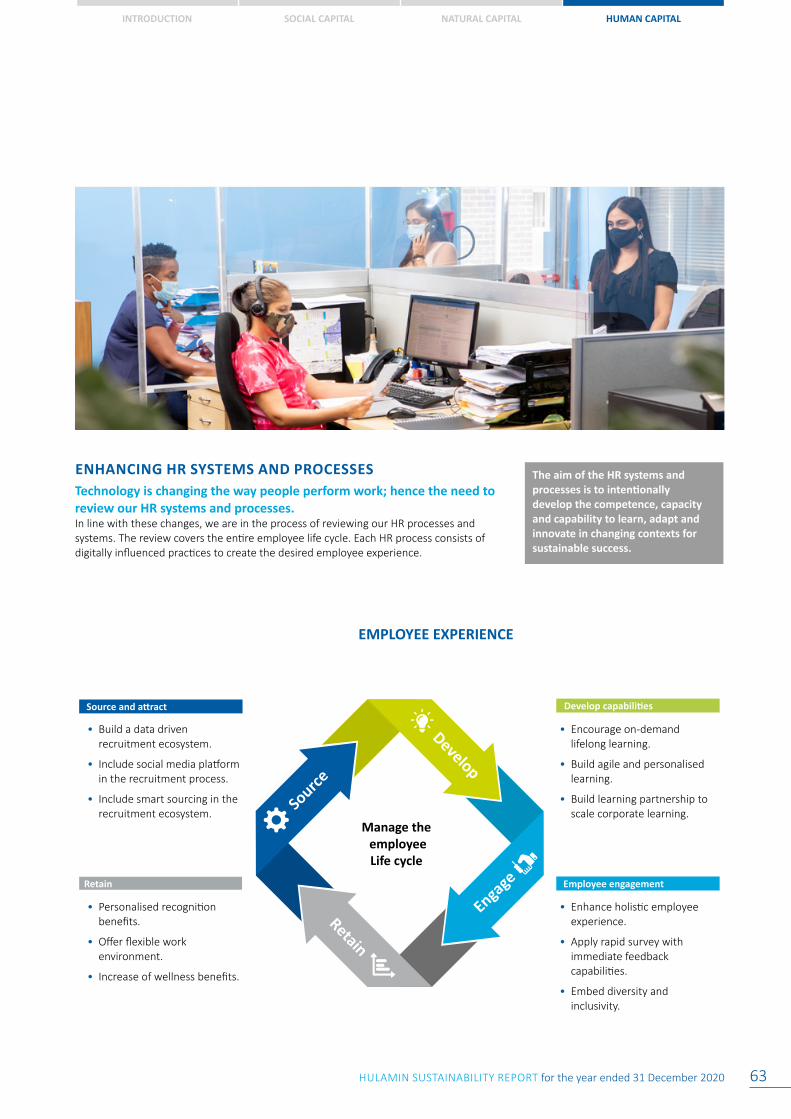
INTRODUCTION SOCIAL CAPITAL NATURAL CAPITAL HUMAN CAPITAL
HULAMIN SUSTAINABILITY REPORT for the year ended 31 December 2020 63
ENHANCING HR SYSTEMS AND PROCESSESTechnology is changing the way people perform work; hence the need to review our HR systems and processes.In line with these changes, we are in the process of reviewing our HR processes and systems. The review covers the entire employee life cycle. Each HR process consists of digitally influenced practices to create the desired employee experience.
The aim of the HR systems and processes is to intentionally develop the competence, capacity and capability to learn, adapt and innovate in changing contexts for sustainable success.
Ex
Develop
Engage
Source
Manage the employeeLife cycle
Retain
EMPLOYEE EXPERIENCE
Source and attract
Source and attract
Develop capabilities
Employee engagement
• Build a data driven recruitment ecosystem.
• Include social media platform in the recruitment process.
• Include smart sourcing in the recruitment ecosystem.
• Personalised recognition benefits.
• Offer flexible work environment.
• Increase of wellness benefits.
• Enhance holistic employee experience.
• Apply rapid survey with immediate feedback capabilities.
• Embed diversity and inclusivity.
• Encourage on-demand lifelong learning.
• Build agile and personalised learning.
• Build learning partnership to scale corporate learning.
Retain
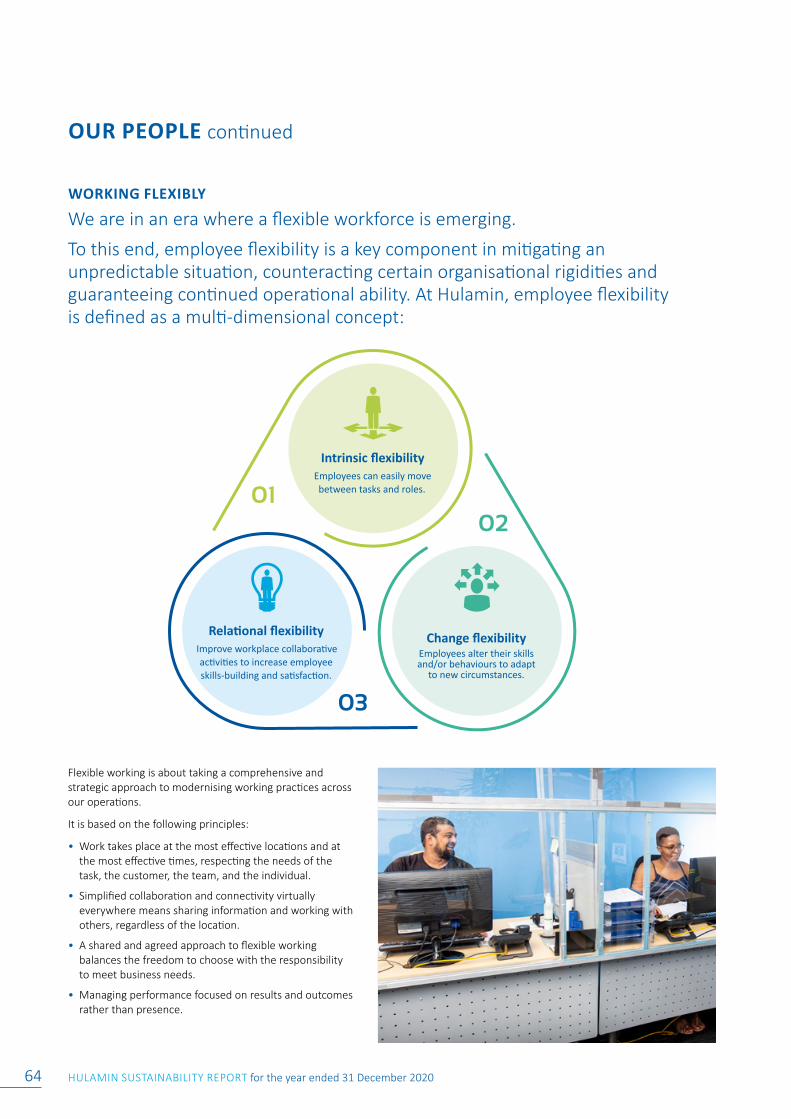
HULAMIN SUSTAINABILITY REPORT for the year ended 31 December 202064
OUR PEOPLE continued
Relational flexibilityImprove workplace collaborative activities to increase employee skills-building and satisfaction.
WORKING FLEXIBLY
We are in an era where a flexible workforce is emerging.
To this end, employee flexibility is a key component in mitigating an unpredictable situation, counteracting certain organisational rigidities and guaranteeing continued operational ability. At Hulamin, employee flexibility is defined as a multi-dimensional concept:
Flexible working is about taking a comprehensive and strategic approach to modernising working practices across our operations.
It is based on the following principles:
• Work takes place at the most effective locations and at the most effective times, respecting the needs of the task, the customer, the team, and the individual.
• Simplified collaboration and connectivity virtually everywhere means sharing information and working with others, regardless of the location.
• A shared and agreed approach to flexible working balances the freedom to choose with the responsibility to meet business needs.
• Managing performance focused on results and outcomes rather than presence.
Intrinsic flexibilityEmployees can easily move between tasks and roles.
Change flexibilityEmployees alter their skills and/or behaviours to adapt
to new circumstances.
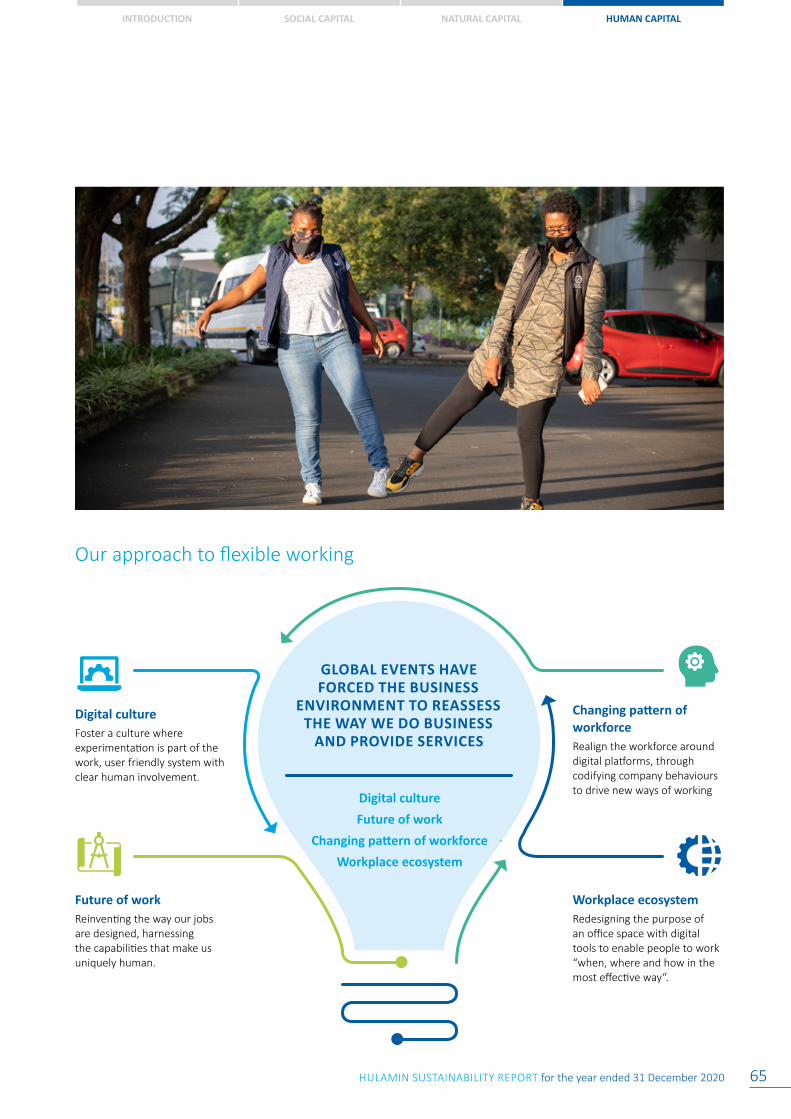
INTRODUCTION SOCIAL CAPITAL NATURAL CAPITAL HUMAN CAPITAL
HULAMIN SUSTAINABILITY REPORT for the year ended 31 December 2020 65
Our approach to flexible working
GLOBAL EVENTS HAVE FORCED THE BUSINESS
ENVIRONMENT TO REASSESS THE WAY WE DO BUSINESS
AND PROVIDE SERVICES
Digital culture
Future of work
Changing pattern of workforce
Workplace ecosystem
Digital culture Foster a culture where experimentation is part of the work, user friendly system with clear human involvement.
Changing pattern of workforce Realign the workforce around digital platforms, through codifying company behaviours to drive new ways of working
Future of workReinventing the way our jobs are designed, harnessing the capabilities that make us uniquely human.
Workplace ecosystemRedesigning the purpose of an office space with digital tools to enable people to work “when, where and how in the most effective way“.
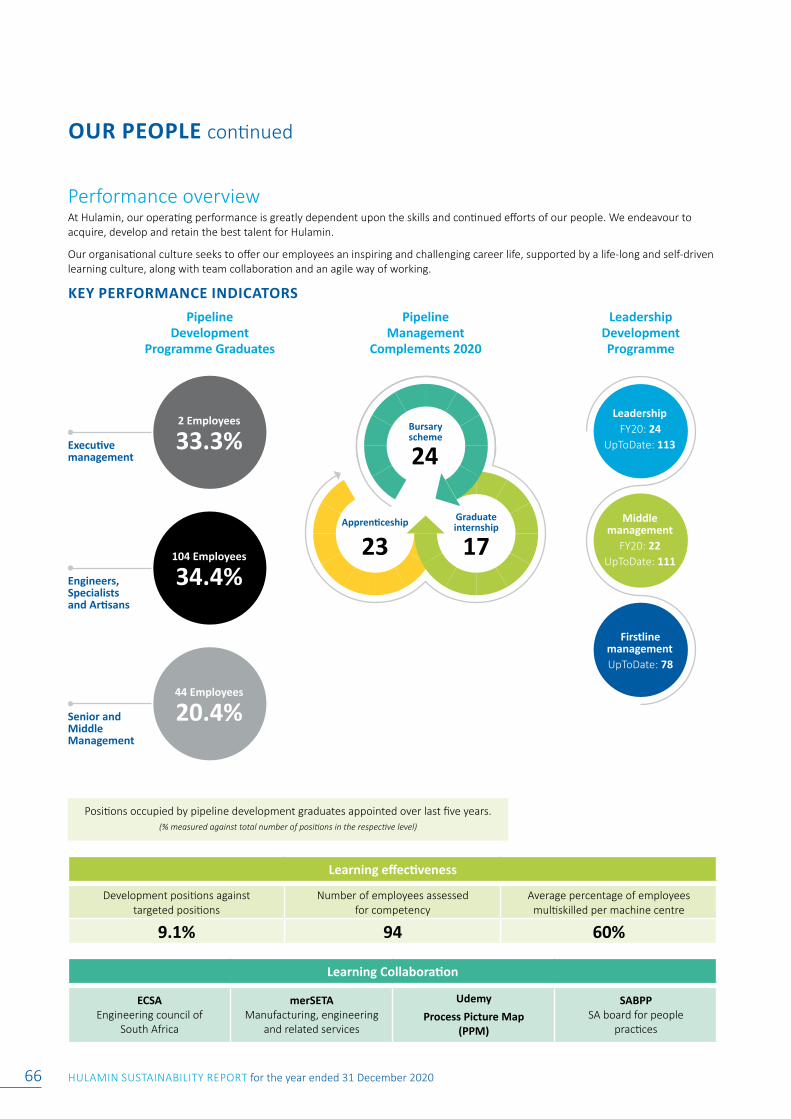
HULAMIN SUSTAINABILITY REPORT for the year ended 31 December 202066
OUR PEOPLE continued
Performance overviewAt Hulamin, our operating performance is greatly dependent upon the skills and continued efforts of our people. We endeavour to acquire, develop and retain the best talent for Hulamin.
Our organisational culture seeks to offer our employees an inspiring and challenging career life, supported by a life-long and self-driven learning culture, along with team collaboration and an agile way of working.
KEY PERFORMANCE INDICATORS
Learning effectiveness
Development positions against targeted positions
Number of employees assessed for competency
Average percentage of employees multiskilled per machine centre
9.1% 94 60%
Learning Collaboration
ECSAEngineering council of
South Africa
merSETAManufacturing, engineering
and related services
Udemy
Process Picture Map (PPM)
SABPPSA board for people
practices
Positions occupied by pipeline development graduates appointed over last five years. (% measured against total number of positions in the respective level)
2 Employees
33.3%
104 Employees
34.4%
44 Employees
20.4%
Leadership FY20: 24
UpToDate: 113
Middle management
FY20: 22UpToDate: 111
Firstline managementUpToDate: 78
Leadership Development Programme
Executive management
Senior and Middle Management
Engineers, Specialists and Artisans
Pipeline Management
Complements 2020
24
1723
Bursary scheme
Apprenticeship Graduate internship
Pipeline Development
Programme Graduates
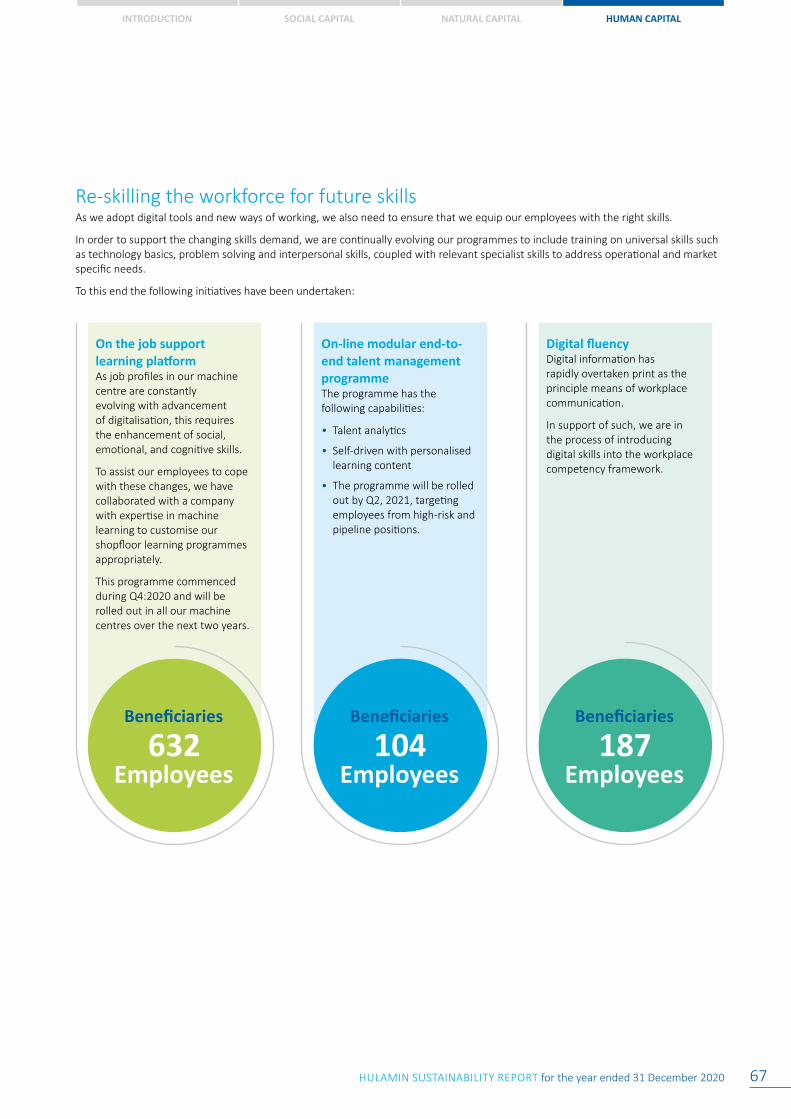
INTRODUCTION SOCIAL CAPITAL NATURAL CAPITAL HUMAN CAPITAL
HULAMIN SUSTAINABILITY REPORT for the year ended 31 December 2020 67
Re-skilling the workforce for future skillsAs we adopt digital tools and new ways of working, we also need to ensure that we equip our employees with the right skills.
In order to support the changing skills demand, we are continually evolving our programmes to include training on universal skills such as technology basics, problem solving and interpersonal skills, coupled with relevant specialist skills to address operational and market specific needs.
To this end the following initiatives have been undertaken:
On the job support learning platformAs job profiles in our machine centre are constantly evolving with advancement of digitalisation, this requires the enhancement of social, emotional, and cognitive skills.
To assist our employees to cope with these changes, we have collaborated with a company with expertise in machine learning to customise our shopfloor learning programmes appropriately.
This programme commenced during Q4:2020 and will be rolled out in all our machine centres over the next two years.
On-line modular end-to-end talent management programmeThe programme has the following capabilities:
• Talent analytics
• Self-driven with personalised learning content
• The programme will be rolled out by Q2, 2021, targeting employees from high-risk and pipeline positions.
Digital fluencyDigital information has rapidly overtaken print as the principle means of workplace communication.
In support of such, we are in the process of introducing digital skills into the workplace competency framework.
Beneficiaries
632 Employees
Beneficiaries
104 Employees
Beneficiaries
187 Employees
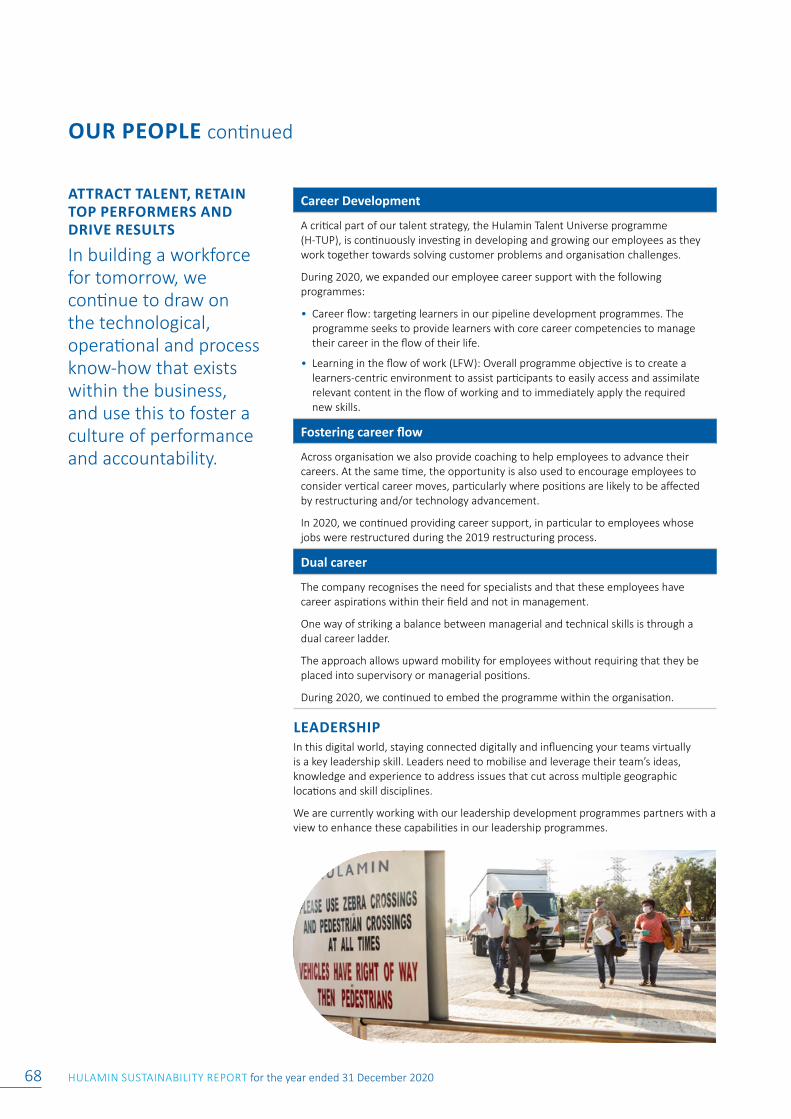
HULAMIN SUSTAINABILITY REPORT for the year ended 31 December 202068
OUR PEOPLE continued
LEADERSHIPIn this digital world, staying connected digitally and influencing your teams virtually is a key leadership skill. Leaders need to mobilise and leverage their team’s ideas, knowledge and experience to address issues that cut across multiple geographic locations and skill disciplines.
We are currently working with our leadership development programmes partners with a view to enhance these capabilities in our leadership programmes.
ATTRACT TALENT, RETAIN TOP PERFORMERS AND DRIVE RESULTS
In building a workforce for tomorrow, we continue to draw on the technological, operational and process know-how that exists within the business, and use this to foster a culture of performance and accountability.
Career Development
A critical part of our talent strategy, the Hulamin Talent Universe programme (H-TUP), is continuously investing in developing and growing our employees as they work together towards solving customer problems and organisation challenges.
During 2020, we expanded our employee career support with the following programmes:
• Career flow: targeting learners in our pipeline development programmes. The programme seeks to provide learners with core career competencies to manage their career in the flow of their life.
• Learning in the flow of work (LFW): Overall programme objective is to create a learners-centric environment to assist participants to easily access and assimilate relevant content in the flow of working and to immediately apply the required new skills.
Fostering career flow
Across organisation we also provide coaching to help employees to advance their careers. At the same time, the opportunity is also used to encourage employees to consider vertical career moves, particularly where positions are likely to be affected by restructuring and/or technology advancement.
In 2020, we continued providing career support, in particular to employees whose jobs were restructured during the 2019 restructuring process.
Dual career
The company recognises the need for specialists and that these employees have career aspirations within their field and not in management.
One way of striking a balance between managerial and technical skills is through a dual career ladder.
The approach allows upward mobility for employees without requiring that they be placed into supervisory or managerial positions.
During 2020, we continued to embed the programme within the organisation.
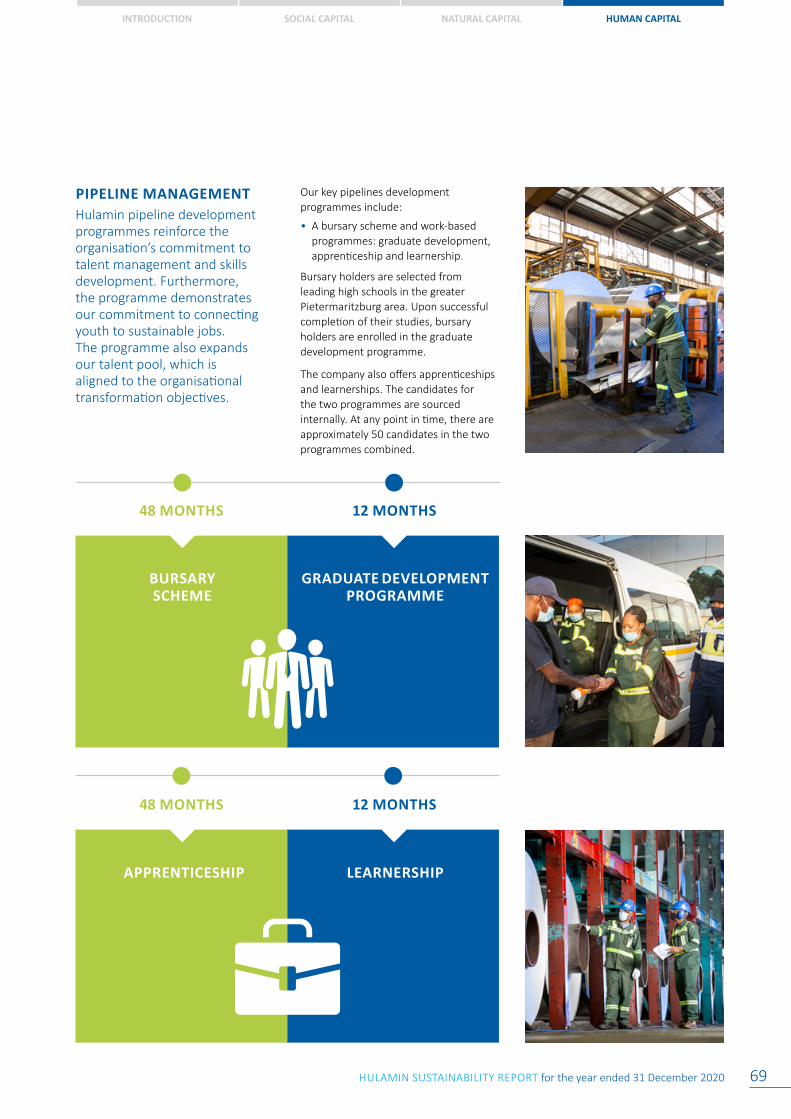
INTRODUCTION SOCIAL CAPITAL NATURAL CAPITAL HUMAN CAPITAL
HULAMIN SUSTAINABILITY REPORT for the year ended 31 December 2020 69
PIPELINE MANAGEMENTHulamin pipeline development programmes reinforce the organisation’s commitment to talent management and skills development. Furthermore, the programme demonstrates our commitment to connecting youth to sustainable jobs. The programme also expands our talent pool, which is aligned to the organisational transformation objectives.
Our key pipelines development programmes include:
• A bursary scheme and work-based programmes: graduate development, apprenticeship and learnership.
Bursary holders are selected from leading high schools in the greater Pietermaritzburg area. Upon successful completion of their studies, bursary holders are enrolled in the graduate development programme.
The company also offers apprenticeships and learnerships. The candidates for the two programmes are sourced internally. At any point in time, there are approximately 50 candidates in the two programmes combined.
48 MONTHS
48 MONTHS
12 MONTHS
12 MONTHS
BURSARY SCHEME
APPRENTICESHIP
GRADUATE DEVELOPMENT PROGRAMME
LEARNERSHIP
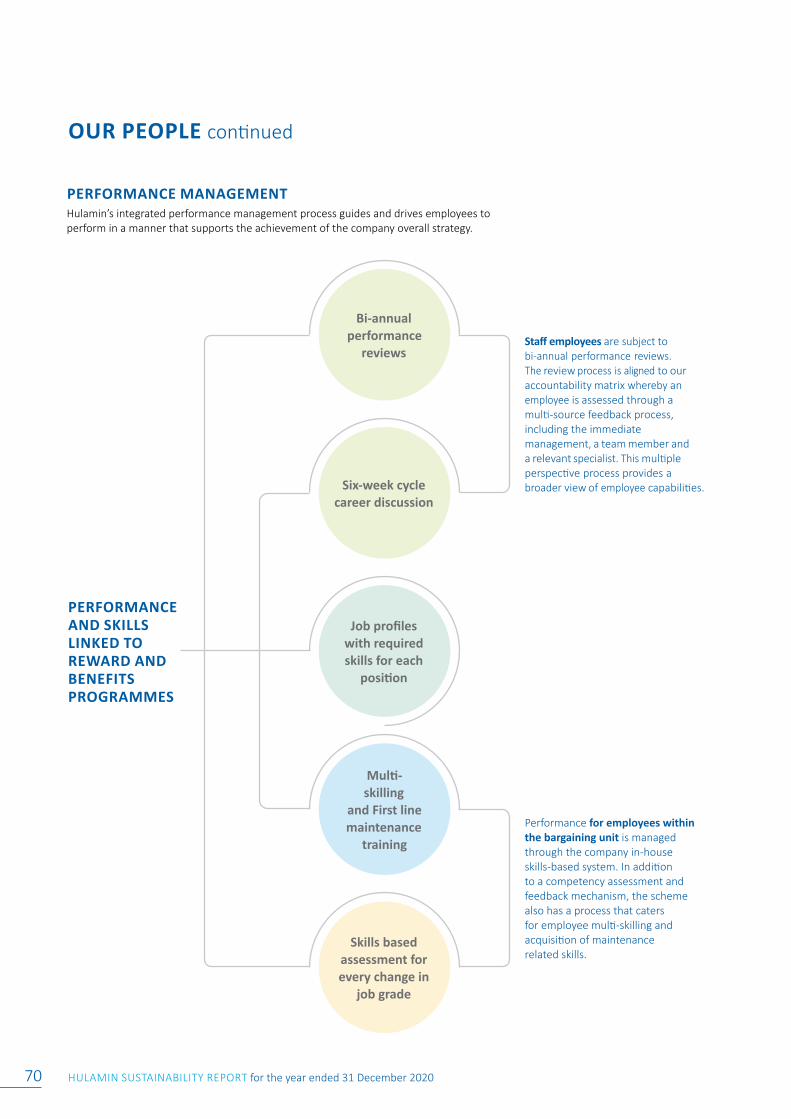
HULAMIN SUSTAINABILITY REPORT for the year ended 31 December 202070
OUR PEOPLE continued
PERFORMANCE MANAGEMENTHulamin’s integrated performance management process guides and drives employees to perform in a manner that supports the achievement of the company overall strategy.
Staff employees are subject to bi-annual performance reviews. The review process is aligned to our accountability matrix whereby an employee is assessed through a multi-source feedback process, including the immediate management, a team member and a relevant specialist. This multiple perspective process provides a broader view of employee capabilities.
Skills based assessment for every change in
job grade
Multi-skilling
and First line maintenance
training
Job profiles with required skills for each
position
Six-week cycle career discussion
Bi-annual performance
reviews
PERFORMANCE AND SKILLS LINKED TO REWARD AND BENEFITS PROGRAMMES
Performance for employees within the bargaining unit is managed through the company in-house skills-based system. In addition to a competency assessment and feedback mechanism, the scheme also has a process that caters for employee multi-skilling and acquisition of maintenance related skills.
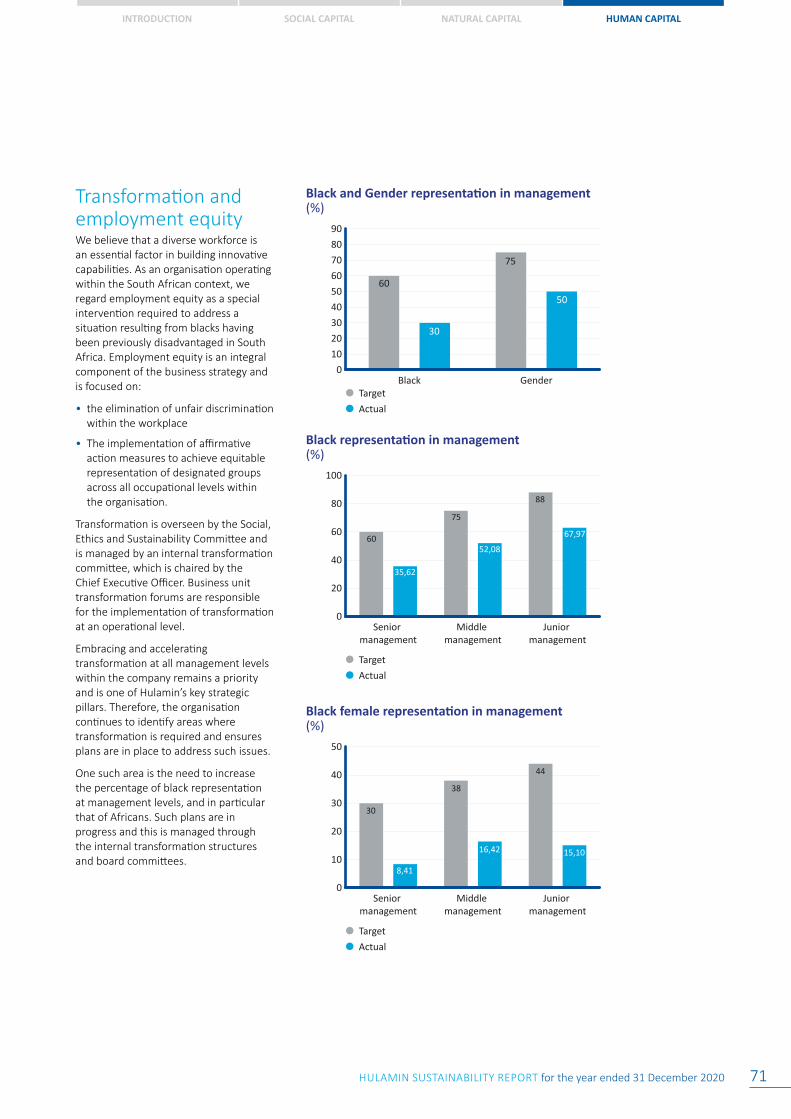
INTRODUCTION SOCIAL CAPITAL NATURAL CAPITAL HUMAN CAPITAL
HULAMIN SUSTAINABILITY REPORT for the year ended 31 December 2020 71
Transformation and employment equityWe believe that a diverse workforce is an essential factor in building innovative capabilities. As an organisation operating within the South African context, we regard employment equity as a special intervention required to address a situation resulting from blacks having been previously disadvantaged in South Africa. Employment equity is an integral component of the business strategy and is focused on:
• the elimination of unfair discrimination within the workplace
• The implementation of affirmative action measures to achieve equitable representation of designated groups across all occupational levels within the organisation.
Transformation is overseen by the Social, Ethics and Sustainability Committee and is managed by an internal transformation committee, which is chaired by the Chief Executive Officer. Business unit transformation forums are responsible for the implementation of transformation at an operational level.
Embracing and accelerating transformation at all management levels within the company remains a priority and is one of Hulamin’s key strategic pillars. Therefore, the organisation continues to identify areas where transformation is required and ensures plans are in place to address such issues.
One such area is the need to increase the percentage of black representation at management levels, and in particular that of Africans. Such plans are in progress and this is managed through the internal transformation structures and board committees.
0
10
20
30
40
50
60
70
80
90
GenderBlack
Black and Gender representation in management(%) Black and Gender representation in management(%)
60
75
30
50
Target
Actual
Black representation in management (%) Black representation in management (%)
0
20
40
60
80
100
Junior management
Middle management
Senior management
60
75
88
35,62
52,08
67,97
Target
Actual
Black female representation in management (%) Black female representation in management (%)
0
10
20
30
40
50
Junior management
Middle management
Senior management
30
38
44
8,41
16,42 15,10
Target
Actual
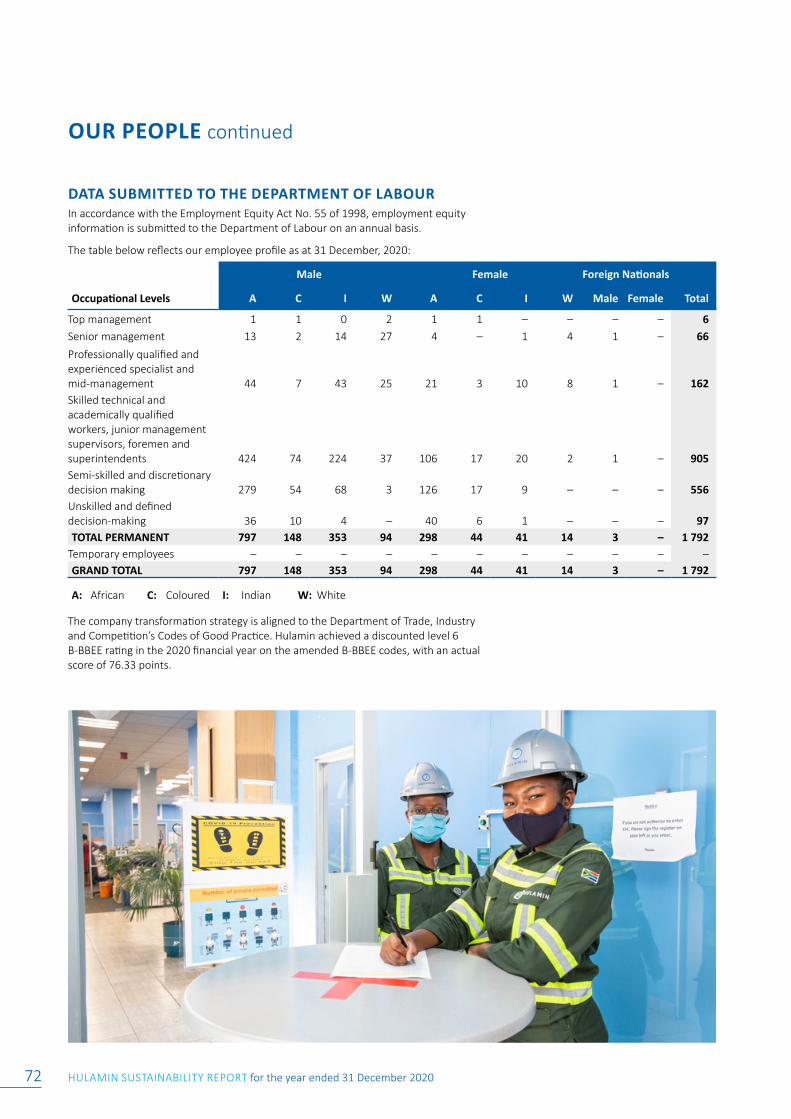
HULAMIN SUSTAINABILITY REPORT for the year ended 31 December 202072
OUR PEOPLE continued
DATA SUBMITTED TO THE DEPARTMENT OF LABOURIn accordance with the Employment Equity Act No. 55 of 1998, employment equity information is submitted to the Department of Labour on an annual basis.
The table below reflects our employee profile as at 31 December, 2020:
Male Female Foreign Nationals
Occupational Levels A C I W A C I W Male Female Total
Top management 1 1 0 2 1 1 – – – – 6Senior management 13 2 14 27 4 – 1 4 1 – 66
Professionally qualified and experienced specialist and mid-management 44 7 43 25 21 3 10 8 1 – 162Skilled technical and academically qualified workers, junior management supervisors, foremen and superintendents 424 74 224 37 106 17 20 2 1 – 905Semi-skilled and discretionary decision making 279 54 68 3 126 17 9 – – – 556Unskilled and defined decision-making 36 10 4 – 40 6 1 – – – 97TOTAL PERMANENT 797 148 353 94 298 44 41 14 3 – 1 792
Temporary employees – – – – – – – – – – –GRAND TOTAL 797 148 353 94 298 44 41 14 3 – 1 792
A: African C: Coloured I: Indian W: White
The company transformation strategy is aligned to the Department of Trade, Industry and Competition’s Codes of Good Practice. Hulamin achieved a discounted level 6 B-BBEE rating in the 2020 financial year on the amended B-BBEE codes, with an actual score of 76.33 points.
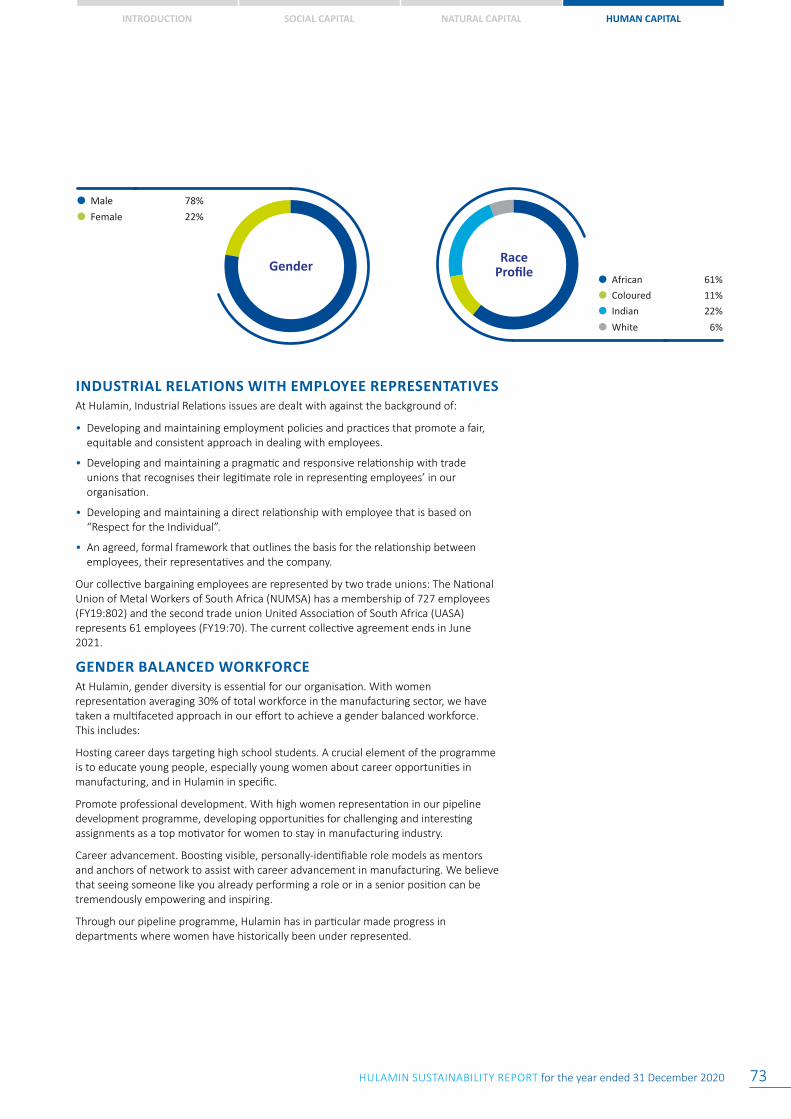
INTRODUCTION SOCIAL CAPITAL NATURAL CAPITAL HUMAN CAPITAL
HULAMIN SUSTAINABILITY REPORT for the year ended 31 December 2020 73
African 61%
White 6%
Coloured 11%
Indian 22%
RaceProfile
Male 78%
Female 22%
Gender
INDUSTRIAL RELATIONS WITH EMPLOYEE REPRESENTATIVESAt Hulamin, Industrial Relations issues are dealt with against the background of:
• Developing and maintaining employment policies and practices that promote a fair, equitable and consistent approach in dealing with employees.
• Developing and maintaining a pragmatic and responsive relationship with trade unions that recognises their legitimate role in representing employees’ in our organisation.
• Developing and maintaining a direct relationship with employee that is based on “Respect for the Individual”.
• An agreed, formal framework that outlines the basis for the relationship between employees, their representatives and the company.
Our collective bargaining employees are represented by two trade unions: The National Union of Metal Workers of South Africa (NUMSA) has a membership of 727 employees (FY19:802) and the second trade union United Association of South Africa (UASA) represents 61 employees (FY19:70). The current collective agreement ends in June 2021.
GENDER BALANCED WORKFORCE At Hulamin, gender diversity is essential for our organisation. With women representation averaging 30% of total workforce in the manufacturing sector, we have taken a multifaceted approach in our effort to achieve a gender balanced workforce. This includes:
Hosting career days targeting high school students. A crucial element of the programme is to educate young people, especially young women about career opportunities in manufacturing, and in Hulamin in specific.
Promote professional development. With high women representation in our pipeline development programme, developing opportunities for challenging and interesting assignments as a top motivator for women to stay in manufacturing industry.
Career advancement. Boosting visible, personally-identifiable role models as mentors and anchors of network to assist with career advancement in manufacturing. We believe that seeing someone like you already performing a role or in a senior position can be tremendously empowering and inspiring.
Through our pipeline programme, Hulamin has in particular made progress in departments where women have historically been under represented.
HULAMIN SUSTAINABILITY REPORT for the year ended 31 December 202074
At Hulamin we are committed to the wellbeing of employees and to the provision of a safe working environment that ensures that the business continues to function effectively and efficiently.We also continue to focus on enhancing our safety systems and acquiring the most recent industrial safety standards, in order to eliminate or minimise harm from risks and hazards. It is important for us to ensure that our machines are operated safely and that employees are protected from injury or harm. Hulamin seeks to continuously improve its safety performance by measuring and monitoring both leading and lagging indicators, which are aligned with the industry’s best practices.
GovernanceThe Hulamin Executive Team is accountable for safety. There are formal structures in place to identify, evaluate and control operational risks. The Hulamin Safety, Health and Environmental, and Risk committees formulate the strategy and standards, and drive the principles of management commitment through Visible Felt Leadership.
The three-way accountability model (team, line, and specialist) ensures that all employees and contractors are aware of their roles, responsibilities, and routines.
With the withdrawal of the OHSAS 18001 (Occupational Health and Safety) management standard, Hulamin has migrated to ISO 45001:2018 (International Organization for Standardization) for verification and compliance. A successful certification audit was conducted during November 2020.
SAFETY
ApproachThe safety strategy was reviewed during the latter part of 2017. The vision remains “zero harm” and this is supported by our mission of “living our values”. The strategy has been developed to focus on three key elements:
• Paper. This element includes all documented systems and review processes. The fundamental aspect of this element is to identify and manage risks.
• Plant. This includes all physical components of the operational process (e.g., equipment, product, materials and tools). The fundamental aspect of this element is to ensure the correct component and that the component is in good condition.
• People. This element consists of two parts: supervision and individuals.
Supervision focuses on leaders carrying out active management, which requires them to:
» Be there
» Look to see
» Appreciate the risk
» Address appropriately
» Ensure compliance
Individuals need to be knowledgeable through training, skilled through monitoring and coaching, and have the correct attitude through coaching and consequence management.
This safety strategy is underpinned by the following principles:
• Risk-based approach
• Caring leadership
• Competent and committed workforce
• Best-practice solutions
• Compliance with legal and statutory requirements
• Principles-based versus rules-based approach
This systematic approach utilises the “Plan-Do-Check-Act” principle. The ISO 45001:2018 (OH&S) Occupational, Health and Safety Management System is used for the framework of risk management.
Safety performance is tracked by means of a scorecard that reflects both leading and lagging indicators. Emphasis is placed on ensuring that we measure the correct leading indicators in order to achieve optimum results.
CARING LEADERSHIPDuring the latter part of 2020, Hulamin was in talks with StratisQ Africa on the subject of “people-driven safety” (PDS). Based on organisational development (OD) principles and best practice, the process engages all organisational levels, teams and individuals in a task – or sequence of tasks – aimed at the improvement of safe behaviours, individual development, and the enhancement of business competitiveness. PDS consists of three fundamentals: commitment to safety; readiness to embrace safety values and change; and the safety mindset of the workforce.
COMPETENT AND COMMITTED WORKFORCEA competent and committed workforce starts with caring leadership. Training, development and coaching also contributes significantly towards this key principle. Hulamin continues to invest in safety training and development programmes to upskill employees’ understanding of safety.
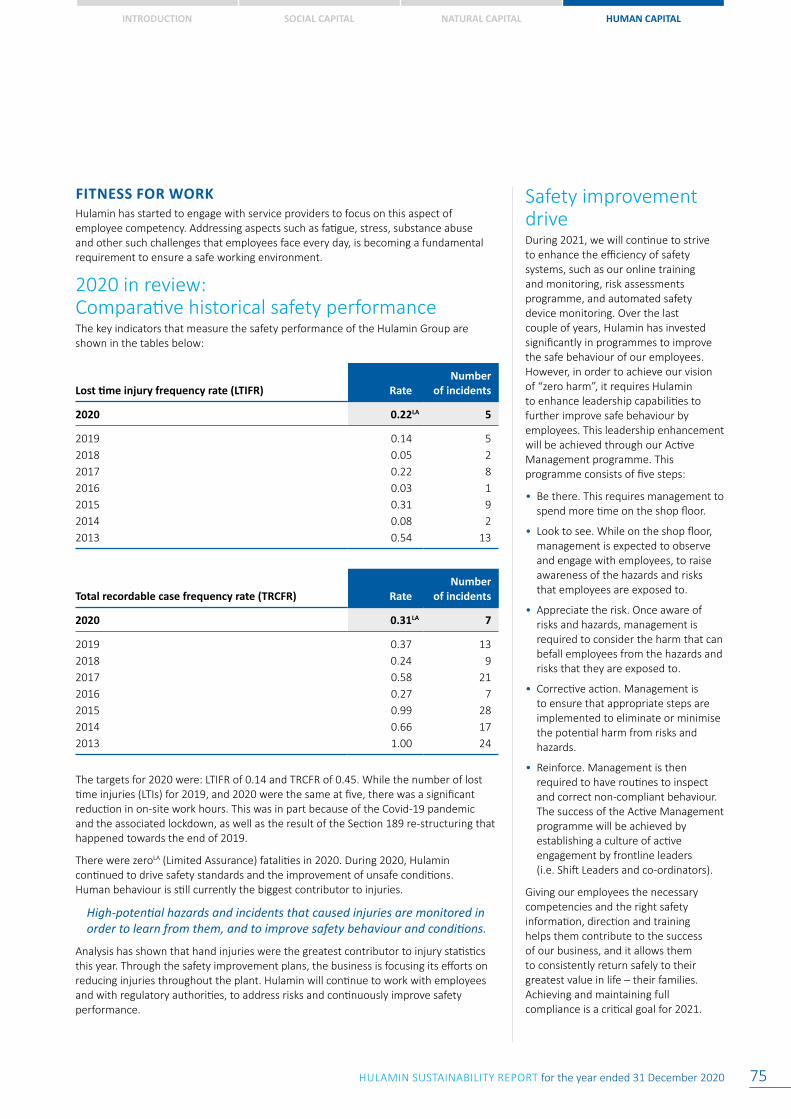
INTRODUCTION SOCIAL CAPITAL NATURAL CAPITAL HUMAN CAPITAL
HULAMIN SUSTAINABILITY REPORT for the year ended 31 December 2020 75
FITNESS FOR WORK Hulamin has started to engage with service providers to focus on this aspect of employee competency. Addressing aspects such as fatigue, stress, substance abuse and other such challenges that employees face every day, is becoming a fundamental requirement to ensure a safe working environment.
2020 in review: Comparative historical safety performanceThe key indicators that measure the safety performance of the Hulamin Group are shown in the tables below:
Safety improvement driveDuring 2021, we will continue to strive to enhance the efficiency of safety systems, such as our online training and monitoring, risk assessments programme, and automated safety device monitoring. Over the last couple of years, Hulamin has invested significantly in programmes to improve the safe behaviour of our employees. However, in order to achieve our vision of “zero harm”, it requires Hulamin to enhance leadership capabilities to further improve safe behaviour by employees. This leadership enhancement will be achieved through our Active Management programme. This programme consists of five steps:
• Be there. This requires management to spend more time on the shop floor.
• Look to see. While on the shop floor, management is expected to observe and engage with employees, to raise awareness of the hazards and risks that employees are exposed to.
• Appreciate the risk. Once aware of risks and hazards, management is required to consider the harm that can befall employees from the hazards and risks that they are exposed to.
• Corrective action. Management is to ensure that appropriate steps are implemented to eliminate or minimise the potential harm from risks and hazards.
• Reinforce. Management is then required to have routines to inspect and correct non-compliant behaviour. The success of the Active Management programme will be achieved by establishing a culture of active engagement by frontline leaders (i.e. Shift Leaders and co-ordinators).
Giving our employees the necessary competencies and the right safety information, direction and training helps them contribute to the success of our business, and it allows them to consistently return safely to their greatest value in life – their families. Achieving and maintaining full compliance is a critical goal for 2021.
Lost time injury frequency rate (LTIFR) RateNumber
of incidents
2020 0.22LA 5
2019 0.14 52018 0.05 22017 0.22 82016 0.03 12015 0.31 92014 0.08 22013 0.54 13
Total recordable case frequency rate (TRCFR) RateNumber
of incidents
2020 0.31LA 7
2019 0.37 132018 0.24 92017 0.58 212016 0.27 72015 0.99 282014 0.66 172013 1.00 24
The targets for 2020 were: LTIFR of 0.14 and TRCFR of 0.45. While the number of lost time injuries (LTIs) for 2019, and 2020 were the same at five, there was a significant reduction in on-site work hours. This was in part because of the Covid-19 pandemic and the associated lockdown, as well as the result of the Section 189 re-structuring that happened towards the end of 2019.
There were zeroLA (Limited Assurance) fatalities in 2020. During 2020, Hulamin continued to drive safety standards and the improvement of unsafe conditions. Human behaviour is still currently the biggest contributor to injuries.
High-potential hazards and incidents that caused injuries are monitored in order to learn from them, and to improve safety behaviour and conditions.
Analysis has shown that hand injuries were the greatest contributor to injury statistics this year. Through the safety improvement plans, the business is focusing its efforts on reducing injuries throughout the plant. Hulamin will continue to work with employees and with regulatory authorities, to address risks and continuously improve safety performance.
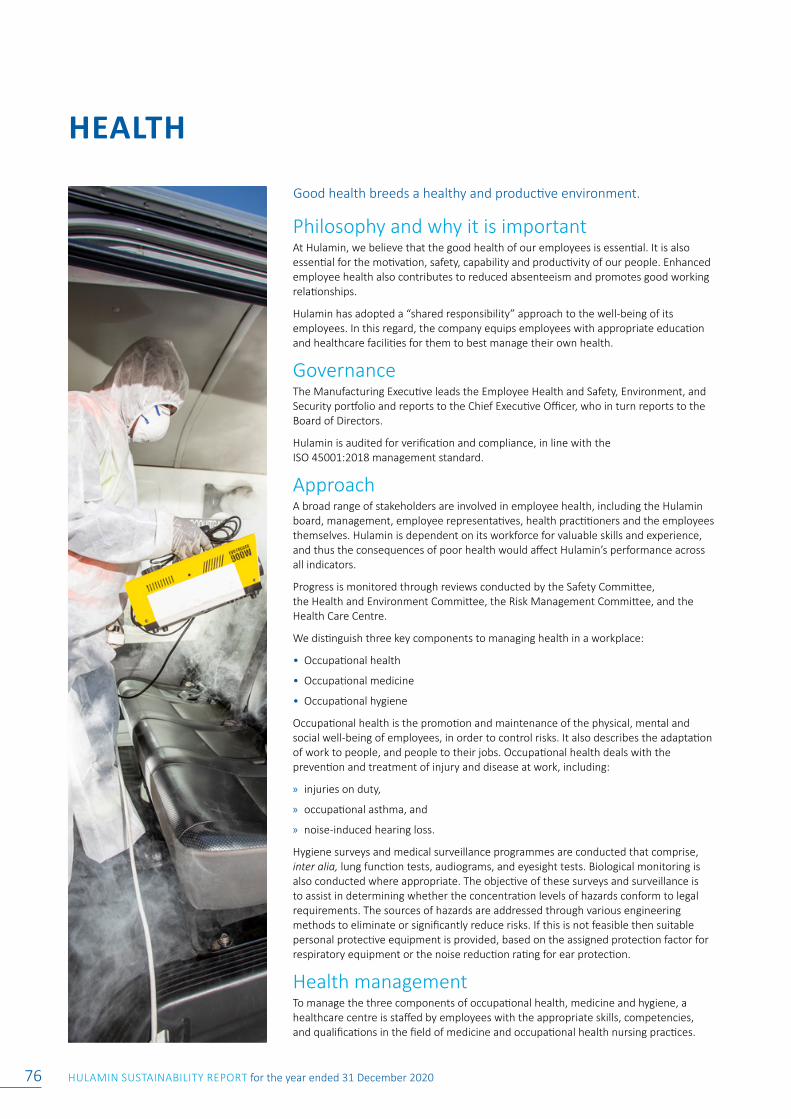
HULAMIN SUSTAINABILITY REPORT for the year ended 31 December 202076
HEALTH
Philosophy and why it is importantAt Hulamin, we believe that the good health of our employees is essential. It is also essential for the motivation, safety, capability and productivity of our people. Enhanced employee health also contributes to reduced absenteeism and promotes good working relationships.
Hulamin has adopted a “shared responsibility” approach to the well-being of its employees. In this regard, the company equips employees with appropriate education and healthcare facilities for them to best manage their own health.
GovernanceThe Manufacturing Executive leads the Employee Health and Safety, Environment, and Security portfolio and reports to the Chief Executive Officer, who in turn reports to the Board of Directors.
Hulamin is audited for verification and compliance, in line with the ISO 45001:2018 management standard.
ApproachA broad range of stakeholders are involved in employee health, including the Hulamin board, management, employee representatives, health practitioners and the employees themselves. Hulamin is dependent on its workforce for valuable skills and experience, and thus the consequences of poor health would affect Hulamin’s performance across all indicators.
Progress is monitored through reviews conducted by the Safety Committee, the Health and Environment Committee, the Risk Management Committee, and the Health Care Centre.
We distinguish three key components to managing health in a workplace:
• Occupational health
• Occupational medicine
• Occupational hygiene
Occupational health is the promotion and maintenance of the physical, mental and social well-being of employees, in order to control risks. It also describes the adaptation of work to people, and people to their jobs. Occupational health deals with the prevention and treatment of injury and disease at work, including:
» injuries on duty,
» occupational asthma, and
» noise-induced hearing loss.
Hygiene surveys and medical surveillance programmes are conducted that comprise, inter alia, lung function tests, audiograms, and eyesight tests. Biological monitoring is also conducted where appropriate. The objective of these surveys and surveillance is to assist in determining whether the concentration levels of hazards conform to legal requirements. The sources of hazards are addressed through various engineering methods to eliminate or significantly reduce risks. If this is not feasible then suitable personal protective equipment is provided, based on the assigned protection factor for respiratory equipment or the noise reduction rating for ear protection.
Health managementTo manage the three components of occupational health, medicine and hygiene, a healthcare centre is staffed by employees with the appropriate skills, competencies, and qualifications in the field of medicine and occupational health nursing practices.
Good health breeds a healthy and productive environment.
INTRODUCTION SOCIAL CAPITAL NATURAL CAPITAL HUMAN CAPITAL
HULAMIN SUSTAINABILITY REPORT for the year ended 31 December 2020 77
The Hulamin clinic provides a comprehensive medical surveillance programme to our employees. This programme is tailored around health risks that may have been identified by the occupational hygiene surveys conducted in the manufacturing departments.
Annual audiometric testing allows for early detection of hearing loss and intervention where required. Sight screening identifies employees with reduced visual acuity and the necessary interventions required. Medical surveillance also provides employees with the opportunity to acquire an individual health profile and all employees are encouraged to be proactive about their health, as opposed to being reactive to ailments and illnesses.
A primary healthcare service is provided by the clinic to assist with the treatment of minor ailments and illnesses. Advice, guidance, counselling and referrals are given where needed, and flu vaccines are offered to employees every year. Health and lifestyle issues are addressed, and ongoing relevant education and advice is given.
Non-medical aid employees are assisted by the clinic in the management of all chronic conditions. This includes diagnosis and treatment, education, ongoing monitoring, and follow-up. This service is provided onsite and helps reduce time spent off-site for monitoring, treatment and reviews. The clinic also provides opportunities throughout the year for employees who wish to undergo HIV counselling and testing. Pre-employment medicals are performed on all new recruits to determine a baseline health profile for each employee. Exit medicals are done on all employees leaving the company, documenting the status of health on departure.
2020 In reviewThere were zero (0)LA noise-induced hearing loss (NIHL) claims reported in 2020 and zero (0)LA cases of occupational dermatitis reported.
Total HIV management costs for 2020 amounted to R340 317.99LA, compared to R288 150.00LA the previous year. The HIV management programme entered its 16th year in 2020 and continues to assist approximately 60 non-medical aid employees with support, treatment and surveillance.
HULAMIN AND COVID-19The Covid-19 crisis continues to be a systemic shock to all businesses across the globe.
Health and safety is an immediate priority at Hulamin, and this includes the physical and mental wellbeing of our employees, customers, contractors, and other stakeholders.
When the pandemic affected South Africa in early 2020, it also had an impact on Hulamin. To ensure speedy decision making and response, a Command Council (crisis management team) was established to mobilise relevant skills across the organisation to oversee major issues, formulate business contingency plans, and co-ordinate and align implementation across all departments, as set out in the Directive and the Regulations.
The Regulations issued in terms of section 27(2) of the Disaster Management Act, 2002 (Regulations), and the Covid-19 Direction on Health and Safety in the Workplace issued by the Department of Employment and Labour (Directive), set out specific measures that employers are required to take to protect their employees from Covid-19 in the workplace.
It is important to note that Hulamin made a concerted effort to screen and test all their employees and contractors. It is with deep sadness and regret, however, that we recorded four Covid-19 related deaths during 2020.
We convey our heartfelt condolences to the loved ones of the departed. We will remain hopeful as we continue to focus on strengthening our safety culture and controls further during these challenging times.

www.hulamin.com