Embed Size (px)
Citation preview

March | 2018
THINK Executive White Paper Series
A Collaboration Between

Disclaimer, Limitation of Liability and Terms of Use
NUS and contributors own the information contained in this report, we are licensed by the contributors to reproduce the information
or we are authorised to reproduce it.
Please note that you are not authorised to distribute, copy, reproduce or display this report, any other pages within this report or
any section thereof, in any form or manner, for commercial gain or otherwise, and you may only use the information for your own
internal purposes. You are forbidden from collecting information from this report and incorporating it into your own database,
products or documents. If you undertake any of these prohibited activities we put you on notice that you are breaching our and our
licensors' intellectual property rights in the report and we reserve the right to take action against you to uphold our rights, which may
involve pursuing injunctive proceedings.
The information contained in this report has been compiled from sources believed to be reliable but no warranty, expressed or
implied, is given that the information is complete or accurate nor that it is fit for a particular purpose. All such warranties are expressly
disclaimed and excluded.
To the full extent permissible by law, NUS shall have no liability for any damage or loss (including, without limitation, financial loss,
loss of profits, loss of business or any indirect or consequential loss), however it arises, resulting from the use of or inability to use
this report or any material appearing on it or from any action or decision taken or not taken as a result of using the report or any
such material.

Presented at:
THINK EXECUTIVE SUMMIT: DIGITAL TRANSFORMATION OF SUPPLY CHAINS
2 March 2018
Singapore

Digital Transformation of Supply Chains
1
EXECUTIVE SUMMARY
The advent of digitalization is upon us. It is pervasive and ubiquitous. Supply chains which previously had
inventory as a lubricant to maintain flows, albeit hiding all but the tip of the iceberg, now additionally have
to contend with data as the new currency too. A currency that is omnipresent but not sufficiently leveraged.
Artificial Intelligence (AI) power has uncovered not only the hidden opportunities but also set the agenda for
transformation of the very core of business. Digitalization in supply chains ranges from sensing, the Internet
of Things (IOT), through simulation and computational modelling all the way through integrated decision
support via platforms that encompass visualization, scenario experimentation, dashboards and decision
analysis. This whitepaper sets out the research agenda supported by experts’ perspectives and field studies.
In the first section, the white paper focusses on the agenda for digitalization in supply chains. In Chapter 1,
the Institute positions its work to date on digitalization through cases and applications and advocates a call
to action via a new AI-powered orchestration platform that enhances transparency, collaboration and
flexibility. Chapter 2, positions Industry 4.0 that proclaims do-or-die transformation in the disruptive world
of a proliferation of digital technologies.
In the second section, the emphasis is on digital methods in managing potential disruptions and to ascertain
the resilience and robustness of networks. In Chapter 3, the concept of urban analytics from the perspective
of a focal company is presented for quick and reliable detection of disturbances, threats and bottlenecks.
Chapter 4 continues the discussion of risk management but with an emphasis on the focal company’s
suppliers. It builds out their risk profiles through indices and provides for an integrated perspective through
methodological simulation and visualization.
In the third section, the emphasis shifts to simulation and computational modelling. Chapter 5 sets out an
overarching view on the challenges and methodologies for digitalizing the real world through models that
can be dynamically tuned and optimized to achieve insights and agility in the digital age. In Chapter 6, a case
study is presented on collaborative coordination mechanisms in practice. It shows that digitalization has
massive potential to break away from silo decentralization to a facilitated-function control tower.
Chapters 7 and 8 delve deeply into decision support in healthcare and humanitarian logistics. Chapter 7
presents ground breaking work to enhance the productivity and reduce the bottlenecks of processes related
to the different supply chains of several hospitals in Singapore. The challenges are to build capabilities to
support hospitals in their business model transformation leveraging smart decision technologies and in
readiness for robotics and automation applications. Chapter 8, brings digital decision support to a very
traditional field of humanitarian logistics with Indonesia as the backdrop. The challenge was to effectively
determine optimal pre-positioning of stocks and optimize the distribution in critical time down to the last
mile.

Digital Transformation of Supply Chains
2
In summary, this white paper positions wide ranging digitalization work in supply chain and logistics
transformation. The intent is to create dialogue at the Think Executive session and set forth a call to join us
in this journey as research collaborators. I hope you enjoy reading it as much as we did assembling the
contributions. It is neither all-encompassing nor conclusive but intended to seed the next phase of research
as described at the end of Chapter 1.
Digital Transformation of Supply Chains
3
TABLE OF CONTENTS
INTRODUCTION
CHAPTER 1.
DIGITAL TRANSFORMATION IN SUPPLY CHAIN AND LOGISTICS 6
CHAPTER 2.
WHAT BENEFITS DO INITIATIVES SUCH AS INDUSTRY 4.0 OFFER FOR PRODUCTION LOCATIONS IN HIGH-WAGE COUNTRIES?
30
SUPPLY CHAIN RISK MANAGEMENT
CHAPTER 3.
THREAT ANALYSIS AND RESILIENCE OF COMPLEX SUPPLY CHAINS - URBAN ANALYTICS 35
CHAPTER 4.
DISRUPTION AND RISK MANAGEMENT OF HEALTHCARE SUPPLY CHAIN TOOLKIT: A CASE STUDY
40
SIMULATION AND COMPUTATIONAL MODELLING
CHAPTER 5.
SUPPLY CHAIN OPTIMIZATION AND SIMULATION – TECHNOLOGY OVERVIEW 49
CHAPTER 6.
LEVERAGING THE DIGITAL ECONOMY – A GOVERNMENT LOGISTICS PERSPECTIVE 55
CHAPTER 7.
COMPUTATIONAL MODELLING AND ROBOTIC PROCESS AUTOMATION FOR HEALTHCARE IN SINGAPORE
61
CHAPTER 8.
LOGISTICS PREPAREDNESS FOR DISASTER RESPONSE IN INDONESIA 70


Digital Transformation of Supply Chains
6
Chapter 1.
DIGITAL TRANSFORMATION IN SUPPLY CHAIN AND LOGISTICS
The Logistics Institute – Asia Pacific, National University of Singapore
The Digital Era
Digital transformation affects everyone in their daily lives. Everything that can be digitalized will be
digitalized, and anything that can be connected will be connected. This applies to everything including
people, machines, products and services. Customers are moving from traditional catalogue sales to online
e-commerce on their personal devices, from printing of photographs to saving and sharing digital
photographs through cloud services and social media, from manually turning on/ off home appliances to
remotely controlling appliances from anywhere using smart appliances connected to the cloud. All of these
are enabled by smart and interconnected devices, where data and applications are stored in the cloud.
Digital Business Transformation
For businesses, digital transformation changes the market context for every
business. It changes the customers’ behaviour and interaction, the product
offerings, the business operations as well as the source of business services as
illustrated in Figure 1.1. Customers have higher expectations and are able to
compare the products and services offered easily using available technologies.
They can openly share their opinions about certain products and services and
read opinions of others before they decide to purchase. They also value the
digital experience as an integral part of the product and service. In terms of
product offerings, companies may need to develop, implement, test and refine new products and services
very rapidly to help customers achieve their desired outcomes. Companies are experiencing the growing
need to refine their business operations by intelligently using the data that they have, and collaborating with
other stakeholders to expand and optimize the customer experience.
Digital transformation also accelerates the pace of change and, new products are offered more often, (for
example from every 5 years to almost every 6 months) to bring new opportunities for companies to unlock
new revenue streams by focusing on customers’ desired value and interaction using disruptive technologies.
Digital
transformation
changes the market
context for every
business.

Digital Transformation of Supply Chains
7
Figure 1.1. Digital Transformation Impact to Business
Navigating Logistics Assets
The shift to a digital supply chain creates significant impacts and challenges
to the companies/stakeholders involved. Companies need to strategically
navigate and explore alternatives to improve their supply chain and logistics
to keep up with the changing demands and stay ahead of the competition.
Take for example the e-commerce industry. Most e-commerce customers
want fast delivery, the ability to choose their delivery options, guaranteed
delivery dates and the ability to specify their delivery time slots1. Customers
regard these services as important as the products’ quality and cost.
Customers’ satisfaction will eventually transition from pricing to service
quality, including faster delivery and reliable services. This is part of their
digital agenda.
This makes e-commerce supply chain and logistics management very critical.
In addition, e-commerce demand is highly fragmented with smaller packages
and higher frequency. Companies need to balance between the cost, time
and flexibility of delivery service. On the one hand, they need to deliver the
goods quickly according to the customers’ preferred time windows, but on
the other hand, they also need to provide relatively low delivery cost to the
customers. This makes e-commerce logistics different from conventional
responsive or efficient logistics to responsive and efficient logistics as
illustrated in Figure 1.3.
Figure 1.2. E-Commerce
Logistics Characteristics
1 The Logistics Institute – Asia Pacific, E-Commerce Trends and Challenges: A Logistics ad Supply Chain Perspective, TLI-AP Whitepaper Series, November 2016.

Digital Transformation of Supply Chains
8
Adapted from Rodrigue J.P. et al., The Geography of Transport Systems, 2017. Available at:
https://people.hofstra.edu/geotrans/eng/ch5en/conc5en/ecommercelog.html
Figure 1.3. Conventional and E-Commerce Logistics
Using Simulation Tool to Navigate Infrastructure and Logistics Assets
To fulfil the customers’ demands and expectations, companies have to place
emphasis on the design of their supply chain and logistics systems, including
navigating and monitoring their assets to ensure distribution efficiency and
customers’ satisfaction for quality, speed, reliability and flexibility in deliveries,
as well as identifying and mitigating risks in their supply chain and logistics.
Placing logistics assets, such as freight facilities, in the correct location is one of
the key element of improving the efficiency and effectiveness of the supply
chain and logistics system; thus, the number of and siting of locations should be
carefully determined. It needs to consider the current market status such as
market trends, proximity to existing customers/demands, and access to
suppliers or vendors, transportation cost and travel times. When determining
the locations, the companies also need to consider any potential changes in the
future (such as changes to customers’ demands, location, urban planning and
development) because the freight facilities will be functioning for several years
or decades in the future. Poor asset resourcing may create bottlenecks and
congestion around the freight facility location and delay the deliveries to the
customers.
Placing logistics assets,
such as freight
facilities, in the correct
location is a key
element of improving
the efficiency and
responsiveness of the
supply chain and
logistics system.

Digital Transformation of Supply Chains
9
Various methodologies can be applied to determine the location (or a list of
candidate locations) of freight facilities, including simulation modelling. In
simulation modelling, a digital prototype (as illustrated in Figure 1.4) is created
to model the “real-world” supply chain and analyzed using different modelling
tools (i.e. discrete event simulation, system dynamic and optimization model).
It takes into consideration the criteria or success factors of the supply chain and
logistics design and processes. The alternative solutions can then be generated
to improve the supply chain and logistics system. We explore this in the two
case studies that follow.
Figure 1.4. Modelling and Simulation Illustration
In e-commerce logistics, the focus thus shifts to last mile distribution, resulting
in different logistics strategies and capabilities. Hence, a different supply chain
and distribution network is needed to fulfil e-commerce end to end logistics.
In simulation
modelling, a digital
prototype is created to
model the “real-world”
supply chain and
analysed using
different modelling
tools (i.e. discrete
event simulation,
system dynamic and
optimization model).

Digital Transformation of Supply Chains
10
Case Study 1: B2C E-Commerce Demand Forecast on Electronics Goods
This case study focuses on navigating infrastructure and logistics assets to fulfil e-commerce demands
by answering the following business questions:
1. Where are the sources of B2C e-commerce demand within Singapore?
2. How many warehouses are required to fulfil the B2C e-commerce demand in Singapore?
3. Where should e-commerce businesses locate their warehouse/s to minimize costs?
B2C E-Commerce Demand Forecast
This case study focuses on B2C on electronics goods. To understand the
B2C e-commerce demand for electronic goods for the next ten years, a
forecasting method based on Singapore’s population 2 , population
growth, death rate 3 and age specific electronic expenditure 4 and
percentage of online purchase5 is applied.
The results presented, as illustrated in Figure 1.5, represents the total
demands in each planning area, in SGD. For that reason, higher values
usually correspond with larger planning areas, like the area of Tampines,
which has the highest demand.
Figure 1.5. Heat Map of B2C E-Commerce Demand Forecast for Electronic Goods
2 Department of statistics of Singapore, Geographic Distribution, 2017. Available at http://www.singstat.gov.sg/statistics/browse-by-theme/geographic-distribution 3 Department of Statistics Singapore, Age specific death rate, 2017. Available at http://www.tablebuilder.singstat.gov.sg/publicfacing/createDataTable.action?refId=13249 4 Department of Statistics Singapore, Household Expenditure Survey, 2017. Available at: http://www.singstat.gov.sg/statistics/browse-by-theme/household-expenditure-survey-tables 5 Google, Consumer Barometer, 2017. Available at: https://www.consumerbarometer.com/en/
From the B2C e-
commerce demand
forecast, it can be
concluded that higher
demands usually
correspond with larger
planning areas, like the
area of Tampines, which
has the highest demand.

Digital Transformation of Supply Chains
11
Determining Number of Warehouses and the Locations
Considering the results from the demand forecasting, a simulation model is developed to specify how
many warehouses are needed, and where should they be located to minimize costs for the e-
commerce market in Singapore. A Green Field Analysis is used using a simulation software to
determine the optimal location for the warehouses.
The result of this analysis determined that the optimal location for the warehouse is in Bishan area (as
illustrated in Figure 1.6). However, the coordinates proposed by the GFA are not in an appropriate
location for a warehouse. Hence, some adequate coordinates are proposed based on the different
industrial areas in Bishan, as shown in Figure 1.7.
Figure 1.6. Green Field Analysis Result for B2C E-Commerce Demand for Electronic Goods in Singapore
Figure 1.7. Proposed Areas from Green Field Analysis and Industrial Areas around It

Digital Transformation of Supply Chains
12
Case Study 2: Freight Facility Design and Selection for B2C E-Commerce
To identify important criteria to consider for freight facility, a survey was designed and circulated
among industry professionals and academic experts to capture the relative importance of 40 criteria.
Respondents were asked to rate the level of importance of each criterion on a scale of 1 to 5 with “1”
being “not important at all” and “5” being “extremely important”.
A total of 27 responses were received. The results show that the top five criteria are order fill rate,
total storage/warehouse capacity, adopting appropriate storage strategy for SKUs, use of integrated
warehouse management system (WMS) and proximity to the customers. The summary of the result is
shown in Figure 1.8.
Figure 1.8. Average scores of Top 5 criteria by type of e-commerce players

Digital Transformation of Supply Chains
13
Application 1: Last Mile Delivery Planning and Monitoring through Smart Analytics Routing Application (SARA)6
To tackle the last mile, companies need to be able to plan, schedule, manage and monitor their logistics
assets for deliveries across a wide spectrum of parameters (locations, travel time, travel mode,
weather, etc.). The advancement in today's communication and software technology makes it possible
to do these using for example Smart Analytics Routing Application (SARA) which is currently developed
to support supply chain operation and management by displaying and analyzing logistics fleets and its
routes.
Figure 1.9. Fleet Load Visualization in SARA
SARA would generate and display fleet load and routes by considering last mile routing between each
delivery nodes as illustrated in Figure 1.9. It will try to find the optimal fleet for a certain delivery area
and generate routes to deliver a given set of shipments to the nodes in this area. The optimal set of
routes found by SARA will consider individual segments between nodes with different properties (such
as cost, time, distance etc.). The optimal set of routes found by SARA will minimize the total
transportation cost based on the total distance travelled as well as the fixed costs associated with the
used vehicles and drivers; minimize the number of vehicles needed to serve all customers and
maximize service quality or minimize penalties for low quality service.
6 This section is based on the joint work between The Logistics Institute – Asia Pacific (TLI-AP) and ST Electronics (Info-Software System) Pte Ltd under the Integrated Supply Chain and Logistics project (grant number 152 42 00055).

Digital Transformation of Supply Chains
14
Application 2: Mitigating Supply Chain Risk using A Web-based Tool for Supply Chain Risk Management
A shift to a more connected supply chain via digital interconnected
devices and complex web will make the supply chain network more
exposed to numerous risks of supply chain disruptions. These disruptions
may have different occurrence frequency and consequences. One
disruption may happen more frequently with more severe consequences
compared to other disruptions (as illustrated in Figure 1.10).
Figure 1.10. Modelling a supply chain through a map in RISKMethodsTM
Phase 1: Risk identification
Supply chain risks are linked to the following areas: suppliers,
customers, locations, countries and own sites. The framework in Figure
8.3 is used to categorize risk factors. Companies can identify their own
risk factors according to this framework. In each green subgroup, there
are lists of risk factors for selection. Those selected risk factors will be
tracked and monitored by the tool in real time.
Experimental work with riskmethods software modules as permitted by riskmethods GmbH (riskmethods.net)
Supply chain risks are
linked to the following
areas: suppliers,
customers, locations,
countries and own
sites.
Supply chain risks are
linked to the following
areas: suppliers,
customers, locations,
countries and own
sites.

Digital Transformation of Supply Chains
15
Figure 1.11. Framework of risk factors
Phase 2: Risk Assessment
Risk impact can be assessed based on the questioner built by the companies through this tool. An
example of the questionnaire is shown in Figure 1.12. With the risk score and impact score, the risk
portfolio can be generated as in Figure 1.13.
Figure 1.12. Risk impact questionnaire and the weight

Digital Transformation of Supply Chains
16
Figure 1.13. Risk portfolio
Phase 3: Risk Mitigation
Based on the risk assessment, the companies can decide whether mitigation strategies can be
implemented in advance to reduce the risk level. Figure 1.14 and 1.15 illustrate the functions to activate
mitigation action plan for supply chain members.
Figure 1.14. Supply chain entities

Digital Transformation of Supply Chains
17
Figure 1.15. Mitigation action plan
Phase 4: Risk Monitoring
For risk monitoring, real time alerts (as illustrated in Figure 1.16) for the registered risk events are very
important. It would help the companies to reassess the risk level.
Figure 1.16. Risk monitoring – indicator messages

Digital Transformation of Supply Chains
18
Overall Risk Level Tracking and Visualization
With risk identification and assessment, the results for different supply chain entities, e.g. suppliers,
supply chain paths, locations, and countries, at the current time, are presented in Figure 1.17.
Furthermore, we can also track the history of risk levels of supply chain entities overtime as illustrated
in Figure 1.18, which tracks the risk levels of suppliers, supply paths, locations and countries for the
last 3.5 years.
Figure 1.17. Risk assessment for different supply chain entities
Figure 1.18. Tracking risk levels of supply chain entities in past years

Digital Transformation of Supply Chains
19
Application 37: Commentary: Use of Statistical Computing in
Decision Making
R and Statistical Computing
R is a statistical computing environment that makes it easy to solve mathematical problems relating to
optimization, predictive modelling, (time series) forecasting, and visualization. It is also the most
popular statistical language among data scientists and mathematicians.
R is free and open source.
Being the most widely used data analysis environment, R is naturally a common tool of choice when it
comes to prototyping and building application layers using geo-spatial data. We go through a series of
examples to show how anyone can make use of this free, open-sourced and well-developed R
ecosystem to aid their decision making and software engineering process. It is our hope that this
vignette helps shed light on some of the more foundational engineering processes behind mapping,
navigation, route finding or even forecasting solutions widely used throughout commercial
applications. It is further our intention that this writing elevates your interest even slightly in the field
of applicational data science and more generally, statistical computing.
Developing Mapping Applications
Logisticians or software developers looking to visualize spatial data and develop spatial models can use R and it's "wrapper functions" to query just about any external servers to obtain the underlying spatial data. In the workshop, We demonstrate the use of R to query (and download) maps from Google, OpenStreetMap, and Stamen Maps but these are not the only options!
We can plot the map we created in two lines of code in R and overlay information as aesthetic objects onto our plot:
map1 <- ggmap(sing) +
geom_point(data=foo, aes(x = long, y = lat), color = "red", size=0.7)
suppressWarnings(print(map1))
7 This section is contributed by Mr. Samuel Chan, co-Founder Algoritma.

Digital Transformation of Supply Chains
20
We search up the latitude and longitude of NUS Singapore campus and use Open Street Map's API to
download the data into our environment by plugging the longitude and latitude (103.7764 and 1.2966
respectively):
## osmar$nodes object
## 3031 nodes, 228 tags
##
## ..$attrs data.frame:
## id, visible, timestamp, version, changeset, user, uid, lat,
## lon
## ..$tags data.frame:
## id, k, v
##
## Bounding box:
## lat lon
## min 1.289702 103.7692
## max 1.302787 103.7855
##
## Key-Value contingency table:
## Key Value Freq
## 1 bus yes 16
## 2 highway bus_stop 15
## 3 public_transport platform 13
## 4 barrier lift_gate 9
## 5 amenity atm 7
## 6 route_ref 95 4
## 7 amenity cafe 4
## 8 location Lower Kent Ridge Roa... 4
## 9 location Prince George's Park 4
## 10 source survey 4

Digital Transformation of Supply Chains
21
We can take at a subset of the data we downloaded using find() and subset(): ## id k v
## 71 1738410357 bus yes
## 72 1738410357 highway bus_stop
## 73 1738410357 location Prince George's Park
## 74 1738410357 name House 7
## 75 1738410357 public_transport platform
## 76 1738410359 bus yes
## 77 1738410359 highway bus_stop
## 78 1738410359 location Prince George's Park
## 79 1738410359 name Opp House 12
## 80 1738410359 public_transport platform
We can, of course, also visualize the data we downloaded from Google and Open Street Map. R and
the packages on its ecosystem provide us with a rich collection of tools and functions to model these
spatial data.
We demonstrate some of the functions common for geolocation and routing, we also note that most
of this data we just acquired is "crowd-sourced" by regular folks. We can attribute the contribution of
each tags to the "user" through visualization:
bg_poly <- as_sp(bg, "polygons")
# change `user` to `version` to see its changes over version
spplot(bg_poly, c("user"))

Digital Transformation of Supply Chains
22
If we wanted to, we can also plot the buildings and pathways around our NUS campus using the crowd-
sourced data. This generates an object that serves as a foundational base that we can then use to
overlay our routing logic or algorithmic optimization on.
hw_line <- as_sp(hw, "lines")
spplot(hw_line, c("version")
Notice that from the initial server query to visualizing our NUS compound is really a matter of several lines of code. We're taking advantage of crowd-sourcing to help our model figure out the paths, buildings, walkways, amenities and other objects in an open source, full-fledged data environment!
par(cex.axis=1, cex.lab=1, cex.main=1.2, cex.sub=1, pch=19, cex=0.7) plot(bg_poly, col = "lightgray") plot(hw_line, add = TRUE, col = "dodgerblue1") plot(bs_points, add = TRUE, col = "dodgerblue4", pch=19)

Digital Transformation of Supply Chains
23
While programming in a statistical environment may seem daunting, or even intimidating in the
beginning, such intimidation is short-lived when you realize that a large part of this experience uses a
very consistent "grammar". We're dealing with polygons, lines and points for the most part when it
comes to spatial visualization and this consistency is observed across many packages in this domain of
data science in the R ecosystem. The level of consistency makes it easy to integrate different
functionalities from third-party packages authored by independent researchers, professionals and
geospatial scientists.
Developing Navigation Abilities
To simulate a navigation device, consider the following graph and our starting (green point) and destination (red point) positions. Using what we've learned so far, we can first plot all existing roads in the region, and then add the red and green labels to the nearest node of our specified starting and destination points.

Digital Transformation of Supply Chains
24
Consider the number of possible routes or paths between these two points.
par(cex.axis=1, cex.lab=1, cex.main=1.2, cex.sub=1, pch=19, cex=2)
plot(mucbg_poly, col = "gray")
plot(muchw_line, add = TRUE, col = "dodgerblue4")
plot(hway_start, add = TRUE, col = "green", pch=19)
plot(hway_end, add = TRUE, col = "red", pch=19)
We can now convert the above network of paths into a graph and run an algorithm to compute the
shortest distance among all possible combinations of paths. R packages like igraph can also
automatically pick an algorithm that most efficiently compute the distances for the supplied weights.

Digital Transformation of Supply Chains
25
We can also plot a histogram by computing the shortest path length between each pair of vertices in
our graph for directed graphs both directions are considered so every pair of vertices appears twice in
the histrogram8.
## Loading required package: igraph
## ## Attaching package: 'igraph' ## The following objects are masked from 'package:stats': ## ## decompose, spectrum ## The following object is masked from 'package:base': ##
## union

Digital Transformation of Supply Chains
26
Impacts on Supply Chain
Digital transformation requires companies to rethink not only their current
business models but also their whole business operation and corporate culture,
including their supply chains. Traditional supply chains with linear and long
chains before reaching the customers (as illustrated in Figure 1.19) may not be
sufficient. A shift to a more connected supply chain, via digital interconnected
devices and complex webs (as illustrated in Figure 1.20), is necessary. This would
link suppliers, distributors, wholesalers, transporters and customers to enable
supply chains to react faster and be better able to adapt to the fast changing
market.
Figure 1.19. Traditional Supply Chain
Figure 1.20. Digital Supply Chain
8 G Csardi, igraph Package in R
A shift to a more
connected supply
chain, via digital
interconnected
devices and complex
webs, is necessary.

Digital Transformation of Supply Chains
27
Thus, in summary, in this digital era, we are faced with shifting consumer demand patterns, changing market
trends, and subtle change in consumer behaviour. Even though supply networks are integrated and
information may be shared through centralized platforms, businesses and stakeholders involved may still
have different views of consumer demands. Seasonality and weather conditions also impact demands. As a
consequence, a mismatch in supply and demand occurs. High costs of operations, poor service level, waste,
and low productivity ensue. Therefore, it is imperative to have a more adaptive and more orchestrated
mechanism to efficiently help plan and operate supply chain in a changing environment. The main challenges
of today’s supply chain can be summarized as follows:
Supply Chain Transparency
Coordinated information exchange through the entire chain is still not a common practice. Often, huge data
generated by digital technologies is stored in a complex and non-structural form, which is not easily machine
readable. Opaque supply chains could lead to poor demand planning and management. This could result in
high operating cost, due to excessive inventory and high product return rate (and claims). On the other hand,
it could also lead to poor service levels due to stock-out. The slew of new technologies and innovative work
in AI-powered production systems calls for innovative collaborative business models. Limited supply chain
visibility is a growing concern. The move towards a globally integrated supply chain with near "total
transparency' is needed.
Various cutting-edge technologies (e.g. Big Data Analytics and Learning algorithms) must be embedded in
solution platforms to ensure that all parties have the same unified view of the database, a feature that will
permit a supply chain to respond effectively to increased supply, modal choices and demand volatility.
Supply Chain Collaboration
Siloed execution by supply chain partners especially in the last-mile stage could result in high cost, low
productivity, and resource wastage. With limited resources, last-mile logistics has to be managed in
innovative ways to ensure timely order fulfilment. Collaboration is a strategic term for integrating different
technologies, processes, resources, and also networks to achieve the optimal operations with efficient use
of resources. One common approach of supply chain collaboration is last-mile consolidation, where data
exchange, demand clustering, and resource management of more than one stakeholder are synchronized.
Integration of automation and Artificial Intelligence (AI) in daily logistics operations also help improve
productivity and resource usage.
Supply Chain Flexibility
Fragmentation and a stochastic universe hinder flexibility. Real-time planning of inventory and last-mile milk
runs are needed. The supply chain network must therefore be dynamically optimized and configured to
accommodate changing parametric values such as change or substitution of vendor, order quantity, safety
stock, lead time, and so on. Dynamic optimization and multi-scenario simulation are the main tools to help
networks self-reconfigure to achieve the flexibility.

Digital Transformation of Supply Chains
28
Figure 1.21 specifically describes the current problems of today's supply chain in focused industry sectors.
Figure 1.21. Sectoral Problem Statements
Moreover, a lack of transparency, inefficient resource allocation and inflexibility manifest in supply chain
problems that are not unique to any one industry sector. Thus, cross sector best practices are best gleaned
from an integrated perspective. This is shown in Figure 1.21.
Supply Chain Orchestration Platform
Leveraging on supply chain and logistics capabilities, domain knowledge and notable industry engagements,
The Logistics Institute – Asia Pacific (TLI-Asia Pacific) aims to continue to develop innovative,
integrated/seamless platforms that will provide solutions and insights to help tackle various challenges in the
supply chain and logistics, especially in last mile logistics with enhanced effectiveness and efficiency. The
platforms will serve the following firstly, to test breakthrough concepts, strategies and dynamically re-
configure the supply chain network with the changing demands and markets, and secondly as an innovative
model/tool that explores techniques, data analytics and disruptive technology to support/sustain self-
orchestration of entire supply chain networks. Two such platforms have been built as shown in Figure 1.22.
1.22. Integrated platform for Last Mile and E-Commerce Logistics

Digital Transformation of Supply Chains
29
We propose a new integrated orchestration platform as shown in Figure 1.23. This platform is aimed at
dynamic reconfiguration of networks. It has four main interdependent components:
A self-orchestrator, an allocator of resources in real time, a dynamic price setter based on current and
predicted conditions and a scenarios planner. Each of these components “interlocks” with the other to give
rise to a unique control tower.
Figure 1.23. Orchestration Platform
The platform has as its core an integrated AI powered engine that provides for different scenario
experimentation, visualization and decision dashboards.
To foster the implementation and application of the concepts/strategies/tools/platform, we welcome
collaboration from industry with complex supply chain networks to contribute by sharing their supply chain
and logistics problems/challenges/ideas and participating in the research.

Digital Transformation of Supply Chains
30
Chapter 2.
WHAT BENEFITS DO INITIATIVES SUCH AS INDUSTRY 4.0
OFFER FOR PRODUCTION LOCATIONS
IN HIGH-WAGE COUNTRIES?
Contributed by Prof. Dr. Paul Schönsleben, Professor for Operations and Supply Chain Management
ETH Zurich, Department of Management, Technology, and Economics
Introduction
Initiatives like the Industry 4.09 initiated in Germany are driving a digital revolution in production, through
which high-income countries in particular (e.g. USA, German, Japan and Switzerland) are looking to utilize to
enhance their positions as production locations. Industry 4.0 postulates a fourth industrial revolution where
smart and connected machinery, warehousing systems and production facilities capable of autonomously
exchanging information, triggering actions and controlling each other independently rapidly disrupt
conventional production systems10. The result will be increased production effectiveness and efficiency, or
“Smart Factories” that feature (1) more individualization of products to customers’ requirements without
significantly increasing costs; (2) improved versatility, efficiency, and ergonomics with better integration
throughout the entire supply chain; and (3) more autonomous decision making in decentralized product and
production systems. Other similar initiatives include Cyber-Physical Systems (CPS)11 initiated by USA, IVI
(Industrial Value Chain Initiative)12 in Japan or Industry202513 in Switzerland.
Figure 2.1. Fully Digitalized Smart Factory
9 Kagermann H., Wahlster W., Helbig J. Securing the Future of German Manufacturing Indystry: Recommendations for Implementing the Strategic Initiative Industrie 4.0. Acatech, Final Report of the Industrie 4.0 Working Group, 2013. 10 Ibid. Note 1 11 Lee EA. Cyber-Physical Systems: Design Challenges, Technical Report No. UCB/EECS-2008-8. UC Berkeley, 2008. 12 Industrial Valuechain Initiative,What is IVI? Available at www.ivi.org/en/ [Accessed 09.03.2017] 13 Industrie 2025. Portrait. Available at www.industrie2025.ch [Accessed 09.03.2017]

Digital Transformation of Supply Chains
31
Examples around Industry 4.0
Industry 4.0 is enabled by key technology building blocks for a smart, interconnected system, including
concepts like intelligent sensors, the Internet of Things, big data, additive manufacturing, medical
engineering etc. These digital components allow automated production to adapt increasingly quickly to
changing requirements. Below are some examples of key technology building blocks. Most of these examples
are taken from the Swiss industrial and services sectors.
Smart Sensors
Figure 2.2. An example of a smart sensor. Valedo sensor
(Source: Hocoma)
A smart sensor can be used to measure things (as a
conventional sensor would), process the measured
data and make the results available in the required
form.
Internet of Things (IOT) and Big Data
Figure 2.3. An example of IOT traker. The Kizy
Tracker (Source: Kizy Tracking)
The IOT is a network of material or non-
material goods and objects (“things”) that
are connected to each other and that can
exchange data, which creates so large and
complex data sets (also known as Big Data).
Additive Manufacturing (AM)
Figure 2.4. An example of “digital” spare parts
for textile machinery
(Source: 3D Prints Lechthaler Reinhard)
AM is widely known as 3D printing. It is a process
that offers the possibility of creating three-
dimensional objects.
Personalized Medication
Figure 2.5. High-precision distribution of liquids
(Source: 3D Precision SA)
Personalized medication is a patient-focused
approach that incorporates both medication
and the dispensing process.

Digital Transformation of Supply Chains
32
Impact of Industry 4.0
In terms of the medium-term impact, digital revolution across all sectors and technologies will drive
continuous progression. However, companies that are built around specific analogue technologies, such as
analogue photography, analogue telephony, offset printing and tooth imprints, are exposed to substantial
risk of being replaced by digital technologies. Over the long term, initiatives such as Industry 4.0 offer
significant benefits for production locations in high-wage countries by giving the countries a competitive
edge, because countries are already seeing their status enhanced by these initiatives, which in turn helps
them attract the best young talent to the industrial sectors.
Acknowledgement
This chapter is a summary from Schonsleben, P., Fontana, F., Duchi, A., What benefits do initiatives such as
Industry 4.0 offer for production locations in high-wage countries?, In The 50th CIRP Conference on
Manufacturing Systems, Procedia CIRP 63, pp. 179-183, 2017.


Digital Transformation of Supply Chains
35
Chapter 3.
Threat Analysis and Resilience of Complex Supply Chains
- Urban Analytics
Contributed by Prof. Markus Gerschberger, Professor for Supply Chain Management, University of Applied Sciences Upper Austria, Steyr: and
Prof. Stefan Pickl, Professor for Operations Research, Universität der Bundeswehr München
Society depends decisively on the availability of critical infrastructures such as transportation, energy,
telecommunication, banking and finance, health care and governmental and public administration. Even
selective disruption of one of these infrastructures may result in disruptions of governmental, industrial or
public functions. Vulnerability of infrastructures therefore offers spectacular leverage for natural disasters as
well as criminal actions. Threats and risks are part of the technological, economical, and societal
development. Increasing complexity of our critical infrastructures exacerbates consequences of natural
and/or man-made disasters. Not only primary effects but also cascading effects as result of increasing
dependencies and interdependencies of our technological and societal systems demand intelligent
simulation and optimization techniques (AI-based) in the area of supply chain and a comprehensive safety
and security management.
In order to design supply chains that are less vulnerable to disruptions, researchers have to consider the
structure and organization of companies and their supply chains which play an important role in improving
supply chain resilience14. Originally, resilience has its roots in psychology and ecosystems before it was
adapted to supply chain management15. For our study we rely on the definition by Ponis and Koronis (2012)16.
“Supply chain resilience is the ability to proactively plan and design a supply chain network for anticipating
unexpected disruptive (negative) events, respond adaptively to disruptions while maintaining control over
structure and function and transcending to a past event robust state of operations, if possible, more
favourable than the one prior to the event, thus gaining competitive advantage”. This definition was chosen
due to the inclusion of design and structure of a supply chain which is the link to our research focus.
14 Datta, P.P., Christopher, M. and Allen P. (2007), “Agent-based modelling of complex production/distribution systems to improve resilience”, International Journal of Logistics Research and Applications, Vol. 10, No. 3, pp. 187-203 15 Datta, P.P., Christopher, M. and Allen P. (2007), “Agent-based modelling of complex production/distribution systems to improve
resilience”, International Journal of Logistics Research and Applications, Vol. 10, No. 3, pp. 187-203; Ponomarov, S.Y. and Holcomb,
M.C. (2009), “Understanding the concept of supply chain resilience”, International Journal of Logistics Management, Vol. 20, No. 1,
pp. 124–143; Ponis, S.T. and Koronis, E. (2012), “Supply chain resilience: definition of concept and its formative elements”, The Journal
of Applied Business Research, Vol. 28, No. 5, pp. 921–930; Pettit, T.J., Croxton, K.L and Fiksel J. (2013), "Ensuring supply chain
resilience: development and implementation of an assessment tool", Journal of Business Logistics, Vol. 34, No. 1, pp. 46-76. 16 Ponis, S.T. and Koronis, E. (2012), “Supply chain resilience: definition of concept and its formative elements”, The Journal of Applied Business Research, Vol. 28, No. 5, pp. 921–930

Digital Transformation of Supply Chains
36
Supply chains become more and more complex. On the other side decision makers intend to identify critical
situations (mentioned above) in a very quick and reliable way in order to detect disturbances, threats and
bottlenecks. The authors present a new holistic approach for a resilient supply chain environment which is
based on the following items:
A model of the supply chain (= view of a focal company)
A modern management cockpit
Education and Training Perspective
In a first step, we describe the model of our supply chain network and the underlying network topology.
An Innovative Model of the Supply Chain
Adaptability, Agility and Alignment
Although, literature regarding adaptive supply networks (ASN) may slightly differ, three key characteristics
can be recognized. These are: Adaptability, Agility, and Joint Alignment. These keywords are adapted from
Lee (2004)17, as they best describe the requirements for an ASN. However, note that these characteristics
require a network structure of the supply chain.
Therefore, we model the supply chain as a multi-layered network. Each layer stands for a certain critical
infrastructure view. Based on this basic and generally applicable multi-layered network of critical
infrastructure the supply chain layer (= from the perspective of a focal company) is developed consisting of
nodes (= companies in involved in the value creation process) and edges (= the transport relations between
companies). The relationship between the components are described by mathematical equations and a
special network topology. The components are interlinked.
In our opinion graph mining is a very important field in that context. We might differ to aspects:
mining in a set of graphs and
mining in a single graph.
For the former one many problems have been examined in the past. During graph mining we might suggest
a combination of the analytics of graph structures as well as node attributes. In the show room hybrid
approaches might be analysed to identify the evolvement of an certain event in a graph, for example in the
context of disaster relief.
In comparison to Guan and Yuan (2014)18, where in their work they first studied the problem of measuring
how strongly such an event that took place in a graph is correlated to the graph structure, i.e. Self Structural
Correlation (SSC) a novel measure was introduced to assess SSC. It can be used to derive statistical
17 Lee, H.L. (2004) "The Triple-A Supply Chain", Harvard Business Review, 82(10), pp. 102-12. 18 Guan, D.; Yuan, W.; Lee, Y.K., Najeebullah, K., Rasel, M.K. (2014) A review of ensemble learning based feature selection IETE Tech. Rev. 31(3), 190-198.

Digital Transformation of Supply Chains
37
significance to test if an event is randomly distributed over a graph or not. Our aim is to estimate on their
basis very quickly the development in large-scale graphs. Their proposed method is scalable and in their
article successfully applied to the co-author DBLP network and a social network extracted from TaoBao.com,
the largest online shopping network in China, with many exciting discoveries.
We extend their approach to specific supply chain networks. This process will be embedded in an interactive
certain show room “Graph Mining“. In order to simulate the complex behaviour, we propose an innovative
management cockpit framework which will be the basis of a suitable “business decision room “ (as illustrated
in Figure 3.1.)
Figure 3.1. Business Decision Room - Framework
The special multi-level approach allows the company-specific illustration of Supply Chains including
identification of critical nodes (=companies, transhipment points) and edges (=transport relations). Based on
the dynamic identification of criticality in the supply chain, the user has the possibility to consistently derive
alternative actions to improve the sustainability and resilience (see also figure Business Decision Room -
Framework). The basis of the multi-level network is the mapping of the relevant infrastructure (e.g.
demographic indicators, energy networks). Based on that, the transport infrastructure of the analysis area is
added as a further level. All levels are in active relationships with each other, which are methodically
formulated and integrated into the overall system. Furthermore, after the successful test of the visualization
tool any additional levels (e.g., healthcare, emergency systems) may be introduced. Based on this basic
network modelling, PI / company-specific supply chain information is applied (e.g., geo-locations of own sites,
suppliers and customers as well as actual transport relations).
The resulting transparency across multi-level networks allows the continuous identification and evaluation
of critical nodes and edges in the supply chain.

Digital Transformation of Supply Chains
38
System of Systems
This lead project combines isolated research approaches (Smart Grid, Geo-Modelling, System Dynamics
approaches to evaluate interdependencies) to a system of systems, enabling integrated analysis of cause-
and-effect relationships. Consistent proactive analysis allows companies to extensively monitor and improve
critical nodes and edges in their specific system. This makes their multi-level network more targeted,
sustainable and resilient.
Management Cockpit
As the multi-layered perspective is high-dimensional we intend to identify the
key parameters of the processes. What are the critical nodes and edges in the
supply chain, what are the critical internal and external process? How can we
monitor and manage this process, which are the critical control parameters
and which parameters guarantee a certain stable behaviour?
The management cockpit as central element of this business decision room
focusses on the
i) the identification of critical events,
ii) the assessment of these events including the development of mitigation strategies and
iii) development of strategic management solutions.
Visual Analytics Tool
In a first step the management cockpit gives an overview on the parameter and steering opportunities. In a
second step, we intend to identify criteria. As an innovative approach, we present a special visual analytics
tool. In order to improve the visibility, we filter the information. Our approach tries to reduce the complexity,
afterwards we integrate additional information. The visual analytics technique simulates the capacity, the
different flows and estimate certain graph measures. Key aspect is the improvement of the efficiency. We
describe a procedure how we can detect critical zones.
REHSTRAIN, RIKOV - LIVE and ARTEFAL
New methods like predictive analytics, network analysis, system dynamics and artificial intelligence are
presented to master such complex networks via modern command & control systems. It presents actual
decision support approaches - in the area of modern transportation systems, energy networks and aviation
management - via innovative sensor networks, network control and reach back architectures to support an
adaptive information and smart management system. Actual heuristics and first computational results for
special multi-layered decision problems will be presented. We refer to the projects RIKOV, REHSTRAIN,
MILAN, LIVE and ARTEVAL. The control enables the operator to get insight in the process structure, failures
of the system and potentialities.
Central idea is how
executives might
“pilot” their business.
Markus Gerschberger

Digital Transformation of Supply Chains
39
Education and Training using Gamification “Resilience Game”
We design a so-called resilience game to stabilize the behaviour of the supply
chain. Actors try to describe certain areas whereas other decision makers try
to react, to recover weak zones and to stabilize the process. The players act
and interact with their environment.
We identify equilibria and trajectories via the following techniques
Predictive Analytics (SAP)
Fourier Transformation on Graphs
Dual Treatment
First computational results will be presented at the summit in March 2018.
Urban Analytics is the
Key for the
Development of
Megacities.
Stefan Pickl

Digital Transformation of Supply Chains
40
Chapter 4.
DISRUPTION AND RISK MANAGEMENT OF
HEALTHCARE SUPPLY CHAIN TOOLKIT: A CASE STUDY19
Contributed by Prof. Mark Goh, Director (Industry Research), The Logistics Institute – Asia Pacific, National University of Singapore
For this study, the focal company is an end-to-end supply chain ecosystem company involved in the
procurement of goods from suppliers, managing warehousing facilities, and providing last mile delivery to
corporate customers. There is a need for the company to understand the attendant risks of the suppliers and
have a sense of the appropriate mitigation strategies to deploy. The accuracy of the risk index is important
for the focal company to select the right partners and manage the underlying risks. The calculation of the risk
index is based on the quantitative assessment of the risk impact of each supplier to the focal company.
This required assessing and evaluating their supply chain for the effects of various possible disruptions. This
was made possible through the development of a simulator of the supply chain. This arms the company with
a test bed to assess the effects of any possible scenario. Further to help in easy understanding of the context
the risk faced by various entities was quantified in form of a risk index. This was then used to evaluate various
suppliers and calculate the real-time risk index. Through a user-friendly interface and Geographic Information
System (GIS), the focal company can now update the respective input risk parameters and observe the
changes in the risk index. Through this, appropriate mitigation strategies can be offered.
Problem statement
The current case study is divided into two parts:
1. Part 1: Supplier risk index for strategic decision making
2. Part 2: Supply chain risk management platform for visualisation
Part 1 - Risk index for strategic decision making
Part 1 aims to identify a potential supply chain risk index based on the data provided by the focal company
and her clients. The company wanted to build a virtual simulator, assess the supplier’s risk profile, and
identify the potential disruption for each supplier. With this profiling, mitigation strategies for the identified
disruptions were developed and the outcome was validated through simulation.
19 The work is supported by A*STAR under Integrated Supply Chain and Logistics project (grant number 152 42 00055)

Digital Transformation of Supply Chains
41
Part 2 - Supply chain risk management platform
Part 2 aims to develop a GIS platform to identify the real-time risk indices for each supplier using real-time
information feeds and develop a user-friendly interface through which they can update the input data in the
simulation model, to continuously update the basis of solutions.
Figure 4.1. Structure of healthcare supply chain of focal firm
Techniques used
The following research methods were applied:
1. Value at Risk (VaR): VaR is the most common risk measure used in finance. This has been adapted here
to the supply chain context. The concept is illustrated in Figure 4.2.
Figure 4.2. Value at risk (VaR 5)

Digital Transformation of Supply Chains
42
2. Agent based simulation: An agent based simulation model was built for this. Agent based modelling was
chosen because of its scalability and so that the platform does not become obsolete when changes are
made to the supply chain.
3. Web crawler: A web crawler platform was built to capture and update the disruption risk data. This
platform monitors the latest update from an open source disruption data site and all data relevant to
any of the supplier locations would then be added to the simulator database. The programming language
Python was used to build this crawler.
4. Demand analysis: Visual Basic for Applications (VBA) is used to write the in Microsoft Excel macros, used
to process the input demand data into the simulation model.
5. User Interface (UI): All three platforms are then connected through an integrated UI built on AnyLogic.
The Java language is used for this work.
In the simulation model, the other methods used are: shortest path selection by the built-in GIS of AnyLogic,
order consolidation for full truckload delivery, uniform distributions for demand data, control interface to
change the parameter values on the fly and see their effects.
Results
The simulation is run for 300 times and each time the potential loss value is calculated. These values are
pooled together and then a Normal distribution is fitted. Each supplier has 300 numbers representing the
revenue loss caused by their respective risk factors. From these 300 samples of possible revenue loss, we can
generate the loss distribution function for each product and thus find the VaR. Figure 4.3 is an example of
the loss distribution function of P1 for one year and it’s VaR at the 95% confidence interval.
Figure 4.3 shows the distribution of losses due to disruption for 300 simulated runs for Product P1. On
average, the loss is expected to be $168,677. The green area shows the lowest 5% of losses with a VaR of
$93,937 and the corresponding CVaR20 is $73,258. Figure 4.4 provides the visual dashboard for operational
efficiency, and Figure 4.5 shows the dashboard for the aggregated values of the warehouses.
20 Conditional value at risk (CVaR) is a risk assessment technique often used to reduce the probability that a portfolio will incur large losses. This is performed by assessing the likelihood (at a specified confidence level) that a specific loss will exceed the value at risk. The smaller the value of the CVaR, the better.

Digital Transformation of Supply Chains
43
Figure 4.3. Dashboard window showing risk index values
Figure 4.4. Dashboard showing GIS map of deliveries
Figure 4.5. Dashboard window showing aggregated values for all warehouses

Digital Transformation of Supply Chains
44
Table 4.1. Average profit for a year
Product no. Avg. Profit
1 1000719.1839992598
2 388293.23200399725
3 1043314.3830773791
4 1204188.2192429437
5 752926.1141913177
6 -147490.39406126743
7 435673.5294320771
8 168568.38371838874
9 48995.45016805381
10 208117.56615667167
11 748350.7044939497
12 101897.16124577737
13 89256.43666205244
14 10459.506347246537
15 49827.40285346052
16 6600055.094216719
17 517782.3002070122
18 968944.8714904856
These values are used as the base values from which the profit of the disrupted supply chain is deducted. By
populating these values and fitting a Normal distribution curve, the VaR for the revenue loss can be found.
The VaR results are listed in column four of Tables 4.2 and 4.3. Table 4.2 shows that the VaR at the 95%
confidence interval while Table 4.3 shows the VaR results at the 90% confidence interval. Subsequently, we
can obtain risk index (RI) of each supplier through the following equation.
𝑅𝐼𝑖 = (𝑉𝑎𝑅𝑖)/𝑇𝑜𝑡𝑎𝑙 𝑝𝑟𝑜𝑓𝑖𝑡 𝑓𝑜𝑟 𝑡ℎ𝑒 𝑐𝑜𝑚𝑝𝑎𝑛𝑦
Though we can choose a different base to calculate risk index values, the total profit is chosen as this gives a
clearer picture on the portion of the total profit at risk from a disruption of a particular product supply. The
results of the risk index for all suppliers are listed in the last columns of Tables 4.2 and 4.3, respectively.
Table 4.2. Supplier risk indices based on VaR values at 95% confidence interval
Supplier Min loss Max loss VaR at 95% Risk Index
S1 153.57 168,083.031 8550.04305 0.0006
S2 30,049.099 569,981.53 57045.72055 0.004002
S3 66.385 28,575.982 1491.865 0.000105
S4 258.376 50,761.34 2783.1482 0.000195
S5 106.225 9,095.838 555.49 3.9E-05
S6 118.715 5,578.1 391.684 2.75E-05
S7 26,894.859 476,412.896 49369.90185 0.003463
S8 58,502.469 145,667.564 62860.2782 0.004409

Digital Transformation of Supply Chains
45
Table 4.3. Supplier risk indices based on VaR values at 90% confidence interval
Supplier Min loss Max loss VaR at 90% Risk Index
S1 153.57 168,083.031 22670.477 0.00159
S2 30,049.099 569,981.53 72891.145 0.005113
S3 66.385 28,575.982 3848.795 0.00027
S4 258.376 50,761.34 6817.9001 0.000478
S5 106.225 9,095.838 1229.828 8.63E-05
S6 118.715 5,578.1 738.9474 5.18E-05
S7 26,894.859 476,412.896 87578.934 0.006143
S8 58,502.469 145,667.564 70269.35114 0.004929
These values show that suppliers S7, S2 and S8 are the critical suppliers to manage from the risk disruption
point of view.


Digital Transformation of Supply Chains
49
Chapter 5.
Supply Chain Optimization and Simulation
– Technology Overview
Contributed by Timofey Popkov, Director of Business Development, The AnyLogic Company, anyLogistix.com
Introduction
Analytical optimization and dynamic simulation are the two most commonly adopted technologies for solving
complex supply chain problems. However, there has been a lot of confusion around the terms “optimization”
and “simulation” in the industry – they are often misinterpreted, used in the wrong context, and given
different meanings. Many companies question the differences between these techniques, which one is
better or more efficient, and what problem does each one solve? This chapter tries to resolve the confusion
and explain when best to apply each method. It will also show why analytical optimization tools already
employed by many supply chain strategists should be accompanied by dynamic simulation, and how
managers can improve lean and agile supply chain management with this addition.
Supply Chain Challenges by Level of Detail
Managing the supply chain means continuously searching for improvements and meeting new challenges.
The solutions can involve different areas of expertise and be from operational, tactical, or strategic
management levels. They may also depend on the type of company you are engaged with – distributor,
retailer, manufacturer, or a 3PL/4PL operator. Challenges linked to supply chain design, inventory and
transportation policies, production planning, and risk management can be grouped into three sections and
represented on a pyramid-shaped diagram, Figure 5.1.

Digital Transformation of Supply Chains
50
Figure 5.1. Challenges addressed by supply chain models and the level of detail.
Analytical Optimization
Analytical optimization is probably the most common technique for improving supply chains. Most analytical
optimization tools allow companies to develop a model to visually describe a supply chain as a graph and
parametrize it with a set of criteria. The constraints need to be described clearly and the model populated
with data. These tools then try to find the optimal – or suboptimal – solution(s) to a specific supply chain
problem. During this stage, the model is converted into a set of linear equations, constituting a linear and
mixed integer programming (LP and MIP) problem. These equations are then solved using optimization
engines, of which there are many. The results appear in the user interface of the supply chain tool as set of
tables with material flows and financial information. Problems that can be solved using analytical
optimization includes:
Supply chain design:
o Where to locate the facilities?
o What their throughput should be?
o How to arrange product flows?
Master planning by period:
o Where to produce or stock goods?
o How much to produce and order?
o How to provide for seasonal peaks in demand?
Transportation:
o What size of the fleet is required?

Digital Transformation of Supply Chains
51
Limits to Optimization
In order to map a supply chain to a set of equations using analytical optimization tools, companies must
simplify the real-world system and employ certain generalizations and assumptions, including (but not
limited to):
All the relations in such a model have to be represented as linear dependencies or step functions –
a significant simplification of the world’s unevenness.
Products, orders, and deliveries are modeled as a set of flows between facilities and costs associated
with flows, abstracting from unique shipments or product units.
Time is represented with periods, e.g. week, month, year. Disruptive or random change can only
occur at the beginning or the end of a period, and not inside it. Any event may happen only once
within a period (e.g. closing a facility). Also, analytical models assume that all parameters are
uniformly distributed within a period.
Analytical models cannot represent actual supply chain behavior, such as process logic, resource
availability, randomness, and time-related dynamics.
Details need to be sacrificed when describing and optimizing a supply chain using an analytical
model. As a result, analytical optimization should not be used for issues that need to consider
detailed logic and time. The optimizers also work as a black box, denying users insight into the
outputs.
Analytical models are ideal for solving supply chain challenges at the network level, when account operational
logic, randomness, and dynamics are not considered. If the problem requires considering any of these,
analytical optimization can still be used to get a first approximation of a solution, then dynamic simulation
modeling used to produce detailed in-depth analysis.
Dynamic Simulation
Dynamic simulation has been less commonly used in the supply chain area until recently, but, with the
evolution of modern simulation tools, more companies are starting to empower themselves with its diverse
capabilities.
A dynamic simulation model is the description of a system and the rules by which it operates – business
process logic, and the interdependencies between system components. Simulation models are dynamic
because they are executable – they can be run to examine behavior over time. In fact, a dynamic simulation
model is a digital twin of a supply chain that allows for experimentation with improvement ideas and to track
metrics. The logic behind your supply chain can be defined using a simulation engine. For example: if on-hand
inventory is less than 50 units, then the warehouse orders 300 units. The most advanced simulation platforms
have pre-built logic that can be flexibly customized to represent the uniqueness of the supply chain. Benefits
of using dynamic simulation are summarized in Figure 5.2.

Digital Transformation of Supply Chains
52
Figure 5.2. Benefits of using dynamic simulation
Dynamic simulation is especially useful when the operational logic and processes inside the supply chain
significantly influence financial efficiency and, as a consequence, need to be accounted for during supply
chain design stage. Some of the challenges that can be addressed using dynamic simulation:
Implementing a new supply chain design.
o How to introduce a solution suggested by network optimization?
o What if the solution suggested by optimization cannot be implemented in the real world?
Understanding supply chain operations.
o To efficiently manage your network, you need to understand how it operates over time and
in detail, down to the level of every resource and policy.
o Estimate safety stock at each facility for each product.
Experimenting with supply chain innovations.
o With a high-level network design in place, you may want to know how to improve
operational performance.
o Ideas can be tested prior to implementation.
Risk assessment.
o What are the risks related to this supply chain structure?
“Inside the four walls” business process assessment.
o How do the internal processes in your DCs or factories influence operations across the
whole supply chain?
Limits of dynamic simulation
Several limitations of dynamic simulation are as follows.
1) When using dynamic simulation, a lot of time and effort must be invested in data preparation and
the creation of the model itself. Building a model from scratch may be a laborious task. Although,
today there are flexible tools that allow analysts to quickly build simulations using out-of-the-box

Digital Transformation of Supply Chains
53
functionality, without losing the capabilities required for complex challenges and in-depth model
customization.
2) The level of abstraction must be carefully considered. Unnecessary details may increase processing
time.
3) Dynamic simulation does not calculate the optimum solution, it can only test different what-if
scenarios to see which one is better. Simulation-based optimization exists, but it is fundamentally
different from analytical, or mathematical, optimization. In the case of simulation, the optimization
engine is a separate program working in conjunction with the simulation model. The optimizer
measures the model output and generates a new set of input parameters based on this data, trying
to better achieve the optimization goals. As a result, a simulation model has to be run many times to
achieve an optimal result, and this can take a lot of time – for really data-intensive models on a
desktop computer this can be days. However, these problems are now being solved, with an
emergence of cloud technologies, and simulation model execution is now moving to the cloud.
Dynamic simulation does not produce an optimal solution from multiple combinations, but allows a
comprehensive study, particularly of dynamic scenarios and supply chain interdependencies. Dynamic
simulation should be used when the supply chain is heavily affected by uncertainties, influenced by a sites’
internal logic and processes, and requires many details to be considered.
Differences between analytical optimization and dynamic simulation are summarized in Table 5.1.
Table 5.1. Summary of differences between analytical optimization and dynamic simulation
Consideration Factors Analytics Optimization Dynamic Simulation
Description of the model
Flows (goods or information) between facilities
The logic (a set of rules) of any process in the supply chain
Time dimension Time as a set of periods (e.g., weeks or months); all the parameters (e.g., shipments) are uniformly distributed within a period
Used only as a unit of measure allowing a dynamic and natural representation of reality.
Risk and Uncertainty Does not consider randomness. Every parameter (excluding input parameters) is predefined and averaged, including naturally varying things like lead times or demand.
Able to vary internal model parameters, such as production time for each unit.
Model Transparency Considered as a “black box”
The processes of producing the results are not transparent
The model can have interactive animation to show the dynamics of what is happening in the supply chain when the model is running
Measurement Metrics
Typically built around a single supply chain KPI – such as costs and profit
Various metrics can be measured simultaneously.
Digital Transformation of Supply Chains
54
Why should Optimization and Simulation be used together?
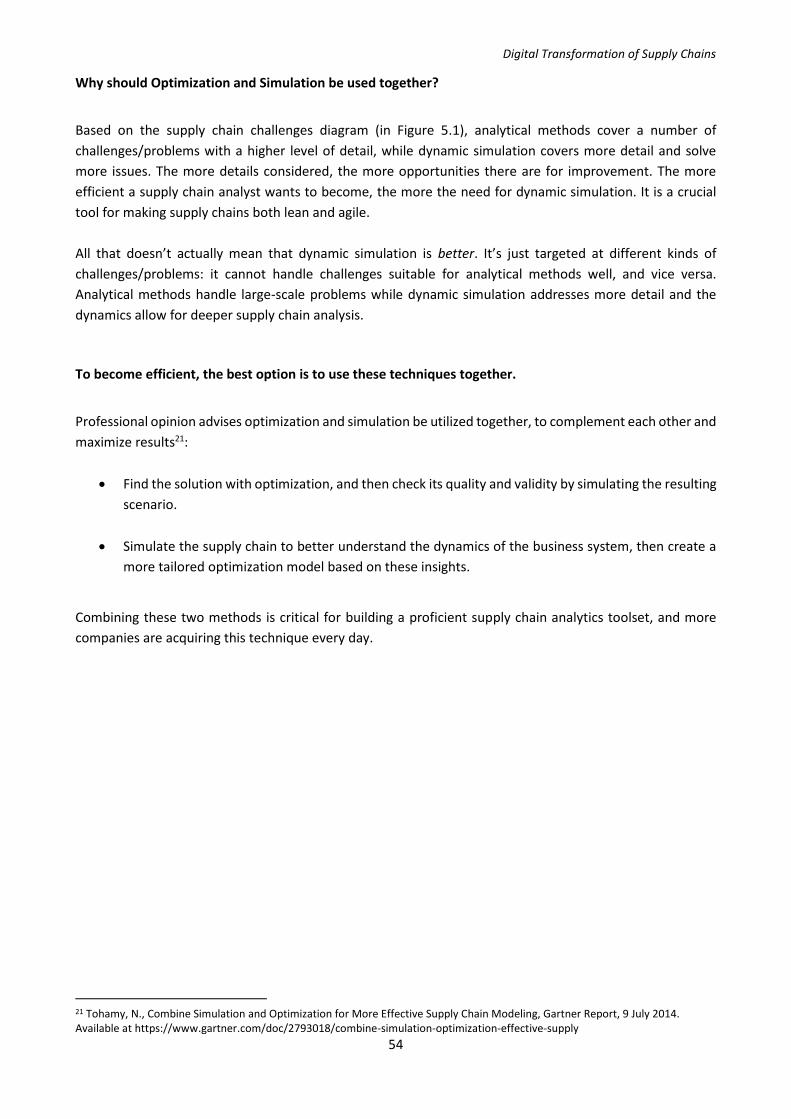
Based on the supply chain challenges diagram (in Figure 5.1), analytical methods cover a number of
challenges/problems with a higher level of detail, while dynamic simulation covers more detail and solve
more issues. The more details considered, the more opportunities there are for improvement. The more
efficient a supply chain analyst wants to become, the more the need for dynamic simulation. It is a crucial
tool for making supply chains both lean and agile.
All that doesn’t actually mean that dynamic simulation is better. It’s just targeted at different kinds of
challenges/problems: it cannot handle challenges suitable for analytical methods well, and vice versa.
Analytical methods handle large-scale problems while dynamic simulation addresses more detail and the
dynamics allow for deeper supply chain analysis.
To become efficient, the best option is to use these techniques together.
Professional opinion advises optimization and simulation be utilized together, to complement each other and
maximize results21:
Find the solution with optimization, and then check its quality and validity by simulating the resulting
scenario.
Simulate the supply chain to better understand the dynamics of the business system, then create a
more tailored optimization model based on these insights.
Combining these two methods is critical for building a proficient supply chain analytics toolset, and more
companies are acquiring this technique every day.
21 Tohamy, N., Combine Simulation and Optimization for More Effective Supply Chain Modeling, Gartner Report, 9 July 2014. Available at https://www.gartner.com/doc/2793018/combine-simulation-optimization-effective-supply

Digital Transformation of Supply Chains
55
Chapter 6.
LEVERAGING THE DIGITAL ECONOMY
– A GOVERNMENT LOGISTICS PERSPECTIVE22
Contributed by Max Ma, ST Logistics Pte Ltd
Current Landscape
Digital economy transformation in the commercial logistics industry is growing very fast. Much of the
traditional value chains are disrupted by the unprecedented technological advances. The Singapore
government is positioning the country as a global logistics hub. The government has set aside $4.5 billion
Industry Transformation Programme under the Logistics Industry Transformation Map (ITM)23. Under the
ITM, the government will work closely with key firms in implementing technologies that “push the frontier
of productive operations in Singapore”. Singapore’s global logistics performance index was ranked 1st in
Asia 24 . Leading manufacturers like Henkel and Infineon base their Supply Chain Control Towers 25 and
Distribution Centres in Singapore to orchestrate their regional and global supply chains. For the logistics
sector serving the Singapore government, it is catching up in digital transformation too.
For government logistics, the shift in focus is to Business-to-Government (B2G) where it relates to trade in
products and service between businesses and government. A different way of organizing the supply chain
and distribution network is needed to fulfil the B2G logistics demands. This case study focuses to navigate
infrastructure and logistics assets to fulfil government logistics demands by answering the following business
questions:
1. What challenges do we face in government logistics vis-a-vis commercial logistics?
2. How does digitisation help to navigate in such an environment to track the entire end to end supply
chain for government logistics better?
22 This chapter is based on the joint work between The Logistics Institute – Asia Pacific (TLI-AP) and ST Logistics Pte Ltd under the A*STAR Integrated Supply Chain and Logistics project (grant number 152 42 00055). 23 The Straits Times, Road map to boost Singapore's role as global logistics hub, 17 Nov 2016, available at http://www.straitstimes.com/business/companies-markets/road-map-to-boost-singapores-role-as-global-logistics-hub 24 The World Bank’s 2016 International LPI Global Ranking. 25 EDB Singapore, Logistics and Supply Chain Management, 2018, available at https://www.edb.gov.sg/en/our-industries/logistics-and-supply-chain-management.html

Digital Transformation of Supply Chains
56
Challenges
As the nation embarks on the smart nation initiative, the logistics sector serving the government should drive
out business impediments both in regulations and costs to fully benefit from the digital transformation wave.
Several challenges are described below. Firstly, unlike commercial logistics, selling into the local government
is a different proposition. Firms bidding into government logistics works are preferred to be based locally as
it is seen as less risky. Often, logistics is seen as a critical function to support government operations and
strategic partnership is formed between the Logistics Service Provider (LSP) and the government. The service
required is usually on-site and time critical. Hence offshore outsourcing efforts are generally discouraged.
Second, government institutions has to exercise prudence in spending for outsourced activities. One such
example would be the cut in ministries’ spending to stay ‘prudent’ during Budget 201726. Logistics company
have to deal with issues such as cuts in public spending due to government budget changes which translates
to more emphasis on cost competitiveness rather than value.
Third, the preference for logistics service that aligns to Singapore’s smart nation initiative. The smart nation
initiative was launched as an enabler to facilitate innovation by the public and the private sector27. Under
the initiative, there has been constant push by the government for smart solutions where digital technology
can be operationalised for daily work.
Lastly, the nature of government logistics service covers government to government (G2G) as well. G2G is
the relationship between organizations (subjects) of public administration. One such example is in the area
of humanitarian logistics that specializes in warehousing and delivery during natural disasters or national
emergencies, as well as the operational deployment of critical supply chain and logistics management in-
theatre. As Singapore is geographically shielded from natural disasters, humanitarian logistics revolves
around supporting regional Humanitarian Aid and Disaster Relief (HADR) efforts and as well as local critical
nation-wide emergencies.
Digitization of B2G Supply Chain and Logistics
The proliferation of the digital economy enables interconnectedness between consumers, systems and
providers. There is a seamless flow of information on transactions that facilitates agile and adaptive supply
chain. Although the nature of government logistics might differ from commercial logistics, the supply chain
operations under the government business could benefit from it.
Government logistics requires speed, agility, visibility and ‘zero’ lead time activation. To achieve such
outcome, there is a critical need for visibility in the supply chain. Visibility is defined by the awareness of, and
control over, specific information related to product demand forecast, orders and product supply and
inventory plus physical shipments, including transport and other logistics activities, and the status of events
26 The Straits Times, Budget 2017: Singapore cuts ministries’ spending to stay ‘prudent, effective’, 20 Feb 2017, available at https://www.channelnewsasia.com/news/budget2017/news/budget-2017-singapore-cuts-ministries--spending-to-stay--prudent-7595228 27 Smart Nation Singapore, About Smart Nation, 9 Nov 2017, available at https://www.smartnation.sg/about-smart-nation/enablers

Digital Transformation of Supply Chains
57
and milestones that occur prior to, and in transit28. Visibility can be made possible with digitisation which can
eventually progress to a one stop information hub which is commonly termed as a supply chain control tower.
The supply chain network that is set up in today’s context is often siloes and customer-centric. This is
especially so for government institutions where vendors in the supply chain are segmented so that the entire
end to end supply chain is not controlled by a single supplier for strategic reasons. This has resulted in a
fragmented way of coordinating supply chain operations, and as network gets more complex, it exacerbates
the gaps between each node in the supply chain. An ecosystem driven by the digital economy is able to offer
a digital supply network. Every node within the supply chain when supported by key technologies is able to
provide an aggregated view of information supporting an end to end supply chain coordination. This is largely
possible when every step is digitised and made “visible” remotely.
Digitisation is not without challenges. Stovepipe processes, legacy systems and manual paperwork remains
the backbone driving supply chain operations in the government sector. However, the government in the
recent years has advanced rapidly to make available open data such as real time traffic conditions, carpark
availability to third party developers to incorporate into their logistics solutions. Also, the government has
started smart initiatives such as contactless payment for public transport and spaces to test bed autonomous
technology. Considering the challenges of government logistics and the opportunities of digital economy, we
will use a home grown national logistics company as a case study on how it benefitted from digital economy
to make operations more efficient.
Conclusion: Support of Government Logistics Made Better by Digitized Supply Chain Control Tower
Digitisation helps in improving the end to end supply chain visibility. Visibility, in itself being the most
important factor to handle many ills effecting supply chains, helps to solve many problems. As discussed,
few areas where it has direct impact as experienced by the company in our case study, are risk management,
humanitarian supply chain etc. Also with the unique challenges brought about by the government logistics,
digitisation helps us to break the decentralized way of operating of government supply chains. The digital
supply chain has the potential to break these impediments and increase the efficiencies.
The case study such as SiTadeL (in Box 1) is a coordination mechanism to provide facilitative functions for
assisting the understanding of risk propagation and coordination of network-based risk management in a
sustainable way across networks. Facilitative function of the control tower can aid disrupted logistics in these
area: (1) Provide full visibility of the affected region for route planning purposes; (2) Anticipates risk and
provide alternatives for the agencies involved; (3) Caters for innovative supply chain solutions
28 Heaney, B., Supply Chain Visibility and Segmentation: Control Tower Approach, Aberdeen Group Report, 2014

Digital Transformation of Supply Chains
58
Box 1: A National Logistics Company with a Supply Chain Control Tower
Close Monitoring of Supply Chain Made Possible by Supply Chain Control Tower
By embracing IT connectivity, big‐data analytics, mobile computing and intelligent design in business
systems, ST Logistics (STL) is geared towards the potential increase that Smart Technology has to offer
in workforce productivity. STL has developed a Supply Chain Control Tower (SiTadeL)- a broad
spectrum IT platform that would function as a decision support system for achieving strategic, tactical
and operational visibility of the business. SiTadeL provides visibility to the upstream of the supply chain
where it begins with the supplie/manufacturer. SiTadeL as an information hub, is able to capture and
use the necessary data for decision making, provide resilience to supply chain disruptions and allow
operations to be excuted in a single operational hub. In daily operations, the risk resilience platform
monitors ‘live’ events occurring globally and sends notification to operations personnel on their area
of operations/supplier’s location. When an event/disaster occurs and affects the supplier, the
prescriptive module is activated. Mitigating actions can be meted out in accordance to actions that
system suggests, and the event is tracked in a methodical manner until the supply chain disruption is
restored. ‘Live’ monitoring of suppliers is important to STL business where the suppliers are supplying
important government agencies with products and equipment necessary for the nation’s well-being.
With SiTadeL, the risk resilience of STL’s supply chain is more robust and STL is able to serve their
government customers with better supply chain management.
STL manages their supplier’s health through
risk index. Quantitative approaches suitable
where sufficient is data is available. Statistical
methods are used to evaluate specific risks
where objective input (e.g. historical data) is
available. Using statistical moments, risks may
be stated in a variety of ways: mean, expected
value or standard deviation. In STL case,
quantitative risk assessment approach is
adopted using an agent based simulation.
Simulation program models the supply chain
operations of the government business using Agent based methodology. This allows the model to be
scalable permitting new additions of entities i.e. customers, warehouses, suppliers and products. A
Value-at-Risk (Var) of revenue loss can be calculated and based on the VaR, revenue importance,
financial risk and product criticality, a weight risk index is derived to dynamically track supplier’s
performance.
As the government sector opens up to cashless and paperless transaction, STL capitalize on the
opportunity to digitize their operations to serve the government customers as well. In the commercial
industry, there has been unprecedented growth in electronic ordering platform such as Qoo10,
Lazada..etc to support the eCommerce boom. Similarly, in the government sector, STL supports the

Digital Transformation of Supply Chains
59
eCommerce initiatives by customizing electronic ordering platform for their customers in MINDEF,
MHA and MOH. These electronic ordering platform coupled with partnership with last mile delivery
platforms supports a seamless order to fulfilment eCommerce ecosystem. This can happen as SiTadeL
takes the extension of application to a mobile application that allows any delivery drivers to manage
their task and navigate to the delivery location. STL is pushing for all their government customers to
adopt the electronic Proof-Of-Delivery (“ePOD”) as an effort to go paperless. In addition, as the ability
of SiTadeL spans across from ordering to fulfilment platforms, it enables data mining of valuable data
that drives insights such as consumer’s consumption pattern, resource utilization and efficiency of
service to value add to STL’s offering. Such data analytics can only be made possible with the
government agency’s willingness to join STL in effort to leverage on the digital economy.
SiTadeL’s Freight solutions track goods from the
different ports around the world to Singapore.
The web-based tracking platform allows the
monitoring statuses of goods, orders and
shipments, quickly and real-time. This platform
is customer friendly that customers are able to
access or enter data for shipment, declarations,
orders, security filing, inventory, receipts and
accounting information, saving time and
reducing data entry work for the operational
staff. For last mile delivery during freight
shipment, SiTadeL supports vehicle telematics.
The geo-fencing capabilities enables alert when
vehicle breaches the out of bound regions.
‘Live’ stream images in vehicle cabins and road
conditions are also available for secure tracking
of valuable goods.
In addition, immobilizers can be installed in
every vehicle to disable movement when security is compromised. SiTadeL is STL Supply Chain Control

Digital Transformation of Supply Chains
60
Tower that is operational in Toll City (owned by Toll). With SiTadeL as an enabler, STL is able to provide
the customers with a resilient supply chain and providing an end to end supply chain visibility.

Digital Transformation of Supply Chains
61
Chapter 7.
Computational Modelling and Robotic Process Automation
for Healthcare in Singapore29
Contributed by Prof. Mark Goh, Director (Industry Research), The Logistics Institute – Asia Pacific, National University of Singapore
The population of many countries around the world is rapidly ageing (see Figure 7.1). An ageing population
would bring challenges to the healthcare systems around the world through the increased share of elderly
citizens and chronically ill patients as well as higher demand on the supply side of a hospital to deliver faster,
better, cheaper if possible. There is thus a need to strengthen healthcare services for the elderly and the sick,
both now and in the future. At the same time, with an ageing population particularly in the workforce, labour
productivity has to keep up with rapidly changes in technological developments and maintaining the same
level of patient care. Singapore is no exception. Figure 7.2 demonstrates the gap between hospitalization
demand and labour force increment.
Figure 7.1. Rapidly ageing population in Singapore
29 TLI-AP gratefully acknowledges the support of A*Star and the NRP in funding this project and for all the assistance rendered.

Digital Transformation of Supply Chains
62
Figure 7.2. Gap between hospitalization demand and labor force increment30
As such, there is an imperative for our healthcare system to innovate, work smarter on all levels, leverage on
practices used in other sectors, and maintain the same level of productivity. Hospitals in this regard need to
consider ways and means to improve operational efficiency and productivity in order to be able to treat more
patients without increasing cost, and justify the cost of capital investment. Most of the healthcare institutions
in Singapore realise the inevitability of manpower challenges especially at the bottom of workforce pyramid,
and have adopted more process based technologies, particularly in robotics and automation. In the hospital
of tomorrow, Robotic Process Automation (RPA) will be a part of the Internet of Things (IoT) to assist the new
mission. Put simply, ancillary service workers e.g. porters and nurses will in future co-work and collaborate
closely with robots (cobots/ umeebots) in a shared workspace to deliver the same level of patient care if not
better. Robotic equipment will replace the more labour intensive, repetitive low value added, mundane rule
based tasks that needed to be attended to in any hospital such as linen delivery within a hospital, food service
to the wards at regular meal times, consumables such as adult diapers, and prescription labelling and
dispensing to the patients.
For this to happen, there is a need for a deeper and richer understanding of how human effort can be
integrated seamlessly with RPA activities in a hospital setting and to visually show to the operations/ logistics
personnel in a healthcare institution the attendant challenges/ bottlenecks. Further, in doing so, the new
workflows in particular for hospital logistics need to be re-designed to suit both man and machine to work
effectively and nimbly as much as possible. Robots and automated equipment will then take care of the
transactional activities in a hospital setting while the existing and new healthcare folks will reap the benefits
of working on the less repetitive, more valuable, and higher skilled hospital operation related activities. This
frees up scarce resources, improves productivity, reduces unnecessary wait time, and ensures better
allocative efficiency. However, before we can arrive at this point, there is a need to understand where the
operational challenges lie and how to circumvent them through simple operations analysis techniques such
as value streaming, workflow optimization, and bottleneck smoothing. Therefore, building a virtual simulator
to show the “guts” (supply chain) and materials flow of a hospital is instructive to guide operational decision
making and investment.
The main objective of this simulation/ computational modelling project undertaken by TLI-AP is to enhance
the productivity and reduce the bottlenecks of processes related to the different supply chains of several
hospitals in Singapore. The primary supply chains considered include Consumables, the Central Sterile
30 Figure generated from public domain data provided by Government of Singapore.

Digital Transformation of Supply Chains
63
Services processing (CSSD), Food, Pharmacy, and Linen. This project is a part of the National Robotics Program
designed to develop robotics technologies to address national challenges such as an ageing workforce and
lagging productivity, and to build capabilities to support organizations in their business model
transformations through leveraging on smart technologies.
Problem statement
This study is divided into two phases. In Phase I, an extensive time motion study involving data collection
will be undertaken, followed by a value stream mapping of the current set of logistics activities in a typical
hospital. Thereafter, an As-Is simulation model will be built for a hospital’s supply chain in three dimension
space. The 3-D simulation model will map the existing materials flow, identify areas of waste or inefficiencies,
highlight the opportunities for using RPA, and detect potential bottlenecks in the existing workflows.
In Phase II, a To-Be simulation model will be built for a hospital’s supply chain by considering new healthcare
facilities (medical centres, hospital towers) to be built alongside the RPA. A comparative analysis will be
conducted to measure the improvement in the respective areas.
Figure 7.3. Project block diagram
RoA opportunities
Floor Plan
Dispatching Area
Receiving Area
Staff Routing
Vehicle Routing
3D building model
Simulator validation
Automation solutions: AGV, service robots
Work Flow
Food
Linen
Pharmacy
CSSD & MMD
Route network
optimization Integrated
Consolidated

Digital Transformation of Supply Chains
64
Techniques used
Several techniques were applied in this study. They include the following:
1. Time motion study: This approach involves a direct and continuous observation of a mundane task that
forms a part of the typical cycle of activities in a hospital material flow. Normally, we use a time-keeping
device to record the time taken to accomplish that task. With the primary data collected, we then
conducted a time motion analysis to build the necessary distribution as input to the simulator for our
computational modelling work. Figure 7.4 provides an example of this technique and outcome.
Figure 7.4. Time motion analysis
2. Value Stream Mapping (VSM): VSM is a lean management tool used widely in supply chain or logistics
studies to analyse the current state of activities from start to finish of a defined process. We used the
software eVSM to identify the process and wait times for each activity of a hospital’s supply chain. The
non-value added times (muda) for a receiving, and scheduled versus non-scheduled in-house delivery
process are thus identified, as shown in the sample examples found in Figures 7.5 to 7.7.

Digital Transformation of Supply Chains
65
Figure 7.5. Generic VSM of receiving process
Figure 7.6. Generic VSM of scheduled distribution process
Figure 7.7. Generic VSM of non-scheduled distribution process

Digital Transformation of Supply Chains
66
3. SketchUp: The software SketchUp Pro is a useful and cost effective CAD tool to construct a scaled and
accurate 3-D visualiser of a facility, which will be imported into the virtual simulator to provide a physical
sense of the workflow.
4. Discrete-Event Simulation: The DES as a part of the core computational modelling effort models the
operation of a system as a discrete sequence of events in time. Each event occurs at a particular instant
in time and marks a change of state in the system. Between consecutive events, no change in the system
is assumed to occur. Thus, the simulation can directly jump in time from one event to the next. We built
our simulator using the software Simio (University edition). Figure 7.8 is a mock-up of the 3-D virtual
simulator for an 8-floor building including the basement for AGV docking, done on SketchUp and Simio.
Figure 7.8. Simulation model
Preliminary results and discussion
In this section, we present some sample simulation results for Phase I. The simulator has built a transporter
usage (Table 7.1), resource state log (Table 7.2), resource usage log (Table 7.3), workforce schedule (Figure
7.9), and the workflow constraints analysis (Table 7.4). Table 7.1 highlights to the user the state of a particular
AGV in use on a work trip of a particular work shift on a particular day of the week. Table 7.2 shows the state
of utilization as simulated by Simio. This can be used to compare the productivity offered through RPA. Table
7.3 depicts the simulated workforce level utilization of a staff or work team either in transporting,
transferring goods, or waiting for a lift. Figure 7.9 presents a simulated workforce schedule of a particular
shift. This is useful for daily workload balancing incorporating both activities that involve humans and
machines. Finally, Table 7.4 is the data derived from the virtual simulation of a material flow for a particular
supply chain in hospital on the workflow constraints analysis. Such a result can provide useful data driven
(though simulated!) evidence of potential areas of bottlenecking after implementing RPA.

Digital Transformation of Supply Chains
67
At the point of writing, we are now testing the rules of movement and contact for some logistics flows in a
hospital. For instance, the road network inside of a hospital facility is fixed by design. All AGVs move on the
left and priorities are allocated at the intersection of passageways. Further, the how the queues should be
formed at the dispatching areas in order to avoid flow congestion at the intersections or in front of lifts. TLI-
AP has also developed an optimal schedule for the AGVs and optimal delivery time windows for each supply
chain.
Table 7.1. Transporter usage log
Table 7.2. Resource state log
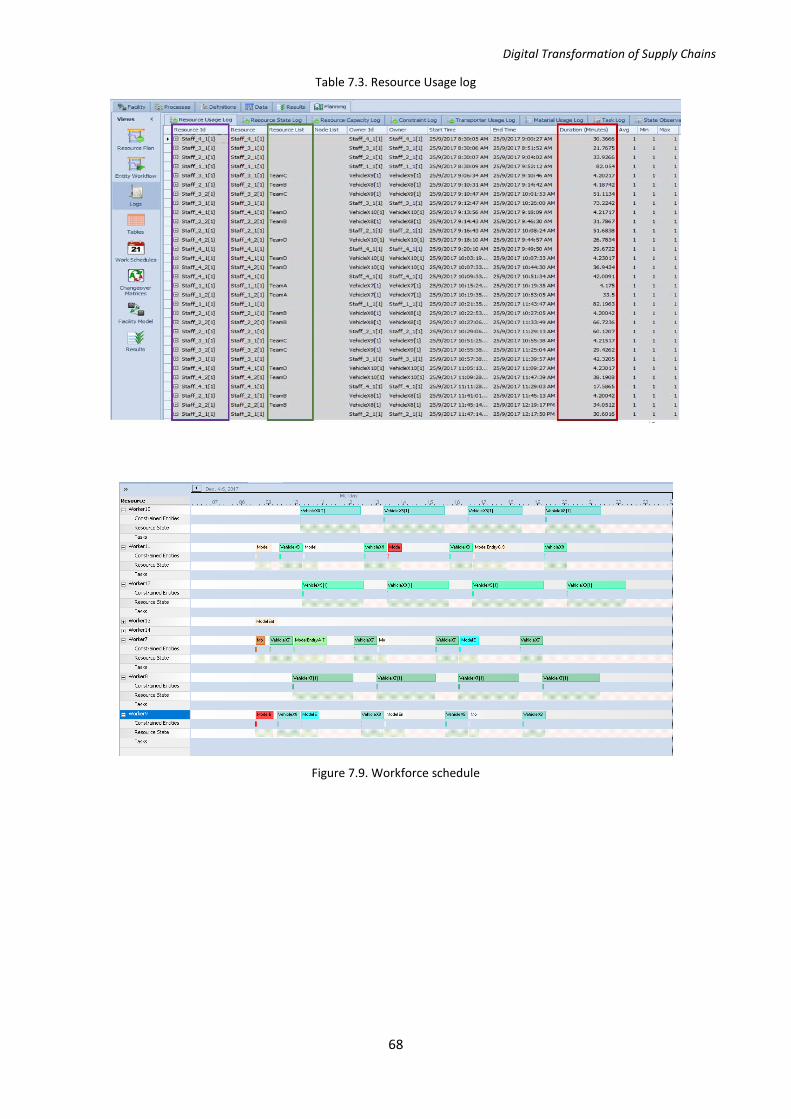
Digital Transformation of Supply Chains
68
Table 7.3. Resource Usage log
Figure 7.9. Workforce schedule

Digital Transformation of Supply Chains
69
Table 7.4. Workflow constraints analysis
Summary
A computational model have been developed to display the behavior an actual complex hospital logistics
system using computer simulation, executed on Simio. The As-Is simulator is validated by primary data
collected through VMS and time motion studies. Further, several 3-D facility models of, associated with
logistics dispatching area, receiving area, staff routing, vehicle routing, lift entry, ward sizes, lift locations,
and AGV docking stations have been built. Through this tool, scenario planning can be performed and
situations tested through the computational experiments to gain a realistic understanding of how RPA can
complement human effort for maximal resource usage and productivity gains.

Digital Transformation of Supply Chains
70
CHAPTER 8.
LOGISTICS PREPAREDNESS FOR DISASTER RESPONSE
IN INDONESIA
Contributed by Dr. Robert de Souza, Executive Director, Giuseppe Timperio and Lee Cher Kian, The Logistics Institute – Asia Pacific, National University of Singapore
OVERVIEW
Located on the edges of two
continental and two oceanic
tectonic plates, Indonesia is home
to more than 500 volcanoes (128
of which are active), and
threatened by some of the
greatest seismic activity in the
world. Furthermore, much of this
activity is offshore and brings the
significant added risk of tsunamis
(as shown in Figure 5.1). The
country experiences recurring
small/medium scale natural
disasters compounded by a high
risk of less frequent, but very
large-scale, natural disasters that
necessitate a system wide
international humanitarian
response.
Source: From Indonesia Natural Hazard Risks, by United Nations
Office for the Coordination of Humanitarian Affairs - regional Office for Asia
and the Pacific (OCHA ROAP), ©2011 United Nations. Reprinted with the
permission of the United Nations
Figure 8.1. Hazard risks map Indonesia (earthquake and tsunami)
When disasters strike, especially in remote areas of the Indonesian archipelago, existing response
capacities are invariably stretched. Besides operational challenges brought about by the country’s
geographical characteristics, national disaster response capabilities are further limited by:
Poor logistics infrastructure, especially in remote areas;
Lack of facilities to store, handle, and consolidate humanitarian cargo for distribution in disaster
affected areas.

Digital Transformation of Supply Chains
71
CHALLENGES
This case study focuses on navigating infrastructure and logistics assets for pre‐positioning critical relief
supplies in Indonesia. The research question is formulated as:
What is the most optimum network configuration for prepositioning stockpiles of life‐saving goods
in Indonesia to distribute in the aftermath of disaster events?
How does the network selected using a network optimization approach perform in response to
sudden onset calamities in Indonesia?
SOLUTION APPROACH
To address the identified research question a multi‐phase framework was conceptualized as summarized in
Figure 8.2:
Phase 1. Identification, assessment, and selection of suitable locations for facilities;
Phase 2. Structuring and optimizing the supply network;
Phase 3. Simulating and measuring supply network performances.
Figure 8.2. Integrated Decision Support Framework for Facility Prepositioning
Phase 1. The project began with the identification of all potential candidate locations, and the subsequent
selection of suitable network nodes. This phase was undertaken through an ad‐hoc decision support
framework which fully leveraged operational research techniques.
Based on the following premises:
Twenty‐one cities were initially identified as potential nodes;
Eight criteria were defined;
Fuzzy AHP (f‐AHP) using synthetic extent value method was used to determine criteria weightage.
Nine locations were selected as suitable sites for siting relief facilities. In light of the network design
requirements31 set by the national government, only six strategic locations are to be selected.
31Indonesia national master plan for the acceleration and expansion of the country over 2011-2025 identifies six economic corridors, which for humanitarian response were further organized in the geographies of 1) Sumatra, 2) Java-Bali-East Nusa Tenggara (NTT)-West Nusa Tenggara (NTB), 3) Kalimantan, 4)Maluku, 5)Papua, and 6) Sulawesi. Each of the six main Indonesian islands is requested to be equipped with its own emergency response facility (DC).

Digital Transformation of Supply Chains
72
Phase 2. Using a simulation software, the optimal configuration for the prepositioned network was defined.
The most appropriate six locations were identified, and the optimal flows across the nodes were computed.
Particularly, demand data of a) Eleven big scale humanitarian emergencies affecting the country in the period
2004‐2016 and b) 489 recurrent small/medium scale disasters for the biennium 2014‐2015 32 were
considered. Optimizations were conducted on the various what‐ifs scenarios and identified the best supply
chain configuration in terms of response time, risk exposure, and logistics costs.
Phase 3. A discrete event simulation model was built, and a two tiers supply chain (as shown in Figure 8.3)
was considered. Simulation setting includes a single sourcing strategy from Distribution Centres (DCs) to
beneficiaries, and demand being triggered by actual events as well as potential forceful disasters which are
assumed to occur in two highly populated areas in the islands of Java and Sumatra.
Figure 8.3. Supply Chain Design Structure
OUTCOMES
Four different experiments (summary on Table 8.1, with illustrations on Figure 8.4) were run as to capture
operational performances of feasible network configurations.
Alternative solutions were analysed and cross compared, with the “basic configuration” fixed as reference
point. Using network optimization tool in modelling the logistics preparedness for disaster response, this case
study improved the capabilities to cope with disasters by achieving an average transportation time to
disasters affected zone of 0.23 days33. Compared to the basic solution identified through operations research,
the network identified via Network Optimization tool reduces transportation cost by 29%, with no
compromise to be made on the service level.
The simulation consisted of robustness and resilience stress tests of the optimum solution of phase 2, which
is configuration 3 from Figure 8.4. Experiments were performed subject to historical demand, 489 recurrent
small/medium scale disasters for the biennium 2014-2015, and two major disaster scenarios respectively in
Sumatra and Java. By using a dynamic simulation approach (illustrated in Figure 8.5), supply chain
32 Considered disasters include 431 floods, 18 landslides, 13 volcano eruptions, 13 floods with landslides, 8 droughts, 3 forest fires, 2 tornadoes, and 1 tsunami with more than 500 people affected. Available at www.dibi.bnpb.go.id. 33 Lead time considers only geographical distance, with no considerations on disruptions and infrastructural damages in affected zones.

Digital Transformation of Supply Chains
73
performances such as lead time, fleet size, service level, and transportation costs were accurately computed
and observed over time.
Table 8.1. Description of Selected Experiments
No. Network Nodes/ Configuration Defined by
1 Pekanmbaru, Surabaya, Banjarmasin, Ambon, Timika, Manado (Figure 8.4.a)
Timperio, et al. (2017), and named “Basic Configuration”34
2 Surabaya, Banjarmasin, Ambon, Medan, Jayapura, Makassar (Figure 8.4.b)
Timperio, et al. (2017), and named “High Infrastructure Capacities”34
3 Surabaya, Banjarmasin, Ambon, Timika, Manado, Medan (Figure 8.4.c)
Analytical solver, and named “Optimized Solution”
4 Surabaya, Banjarmasin, Ambon, Manado, Medan, Jayapura (Figure 8.4.d)
Analytical solver, and named “Second best Optimized Solution”
Figure 8.4. Alternative Network Configurations
34 See: How to Identify the Most Appropriate Locations for Establishing an Efficient Network of Emergency Response Facilities (Vol 16-Mar-HL)
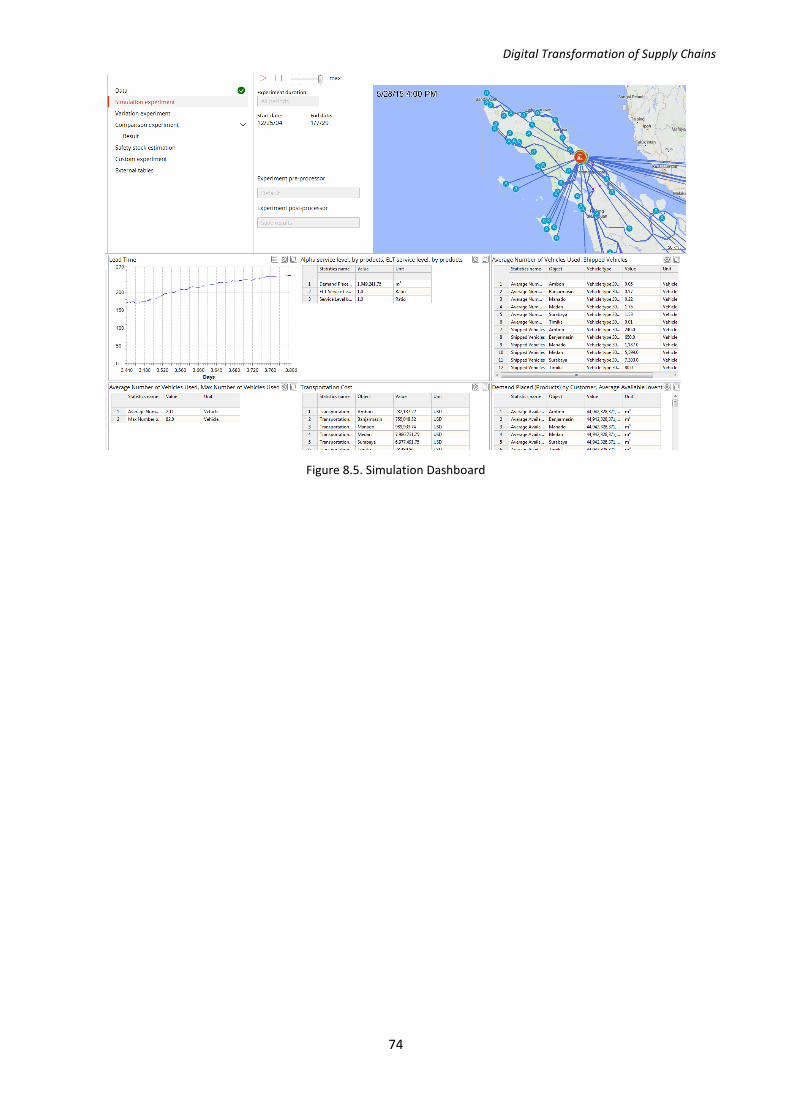
Digital Transformation of Supply Chains
74
Figure 8.5. Simulation Dashboard


TLI-Asia Pacific White Paper Series on Supply Chain Risk Management includes:
Supply Chain Identification in an Uncertain Future – Concepts, Methods and Tools (Jan 2017)
Supply Chain Risk Mitigation
(Vol 13-Nov-RISK)
Challenges in Managing The Unexpected (Vol 15-Apr-RISK)
Risk Management of Complex
Supply Chains Part 1: Supply Chain
Risk and Complex Systems
(Vol 12-Nov-SCI09)
Networked Supply Chains – Addressing 11 Challenges in Robustness and Resilience (Vol 14-Mar-RISK)
Risk Management of Complex
Supply Chains Part 2: Network
Analysis for Supply Chain Risk
Management
(Vol 12-Nov-SCI10)
Master Facilitative Control Tower for Risk Management of Complex Supply Chains – An Overview
(Vol 13-Nov-RISK)
Risk Management of Complex
Supply Chains Part 3: Technologies
for Supply Chain Risk Management
(Vol 12-Nov-SCI11)
Master Facilitative Control
Tower and Visualization
Framework
(Vol 13-Nov-RISK)
A Risk Management Framework for
Supply Chain Networks
(Vol 07-Aug-SCO03)
Advances in Supply Chain Risk
Analysis
(Vol 13-Nov-RISK)
Please visit www.tliap.nus.edu.sg for more reports.

The Logistics Institute – Asia Pacific National University of Singapore 21 Heng Mui Keng Terrace, #04-01
Singapore 119613 Tel: (65) 6516 4842 Fax: (65) 6775 3391 E-mail: [email protected] Website: www.tliap.nus.edu.sg