Embed Size (px)
Citation preview

International Journal of Scientific & Engineering Research Volume 4, Issue3, March-2013 1 ISSN 2229-5518
IJSER © 2013 http://www.ijser.org
Thickness evaluation of asphalt and base layers of some major and minor arterial roads in Kumasi
using ground penetrating radar Mohammed hadi, Kwasi Preko
Abstract The asphalt and base layer thicknesses of major and minor arterial roads in Kumasi were investigated to determine possible structural defects. Measurements were both done on newly constructed flexible pavements and older ones. The MALA GPR unit was used with the 800 MHz ground-coupled shielded antenna in the common offset mode and the equipment was calibrated to probe up to a depth of 1 m. A longitudinal profile of average length 1.5 km each was taken on ten different flexible pavements, at approximately 1.5 m from the outer edge of the respective pavements. In addition, single sample cores were picked from each study site to calibrate the GPR results. The estimated average asphalt layer thickness range of the major arterial pavements was 110 - 141 mm ± 19 mm as compared to the designed thickness of 150 mm, with an accuracy of within 4 – 8% when compared to sample cores from the roads. The average base layer thickness estimated was 155 - 171 mm ±21 mm for the designed value of 200 mm, with 5 – 7% accuracy from core measurement comparison. Although the estimated layer thicknesses of the newly constructed were within the acceptable range, it was found that the layer thicknesses measured were below the layer thicknesses as specified in the construction details. The minor arterial roads had an average asphalt layer thickness range of 91 - 99 mm ±22 mm, against the designed thickness of 102 mm. Average values of relative dielectric constant of the asphalt layers were estimated in the newly constructed roads and its variation along the roads were used to locate potential low density section of the asphalt layers. Poor layer interfaces were recorded along the roads surveyed mostly in the older ones. Such defects noticed in the older roads were partly attributed to the extensive loading by heavy duty trucks as many industries are located in the area. However, defects in the new roads were apparently due to poor construction practices. The GPR method’s fast and non-destructive survey provides a fine alternative to the visual pavement condition evaluation method presently used in Ghana. Keywords: asphalt thickness, flexible pavements, relative dielectric constant, ground penetrating radar, road condition evaluation, non-destructive testing, asphalt density, Global Positioning System.
1. Introduction
Quality assurance of finished contractor jobs in traffic infrastructure of most developing countries is often based on ad-hoc visual inspections which may include both structural and functional pavement conditions. Most roads in Ghana experience pavement failures shortly after their construction as manifested in road surface defects such as rutting, stripping, cracks etc, thereby necessitating prompt
maintenance interventions. Such failures are caused partly
by a lack of specialized geotechnical tests to determine reliable input parameters, and partly by poor construction
practices used on the projects [1]. The methods often used by local government engineers in road condition evaluation are mostly visual. Thus, important structural features of the road such as layer thickness and density are not efficiently assessed after completion.
Deformations of flexible pavement are mainly caused by continuous traffic loading as well as changing environmental conditions, such as temperature and rainfall or moisture. Such deformations are manifest on the surface of the road pavement in the form of cracks or potholes, in which case they are visible and, therefore, are easily detectable by visual inspection. Pavement deformations could also begin developing in the subsurface layers over time until they reach the surface. These internal defects are typically caused by extensive loading, weak sub-grade, and/or entrapped moisture. The accumulation of moisture in the aggregate base and sub-grade layers, causes a decrease in the material resistance to permanent deformation caused by heavy traffic loads. Moisture can also be trapped within the Hot Mix Asphalt layers, thereby weakening the bond between asphalt and
———————————————— Mohammed Hadi is currently pursuing masters degree program in
Geophysics at Kwame Nkrumah University of Science and Technology (KNUST), Kumasi, Ghana. E-mail: [email protected]
Kwasi Preko is currently a senior lecturer at KNUST Kumasi, Ghana . E-mail: [email protected]

International Journal of Scientific & Engineering Research Volume 4, Issue3, March-2013 2 ISSN 2229-5518
IJSER © 2013 http://www.ijser.org
aggregates, which can result in raveling. Raveling is typically limited to the pavement’s surface, and as such contributes to a reduction in the functional rather than the structural performance of a pavement Road evaluations are carried out to assess the functional and structural conditions of road pavement sections either for purposes of routine monitoring or planned corrective action. The various methods include destructive methods (such as coring, drilling and pit excavations), which are often used for calibration and verification purposes only. The other category of methods are collectively termed the Non-Destructive Testing (NDT) techniques which include; the Benkelman beam, Falling Weight Deflectometer (FWD) or dynaflect [2], Spectral or Seismic Pavement Analyzer (SPA) [6], linear polarization techniques, half-cell potentiometer, ultrasonic, infrared thermography, video imaging, profilometers and Ground Penetrating Radar (GPR) [4]. Non-Destructive Tests (NDT) are the pavement evaluation methods conducted on pavements to assess in-situ properties using scientific equipment. Results from NDTs can be used to evaluate the need for further destructive tests. Unlike the destructive methods, these methods do not require subsequent maintenance work at the site and they minimize disruption to traffic. NDTs could also assess both structural and functional conditions of a pavement. Maser and Scullion (1992) used the GPR method to determine the asphalt and base layer thicknesses of pavements in Texas in which the asphalt thickness was found to range from 50 – 250 mm whereas the base layer thickness varied from 175 – 300 mm. The accuracy of the radar predictions for asphalt thickness was within 8 mm (4%) using the radar data alone, and within 2.75 mm (1.4%) when one calibration core was used per site. Moreover, fourteen asphalt test sections were evaluated in Kansas by Roddis et al (1992) and the pavement thickness ranged from 75 – 500 mm. In their study, the GPR surveys were calibrated with 73 ground-truth measurements and the results indicated that blind estimates of asphalt thickness were found to be within 10% of actual thicknesses. In recent years research on GPR has been focused on different types of applications on low traffic volume roads, both paved and gravel roads [7], [10], [11]. The advantages of using GPR include rapidity of measurements, non-invasive nature of the technique, and the ability to detect defects before they reach an advanced stage. The most important application of GPR in pavements is the determination of different layer thicknesses. These data are useful for overlay design, predicting pavement life, and as input for other testing techniques such as the Falling Weight Deflectometer [4].
This paper investigates the use GPR to estimate the layer thicknesses of asphalt concrete wearing course as well as base layer course in both newly constructed roads and already existing ones in Kumasi. The GPR method used is expected to provide estimates of the asphalt and aggregate base layer thicknesses of the surveyed roads, with some margin of error anticipated. The results are further expected to provide technical advice to the local government engineers for use in their routine quality assurance of pavements and development of rehabilitation strategies for older pavements in Ghana and as an alternative to the conventional visual method often used.
2. The Ground penetrating radar (GPR) method and theoretical background
2.1 Theoretical background
GPR technology involves the transmission of short pulses of electromagnetic energy into the ground, and the measurement of the time elapsed between the transmission and reception of the wave by a surface radar antenna, after reflection in an electrically inhomogeneous layer. The amplitudes and arrival times of the received pulses carry vital information about the electrical conductivities or dielectric coefficients of the material layers. Depending on the dielectric coefficient of the layers penetrated, part of the transmitted energy is reflected whereas part is absorbed (fig.1). Thus as shown in fig.1, the observed peaks in amplitudes represent the pavement surface reflection (A1), the asphalt-base interface reflection (A2), and the base-subgrade interface reflection (A3) respectively. Further, the time interval (t1) between the peaks A1 and A2 represents the two-way travel-time through the asphalt pavement layer, and the time interval (t2) between peaks A2 and A3 represents the two-way travel-time through the base layer etc. The thicknesses of each layer (hi) can be calculated by hi = viti/2 (1)
where vi is the propagation velocity through each layer.

International Journal of Scientific & Engineering Research Volume 4, Issue3, March-2013 3 ISSN 2229-5518
IJSER © 2013 http://www.ijser.org
Fig. 1: Typical GPR reflection in a road pavement and its
waveform.
The propagation velocity is again related to the electromagnetic property of the material by vi = c/√ɛi (2) where εi is the relative dielectric coefficient of each layer and c is the speed of light in air. c = 11.8 in/ns or 0.30 m/ns. 2.2 Determination of relative dielectric permittivity of asphalt
In air-coupled mode of GPR surveys, the dielectric constants of pavement materials are usually measured by the surface reflectivity method (equation 3). That is, the relative dielectric coefficient of the road pavement layer (εi) is found by
√휀i = (1 + 휌 )/(1 – 휌 ) (3)
where ρ1 = A1/Am, A1 is the amplitude of the GPR wave from the road pavement surface and Am is the amplitude of the GPR wave from a metal plate. Similarly, the relative dielectric coefficient of the base layer (휀2) is found by: √휀 = √휀 (1 – 휌 +휌 )/(1 – 휌 휌 ) (4) where 휌 = A2/Am, A2 is the amplitude of the GPR wave from the base layer [3]. However, since a ground-coupled GPR antenna was used in this study (fig. 2), the above method could not be applied in calculating the relative dielectric constant of the asphalt. That is the surface reflectivity method of estimating the relative dielectric coefficients of the pavement layers does not apply to ground-coupled GPR studies. Therefore only the average dielectric constant of the asphalt layers were estimated. Since the travel time of the radar waves to
each interface is a function of the average velocity of propagation of the wave, with known average transmission velocity of the wave in the asphalt concrete layer, the relative dielectric permittivity of the asphalt layer, ɛ ( ) was estimated using
ɛ ( ) = [ .
( )]2 (5)
where 푉 ( ) is the average propagation velocity of the radar waves through the asphalt concrete.
Fig. 2 : MALA GPR equipment used in the measurements, with the 800 MHz ground-coupled antenna in a wheel cart.
3. Materials and methods
3.1 Site description
Fig. 3 shows the various survey sites, both major and minor arterial roads. Majority of the surveyed road pavements were located in the southern part of Kumasi (Asokwa Sub-Metro), which can best be described as the industrial area of the city, with a number of heavy duty industries ranging from lumber companies, major construction companies and brewing companies. Thus, the roads in the area are constantly plied by heavy duty trucks, apparently causing damages to the pavements a few years after their construction. Accordingly, the older pavements surveyed have undergone several maintenance and resurfacing treatments over a number of years. Both new and existing roads were marked for the survey in order to fully assess the capability of the available GPR equipment for pavement thickness estimation.

International Journal of Scientific & Engineering Research Volume 4, Issue3, March-2013 4 ISSN 2229-5518
IJSER © 2013 http://www.ijser.org
Fig. 3: Map of major and minor arterial roads in southern part of Kumasi (modified from google earth). The studied roads are shown in black lines with orange plots of GPS coordinates. According to the original construction plans, the newly constructed roads (Lake roads 1 and 2, Eastern Bypass road) consist of two major structural units, asphalt concrete course, and the aggregate base. The asphalt layer is 150 mm in thickness and 200 mm base course overlaying the existing sub-grade (fig. 4 a).
Fig. 4 : (a) : Construction details of the new roads surveyed. (b): the GPR profiles taken along the roads
3.2 The GPR measurements on the pavements
The GPR equipment used in this research is a RAMAC system manufactured by MALA (fig. 2 ). It comprises the MALA (ProEx) Control unit, the XV Monitor powered by an external 12 V standard Li-Ion battery, and a shielded antenna unit with 800 MHz central frequency. The shielded antenna unit was mounted in a cart and pushed along the pavement at pace speed, enabling spatial triggering from the wheel at approximately every 2.3 cm, at a time window of 18.3 ns with very good resolutions and penetration depth of approximately 1.0 m. During operation, the ProEx control unit was mounted on a backpack and connected to the antenna in the cart. The moving mode employed in this research allowed a radar wave to be transmitted, received and recorded each time the antenna is moved a fixed distance across the road pavement surface. The recorded signals are displayed as traces side-by-side to form a GPR time-distance record, or radargram, which shows how the reflections vary in the subsurface. Single longitudinal survey profiles of varying lengths were taken on the roads at approximately 1.5 m from the edge of the pavement; some transverse profiles were also taken 100 m apart along the newly constructed pavements (fig. 4b). A Global Positioning System (GPS) device was also used to track the locations of the survey lines. The GPS data was picked at 100 m intervals along the roads as well as locations of prominent features along the roads that are expected to introduce anomalies on the radargrams. Reconnaissance surveys were initially carried out on selected roads with the 800 MHz ground-coupled antenna and results from these preliminary surveys were encouraging, although the poor conditions of the aged roads studied introduced great difficulty in the interpretation of the results. Potential sources of spurious reflections like above ground metal posts, cell-phone towers, vehicles, overhead cables etc were carefully noted in the course of the survey so as to distinguish them from genuine below ground reflections.
3.3 Data processing The radargrams from the GPR data files were processed and analyzed using the ReflexW 4.5 software [12], which is designed to convert the two- way travel time of the reflected waves into depth (layer thicknesses). The raw data (fig. 5a) was subjected to filtering stages including background noise removal subtract-mean (dewow) and

International Journal of Scientific & Engineering Research Volume 4, Issue3, March-2013 5 ISSN 2229-5518
IJSER © 2013 http://www.ijser.org
time to depth conversion within the pavement structure. Background noise removal was done to simply eliminate temporarily consistent noise from the entire profile in order to make the signal parts which were originally covered by noise more visible.
Fig. 5 : ReflexW software processing of sample data (Lake road 2). (a): raw data (b) : processed data (c) : layer interface location.
The filter was also used to suppress horizontally coherent energy. Further, muting (time-zero) correction, which is a time-independent correction was done for each trace in time direction. The application of this filter enabled the data above the time shift to be removed, allowing the significant first arrivals to be determined and also corrected the start position of the time axis. Bandpass butterworth filter was applied to suppress noise with the bandpass filter when it differs from the signal in its frequency content. The filter band was specified by setting two values. The first point determines the lower cut off frequency, and the second, the higher cut off frequency. Finally, the data points were multiplied by a gain function in order to compensate for possible damping or losses due to geometric spreading and material absorption or scattering. The function has options such as manual gain g(y), or g(t), energy decay or the Automatic Gain Control (AGC). Fig. 5b shows the result of the application of the various filters on the GPR data taken from the 1.5 km profile of Lake Road, with distinct layer interfaces as black and white lines. The profile length, the travel time of the radar signals and the penetration depth are displayed in the ReflexW software window.
3.4 Location of pavement layer interface
Subsurface layers appear as continuous reflectors on the radargrams which are plotted as 2-D sections using the reflexW software. The pavement bottom reflection is easily defined from the filtered data as shown in fig. 5c. The polarity of the reflections provides information on the dielectric properties (and moisture) of the road structures. Positive reflectors show white in the middle and this reveals that the dielectric value of the proceeding layer course below is higher than the dielectric value of the layers above. A negative polarity on the other hand shows black in the middle (between two white lines) and this shows that the layer below has a lower dielectric value and lower moisture content than the layer above [9].
3.5 Assessment of the accuracy of the GPR results
One calibration core was allowed to be taken from each of the sites surveyed, though the roads were of varying lengths. Measurements of the asphalt and base layer thicknesses were done on each core sample and the positions of the cores carefully located on the GPR radargrams. Again, the two-way travel times of the reflected radar waves from the bottoms of the asphalt and the base layers at those core locations were each measured from the GPR radargrams and recorded. Finally, the average transmission velocities in each case were estimated using equation 1 above and this ranged from 0.1 to 0.11 m/ns. Thus, these velocities were used to convert the travel times in the data to depths (layer thicknesses). Further in order to verify the reliability of the GPR predicted thicknesses, a comparison of the GPR measurements was done with the cores and the accuracy of the GPR predictions were found to be between 5 - 9 mm (4 – 8 )% in the asphalt layers and within 8 – 11 mm (5 - 7)% in the base layers, although some margins of error were anticipated in some cases since some of the locations of the cores could not be exactly traced on the GPR radargrams. To determine the variations of the measured layer thicknesses at the various layer interfaces, the root mean square deviations (RMSD) of the measured layer thicknesses were calculated using equation 6 below
RMSD = ∑ [h −h ] (6)
where ; hi is the thickness measured from each sample point, havg is the estimated average thickness for each profile, i is each sample point and n is the number of sample points for each profile.
4. Results and discussion
International Journal of Scientific & Engineering Research Volume 4, Issue3, March-2013 6 ISSN 2229-5518
IJSER © 2013 http://www.ijser.org
4.1 Layer thicknesses of pavements surveyed Fig. 6a is the processed GPR data display (radargram) depicting the asphalt course and the base course in the Lake road 2 road pavement. The intensity of the interface indicates the quality or clarity of the interface, that is, the more white or black the layer interface, the greater is the reflection amplitude and therefore the easier it is to pick the interface. Fig. 6b represents the display chart of the layers generated from the picked layers.
Fig. 6 : Longitudinal GPR profile of LKRD 2.
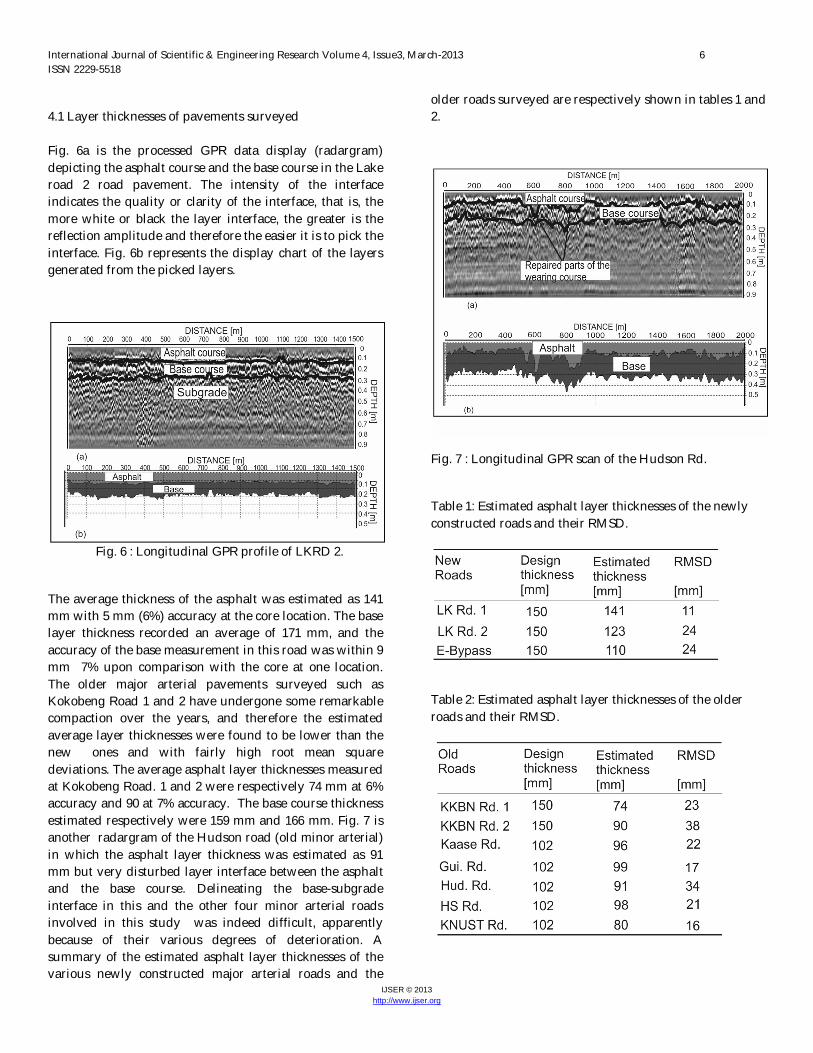
The average thickness of the asphalt was estimated as 141 mm with 5 mm (6%) accuracy at the core location. The base layer thickness recorded an average of 171 mm, and the accuracy of the base measurement in this road was within 9 mm 7% upon comparison with the core at one location. The older major arterial pavements surveyed such as Kokobeng Road 1 and 2 have undergone some remarkable compaction over the years, and therefore the estimated average layer thicknesses were found to be lower than the new ones and with fairly high root mean square deviations. The average asphalt layer thicknesses measured at Kokobeng Road. 1 and 2 were respectively 74 mm at 6% accuracy and 90 at 7% accuracy. The base course thickness estimated respectively were 159 mm and 166 mm. Fig. 7 is another radargram of the Hudson road (old minor arterial) in which the asphalt layer thickness was estimated as 91 mm but very disturbed layer interface between the asphalt and the base course. Delineating the base-subgrade interface in this and the other four minor arterial roads involved in this study was indeed difficult, apparently because of their various degrees of deterioration. A summary of the estimated asphalt layer thicknesses of the various newly constructed major arterial roads and the
older roads surveyed are respectively shown in tables 1 and 2.
Fig. 7 : Longitudinal GPR scan of the Hudson Rd.
Table 1: Estimated asphalt layer thicknesses of the newly constructed roads and their RMSD.
Table 2: Estimated asphalt layer thicknesses of the older roads and their RMSD.

International Journal of Scientific & Engineering Research Volume 4, Issue3, March-2013 7 ISSN 2229-5518
IJSER © 2013 http://www.ijser.org
The RMSD of the asphalt thickness at the asphalt-base interface was found as ± 11mm, and this may be due to poor compaction of the aggregate base layer. Another newly built road (Eastern Bypass Road) as shown in fig. 9 also had a RMSD of ±24 mm in the asphalt layer and ±17 mm in the base layer. Accordingly, sections of the pavement layers with distinct lower layer thicknesses are likely to develop pavement defects such as rutting, leading to premature deterioration of the road.
The asphalt layer thicknesses at the Eastern Bypass Road had average asphalt thickness of 110 mm, and the accuracy of the radar measurement was 6 mm (7%) whereas the base course recorded an average of 159 mm and 7% accuracy at a single core location. Further, as evident from fig. 8, a section of the Eastern Bypass road registered some asphalt layer thickness values lower than the minimum 50 mm value allowed by the Ghana Highway Authority standard. Though a very small section, such areas could be potential sites for premature deterioration of the pavement.
Fig. 8 : Variation of asphalt layer thickness of LKRD 2 calculated from the GPR data.
Fig. 9 : Calculated thicknesses of the 1.7 km section of the Eastern Bypass Road
Further, a remarkable disparity was noted between the estimated thickness variations of the dual carriage pavement of LKRD 1 and 2. That is, for the same 1.5 km GPR profile taken from each lane at the same location, the south-bound lane (fig.10 a) registered an average asphalt layer thickness of 141 mm ± 11 mm, whereas the north-bound lane (fig. 10 b) measured an average of 123 mm ±24 mm. Thus, for a pavement constructed within the same time frame and therefore with equal design specifications to have fairly large difference in average asphalt layer thickness of 18 mm should be a matter of concern, since with all other things being equal, the lane with the lower average asphalt thickness would have the tendency to develop premature structural defects relative to the other lane. The Lake road traverses a major industrial area in the city such as lumber and construction companies and in fact the lower pavement layer thicknesses estimated (relative to the design thickness) poses a threat to the future of the road. Accordingly, quality assurance of new pavements by local government engineers should involve picking of cores at regular intervals and their thicknesses measured in the laboratory to ascertain the true layer thickness variation along the road, instead of the visual inspection methods used.
Fig. 10 : A comparison of the thickness variations of two lanes of LKRD 1 and 2. 4.3 Location of low density sections of the pavements

International Journal of Scientific & Engineering Research Volume 4, Issue3, March-2013 8 ISSN 2229-5518
IJSER © 2013 http://www.ijser.org
Low density sections of the asphalt pavement were located using the principle that the compaction of the pavement materials would reduce the volume of air and increase the proportion of components such as bitumen or aggregate. Fig. 11b and fig.12b provide interesting information about the variations of the relative dielectric coefficient of the asphalt wearing course along Lake road 2 and Kokoben 1 pavements which were estimated using equation 5 above. These variations were used to locate areas of low density and/or segregations in the pavement. That is, in a uniformly compacted asphalt surface, the surface dielectric coefficient should be fairly constant, with distinct layer interfaces. Average relative permittivity values of 6.7 and 5.2 were respectively estimated for the Lake road 2 (Newly built) and the Kokoben 1 road (older road). From the average relative permittivity plots (figs. 11b and 12 b), areas along the profile with lower values were compared to the radargrams from the GPR and a careful inspection at such positions indicated large negative peaks in the waveform of the individual traces at the layer interface, and these possibly came from poor binding of aggregates of the base layer, which may be potential areas where voids occur, thereby reducing the density of the pavement at these areas. When the aggregate materials are compacted, the volumetric proportion of air, which has a low dielectric value, is squeezed out of the mixture and thus the dielectric value of the asphalt mixture increases.
Fig. 11: (a) Radargram of asphalt and base course of Lake Road 2 (new pavement). (b) Average dielectric constant in asphalt course.
Fig. 12: (a) Radargram of asphalt and base course of Kokobeng Road 1 (older pavement). (b) Average dielectric constant of asphalt layer.
5. Conclusions Two main layers were identified in the pavements surveyed (asphalt wearing course and base course) and the average asphalt layer thicknesses of the newly constructed major arterial roads (Lake Road 1 and 2, Eastern Bypass Road) were found to have a range of 110 – 141 mm ± 19 mm, as against the designed layer thickness range of 150 mm, with an accuracy of within 4 – 8% when compared with the core samples , whereas the base layers ranged between 155 - 171 mm ± 21 mm, compared to the 200 mm designed layer thickness. A comparison with core measurements showed an accuracy of 5 – 7%.
The older major arterial roads however recorded lower average asphalt layer thickness range of 74 - 90 mm for the designed thickness of 150 mm and showed a RMSD of ±24 mm . The lower average asphalt layer thicknesses recorded in this case may be attributed to the relative compaction of these older pavements over the years. The estimated average base course thickness in these roads ranged between 159 - 166 mm with ± 9mm RMSD. The asphalt layer thicknesses of the minor arterial roads studied were between 91 - 99 mm for a designed thickness of 102 mm, with a RMSD of within ±22 mm. The estimated average dielectric constant of the asphalt layers were found to range between 5.2 and 6.7 respectively in the older and newly built roads and the variations of the estimated dielectric values along the newly built roads were used to locate low some low density areas of the asphalt course at the asphalt-base interface.

International Journal of Scientific & Engineering Research Volume 4, Issue3, March-2013 9 ISSN 2229-5518
IJSER © 2013 http://www.ijser.org
It has been found through this study that the ground penetrating radar technique can be used reliably to non-destructively assess pavement systems and to estimate their layer thicknesses instead of the visual method often used by local government engineers in Ghana. The GPR’s continuous profiling capability, and ability to estimate pavement layer thickness, would also allow distressed areas to be mapped so that cores can be taken only at such distressed locations in order to plan further rehabilitation strategies in local Ghanaian roads. Finally, the GPR method, though commonly used in other developed countries for road condition assessment, is not a common practice in Ghana, and accordingly, the results obtained is expected to help local government engineers to perform continuous evaluation of the pavement conditions quickly and more accurately. In turn, this benefit will inherently increase construction efficiency and reduce the cost of pavement construction and maintenance in Ghana.
6. Acknowledgement We are grateful for the support provided by Engineers of the Kumasi Department of Urban Roads and the Ghana Highways Authority. We are also thankful to Andrew Davidson and Boadi Benjamin for their assistance during data collection. The work was partly funded by the Physics Department (Geophysics Section), Kwame Nkrumah University of Science and Technology, Kumasi.
7. References
[1] Atto-Okine, B. (1992). Investigation of post- construction failure of a lightly trafficked road in Ghana. Proceedings of the Institution of Civil Engineers, Municipal Engineer, 93(1):51–55.
[2] Irwin, L. H. (2002). Backcalculation: An overview and
perspective. FWD/Backcalculation Workshop 3- 6th International Conference on the Bearing Capacity of Roads, Railways and Airfields.
[3] Loken, M. (2007). Use of ground penetrating radar to evaluate
Minnesota roads. Technical Report MN/RC-2007-01, Minnesota Department of Transportation Office of Materials, 1400 Gervais Avenue Maplewood, MN 55109.
[4] Loulizi, A. (2001). Development of Ground Penetrating Radar
Signal Modeling and Implementation for Transportation Infrastructure Assessment . PhD thesis, Blacksburg, Virginia.
[5] Maser, K. and Scullion, T. (1992). Automated pavement
subsurface profiling using radar: Case studies of four experimental field sites. Transport Research Record , (1344):148–154.
[6] Nazarian, S., Makahaube, J., and Rozendal, D. (1993). Investigation of parameters affecting the interface bonding of thin concrete overlays due to vehicular vibration. Technical Report 1920-2, Centre for Geotechnical and Highway Material Research, The University of Texas, El Paso.
[7] Roadex, (1998-2001). Creating effective technical exchange & co-
operation between road districts in the np region. Technical report, Roadex Project(1998-2001), www.roadex.org.
[8] Roddis, W., Maser, K., and Gisi, A. (1992). Radar pavement
thickness evaluation for varying base conditions. Technical Report 1355, Transportation Research Record, National Research Council, Washington, D.C.
[9] Saarenketo, T. (2006). Electrical properties of road materials and
subgrade soils and the use of ground penetrating radar in traffic infrastructure surveys. PhD thesis, Faculty of Science, Department of Geoscience, University of Oulu.
[10] Saarenketo, T. and Aho, S. (2005). Monitoring and classifying
spring thaw weakening on low volume roads in northern periphery. page 11.
[11] Saarenketo, T. and Vesa, H.(2000).The use of gpr technique in
surveying gravel road wearing course in :Eigth intl. conference on ground penetrating radar. SPIEE, 4084:182–184.
[12] Sandmeier, K. J. (2007). REFLEW-Processing and interpretation
software for GPR, seismic and borehole data. Sandmeier Scientific software, http:/www.sandmeier-geo.de. Version4.5