Embed Size (px)
Citation preview

HAL Id: hal-02189916https://hal.archives-ouvertes.fr/hal-02189916
Submitted on 8 Oct 2019
HAL is a multi-disciplinary open accessarchive for the deposit and dissemination of sci-entific research documents, whether they are pub-lished or not. The documents may come fromteaching and research institutions in France orabroad, or from public or private research centers.
L’archive ouverte pluridisciplinaire HAL, estdestinée au dépôt et à la diffusion de documentsscientifiques de niveau recherche, publiés ou non,émanant des établissements d’enseignement et derecherche français ou étrangers, des laboratoirespublics ou privés.
Thick Line Segment Detection with Fast DirectionalTracking
Philippe Even, Phuc Ngo, Bertrand Kerautret
To cite this version:Philippe Even, Phuc Ngo, Bertrand Kerautret. Thick Line Segment Detection with Fast DirectionalTracking. ICIAP 2019 -20th International Conference on Image Analysis and Processing, Sep 2019,trento, Italy. pp.159-170, �10.1007/978-3-030-30645-8_15�. �hal-02189916�
Thick Line Segment Detection with Fast
Directional Tracking
Philippe Even1, Phuc Ngo1, and Bertrand Kerautret2
1 Université de Lorraine, LORIA (UMR 7503), Nancy, [email protected], [email protected]
2 Université Lyon 2, LIRIS (UMR 5205), Lyon, [email protected]
Abstract. This paper introduces a fully discrete framework for a newstraight line detector in gray-level images, where line segments are en-riched with a thickness parameter intended to provide a quality criterionon the extracted feature. This study is based on a previous work on inter-active line detection in gray-level images. At �rst, a better estimation ofthe segment thickness and orientation is achieved through two main im-provements: adaptive directional scans and control of assigned thickness.Then, these advances are exploited for a complete unsupervised detec-tion of all the line segments in an image. The new thick line detector isleft available in an online demonstration.
Keywords: Line/segment detection · discrete objects · digital geometry
1 Introduction
Straight lines are commonly used as visual features for many image analysisprocesses. In particular in man-made environments, they are a suitable alter-native to points for camera orientation [7,18], 3D reconstruction [16] or alsosimultaneous localization and mapping [10,17].
Therefore, straight line detection is always an active research topic centeredon the quest of still faster, more accurate or more robust-to-noise methods[1,2,9,14,15]. Most of the times, they rely on the extraction of an edge mapbased on gradient magnitude. Gradient orientation is often used to discriminatecandidates and thus provide better e�ciency. However, they seldom provide anexploitable measure of the output line quality, based on intrinsic properties suchas sharpness, connectivity or scattering. This information could be useful to getsome con�dence level and help to classify these features for further exploitation.It could also be a base for uncertainty propagation within 3D interpretationtools, in order to dispose of complementary measures to reprojection errors forlocal accuracy evaluation.
In digital geometry, new mathematical de�nitions of classical geometric ob-jects, such as lines or circles, have been developed to better �t to the discretenature of most of today's data to process. In particular, the notion of blurredsegment [4,6] was introduced to cope with the image noise or other sources of

II P. Even et al.
imperfections from the real world using a thickness parameter. E�cient algo-rithms have already been designed to recognize these digital objects in binaryimages [5]. Blurred segments seem well suited to re�ect the required line qualityinformation.
The present work aims at designing a �exible tool to detect blurred seg-ments with optimal thickness and orientation in gray-level images for as wellsupervised as unsupervised contexts. User-friendly solutions are sought, withideally no parameter to set, or at least quite few values with intuitive meaning.An interactive tool was already designed for live line extractions in gray-levelimages [12]. But the segment thickness was initially �xed by the user and notestimated, leading to erroneous orientations of the detected lines. Here, the lim-itations of this �rst detector are solved by the introduction of two new con-cepts: (i) adaptive directional scans designed to better track the detected line;(ii) control of assigned thickness to bound its scattering. As a side e�ect, thesetwo major evolutions also led to a noticeable improvement of the time per-formance of the detector. They are also put forward within a global line ex-traction algorithm which can be evaluated through an online demonstration at:http://ipol-geometry.loria.fr/~kerautre/ipol_demo/FBSD_IPOLDemo
In the next section, the main theoretical notions used in this work are intro-duced. The new detector work�ow, the adaptive directional scan, the control ofassigned thickness and their integration into both supervised and unsupervisedcontexts are then presented in section 3. Experiments led to assess the achievedperformance of this new detector are decribed in section 4. Finally, section 5 givesa short conclusion followed by some open perspectives for future works.
2 Theoretical background
2.1 Blurred segment
This work relies on the notion of digital straight line as classically de�ned in thedigital geometry literature [13]. Only the 2D case is considered here.
De�nition 1. A digital straight line L(a, b, c, ν), with (a, b, c, ν) ∈ Z4, is the
set of points P (x, y) of Z2 that satisfy : 0 ≤ ax+ by − c < ν.
In the following, we note V (L) = (a, b) the director vector of digital lineL, w(L) = ν its arithmetical width, h(L) = c its shift to origin, and p(L) =max(|a|, |b|) its period (i.e. the length of its periodic pattern). When ν = p(L),then L is the narrowest 8-connected line and is called a naive line.
The thickness µ = νmax(|a|,|b|) of L(a, b, c, ν) is the minimum of the vertical
and horizontal distances between lines ax+ by = c and ax+ by = c+ ν.
De�nition 2. A blurred segment B of assigned thickness ε is a set of points
in Z2 that all belong to a covering digital straight line L of thickness µ = ε. Theoptimal line of the blurred segment is the covering line with minimal thickness.
The thickness of the blurred segment is the thickness of its optimal line.

Thick Line Segment Detection with Fast Directional Tracking III
A linear-time algorithm to recognize a blurred segment of assigned thicknessε [6] is used in this work. It is based on an incremental growth of the convexhull of the blurred segment when adding each point Pi successively. As depictedon Fig. 1, the extension of the blurred segment Bi−1 of assigned thickness ε andthickness µi−1 at step i− 1 with a new input point Pi is thus controlled by therecognition test µi < ε.
����
����
����
���
����
����
����
���
r r r r r r rBi−1 bPi
6
?µi−1
6
?
µi
Bi?
Fig. 1. A growing blurred segment Bi : when adding the new point Pi, the blurredsegment minimal thickness augments from µi−1 to µi; if the new thickness µi exceedsthe assigned thickness ε, then the new input point is rejected and Bi = Bi−1.
Associated to this primitive, the following de�nition of a directional scan isan important point in the proposed method.
2.2 Directional scan
De�nition 3. A directional scan DS is an ordered partition restricted to the
image domain I of a thick digital straight line D, called the scan strip, into
scans Si, each of them being a segment of a naive line Ni, called a scan line,
orthogonal to D.
DS =
{Si = D ∩Ni ∩ I
∣∣∣∣V (Ni) · V (D) = 0∧ h(Ni) = h(Ni−1) + p(D)
}(1)
In this de�nition, the clause V (Ni) · V (D) = 0 expresses the orthogonalityconstraint between the scan lines Ni and the scan strip D. Then the shift of theperiod p(D) between successive scans guarantees that all points of the scan stripare traversed one and only one time.
The scans Si are developed on each side of a start scan S0, and ordered bytheir distance to the start line N0 with a positive (resp. negative) sign if theyare on the left (resp. right) side of N0 (Fig. 2). The directional scan is iterativelyparsed from the start scan to both ends. At each iteration i, the scans Si andS−i are successively processed.
A directional scan can be de�ned by its start scan S0. If A(xA, yA) andB(xB , yB) are the end points of S0, and if we note δx = xB − xA, δy = yB − yA,c1 = δx · xA + δy · yA, c2 = δx · xB + δy · yB and pAB = max(|δx|, |δy|), it is thende�ned by the following scan strip DA,B and scan lines NA,B
i :{DA,B = L(δx, δy, min(c1, c2), 1 + |c1 − c2|)NA,Bi = L(δy, − δx, δy · xA − δx · yA + i · pAB , pAB)
(2)

IV P. Even et al.
HHHj
HHHY
y
y
y{
{~
}}
~ A
B
D
S0
S8
S−5
N0
N8
N−5
Fig. 2. A directional scan. The start scan S0 is drawn in blue, odd scans in green, evenscans in red, the bounds of scan lines Ni with plain lines and the bounds of scan stripD with dotted lines.
A directional scan can also be de�ned by a central point C(xC , yC), a direc-tion D(XD, YD) and a minimal thickness w. If we note pD = max(|XD|, |YD|),νD = dw · pDe, c3 = xC · YD − yC ·XD − νD
2 , and c4 = xC ·XD + yC · YD − pD2 ,
it is then de�ned by the following scan strip DC,D,w and scan lines NC,D,wi :{
DC,D,w = L(YD, −XD, c3, νD)
NC,D,wi = L(XD, YD, c4 + i · pD, pD)
(3)
3 The detection method
In this line detection method, only the gradient information is processed as itprovides a good information on the image dynamics, and hence the presence ofedges. Trials to use the intensity signal were also made through costly correlationtechniques, but they were mostly successful for detecting shapes with a stableappearance such as metallic tubular objects [3]. Contrarily to most detectors, noedge map is built here, but gradient magnitude and orientation are examined inprivileged directions to track edge traces. In particular, we use a Sobel operatorwith a 5x5 pixels mask to get high quality gradient information [11].
3.1 Previous work
In a former paper [12], an e�cient tool to detect blurred segments of �xedthickness in gray-level images was already introduced. It was based on a �rstrough detection in a local image area de�ned by the user. At that stage, thegoal was to disclose the presence of a straight edge. Therefore as simple a testas the gradient maximal value was performed. In case of success, re�nementsteps were then run through an exploration of the image in the direction of thedetected edge. In order to prevent local disturbances such as the presence of a

Thick Line Segment Detection with Fast Directional Tracking V
sharper edge nearby, all the local gradient maxima were successively tested untila correct candidate with an acceptable gradient orientation was found.
Despite of a good behavior reported, several drawbacks remained. First, theblurred segment thickness was not measured but initially set by the user ac-cording to application requirements. The produced information on edge qualitywas rather poor, and especially when the edge is thin, the risk to incorporateoutlier points was quite high, thus producing a biased estimation of the edge ori-entation. Then, two re�nement steps were systematically performed. On the onehand, this is useless when the �rst detection is successfull. On the other hand,there is no guarantee that this approach is able to process larger images. Thesearch direction relies on the support vector of the blurred segment detected atformer step. Because the numerization rounding �xes a limit on this estimatedorientation accuracy, more steps are inevitably required to process larger images.In the following, we present the improvements in the new detector to overcomethese limitations.
3.2 Work�ow of the new detection process
The work�ow of the detection process is summerized in the following �gure.
(A,B)- Initial
detection
B-PPP
PPP���
���Valid ?
∅?
(C,D)- Finetracking
B′-PPP
PPP���
���Accept ?
∅?
B′-
Fig. 3. The main work�ow of the detection process.
The initial detection consists in building and extending a blurred segment Bof assigned thickness ε0, based on points with highest gradient magnitude foundin each scan of a static directional scan de�ned by an input segment AB. Theextension is stopped after �ve point addition failures on each side. Notice thatthe gradient direction is not used in this step.
Validity tests are then applied to decide of the detection pursuit. They aimat rejecting too small segments (less than 4 points) or too sparse ones (morethan 50% of point addition failures) or also those with a close orientation to AB(less than π/6).
In the �ne tracking step, another blurred segment B′ is built and extendedwith points that correspond to local maxima of the image gradient, ranked bymagnitude order, and with gradient direction close to start point gradient direc-tion (less than π/6). At this re�nement step, a control of assigned thickness isapplied and an adaptive directional scan based on found position C and directionD is used in order to extend the segment in appropriate direction. These twonotions are described in following sections 3.3 and 3.4.
Output segment B′ is �nally accepted based on application criteria. Finallength and sparsity thresholds can be set accordingly. They are the only param-eters of this local detector, together with the input assigned thickness ε0.
VI P. Even et al.
3.3 Adaptive directional scan
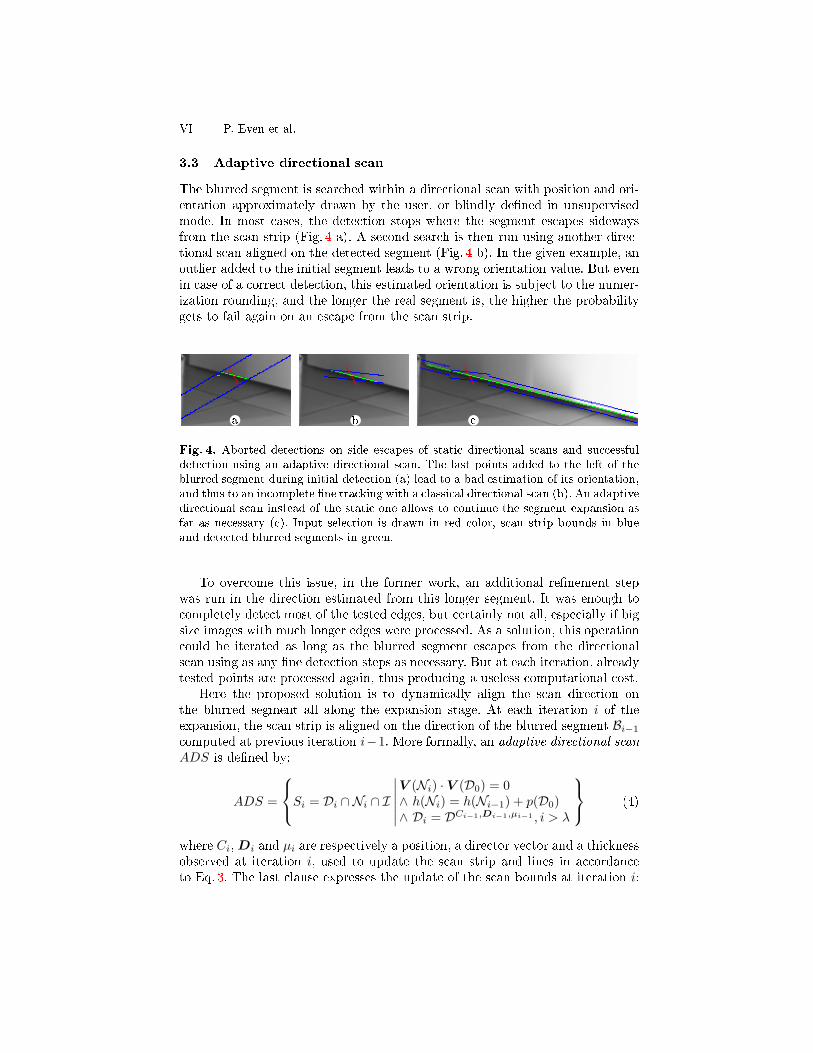
The blurred segment is searched within a directional scan with position and ori-entation approximately drawn by the user, or blindly de�ned in unsupervisedmode. In most cases, the detection stops where the segment escapes sidewaysfrom the scan strip (Fig. 4 a). A second search is then run using another direc-tional scan aligned on the detected segment (Fig. 4 b). In the given example, anoutlier added to the initial segment leads to a wrong orientation value. But evenin case of a correct detection, this estimated orientation is subject to the numer-ization rounding, and the longer the real segment is, the higher the probabilitygets to fail again on an escape from the scan strip.
w w wa b c
Fig. 4. Aborted detections on side escapes of static directional scans and successfuldetection using an adaptive directional scan. The last points added to the left of theblurred segment during initial detection (a) lead to a bad estimation of its orientation,and thus to an incomplete �ne tracking with a classical directional scan (b). An adaptivedirectional scan instead of the static one allows to continue the segment expansion asfar as necessary (c). Input selection is drawn in red color, scan strip bounds in blueand detected blurred segments in green.
To overcome this issue, in the former work, an additional re�nement stepwas run in the direction estimated from this longer segment. It was enough tocompletely detect most of the tested edges, but certainly not all, especially if bigsize images with much longer edges were processed. As a solution, this operationcould be iterated as long as the blurred segment escapes from the directionalscan using as any �ne detection steps as necessary. But at each iteration, alreadytested points are processed again, thus producing a useless computational cost.
Here the proposed solution is to dynamically align the scan direction onthe blurred segment all along the expansion stage. At each iteration i of theexpansion, the scan strip is aligned on the direction of the blurred segment Bi−1computed at previous iteration i−1. More formally, an adaptive directional scan
ADS is de�ned by:
ADS =
Si = Di ∩Ni ∩ I∣∣∣∣∣∣V (Ni) · V (D0) = 0∧ h(Ni) = h(Ni−1) + p(D0)∧ Di = DCi−1,Di−1,µi−1 , i > λ
(4)
where Ci,Di and µi are respectively a position, a director vector and a thicknessobserved at iteration i, used to update the scan strip and lines in accordanceto Eq. 3. The last clause expresses the update of the scan bounds at iteration i:

Thick Line Segment Detection with Fast Directional Tracking VII
Ci−1, Di−1 and µi−1 are respectively the intersection of the input selection andthe central line of Bi−1, the director vector of the optimal line of Bi−1, and thethickness of Bi−1. λ is a delay which is set to 20 iterations to avoid directioninstabilities when too few points are inserted. Compared to static directionalscans where the scan strip remains �xed to the initial line D0, here the scanstrip moves while scan lines remain �xed. This behavior ensures a completedetection of the blurred segment even when the orientation of D0 is wronglyestimated (Fig. 4 c).
3.4 Control of assigned thickness
The assigned thickess ε to the blurred segment recognition algorithm is initiallyset to a large value ε0 in order to allow the detection of thick blurred segments.Then, when no more augmentation of the blurred segment thickness is observedafter τ iterations (µi+τ = µi), it is set to the observed thickness augmented by ahalf pixel tolerance factor, in order to take into account all the possible discretelines which digitization �ts to the selected points:
ε = µi+τ +1
2(5)
This strategy aims at preventing the incorporation of spurious outliers infurther parts of the segment. Setting the observation distance to a constantvalue τ = 20 seems appropriate in most experimented situations.
3.5 Supervised blurred segments detection
In supervised context, the user draws an input stroke across the speci�c edge thathe wants to extract from the image. The detection method previously describedis continuously run during mouse dragging and the output blurred segment isdisplayed on-the-�y. Details about the supervised mode are discussed in [12].
An option, calledmulti-detection (Algorithm 1), allows the detection of all thesegments crossed by the input stroke AB. In order to avoid multiple detectionsof the same edge, an occupancy mask, initially empty, collects the dilated pointsof all the blurred segments, so that these points can not be used any more.
First the positions Mj of the prominent local maxima of the gradient magni-tude found under the stroke are sorted from the highest to the lowest. For eachof them the main detection process is run with three modi�cations:
1. the initial detection takes Mj and the orthogonal direction AB⊥ to thestroke as input to build a static scan of �xed thickness 2 · ε0, and Mj is usedas start point of the blurred segment;
2. the occupancy mask is �lled in with the points of the dilated blurred segmentsB′j at the end of each successful detection (a 5 × 5 octogonal neighborhoodregion of 21 pixels is used);
3. points marked as occupied are rejected when selecting candidates for theblurred segment extension in the �ne tracking step.

VIII P. Even et al.
Algorithm 1:MultiDetect: �nds all segments crossing the selection stroke.
input : Stroke points A, B, occupancy maskM, initial thickness ε0output: ListOfBS → list of detected blurred segments
ListOfBS ← ∅;LocMax ← ComputeAndSortGradientLocalMax (A, B);
for i← 0 to Size (LocMax) doBlurredSegment ← detect (LocMax [i], AB⊥, 2 ε0,M);UpdateOccupancyMask (M, BlurredSegment);ListOfBS ← ListOfBS + BlurredSegment;
end
3.6 Automatic blurred segment detection
An unsupervised mode is also proposed to automatically detect all the straightlines in the image. A stroke that crosses the whole image, is swept in bothdirections, vertical then horizontal, from the center to the borders. At eachposition, the multi-detection algorithm is run to collect all the segments foundunder the stroke. Then small blurred segments are rejected in order to avoid theformation of misaligned segments when the sweeping stroke crosses an image edgenear one of its ends. In such situation, any nearby disturbing gradient is likelyto deviate the blurred segment direction, and its expansion is quickly stopped.The stroke sweeping step is an additional parameter for automatic detections,that could be set in relation to the �nal length threshold parameter.
The automatic detection is available for testing from the online demonstra-tion and from a GitHub source code repository: https://github.com/evenp/FBSD.
4 Experimental validation
In the experimental stage, the proposed approach is validated through compar-isons with other recent line detectors: LSD [9], ED-Lines [1] and CannyLines [14],written in C or C++ language and without any parameter settings. Only LSDprovides a thickness value based on the width of regions with same gradient di-rection. This information does not match the line sharpness or scattering qualityaddressed in this work, so that it can not be actually compared to the thicknessvalue output by the new detector. Moreover, we did not �nd any data base withground truth including line thickness. Therefore, we proceed in two steps: (i)evaluation on synthetic images of the new concepts enhancement on line orien-tation and thickness estimation; (ii) evaluation of more global performance ofthe proposed approach compared to other detectors. For all these experimentsin unsupervised mode, the stroke sweeping step is set to 15 pixels.
At �rst, the performance of both versions of the detector (with and withoutthe concepts) is tested on a set of 1000 synthesized images containing 10 ran-domly placed input segments with random thickness between 2 and 5 pixels. Theinitial assigned thickness ε0 is set to 7 pixels to detect all the lines in the de�ned

Thick Line Segment Detection with Fast Directional Tracking IX
thickness range in unsupervised mode. The absolute value of the di�erence ofeach found segment to its matched input segment is measured. Results in Tab. 1show that the new concepts a�ord improved thickness and angle measurements,better precision with a smaller amount of false detections, and that they helpto �nd most of input segments. More results can be found in a public report:http://doi.org/10.5281/zenodo.3277091.
Detector : old new
Detected blurred segments per image 17.06 ± 3.22 16.83 ± 3.11Undetected input segments per image 0.152 ± 0.43 0.003 ± 0.05
Precision (%) : P = #(D ∩ S)/#D 80.46 ± 7.22 83.87 ± 6.04
Recall (ratio of true detection, %): R = #(D ∩ S)/#S 90.23 ± 3.30 91.15 ± 2.52
F-measure (harmonic mean,%): F = 2× P ×R/(P +R) 84.87 ± 4.42 87.23 ± 3.59
Thickness di�erence (pixels) to matched input segment 0.70 ± 0.24 0.59 ± 0.19
Angle di�erence (degrees) to matched input segment 0.61 ± 0.66 0.57 ± 0.62
Table 1.Measured performance of both versions of the detector on a set of synthesizedimages. Old refers to the previous version [12], whereas new is the proposed detector(with adaptive directional scans and control of assigned width). S is the set of all theinput segments, D the set of all the detected blurred segments.
Next experiments aim at comparing the new approach with recent line de-tectors. Tests are run on the York Urban database [7] composed of 102 imageswith their ground truth lines. As it was set in the scope of Manhattan-worldenvironments, only lines in the three main directions are provided. For theseexperiments, initial assigned thickness ε0 is set to 3 pixels, considering that theother detectors are designed to �nd thin lines, and �nal length threshold to 10points to suit the stroke sweeping step value. Output lines smaller than 10 pixelsare discarded for all the detectors. Compared measures are execution time T ,covering ratio C, detected lines amount N , cumulated length of detected linesL and mean length ratio L/N . On each image of the database and for each linedetector, the execution time of 100 repetitions of a complete detection, gradi-ent extraction included, was measured using Intel Core i5 processor; T is themean value found per image. Then, assuming that a pixel of a ground truthline is identi�ed if there is a detected line in its 8-neighborhood, measure C isthe mean ratio of the length of ground truth line pixels identi�ed on the totalamount of ground truth line pixels. Results are given in Tab. 2.
The example of Fig. 5 indicates that the new detector produces many smallsegments which could be considered as visually non-meaningful. The other detec-tors eliminates them by a validation test based on Helmholtz principle [8]. Suchtest is not yet integrated into the new detector. But even so, the mean lengthof output lines is greater. Except for execution time where ED-Lines performsbest, global performance of the new detector is pretty similar and competitive tothe other ones. Furthermore, it provides additional information on the detectedline quality through the estimated thickness.

X P. Even et al.
g g ga b c
g g gd e f
Fig. 5. Comparison of line detectors on one of the 102 ground truth images of the YorkUrban database : a) input image, b) ground truth lines, c) LSD output, d) ED-Linesoutput, e) CannyLines output, f) thick lines of the new detector.
Measure T (ms) C (%) N L (pixels) L/N
LSD 63.5 ± 13.6 60.9 ± 11.2 536 ± 193 17745 ± 5337 34.6 ± 7.9ED-Lines 55.5 ± 9.9 64.0 ± 11.2 570 ± 210 19351 ± 5669 35.8 ± 8.9CannyLines 69.6 ± 10.5 60.5 ± 10.6 467 ± 138 17679 ± 4398 39.5 ± 10.1Our detector 66.9 ± 15.6 67.9 ± 9.6 478 ± 110 19472 ± 3914 41.7 ± 7.5
Table 2. Measured performance of recent line detectors (LSD [9], ED-Lines [1] andCannyLines [14]) and of our detector on the York Urban Database [7].
5 Conclusion and perspectives
This paper introduced a new straight line detector based on a local analysis ofthe image gradient and on the use of blurred segments to embed an estimationof the line thickness. It relies on directional scans of the input image aroundmaximal values of the gradient magnitude, and on the integration of two newconcepts: adaptive directional scans and control of assigned thickness. Compar-isons to other recent line detectors show competitive global performance in termsof execution time and mean length of output lines, while experiments on syn-thetic images indicate a better estimation of length and thickness measurementsbrought by the new concepts.
A residual weakness of the approach is the sensitivity to the initial conditions.In supervised context, the user can select a favourable area where the awaitededge is dominant. But in unsupervised context, gradient perturbations in theearly stage of the line expansion, mostly due to the presence of close edges, cana�ect the result. In future works, we intend to provide solutions by scoring thedetection result on the basis of a characterization of the local context.
Thick Line Segment Detection with Fast Directional Tracking XI
References
1. Akinlar, C., Topal, C.: EDPF: a real-time parameter-free edge segment detectorwith a false detection control. Int. Journal of Pattern Recognition and Arti�cialIntelligence 26(01), 1255002 (2012)
2. Almazàn, E.J., Tal, R., Qian, Y., Elder, J.H.: MCMLSD: a dynamic program-ming approach to line segment detection. In: IEEE International Conference onComputer Vision and Pattern Recognition. pp. 2031�2039 (2017)
3. Aubry, N., Kerautret, B., Even, P., Debled-Rennesson, I.: Photometric intensitypro�les analysis for thick segment recognition and geometric measures. Mathemat-ical Morphology: Theory and Applications (2), 35�54 (2017)
4. Buzer, L.: A simple algorithm for digital line recognition in the general case. Pat-tern Recognition 40(6), 1675�1684 (2007)
5. Debled-Rennesson, I., Feschet, F., Rouyer-Degli, J.: Optimal blurred segments de-composition of noisy shapes in linear times. Computers and Graphics (2006)
6. Debled-Rennesson, I., Feschet, F., Rouyer-Degli, J.: Blurred segments decomposi-tion in linear time. In: Andres, E., Damiand, G., Lienhardt, P. (eds.) Proc. of Int.Conf. on DGCI. LNCS, vol. 3429, pp. 371�382 (2005)
7. Denis, P., Elder, J.H., Estrada, F.J.: E�cient edge-based methods for estimatingManhattan frames in urban imagery. In: European Conference on Computer Vision.pp. 197�210. LNCS 5303 (2008)
8. Desolneux, A., Moisan, L., Morel, J.M.: From Gestalt Theory to Image Analysis:A Probabilistic Approach, Interdisciplinary Applied Mathematics, vol. 34 (2008)
9. Gioi, R.G.v., Jakubowicz, J., Morel, J.M., Randall, G.: LSD: A fast line segmentdetector with a false detection control. IEEE Trans. on Pattern Analysis and Ma-chine Intelligence 32(4), 722�732 (2010)
10. Hirose, K., Saito, H.: Fast line description for line-based SLAM. In: British MachineVision Conference (2012)
11. Kekre, H., Gharge, S.: Image segmentation using extended edge operator for mam-mographic images. International Journal on Computer Science and Engineering2(4), 1086�1091 (2010)
12. Kerautret, B., Even, P.: Blurred segments in gray level images for interactive lineextraction. In: Wiederhold, P., Barneva, R.P. (eds.) Proc. of Int. Workshop onCombinatorial Image Analysis. LNCS, vol. 5852, pp. 176�186 (2009)
13. Klette, R., Rosenfeld, A.: Digital geometry � Geometric methods for digital pictureanalysis. Morgan Kaufmann (2004)
14. Lu, X., Yao, J., Li, K., Li, L.: CannyLines: a parameter-free line segment detector.In: Int. Conf. on Image Processing. pp. 507�511. IEEE (2015)
15. Matas, J., Galambos, C., Kittler, J.: Robust detection of lines using the progressiveprobabilistic Hough transform. Computer Vision and Image Understanding 78(1),119�137 (2000)
16. Park, S., Lee, H., Lee, S., Yang, H.S.: Line-based single view 3D reconstruction inManhattan world for augmented reality. In: Proceedings of the 14th ACM SIG-GRAPH International Conference on Virtual Reality Continuum and Its Applica-tions in Industry. pp. 89�92. VRCAI '15, ACM (2015)
17. Ruifang, D., Fremont, V., Lacroix, S., Fantoni, I., Changan, L.: Line-based monoc-ular graph SLAM. In: IEEE International Conference on Multisensor Fusion andIntegration for Intelligent Systems. pp. 494�500 (2017)
18. Xu, C., Zhang, L., Cheng, L., Koch, R.: Pose estimation from line correspondences:a complete analysis and a series of solutions. IEEE Transactions on Pattern Anal-ysis and Machine Intelligence 39(6), 1209�1222 (2017)