Embed Size (px)
Citation preview

Thick electrodes for Li-ion batteries: A model based analysis
Timo Dannera,b,∗, Madhav Singhc, Simon Heina,b, Jorg Kaiserc, Horst Hahnb,c, Arnulf Latza,b,d
aInstitute of Engineering Thermodynamics, German Aerospace Center (DLR), Pfaffenwaldring 38-40, 70569 Stuttgart, GermanybHelmholtz Institute Ulm for Electrochemical Energy Storage (HIU), Helmholtzstraße 11, 89081 Ulm, Germany
cKarlsruhe Institute of Technology (KIT), Institute of Nanotechnology, Hermann-von-Helmholtz Platz 1, 76344 Eggenstein-Leopoldshafen,Germany
dInstitute of Electrochemistry, University of Ulm, Albert-Einstein-Allee 47, 89081 Ulm, Germany
Abstract
Li-ion batteries are commonly used in portable electronic devices due to their outstanding energy and power density.A remaining issue which hinders the breakthrough e.g. in the automotive sector is the high production cost. For lowpower applications, such as stationary storage, batteries with electrodes thicker than 300 µm were suggested. Highenergy densities can be attained with only a few electrode layers which reduces production time and cost. However,mass and charge transport limitations can be severe at already small C-rates due to long transport pathways. In thisarticle we use a detailed 3D micro-structure resolved model to investigate limiting factors for battery performance. Themodel is parametrized with data from the literature and dedicated experiments and shows good qualitative agreementwith experimental discharge curves of thick NMC-graphite Li-ion batteries. The model is used to assess the effect ofinhomogeneities in carbon black distribution and gives answers to the possible occurrence of lithium plating duringbattery charge. Based on our simulations we can predict optimal operation strategies and improved design conceptsfor future Li-ion batteries employing thick electrodes.
Keywords: Li-ion batteries, continuum modeling, micro-structure resolved simulation, thick electrodes
1. Introduction
The energy density of Li-ion cells, one of if not the most decisive parameter, is constantly being improved by anumber of measures. On the one hand, active anode and cathode materials are tuned to provide higher cell voltagesand higher charge densities. On the other hand, cell manufacturers minimize the fraction of inactive components in-cluding reduction of binder and conducting aids in the electrode layers, reduction of pore volume in highly calenderedelectrodes, use of thin separators and anode to cathode balancing factors close to unity. Furthermore, thick electrodelayers have a favorable electrode to current collector ratio per stack volume and additionally provide reduced cellmanufacturing costs due to fewer cutting and stapling steps.In this context we have recently presented a study where we compared 70 µm and 320 µm thick graphite andNMC(111) electrode layers [1]. While it was shown that the energy density can be improved, it also appeared thatelectrokinetics of thick electrodes suffer from limitations in electron and mass transport which becomes critical dur-ing charging when conditions evolve under which lithium plating can occur in the regions of the anode close to theseparator even at moderate C rates. This was presumably the reason for the short cycle life observed with the cellsconsisting of thick anodes and cathodes.In order to understand these effects in detail, different approaches are generally being pursued. The straight forwardone commonly used but resource intensive is the measurement of test matrices set up from parameters such as tem-peratures, C-rate, depth of discharge and others with one or more cells per matrix element accompanied by ante-and postmortem analysis. This works well when a sufficient amount of comparable cells, preferably commercially
∗Corresponding author:Email address: [email protected] (Timo Danner)URL: http://www.dlr.de/tt/en/ (Timo Danner)
Preprint submitted to Journal of Power Sources October 4, 2016

produced cells are available. Another approach is to directly look into the battery during operation. In the literatureseveral in-operando techniques were suggested to study specific aspects of Li-ion batteries. However, often modifi-cations of the cell design are necessary in order to fit the sample to the needs of the measurement device, such asrestrictions in sample size. This complicates a direct transfer of results between different cell designs.Detailed theoretical studies provide an interesting alternative and a variety of models were suggested in the literaturefor Li-ion batteries. They range from simple and efficient equivalent circuit and performance models [2, 3] to phys-ically motivated electrochemical [4–8] and thermal [9, 10] models. Important aspects affecting the performance andlifetime of the cell, such as dendrite formation [11, 12], SEI growth [13–15], lithium plating [16, 17], mechanicalstress and crack formation [18–20], and many more were studied in detail and help to improve our understanding ofrelevant process for a successful operation of Li-ion batteries. In this article we present detailed 3D micro-structureresolved simulations of half-cells as well as full battery cells consisting of thick NMC cathodes and graphite anodes.In our framework for numerical simulations BEST we are able to distinguish between active material, binder, and con-ductive additive such as carbon black which allows us to study the effect of local conditions and inhomogeneities onglobal cell performance. A focus of the simulations presented in this article is set on the investigation of the influenceof an inhomogeneous carbon black distribution. Carbon black consists of particles of high dispersion with a strongtendency to form stable agglomerates. In order to function as an electronic conducting aid in Li-ion battery electrodes,these agglomerates must be cracked during the electrode slurry preparation step by the usage of mechanical stirringforce and then be coated on the active material particles so that they provide interconnected pathways of high electronconductivity from the substrate foil to ideally every single active material particle [21]. Thus the destruction of ag-glomerates and the coating are sensitive steps and small deviations from the optimal process parameters could, amongothers, negatively affect local potential distributions in the electrode layers and lead to performance losses particularlyin the case of thick electrode layers. Moreover, we study the occurrence of lithium plating during battery charge whichis regarded as a major degradation mechanism. The basis for qualitative predictions on a complicated system suchas a Li-ion battery is a quantitative parameterization of the model. Most of the parameters are either taken from theliterature or our own dedicated experiments. For the estimation of kinetic parameters we present an approach basedon supplemental simulations with a reduced and computationally efficient 1+1D model. The article is structured asfollows:First, we present the setup and results of half- and full cell measurements on NMC/graphite cells which provide thebasis for a sound parameterization and validation of our model (Section 2). The model layout and governing equationsare summarized in Section 3. Finally, we present in Section 4 results of our simulations and discuss in detail the effectof local inhomogeneities in carbon black distribution and operating conditions on the performance of the battery.
2. Experiments
Graphite and NMC(111) were used to prepare 70 µm and 320 µm thick anode and cathode layers with high activematerial contents. They were tested in both half cell and full cell configuration. The electrochemical characterizationand all further details regarding the experimental setup and cycling protocols can be found in [1]. Representativecharge and discharge curves are shown in the course of model parameterization and validation. The open circuitvoltages in Figure 1 were recorded in half cell configuration on 70 µm thick electrodes vs. lithium metal. After threecharge and discharge cycles the cells were charged stepwise by 2.5% SOC followed by a 30 min resting period afterwhich the cell voltage was recorded. After fully charging the procedure was repeated in discharge direction to accountfor a possible hysteresis. The data sets for lithiation and delithiation are fitted with an empirical correlation given by
OCVNMC(soc) = 7.9760 − 5.5419 · soc + 5.2824 · soc1.0700
− 1.0556 · 10−04 · exp (124.7407 · soc − 114.2593)
− 4.0446 · soc0.0766 .
(1)
In order to extend the range of the correlation the data was extrapolated to voltages above the upper cut-off limit of4.2 V of the half-cell measurements. Figure 1 demonstrates that the data can be well described by Eq. (1). At SOC=0and SOC=1 we enforce a strongly diverging OCV curve to improve the stability of the 3D simulations if a particle isfully de-/lithiated. From these OCV measurements we also deduce a maximum amount of lithium cmax
s = 36224 mol
2

Figure 1: OCV curves determined by pulsed lithiation (yellow) and delithiation (red) measurements. Gray symbols represent extrapolated datapoints beyond the cut-off voltage of 4.2 V. The blue line shows a fit to the electrochemical data as given by Eq. (1).
m−3 which can be stored in the active material in the given potential window.In a second experiment we determine the effective conductivity of dry NMC electrodes. Disc shaped samples with adiameter of 11 mm were clamped between two nickel electrodes before the AC impedance at 5 kHz was measured(Gamry potentiostat interface 1000). Varying specific conductivities of 0.6 and 1.89 S m−1 were found for the 70 µmand 320 µm thick electrode, respectively. An explanation for this deviation might be a strong contribution of a contactresistance or an inhomogeneous carbon black and binder distribution in the thick electrodes.
3. Simulation methodology
In this section we give details on our approach for the simulation of thick NMC-graphite Li-ion batteries. First,we explain our method of structure generation and characterization. The resulting geometry and effective transportparameters are input to our electrochemical 1+1D and 3D simulations. 1+1D simulations are mainly used for anefficient determination of kinetic parameters which are needed in our detailed 3D micro-structure resolved simulations.
3.1. Structure generation and characterization
Realizations of electrode micro-structures are an important corner stone for predictive micro-structure resolvedsimulations [22, 23]. In this study we employ synchrotron radiation X-ray tomographies of NMC battery electrodesprovided open source by Ebner et al. [22]. The data matches favorably with our electrodes regarding composition,porosity, and particle size distribution. The reconstructions with dimensions of ∼700x700x70 µm are imported in thesoftware GeoDict [24] for a first structural characterization of transport parameters and specific surface area. Theresults show that the structure is rather isotropic which allows us to rotate the structure by 90° in order to generate arealization of a thick electrode. An additional coarsening step is needed to reduce the computational load of the 3Dsimulations and the final voxel length or resolution of our simulations is 1.48 µm. The binder phase is not resolved inthe tomography images. However, it is known that the binder distribution has an influence on the performance of thecell since it provides mechanical stability but blocks active surfaces. In our approach we distribute the binder in itsrespective weight percentage at positions in the electrode where the distance between neighboring active particles issmall. One of the challenges in micro-structural simulations is a mismatch in the scales of the different materials, suchas active particles d50 ≈ 11 µm and conductive additive d50 ≈ 100 nm. A resolution of the carbon black particles is notfeasible due to the high computational load and a lack of reliable image data. In our model we assume a continuoussurface layer with high electronic conductivity instead of resolving individual particles.The negative electrode consists of artificial graphite with an average particle diameter of 24 µm. Unfortunately, therewas no tomography data available for our structural model. Therefore, we use the software GeoDict to construct
3

an electrode realization based on the data sheets provided by material suppliers and SEM images [1]. The virtualmodel electrode consists of convex polyhedrons with a defined distribution of particle size and shape in order to get arealistic representation of the electrode geometry. In a second step the binder phase is distributed in the same manneras described for the positive electrode. Deviations in the transport behavior compared to the real electrode can beexpected and tomographies of graphite electrodes are an important direction for future research. In Section 4.1 weinvestigate the sensitivity of our simulations towards effective transport parameters in order to estimate the error ofour simulations.In the full cell simulations the area and thickness of the graphite anode are increased in order to avoid edge effectsand to take into account the balancing factor of the electrodes. At the cathode a thin layer of insulating materialsurrounding the electrode structure in y and z direction is assumed which is meant to represent the cell housing.Images of NMC and graphite micro-structures are provided at the top of Figure 2 and transport as well as structuralparameters are summarized in Table 1.
3.2. 1+1D modelThe modeling of Li-ion batteries was pioneered by Newman and co-workers [25, 26] and their work provides the
basis for a variety of continuum models suggested in the literature [27, 9, 5]. This pseudo-2D model is state of theart and a derivation of governing equations with the help of volume averaging techniques is given in [28] and [10]. Adetailed description of constitutive equations is not in the focus of this work, however, we provide a brief overview ofthe most important model features and summarize the equations in Table 2.In the pseudo-2D (1+1D) approach the transport of lithium ions by diffusion and migration in the electrolyte isdescribed by a volume-averaged material balance as given by Eq. (6). The potential of the electrolyte which is neededto describe the migrative flux is obtained by a charge balance under the assumption of electro-neutrality (cf. Eq. (8)).At the cathode and anode current collector we assume no-flux boundary conditions (∂ce/∂x = ∂φe/∂x = 0). In eachcontrol volume a representative active particle is modeled to take into account the diffusion of lithium in the activematerial (Eq. (14)). The de-/intercalation of lithium ions on the surface of the active particles
Li+ + e− Li (2)
is then typically described by the Butler-Volmer equation
ise = i0
[exp
(αFRT
η)− exp
(−
(1 − α)FRT
η
)]= i00cαe cαs (cmax
s − cs)1−α[exp
(αFRT
η)− exp
(−
(1 − α)FRT
η
)].
(3)
The associated flux of lithium ise/F is used as boundary condition for Eq. (14) at the particle surface. At the particlecenter no-flux boundary conditions apply due to symmetry reasons (∂cs/∂r = 0). The resulting flux of lithium ionsand electrons enter as a source term in the material balance of lithium ions (Eq. (6)) and the charge balance of thesolid phase (Eq. (16)), respectively. In the half-cell setup the negative electrode consists of a lithium metal foil. Wemodel the lithium electrode as an infinite reservoir of lithium which is stripped and deposited with a constant exchangecurrent density i0 = i00 = 10 A m−2 [29].The most prominent advantage of this type of model is its computational efficiency. Full charge/discharge simulationsare computed in only a few seconds to minutes on a standard desktop computer. Therefore, we employ the 1+1Dmodel in our work for the efficient estimation of model parameters by a fit to experimental data. The governingequations and a non-linear least squares algorithm for parameter estimation are implemented in Matlab.
3.3. 3D modelFor the 3D micro-structure resolved simulations we use our software BEST (Battery and Electrochemistry Simulation
Tool) which is developed in a joint effort by DLR/HIU and Fraunhofer ITWM Kaiserslautern [30]. BEST is a finitevolume implementation based on the CoRheos framework for complex and granular flow developed at Fraunhofer.The governing equations are derived in a rigorous approach from fundamental non-equilibrium thermodynamics. Adetailed derivation which also includes the description of a thermal model can be found in [8, 10]. In this article we
4
focus on isothermal simulations and the relevant equations are summarized in Table 2.The model consists of a similar set of governing equations as introduced in the previous paragraph describing thetransport of mass and charge in the electrolyte (Eq. (7) and Eq. (9)) and solid material (Eq. (15) and Eq. (17)).However, there are some fundamental differences between volume-averaged and micro-structure resolved modelswhich will be explained in detail in the following paragraph. Eq. (7) describes the temporal evolution of lithium ionconcentration in the liquid electrolyte
∂ce
∂t= −∇ ·
(−De∇ce +
tLi+ ieF
).
Compared to Eq. (6) this equation does not contain a source term related to the de-/intercalation of lithium. In ahomogenized model, like the 1+1D model described above, solid and liquid phases coexist in each voxel with their re-spective volume fraction εi. The volume averaging transforms the interfacial flux into a volume source term weightedwith a volume specific surface area av. In micro-structure resolved simulations each voxel can be clearly assigned to acertain phase or material with defined interfaces between neighboring voxels. Therefore, the de-/intercalation currentat the electrode-electrolyte interface is modeled as an interface flux [8] given by
n ·ieF
= n ·isF
=ise
F, (4)
where the area normal n points from the solid to the electrolyte phase and ise is calculated from the Butler-Volmerexpression in Eq. (3). The same applies for the charge balance in the electrolyte and solid phase. Moreover, sinceeach voxel can be assigned to a certain material or phase the transport properties in the bulk of the respective materialare used in Eqs. (7), (9), (15), and (17). In the 1+1D model effective transport parameters are needed as a result of thevolume averaging approach. Details on the underlying theory and simulation strategies can be found in [8, 10, 17].The simulations are performed directly on the electrode structures presented in Section 3.1. BEST is able to handlemultiple solid phases, such as binder, carbon black, and active material. For each material transport parameters (Ds,κ) need to be defined. The insulating nature of the binder phase is described by no-flux conditions to neighboringphases, whereas the surface layer of carbon black (cf. Section 3.1) is modeled as active material with high electricconductivity. In this case the transport of lithium and electrons is assumed to be continuous at phase boundariesand the charge transfer reaction between the electrolyte phase and active material is described by the Butler-Volmerequation (Eq. (3)). The micro-structure of the separator is not resolved explicitly in this study and we use effectivetransport parameters for the electrolyte phase in this region. At the boundary of the through plane direction whichis denoted by x in the 1+1D case we model current collectors with high electric conductivity and enforce no-fluxconditions for lithium in the solid phase and lithium ions in the electrolyte. In the directions orthogonal to x we alsoenforce no-flux conditions at the boundary of the computational domain since the electrode reconstructions are notperiodic in y and z. Test simulations using periodic boundary conditions showed a negligible influence on simulationresults even for inhomogeneous carbon black distribution.3D simulations are performed in parallel on 4 processors on the Justus cluster hosted by the Ulm University. Thecomputation time is in the order of 1 day for full-cell simulations of thick Li-ion batteries. Results of our simulationsare presented in Section 4.
4. Results and discussion
In this section we present results of our measurements and simulations of thick Li-ion batteries. First, we describein detail our parameterization methodology and validate the model against experimental data of half- and full-cellmeasurements. The validated 3D model is used for a detailed analysis of transport processes within the electrodes ofthick Li-ion batteries. In this context we set a focus on the influence of an inhomogeneous carbon black distributionon battery performance and the possible degradation of battery capacity and lifetime due to lithium plating.
4.1. Model parameterization and validation
A reliable parameterization is an important step for predictive simulations. Except for one all of the parametersof our models are either obtained from the literature or dedicated measurements. In order to ensure a consistent pa-rameterization of the 1+1D and 3D model we determine effective transport parameters for the structures presented in
5

Figure 2: Simulation results of electrodes with a thickness of 70 µm (top) and 320 µm (bottom) in half-cell configuration. The dotted line givesthe corresponding OCV curves as reference. The micro-structures of the NMC (left) and Graphite (right) electrode structures which are used in 3Dsimulations and for the determination of effective transport parameters are shown at the top the the Figure.
Section 3.1 in GeoDict. The negative electrode consisting of graphite (100 S m−1 [31]) and insulating binder has aneffective conductivity σeff ≈ 10.1 S m−1. At the positive electrode we assume σeff ≈ 1 S m−1 which is in between theexperimental data points for the thin and thick electrode (cf. Section 2). The conductivity of the carbon black surfacelayer (17.1 S m−1) is adjusted to match the electrode conductivity which is determined by the bulk conductivities ofNMC (0.023 S m−1 [32]), carbon (100 S m−1 [31]), and insulating binder. Bulk properties of the liquid electrolyte,such as conductivity, Li+ diffusion coefficient, and transference number are reported in Ref. [33]. The OCV curves ofgraphite are well studied in the literature and we use a correlation proposed by Safari et al. [27]. The correspondingexchange current density and lithium diffusion coefficient are taken from a parameter study by Vazquez-Arenas et al.[34] on NMC/graphite cells, which give a good agreement to our half-cell measurements (see Figure 2 b)). However,their parameterization of the NMC electrode gives unsatisfactory results. Therefore, we use the OCV curves presentedin Section 2 in our simulations and determine the exchange current density of NMC i00 = 5.06 · 10−6 m2.5 mol−0.5 s−1
6

Figure 3: Results of 1+1D delithiation simulations of the 320 µm graphite electrode at a rate of C/2 for increasing Bruggeman coefficient corre-sponding to an increase in transport resistance.
by a fit of the 1+1D model to experimental data of half-cell measurements on a 70 µm thick electrode (cf. Figure 2 a)).The diffusion coefficient of lithium is parametrized by simulating the stepwise charge and relaxation protocol whichwas used in the measurement of OCV curves. The estimated diffusion coefficient Ds ≈ 2· 10−15 m2 s−1 matches withthe value found by Dees et al. [35] for the simulation of electrochemical impedance spectra. All model parametersand corresponding sources are summarized in Table 3.Figures 2 a)-d) show de-/lithiation curves of NMC (left) and graphite (right) half-cell measurements on electrodeswith 70 and 320 µm thickness. The measurements are performed with increasing C-rate (C/10, C/5, C/2, 5 cycleseach) in discharge direction or delithiation and lithiation direction of the graphite and NMC half-cell, respectively.The C-rate of the charge process is kept constant at C/10. NMC half-cells and full-cell measurements are recorded gal-vanostatically with a lower and upper cut-off voltage of 3 and 4.2 V, respectively. The graphite half-cells are operatedin a potential window between 5 mV and 2.0 V. In general, we can report favorable agreement between measurementsand simulations, especially for thin electrodes (Figure 2 a) and b)). Differences between 1+1D and 3D simulationsare minor and become visible at high current densities only. This result shows that efficient 1+1D simulations can beused to obtain a first estimate of parameters for the detailed 3D model. However, at high current densities local effectswhich are not resolved in the 1+1D model become more prominent and the deviation to the micro-structure resolvedsimulations increases. This effect was also found by Goldin et al. [7] in their study on model electrodes consisting ofspherical particles. Figures 2 c) and d) show de-/lithiation curves of thick electrodes which demonstrate a good quali-tative agreement between measurements and simulations. In the case of NMC (Figure 2 c)) the predicted capacity ishigher compared to the experimental data. Deviations to the optimal electrode structure due to the challenging pro-duction process of thick electrodes might be responsible for this mismatch. This could cause fluctuations in electrodeloading or an inhomogeneous binder as well as carbon black distribution. The first case can be almost excluded sinceour measurements showed a good reproducibility. An inhomogeneous binder distribution might block active surfacesand transport pathways for electrons and lithium ions. An inhomogeneous carbon black distribution might lead toinsufficiently connected areas of the electrode. Both cases will effectively lead to a loss in cyclable active materialand, therefore, capacity. The effect of inhomogeneous carbon black distribution will be discussed in detail in Section4.3. It has to be noted, that a scaling of the simulated and measured voltage curves with the maximum theoretical andpractical capacity, respectively, yields better agreement between simulation and experiment at all rates. An analysisof the 3D concentration distribution of lithium ions in the electrolyte reveals a massive transport limitation leading tovanishing lithium ion concentration in large parts of the NMC electrode close to the current collector. This causes adisproportionately high capacity loss at a lithiation rate of C/2 and is an indication that thick electrodes in the currentdesign are not suitable for high power applications with C-rates much larger than C/5.A similar behavior is found for the delithiation of graphite at high C-rates as shown in Figure 2 d). However, the ca-pacity loss which is found in the experiments is more severe than predicted by our simulations. A possible explanation
7

Figure 4: Simulation results of the full battery cell. Left: Thin electrodes Right: Thick electrodes.
might be that the transport resistance in the electrolyte is higher than expected. As discussed in Section 3.1 the anodemicro-structure is reconstructed based on their macroscopic properties and SEM images. Local inhomogeneities andbottle-necks for lithium ion transport are not captured in this approach. In order to assess the effect of a higher trans-port resistance we vary the Bruggeman coefficient β in 1+1D simulations. Figure 3 a) shows the resulting voltagecurves at C/2 rate. The simulations show that transport limitations become prominent for β ≥ 2.6 resulting in a highcapacity loss. Figure 3 b) gives the corresponding concentration profiles at the end of the lithiation process. The sim-ulations predict that a high transport resistance will lead to a depletion of lithium in front of the lithium metal anode.This leads to a sharp increase in cell voltage due to our assumption of constant exchange current density as observedin Figure 3 a). Simulations with an exchange current density proportional to the concentration of lithium ions showeda smoother increase but qualitatively similar results. Values of β ≥ 2.6 are rather high and further investigations onthe micro-structure of graphite electrodes are needed to resolve this issue. Another possible source for the capacityloss could be the deposition of metallic lithium during the lithiation of graphite. In our simulations we do not find anindication for this degradation process at the relatively moderate lithiation current of a C/10 rate. A detailed analysisof lithium plating in the full battery cell is done in Section 4.4. Interestingly, we find in our simulations a large contri-bution of the charge transfer resistance at the lithium metal electrode to the overall cell resistance. Although lithiumdeposition kinetics are generally several orders of magnitude faster than intercalation kinetics the small active surfacearea limits the deposition rate. In the NMC electrode which has a lower porosity and higher tortuousity this effect wasfound to be negligible. In this case the charge transport resistance is larger relative to the charge transfer resistance atthe lithium metal electrode.
4.2. Full-cell simulations
Figure 4 presents results of full battery cell simulations consisting of thin (left) and thick (right) electrodes. Es-pecially, the simulation results of the thick cell are in good qualitative agreement with the experimental data. Thisindicates that our model captures most of the relevant effects determining the performance of the battery. At highdischarge rates we find a severe transport limitation of lithium ions as it was discussed above for NMC half-cells.This effect imposes the use of very small time steps in the simulation and the calculations had to be stopped half-wayduring discharge. Modifications of the code and/or solution strategy will be necessary to overcome this limitation forfuture work. However, it has to be pointed out that also the operation of the ’real’ battery cell under these extremeconditions should be avoided in practical applications.The validated 3D model gives the opportunity to study the influence of local conditions and inhomogeneities on cellperformance. These studies are not possible in standard 1+1D simulations and are a unique strength of micro-structureresolved simulations. In the remainder of this section the model will be used to analyze in detail the effect of inho-mogeneities in carbon black distribution in the NMC electrode and the occurrence of lithium plating in the graphiteelectrode during battery charge.
8

Figure 5: Lithiation curves of thick NMC electrodes in half-cell configuration. Graphs show the influence of an inhomogeneous soot distributionfor varying defect sizes at position ’4’ (5 a) and b)) and a large defect at varying defect positions (5 c) and d)) relative to the cathode currentcollector (CC).
4.3. Carbon black distributionThe fabrication process of battery electrodes with high areal loading is very challenging and a scale-up of the
electrode thickness is not straight forward. New production parameters or even new techniques will need to bedeveloped for e.g. the drying process of thick electrodes. Inhomogeneities in binder or carbon black distribution canaffect the life time and capacity of the battery. In this section we investigate the influence of carbon black distributionon the performance of the NMC electrode. In the optimal case we assume a perfect conductive layer on all NMCparticles. As inhomogeneity we define particles which do not have a layer of conductive carbon black on the surfaceand the whole particle has the low conductivity of NMC. In our simulations we vary both the position and size of
9

Figure 6: SOC during the lithiation of a thick NMC electrode at a rate of C/10 with a large defect at position 2 (L2) as shown in the inset on theupper right hand corner. The time points a)-d) are given in the corresponding lithiation curve.
inhomogeneities in carbon black distribution in lithiation simulations of thick NMC electrodes. The upper left handimage of Figure 5 shows the resulting current density distribution at a C/10 rate for an ideal carbon black distribution.The current flows almost exclusively in the surface layer as indicated by the red color. In the inhomogeneous casesthe NMC particles in varying parts of the electrode are modeled without a conductive surface layer. As indicated inFigure 5 a)-d) the size is defined by the cross-section of the electrode domain in which the conductive layer of particlesis missing. The dimension of the domain in x-direction is always 76 voxels and the side length of the cases denotedby ’S’, ’M’, ’L’, and ’full’ correspond to 40, 50, 60, and 64 voxels, respectively. As a second parameter we varythe position of the inhomogeneity relative to the current collector. In this case all inhomogeneities do have the samedimension in x-direction as position ’1’ such that there is some overlap of the regions. The different cases are alsoillustrated as insets in Figure 5 a)-d). The upper right hand image in Figure 5 shows a representative current densitydistribution for an electrode with a large inhomogeneity at position 2. The graph demonstrates the change in currentdensity distribution compared to the optimal electrode. As it can be seen at sliced particles some of the current isforced to flow through NMC particles with low electric conductivity. The impact of inhomogeneity position and sizeon electrode performance is illustrated in the graphs below. Small and medium size defects do not affect the electrodeperformance even at a high C/2 rate and irregardless of their position (Figure 5 a) and b)). Only for large defects oreven whole layers without conductive additive the effect becomes visible. The portion of the current which has to flowthrough NMC particles with low conductivity increases with defect size and, therefore, increases the contribution ofthe ohmic resistance. This effect can already be observed at low C-rates (5 a)) and becomes more pronounced at highC-rates (5 b)), eventually leading to a strong decrease in electrode capacity. For ’large’ defects we investigate in detailthe influence of the position of the inhomogeneities (Figure 5 c) + 5 d)).In summary we can conclude that a position of the inhomogeneity close to the current collector has a larger influenceon the lithiation curve. Moreover, the shape of the lithiation curve shows stages which are normally associated withchanges in the host structure of the active material. An effect which is not included in our simulations. This behavioris investigated in Figure 6 which shows the SOC of an electrode with a large defect at position ’2’ at four characteristictime points during a C/10 lithiation process. In an electrode with homogeneous carbon black distribution lithiationstarts close to the separator and a lithiation front moves towards the current collector during discharge. The presence
10
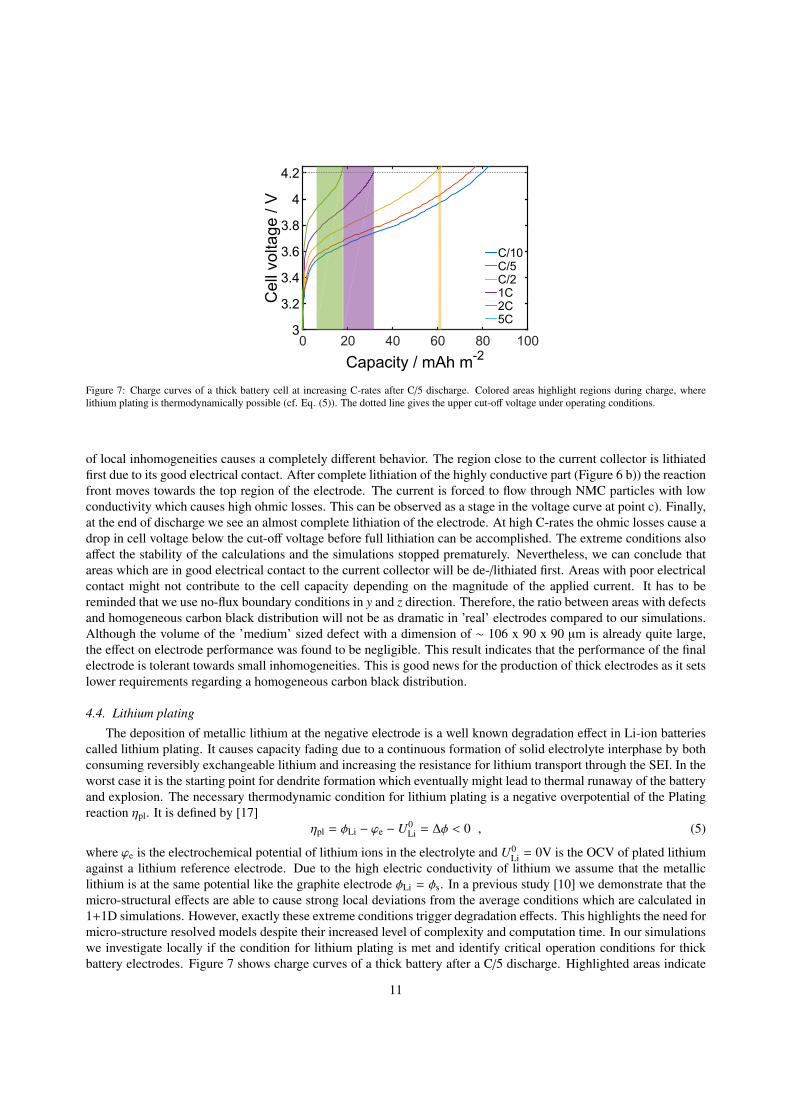
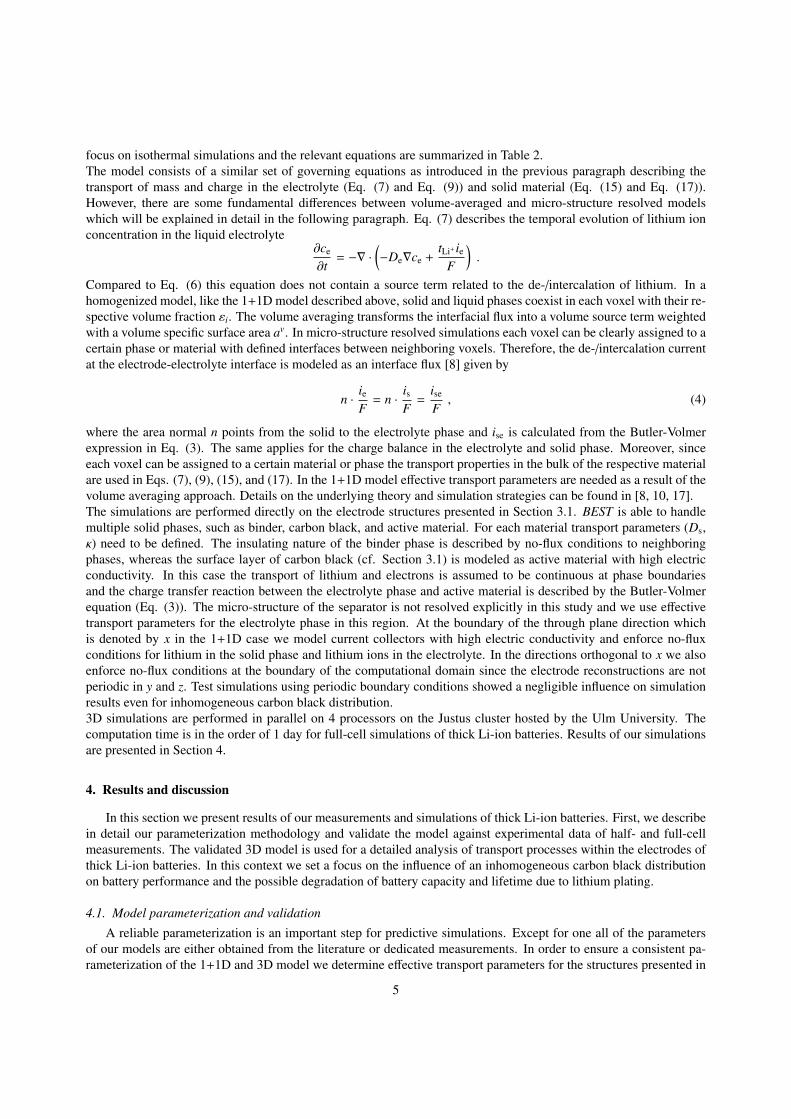
Figure 7: Charge curves of a thick battery cell at increasing C-rates after C/5 discharge. Colored areas highlight regions during charge, wherelithium plating is thermodynamically possible (cf. Eq. (5)). The dotted line gives the upper cut-off voltage under operating conditions.
of local inhomogeneities causes a completely different behavior. The region close to the current collector is lithiatedfirst due to its good electrical contact. After complete lithiation of the highly conductive part (Figure 6 b)) the reactionfront moves towards the top region of the electrode. The current is forced to flow through NMC particles with lowconductivity which causes high ohmic losses. This can be observed as a stage in the voltage curve at point c). Finally,at the end of discharge we see an almost complete lithiation of the electrode. At high C-rates the ohmic losses cause adrop in cell voltage below the cut-off voltage before full lithiation can be accomplished. The extreme conditions alsoaffect the stability of the calculations and the simulations stopped prematurely. Nevertheless, we can conclude thatareas which are in good electrical contact to the current collector will be de-/lithiated first. Areas with poor electricalcontact might not contribute to the cell capacity depending on the magnitude of the applied current. It has to bereminded that we use no-flux boundary conditions in y and z direction. Therefore, the ratio between areas with defectsand homogeneous carbon black distribution will not be as dramatic in ’real’ electrodes compared to our simulations.Although the volume of the ’medium’ sized defect with a dimension of ∼ 106 x 90 x 90 µm is already quite large,the effect on electrode performance was found to be negligible. This result indicates that the performance of the finalelectrode is tolerant towards small inhomogeneities. This is good news for the production of thick electrodes as it setslower requirements regarding a homogeneous carbon black distribution.
4.4. Lithium plating
The deposition of metallic lithium at the negative electrode is a well known degradation effect in Li-ion batteriescalled lithium plating. It causes capacity fading due to a continuous formation of solid electrolyte interphase by bothconsuming reversibly exchangeable lithium and increasing the resistance for lithium transport through the SEI. In theworst case it is the starting point for dendrite formation which eventually might lead to thermal runaway of the batteryand explosion. The necessary thermodynamic condition for lithium plating is a negative overpotential of the Platingreaction ηpl. It is defined by [17]
ηpl = φLi − ϕe − U0Li = ∆φ < 0 , (5)
where ϕe is the electrochemical potential of lithium ions in the electrolyte and U0Li = 0V is the OCV of plated lithium
against a lithium reference electrode. Due to the high electric conductivity of lithium we assume that the metalliclithium is at the same potential like the graphite electrode φLi = φs. In a previous study [10] we demonstrate that themicro-structural effects are able to cause strong local deviations from the average conditions which are calculated in1+1D simulations. However, exactly these extreme conditions trigger degradation effects. This highlights the need formicro-structure resolved models despite their increased level of complexity and computation time. In our simulationswe investigate locally if the condition for lithium plating is met and identify critical operation conditions for thickbattery electrodes. Figure 7 shows charge curves of a thick battery after a C/5 discharge. Highlighted areas indicate
11
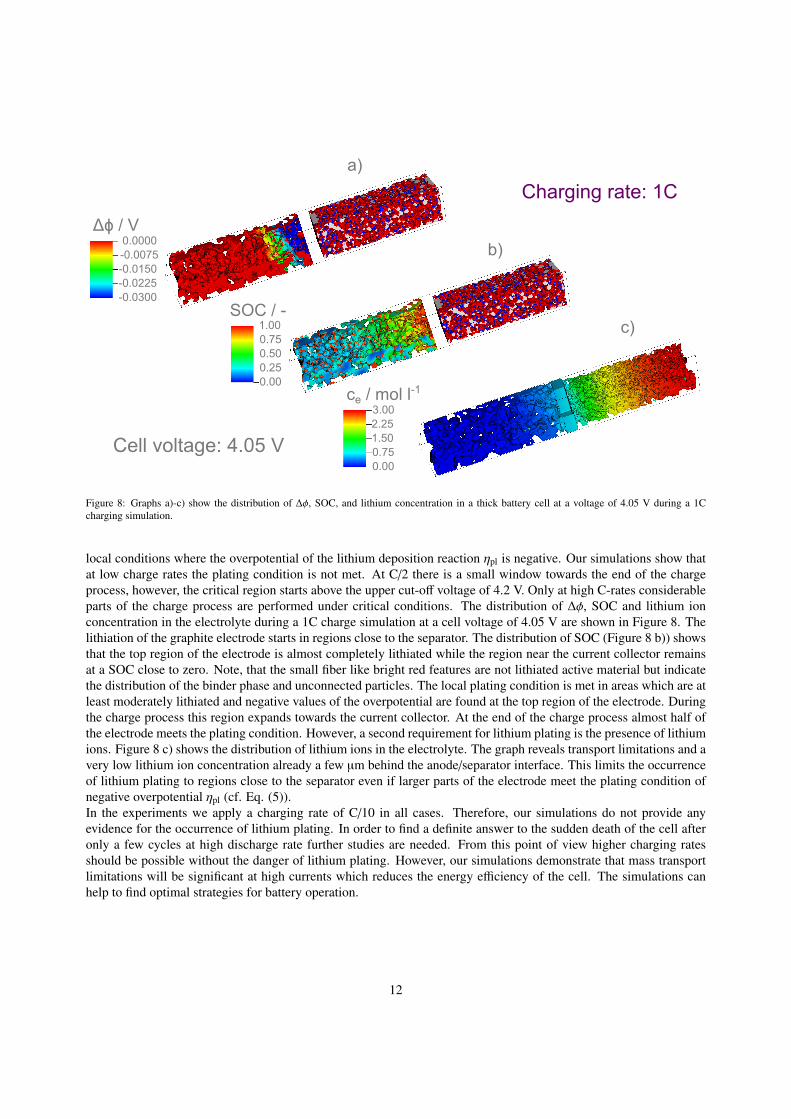
Figure 8: Graphs a)-c) show the distribution of ∆φ, SOC, and lithium concentration in a thick battery cell at a voltage of 4.05 V during a 1Ccharging simulation.
local conditions where the overpotential of the lithium deposition reaction ηpl is negative. Our simulations show thatat low charge rates the plating condition is not met. At C/2 there is a small window towards the end of the chargeprocess, however, the critical region starts above the upper cut-off voltage of 4.2 V. Only at high C-rates considerableparts of the charge process are performed under critical conditions. The distribution of ∆φ, SOC and lithium ionconcentration in the electrolyte during a 1C charge simulation at a cell voltage of 4.05 V are shown in Figure 8. Thelithiation of the graphite electrode starts in regions close to the separator. The distribution of SOC (Figure 8 b)) showsthat the top region of the electrode is almost completely lithiated while the region near the current collector remainsat a SOC close to zero. Note, that the small fiber like bright red features are not lithiated active material but indicatethe distribution of the binder phase and unconnected particles. The local plating condition is met in areas which are atleast moderately lithiated and negative values of the overpotential are found at the top region of the electrode. Duringthe charge process this region expands towards the current collector. At the end of the charge process almost half ofthe electrode meets the plating condition. However, a second requirement for lithium plating is the presence of lithiumions. Figure 8 c) shows the distribution of lithium ions in the electrolyte. The graph reveals transport limitations and avery low lithium ion concentration already a few µm behind the anode/separator interface. This limits the occurrenceof lithium plating to regions close to the separator even if larger parts of the electrode meet the plating condition ofnegative overpotential ηpl (cf. Eq. (5)).In the experiments we apply a charging rate of C/10 in all cases. Therefore, our simulations do not provide anyevidence for the occurrence of lithium plating. In order to find a definite answer to the sudden death of the cell afteronly a few cycles at high discharge rate further studies are needed. From this point of view higher charging ratesshould be possible without the danger of lithium plating. However, our simulations demonstrate that mass transportlimitations will be significant at high currents which reduces the energy efficiency of the cell. The simulations canhelp to find optimal strategies for battery operation.
12

5. Conclusions
The use of thick electrodes in Li-ion batteries gives the possibility to reduce the production cost and provides at thesame time an improved energy density. However, first experimental studies revealed a short cycle life and a significantdecrease in capacity at high C-rates. In this article we present a 3D micro-structure resolved model of a NMC-graphiteLi-ion battery implemented in our software BEST. The model was parametrized based on data in the literature and ded-icated experiments. We demonstrate the use of supplemental 1+1D simulations for an efficient estimation of kineticparameters by a fit to de-/lithiation curves measured on thin electrodes (70 µm) in half-cell configuration. The resultsof our model are in good qualitative agreement with the experimental data and give insights on limiting factors duringthe operation of thick Li-ion batteries. At high C-rates we find a strong limitation of the transport of lithium ions in theelectrolyte which is responsible for a significant loss in capacity. Small inhomogeneities in carbon black distribution,however, did not affect the performance of the electrode. Finally, we studied the occurrence of lithium plating duringbattery charge. At low C-rates we did not find any evidence of lithium plating which leaves the sudden death of thecell as open question for future research. In order to improve the rate capabilities advanced electrode structures, suchas layer configurations or gradients in porosity will need to be developed. Micro-structure resolved models in com-bination with a virtual material design of new electrode concepts will be able to guide future developments in the field.
AcknowledgmentsThe authors acknowledge support with computational resources provided by the state of Baden-Wurttemberg throughbwHPC (bwForCluster JUSTUS) and the German Research Foundation (DFG) through grant no INST 40/467-1FUGG. MS and JK would like to thank the Karlsruhe Institute of Technology and the Helmholtz Institute Ulm forfinancial support.
[1] M. Singh, J. Kaiser, H. Hahn, Thick Electrodes for High Energy Lithium Ion Batteries, J Electrochem Soc 162 (7) (2015) A1196–A1201.doi:10.1149/2.0401507jes.
[2] X. Hu, S. Li, H. Peng, A comparative study of equivalent circuit models for Li-ion batteries, J Power Sources 198 (2012) 359–367. doi:
10.1016/j.jpowsour.2011.10.013.[3] J. Remmlinger, S. Tippmann, M. Buchholz, K. Dietmayer, Low-temperature charging of lithium-ion cells Part II: Model reduction and
application, J Power Sources 254 (2014) 268–276. doi:10.1016/j.jpowsour.2013.12.101.[4] J. Newman, W. Tiedemann, Porous-electrode theory with battery applications, AIChE J 21 (1) (1975) 25–41. doi:10.1002/aic.
690210103.[5] G. G. Botte, V. R. Subramanian, R. E. White, Mathematical modeling of secondary lithium batteries, Electrochim Acta 45 (15-16) (2000)
2595–2609. doi:10.1016/s0013-4686(00)00340-6.[6] R. E. Garcia, Y.-M. Chiang, W. Craig Carter, P. Limthongkul, C. M. Bishop, Microstructural Modeling and Design of Rechargeable Lithium-
Ion Batteries, J Electrochem Soc 152 (1) (2005) A255. doi:10.1149/1.1836132.[7] G. M. Goldin, A. M. Colclasure, A. H. Wiedemann, R. J. Kee, Three-dimensional particle-resolved models of Li-ion batteries to assist the
evaluation of empirical parameters in one-dimensional models, Electrochim Acta 64 (2012) 118–129. doi:10.1016/j.electacta.2011.12.119.
[8] A. Latz, J. Zausch, Thermodynamic consistent transport theory of Li-ion batteries, J Power Sources 196 (6) (2011) 3296–3302. doi:
10.1016/j.jpowsour.2010.11.088.[9] W. Fang, O. Kwon, C. Wang, Electrochemical-thermal modeling of automotive Li-ion batteries and experimental validation using a three-
electrode cell, Int J Energy Res 34 (2010) 107–115. doi:10.1002/er.1652.[10] A. Latz, J. Zausch, Multiscale modeling of lithium ion batteries: thermal aspects, Beilstein J Nanotechnol 6 (2015) 987–1007. doi:10.
3762/bjnano.6.102.[11] C. Monroe, J. Newman, Dendrite Growth in Lithium/Polymer Systems, J Electrochem Soc 150 (10) (2003) A1377. doi:10.1149/1.
1606686.[12] D. R. Ely, A. Jana, R. E. Garcia, Phase field kinetics of lithium electrodeposits, J Power Sources 272 (2014) 581–594. doi:10.1016/j.
jpowsour.2014.08.062.[13] H. J. Ploehn, P. Ramadass, R. E. White, Solvent Diffusion Model for Aging of Lithium-Ion Battery Cells, J Electrochem Soc 151 (3) (2004)
A456. doi:10.1149/1.1644601.[14] J. Christensen, J. Newman, A Mathematical Model for the Lithium-Ion Negative Electrode Solid Electrolyte Interphase, J Electrochem Soc
151 (11) (2004) A1977. doi:10.1149/1.1804812.[15] M. B. Pinson, M. Z. Bazant, Theory of SEI Formation in Rechargeable Batteries: Capacity Fade, Accelerated Aging and Lifetime Prediction,
J Electrochem Soc 160 (2) (2012) A243–A250. doi:10.1149/2.044302jes.[16] P. Arora, M. Doyle, R. E. White, Mathematical Modeling of the Lithium Deposition Overcharge Reaction in Lithium-Ion Batteries Using
Carbon-Based Negative Electrodes, J Electrochem Soc 146 (10) (1999) 3543–3553. doi:10.1149/1.1392512.[17] S. Hein, A. Latz, Influence of local lithium metal deposition in 3D microstructures on local and global behavior of Lithium-ion batteries,
Electrochim Acta 201 (2016) 354–365. doi:10.1016/j.electacta.2016.01.220.[18] J. Christensen, Modeling Diffusion-Induced Stress in Li-Ion Cells with Porous Electrodes, J Electrochem Soc 157 (3) (2010) A366. doi:
10.1149/1.3269995.
13

[19] M. Huttin, M. Kamlah, Phase-field modeling of stress generation in electrode particles of lithium ion batteries, Appl Phys Lett 101 (13).doi:10.1063/1.4754705.
[20] K. Takahashi, V. Srinivasan, Examination of Graphite Particle Cracking as a Failure Mode in Lithium-Ion Batteries: A Model-ExperimentalStudy, J Electrochem Soc 162 (4) (2015) A635–A645. doi:10.1149/2.0281504jes.
[21] J. Kaiser, V. Wenzel, H. Nirschl, B. Bitsch, N. Willenbacher, M. Baunach, M. Schmitt, S. Jaiser, P. Scharfer, S. Schabel, Prozess- undProduktentwicklung von Elektroden fur Li-Ionen-Zellen, Chem-Ing-Tech 86 (5) (2014) 695 – 706. doi:10.1002/cite.201300085.
[22] M. Ebner, F. Geldmacher, F. Marone, M. Stampanoni, V. Wood, X-Ray Tomography of Porous, Transition Metal Oxide Based Lithium IonBattery Electrodes, Adv En Mater 3 (7) (2013) 845–850. doi:10.1002/aenm.201200932.
[23] J. Feinauer, T. Brereton, A. Spettl, M. Weber, I. Manke, V. Schmidt, Stochastic 3D modeling of the microstructure of lithium-ion batteryanodes via Gaussian random fields on the sphere, Comput Mater Sci 109 (2015) 137–146. doi:10.1016/j.commatsci.2015.06.025.
[24] Math2Market GmbH - Becker, J.; Wiegmann, A., GeoDict (2016).URL http://www.geodict.com
[25] J. S. Newman, K. E. Thomas-Alyea, Electrochemical systems, J. Wiley, 2004.[26] M. Doyle, T. Fuller, J. Newman, Modeling of galvanostatic charge and discharge of the lithium/polymer/insertion cell, J Electrochem Soc
140 (6) (1993) 1526–1533. doi:10.1149/1.2221597.[27] M. Safari, C. Delacourt, Modeling of a Commercial Graphite/LiFePO4 Cell, J Electrochem Soc 158 (5) (2011) A562. doi:10.1149/1.
3567007.[28] P. De Vidst, R. E. White, Governing Equations for Transport in Porous Electrodes, J Electrochem Soc 144 (4) (1997) 1343–1353. doi:
10.1149/1.1837595.[29] S. G. Meibuhr, Electrode studies in nonaqueous electrolytes, J Electrochem Soc 118 (1) (1970) 1320. doi:10.1149/1.2407438.[30] Fraunhofer Institute for Industrial Mathematics (ITWM) - Zausch, J., BEST - Battery and Electrochemistry Simulation Tool (2016).
URL http://www.itwm.fraunhofer.de/en/departments/flow-and-material-simulation/complex-fluids/
best-battery-and-electrochemistry-modeling.html
[31] M. Doyle, Comparison of Modeling Predictions with Experimental Data from Plastic Lithium Ion Cells, J Electrochem Soc 143 (6) (1996)1890. doi:10.1149/1.1836921.
[32] S. Kang, Layered Li(Ni0.5xMn0.5xM2x)O2 (M=Co, Al, Ti; x=0, 0.025) cathode materials for Li-ion rechargeable batteries, J Power Sources112 (1) (2002) 41–48. doi:10.1016/S0378-7753(02)00360-9.
[33] D. Djian, F. Alloin, S. Martinet, H. Lignier, Macroporous poly(vinylidene fluoride) membrane as a separator for lithium-ion batteries withhigh charge rate capacity, J Power Sources 187 (2) (2009) 575–580. doi:10.1016/j.jpowsour.2008.11.027.
[34] J. Vazquez-Arenas, L. E. Gimenez, M. Fowler, T. Han, S.-k. Chen, A rapid estimation and sensitivity analysis of parameters describingthe behavior of commercial Li-ion batteries including thermal analysis, Energ Convers Manage 87 (2014) 472–482. doi:10.1016/j.
enconman.2014.06.076.[35] D. W. Dees, D. P. Abraham, W. Lu, K. G. Gallagher, M. Bettge, A. N. Jansen, Electrochemical Modeling and Performance of a Lithium-
and Manganese-Rich Layered Transition-Metal Oxide Positive Electrode, J Electrochem Soc 162 (4) (2015) A559–A572. doi:10.1149/2.0231504jes.
[36] L. O. Valoen, J. N. Reimers, Transport Properties of LiPF6-Based Li-Ion Battery Electrolytes, J Electrochem Soc 152 (5) (2005) A882.doi:10.1149/1.1872737.
14

List of Tables
1 Dimensions and resolution of the electrode samples in x, y, z direction. The reconstructed electrodesare based on cubic voxels with a voxel size of 1.48 µm. Transport parameters and specific surfaceareas are determined by simulations in GeoDict [24]. . . . . . . . . . . . . . . . . . . . . . . . . . . 16
2 Constitutive equations of 1+1D [26] and 3D [10] Li-ion battery models used in this work. . . . . . . . 163 Simulation parameters. Values of electrode and separator thickness, porosity, and cross-sectional area
separated by ”-” indicate parameters for half-cell and full-cell measurements, respectively. In bothcases simulations are performed for electrodes with a thickness of 70 and 320 µm representing thinand thick electrodes. In order to match the balancing of the electrodes in the full-cell setup the graphiteelectrode thickness is increased to 85 and 345 µm, respectively. . . . . . . . . . . . . . . . . . . . . . 17
15

Dimensions Voxels av κeff βµm - m−1 S m−1 -
x/y/z x/y/zNMC (70 µm) 69.6/94.7/94.7 47/64/64 238065 1.07 2.26NMC (320 µm) 319.7/94.7/94.7 216/64/64 235370 0.99 2.23Graphite (70 µm) 69.6/94.7/94.7 47/64/64 116458 10.67 2.01Graphite (85 µm) 85.8/102.1/102.1 58/69/69 110660 9.49 1.86Graphite (320 µm) 319.7/94.7/94.7 216/64/64 105548 10.16 1.85Graphite (345 µm) 344.8/102.1/102.1 233/69/69 105548 10.00 1.87
Table 1: Dimensions and resolution of the electrode samples in x, y, z direction. The reconstructed electrodes are based on cubic voxels with avoxel size of 1.48 µm. Transport parameters and specific surface areas are determined by simulations in GeoDict [24].
1+1D BEST (3D)
Electrolyte
Material balance∂εece
∂t= −
∂
∂x
(−Deε
βe∂ce
∂x+
tLi+ ieF
)+
avise
F(6)
∂ce
∂t= −∇ ·
(−De∇ce +
tLi+ ieF
)(7)
Charge balance 0 = −∂ie∂x
+ avise (8) 0 = −∇ · ie (9)
ie = −κεβe∂φe
∂x− κDε
βe∂ce
∂x(10) ie = −κ∇φe − κD∇ce (11)
κD =2κRT (tLi+ − 1)
Fce
(1 +
∂ln fLi+
∂lnce
)(12) κD =
κ(tLi+ − 1)F
(∂µe
∂ce
)(13)
Active material
Material balance∂cs
∂t= −
1r2
∂
∂r
(−r2Ds
∂cs
∂r
)(14) ∂cs
∂t= −∇ · (−Ds∇cs) (15)
Charge balance 0 = −∂is∂x− avise (16) 0 = −∇ · is (17)
is = −σeff ∂φs
∂x(18) is = −σ∇φs (19)
Table 2: Constitutive equations of 1+1D [26] and 3D [10] Li-ion battery models used in this work.
16
NMC Separator GraphiteElectrolytec0
e / mol m−3 1000 [33]κ / S m−1 0.98 [33]tLi+ / - 0.4 [33]De / m2 s−1 2.72 · 10−10 [33](1+ln fe/∂lnce) / - 2.191 [36]β / - 2.25*** 1.5 2.0***Electrodeσeff / S m−1 1.0* 10.6***Ds / m2 s−1 2 · 10−15 [35] 3.9 · 10−14 [27]Kineticsi00 / m2.5 mol−0.5 s−1 5.06 · 10−6** 3.67 · 10−6[34]U0 / V see Eq. (1)* see Ref. [27]α / - 0.5 0.5cmax
s / mol m−3 36224* 23204*GeometryThickness / µm 70/320 - 70/320 200 - 30 70/320 - 85/345Area / cm2 0.95 - 25 1.1 - 33.64 0.95 - 29.16Rp / µm 5.5 - 12εe / - 0.383 0.8 - 0.5 0.4766εNMC / - 0.4900 - -εGraph / - 0.0435 - 0.4600εFiller / - 0.0408 0.2 - 0.5 0.0309εPVDF / - 0.0427 - 0.0325* Determined by dedicated experiment** Determined by fit to electrochemical data*** Determined from simulation in GeoDict
Table 3: Simulation parameters. Values of electrode and separator thickness, porosity, and cross-sectional area separated by ”-” indicate parametersfor half-cell and full-cell measurements, respectively. In both cases simulations are performed for electrodes with a thickness of 70 and 320 µmrepresenting thin and thick electrodes. In order to match the balancing of the electrodes in the full-cell setup the graphite electrode thickness isincreased to 85 and 345 µm, respectively.
17

Symbol Unit Meaningav m2· m−3 Specific surface areace mol · m−3 Li+ concentration in electrolytecs mol · m−3 Lithium concentration in active materialDe m2· s−1 Li+ diffusion coefficientDs m2· s−1 Lithium diffusion coefficientfe - Activity coefficientF C · mol−1 Faradays constantik A · m−2 Current density in phase kise A · m−2 Faradaic current densityi0 A · m−2 Exchange current densityi00 m2.5 mol−0.5 s−1 Rate constantr m Radial coordinateR J · mol−1 · K−1 Ideal gas constantRp m Particle radiust s Time
tLi+ - Transference numberU0 V Open circuit voltage
x, y, z m Spatial coordinatesα - Symmetry factorβ - Bruggeman coefficientεk - Volume fraction of phase kη V Overpotentialκ S·m−1 Electrolyte conductivityµe J · mol−1 Chemical potentialσk S·m−1 Electric conductivity of phase kφs V Electrolyte potentialφe V Electrode potentialϕe J · mol−1 Electrochemical potential
18