Embed Size (px)
Citation preview
They're doing what online? Assessing college students' use of technology
Stacy Ackerlind, Ph.D.University of Utah
Kim VanDerLinden, Ph.D.StudentVoice
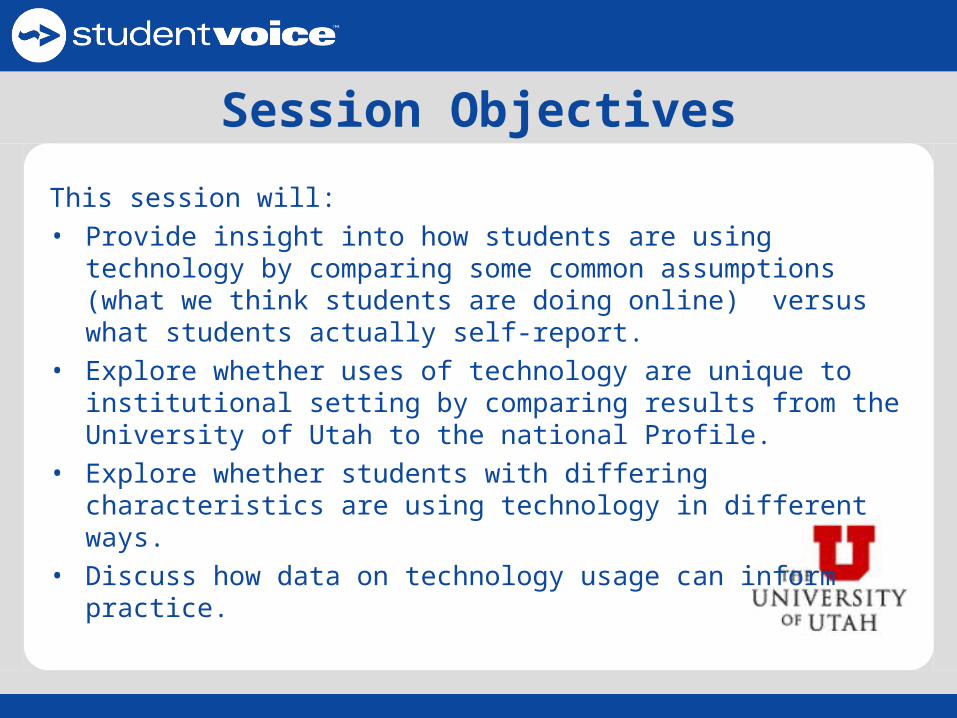
Session Objectives
This session will: • Provide insight into how students are using technology by comparing
some common assumptions (what we think students are doing online) versus what students actually self-report.
• Explore whether uses of technology are unique to institutional setting by comparing results from the University of Utah to the national Profile.
• Explore whether students with differing characteristics are using technology in different ways.
• Discuss how data on technology usage can inform practice.
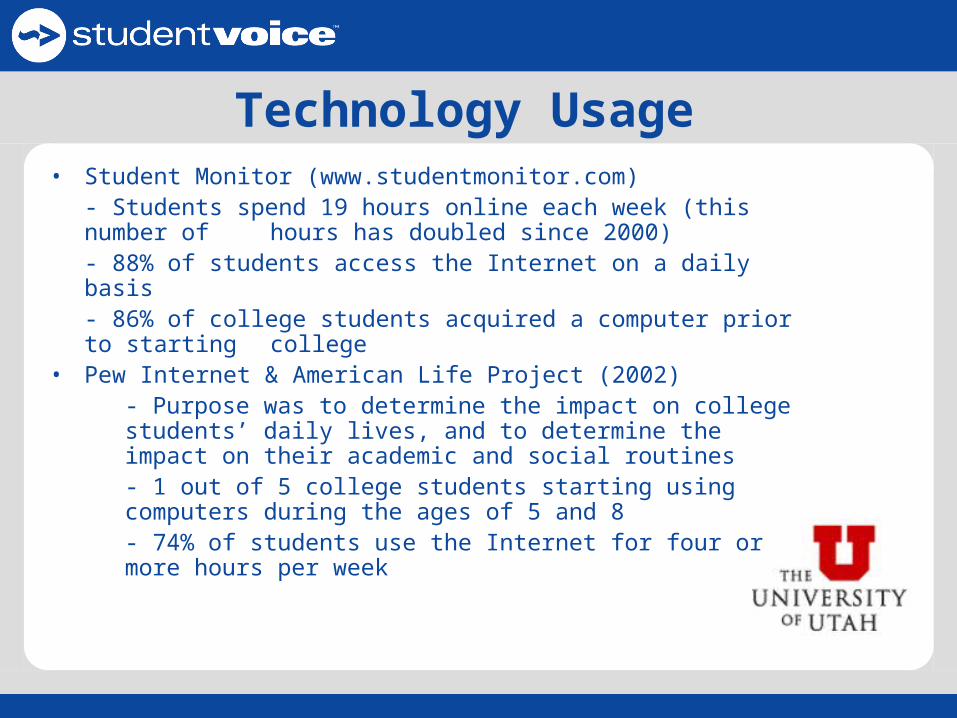
Technology Usage • Student Monitor (www.studentmonitor.com)
- Students spend 19 hours online each week (this number of hours has doubled since 2000)
- 88% of students access the Internet on a daily basis- 86% of college students acquired a computer prior to
starting college• Pew Internet & American Life Project (2002)
- Purpose was to determine the impact on college students’ daily lives, and to determine the impact on their academic and social routines - 1 out of 5 college students starting using computers during the ages of 5 and 8- 74% of students use the Internet for four or more hours per week
The Profile of the American College Student
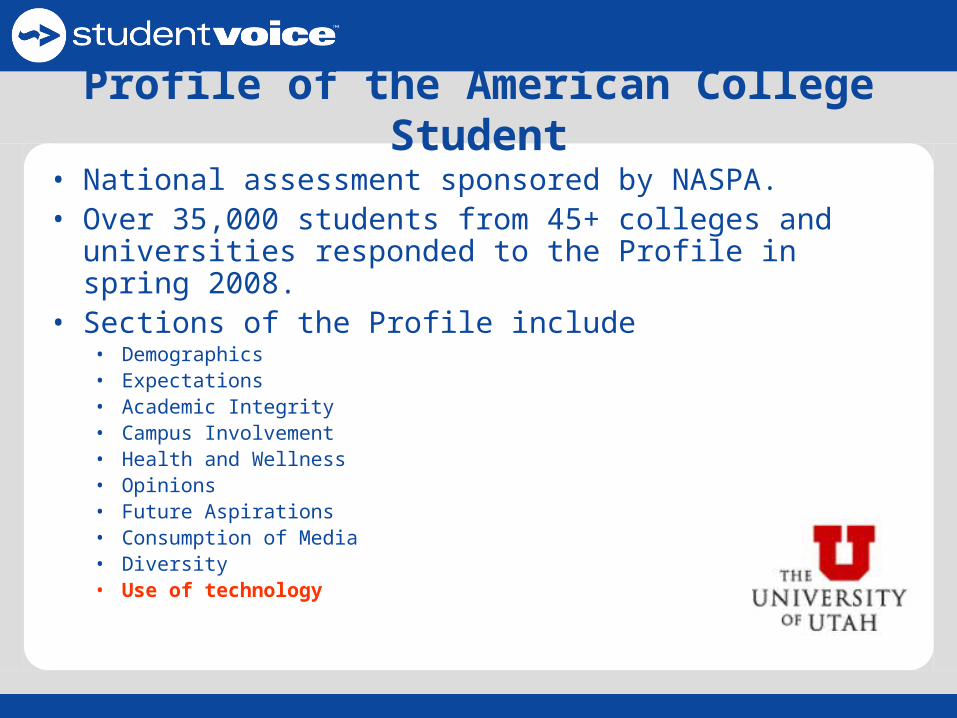
Profile of the American College Student
• National assessment sponsored by NASPA.• Over 35,000 students from 45+ colleges and universities
responded to the Profile in spring 2008. • Sections of the Profile include
• Demographics• Expectations• Academic Integrity• Campus Involvement • Health and Wellness• Opinions• Future Aspirations • Consumption of Media• Diversity • Use of technology
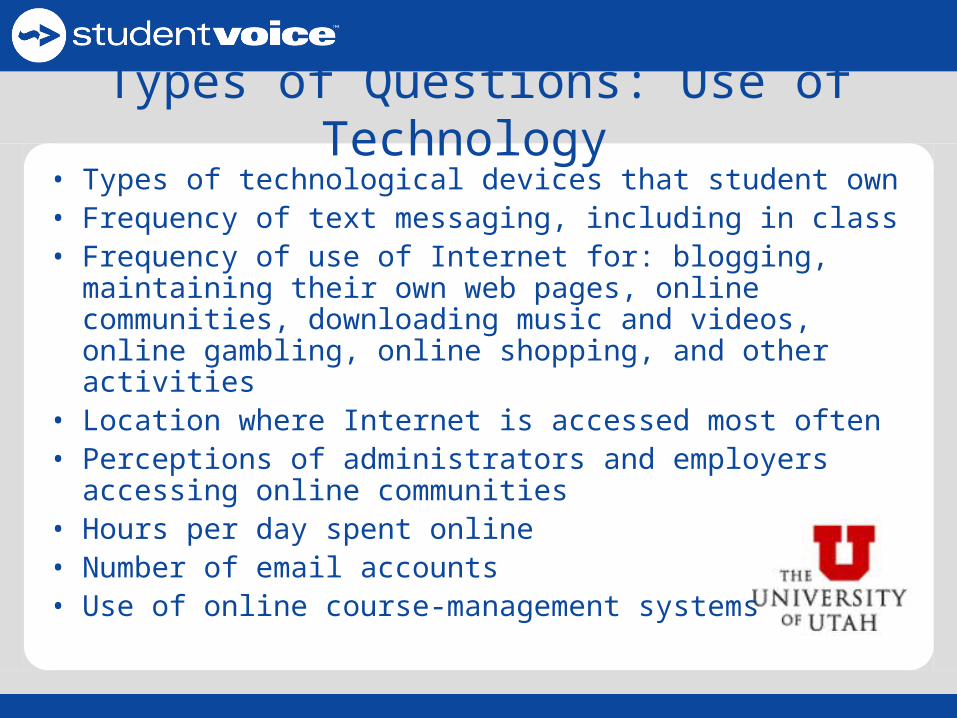
Types of Questions: Use of Technology • Types of technological devices that student own• Frequency of text messaging, including in class• Frequency of use of Internet for: blogging, maintaining
their own web pages, online communities, downloading music and videos, online gambling, online shopping, and other activities
• Location where Internet is accessed most often• Perceptions of administrators and employers accessing
online communities • Hours per day spent online• Number of email accounts• Use of online course-management systems
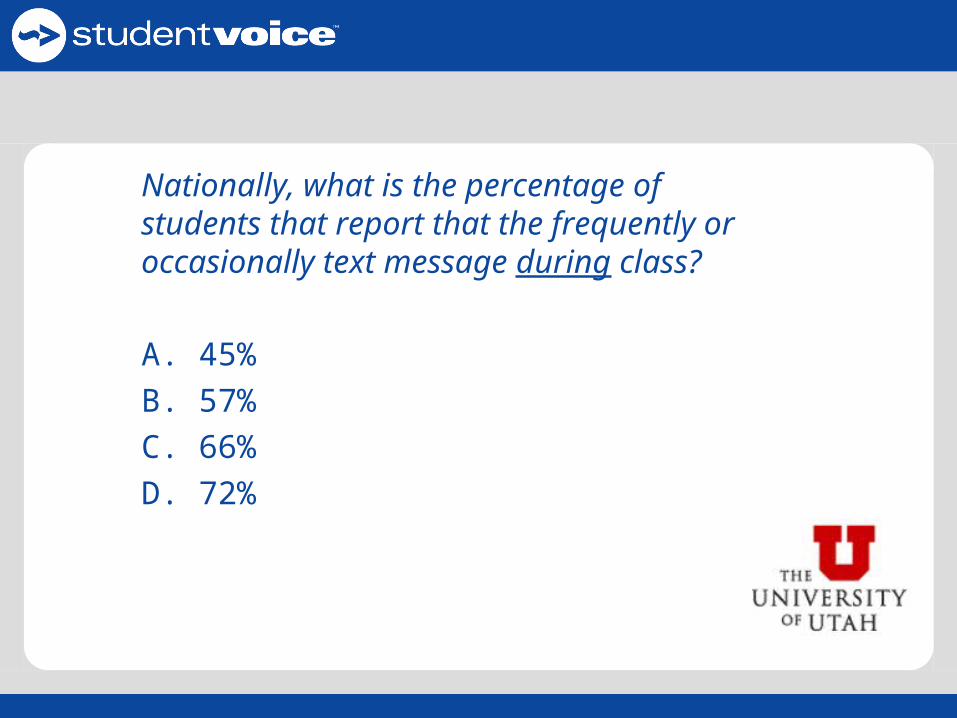
Nationally, what is the percentage of students that report that the frequently or occasionally text message during class?
A. 45%
B. 57%
C. 66%
D. 72%
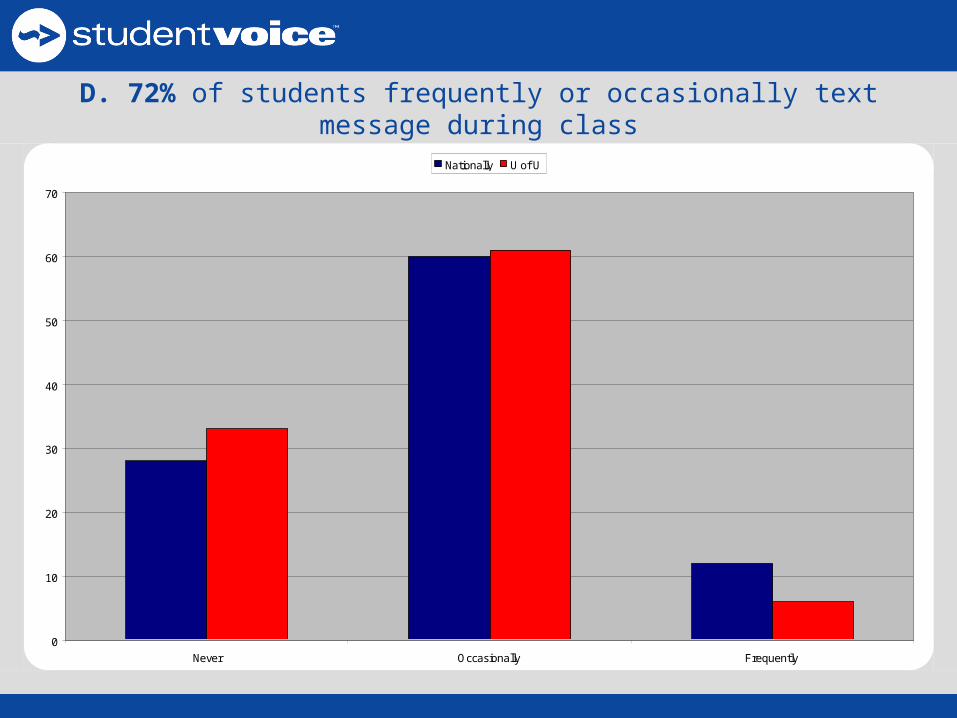
D. 72% of students frequently or occasionally text message during class
0
10
20
30
40
50
60
70
Never Occasionally Frequently
Nationally U of U
Nationally, what percentage of students report that they own a gaming device (Xbox, Play Station, Wii, etc.)?
A. 12%
B. 24%
C. 37%
D. 46%
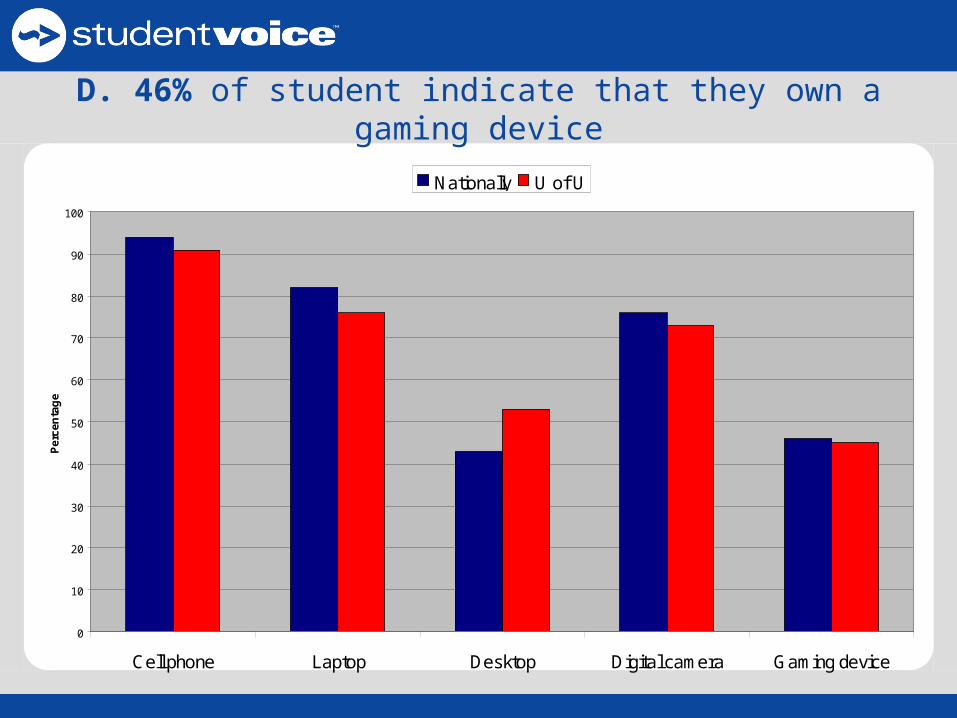
D. 46% of student indicate that they own a gaming device
0
10
20
30
40
50
60
70
80
90
100
Cell phone Laptop Desktop Digital camera Gaming device
Per
cen
tag
e
Nationally U of U
Nationally, what percentage of students report that the primary location where they access the Internet is a campus computer (library, computer lab, etc.)?
A. 2%
B. 7%
C. 14%
D. 19%
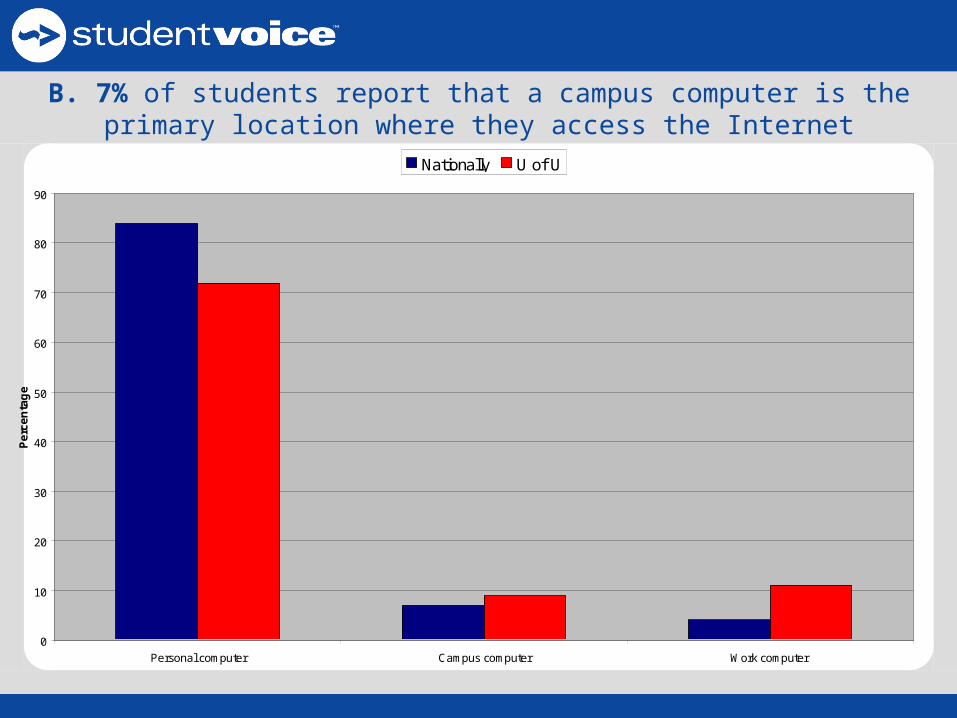
B. 7% of students report that a campus computer is the primary location where they access the Internet
0
10
20
30
40
50
60
70
80
90
Personal computer Campus computer Work computer
Pe
rce
nta
ge
Nationally U of U
Nationally, what percentage of students have a profile on an online social network?
A. 77%
B. 83%
C. 86%
D. 94%
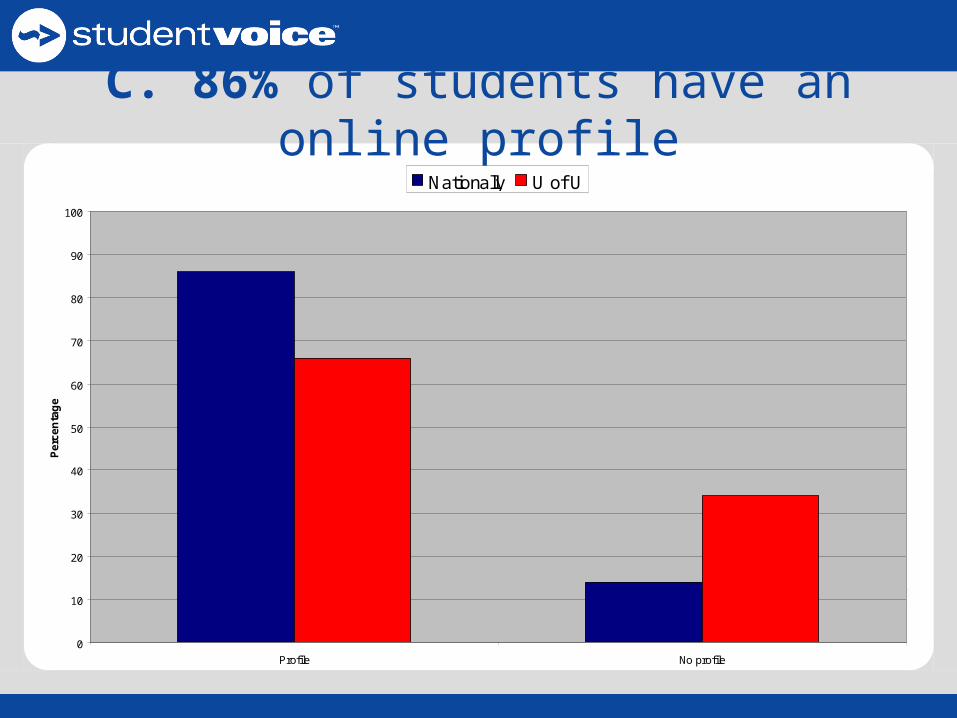
C. 86% of students have an online profile
0
10
20
30
40
50
60
70
80
90
100
Profile No profile
Pe
rcen
tag
e
Nationally U of U
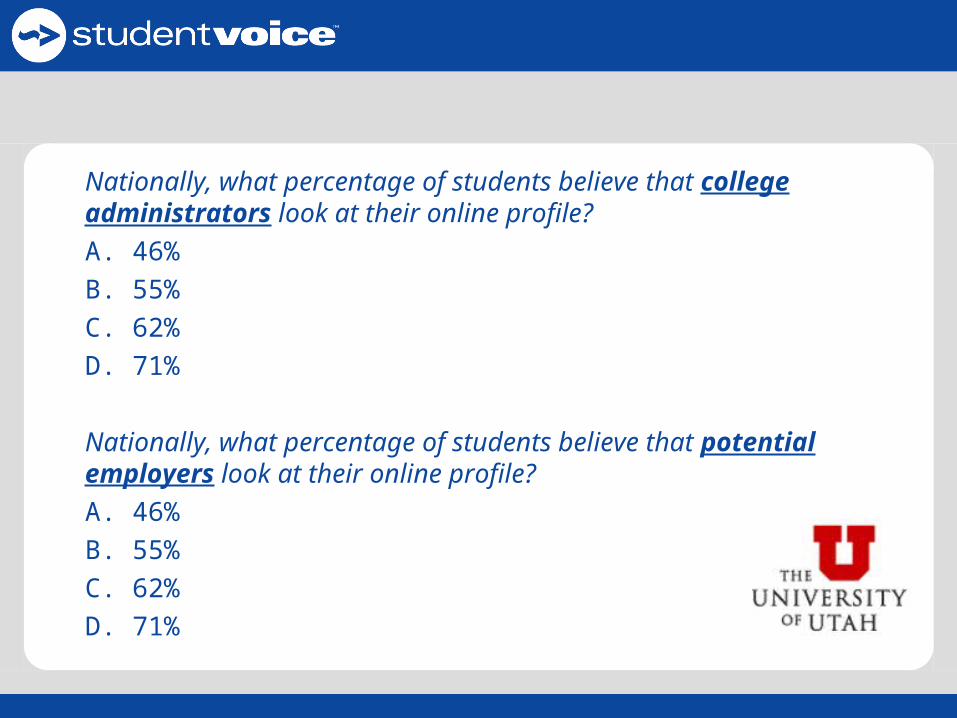
Nationally, what percentage of students believe that college administrators look at their online profile?
A. 46%
B. 55%
C. 62%
D. 71%
Nationally, what percentage of students believe that potential employers look at their online profile?
A. 46%
B. 55%
C. 62%
D. 71%
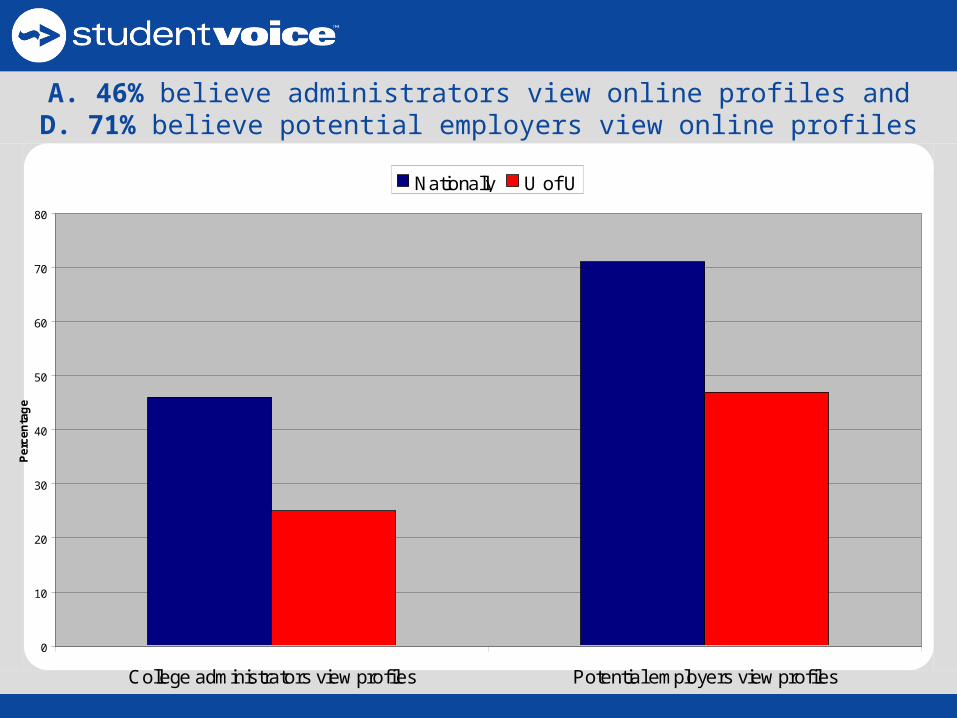
A. 46% believe administrators view online profiles and D. 71% believe potential employers view online profiles
0
10
20
30
40
50
60
70
80
College administrators view profiles Potential employers view profiles
Pe
rce
nta
ge
Nationally U of U
Nationally, what percentage of students believe that they should be held accountable for actions depicted in posted photographs?
A. 63%
B. 73%
C. 83%
D. 93%
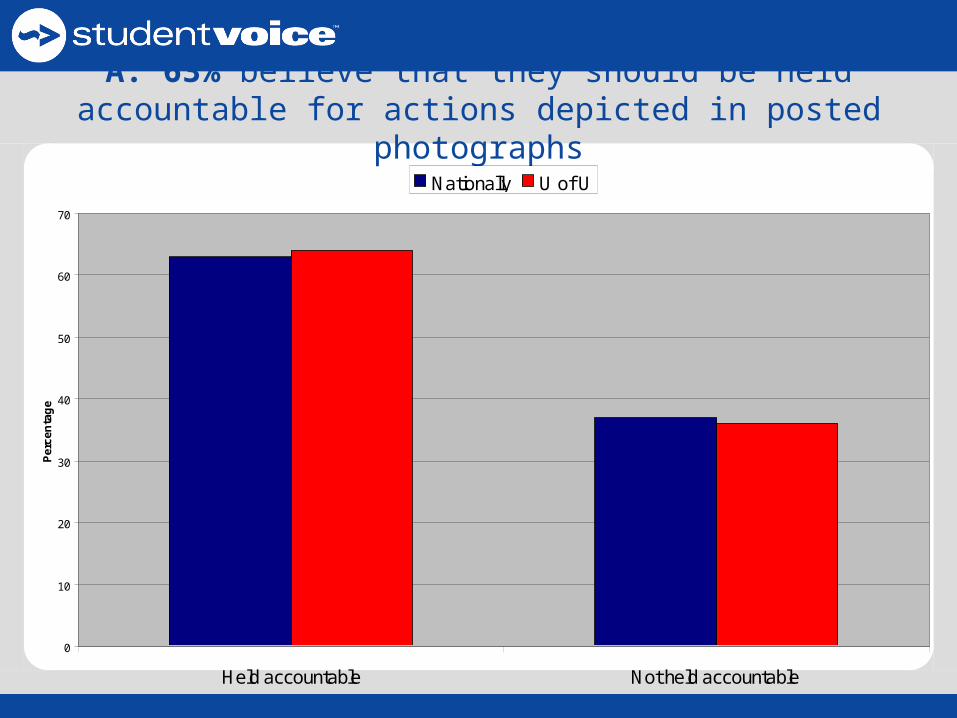
A. 63% believe that they should be held accountable for actions depicted in posted photographs
0
10
20
30
40
50
60
70
Held accountable Not held accountable
Pe
rce
nta
ge
Nationally U of U
Nationally, what percentage of students report having three or more active email accounts?A. 13% B. 26%C. 35%D. 41%
Nationally, what percentage of students report that they do NOT use the email account provided by their college?A. 13%B. 26%C. 35%D. 41%
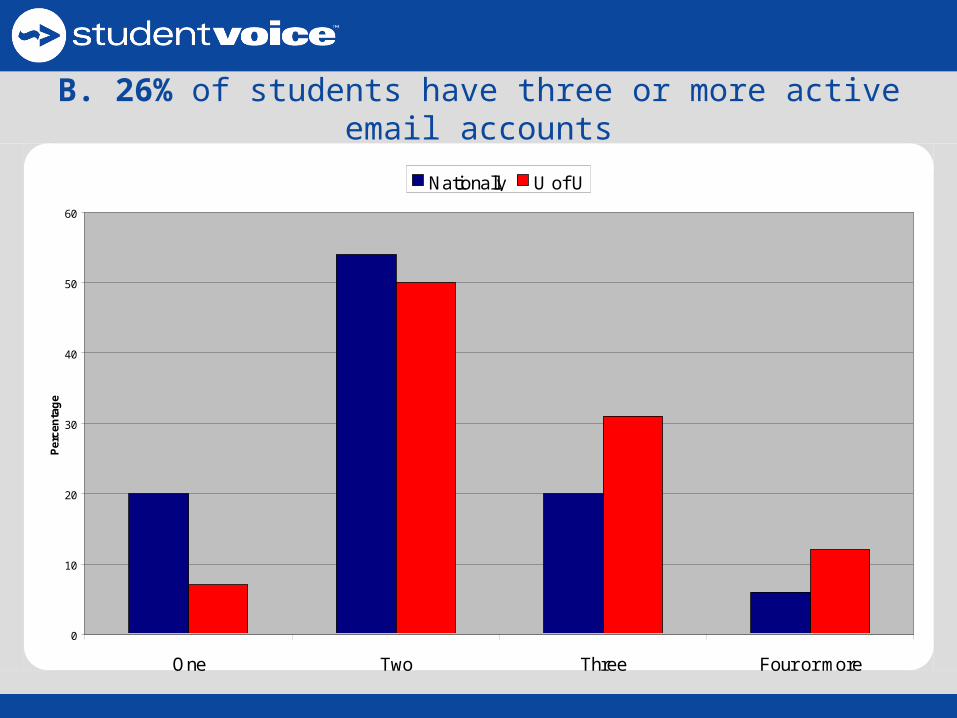
B. 26% of students have three or more active email accounts
0
10
20
30
40
50
60
One Two Three Four or more
Per
cen
tag
e
Nationally U of U
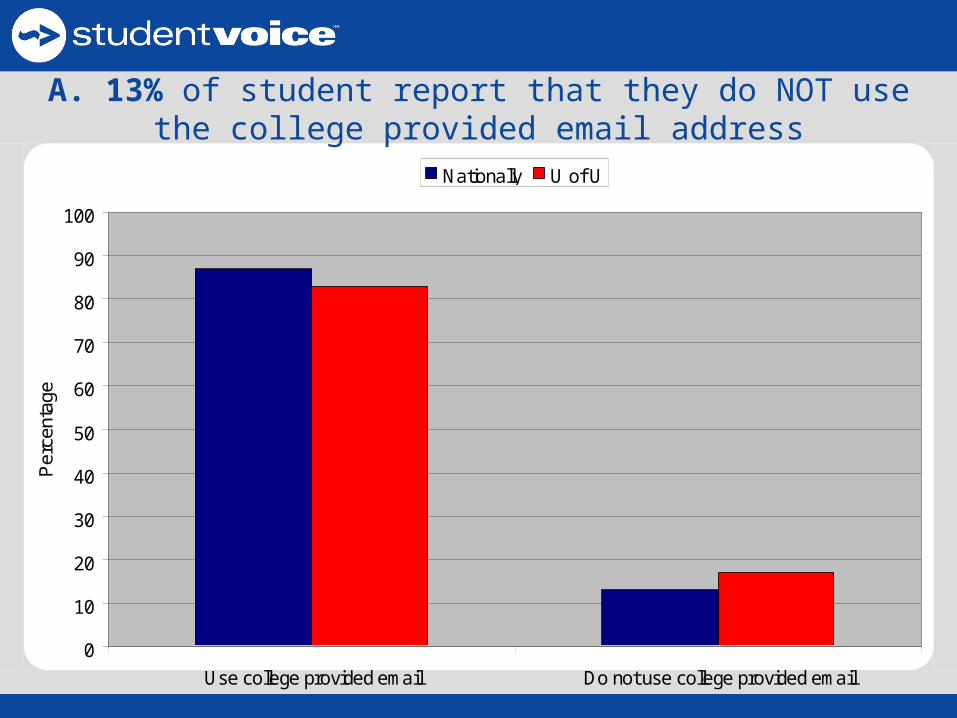
A. 13% of student report that they do NOT use the college provided email address
0
10
20
30
40
50
60
70
80
90
100
Use college provided email Do not use college provided email
Per
cent
age
Nationally U of U
Nationally, what percentage of students spend 6+ hours per day (on average) on the Internet?
Actively
A. 17%
B. 24%
C. 32%
D. 39%
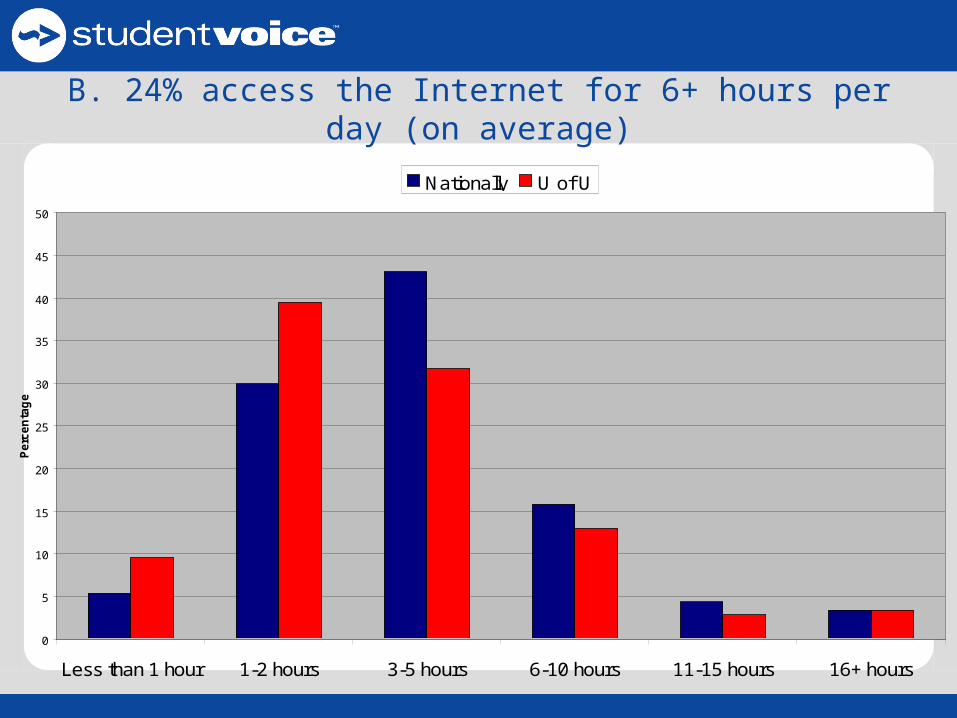
B. 24% access the Internet for 6+ hours per day (on average)
0
5
10
15
20
25
30
35
40
45
50
Less than 1 hour 1-2 hours 3-5 hours 6-10 hours 11-15 hours 16+ hours
Pe
rce
nta
ge
Nationally U of U
Does a digital divide or digital disconnect exist?
• Term ‘digital divide’ was coined in the 1990s and is defined by some as “the troubling gap between those who use computers and the internet and those who do not” (Mehra et al, 2004, p.782).
• More recently, discussions of a digital divide have broadened to include technology related skills and training in addition to basic access to computers and internet access.
Characteristics of heavy tech users (6+ hours per day of active Internet use)
Heavy Internet users: • Are slightly more likely to be first year students – 25% of
first year students spent 6+ hours per day (actively) on the Internet
• Are more likely to be international students (35%) rather than non-international students (23%)
• Are more likely to be male (26% of males versus 22% of females)
• Are more likely to live on-campus (28%)• Are more likely to be non-White
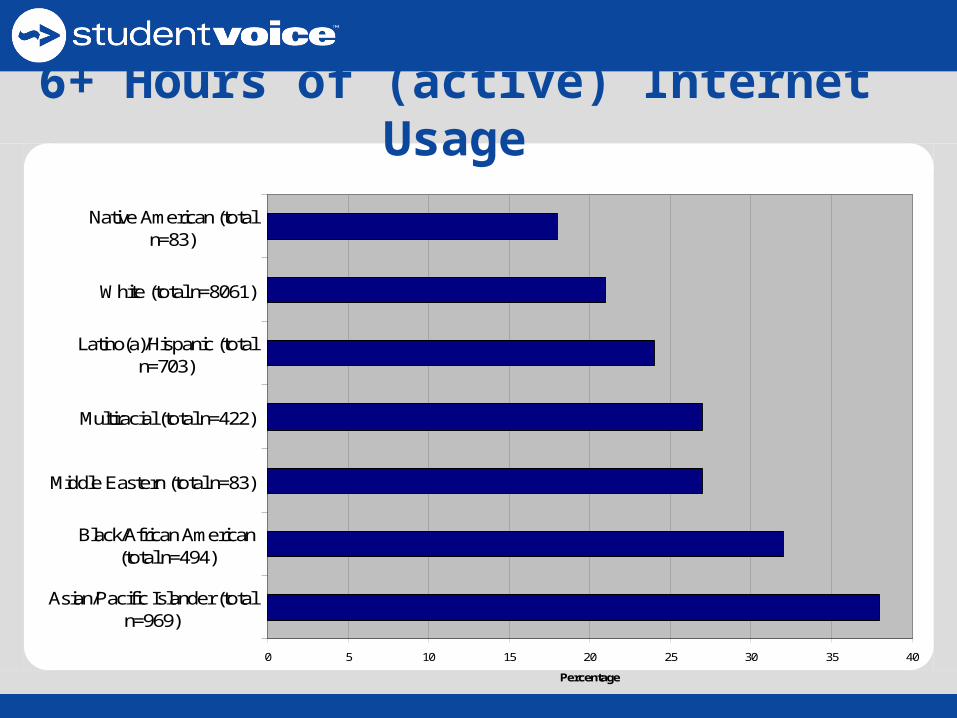
0 5 10 15 20 25 30 35 40
Asian/Pacific Islander (totaln=969)
Black/African American(total n=494)
Middle Eastern (total n=83)
Multiracial (total n=422)
Latino(a)/Hispanic (totaln=703)
White (total n=8061)
Native American (totaln=83)
Percentage
6+ Hours of (active) Internet Usage
Generational Digital Divide?
• Heavy users are more likely to be first year students.• First year students (91%) are much more likely than seniors
(83%) to have online profiles. Additionally, only 61% of those born before 1985 have an online profile versus 94% of those born after 1985.
• First year students are more likely to frequently text message during class. Those born after 1985 are more likely to access the Internet for non-course-related reasons during class.
• 26% of those born before 1985 do not text message, versus 11% of those born after 1985.
• Those born after 1985 are more likely to use the Internet for social/entertainment aspects (downloading music and videos) versus those born before 1985 use the Internet for more functional reasons (banking, shopping).
Future Research
• Further explore whether a digital divide or disconnect exists amongst college students.
• Unanswered questions remain about how technology is impacting student learning.
• Technology usage data can be cross referenced with other sections of the Profile data for a more holistic understanding of the student experience.
Questions and Comments