Embed Size (px)
Citation preview

arX
iv:a
stro
-ph/
0204
337v
1 1
9 A
pr 2
002
Mon. Not. R. Astron. Soc. 000, 000–000 (0000) Printed 5 October 2021 (MN LATEX style file v1.4)
The X–ray transient XTE J1859+226 in Outburst &
Quiescence
C. Zurita1⋆, C. Sanchez–Fernandez2, J. Casares1, P.A. Charles3, T.M. Abbott4,
P. Hakala5, P. Rodrıguez–Gil1, S. Bernabei6, A. Piccioni7, A. Guarnieri7, C. Bartolini7,
N. Masetti8, T. Shahbaz 1, A. Castro–Tirado91Instituto de Astrofısica de Canarias, 38200 La Laguna, Tenerife, Spain2Laboratorio de Astrofısica Espacial y Fısica Fundamental (LAEFF-INTA), 28080 Madrid, Spain3Department of Physics and Astronomy, University of Southampton, Southampton, SO17 1BJ, UK4Nordic Optical Telescope, 38700 Santa Cruz de La Palma, Spain.5Observatory and Astrophysics Laboratory, FIN-00014 University of Helsinki, Finland6Osservatorio Astronomico di Bologna, Via Ranzani 1 Bologna, Italy7Dipartimento di Astronomia, Universita di Bologna, Via Ranzani 1 Bologna, Italy8Istituto Tecnologie e Studio Radiazioni Extraterrestri, CNR, Via Gobetti 101, 40129 Bologna, Italy9Instituto de Astrofısica de Andalucıa, 18080 Granada, Spain
5 October 2021
ABSTRACT
We present optical photometry and spectroscopy of the X–ray transient XTEJ1859+226, obtained during outburst and its subsequent decay to quiescence. Boththe X–ray and optical properties are very similar to those of well–studied black holesoft X–ray transients. We have detected 3 minioutbursts, when XTE J1859+226 wasapproaching quiescence, as has been previously detected in the Soft X–Ray Tran-sients GRO J0422+32 and GRS 1009–45. By 24 Aug 2000 the system had reachedquiescence with R=22.48±0.07. The estimated distance to the source is ∼11 kpc. Pho-tometry taken during quiescence shows a sinusoidal modulation with a peak to peakamplitude of about 0.4 mag. A period analysis suggests that periods from 0.28 to 0.47days are equally possible at the 68% confidence level. The amplitude of the quiescentlight curve and the relatively low ratio of X–ray to optical flux, indicates that thebinary inclination should be high. The measured colours during the outburst allowsus to obtain the basic properties of the disc, which agrees well with irradiated discmodel predictions.
Key words: black hole physics–binaries:close–stars: individual: XTE J1859+226–X-rays:stars
1 INTRODUCTION
Soft X-ray transients (SXTs) are a subclass of low-mass X-ray binaries (LMXBs) that are characterized by episodic X-ray outbursts (usually lasting for several months), when theX-ray luminosities can increase by as much as a factor of107 (van Paradijs & McClintock 1995). The observed opti-cal flux is generated by X-ray reprocessing in the accretiondisc and the companion star. These outbursts recur on atimescale of decades, but in the interim the SXTs are in astate of quiescence and the optical emission is dominatedby the radiation of the faint companion star. This offers the
⋆ e-mail: [email protected]
best opportunity to analyze the properties of this star andobtain dynamical information which eventually enables usto constrain the nature of the compact object. There arecurrently 17 SXTs with identified optical counterparts, with13 dynamically studied black-holes and 4 confirmed neutronstars.
The X–ray transient J1859+226, was discovered by theAll–Sky Monitor (ASM) on board the Rossi X–Ray TimingExplorer (RXTE) on 1999 October 9 (Wood et al. 1999) andsubsequently identified with a R=15.1 variable star (Gar-navich & Quinn 2000). Spectra during outburst showed typ-ical LMXB features (Wagner et al. 1999). The dereddenedoptical energy distribution was represented by a steep bluepower law flattening in the ultraviolet which suggested a bi-
c© 0000 RAS

2 C. Zurita et al.
nary period ≤1 day. Although no persistent coherent mod-ulation was detected, a low amplitude (1 per cent modu-lation) with a period of 22–23 min was seen (Hynes et al.1999). Subsequent photometry revealed other modulationswith periods of 0.2806 days (Uemura et al. 1999) and 0.3813days (Garnavich et al. 1999), but none of them could beconfirmed. Nine months after the outburst, but still not inquiescence, a new 0.78 day period was reported (McClintocket al. 2000). Light curves folded on this period showed a 0.2mag primary minimum (interpreted as a partial eclipse ofthe accretion disc by the secondary star), and a shallow sec-ondary minimum (explained as an eclipse of the star by thedisc).
Here we present our extensive optical photometry ofthe entire outburst, the subsequent minioutburst and thefirst quiescent photometry. Some of these results have re-ceived preliminary announcements in Sanchez–Fernandez etal. 2000, Zurita et al. 2000 and Charles et al. 2000.
2 OBSERVATIONS AND DATA REDUCTION
2.1 Photometry
Our long–term monitoring campaign was carried out duringthe period Oct. 1999– Sep. 2000 with the 80 cm IAC80 and1m Optical Ground Station (OGS) at the Observatorio delTeide; 1m JKT, 2.5m NOT, 3.5m TNG and 4.5m WHT atthe Observatorio del Roque de los Muchachos; 1.5m OANand 2.2m CAHA at Observatorio de Calar Alto and 1.52mtelescope at Loiano. We obtained CCD images mainly in R–band but also some B, V, I colours. Integration times rangedfrom 30 s to 40 min , depending on the telescope, atmo-spheric conditions and the star brightness. The observinglog with full details is given in Table 1. All the images werede–biased and flat–fielded in the standard way using iraf.
We applied aperture photometry to our object and sev-eral nearby comparison stars within the field of view, us-ing iraf. We selected several comparison stars which werechecked for variability during each night, and over the en-tire data set. Calibration of the data was performed using17 standard stars from several fields (Landolt 2000), to con-struct a colour dependent calibration. Frames taken duringquiescence with the WHT and good seeing conditions, re-vealed the presence of a faint nearby star ∼1.4 arsec Northof the target (see Figure 1). We applied psf photometry usingthe IRAF routine DAOPHOT (Stetson 1987). We found amagnitude of R=23.05±0.04 for the contaminating star. Wealso recalibrated a set of 5 faint comparison stars from theprevious calibrated set, using these images (see Table 3).
2.2 Spectroscopy
Spectroscopic observations of XTE J1859+226 were carriedout at primary outburst and during one of the miniout-bursts. The observing log for these observations is presentedin Table 2. The first series of optical spectra of the sourcewere obtained on Oct. 28-29, 1999, when 31 exposures weretaken in the Isaac Newton Telescope (INT) at the Observa-torio del Roque de los Muchachos, using the eev10 camera
Table 1. Log of photometric observations (Oct 1999 –May 2000)
Date HJD(∗) Exp/Filter Telescope
Oct15 7 1xR 0.8m IAC80Oct17 9 10xI,21xR,2xV,2xB 0.8m IAC80Oct18 10 111xR,1xV,1xB 0.8m IAC80Oct19 11 106xR,1xV,1xB 0.8m IAC80Oct20 12 1xI,110xR,1xV ,1xB 0.8m IAC80Oct21 13 2xR,1xV,1xB 0.8m IAC80Oct23 15 1xR 0.8m IAC80Oct28 20 3xR 0.8m IAC80Oct29 21 1xI,111xR,1xV,1xB 0.8m IAC80Nov07 29 128xR 1.5m OANNov27 50 30xR,1xV,1xB 0.8m IAC80Nov28 51 40xR,1xV,1xB 0.8m IAC80Dic10 63 2xR 0.8m IAC80Dic12 65 4xR,1xV,1xB 0.8m IAC80Dic16 69 1xR 0.8m IAC80Jan03 87 3xR 2.2m CAHAJan04 88 3xV 2.2m CAHAJan05 89 1xB 2.2m CAHAFeb01 116 1xR 0.8m IAC80Feb04 119 1xI,1xR,1xV,1xB 1m OGSFeb05 120 1xI,1xR,1xV,1xB 1m OGSFeb06 121 1xI,2xR,1xV,1xB 1m OGSFeb07 122 1xI,1xR,1xV,1xB 1m OGSFeb08 123 1xI,1xR,1xV,1xB 1m OGSFeb09 124 1xI,1xR,1xV,1xB 1m OGSFeb10 125 1xI,1xR,1xV,1xB 1m OGSFeb11 126 2xI,2xR,2xV,2xB 1m OGSFeb12 127 1xI,2xR,1xV,1xB 1m OGSFeb13 128 2xI,2xR,1xV,1xB 1m OGS
Feb14 129 3xI,2xR,1xV,1xB 1m OGSFeb15 130 2xI,1xR,2xV,2xB 1m OGSFeb20 135 1xR 1m OGSFeb27 142 1xR 0.8m IAC80Mar03 145 1xR 0.8m IAC80Mar16 160 1xV,1xR 0.8m IAC80Mar23 167 1xV,1xR 0.8m IAC80Mar24 167-8 10xR Lowell
1xV,1xR 0.8m IAC80Mar25 168 1xR LowellMar27 170-1 30xR LowellApr03 178 1xV,1xR 0.8m IAC80Apr04 179 1xV,1xR 0.8m IAC80Apr05 180 1xR 0.8m IAC80Apr10 185 1xV,1xR 0.8m IAC80Apr16 191 1xR 0.8m IAC80Apr25 200 1xV,1xR 0.8m IAC80Apr28 203 2xR 0.8m IAC80May16 221 2xR 0.8m IAC80May17 222 1xR 0.8m IAC80May23 228 2xR 1.52 LoianoMay24 229 2xR 1.52 LoianoMay25 230 2xR 0.8m IAC80
3xR 1.52 Loiano
∗HJD–2451460
c© 0000 RAS, MNRAS 000, 000–000

XTE J1859+226 3
Table 1 – continued Log of photometric observations (Jun–Nov2000)
Date HJD(∗) Exp/Filter Telescope
Jun01 237 37xR 1m OGS
Jun03 239 34xR 1m OGSJun04 240 64xR 1m OGSJun06 242 69xR 1m OGSJun07 243 28xR 1m OGSJun11 246 1xR 0.8m IAC80Jun12 248 1xI,1xV 2.5 NOTJun14 249 1xV,1xR 0.8m IAC80Jun24 260 1xR 0.8m IAC80
18xR 1m OGSJun25 261 17xR 1m OGSJun28 264 17xR 1m OGSJul01 267 1xV,1xR 0.8m IAC80Jul02 268 2xR 1.52 LoianoJul03 269 1xR 1.52 LoianoJul04 270 1xV,1xR 0.8m IAC80Jul05 271 336xB 2.5 NOTJul06 272 1xV,1xR 0.8m IAC80
887xB 2.5 NOTJul11 277 1xV,1xR 0.8m IAC80Jul14 280 1xV,1xR 0.8m IAC80Jul15 281 1xV,18xR 0.8m IAC80Jul16 282 1xR 1m JKTJul17 283 1xR 0.8m IAC80Jul19 285 1xR 0.8m IAC80Jul20 286 1xR 1m JKTJul21 287 1xR 0.8m IAC80
1xR 1.52 LoianoJul22 288 1xR 0.8m IAC80Jul23 289 1xR 1.52 LoianoJul24 290 1xR 1.52 LoianoJul27 293 1xR 1.52 LoianoJul30 296 168xR 1m OGSJul31 297 59xR 1m OGSAug05 302 1xR 0.8m IAC80Aug06 303 1xR 0.8m IAC80
1xR 1.52 LoianoAug07 304 1xR 1.52 LoianoAug08 305 1xV,1xR 0.8m IAC80Aug09 306 1xV,1xR 0.8m IAC80Aug10 307 1xR 1.52 LoianoAug11 308 1xR 1.52 LoianoAug18 315 1xR 1.52 LoianoAug19 316 1xR 1.52 LoianoAug20 317 1xR 1.52 LoianoAug21 318 1xR 1.52 LoianoAug24 321 1xR 0.8m IAC80
Aug25 322 1xR 0.8m IAC80Aug27 324 1xR 0.8m IAC80Aug28 325 1xR 0.8m IAC80Aug29 326 1xR 0.8m IAC80Aug04 332 1xR 0.8m IAC80Aug05 333 1xR 0.8m IAC80Sep27 355 6xR 4.2m WHTSep28 356 16xR 4.2m WHTOct17 374 1xV 2.5m NOTNov04 393 6xR 2.5m INTNov05 394 5xR 2.5m INT
∗HJD–2451460
Table 2. Log of spectroscopic observations
Date HJD(∗) Number of spectra Telescope
99 Oct28 20 1 1.52m G.D. Cassini99 Oct28 20 7 2.5m INT99 Oct29 21 24 2.5m INT00 Jul11 277 12 4.5m WHT
∗HJD–2451460
N W
C1
2
3
4
5
E N
Figure 1. R band 1800 s image of XTE J1859+226. The field ofview is 1.4 x 1.0 arcmin. XTE J1859+226 is indicated by an arrowand the contaminanting star by the letter C. The magnitudes ofstars 1–5 are listed in Table 3
on the Intermediate Dispersion Spectrograph (ids) (range3500-5000 A, spectral resolution 1.02 A/pixel). The expo-sure times ranged from 300–600 s for individual spectra. Asingle 2400 s spectrum was obtained with the 152cm G.D.Cassini Telescope at Loiano Observatory using bfosc. Theslit width was 2.5” and the spectral range 3500-9000 A. Thesecond series of spectroscopic observations were carried outon July 11 2001, during the second optical minioutburst de-scribed in section 4. We observed XTE J1859+226 usingthe isis spectrograph on the 4.2m WHT in Observatorio delRoque de los Muchachos, using typical exposure times of1800 s. Standard iraf procedures were used to de–bias theimages and to remove the small scale CCD sensitivity vari-ations. One dimensional spectra were then extracted fromthe processed images using the optimal extraction method(Horne 1986). Wavelength calibration was interpolated be-tween contemporaneous exposures of a copper–argon arclamp. No flux calibration was performed on the spectra, in-stead continuum normalization was applied.
c© 0000 RAS, MNRAS 000, 000–000

4 C. Zurita et al.
0 40 80 120 160 200 240 280 320 36024
23
22
21
20
19
18
17
16
15
HJD-2451460
26
24
22
20
0 80 160 240 320 400 480 560 64022
21
20
19
18
17
16
15
14
13
12
HJD-2448895
Figure 2. Top: Temporal evolution of J1859+226 plotted as ’X-ray magnitudes’ [24-2.5log(XTE/ASM Count Rate)] and R-bandmagnitudes averaged for each day. Note that 1 Crab equals an xte/asm count rate of 75 counts/sec. A, B and C mark the epochs studiedfor photometric and spectrometric variability . The arrows indicate the dates when spectra were taken. Bottom: R band light curve ofXTE J0422+32 plotted for comparison. The J0422+32 data were provided by E. Kuulkers.
c© 0000 RAS, MNRAS 000, 000–000
XTE J1859+226 5
220 230 240 250 260 270 280 290 300 310 320 330
23
22
21
20
19
18
17
20
18
16
14
0 20 40 60 80 100 120 140 160 180 200 22024
22
20
18
Days
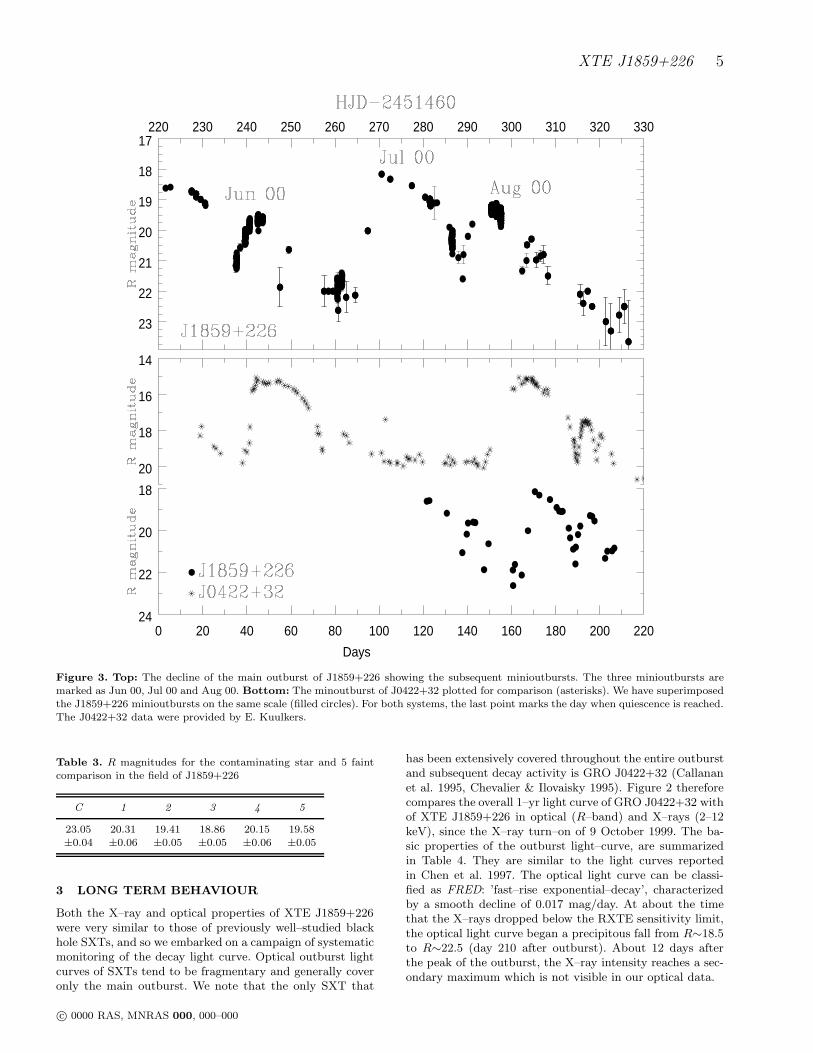
Figure 3. Top: The decline of the main outburst of J1859+226 showing the subsequent minioutbursts. The three minioutbursts aremarked as Jun 00, Jul 00 and Aug 00. Bottom: The minoutburst of J0422+32 plotted for comparison (asterisks). We have superimposedthe J1859+226 minioutbursts on the same scale (filled circles). For both systems, the last point marks the day when quiescence is reached.The J0422+32 data were provided by E. Kuulkers.
Table 3. R magnitudes for the contaminating star and 5 faintcomparison in the field of J1859+226
C 1 2 3 4 5
23.05 20.31 19.41 18.86 20.15 19.58±0.04 ±0.06 ±0.05 ±0.05 ±0.06 ±0.05
3 LONG TERM BEHAVIOUR
Both the X–ray and optical properties of XTE J1859+226were very similar to those of previously well–studied blackhole SXTs, and so we embarked on a campaign of systematicmonitoring of the decay light curve. Optical outburst lightcurves of SXTs tend to be fragmentary and generally coveronly the main outburst. We note that the only SXT that
has been extensively covered throughout the entire outburstand subsequent decay activity is GRO J0422+32 (Callananet al. 1995, Chevalier & Ilovaisky 1995). Figure 2 thereforecompares the overall 1–yr light curve of GRO J0422+32 withof XTE J1859+226 in optical (R–band) and X–rays (2–12keV), since the X–ray turn–on of 9 October 1999. The ba-sic properties of the outburst light–curve, are summarizedin Table 4. They are similar to the light curves reportedin Chen et al. 1997. The optical light curve can be classi-fied as FRED: ’fast–rise exponential–decay’, characterizedby a smooth decline of 0.017 mag/day. At about the timethat the X–rays dropped below the RXTE sensitivity limit,the optical light curve began a precipitous fall from R∼18.5to R∼22.5 (day 210 after outburst). About 12 days afterthe peak of the outburst, the X–ray intensity reaches a sec-ondary maximum which is not visible in our optical data.
c© 0000 RAS, MNRAS 000, 000–000

6 C. Zurita et al.
Table 4. Basic properties of the outburst.
Date of the outburst: Oct.1999
X–ray light curve
Morphology type: FREDInstrument and E band: ASM(RXTE)/2–12 KeVFlux at the peak: 0.25 CrabRise timescale (τr): 2.5 daysDecay timescale (τd): 34 daysDuration of the rising phase (Tr): 13 days
Duration of the decay phase (Td): 155 days
Optical light curve
Morphology type: Exponencial decay
No rise phase dataPeak magnitude R=15.1,V=15.3 magsQuiescent magitude R=22.48, V=23.29 magsOutburst amplitude (mquiet-mpeak) ∆R=8.4, ∆V=7.8 magsDecay timescale (τd): 103 daysDuration of the decay phase (Td): 220 days
A ’glitch’ of ∆R∼0.5 mag was detected in the expo-nential decay phase, at about Mar 25 (∼165 days afterthe peak), and in the X–ray light curve about 5 days ear-lier (∼160 days from the outburst). Similar glitches havealso been observed in the optical light curve of A0620-00(Tsunemi et al. 1977), with a magnitude increase of ∆B∼0.5mag about 150 days after the onset of the outburst, and alsoin J0422+32 with ∆V∼0.3 mag (Callanan et al. 1995). InX–rays, glitches are seen in the light curves of J0422+32,A0620-00, 1543-47, and 1124–683 (Chen et al. 1997).
Shortly after this rapid decline began, we have detected3 minioutbursts or small amplitude (relative to the primarypeak) events superposed on a ’normal’ decay profile, whenXTE J1859–226 was approaching quiescence (see Figure. 3).The first one (Jun 00) occurs ∼240 days after the peak, hasan amplitude of 1.3 mag in R (with respect to the base levelof Jun 2000) and lasts for ∼20 days. After the minioutburst,the decay follows roughly the same decline as before. Thesecond minioutburst (Jul 00) occurs ∼265 days after thepeak, reaches a maximum of R∼18 (∆R∼4.7mag) and lastsfor ∼25 days. And the third (Aug 00) reaches a peak only∼2 mags above the previous minimum.The source then de-cays linearly to R ∼23 about 30 days after the onset on thislast event. Minioutbursts have only been previously detectedin GRO J0422+32 (Chevalier & Ilovaisky 1995) and GRS1009–45 (Bailyn 1992) but this may be a consequence ofinadequate monitoring (or lack of sensitivity) once the out-burst is over. In J0422+32, two principal minioutbursts wereobserved (see Figure.2). Both had an amplitude of ∆V∼5mag and lasted for ∼20–40 days. Here the minioutburstsreached the same level as the extrapolated light curve be-fore the precipitous fall and are followed by events of smalleramplitude, as occur in J1859+226 Jul 00 minioutburst. De-spite these similarities, the shape of the long term light curvein J0422+32 is completely different. Here the rate of decayin the R–band is only 0.0056 mag/day, which is a remark-ably slow rate (Callanan et al. 1995). We note that boththe duration of the main outburst and the minioutbursts isapproximately the same.
0 40 80 120 160 200 240 280 320 36024
22
20
18
16
HJD-2451460
B:V:I:
0
0.5
1
1.50
0.5
1
1.50
0.5
1
1.5
Figure 4. Long term variations of the V − −I, V − −R andB−−V colour indices of J1859+226 are plotted here against theoverall light curve (bottom).
Figure 4 presents colour information of J1859+226 asa function of time. The mean V –R colour during outburstwas measured to be ∼0.27 and remains constant duringthe main outburst. The source does not show detectablecolour changes during any given night. It is clear that thesystem reddens as the system approaches quiescence andthe secondary’s contribution increases. During quiescenceV –R=0.81±0.11, which is consistent with the colour of aG9–K5 main sequence star.
From 24 Aug the system has reached quiescence witha mean magnitude of R=22.48±0.07 and V=23.29±0.09(measured on 17 Oct). This yields a total amplitude forthe optical outburst of ∆V=7.8 mag, comparable to thatobserved for other SXTs (Chen et al. 1997).
4 ANALYSIS OF PHOTOMETRIC
VARIABILITY
Photometric variability has been explored in our best sam-pled data set. This includes a group of 6 nights at the peak ofoutburst (18–20, 29 October 1999, 8 and 28 November 1999),2 nights during the maximum of the July minioutburst (5–6 July 2000) and 4 nights in quiescence (27–28 September2000 and 4–5 November 2000). Hereafter, we will refer todata taken during the main outburst, the Jul 00 miniout-burst and quiescence as Epochs A, B and C respectivelyand they are marked in Figure. 2.
c© 0000 RAS, MNRAS 000, 000–000

XTE J1859+226 7
15.6
15.418/10/1999
15.6
15.4
19/10/1999
15.6
15.4
20/10/1999
15.8
15.629/10/1999
16
15.808/11/1999
16.6
16.4
28/11/1999
Figure 5. Optical light curves for XTE J1859+226 on differentnights in Epoch A. Note the remarkable changes in the light curveshape during each night.
4.1 Epoch A: Irregular Variability
Representative light curves of XTE J1859+226, at the be-ginning of the outburst, are presented in Figure 5. We notethe remarkable changes in shape and amplitude with noevidence for repeatability. Intermittent modulations of thistype during decline from outburst on timescales at or nearthe orbital period have been seen in GS 2000+25 (Charles etal. 1991), Nova Muscae 1991 (Bailyn 1992) and Nova Persei1992 (Callanan et al. 1995; Chevalier and Ilovaisky 1994).
Fourier analysis of these October data, shows threemain peaks of comparable significance at 0.1600, 0.1907 and0.2353 days in the power spectrum. However, no clear modu-lation is obtained after folding the data on these periods. Wealso note that none of these periods have been observed byother authors. For example periods of 0.2806 days (Uemuraet al. 1999) and 0.3813 days (Garnavich et al. 1999) were re-ported during the first phase of the outburst. Nonetheless,the determination of orbital periods of X–ray novae duringoutburst has proved notoriously unreliable, e.g. modulationin the outburst light curve at a period much shorter thanthe orbital period has been seen in V404 Cyg (i.e. Wagner etal. 1990, Gotthelf et al. 1991). On the other hand it has beensuggested that J1859+226, has a binary period shorter than1 day, since the dereddened optical spectral energy distribu-tion of J1859+226 during outburst can be represented by asteep blue power law flattening in the ultraviolet, and thisresembles energy distributions of other short–period SXTs(Hynes et al. 1999) .
4.2 Epoch B: 22 min QPOs
High time resolution (30 to 60 s) B–band light curves wereobtained on 5 and 6 July when J1859+226 was at the max-imum of a minioutburst (see Figure. 6). The light curve onJul 5 shows an extended ’dip’ of about 0.3 mag lasting for3 hr. During this dip, the source exhibited remarkable QPO
flaring activity with ∼20 per cent amplitude. On July 6, theQPOs has disappeared and instead the source exhibited asmooth sinusoidal modulation with ∼0.10 mag amplitude.Studying the rapid variability seen on July 5, we find a pe-riod of 21.7±0.6 min using a periodogram analysis. ThisQPO timescale is very close to that reported by Hynes etal. 1999. The flaring ceased when the source returned to itspredip level.
A periodicity of 0.78 days has also been reportedfrom contemporary data (McClintock et al. 2000), whichis claimed to be the orbital period. Their light curve showsevidence for a deep primary minimum (interpreted as theeclipse of the disc by the companion star) and a shallowsecondary minimum. Assuming that the 0.3 mag dip in theJuly 05 light curve is the primary minimum, it occurs atHJD 2451731.51, which is exactly 1.3 days before McClin-tocks’s et al. primary minimum. Therefore the true orbitalperiod would be a submultiple of 1.3 days, which automati-cally rules out the 0.78 d period (Zurita et al. 2000).
4.3 Epoch C: Quiescent ellipsoidal modulation
Data taken in quiescence during 2000 September 27 and 28,on the 4.2m WHT, and 2000 November 4 and 5 on the 2.5mINT, exhibit a sinusoidal modulation, with a peak-to-peakamplitude of about 0.4 mag. We applied a Chi-squared min-imization method in order to characterize the periodicitypresent in the data. Periodogram is shown in Figure 7. Theperiodogram shows several peaks although formally the peakwith the highest significance is found at 0.1594±0.003 days.Assuming that this is actually a double–humped ellipsoidallight curve, as is typical of quiescent soft X–ray transients,the orbital period would then be 0.3188±0.003 days (∼7.7hours). We note that this period is roughly a submultiple of1.3 days. This suggests that the variability (and in particularthe 0.35 mag drop observed in the July minioutburst), mightbe related to the orbital period. However, periods from 0.14to 0.23 days (Porb ∼6.6 to 11.2 hrs ) are equally possibleat the 68 percent confidence level. Clearly more and higherquality data are needed to determine conclusively which pe-riod is the true orbital period.
We note that Filippenko & Chornock (2001) report a9.16±0.08 hr (0.382±0.03 days) modulation in the radialvelocities of only 10 spectra, spread over two nights, ob-tained during quiescence. This period is consistent withour data and previous reports by Garnavich et al. (2001)and Sanchez–Fernandez et al. (2000). Since all the datasetare affected by aliasing, it is clear that more spectro-scopic/photometric observations are required to determinethe true orbital period.
In Figure 8 we show the quiescent data folded on the0.319 days period (top panel) and on the 0.382±0.03 daysFilippenko’s spectroscopic period (bottom panel). By com-
c© 0000 RAS, MNRAS 000, 000–000

8 C. Zurita et al.
19.5
19.4
19.3
19.2
19.1
19
05/07/2000
0 1 2 3 4 5 6
19.5
19.4
19.3
19.2
19.1
19
hours
06/07/2000
Figure 6. B–band light during Epoch B (Jul00 minioutburs) of J1859+226 on 5 (top) and 6 Jul (bottom). The data points have beenobtained with the 2.5m NOT. Note the flares in the Jul 5 light curve.
paring the amplitude of the curve with other SXTs in quies-cence, we conclude that the the binary inclination must behigh. The different depths in the minima also support thisidea since this is only evident when the inclination angle ishigh.
An alternative way to estimate the orbital period isthrough the V amplitude of the outburst light curve (∆V ),by the use of the empirical relation
∆V = 14.36 − 7.6 logPorb(hr)
(Shahbaz & Kuulkers 1998). Taking V (peak)=15.5 andV (quiescence)=23.3, we obtain Porb ∼7.30 hr (0.30 days)which is consistent with the previous values.
5 ANALYSIS OF SPECTRAL VARIABILITY
Spectral variability has been explored in epoch A (Oct.20–28) and in the epoch B minioutburst (Jul.11). Days whenspectra were taken are marked by arrows in Figure. 2 andare plotted in Figure. 9.
5.1 Epoch A
The bluer spectrum displayed typical emission lines of X–ray transients in outburst: He ii 4686 A, the Bowen blend at4630–4640 Aand 3097– 4103 A, and Balmer emission fromHβ to Hδ. The Hβ emission line is embedded in a broad ab-sorption, as is often observed in the Balmer emission linesfrom SXTs (e.g. Casares et al. 1995). The main interstel-lar features were the Caii interstellar bands at 3933.66 and3968.47 A, (probably with some contribution from Hǫ ab-sorption at 3970 A), and the diffuse interstellar band at 4430A.
The only prominent feature in the redder spectrum isHα emission. The main interstellar features were the blendat 5778, 5780 and 5797 A, the blend due to the interstel-lar Na I D lines at 5889 and 5895 A, and the interstellarband at 6280 A. The HeII and Balmer lines appear to bedouble peaked with separations of 300–500 km s−1, notablysmaller than those detected in the outburst spectra of GROJ0432+22 (Callanan et al. 1995) or in the quiescent spectraof Nova Muscae 1991 or A0620-00 (Orosz et al. 1994). Dou-
c© 0000 RAS, MNRAS 000, 000–000

XTE J1859+226 9
0 5 10 15 20 25 300
1
2
3
4
5
6
Frecuency (day−1)
χ2
68 percent confidence limit
P/2= 0.16 days
P/2 = 0.19 days
Figure 7. χ2 minimization spectrum of the quiescent data. Thedeepest minima are marked, corresponding to Porb ∼0.32 andPorb ∼0.38 days.
−0.5 0 0.5 1 1.5
22
22.2
22.4
22.6
22.8
23
Orbital phase
R m
ag
nitu
de
−0.5 0 0.5 1 1.5
22
22.2
22.4
22.6
22.8
23
Orbital phase
R m
ag
nitu
de
P= 0.32 d
P= 0.38 d
Figure 8.Optical photometry of XTE J1859+226 during the qui-escent state (Epoch C) folded on the 0.319 d period (top panel)and on the 0.382 d period found by Filippenko & Chornock (bot-tom panel) and a superimposed sinusoidal fits. We have repre-sented points taken on different days/sites with different sym-bols: asterisks (27/09/2000 – WHT), circles (28/09/2000– WHT),squares (04/11/2000 – INT) and triangles (05/11/2000 – INT).
ble peaks were not detected in the Bowen blend lines in ourspectra, most probably due to the blending phenomena thanto the absence of such structure. However, the Bowen blendcould also arise from other emitting region in the system.
5.2 Epoch B
The second series of spectra of the source were obtained onJuly 11 2000, near the maximum of that minioutburst. Thebluer spectra displayed prominent Balmer emission from Hβto H9. Bowen emission was not detected in these observa-tions. On the other hand, Cii emission at 4267 Awas present.The main interstellar features were again the interstellar ab-sorption at 3968 A, which affects the Hǫ emission line, thediffuse Caii bands and the diffuse interstellar band at 4430A. The Balmer lines also appear to be double peaked in min-ioutburst, with typical separations of 500–700 km s−1, no-tably larger than the separations observed during main out-burst. The red spectra display Hα emission and Hei emissionlines at 5877 and 6680 A. The He i line at 5877 is affected bythe interstellar blend of the Na I D. The interstellar bandsat ∼ 5780 Aand 6280 Aare also detected.
The only observations of previous minioutburst spec-tra of SXTs are those from GRO J0422+32 (Casares etal. 1995; Callanan et al. 1995) and GRS 1009–45 (Bailyn& Orosz 1995). The spectra from GRO J0422+32 showedbroad shallow Hβ absorption, and Hα evolving from ab-sorption to emission on a timescale of 3 days. The spectrafrom GRS 1009–45 showed weak Hα and weak Hβ absorp-tion. In none of them evidence of He I is found. Casares etal. 1995 also obtained phase resolved Hα and Hβ spectra ofJ0422+32 during its 1993 minioutburst. Balmer lines wereembedded in broad absorptions whereas Heii was purely inemission and showed evidence of a large amplitude (∼755km s−1) S–wave component.
5.2.1 Variability of the emission lines
To examine the variability of the emission lines during theminioutburst, the equivalent widths were measured in theindividual spectra as a function of 0.319 d period (see Fig-ure. 10). The equivalent widths of the lines were measuredafter normalization of each individual spectrum by its con-tinuum so that the variations in the lines are separated fromvariations in the continuum. Unfortunately, this study wasnot possible with the main outburst data, due to the poorS/N ratio of the individual spectra. Sinusoidal fits have beenincluded in the plots as a reference. We can see that the Hαequivalent width is dependent on orbital phase. The samerelation is less clear in Hβ, probably due to the smaller am-plitude of the variations, but it is still present. The variationin the equivalent widths for both of them can be roughlyreproduced with a sinusoidal function equal to the orbitalperiod of the system, thus pointing to the changing visibilityof a region of enhanced emission or bright spot, perhaps thesplash point where the gas stream and accretion disc meet.Unfortunately, the uncertainty in our T0 prevents to definethe absolute phasing in the EW curves. No clear modula-tion is seen in the EWs of Hǫ and Heii which have means of5.95±0.95 Aand 5.41±1.40 Arespectively.
c© 0000 RAS, MNRAS 000, 000–000

10 C. Zurita et al.
3600.0 3850.0 4100.0 4350.0 4600.0 4850.0Wavelength (Angstroms)
0.7
0.9
1.1
1.3
No
rma
lize
d f
lux
c)
Η9
Η8
Ηε
Ηδ
Ηγ
CII
HeI
I
ΗεΙΗβ
IS
IS
5700.0 5950.0 6200.0 6450.0 6700.0 6950.0Wavelength (Angstroms)
0.7
0.9
1.1
1.3
No
rma
lize
d f
lux
b)
Ha
IS
IS
IS
5700.0 6200.0 6700.0Wavelength (Angstroms)
0.7
0.9
1.1
1.3
No
rma
lize
d f
lux
d)
HeI HeIH
a
IS
IS
IS
3500.0 3750.0 4000.0 4250.0 4500.0 4750.0 5000.0Wavelength (Angstroms)
0.7
0.9
1.1
1.3
No
rma
lize
d f
lux
a)
Ηδ
/ΝΙΙ
Ι
NII
I+C
III
Ηγ
HeI
I
Ηβ
IS
IS
IS
b)
c)
a)
d)
Figure 9. Spectroscopic observations of XTE J1859+226 during Epoch A (main outburst)– figures a and b– and during Epoch B (July00 minioutburst)–figures c and d.
6 DISCUSSION
6.1 Distance estimate
In the context of King & Ritter’s model ( 1998), the expo-nential decay of the X–ray light curve indicates that irra-diation is strong enough to ionize the entire accretion disc.Also, a secondary maximum is expected one irradiated-stateviscous time after the onset of the outburst and this can beused to calibrate the peak X-ray luminosity and hence thedistance to the source dkpc through
dkpc = 4.3× 10⁻⁵t3/2s η1/2f1/2F−1/2p τ
−1/2d
where Fp is the peak X-ray flux, ts the time of the secondarymaximum after the peak of the outburst in days, τd the e-folding time of the decay in days, η the radiation efficiencyparameter and f the ratio of the disc mass at the start ofthe outburst to the maximum possible mass (Shahbaz et al.1998). In our case, τd=34 d, ts ≃68 d and Fp can be esti-
mated from the XTE count rate (250 mCrab in the energyrange 2-10 keV) which corresponds to 1.7 × 10⁻⁸ erg cm−2
s−1. Assuming η=0.15 and f=0.8 we find dkpc = 11.
Alternatively, we can estimate the distance to the sourceby comparing the quiescent magnitude with the absolutemagnitude of a main sequence star which fits within theRoche lobe of a 7.65 hr orbit. Combining Paczynski’s (1971)expression for the averaged radius of a Roche lobe with Ke-pler’s Third Law we obtain the well-known relationship be-tween the secondary’s mean density and the orbital period:ρ = 110/P 2
hr (g cm−3). Substituting for the orbital periodof J1859+226 we obtain ρ=1.87 g cm−3 which correspondsto a K0V-K1V secondary star with absolute magnitudeMR ≃6.1. The dereddened quiescent magnitude is V=23.27(using AV =1.80±0.07 as derived from the NaID line; seeHynes et al. 1999) which yields dkpc = 11. This value per-fectly agrees with that obtained previously, although strictly
c© 0000 RAS, MNRAS 000, 000–000

XTE J1859+226 11
0 0.1 0.2 0.3 0.4 0.5 0.6 0.7 0.8 0.9 1
4
6
8
10
12
14
16
Eq
uiv
ale
nt
wid
th
Hα
0 0.1 0.2 0.3 0.4 0.5 0.6 0.7 0.8 0.9 10
1
2
3
4
5
Orbital phase
Eq
uiv
ale
nt
wid
th
Hβ
Figure 10. Equivalent width variations for Hα and Hβ, duringEpoch B (Jul00 minioutburst).
speaking, this is a lower limit to the distance as we are ne-glecting any contribution by the accretion disc to the qui-escent optical flux. Although the measured (V–R) color isconsistent with the calculated density, a spectral type de-termination of the companion star is essential to refine thisdistance estimate.
6.2 Relative contribution of the disc
Following the color evolution of the system, we can computethe relative contribution of the disc to the optical flux in theV and R bands as a function of the assumed spectral typeof the companion star. Assuming that the colour of the sec-ondary star corresponds to a normal dwarf of a fixed spectraltype and that the colour of the disc remains constant duringthe main outburst (as we can see in Figure 4), then we canrelate the fluxes of the disc and star in the R and V bands:fVdisc
=h×fRdisc, fVstar
=k×fRstar, where h∝10(V−R)disc and
k∝10(V−R)star . It is straightforward to calculate the relativecontribution of the disc (fVdisc
/fV and fRdisc/fR) through:
fV = h× fR + (k − h) × fRstar
where fV and fR are the measured fluxes in the V andR bands. The unreddened colours (V-R) corresponding tospectral types G5V to M0V are taken from Schmidt–Kaler(1982). We also assume E(B-V)=0.58 from Hynes et al. 1999.The results are shown in Table 5.
During the first phase of the outburst, the optical emis-sion is almost completely dominated by the accretion disc.The relative contribution of the disc reaches a minimumwhen the system drops to the faint level between the June00 and July 00 minioutbursts.
Table 5. Relative contribution of the disc in the R and V band(bold), assuming different spectral types for the companion star.
HJD(∗) G5V K0V K5V M0V10 0.99 0.99 0.99 0.99
1.00 1.00 1.00 1.00
21 0.99 0.99 0.99 0.991.00 1.00 1.00 1.00
65 0.99 0.99 0.99 0.991.00 1.00 1.00 1.00
120 0.96 0.97 0.98 0.980.99 1.00 1.00 1.00
130 0.97 0.97 0.98 0.980.98 0.98 0.99 0.99
160 0.93 0.94 0.95 0.960.95 0.95 0.97 0.98
167 0.91 0.92 0.94 0.940.95 0.96 0.98 0.98
200 0.92 0.92 0.94 0.950.93 0.94 0.96 0.97
249 0.37 0.44 0.55 0.610.38 0.45 0.56 0.62
267 0.64 0.68 0.73 0.760.63 0.66 0.75 0.78
272 0.93 0.93 0.94 0.950.93 0.94 0.95 0.96
281 0.85 0.86 0.89 0.910.84 0.85 0.88 0.90
∗HJD–2451460
6.3 Properties of the disc
Using the same technique, we have fitted the unreddenedB, V and R band fluxes to estimate the intrinsic coloursof the disc. As we might expect, the fluxes during outburstare strongly correlated. We obtain (B-V)disc ∼–0.07 and(V-R)disc ∼–0.10. These colours agree well with irradiatedmodel predictions, where most of the reprocessed energyis radiated in the UV (see e.g. van Paradijs & McClintock1995).
The ratio of outburst X-ray to optical luminosity [ξ =B0 + 2.5 logFx(µJy)] agrees with the observed distribu-tion for LMXBs. Taking B=15.9 (Chaty et al. 2000) andFx(2 − 12keV ) ≃ 250 mCrab (Wood et al. 1999) at theoutburst peak and assuming AB=2.39 (Hynes et al. 1999)we obtain ξ=20.9 ±0.4, whereas the distribution peak ofLMXBs gives ξ=21.8 ±1 (see van Paradijs & McClintock1995). The moderately low ξ probably indicates a high bi-nary inclination since the X-ray source in J1859+226 couldbe partially hidden by the accretion disc. This result is con-sistent with the evidence for two X–ray dips during the sec-ond outburst (∼July 8) reported by Tomsick et al. 2000,and with the large amplitude (0.4 mag) of the quiescent el-lipsoidal modulation.
6.4 The outburst mechanism
It is largely accepted that optical emission in SXTs outburstis due to irradiation of the outer disc by X–rays. Within thiscontext, the optical emission must be correlated with theX–rays. However, we see features which have no correspon-dence between the X–rays and optical, such as a secondary
c© 0000 RAS, MNRAS 000, 000–000

12 C. Zurita et al.
maximum ∼12 days after the peak of the X–rays outburstwhich is not visible in the optical band, and minioutburstswhich are absent in the X–ray lightcurve. Such differencescan not be explained in the context of a simple irradiateddisc and an additional mechanism is necessary to explainthem. Systems with clear discrepancies between X–rays andoptical are J1655-40 (Esin et al. 2000) and J1550-564 (Jainet al. 2000). Both sources exhibit an exponentially declin-ing optical light curve, whereas the X–ray remains constantor increases slightly. To explain the outburst light curvesin these systems it has been suggested the classical dwarf–nova type instability followed by an episode of enhancedmass transfer from the secondary or up scatter of the op-tical flux into the X–ray by the corona. Our photometriccolors indicate that the optical emission is dominated by X–ray reprocessing on the disc although in J1859+226 clearlyinterplay with viscous heating and geometrical effects (suchas disc height variations and shadowing effects) are playingan important role in the differences between the X–ray andoptical lightcurves.
The only SXTs where minioutbursts have been detectedare XTE J0422+32 and GRS 1009–45, although this prop-erty does not seem to be a peculiarity of these systems, but aselection effect, due to the difficulty in obtaining continuousmonitoring from outburst to quiescence. The most promis-ing mechanism to produce minioutbursts is the X–ray echo
model (Augusteijn et al. 1993, Hameury et al. 2000) , wherethey are interpreted as due to enhanced mass flow from thecompanion star on the outer disc which is responding, es-sentially linearly, to heating by X–rays from the primary.The process goes on continuously, triggered by echoing theinitial X–ray outburst.
The spectra taken during the main outburst show anemission feature at λλ4540–4550Awhich is the Bowen Blend,but it is not present in the Jul 00 minioutburst. This behav-ior has also been observed in J0422+32 (Casares et al. 1995,Callanan et al. 1995). The Bowen blend is a combination ofhigh excitation lines (mainly Ciii, Oii and Niii at λλ4634–4642), produced by the fluoresencence resonance mechanismwhich initially requires seed photons of Heii Lyα at λ303.78.Under the hypothesis that the composition of the accretingmaterial has not changed substantially since the onset ofoutburst, the absence of Bowen emission in the miniout-burst spectra must be ultimately related to the weaknessof the X-ray photoionizing continuum which originates thewhole cascade process. We do not have enough informationin our data to make detailed calculations of this process.However, it seems that the reprocessed X–rays make a smallcontribution to the optical flux during minioutburst: in anirradiated disc, the average ratio of X–ray to optical lumi-nosity yields LX(2–11 keV)/Lopt(300–700 nm)≃500. We canestimate this rate during the highest minioutbursts (Jul 00).Tomsick et al. 2000 report a 3.11× 10⁻¹¹erg cm−2 s−1 fluxnear the maximum of the minioutburst in the range 2.5–20keV, which was well above the expected quiescent X–ray fluxlevel. Assuming the energy spectrum is described by a powerlaw with a photon index 2.03 as they reported, we can esti-mate the flux in the range 2–11 keV. Taking a B magnitudeof B∼19.2, the estimated X–ray to optical ratio is LX(2–11 keV)/Lopt(300–700 nm)∼4. This means that the X–ray
spectrum during minioutburst must be much harder thanduring primary outburst or, alternatively, that the opticalflux during minioutburst is instead dominated by the in-trinsic luminosity of the disc. During the primary outburst,the intensity and width of the Balmer lines is notoriouslysmaller than in the minioutburst spectra as expected be-cause the continuum is 2 mag brighter. The change in linesize is probably reflecting a shrinking in disc size. Alterna-tively the emission line cores might be filled in with narrowemissions during the main outburst.
Another possibility could be that minioutbursts are pro-duced by a temporal enhancement of viscosity in the quies-cent disc just after the main outburst (Osaki et al. 1997).However, there is no easy explanation as to why the viscositycan vary in such a way.
7 ACKNOWLEDGMENTS
We thank G. Dalton for contributions to the observing cam-paign and E. Kuulker for providing the optical light curve ofJ0422+32. Part of this work is based on observations madewith the European Space Agency OGS telescope operatedon the island of Tenerife by the Instituto de Astrofısica deCanarias in the Spanish Observatorio del Teide of the In-stituto de Astrofısica de Canarias. TS was supported by anEC Marie Curie Fellowship HP–MF–CT–199900297.
REFERENCES
Augusteijn T., Kuulkers E., Shaham J., 1993, A&A, 279, L13
Bailyn C.D., 1992, ApJ, 391, 298Bailyn, C.D., Orosz J.A., 1995, ApJ, 440, L73Callanan P.J., Garcia M.R., McClintock J.E., Zhao P., Remillard
R.A., Bailyn C.D., Orosz J.A., Harmon B.A., Paciesas W.S.,1995, ApJ, 441, 786
Casares J., Martin A.C., Charles P.A., Martin E.L., Rebolo R.Harlaftis E.T., Castro–Tirado A.J., 1995, MNRAS, 276, L35
Charles P.A., Kidger M.R., Pavlenko, E.P., Prokof’eva, V.V.,Callanan P.J., 1991, MNRAS, 249, 567
Charles, P. A., Hynes, R. I., Casares, J., Israelian, G., Rodriguez-Gil P., Shahbaz, T., Zurita, C., Abbott, T., Hakala, P., King,A.R., 2000, AAS High Energy Astrophysics Division
Chaty S., Haswell C.A., Norton A.J., Hynes R.I.,Smail I., SolheimJ., Ostensen R., Greve T.R., Fynbo J., Horne K., O’Brien K.,SkidmoreW., Fried R., Krisciunas K., Garnavich P.M., GarciaM., Contreras M., Harlaftis E.T., Charles P.A., Shahbaz T.,Kuulkers E., Chen W., Shrader C.R., Howell S.B., WagnerM., 1999, IAUC, 7284
Chen W., Shrader C.R.,Livio M., 1997, ApJ, 491, 312Chevalier C., Ilovaisky S.A., 1995, A&A, 297, 103Esin A.A., Lasota J.P., Hynes R.I., 2000, A&A, 354, 987Filippenko A.V., Chornock R., 2001, IAUC, 7644
Garnavich P.M., Stanek K.Z., Berlind P., 1999, IAUC, 7276Garnavich P., Quinn J., 2000, IAUC, 7388Gotthelf, E., Patterson, J., Stover, R.J., 1991, ApJ, 374, 340Hameury J., Lasota J., Warner B., 2000, A&A, 353, 244
Horne K., 1986, PASP, 98, 609Hynes R.I., Haswell C.A., Norton, A.J., Chaty S., Solheim J.E.,
Ostensen R., Abbott T.M. C., Fried R., McFarland J., RolfeD.J., Lott D.A., Ioannou Z,., Shafter A., O’Brien K., HorneK., Krisciunas K., Ivison R.J., 1999, IAUC, 7294
c© 0000 RAS, MNRAS 000, 000–000

XTE J1859+226 13
Jain R.K., Bailyn C.D., Orosz J.A., McClintock J.E., Sobczak
G.J., Remillard R.A., 2000, ApJ, 546, 1086King A.R., Ritter H., 1998, MNRAS, 293, L42Landolt A.U., 1999, ApJ, 104, 340McClintock J.E., Remillard R.A., Heindl W.A., Tomsick J.A.,
2000, IAUC, 7466Orosz, J.A., Bailyn, C.D., Remillard, R.A., McClintock, J.E.,
Foltz, C.B., 1994, ApJ, 436, 848Osaki Y., Shimizu S., Tsugawa M., 1997, PASP, 49, L19Paczynski B., 1971, Annual Review of Astronomy and Astro-
physics, 9, 183Sanchez-Fernandez C., Zurita C., Casares J., Shahbaz T., Castro-
Tirado A., 2000, IAUC, 7506Schmidt–Kaler, T.H., 1982, Landlolt–Bernstein New Series, Vol-
ume 2b, Astronomy and Astrophusics–Stars and Star Clus-ters, eds. K. Schaifers, H.H. Voigt, Springer–Verlag, New York
Shahbaz T., Kuulkers E., 1998, MNRAS, 295, L1Shahbaz T., Charles P.A., King A.R., 1998, MNRAS, 301, 382Stellingwerf, R.F., 1978, ApJ, 224, 953Stetson P.B., 1987, PASP, 99, 191Tomsick J.A., Heindl W.A., 2000, IAUC, 7456Tsunemi H., Matsuoka M., Takagishi K., 1977, ApJ, 211, L15Uemura M., Kato T., Pavlenko E., Shugarov S., Mitskevich M.,
1999, IAUC, 7303van Paradijs J., McClintock J.E., 1995, X-Ray Binaries, Cam-
bridge University Press, CambridgeWagner R.M. et al., 1990, in IAU Colloq. 122: Physics of Classical
Nova , p. 429Wagner R.M., Smith P.S., Schmidt G.D. Shrader C.R., 1999,
IAUC, 7279Wood A., Smith D.A., Marshall F.E., Swank J., 1999, IAUC, 7274Zurita C., Casares J., Rodrıguez–Gil P., Shahbaz T., Charles P.A.,
Sanchez–Fernandez C., Castro–Tirado A., Abbot T., HakalaP., 2000, Proceeding of the Granada Microcuasar Symposium,Kluwer Academic Publishers
c© 0000 RAS, MNRAS 000, 000–000