Embed Size (px)
Citation preview
University of Strathclyde in Glasgow
Department of Mechanical Engineering
Thesis Title:
Generating Electricity from a 10 MW MSW combustion plant in the area
of Athens, Greece: A Feasibility Study
By
Konstantinos Papagiannakis
MSc in Energy Systems and the Environment
Glasgow
2003

2
Declaration of author’s rights
‘The copyright of this dissertation belongs to the author under the terms of the
United Kingdom Copyrights Acts as qualified by the University of Strathclyde Regulation
3.49. Due acknowledgement must always be made of the use of any material contained in,
or derived from, this dissertation’.

3
Acknowledgements
I would like to thank my Supervisor Ms. Lorrie Mc Elroy for her continuous support
and advice provided regarding the completion of this Thesis project. Additional thanks to
Associate Professor E. Kakaras and Dr. D. Giannakopoulos of the School of Mechanical
Engineering, Thermal Engineering Division of the National Technical University of Athens.
I would also like to thank my friends and colleagues Maria Somaraki and Ioannis
Papagiannakis for their encouragement, impeccable sense of humour, knowledge and help.
Furthermore, I would like to thank my friend Stella Pachakis, for her
encouragement, care and faith for which I am eternally grateful.
As last, but not least, I would like to thank my friends and family for their tireless
support during the course of my academic career.
This work is dedicated to my father, Panagiotis Papagiannakis.

4
Abstract
The aim of this Thesis is to perform a feasibility assessment on the development of a
10 MW MSW combustion plant for the area of Athens, Greece. The 10 MW MSW
combustion plant is planned to be built in the Industrial Zone of Athens (OINOFYTA area),
which is situated in a distance of 60 km from the city’s centre. This particular site will
utilise local MSW producing electricity for the city. Apart from power production benefit,
its operation would provide an effective means of dealing successfully with the industrial
and municipal waste-handling problem, which has escalated to enormous proportions in the
last five years in Athens threatening the prosperity of the area. The feasibility study covers
the areas of Plant Set-up Analysis, Thermodynamic Cycle Assessment, Economic
Assessment and Environmental Impact Assessment. The student is undertaking the role of
the engineer called to assess the potential venture.

5
Contents
Declaration of author’s rights 2
Acknowledgements 3
Abstract 4
Chapter 1: Introduction
Biomass 8
Biofuels 8
Energy from waste 9
What is MSW? 9
Waste to Energy plants 9
Biomass in Greece 10
Reasons for performing the feasibility study 12
Why a Mass-Burning plant and not an RDF plant 12
Chapter 2: Plant Set-up Analysis
Introduction 14
Preparation, Fuel Handling and Disposing Systems 14
Rotary Water walled Furnace 16
Boiler and Feed Heating Systems 17
Steam Turbine Generator 22
Stack Gas Clean Up and Pollution Controls 24
Plant Engineering 25
6
Chapter 3: Production Assessment
Introduction 28
Load Factor 28
Heat Rate 28
Methodology 29
Process 30
Chapter 4: Thermodynamic Plant Efficiency Assessment
Introduction 37
Operating Conditions 37
Thermodynamic Efficiency of cycle 38
Overall Plant Efficiency 38
Methodology 38
Process 41
Chapter 5: Economics
Introduction 51
Net Present Value (NPV) 51
Internal Rate of Return (IRR) 51
Public Power Corporation (PPC) 52
The Energy Law in Greece 53
Methodology 56
Process 58
7
Chapter 6: Environmental Impact
Introduction 65
Environmental Profile 65
Post-combustion derivatives of the 10 MW MSW combustion
plant 66
Boiler and steam turbine emissions 68
Boiler Emissions Control Options – NOx 70
Post-Combustion Control 72
Boiler Emissions Control Options - SOx 73
The advantages of dry absorption on the path to the exhaust
stack 73
Chapter 7: Discussion 75
Chapter 8: Conclusion 79
Appendix A 81
References 83
8
CHAPTER 1- Introduction
Biomass
Biomass accounts for all the living matter, which exists in the thin layer of
Earth called the Biosphere. Based on the cyclic process, which involves energy
supplied from the sun, through storage in plants and eventual natural recycling via a
series of chemical and physical processes in plants, the atmosphere, the living matter
and eventually radiation from the Earth as low-temperature heat, biomass is thus
potentially an enormous store of energy, which is restored continuously.
Biomass comprises a potential source of energy utilisation for humans.
Today, efforts are focused in capturing biomass at the stage of stored chemical
energy, which in turn is providing a fuel. Biomass is considered by many as a ‘green’
process for fuel production; providing the restraint that the human consumption
doesn’t exceed the natural level of recycling, in bio-fuels there is no additional
generation of heat as well as carbon dioxide, which could have both been emitted
during any conventional fuel production process. If consumed ay this rate, no
detrimental environmental effects will occur and thus a new sustainable system of
energy production is available for further utilisation and exploitation.
Biofuels
According to the UK Energy Technology Support Unit, ‘bio-fuels are any
solid, liquid or gaseous fuels produced from organic materials, either directly from
plants or indirectly from industrial, commercial, domestic or agricultural wastes.
They can be derived from a wide range of raw materials and produced in a variety of
ways. These include the energy derived from waste residues’ utilisation, either of
organic origin (e.g. plants, animal by-products) or of urban and industrial wastes and
the majority of the content of each household’s dustbin’ (ETSU, 1991).
9
Energy from waste
The generation of energy from waste burning is a concept that has received a
huge wave of interest and in the main, broad acceptance from various countries
including both members of the European Union and the rest of the world in the last
fifteen years. Its practical deployment, which features the development of MSW
combustion units, is in various stages of progress for the majority of these countries.
At the current time, Austria leads in the generation of energy from waste field in
Europe, currently having several units in operation, which utilise the local waste
efficiently. Other countries such as Germany, Denmark and the United Kingdom
follow at a steady and methodical pace.
What is MSW?
According to the US Environmental Protection Agency the term MSW
accounts for Municipal Solid Wastes, which describes ‘the stream of garbage
generated by households, commercial establishments, industries and institutions.
MSW consists of everyday items from product packaging, grass clippings, furniture,
clothing, bottles, food scraps, newspapers, appliances, plastics to paint and batteries.
It does not include medical, commercial and industrial hazardous or radioactive
wastes, which must be treated separately’ (US Environmental Protection Agency).
Waste to Energy plants
There are two discrete configurations of waste to energy plants, which are
designated separately according to their characteristics and codes of operation: the
refuse-derived fuel plant and the mass-burning plant. Their operation is differentiated
by one characteristic element, which takes place before MSW is combusted: in an
RDF plant separation of non-combustible particles is undertaken by MSW shredding.
By comparison, in a Mass-Burning plant the MSW is not separated, but is combusted
directly in much the same way as fossil fuels are used in other combustion
technologies. Apart from this fundamental difference, both plants combust MSW by
10
following an identical set-up, converting water into steam to drive a turbine
connected to an electricity generator/gearbox formation.
The refuse-derived fuel plant employs mechanical processes to shred
incoming MSW separating the non-combustibles in order to produce a high-energy
fuel fraction and thus improved efficiency. One of the most appealing aspects of
RDF is that it can be employed as a supplementary fuel in conventional boilers.
Furthermore, RDF’s energy content is around half that of UK’s industrial coals and
nearly two thirds that of low grade US coal.
By contrast, the Mass Burning Plant is designed to burn unprocessed MSW
directly in boilers. The combustion takes place in furnaces under specified conditions
of excess air. Removal of bulky objects in some cases is suggested as a minimal
stage of pre-processing for mass-burn units. Nevertheless, the efficiency of the fuel
flow is satisfactory whether or not this practice is followed.
Biomass in Greece
Although Greece is well regarded as one of the few countries that has
developed and supported implementation of a range of renewable technologies for
energy generation, based on solar trends (photovoltaics) and wind turbines,
unfortunately it remains reluctant to embrace the prospects offered by the utilisation
of Biomass. The reasons for this view can be largely attributed to a lack of financial
incentives as well as technological drawbacks both of which have rendered Greece
inactive in this area of renewable technologies: Priority has been given to the
utilisation of wind turbines technology and solar systems due to the huge wind and
sunlight potential of the country and this potential has translated into financial
benefits for individual investors and the Government alike. From a technological
point of view, until recently, the primary focus of the local industry was targeted on
the technological development of the wind turbines and solar systems technologies
because it was felt that there was a market niche to be exploited, leaving no space for
the research and development of other options such as Biomass.
However, over the last five years there has been a dramatic shift of policy and
interest: although the wind turbines and the solar systems technologies are still
11
profitable, Biomass and especially Energy from Waste has risen on the agenda and
has gone through intense debate in respect of whether or not it can make a useful
energy contribution and be financially viable to be introduced in Greece. The reason
for such a change in the country’s official position has been the exponentially
escalating problem of wastes dumping, which is taking place in designated and non-
designated disposal sites around Athens and other major cities in Greece and
threatens to destroy an already pollution damaged ecological system as well as result
detrimental effects in public health.
Although strong legislation put into force in the recent years has successfully
dealt with the various emissions problems from local industry, the Government has
remained intransigent in terms of predicting the inception of the waste problem in the
past. Greece is already facing a court case and a legal suit from the European Union
due to its incapability to deal effectively and permanently with the issue of waste
disposal. At this point it should be highlighted that each individual Greek citizen
creates only one third of the quantity of waste generated by any other citizen in the
European Union. That percentage translates to 0.74 kg daily, which isn’t high by any
means. The problem focuses more on where this waste is stored due to the shortage
of suitable sites.
Nevertheless, these dumped quantities of waste can provide an excellent
source of MSW for energy production. The development of Energy to Waste plants
in the major cities could provide an effective and permanent solution to the waste
problem Greece is facing at the current time. Energy to Waste plants could combust
large quantities of MSW and generate power solving the waste problem, complying
with the energy legislation and satisfying the local power need simultaneously.
However, as yet, no positive moves by the local Government have been taken place
in this direction.
The current study will undertake a feasibility assessment for a 10 MW
Municipal Solid Waste plant for the area of Athens, Greece. The plant is anticipated
to be built in the Industrial Zone of Athens (OINOFYTA area), which is situated in a
distance of 60 km from the city’s centre. This particular site possesses a number of
interesting features - the most distinctive one being the proximity to the designated
12
MSW dumping sites of East Athens (17 out of a sum of 27 areas that exist in
Athens).
Reasons for performing the feasibility study
The study is undertaken from the viewpoint of a real feasibility study in order
to attempt to emulate the constraints that would be imposed by a commercial
investor. This consultancy allocation accounts as an issue of particular engineering
interest because it exposes the student to a rapidly developing technology, which he
is called to investigate in depth before deciding about its degree of suitability for
further development in his native country. Moreover, it acts as a vehicle to study and
comment on an existing problem in Athens, which has social, environmental and
health implications.
Throughout the assessment of the study, a strong effort is made to retain the
level of objectivity in terms of presenting the case objectively and commenting on
the suitability of the potential venture for further development according to the
sources and data available during the time the investigation took place. It was also
intended from the outset to assess the project independently and without bias in order
to maintain integrity and objectivity in the recommendations presented at the end of
the study.
Why a Mass-Burning plant and not an RDF plant?
From the outset, one of the fundamental aspects to be assessed was which
Waste to Energy plant configuration would be the most suitable to apply in the
current situation.
The advantages of the mass-burn plant type are numerous: negligible front-
end processing of the MSW is demanded before the combustion takes place
eliminating a significant source of expense. Furthermore, mass-burn facilities are
considered easy to maintain and operate. On the other hand, because of the
heterogeneous nature of the pre-combusted MSW, high quantities of excess air are
13
needed for proper combustion, employing a larger boiler and flue gas cleaning
system when compared with a facility using RDF technology for the equivalent
quantity of MSW.
The advantages of the refuse-derived fuel plant type are focused mainly on
the relatively higher energy content of the RDF fuel, which originates from the pre-
combustion separation processing. In monetary terms however, the financial
evaluation of already operational refuse-derived fuel plants indicates a different
issue: The RDF set-up demands an increased up-front capital investment (Steam
Plant Operation, sixth edition, 1992).
After careful and detailed examination of all aspects presented above as well
as taking into account the financial intensiveness of the project for the external
investor, the decision was made to explore the option of the Mass Burning type of
Waste to Energy plant for the area of Athens, Greece.

14
CHAPTER 2- Plant Set-up Analysis
Introduction:
This chapter provides a detailed breakdown of the 10 MW MSW combustion
plant apparatus including technical information for the most important parts of the
site. The aim of this chapter is to gain familiarity with the plant’s main constituent
units, which is required in order to understand in depth its operation for the work that
follows later on. As a necessary step towards the achievement of this goal, the unit is
grouped in five sections (Systems) according to each System’s designated function.
A sixth section designated as Plant Engineering highlights the interconnecting
mediums (pumps, connectors) that link the systems together into a unit. All systems
are presented in Tables below and additional details are provided individually for
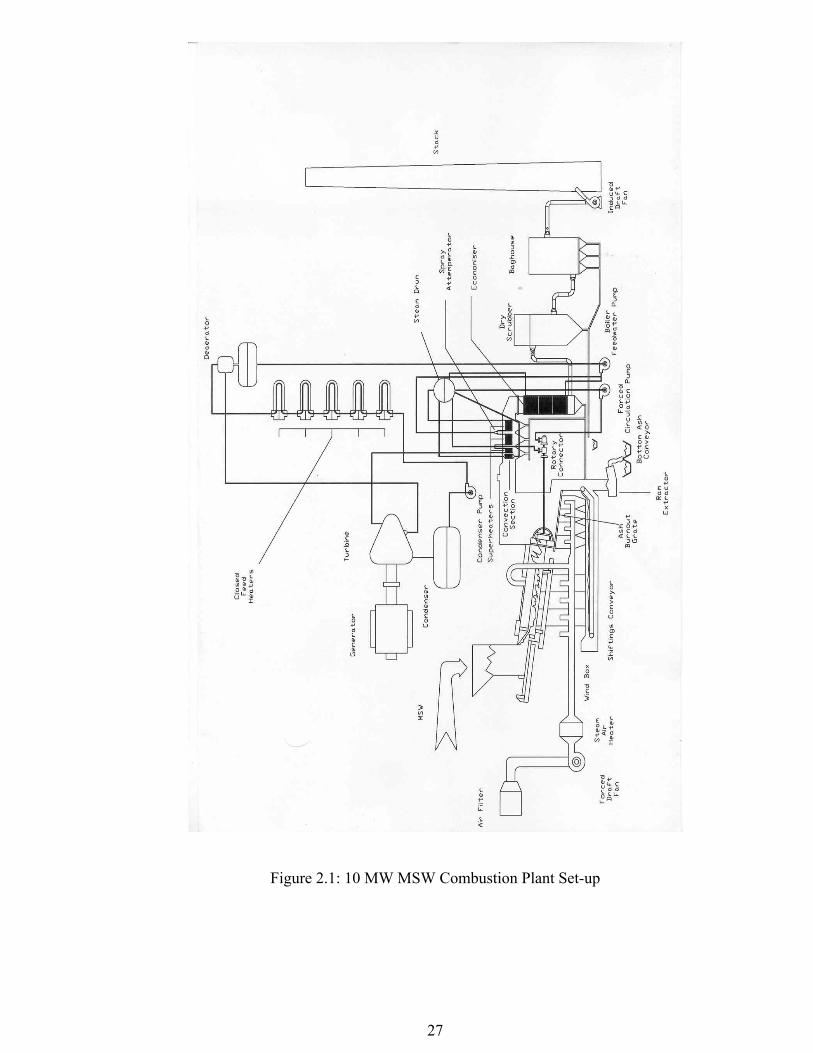
each one. Furthermore, an illustration of the plant set-up is provided in Figure 2.1 at
the end of the chapter.
Systems Breakdown
Table 2.1: Preparation, Fuel Handling and Ash Disposing Systems
Air Injection System in
the combustion
Chamber
Feeding System Ash Disposing System
Air Filter MSW Collection Pit Ash Burnout Grate
Forced Draft Fan Feed Chute Shiftings Conveyor
Steam Air Heater Ram Feeder Ram Extractor
Wind Box Bottom Ash Conveyors
MSW Collection Pit
Before mass burning takes place at the Rotary Water Walled Furnace, MSW
is unloaded into the collection pit or bunker from dustcarts. The MSW collection pit
is developed according to strict EU standards of safety and hygiene, which demand
15
the elimination of odour and dust particles generated from the MSW unloading in the
adjacent areas to the pit.
The pit’s size will vary according to the daily consumption of MSW required
to cover the plant’s power generating specifications. Most notably, the quantity of
MSW stored must be twice the quantity of MSW consumed daily to cover the plant’s
power generating specifications. This analogy is by no means accidental, in fact it is
considered as one of the most important actions that must take place, so that
unfortunate situations such as the risk of a fire in the premises are minimised: when
MSW remains stored in collection pits for a period of more than three days,
temperatures ranging from 90 °C to 100 °C can build up within the mass of waste
and in combination with gases such as methane that develops from rotting waste can
cause a fire to start that can lead to considerable damage to various areas of the plant.
The collection pit must be well lit to allow observation and fire extinguishers must be
available in adjacent areas to it and its minimum width must be 8 m.
Air Filter, Forced Draft Fan, Steam Air Heater, Wind Box
In order to achieve the most efficient combustion of the MSW in the Rotary
Water walled Furnace, excess air is injected in a percentage of no more than 45%
(Steam Plant Operation, Sixth Edition, McGraw-Hill Inc., 1992). Incoming air from
the external environment passes through an air filter. Next, it is heated by a steam air
heater and introduced by a forced draft fan to the wind box configuration. The wind
box is an array of insulated tubes supplying hot combustion air to the Rotary Water
walled Furnace in the pre-combustion phase.
Feed Chute, Ram Feeder
MSW enters the feed chute by a conveyor of crane. The feed chute directs the
MSW to a ram feeder, which carries it to the Rotary Water Walled Furnace for
combustion. There are several types of Ram Feeders; the most widely used being the
Worm type, the Propulsive type and the Cylindrical type. For the current case of the
MSW combustion plant, the Propulsive type is employed.
The Propulsive ram feeder passes through the Rotary Water Walled Furnace
and features four zones of treatment for the MSW; during the first two stages the
16
MSW is dried and an initial burning is manifested. The third and fourth stages are
where the primary burning occurs. The hot combustion air is provided via the wind
box and is directed from the bottom of the feeder upwards under pressure. The ram
feeder is constructed by chromium cast-iron and the inclination given to the structure
is considered a factor of pivotal importance for its effective operation.
Ash Burnout Grate, Shiftings Conveyor, Ram Extractor, Bottom Ash
Conveyors
The combustion’s by-products, which include inert ash at their majority as
well as a small quantity of metal particles, are lead to the ash disposing areas via the
shiftings conveyor. Just before their final disposal, the collection of the metal
particles is taking place employing magnets at the Ram Extractor. The inert ash left
is stored at bottom ash conveyors.
Table 2.2: Rotary water walled furnace
Rotary Water walled Furnace
Rotary Water Walled Furnace
One of the most recent improvements in boiler design and the configuration
chosen for this MSW plant due to its highly efficient energy recovery, is the water
walled furnace, which offers several advantages compared with other configurations
such as refractory lined furnaces. Compared with the latter, the rotary water walled
furnace features a leak proof enclosure, which eliminates phenomena such as gas
leakage and corrosion of casing. Refractory maintenance concerns are also
eliminated. Moreover, the furnace expands and contracts uniformly as a unit. This
results in the elimination of relative expansion problems that occur between water-
cooled walls and refractory lined casings.
For a designated volume, the rotary water walled design features lower heat
release rates on area basis due to the larger effective projected area occupied during
combustion, which lower effectively the heat fluxes. Depending on the furnace’s
dimensions, the improvement in performance ranges between 5% and 15%. The
17
furnace exit gas temperatures are also lower. A cool environment at the flame front
area due to the design also results in a reduction in the NOx emissions produced
during combustion.
The combustor is constructed of boiler water tubes connected by perforated
steel webs, which allow pre-heated air to enter the combustor. A steel casing
surrounds the rotary barrel. The combustor’s rotating mode is set at 7 revolutions per
hour. The rotation enables the MSW to tumble down the axis of the combustor
allowing an excellent means of drying the material before combustion. Burning
occurs in four stages in the combustor: During the first two stages the MSW is dried
and an initial burning is manifested. The third and fourth stages are where the
primary burning occurs and temperatures reach the 600 °C for the specified unit.
Highly turbulent airflow is created due to the rotating action of the combustor that
leads to an effective burnout in a little excess of air scheme. After about 50-55
minutes in the combustor, the remaining MSW and ash fall onto an after burning
grate where any combustibles still present are burned before the ash is directed into
the ash collection area.
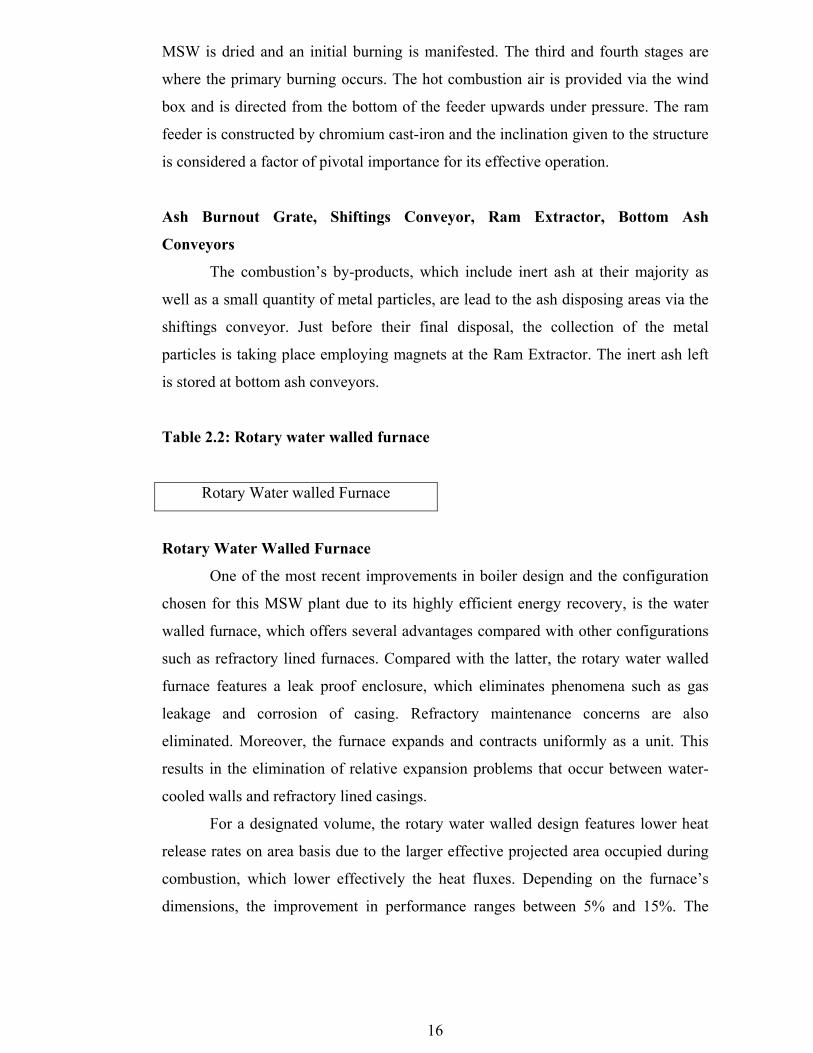
Table 2.3: Boiler and Feed Heating Systems
Boiler Feed Heating System
Super Heaters Closed Feed water Heaters (5)
Condenser Open Feed water Heater (1)
Economiser
Superheaters
Steam that is heated above the temperature corresponding to its saturated
vapour pressure is termed superheated. This steam contains more heat compared with
saturated steam at the same temperature. This added portion of heat provides a
surplus of energy to a turbine for conversion to electric power. Superheated steam
can be transmitted over long distances with only an infinitesimal heat loss. The
process also reduces condensation effectively and problems such as erosion of
turbine blades are reduced to a minimum due to the absence of moisture in the steam.
18
The superheater surface is the surface, which concentrates steam on one side and hot
gases on the other. Hence, the tubes are dry except for the steam that circulates them.
A uniform distribution of the steam enables the prevention of steam tubes over-
heating.
The superheaters used in this design are designated as convection and radiant
types. The convection super heater is placed in the gas stream, where most of its heat
is received by convection. The conventional convection superheater employs two
headers into which two seamless tubes are welded or rolled. For the steam to make a
pass back and forth through the connecting tubes, the headers are baffled. The
headers are small and removing caps similar to those for boiler-tube access provide
access to the tubes. Radiant super heaters are placed near the furnace and receive the
bulk of its heat by radiation.
Employing either a convection-type or a radiant-type superheater does not
guarantee that uniform steam-outlet temperature is achieved. Hence, a combination
superheater is installed to achieve this goal. Steam leaving the boiler drum makes a
first pass through the convection section, then to the radiant section and finally to the
steam header. However, this arrangement will not guarantee the desired results, so a
bypass damper is used aiming to bypass the gas or a portion of the gas around the
convection section controlling the final steam-outlet temperature for various boiler
ratings.
A reheater is also employed in the unit for steam reheating after the steam
leaves the high-pressure area of the turbine. The incorporation of the superheater and
the reheater aims to boost the overall thermodynamic plant efficiency.
Condenser
Steam condensers are vessels in which exhaust steam is condensed by contact
with cooling water. The steam condensation creates a vacuum that reduces the back -
pressure of the engine or turbine leading to an increase in horsepower and efficiency
of the unit. The heat contained in the steam is absorbed by the cooling water, thus
reducing the volume of steam as the condensation takes place. When a space filled
with steam is cooled until the condensation point is reached, the resulting water
occupies only a small portion of the original steam volume and a vacuum is created.

19
The continuous condensation of the exhaust steam reduces the pressure below the
level of the atmospheric pressure.
The configuration employed for the current scenario is designated as a
surface condenser. This is a closed vessel filled with tubes of small diameter. The
condenser features:
• The shell, including tube support plates, hot well and connecting piece, which
is fabricated by heavy steel plate welded into one uniform unit.
• Water tube boxes, which are deep and its design features large nozzles to
keep water velocities down.
• The hot well, which is employed for storage requirements.
• Tubes, made of aluminium alloys and various stainless-steel compositions,
rolled and expanded into the tube sheets at both ends forming a strong and
resistant tube-sheet joint.
• A diaphragm-type shell expansion element, which enables the thermal
expansion and contraction of the tube bundle under operating conditions.
• An air cooler, which provides full-length scavenging of the non-
condensables.
• An impingement plate, placed below the steam inlet to protect the tube
bundle against moisture impingement.
The water flowing through the condenser is supplied from a natural water
source and may undergo a single-pass or a reverse path before being discharged.
Exhaust steam enters at the top of the condenser from the turbine and passes down,
around and between the tube bank tubes. Cold water is flowing through the tubes in
quantities able to condense the steam. Non-condensable gases and air that find their
way into the condenser must be removed in order to reduce the backpressure and
prevent the re-entering of air and oxygen into the system, thus minimizing the
possibilities of corrosion in the piping and the boiler.
Economiser
The economiser is a heat exchanger located in the passage between the boiler
and the stack, designed to recover some of the heat from the products of combustion.
20
It is comprised of a series of tubes through which water flows on its way to the
boiler.
There are two categories of economisers: the parallel-flow and the counter -
flow. In the parallel-flow economiser, the flue gas and the water flow in the same
direction. The hottest flue gases come into contact with the coldest feed water. In the
counter-flow economisers, the flue gas and the water flow in opposite directions. The
latter type, which applies to the unit under examination, is considered to be more
efficient resulting an increased heat absorption scheme. During operation, feed water
enters at the one end of the economiser and is directed to the steam drum through a
complicated system of tubes and headers. The inlet temperature of feed water at the
steam drum is higher than at the inlet temperature to the economiser.
An alternative construction of economisers using flanged joints is generally
preferred to the traditional header construction, due to the advantages of the latter to
use a minimum number of return-bend fittings as well as not to require hand-hole
fittings and gaskets and to be free from expansion difficulties. The modern
economiser is comprised of a continuous coil of tubes rolled or welded into headers
at each end. The advantage of this structure is based on the fact that now acid
cleaning of tubes is possible and gaskets and hand-holes are eliminated.
Closed feed water heaters
A closed feed water heater is a device in which the heat in the steam is
transferred through tubes, which separate the water form the steam. It is comprised
by a steel or cast iron outer shell that holds the steam for heating and also houses the
copper or brass tubes that supply the heat transfer surface.
Closed feed water heaters can be classified by the number of times the water
transverses the length of the unit before being discharged: these types are one-, two-,
three- or four-pass. In the current case, the closed feed water heaters employed are
classified as two-pass. The rates of expansion of the shell and tubes parts of the
closed feed water heaters vary due to the dissimilar nature of the metals from which
they are constructed. Several methods have been developed over the years to
compensate for this difference in expansion rates with the most widely used one
being the packing of each tube so that it can independently expand from the shell.

21
Other methods include the building of heaters without using packed joints between
the tubes and the tube sheet, where the tubes are bent into the form of the letter U as
well as building floating-head-type heaters, which are comprised of separate tubes,
sheets and cover parts that are free to expand inside the shell.
In the closed feed water set-up, no mixing of steam and water takes place.
The application of a pump to force water through several heaters is a common
practice allows utilisation of the steam from several extraction points in the steam
turbine. Closed feed water heaters are unsuitable for heating hard water as the
formation of deposits that occur in the tubes’ surfaces restrict the flow and retard
heat transfer.
Open feed water heater
The open feed water heater or de-aerator is a device in which the steam and
water come into direct contact and the effluent is the combination of the inlet water
and the supply steam. Design characteristics encourage the temperature of the outlet
water to approach the saturation temperature of the supply steam in contrast to the
closed feed water heaters where the steam and water are separated by tubes through
which the heat is transferred.
Open heaters are used for feed water heating that also provides some
additional functions: The combined make-up water and condensate is introduced into
the heater through a spray system and provides a satisfactory mixing of the water and
steam. This process path leads to the rapid heating of water and the removal of
oxygen and other non-condensable gases, which are vented by the heater. The heated
and de-aerated water is stored in a section of the heater or in an additional tank. The
level of water existing in this tank controls the flow of the make-up water to the
heater. When the level in the storage tank drops, the supply of make-up water to the
heater takes place via valves.
22
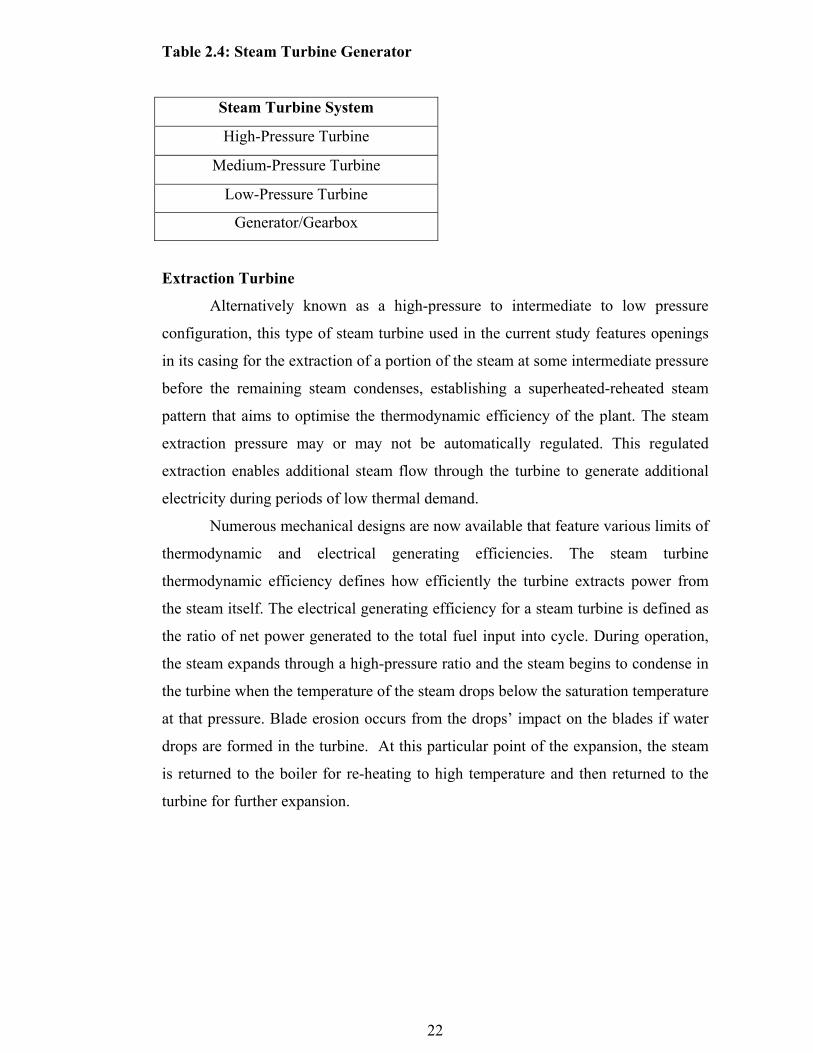
Table 2.4: Steam Turbine Generator
Steam Turbine System
High-Pressure Turbine
Medium-Pressure Turbine
Low-Pressure Turbine
Generator/Gearbox
Extraction Turbine
Alternatively known as a high-pressure to intermediate to low pressure
configuration, this type of steam turbine used in the current study features openings
in its casing for the extraction of a portion of the steam at some intermediate pressure
before the remaining steam condenses, establishing a superheated-reheated steam
pattern that aims to optimise the thermodynamic efficiency of the plant. The steam
extraction pressure may or may not be automatically regulated. This regulated
extraction enables additional steam flow through the turbine to generate additional
electricity during periods of low thermal demand.
Numerous mechanical designs are now available that feature various limits of
thermodynamic and electrical generating efficiencies. The steam turbine
thermodynamic efficiency defines how efficiently the turbine extracts power from
the steam itself. The electrical generating efficiency for a steam turbine is defined as
the ratio of net power generated to the total fuel input into cycle. During operation,
the steam expands through a high-pressure ratio and the steam begins to condense in
the turbine when the temperature of the steam drops below the saturation temperature
at that pressure. Blade erosion occurs from the drops’ impact on the blades if water
drops are formed in the turbine. At this particular point of the expansion, the steam
is returned to the boiler for re-heating to high temperature and then returned to the
turbine for further expansion.
23
Design Characteristics of Extraction Turbine used in 10 MW MSW combustion
plant
The turbine casing is horizontally split. Two materials have been specified for
the high-pressure section: low-alloy steel for intermediate steam pressure and
temperature applications and a medium-alloy steel for high steam pressure and
temperature applications. The shaft is made of forged steel. Two types of shaft
material have been specified: low-alloy steel for low-pressure applications and high-
alloy steel (13% chromium steel) for high-pressure applications.
The front and rear sections of the turbine are identical. The intermediate section
has been designed to accommodate intermediate pressure valves. Cylindrical moving
blades of reaction stage(s) have ‘T’ roots and integral shrouds. Two materials are
employed for the construction of the moving blades: 13% chromium steel with
molybdenum and vanadium is applied for temperatures over 350 °C and 13%
chromium steel is used for lower temperatures. The reaction stage fixed blades are
cantilevered in the blade carriers and held together by a riveted shroud or inserted in
the blade carriers as complete diaphragms. They are made of 13% chromium steel.
There is an emergency stop valve (Push-to-Close type), which protects the turbo-
unit against the un-wanted effects of over-speed. The valve’s response time is set at
50 milliseconds and possesses a high reliability factor. It is installed on each live
steam inlet flange and is mounted directly on the casing, thus minimising the steam
volume that continues to expand through the turbine after valve closure. The steam
extraction can be performed by bleeding or controlled by one or more intermediate
pressure controls. Tilting-pad journal bearings are used in general. Double acting,
tilting-pad thrust bearings are installed with a thrust equalising device. Both journal
and thrust bearings are fitted with thermo-elements for temperature detection and
monitoring. Labyrinth-type end seals are applied. Lubrication and control oil systems
have a common reservoir, pumps, filters and coolers.
(Source: Nuovo Pignone)
Generator/Gearbox
The Gearbox is positioned between the slow motor shaft and the fast
generator shaft. This device, the generator allows shaft to run at approximately
24
70 times faster than the rotor shaft. This is necessary, as the generator has to
rotate at a much higher speed than the rotor. The gearbox transports the entire
power output from the rotor to the generator.
Table 2.5: Stack Gas Clean Up and Pollution Controls
Dry Scrubber System
Dry Scrubber
Baghouse
Ash Recycle System
Induced Draft Fan
Stack
Dry Scrubber System
Dry scrubbing is currently the most rapidly developing technology in the area
of sulphur dioxide removal from the flue gas of MSW fired boilers. As a process, it
results in the production of a dry product e.g. fly ash and the maintenance of the flue
gas above the moisture dew point. Other acid gases are also removed in addition to
sulphur dioxide such as hydrogen chloride and particulate matter. During dry
scrubbing, the heat in the flue gas at the air heater outlet is used to dry and condition
the atomised slurry of alkaline reactants. The majority of the sulphur dioxide present
is collected from the flue gases. The remaining material with the normal fly ash in
the flue gas is then collected in the baghouse. Effective ash handling is undertaken in
an ash recycle system.
Dry scrubbers are defined in two categories by virtue of their design: the
Rotary Atomizer formation, which is incorporated at the particular site in research,
and the Dual Fluid Nozzles formation, which utilises nozzles with fluid atomisation,
quite to these used in liquid fuels combustion. In the rotary atomiser set-up, gas and
reagent flow pattern symmetry is achieved and the flue gas dispenser system that is
additionally provided mixes the large gas volumes involved. The rotary atomiser is
placed on the vertical centre line of the spray dryer absorber and the flue gas runs
around the atomiser from above and below. The atomiser is equipped with a
25
vertically mounted motor, of which the spindle speed can vary according to the
design of the gear drive.
The liquid slurry enters the rotating wheel and is accelerated and atomised at
the wheel’s multiple nozzles forming a spray of droplets. This spray leaves the
nozzles in a horizontal direction at a 180° spray angle. To assure complete drying, a
high volume of flue gas, entering at a temperature of 175 °C must be treated with a
relatively small amount of reactant slurry. This implies that as the plant size
increases, the dry absorber’s dimensions increase faster than the dimensions of the
atomiser itself, and gas contact with the cloud of reagent droplets occurs further
away from the atomiser wheel. This results the inlet flue gas’ division into two
streams in order to balance the cloud of droplets. As the flue gas comes in contact to
the fine lime slurry droplets cloud, it dries them as they react with the sulphur
dioxide in the flue gas to form dry calcium sulphate and calcium sulphite powders.
The flue gas exits the spray dryer absorbers carrying a quantity of dry reacted
chemicals to the baghouse. Baghouse formations are characterised according to the
method they employ for fly ash removal from the filter medium. An additional
reaction takes place between the dry chemicals and flue gas during the removal of
the particulates. Baghouse formations remove more than 99.9% of the fly ash from
the flue gas. From the baghouse, flue gas is directed to an induced-draft fan and then
exits to the atmosphere through the stack. The waste-product material and fly ash
quantities received from the spray dryer absorbers and the baghouse are totally dry.
These products are transported pneumatically or mechanically to collection areas and
stored.
Table 2.6: Plant Engineering
Pump System
Condensate pump
Boiler Feed water pump
Forced circulation Pump
Spray Attemperator
Rotary connector
26
Spray Attemperator (De-Superheater)
A factor of pivotal importance in achieving the optimal plant efficiency
demands that a constant superheat temperature is required over a load range. This
requires that a sufficient surface is installed to make sure that the temperature is
obtained at the minimum load condition. If higher loads are needed, the super heat
temperature will exceed limits because of the amount of its installed surface, unless
the temperature is controlled. A de-superheater (or attemperator) will be used to
control the superheat temperature. This is achieved by mixing water with the steam
at an intermediate stage of the superheater (spray-type attemperator) and will ensure
the maximum steam temperature is not exceeded.
Boiler Feed water pump
The closed feed waters tube sections must withstand the water pressure and
the shell must withstand the pressure of the steam. The water is forced through one
or more heaters by a single pump, the Boiler Feed water pump. This would be
constructed of copper or brass to supply heat transfer insulation.
Condensate Pump
A pump employed to raise pressure from the vacuum levels to 350 pounds
per square inch.
Forced circulation Pump
A pump incorporating a small cooler in the seal configuration. The cooler is
charged by the plant’s closed-loop cooling system. Its operation is utilised mainly
during start-up.
The plant apparatus breakdown took place so familiarity is gained with the
plant’s main constituent units. The resulted understanding of its operation is
considered of pivotal importance for the evaluation the assessments following later
on.
27
Figure 2.1: 10 MW MSW Combustion Plant Set-up
28
CHAPTER 3- Production Assessment:
Introduction:
The Production Assessment process aims to identify and satisfy three areas of
research. Initially, the Power Potential sourcing from the MSW mass burning
utilisation for the area of Athens, Greece is forecasted. At a second stage, the
evaluation of the daily and annual combustible quantity of MSW is calculated in
relation to the MSW combustion plants’ load ranging factor. Finally, the evaluation
of annual kWh production is performed taking into account the examined plant’s
actual load factor parameter. The concurrent evaluation of the heat flow rate
(Btu/kWh) acts as a verification method to the calculations certifying their validity.
Load Factor:
The plant load factor is defined as the ratio of Actual Operational Capacity to
the Optimal Operating Capacity. In the particular MSW plant the Optimal Operating
Capacity is 10 MW and the Actual Operational Capacity is accounted in the range
between 6.5 to 8.5 MW. According to ETSU, ‘a variation of load factor in the range
of 65% to 85% is considered feasible due to the plants’ developed set-up complexity
and capacity levels as well as the safety measures and precautions standards
established by local laws and authorities’ (ETSU, 1991). For the particular
combustion plant in research the current load factor is defined at 75% due to the
plants’ developed set-up complexity and capacity levels.
Load Factor = Actual Operational Capacity / Optimal Operating Capacity (eq. 3.1)
Heat Rate:
The Heat Rate is the method of evaluating the Energy Efficiency of a plant.
Energy Efficiency, in general, measures the amount of primary energy from the raw
fuel needed to produce a specified amount of delivered energy. The Heat Rate is the
amount of energy (Btu) in the fuel needed to produce one kilowatt-hour (kWh) of
electricity. The lower the heat rate the more energy efficient the plant is. Heat rate is
29
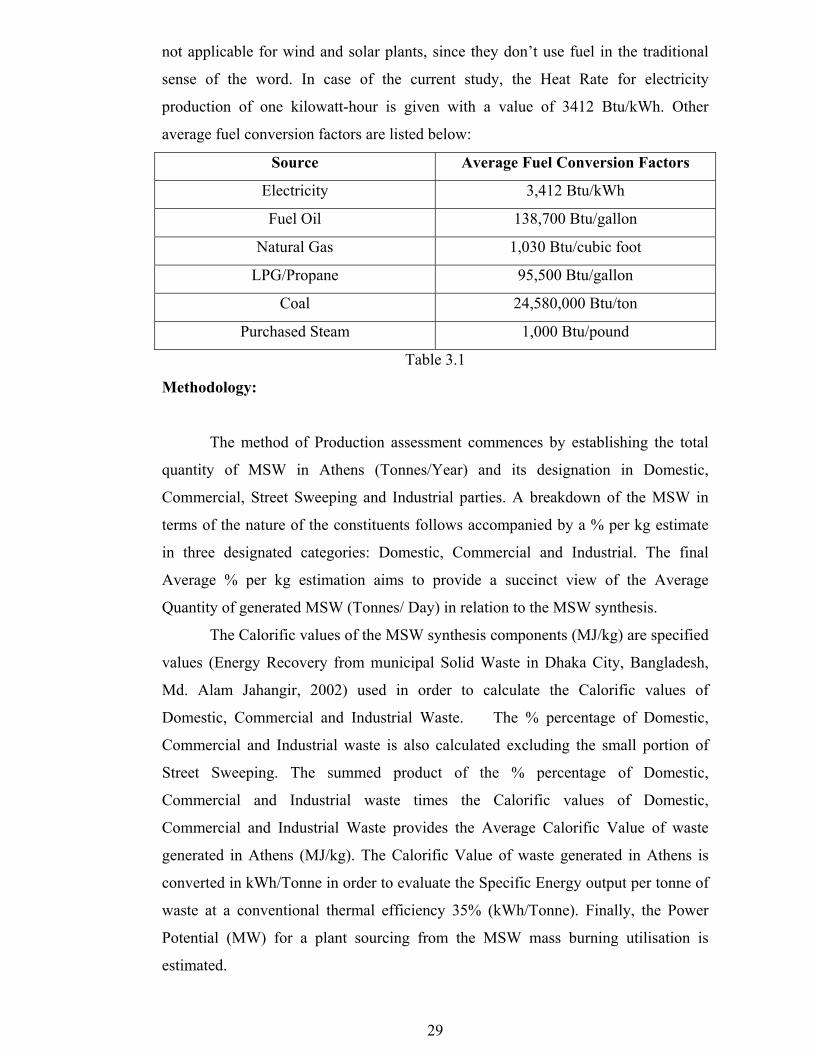
not applicable for wind and solar plants, since they don’t use fuel in the traditional
sense of the word. In case of the current study, the Heat Rate for electricity
production of one kilowatt-hour is given with a value of 3412 Btu/kWh. Other
average fuel conversion factors are listed below:
Source Average Fuel Conversion Factors
Electricity 3,412 Btu/kWh
Fuel Oil 138,700 Btu/gallon
Natural Gas 1,030 Btu/cubic foot
LPG/Propane 95,500 Btu/gallon
Coal 24,580,000 Btu/ton
Purchased Steam 1,000 Btu/pound
Table 3.1
Methodology:
The method of Production assessment commences by establishing the total
quantity of MSW in Athens (Tonnes/Year) and its designation in Domestic,
Commercial, Street Sweeping and Industrial parties. A breakdown of the MSW in
terms of the nature of the constituents follows accompanied by a % per kg estimate
in three designated categories: Domestic, Commercial and Industrial. The final
Average % per kg estimation aims to provide a succinct view of the Average
Quantity of generated MSW (Tonnes/ Day) in relation to the MSW synthesis.
The Calorific values of the MSW synthesis components (MJ/kg) are specified
values (Energy Recovery from municipal Solid Waste in Dhaka City, Bangladesh,
Md. Alam Jahangir, 2002) used in order to calculate the Calorific values of
Domestic, Commercial and Industrial Waste. The % percentage of Domestic,
Commercial and Industrial waste is also calculated excluding the small portion of
Street Sweeping. The summed product of the % percentage of Domestic,
Commercial and Industrial waste times the Calorific values of Domestic,
Commercial and Industrial Waste provides the Average Calorific Value of waste
generated in Athens (MJ/kg). The Calorific Value of waste generated in Athens is
converted in kWh/Tonne in order to evaluate the Specific Energy output per tonne of
waste at a conventional thermal efficiency 35% (kWh/Tonne). Finally, the Power
Potential (MW) for a plant sourcing from the MSW mass burning utilisation is
estimated.
30
In order to estimate the daily and annual combustible quantity of MSW in
relation to a load factor range from 65% to 85% the standardised values of Btu/kg of
MSW according to their synthesis are introduced and an average value (Btu/kg) is
calculated (Estimated average gross calorific values fuels in 2001). The selection of
the average Btu/kg value designates the random collection of MSW that takes place
in the feeding area before the combustor after which burning occurs.
The burning process that leads to utilisation of the MSW is completed in 60
minutes. At this stage the values of Btu/hr of a water-walled combustor for a load
factor ranging between 65% and 85% are introduced. Dividing these to the Average
Btu/kg value of MSW leads to the establishment of the daily and annual quantity of
MSW utilised in the combustor. Ishikawajima-Harima Heavy Industries Co Ltd.,
who is leading manufacturers of water-walled rotary combustors, provided the Btu/hr
values. The annual production of kWh follows, estimating levels of energy generated
from the MSW plant for the ranging load factor parameter, which includes the actual
load factor for the examined site. Finally the Heat Rate is calculated and acts as a
verification tool for the validity of calculations.
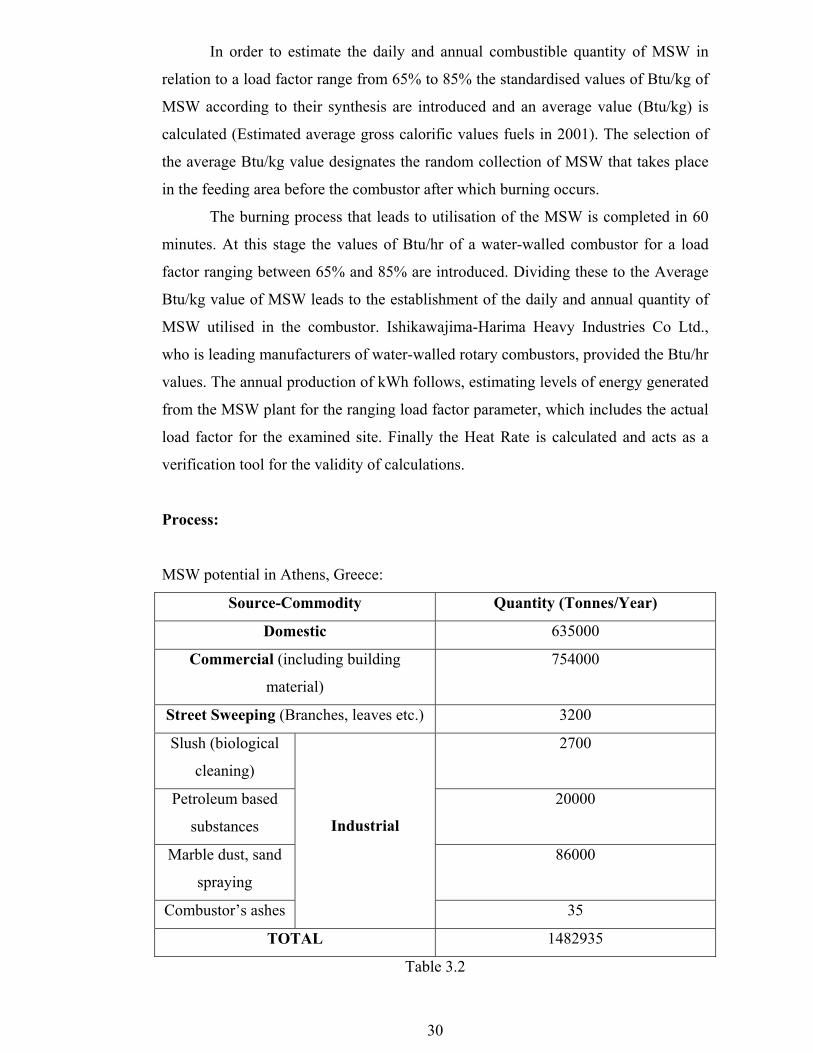
Process:
MSW potential in Athens, Greece:
Source-Commodity Quantity (Tonnes/Year)
Domestic 635000
Commercial (including building
material)
754000
Street Sweeping (Branches, leaves etc.) 3200
Slush (biological
cleaning)
2700
Petroleum based
substances
20000
Marble dust, sand
spraying
86000
Combustor’s ashes
Industrial
35
TOTAL 1482935
Table 3.2
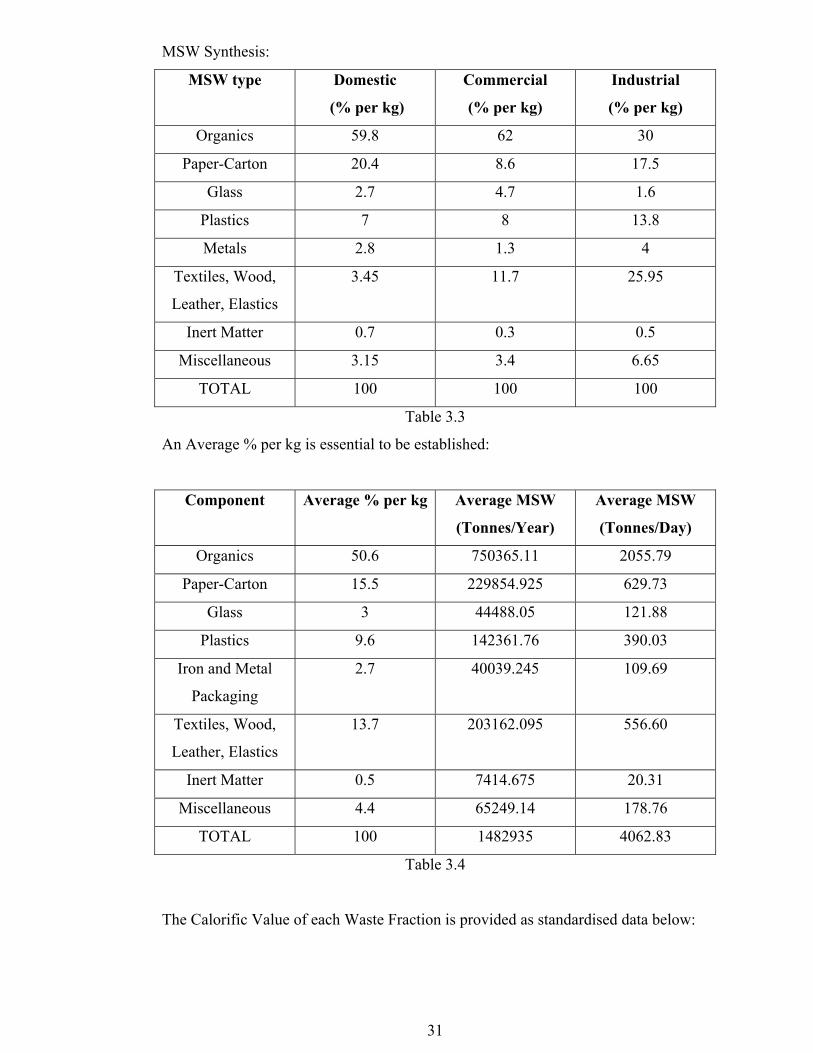
31
MSW Synthesis:
MSW type Domestic
(% per kg)
Commercial
(% per kg)
Industrial
(% per kg)
Organics 59.8 62 30
Paper-Carton 20.4 8.6 17.5
Glass 2.7 4.7 1.6
Plastics 7 8 13.8
Metals 2.8 1.3 4
Textiles, Wood,
Leather, Elastics
3.45 11.7 25.95
Inert Matter 0.7 0.3 0.5
Miscellaneous 3.15 3.4 6.65
TOTAL 100 100 100
Table 3.3
An Average % per kg is essential to be established:
Component Average % per kg Average MSW
(Tonnes/Year)
Average MSW
(Tonnes/Day)
Organics 50.6 750365.11 2055.79
Paper-Carton 15.5 229854.925 629.73
Glass 3 44488.05 121.88
Plastics 9.6 142361.76 390.03
Iron and Metal
Packaging
2.7 40039.245 109.69
Textiles, Wood,
Leather, Elastics
13.7 203162.095 556.60
Inert Matter 0.5 7414.675 20.31
Miscellaneous 4.4 65249.14 178.76
TOTAL 100 1482935 4062.83
Table 3.4
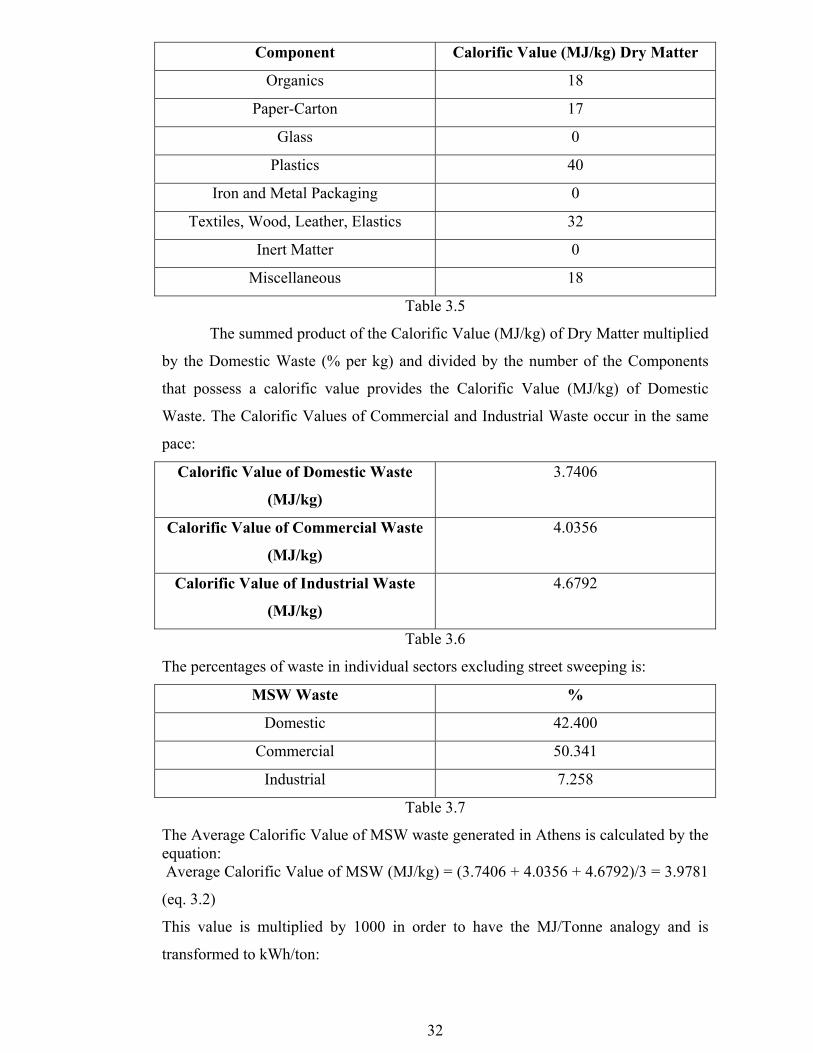
The Calorific Value of each Waste Fraction is provided as standardised data below:
32
Component Calorific Value (MJ/kg) Dry Matter
Organics 18
Paper-Carton 17
Glass 0
Plastics 40
Iron and Metal Packaging 0
Textiles, Wood, Leather, Elastics 32
Inert Matter 0
Miscellaneous 18
Table 3.5
The summed product of the Calorific Value (MJ/kg) of Dry Matter multiplied
by the Domestic Waste (% per kg) and divided by the number of the Components
that possess a calorific value provides the Calorific Value (MJ/kg) of Domestic
Waste. The Calorific Values of Commercial and Industrial Waste occur in the same
pace:
Calorific Value of Domestic Waste
(MJ/kg)
3.7406
Calorific Value of Commercial Waste
(MJ/kg)
4.0356
Calorific Value of Industrial Waste
(MJ/kg)
4.6792
Table 3.6
The percentages of waste in individual sectors excluding street sweeping is:
MSW Waste %
Domestic 42.400
Commercial 50.341
Industrial 7.258
Table 3.7
The Average Calorific Value of MSW waste generated in Athens is calculated by theequation: Average Calorific Value of MSW (MJ/kg) = (3.7406 + 4.0356 + 4.6792)/3 = 3.9781
(eq. 3.2)
This value is multiplied by 1000 in order to have the MJ/Tonne analogy and is
transformed to kWh/ton:
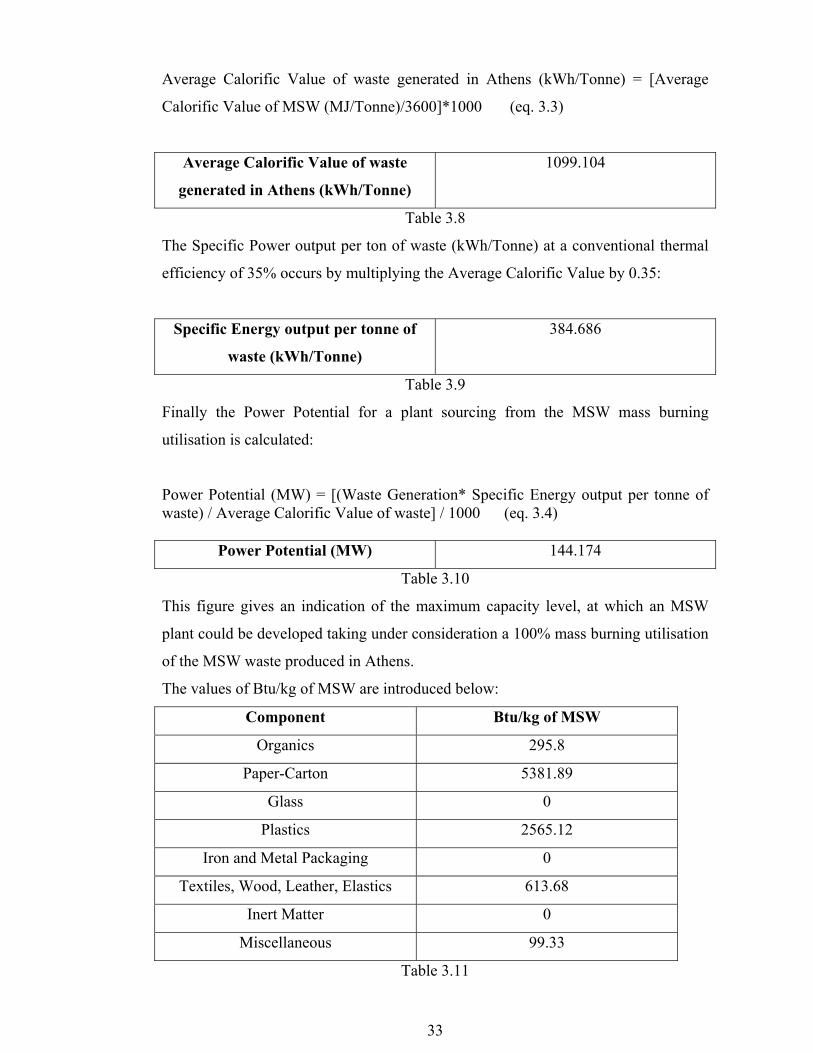
33
Average Calorific Value of waste generated in Athens (kWh/Tonne) = [Average
Calorific Value of MSW (MJ/Tonne)/3600]*1000 (eq. 3.3)
Average Calorific Value of waste
generated in Athens (kWh/Tonne)
1099.104
Table 3.8
The Specific Power output per ton of waste (kWh/Tonne) at a conventional thermal
efficiency of 35% occurs by multiplying the Average Calorific Value by 0.35:
Specific Energy output per tonne of
waste (kWh/Tonne)
384.686
Table 3.9
Finally the Power Potential for a plant sourcing from the MSW mass burning
utilisation is calculated:
Power Potential (MW) = [(Waste Generation* Specific Energy output per tonne ofwaste) / Average Calorific Value of waste] / 1000 (eq. 3.4)
Power Potential (MW) 144.174
Table 3.10
This figure gives an indication of the maximum capacity level, at which an MSW
plant could be developed taking under consideration a 100% mass burning utilisation
of the MSW waste produced in Athens.
The values of Btu/kg of MSW are introduced below:
Component Btu/kg of MSW
Organics 295.8
Paper-Carton 5381.89
Glass 0
Plastics 2565.12
Iron and Metal Packaging 0
Textiles, Wood, Leather, Elastics 613.68
Inert Matter 0
Miscellaneous 99.33
Table 3.11
34
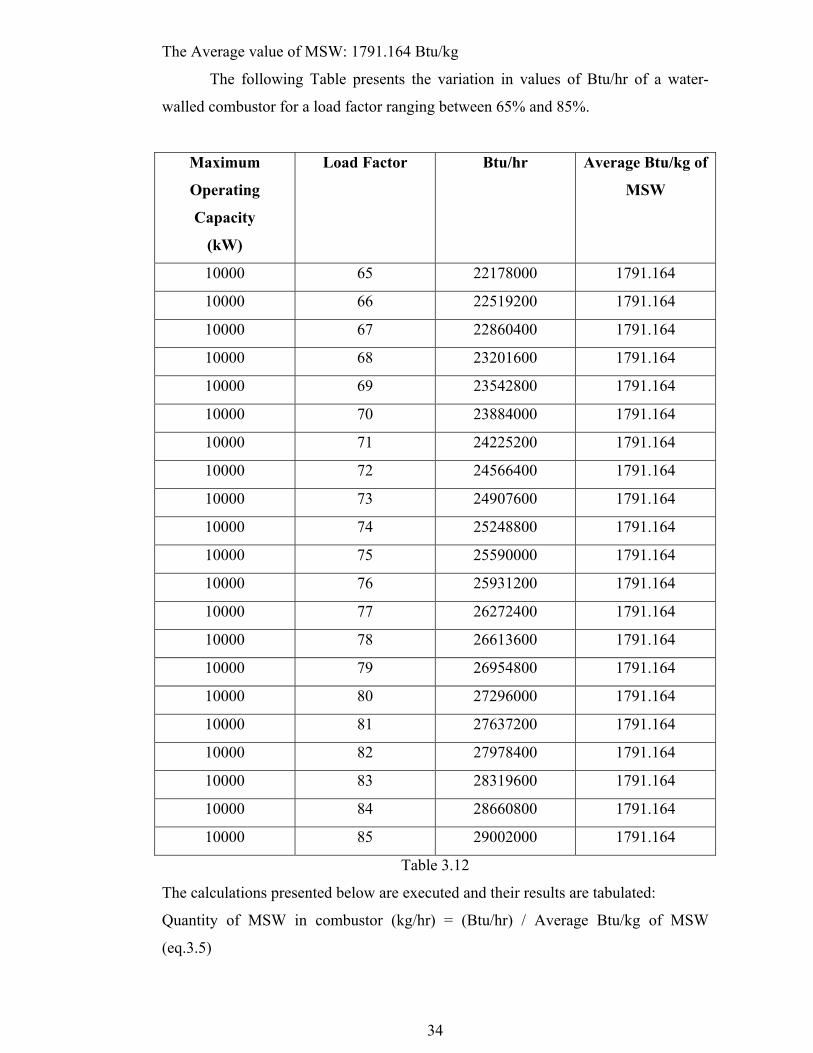
The Average value of MSW: 1791.164 Btu/kg
The following Table presents the variation in values of Btu/hr of a water-
walled combustor for a load factor ranging between 65% and 85%.
Maximum
Operating
Capacity
(kW)
Load Factor Btu/hr Average Btu/kg of
MSW
10000 65 22178000 1791.164
10000 66 22519200 1791.164
10000 67 22860400 1791.164
10000 68 23201600 1791.164
10000 69 23542800 1791.164
10000 70 23884000 1791.164
10000 71 24225200 1791.164
10000 72 24566400 1791.164
10000 73 24907600 1791.164
10000 74 25248800 1791.164
10000 75 25590000 1791.164
10000 76 25931200 1791.164
10000 77 26272400 1791.164
10000 78 26613600 1791.164
10000 79 26954800 1791.164
10000 80 27296000 1791.164
10000 81 27637200 1791.164
10000 82 27978400 1791.164
10000 83 28319600 1791.164
10000 84 28660800 1791.164
10000 85 29002000 1791.164
Table 3.12
The calculations presented below are executed and their results are tabulated:
Quantity of MSW in combustor (kg/hr) = (Btu/hr) / Average Btu/kg of MSW
(eq.3.5)
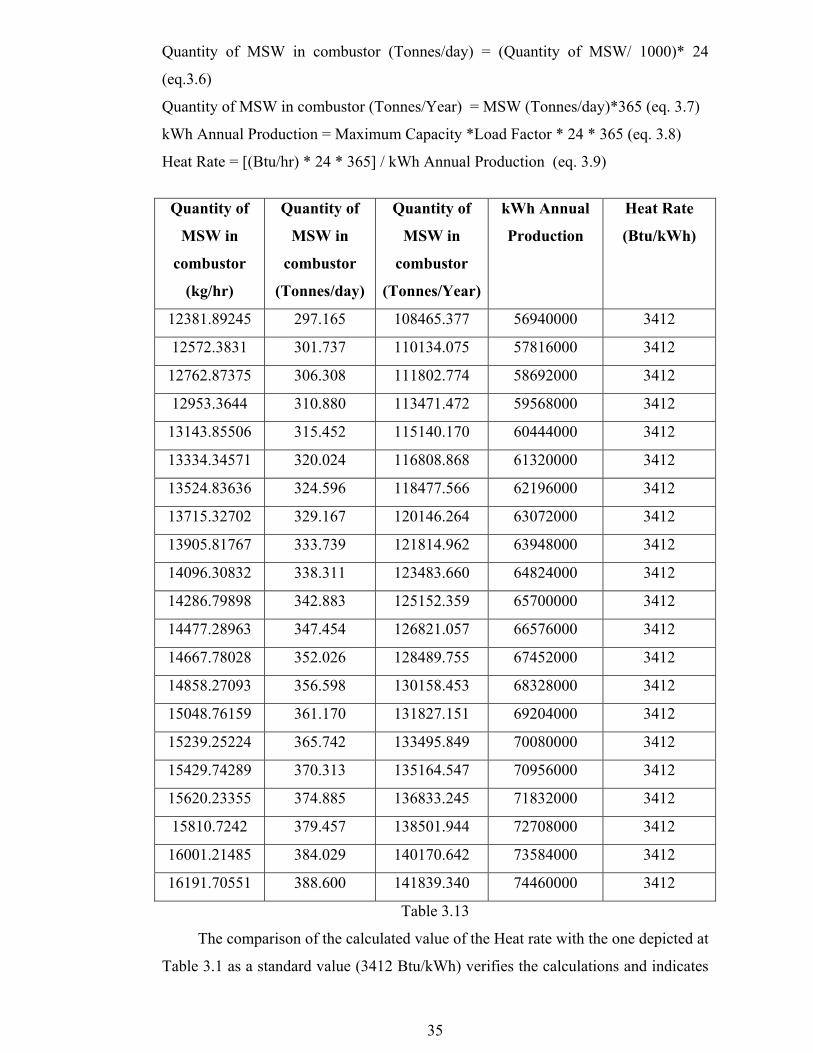
35
Quantity of MSW in combustor (Tonnes/day) = (Quantity of MSW/ 1000)* 24
(eq.3.6)
Quantity of MSW in combustor (Tonnes/Year) = MSW (Tonnes/day)*365 (eq. 3.7)
kWh Annual Production = Maximum Capacity *Load Factor * 24 * 365 (eq. 3.8)
Heat Rate = [(Btu/hr) * 24 * 365] / kWh Annual Production (eq. 3.9)
Quantity of
MSW in
combustor
(kg/hr)
Quantity of
MSW in
combustor
(Tonnes/day)
Quantity of
MSW in
combustor
(Tonnes/Year)
kWh Annual
Production
Heat Rate
(Btu/kWh)
12381.89245 297.165 108465.377 56940000 3412
12572.3831 301.737 110134.075 57816000 3412
12762.87375 306.308 111802.774 58692000 3412
12953.3644 310.880 113471.472 59568000 3412
13143.85506 315.452 115140.170 60444000 3412
13334.34571 320.024 116808.868 61320000 3412
13524.83636 324.596 118477.566 62196000 3412
13715.32702 329.167 120146.264 63072000 3412
13905.81767 333.739 121814.962 63948000 3412
14096.30832 338.311 123483.660 64824000 3412
14286.79898 342.883 125152.359 65700000 3412
14477.28963 347.454 126821.057 66576000 3412
14667.78028 352.026 128489.755 67452000 3412
14858.27093 356.598 130158.453 68328000 3412
15048.76159 361.170 131827.151 69204000 3412
15239.25224 365.742 133495.849 70080000 3412
15429.74289 370.313 135164.547 70956000 3412
15620.23355 374.885 136833.245 71832000 3412
15810.7242 379.457 138501.944 72708000 3412
16001.21485 384.029 140170.642 73584000 3412
16191.70551 388.600 141839.340 74460000 3412
Table 3.13
The comparison of the calculated value of the Heat rate with the one depicted at
Table 3.1 as a standard value (3412 Btu/kWh) verifies the calculations and indicates
36
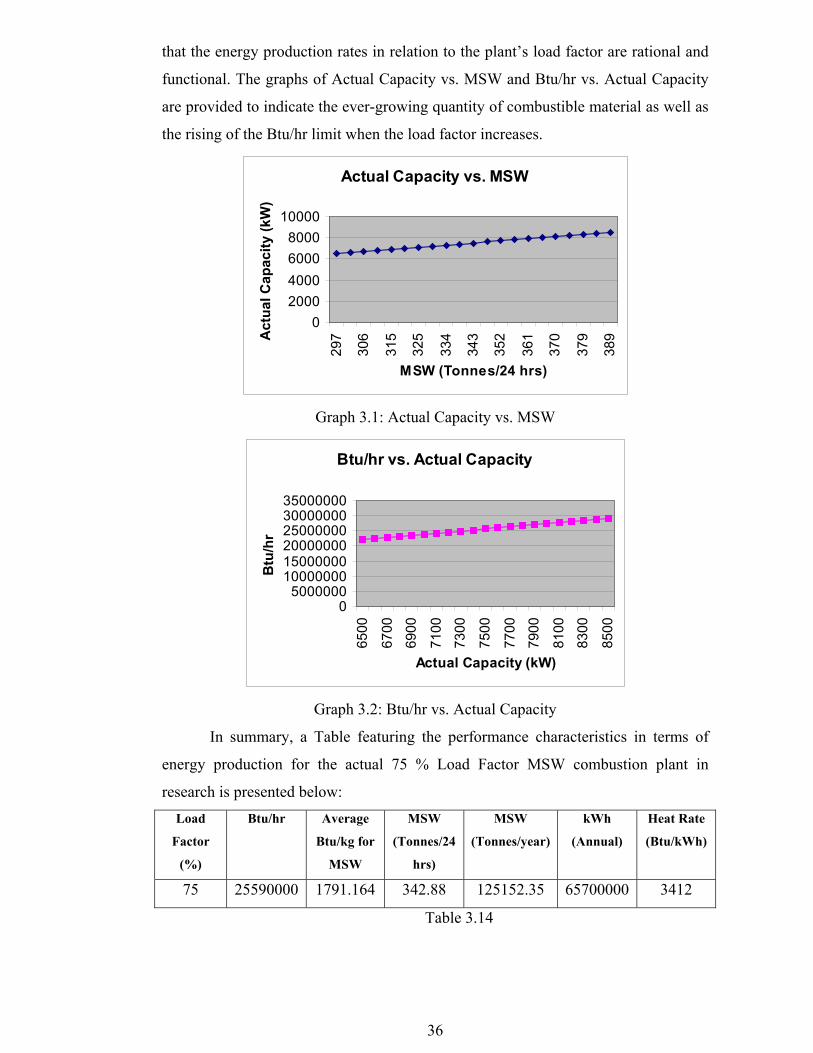
that the energy production rates in relation to the plant’s load factor are rational and
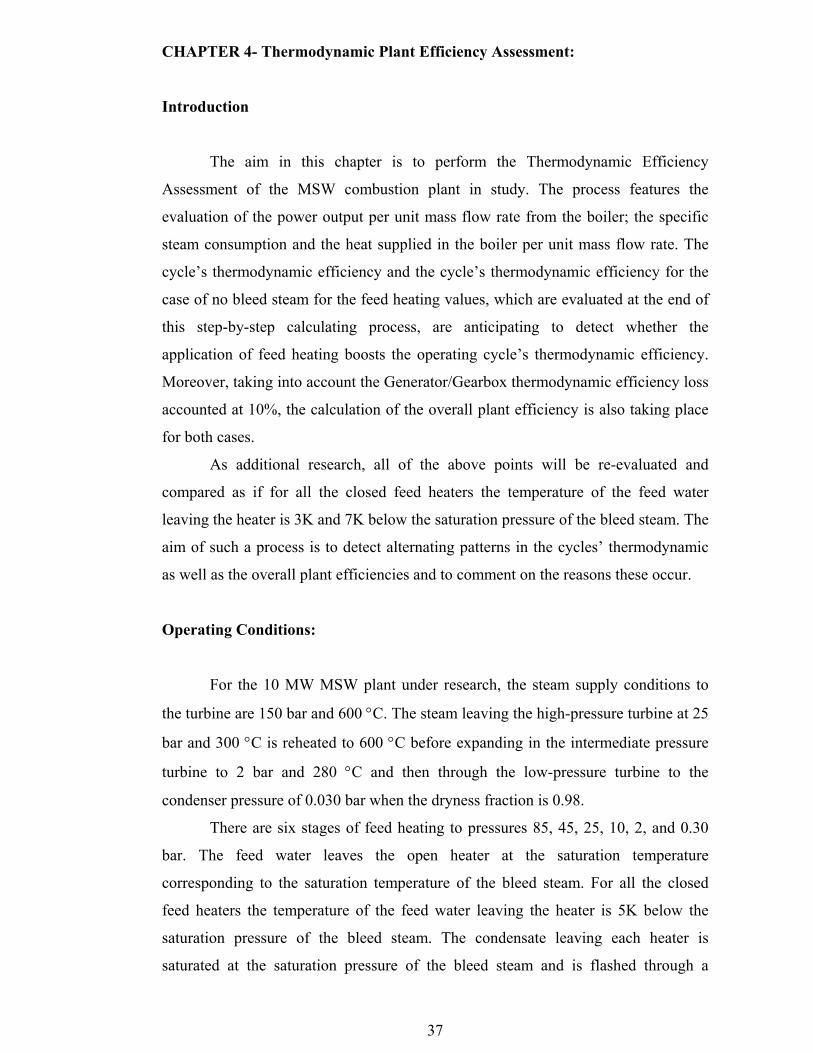
functional. The graphs of Actual Capacity vs. MSW and Btu/hr vs. Actual Capacity
are provided to indicate the ever-growing quantity of combustible material as well as
the rising of the Btu/hr limit when the load factor increases.
Actual Capacity vs. MSW
02000400060008000
10000
297
306
315
325
334
343
352
361
370
379
389
MSW (Tonnes/24 hrs)
Act
ual C
apac
ity (k
W)
Graph 3.1: Actual Capacity vs. MSW
Btu/hr vs. Actual Capacity
05000000
100000001500000020000000250000003000000035000000
6500
6700
6900
7100
7300
7500
7700
7900
8100
8300
8500
Actual Capacity (kW)
Btu
/hr
Graph 3.2: Btu/hr vs. Actual Capacity
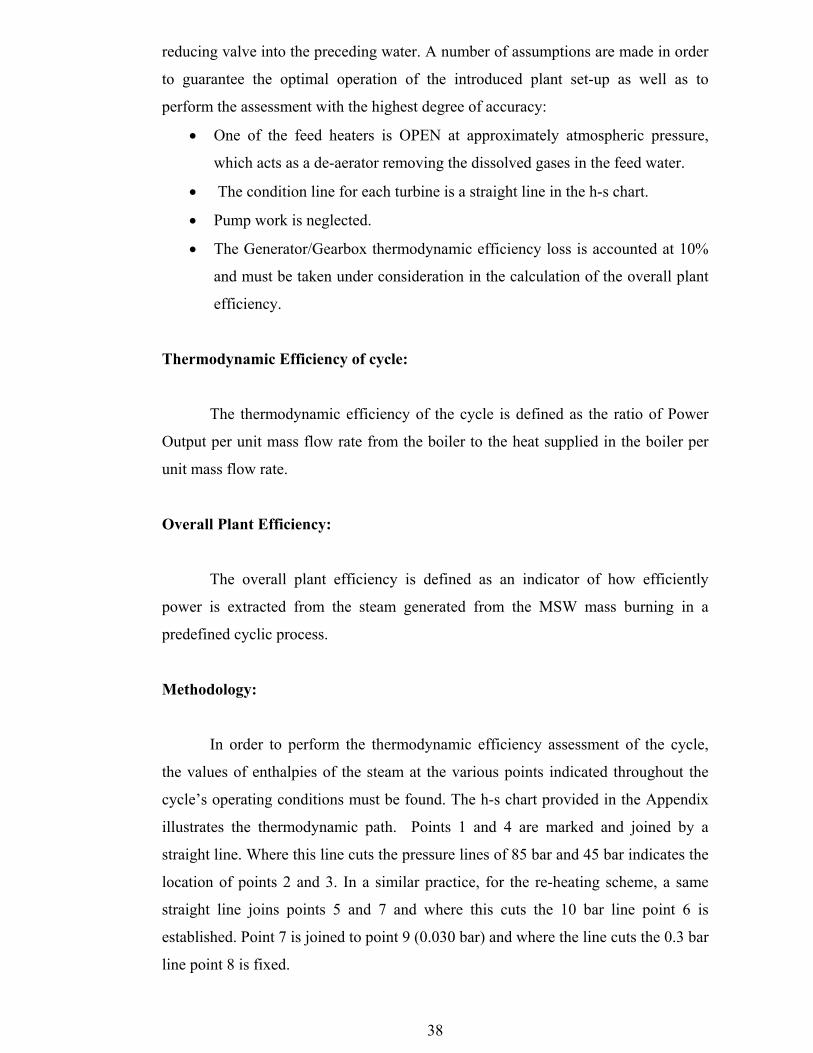
In summary, a Table featuring the performance characteristics in terms of
energy production for the actual 75 % Load Factor MSW combustion plant in
research is presented below:Load
Factor
(%)
Btu/hr Average
Btu/kg for
MSW
MSW
(Tonnes/24
hrs)
MSW
(Tonnes/year)
kWh
(Annual)
Heat Rate
(Btu/kWh)
75 25590000 1791.164 342.88 125152.35 65700000 3412
Table 3.14
37
CHAPTER 4- Thermodynamic Plant Efficiency Assessment:
Introduction
The aim in this chapter is to perform the Thermodynamic Efficiency
Assessment of the MSW combustion plant in study. The process features the
evaluation of the power output per unit mass flow rate from the boiler; the specific
steam consumption and the heat supplied in the boiler per unit mass flow rate. The
cycle’s thermodynamic efficiency and the cycle’s thermodynamic efficiency for the
case of no bleed steam for the feed heating values, which are evaluated at the end of
this step-by-step calculating process, are anticipating to detect whether the
application of feed heating boosts the operating cycle’s thermodynamic efficiency.
Moreover, taking into account the Generator/Gearbox thermodynamic efficiency loss
accounted at 10%, the calculation of the overall plant efficiency is also taking place
for both cases.
As additional research, all of the above points will be re-evaluated and
compared as if for all the closed feed heaters the temperature of the feed water
leaving the heater is 3K and 7K below the saturation pressure of the bleed steam. The
aim of such a process is to detect alternating patterns in the cycles’ thermodynamic
as well as the overall plant efficiencies and to comment on the reasons these occur.
Operating Conditions:
For the 10 MW MSW plant under research, the steam supply conditions to
the turbine are 150 bar and 600 °C. The steam leaving the high-pressure turbine at 25
bar and 300 °C is reheated to 600 °C before expanding in the intermediate pressure
turbine to 2 bar and 280 °C and then through the low-pressure turbine to the
condenser pressure of 0.030 bar when the dryness fraction is 0.98.
There are six stages of feed heating to pressures 85, 45, 25, 10, 2, and 0.30
bar. The feed water leaves the open heater at the saturation temperature
corresponding to the saturation temperature of the bleed steam. For all the closed
feed heaters the temperature of the feed water leaving the heater is 5K below the
saturation pressure of the bleed steam. The condensate leaving each heater is
saturated at the saturation pressure of the bleed steam and is flashed through a
38
reducing valve into the preceding water. A number of assumptions are made in order
to guarantee the optimal operation of the introduced plant set-up as well as to
perform the assessment with the highest degree of accuracy:
• One of the feed heaters is OPEN at approximately atmospheric pressure,
which acts as a de-aerator removing the dissolved gases in the feed water.
• The condition line for each turbine is a straight line in the h-s chart.
• Pump work is neglected.
• The Generator/Gearbox thermodynamic efficiency loss is accounted at 10%
and must be taken under consideration in the calculation of the overall plant
efficiency.
Thermodynamic Efficiency of cycle:
The thermodynamic efficiency of the cycle is defined as the ratio of Power
Output per unit mass flow rate from the boiler to the heat supplied in the boiler per
unit mass flow rate.
Overall Plant Efficiency:
The overall plant efficiency is defined as an indicator of how efficiently
power is extracted from the steam generated from the MSW mass burning in a
predefined cyclic process.
Methodology:
In order to perform the thermodynamic efficiency assessment of the cycle,
the values of enthalpies of the steam at the various points indicated throughout the
cycle’s operating conditions must be found. The h-s chart provided in the Appendix
illustrates the thermodynamic path. Points 1 and 4 are marked and joined by a
straight line. Where this line cuts the pressure lines of 85 bar and 45 bar indicates the
location of points 2 and 3. In a similar practice, for the re-heating scheme, a same
straight line joins points 5 and 7 and where this cuts the 10 bar line point 6 is
established. Point 7 is joined to point 9 (0.030 bar) and where the line cuts the 0.3 bar
line point 8 is fixed.
39
The enthalpy of water is considered to be approximately equal to the
saturation value hf at the same temperature. The enthalpies of the feed water leaving
the closed feed heaters are calculated as follows:
For Point 11
h11=hf at (69.1-5) °C = 64.1 °C = 268 kJ/kg (eq. 4.1)
Similar work is performed for the Points 13, 14, 15 and 16 in order to
establish the enthalpy values. The enthalpy leaving the open heater is saturated at the
pressure of 2 bar, hence: h12 = 505 kJ/kg.
The cycle path is illustrated in Fig. 4.1 at the end of this chapter. Assuming
the bleed steam flow rates per unit mass flow rate from the boiler to be y1, y2, y3, y4,
y5 and y6 the application of the energy balance for each feed heater leads to the
following equations:
First Heater: (for p= 85 bar hf=1341 kJ/kg)
y1*h2+h15-h16-y1*(1341)=0 (eq. 4.2)
Second Heater: (for p=45 bar hf=1122 kJ/kg)
y2*h3+h14+(1341*y1)-h15-1122*(y1+y2)=0 (eq. 4.3)
Third Heater: (for p=25 bar hf=962 kJ/kg)
h5*y3+h13+1122*(y1+y2)-h14-962*(y1+y2+y3)=0 (eq. 4.4)
Fourth Heater: (for p=10 bar hf= 763 kJ/kg)
h6*y4+h12+962*(y1+y2+y3)-h13-763*(y1+y2+y3+y4)=0 (eq. 4.5)
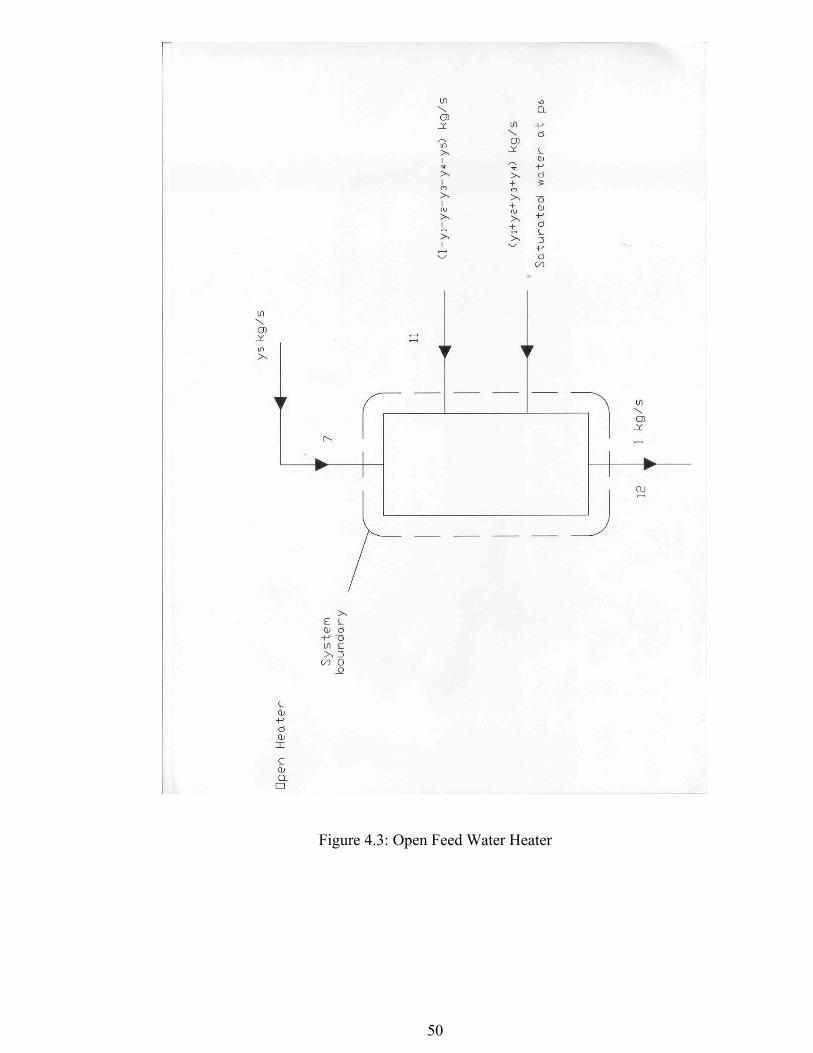
Open Heater: h7*y5 +h11*(1-y1-y2-y3-y4-y5)+763*(y1+y2+y3+y4)-h12=0 (eq. 4.6)
Sixth Heater: (for p=0.30 bar hf=289 kJ/kg, for p=0.030 bar hf=101 kJ/kg)
h8+y6-289*y6=(h11-101)*(1-y1-y2-y3-y4-y5) (eq. 4.7)
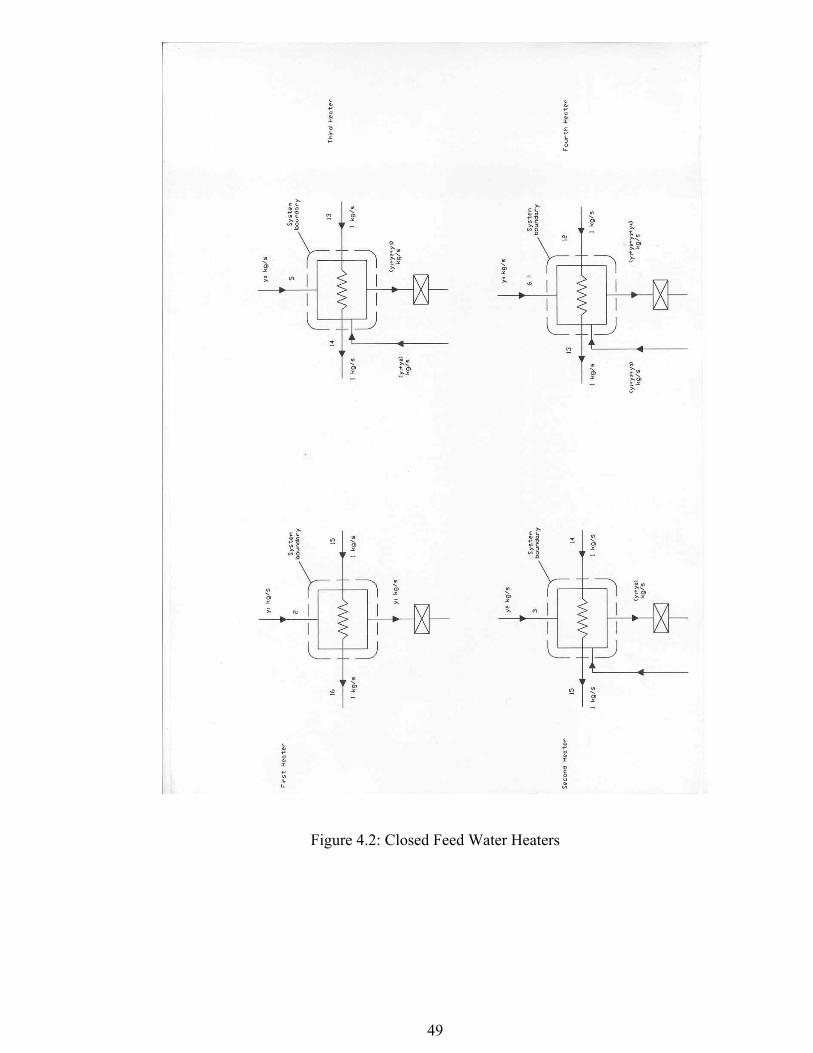
A visualisation of the energy balance for each feed heater is provided in
Figures 4.2 and 4.3 at the end of this chapter. The resulted values of y1, y2, y3, y4, y5
40
and y6 are imported to evaluate the thermodynamic efficiency of the operating cycle.
This estimation though cannot be performed directly as it is comprised by a series of
intermediate calculations that must be executed, following a step-by-step pattern,
which will eventually deliver the anticipated results. The step-by-step approach is
initiated by calculating the Power Output per unit mass flow rate from the boiler:
Power Output per unit mass flow rate from the boiler (kW per kg/s steam flow) =
(h1-h2) + (h2-h3) * (1-y1) + (h3-h4) * (1-y1-y2) + (h5-h6) * (1-y1-y2-y3) + (h6-h7) * (1-
y1-y2-y3-y4) + (h7-h8) * (1-y1-y2-y3-y4-y5) + (h8-h9) * (1-y1-y2-y3-y4-y5-y6) (eq. 4.8)
The required steam flow from the boiler to give a power output of 10 MW:
Boiler Steam Flow Rate (kg/s) = 10000/ Power Output per unit mass flow rate from
the boiler (eq. 4.9)
The Specific Steam Consumption is also calculated:
Specific Steam Consumption (kg/kWh) = 3600/ Power Output per unit mass flow
rate from the boiler (eq. 4.10)
The heat supplied in the boiler per unit mass flow rate (kW per kg/s) is:
(h1-h16) + (h5-h4) * (1-y1-y2) (eq. 4.11)
The cycle efficiency is provided by the equation:
Cycle Efficiency = Power Output per unit mass flow rate from the boiler / Heat
supplied in the boiler per unit mass flow rate (eq. 4.12)
For the case of no bleed steam for feed heating, the power output per unit mass
flow rate (kW per kg/s) is alternated to:
(h1-h4) + (h5-h9) (eq. 4.13)
The Specific Steam Consumption and the Cycle Efficiency can then be re-evaluated.
41
For the cases where for all the closed feed heaters the temperature of the feed
water leaving the heater is 3K and 7K below the saturation pressure of the bleed
steam the same methodology is taking place to calculate the Cycle Efficiency.
The Generator/Gearbox thermodynamic efficiency loss is accounted at 10%
and must be taken under consideration in the calculation of the overall plant
efficiency:
Overall Plant Efficiency (%) = Cycle Efficiency * 0.9 (eq. 4.14)
Process:
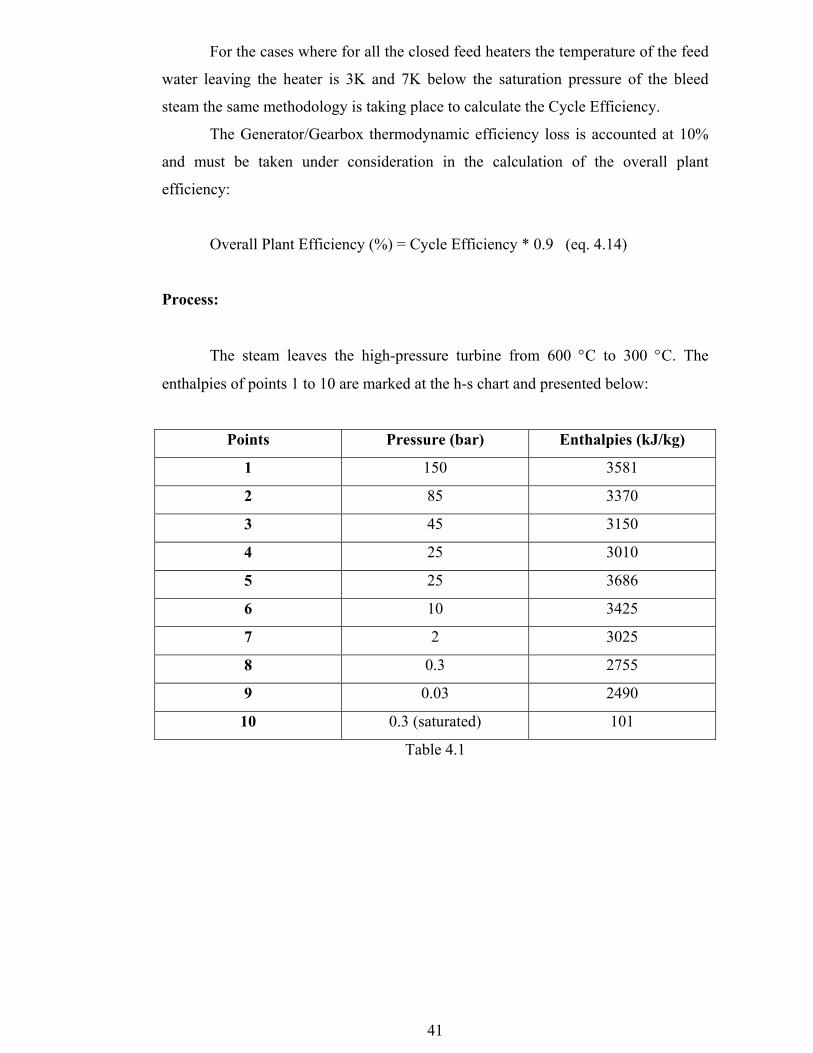
The steam leaves the high-pressure turbine from 600 °C to 300 °C. The
enthalpies of points 1 to 10 are marked at the h-s chart and presented below:
Points Pressure (bar) Enthalpies (kJ/kg)
1 150 3581
2 85 3370
3 45 3150
4 25 3010
5 25 3686
6 10 3425
7 2 3025
8 0.3 2755
9 0.03 2490
10 0.3 (saturated) 101
Table 4.1
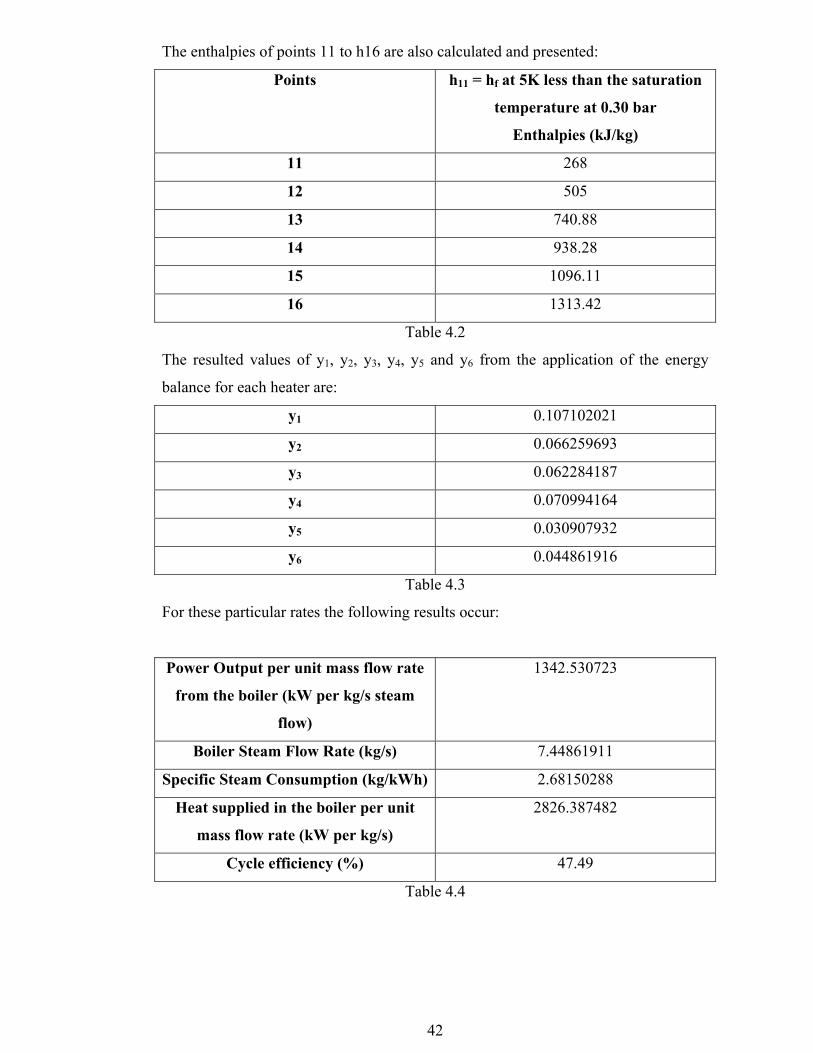
42
The enthalpies of points 11 to h16 are also calculated and presented:
Points h11 = hf at 5K less than the saturation
temperature at 0.30 bar
Enthalpies (kJ/kg)
11 268
12 505
13 740.88
14 938.28
15 1096.11
16 1313.42
Table 4.2
The resulted values of y1, y2, y3, y4, y5 and y6 from the application of the energy
balance for each heater are:
y1 0.107102021
y2 0.066259693
y3 0.062284187
y4 0.070994164
y5 0.030907932
y6 0.044861916
Table 4.3
For these particular rates the following results occur:
Power Output per unit mass flow rate
from the boiler (kW per kg/s steam
flow)
1342.530723
Boiler Steam Flow Rate (kg/s) 7.44861911
Specific Steam Consumption (kg/kWh) 2.68150288
Heat supplied in the boiler per unit
mass flow rate (kW per kg/s)
2826.387482
Cycle efficiency (%) 47.49
Table 4.4
43
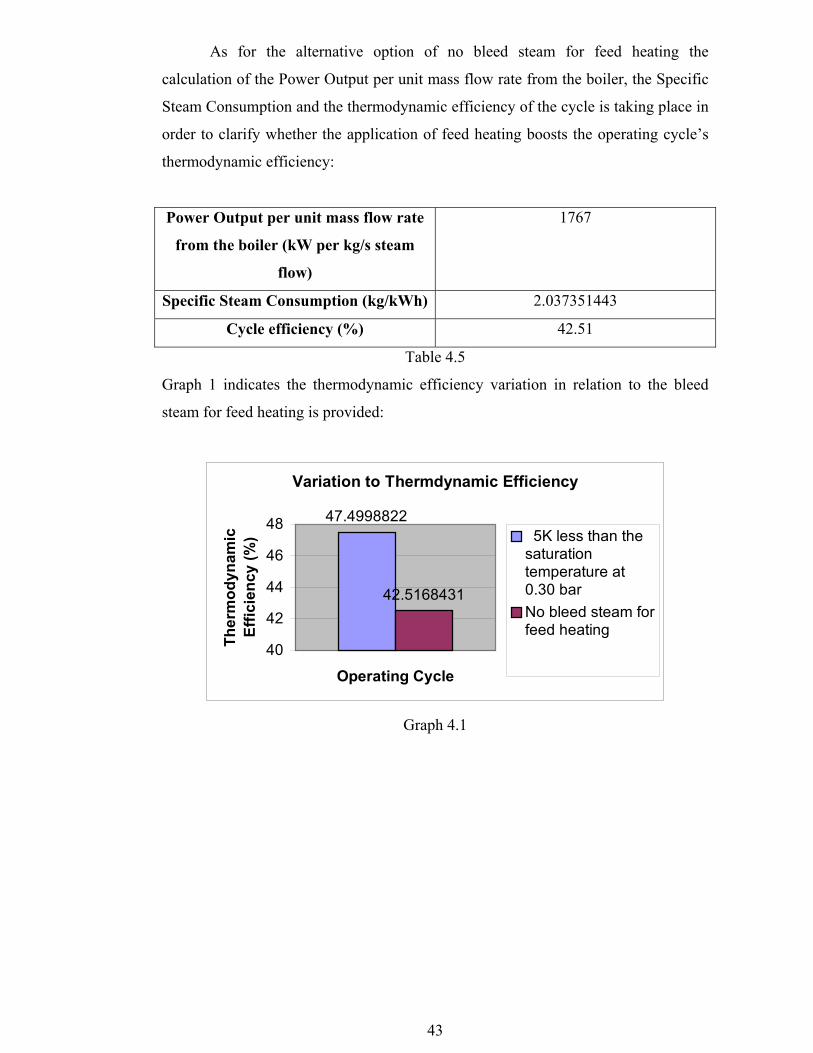
As for the alternative option of no bleed steam for feed heating the
calculation of the Power Output per unit mass flow rate from the boiler, the Specific
Steam Consumption and the thermodynamic efficiency of the cycle is taking place in
order to clarify whether the application of feed heating boosts the operating cycle’s
thermodynamic efficiency:
Power Output per unit mass flow rate
from the boiler (kW per kg/s steam
flow)
1767
Specific Steam Consumption (kg/kWh) 2.037351443
Cycle efficiency (%) 42.51
Table 4.5
Graph 1 indicates the thermodynamic efficiency variation in relation to the bleed
steam for feed heating is provided:
Variation to Thermdynamic Efficiency
47.4998822
42.5168431
40
42
44
46
48
Operating Cycle
Ther
mod
ynam
ic
Effic
ienc
y (%
) 5K less than thesaturationtemperature at0.30 bar No bleed steam forfeed heating
Graph 4.1
44
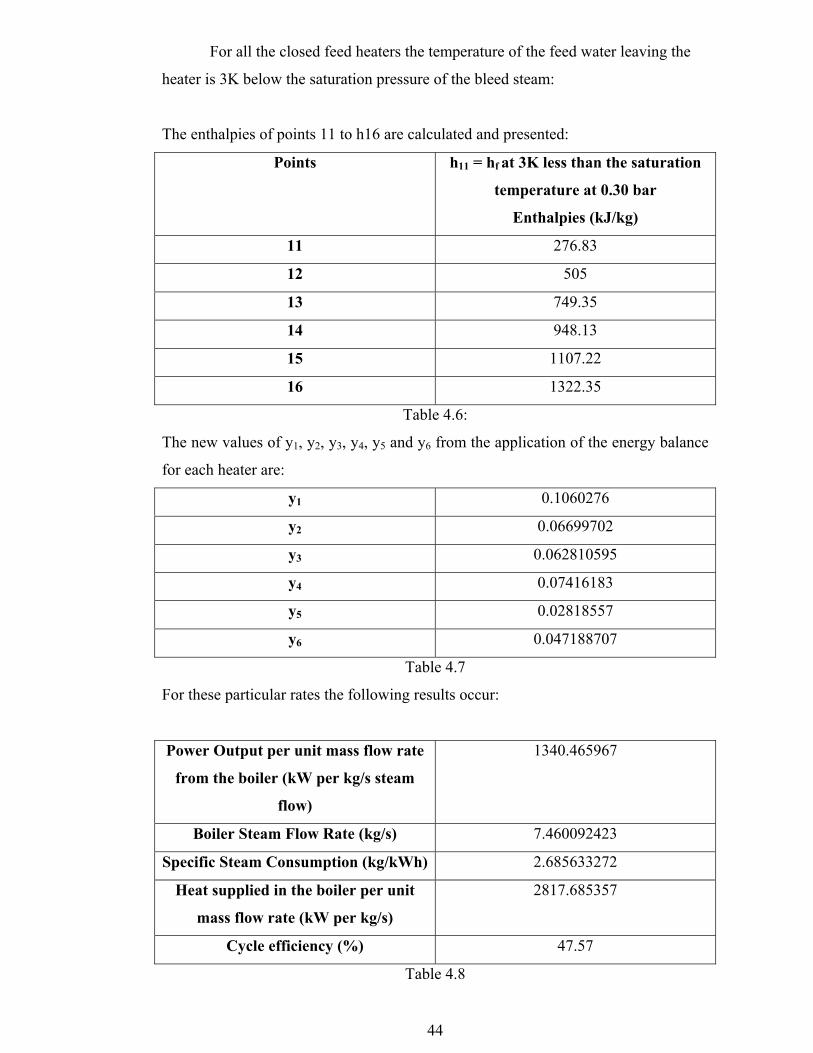
For all the closed feed heaters the temperature of the feed water leaving the
heater is 3K below the saturation pressure of the bleed steam:
The enthalpies of points 11 to h16 are calculated and presented:
Points h11 = hf at 3K less than the saturation
temperature at 0.30 bar
Enthalpies (kJ/kg)
11 276.83
12 505
13 749.35
14 948.13
15 1107.22
16 1322.35
Table 4.6:
The new values of y1, y2, y3, y4, y5 and y6 from the application of the energy balance
for each heater are:
y1 0.1060276
y2 0.06699702
y3 0.062810595
y4 0.07416183
y5 0.02818557
y6 0.047188707
Table 4.7
For these particular rates the following results occur:
Power Output per unit mass flow rate
from the boiler (kW per kg/s steam
flow)
1340.465967
Boiler Steam Flow Rate (kg/s) 7.460092423
Specific Steam Consumption (kg/kWh) 2.685633272
Heat supplied in the boiler per unit
mass flow rate (kW per kg/s)
2817.685357
Cycle efficiency (%) 47.57
Table 4.8
45
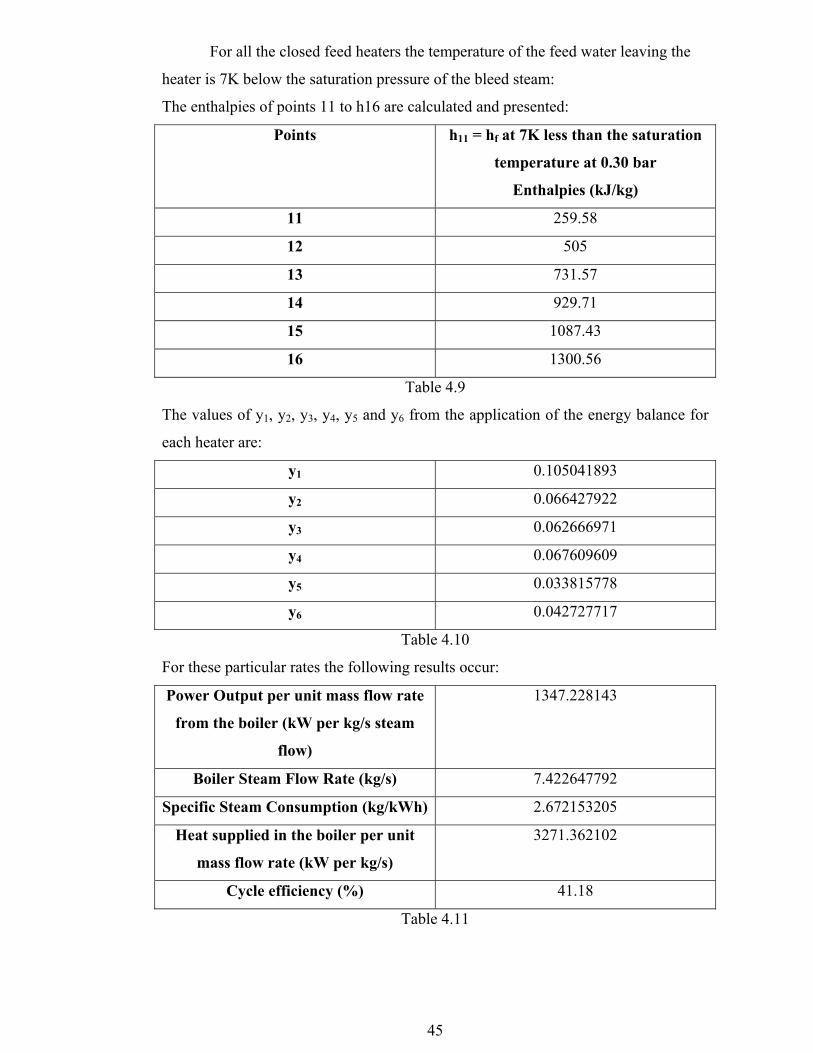
For all the closed feed heaters the temperature of the feed water leaving the
heater is 7K below the saturation pressure of the bleed steam:
The enthalpies of points 11 to h16 are calculated and presented:
Points h11 = hf at 7K less than the saturation
temperature at 0.30 bar
Enthalpies (kJ/kg)
11 259.58
12 505
13 731.57
14 929.71
15 1087.43
16 1300.56
Table 4.9
The values of y1, y2, y3, y4, y5 and y6 from the application of the energy balance for
each heater are:
y1 0.105041893
y2 0.066427922
y3 0.062666971
y4 0.067609609
y5 0.033815778
y6 0.042727717
Table 4.10
For these particular rates the following results occur:
Power Output per unit mass flow rate
from the boiler (kW per kg/s steam
flow)
1347.228143
Boiler Steam Flow Rate (kg/s) 7.422647792
Specific Steam Consumption (kg/kWh) 2.672153205
Heat supplied in the boiler per unit
mass flow rate (kW per kg/s)
3271.362102
Cycle efficiency (%) 41.18
Table 4.11
46
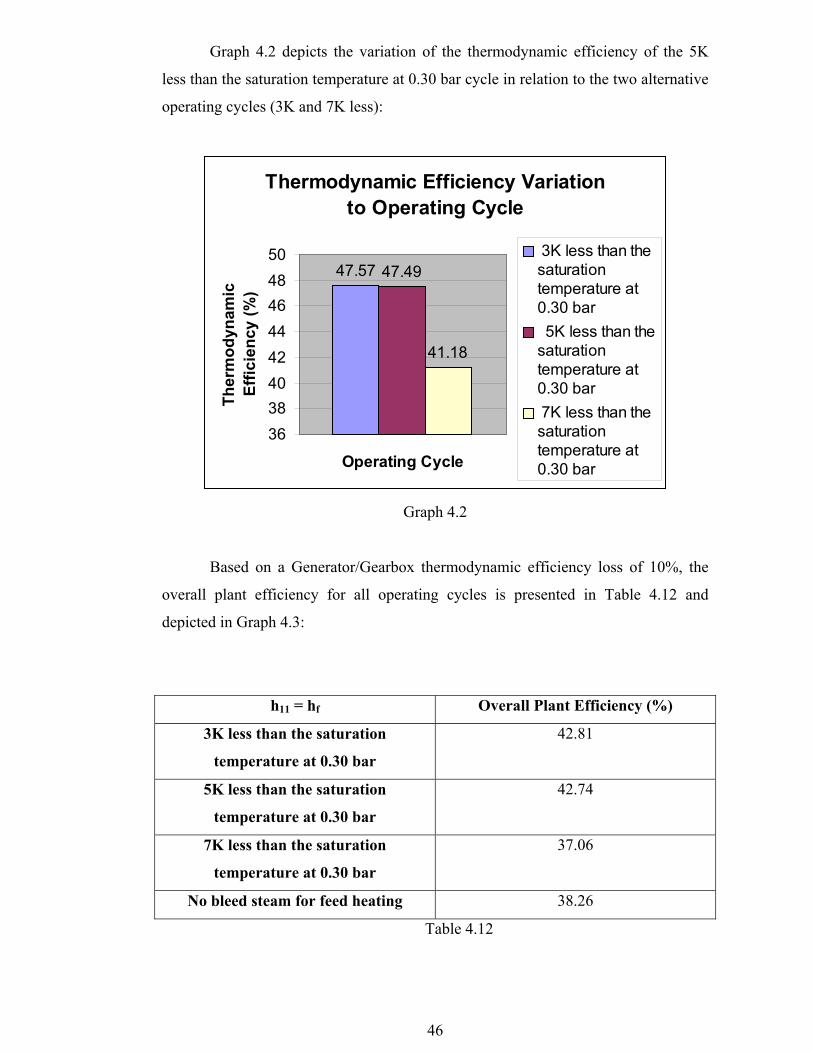
Graph 4.2 depicts the variation of the thermodynamic efficiency of the 5K
less than the saturation temperature at 0.30 bar cycle in relation to the two alternative
operating cycles (3K and 7K less):
Thermodynamic Efficiency Variation to Operating Cycle
47.57 47.49
41.18
3638404244464850
Operating Cycle
Ther
mod
ynam
ic
Effic
ienc
y (%
) 3K less than thesaturationtemperature at0.30 bar 5K less than thesaturationtemperature at0.30 bar 7K less than thesaturationtemperature at0.30 bar
Graph 4.2
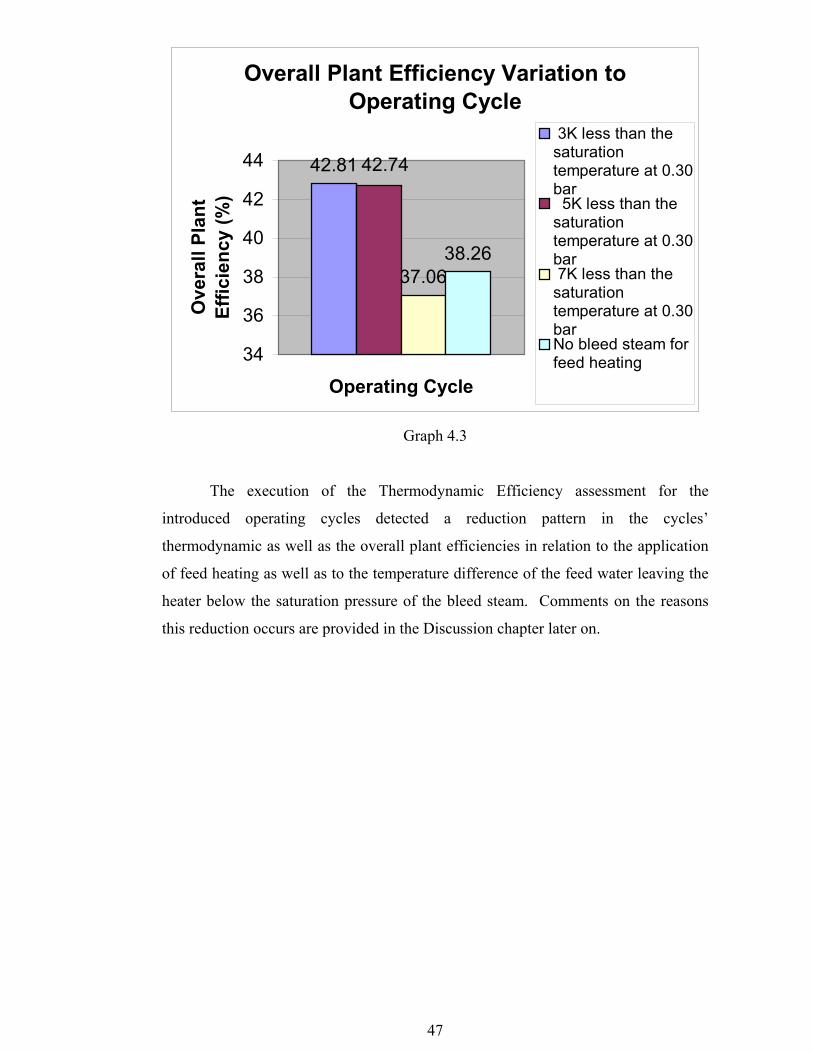
Based on a Generator/Gearbox thermodynamic efficiency loss of 10%, the
overall plant efficiency for all operating cycles is presented in Table 4.12 and
depicted in Graph 4.3:
h11 = hf Overall Plant Efficiency (%)
3K less than the saturation
temperature at 0.30 bar
42.81
5K less than the saturation
temperature at 0.30 bar
42.74
7K less than the saturation
temperature at 0.30 bar
37.06
No bleed steam for feed heating 38.26
Table 4.12
47
Overall Plant Efficiency Variation to Operating Cycle
42.81
37.0638.26
42.74
34
36
38
40
42
44
Operating Cycle
Ove
rall
Plan
t Ef
ficie
ncy
(%)
3K less than thesaturationtemperature at 0.30bar 5K less than thesaturationtemperature at 0.30bar 7K less than thesaturationtemperature at 0.30bar No bleed steam forfeed heating
Graph 4.3
The execution of the Thermodynamic Efficiency assessment for the
introduced operating cycles detected a reduction pattern in the cycles’
thermodynamic as well as the overall plant efficiencies in relation to the application
of feed heating as well as to the temperature difference of the feed water leaving the
heater below the saturation pressure of the bleed steam. Comments on the reasons
this reduction occurs are provided in the Discussion chapter later on.
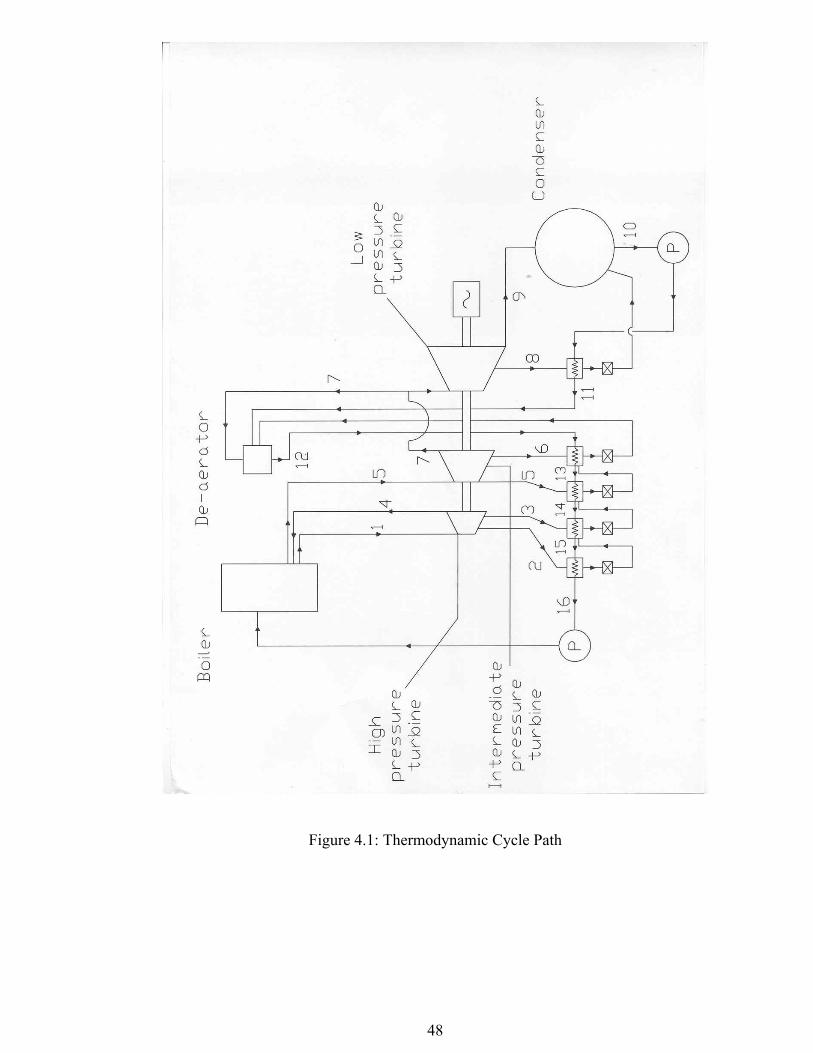
48
Figure 4.1: Thermodynamic Cycle Path
49
Figure 4.2: Closed Feed Water Heaters
50
Figure 4.3: Open Feed Water Heater
51
CHAPTER 5- Economics
Introduction
The aim of the economic assessment is to establish whether or not the
development of a 10 MW MSW combustion plant for the area of Athens, Greece
would be a profitable investment under the current Energy Law and financial trends
and barriers that are in force. The key feature of the analysis is the quantification of
the Capital and Operational Costs for the combustion plant. A detailed breakdown of
all financial factors, relating to the development and operation of the plant, is taking
place in order to ensure the highest level of accuracy in the resultant figures.
The employment of a cash flow chart enables the creation of channels
through which detailed forecasting can be made regarding the financial performance
of the potential project in relation to its operations and adaptability within the
standards established by the local Energy Law. The Net Present Value and Internal
Rate of Return are the standardised financial tools used by engineers to perform such
feasibility assessments. In this case, they are employed in order to clarify whether or
not this potential project would have financial benefits for the investors.
Net Present Value (NPV):
NPV is an approach used in capital budgeting where the present value of cash
inflow is subtracted from the present value of the cash outflows. NPV compares the
value of a currency today with the value of that same currency in the future, after
taking into account inflation and return. If the NPV of a prospective project is
positive, then it should be economically viable. However, if it is negative, then the
project should probably be rejected, as cash flows may be negative.
Internal Rate of Return (IRR):
For an investment that requires and produces a number of cash flows over
time, the internal rate of return is defined to be the discount rate that makes the net
52
present value of those cash flows equal to zero. Given that definition, IRR is defined
by the equation:
NPV (C, t, IRR) =0 (eq. 5.1)
There is no closed-form solution for IRR, in general, it is calculated
iteratively, employing a trial-and-error process. Selecting a value for IRR and
inserting it into the NPV calculation generates a value for NPV relatively close to
zero. Based on this method, picking different IRR values and repeating the process
until the NPV is as close to zero as possible focuses the IRR range to a singular
value.
Public Power Corporation (PPC):
The Public Power Corporation of Greece was established in 1950 with the
aim of mapping out and implementing a national energy policy, which through the
intense exploitation of domestic resources would make electrical power the property
and right of all Greek citizens. Since January 2001, PPC operates as an S.A
company, listed on the Athens and London Stock Exchanges on December 2001.
Today PPC S.A. is Greece’s largest power generation company and the country’s
sole producer supply company, providing electricity to approximately 6.7 million
customers from a total population of 10 million in Greece. PPC is also the sole
company with a fully owned power transportation system in Greece. PPC owns the
97% of the installed power capacity in Greece, generated by lignite, oil and
hydroelectric stations, natural gas stations as well as wind and solar energy parks.
Today, PPC alone covers the country’s rapidly increasing power needs and is now
expanding its activities to other markets, such as telecommunications.
The deregulation of Greece’s energy market (February 2001) saw the
granting of power generation licenses to other companies and private bodies. Thus,
responsibility for power transportation was taken over by an independent company,
which was set up for that purpose, DESMHE S.A. (Manager of Greek Electric Power
Transportation System). Similarly, the overall control of the Greek Power System
53
(Power Generation, Transportation and Distribution) has now been taken up by RAE
(Regulating Authority for Energy).
PPC is the largest business in Greece in terms of assets. In 2002 the Company
recorded revenues increased by 11.2% to Euro 3.437 million and net income
increased by 157.9% to Euro 216 million. Total electrical power is generated in 98
privately-owned power stations, and is transported 10.330 km high voltage lines and
distributed to consumers via 200.989 km-long network.
(COMPANY REGISTERED OFFICE
PUBLIC POWER CORPORATION S.A.
30 CHALKOKONDYLI St.
10432 ATHENS, GREECE)
The Energy Law in Greece:
The current Energy Law came into force under the designation No. 2244 in
October of 1994. It’s content takes into account the energy production regulation
potential from sustainable sources and from conventional fuels and further
dispositions. Under this regulation, the energy production from any external party
outside of the state is obliged to fall in either one of the two following categories:
• As a self-producer connected or disconnected to the power grid, who
generates the energy in order to cover its operational needs and sells the
entire rest of the energy produced to PPC S.A.
• As an independent producer connected or disconnected to the power grid,
who buys energy from PPC to cover its operational needs and sells its entire
produced power to PPC S.A.
Both categories abide by a number of legislative barriers, which forbid any
deviations from these two established entities. Producers are obliged to sell the
produced energy to PPC S.A., which buys it in exclusive. A contract with a lifespan
of 10 years, which defines the charging of energy for self-producers or independent
producers, is signed with PPC S.A. and can be only re-negotiated after the passing of
the agreement’s duration. For a self-producer the selling of energy from sustainable
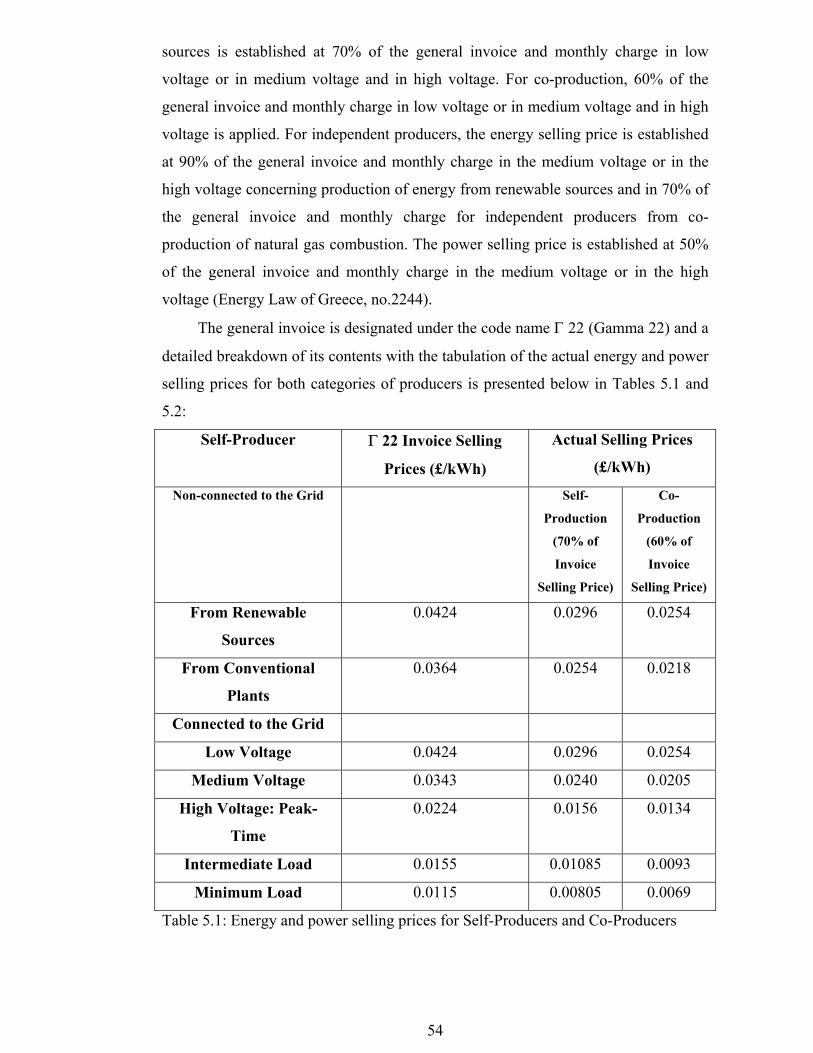
54
sources is established at 70% of the general invoice and monthly charge in low
voltage or in medium voltage and in high voltage. For co-production, 60% of the
general invoice and monthly charge in low voltage or in medium voltage and in high
voltage is applied. For independent producers, the energy selling price is established
at 90% of the general invoice and monthly charge in the medium voltage or in the
high voltage concerning production of energy from renewable sources and in 70% of
the general invoice and monthly charge for independent producers from co-
production of natural gas combustion. The power selling price is established at 50%
of the general invoice and monthly charge in the medium voltage or in the high
voltage (Energy Law of Greece, no.2244).
The general invoice is designated under the code name Γ 22 (Gamma 22) and a
detailed breakdown of its contents with the tabulation of the actual energy and power
selling prices for both categories of producers is presented below in Tables 5.1 and
5.2:
Self-Producer Γ 22 Invoice Selling
Prices (£/kWh)
Actual Selling Prices
(£/kWh)
Non-connected to the Grid Self-
Production
(70% of
Invoice
Selling Price)
Co-
Production
(60% of
Invoice
Selling Price)
From Renewable
Sources
0.0424 0.0296 0.0254
From Conventional
Plants
0.0364 0.0254 0.0218
Connected to the Grid
Low Voltage 0.0424 0.0296 0.0254
Medium Voltage 0.0343 0.0240 0.0205
High Voltage: Peak-
Time
0.0224 0.0156 0.0134
Intermediate Load 0.0155 0.01085 0.0093
Minimum Load 0.0115 0.00805 0.0069
Table 5.1: Energy and power selling prices for Self-Producers and Co-Producers
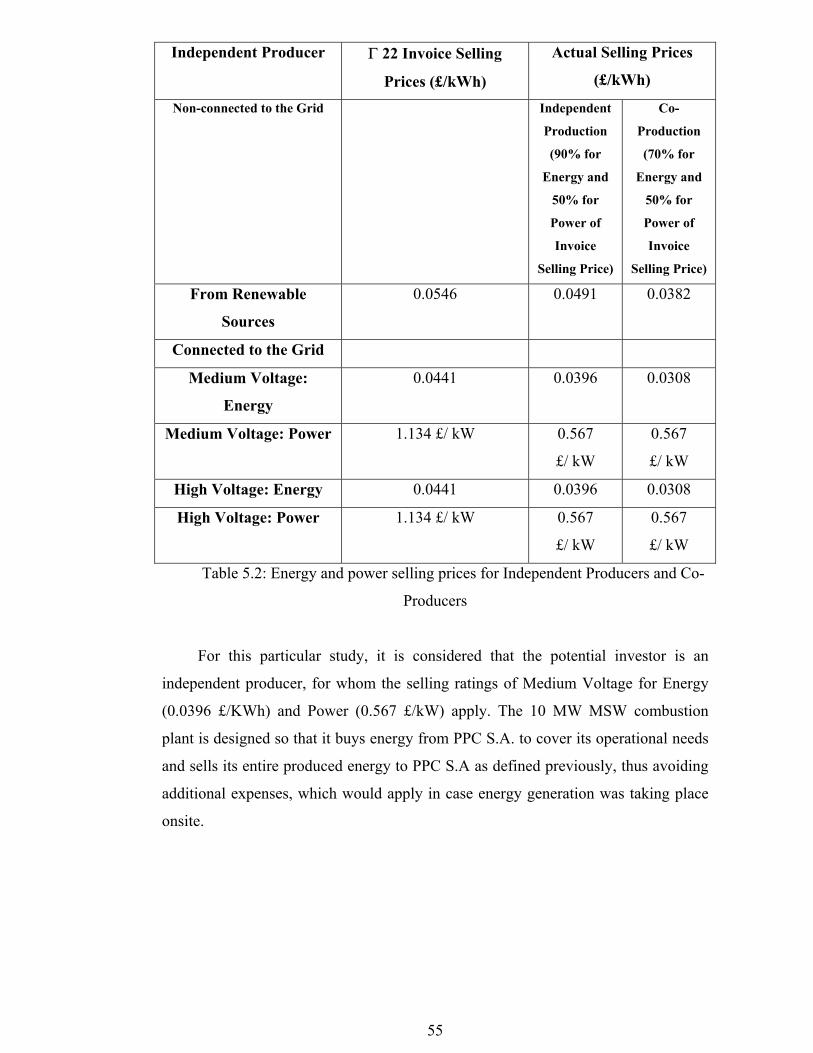
55
Independent Producer Γ 22 Invoice Selling
Prices (£/kWh)
Actual Selling Prices
(£/kWh)
Non-connected to the Grid Independent
Production
(90% for
Energy and
50% for
Power of
Invoice
Selling Price)
Co-
Production
(70% for
Energy and
50% for
Power of
Invoice
Selling Price)
From Renewable
Sources
0.0546 0.0491 0.0382
Connected to the Grid
Medium Voltage:
Energy
0.0441 0.0396 0.0308
Medium Voltage: Power 1.134 £/ kW 0.567
£/ kW
0.567
£/ kW
High Voltage: Energy 0.0441 0.0396 0.0308
High Voltage: Power 1.134 £/ kW 0.567
£/ kW
0.567
£/ kW
Table 5.2: Energy and power selling prices for Independent Producers and Co-
Producers
For this particular study, it is considered that the potential investor is an
independent producer, for whom the selling ratings of Medium Voltage for Energy
(0.0396 £/KWh) and Power (0.567 £/kW) apply. The 10 MW MSW combustion
plant is designed so that it buys energy from PPC S.A. to cover its operational needs
and sells its entire produced energy to PPC S.A as defined previously, thus avoiding
additional expenses, which would apply in case energy generation was taking place
onsite.

56
Methodology:
Initially, a detailed assessment of the capital and operational costs of the 10
MW MSW combustion plant over its 30 years of designed lifespan will be presented.
To complete the task, a designated breakdown of the plant components and
categorisation in terms of the apparatus tasks is attempted. The plant is divided into
six categories, which are presented below in Tables, including the constituent parts
from which they are comprised. This grouping enables evaluating the capital and
operational costs effectively and accurately:
Table 5.3: Fuel Handling, Storage and Preparation System
Air Injection System in
the combustion
Chamber
Feeding System Ash Disposing System
Air Filter Feed Chute Ash Burnout Grate
Forced Draft Fan Ram Feeder Shiftings Conveyor
Steam Air Heater Ram Extractor
Wind Box Bottom Ash Conveyors
Table 5.4: Water walled Furnace
Water walled Furnace
Table 5.5: Boiler and Feed Heating Systems
Boiler Feed Heating System
Super Heaters Closed Feed water Heaters (5)
Condenser Open Feed water Heater (1)
Economiser
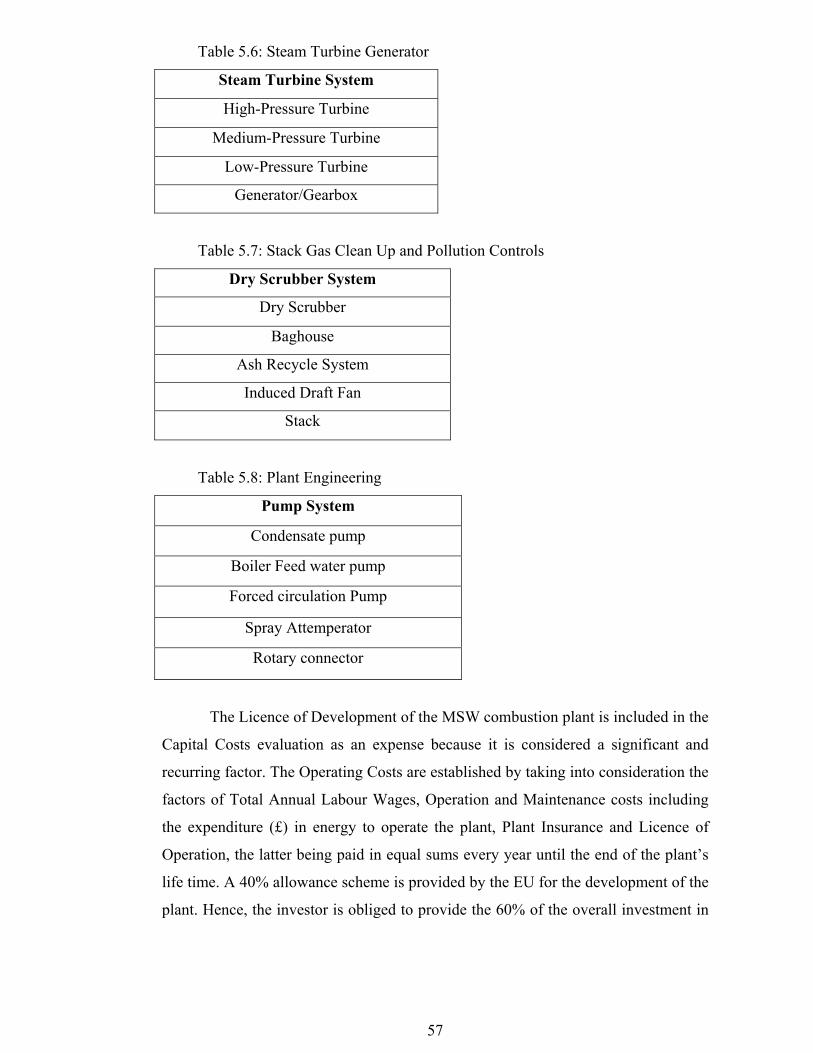
57
Table 5.6: Steam Turbine Generator
Steam Turbine System
High-Pressure Turbine
Medium-Pressure Turbine
Low-Pressure Turbine
Generator/Gearbox
Table 5.7: Stack Gas Clean Up and Pollution Controls
Dry Scrubber System
Dry Scrubber
Baghouse
Ash Recycle System
Induced Draft Fan
Stack
Table 5.8: Plant Engineering
Pump System
Condensate pump
Boiler Feed water pump
Forced circulation Pump
Spray Attemperator
Rotary connector
The Licence of Development of the MSW combustion plant is included in the
Capital Costs evaluation as an expense because it is considered a significant and
recurring factor. The Operating Costs are established by taking into consideration the
factors of Total Annual Labour Wages, Operation and Maintenance costs including
the expenditure (£) in energy to operate the plant, Plant Insurance and Licence of
Operation, the latter being paid in equal sums every year until the end of the plant’s
life time. A 40% allowance scheme is provided by the EU for the development of the
plant. Hence, the investor is obliged to provide the 60% of the overall investment in
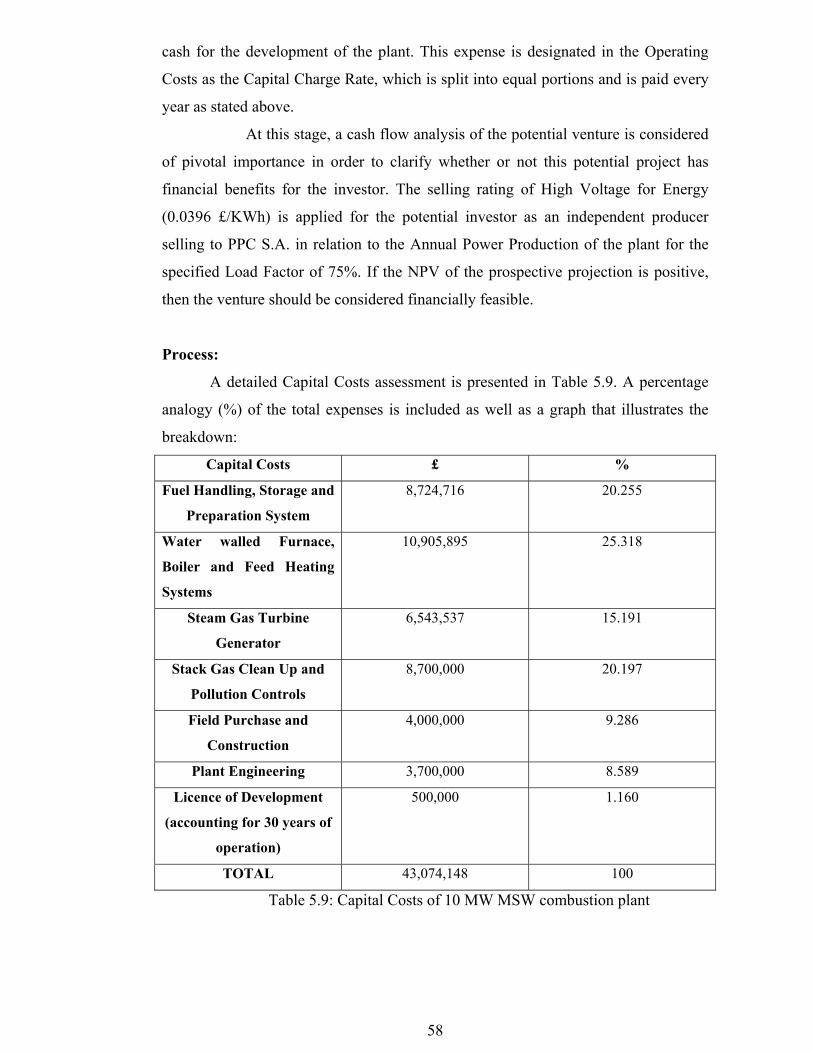
58
cash for the development of the plant. This expense is designated in the Operating
Costs as the Capital Charge Rate, which is split into equal portions and is paid every
year as stated above.
At this stage, a cash flow analysis of the potential venture is considered
of pivotal importance in order to clarify whether or not this potential project has
financial benefits for the investor. The selling rating of High Voltage for Energy
(0.0396 £/KWh) is applied for the potential investor as an independent producer
selling to PPC S.A. in relation to the Annual Power Production of the plant for the
specified Load Factor of 75%. If the NPV of the prospective projection is positive,
then the venture should be considered financially feasible.
Process:
A detailed Capital Costs assessment is presented in Table 5.9. A percentage
analogy (%) of the total expenses is included as well as a graph that illustrates the
breakdown:
Capital Costs £ %
Fuel Handling, Storage and
Preparation System
8,724,716 20.255
Water walled Furnace,
Boiler and Feed Heating
Systems
10,905,895 25.318
Steam Gas Turbine
Generator
6,543,537 15.191
Stack Gas Clean Up and
Pollution Controls
8,700,000 20.197
Field Purchase and
Construction
4,000,000 9.286
Plant Engineering 3,700,000 8.589
Licence of Development
(accounting for 30 years of
operation)
500,000 1.160
TOTAL 43,074,148 100
Table 5.9: Capital Costs of 10 MW MSW combustion plant
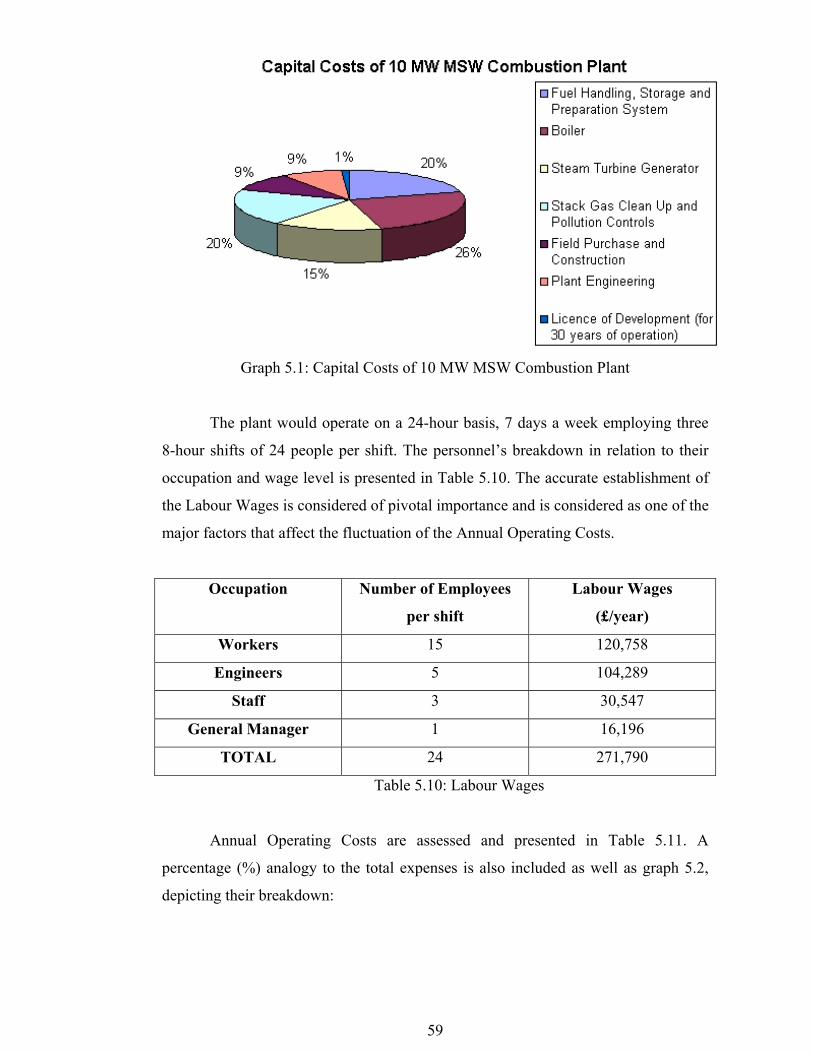
59
Graph 5.1: Capital Costs of 10 MW MSW Combustion Plant
The plant would operate on a 24-hour basis, 7 days a week employing three
8-hour shifts of 24 people per shift. The personnel’s breakdown in relation to their
occupation and wage level is presented in Table 5.10. The accurate establishment of
the Labour Wages is considered of pivotal importance and is considered as one of the
major factors that affect the fluctuation of the Annual Operating Costs.
Occupation Number of Employees
per shift
Labour Wages
(£/year)
Workers 15 120,758
Engineers 5 104,289
Staff 3 30,547
General Manager 1 16,196
TOTAL 24 271,790
Table 5.10: Labour Wages
Annual Operating Costs are assessed and presented in Table 5.11. A
percentage (%) analogy to the total expenses is also included as well as graph 5.2,
depicting their breakdown:
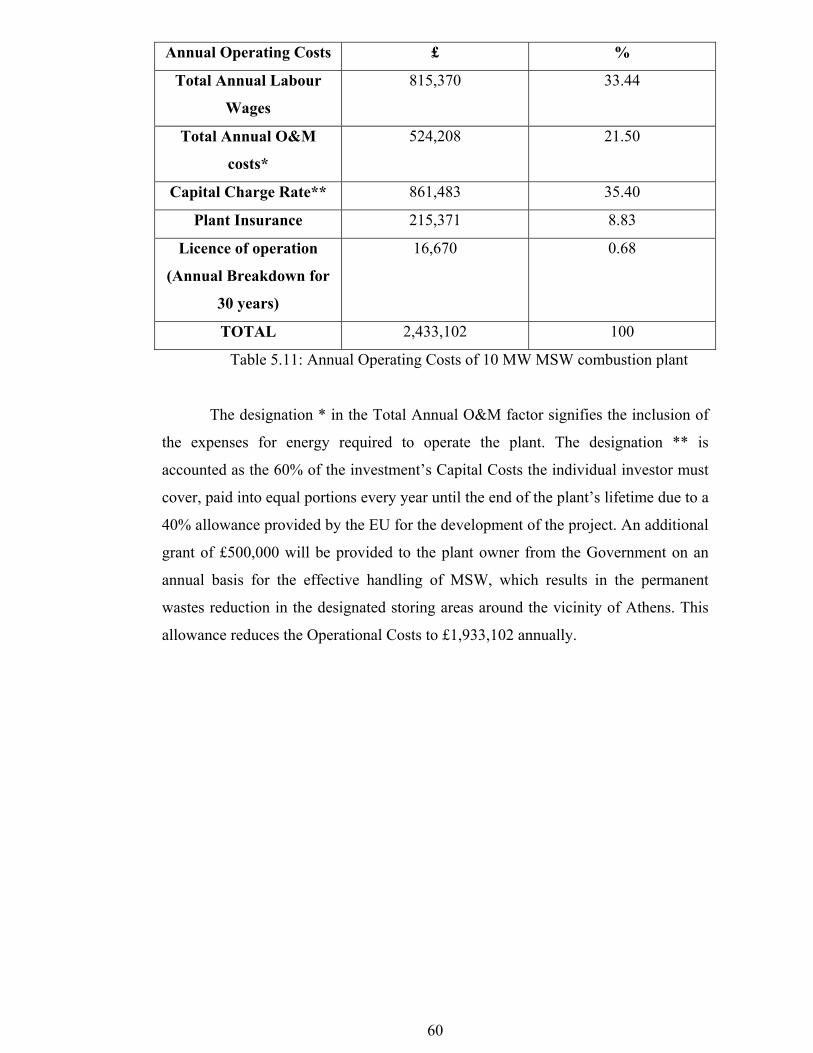
60
Annual Operating Costs £ %
Total Annual Labour
Wages
815,370 33.44
Total Annual O&M
costs*
524,208 21.50
Capital Charge Rate** 861,483 35.40
Plant Insurance 215,371 8.83
Licence of operation
(Annual Breakdown for
30 years)
16,670 0.68
TOTAL 2,433,102 100
Table 5.11: Annual Operating Costs of 10 MW MSW combustion plant
The designation * in the Total Annual O&M factor signifies the inclusion of
the expenses for energy required to operate the plant. The designation ** is
accounted as the 60% of the investment’s Capital Costs the individual investor must
cover, paid into equal portions every year until the end of the plant’s lifetime due to a
40% allowance provided by the EU for the development of the project. An additional
grant of £500,000 will be provided to the plant owner from the Government on an
annual basis for the effective handling of MSW, which results in the permanent
wastes reduction in the designated storing areas around the vicinity of Athens. This
allowance reduces the Operational Costs to £1,933,102 annually.
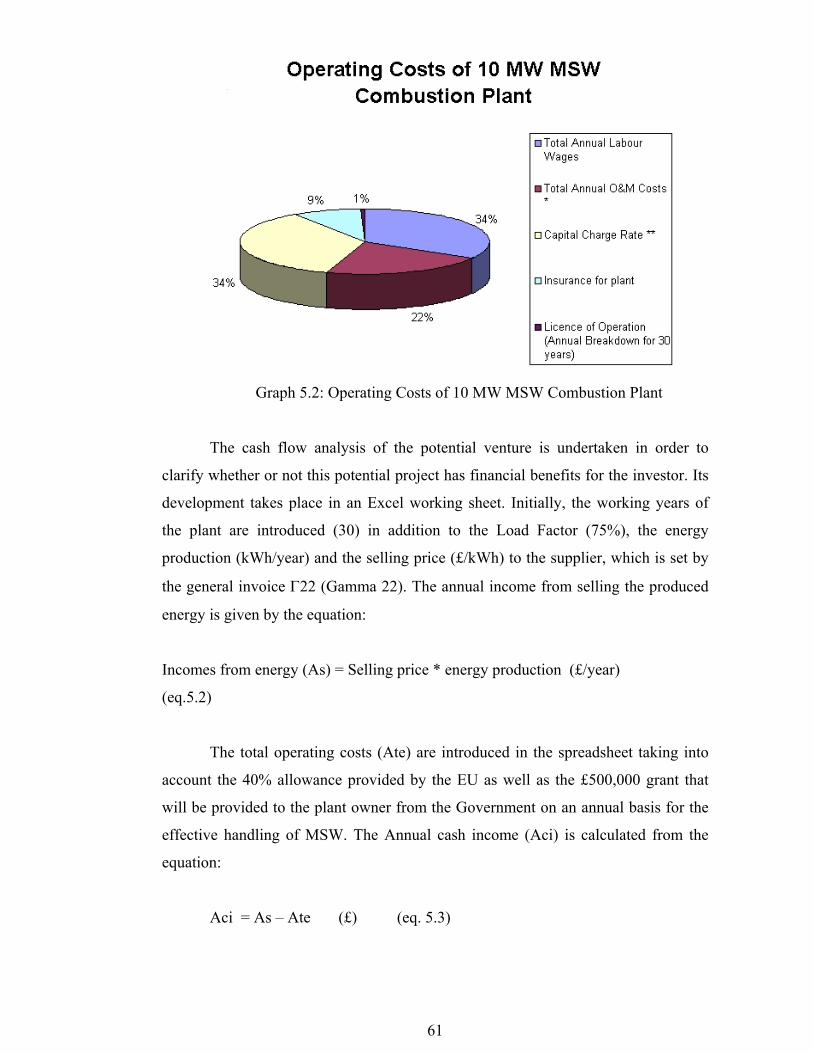
61
Graph 5.2: Operating Costs of 10 MW MSW Combustion Plant
The cash flow analysis of the potential venture is undertaken in order to
clarify whether or not this potential project has financial benefits for the investor. Its
development takes place in an Excel working sheet. Initially, the working years of
the plant are introduced (30) in addition to the Load Factor (75%), the energy
production (kWh/year) and the selling price (£/kWh) to the supplier, which is set by
the general invoice Γ22 (Gamma 22). The annual income from selling the produced
energy is given by the equation:
Incomes from energy (As) = Selling price * energy production (£/year)
(eq.5.2)
The total operating costs (Ate) are introduced in the spreadsheet taking into
account the 40% allowance provided by the EU as well as the £500,000 grant that
will be provided to the plant owner from the Government on an annual basis for the
effective handling of MSW. The Annual cash income (Aci) is calculated from the
equation:
Aci = As – Ate (£) (eq. 5.3)
62
The Tax charging (Ait) of 35 % applies in the annual cash income under the
current legislative instrument in force, assuming the company has issued shares in
the Stock Exchange market. In any other case the Tax charging would be accounted
at the 40% mark. The Net Annual cash income (Anci) is estimated as the value
occurring from the subtraction of the tax charged annual cash income from the
annual cash income:
Anci = Aci – Ait (£) (eq. 5.4)
At this point, the total capital costs (Atc) are introduced in the equation and
the annual net cash after tax (Acf) occurs as the resulted value of the subtraction of
the capital costs from the net annual cash income:
Acf = Anci – Atc (£) (eq. 5.5)
The discount rate (fd) is accounted at 10% for the investment and is
calculated for the number of operating years according to the equation:
fd = 1/(1+i)n , where i = 0.1 and n = 0,1,2,3….,30 (eq. 5.6)
The net annual discounted cash flow (Adcf) occurs as the product of the
discount rate times the annual net cash after tax for each year:
Adcf = fd * Acf (£) (eq. 5.7)
For this particular calculation, the value of the operating costs with a
negative sign convention is inserted at the year 0 slot in the spreadsheet.
The value of NPV is anticipated to be positive in the end of year 30, a fact,
which automatically signals the profitability of the investment. Furthermore, the
sooner the transition from a negative to a positive NPV rate occurs the better for the
investor. This alternation in NPV rates establishes that the break-even point is

63
reached, the investment costs are covered and hence profit is generated from that
particular moment until the end of the factory’s predicted lifespan. The detailed
breakdown of the cash flows in relation to the Annual Energy Production of the plant
for the specified Load Factor of 75% is presented in Table 5.12 on the next page:
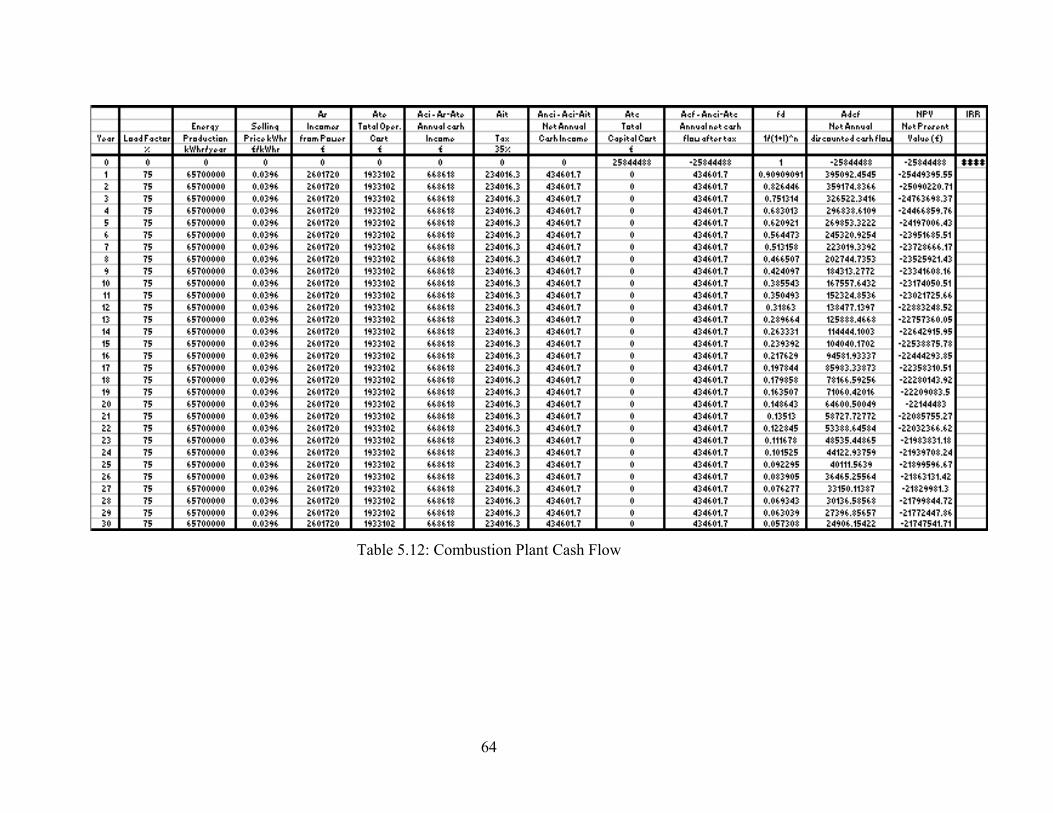
64
Table 5.12: Combustion Plant Cash Flow
65
CHAPTER 6- Environmental Impact
Introduction
A detailed analysis regarding emissions associated with the operation of the
MSW combustion plant is presented in this chapter focusing attention particularly at
the type of emissions (Nitrogen Oxides, Sulphur Compounds, Particulate Matter,
Carbon Monoxide, Carbon Dioxide) as well as the source from where they are
exhausted (boiler, steam turbine). Applicability of alleviation options like
combustion process emissions control, flue gas re-circulation and the dry scrubber
and bag house system’s performance are examined in depth in order to establish the
most efficient and environmentally-friendly operation of the MSW combustion plant.
Environmental Profile
The environmental friendliness of the 10 MW MSW combustion plant’s
operation is considered a factor of pivotal importance for the establishment of the
venture in the area of Athens. The Capital city of Greece hosts nearly 50% of the
total population of the country and a 60% of the country’s total industrial activity. It
becomes evident that in this fragile environmental system, although strong legislation
put into force in the recent years has successfully dealt with the various emissions
problems from local industry, a newly operating industrial site is obliged to uphold
the environmental standards in order to gain support from the government, other
political parties, local environmental groups and citizens alike. The last group
especially, has regarded the development of an MSW combustion plant in the area of
Athens with extreme hostility in the past insisting on the health dangers of the
emissions particulates as well as the quantities in which they are released in the
atmosphere by the MSW mass burning process.
66
Post-combustion derivatives of the 10 MW MSW combustion plant
The post-combustion derivatives of the MSW plant are a subject of particular
interest due to their character: it is considered that the mass burning combustion
reduces the MSW’s total weight by a rate of 75% and volume by a rate of 90%
leading to the formation of inert ash material (60% of the burnout weight
distribution) as well as fly ash material in a percentage rate of 40% of the burnout
weight distribution. Table 6.1 on the next page presents a detailed breakdown of
post-combustion products in relation to Plant Load Factor focusing particularly on
the 75% Load Factor scheme that is currently under investigation as the potential
investment. Ferrous materials comprise the 3% of the inert ash quantity and are
removed by a system employing magnets before the inert ash is deposited in a
specified collection area. This portion of inert ash can be collected regularly and sold
as a first class fertiliser to interested industries later on.
The portion of the fly ash that is generated from the mass burning combustion
has a code of handling and storing that is more complicated because of its constituent
products: Nitrogen Oxides (NOx), Sulphur Oxides (SOx), Particulate Matter (PM),
Carbon Monoxide (CO), Carbon Dioxide (CO2) as well as HCL, dioxins/furans,
heavy metals and organic constituents create a mixture that is hazardous for the
environment as well as for public health if released into the atmosphere unprocessed.
It is of pivotal importance to develop a system that processes and neutralises
these derivatives to the strict legislative standards that are in force in the current time,
in order to ensure the preservation of public health as well as the environmental
sustainability of the industrial site. To bring the project to fruition, a strategy
involving the detailed forecasting of the main sources of emissions exerted from an
MSW combustion plant as well as an investigation of emissions control codes and
practices currently employed into force is described in the following pages. A
discussion of the advantages of dry absorption on the path to the exhaust stack
through the operation of a dry scrubber system is undertaken with the aim to certify
the unit’s essential role in neutralising the hazardous derivatives.

67
Table 6.1: Breakdown of post-combustion derivatives in relation to Plant Load Factor
68
Boiler and Steam Turbine Emissions
The main sources of emissions exerted from an MSW combustion plant focus
on the steam turbine and the boiler operating at the plant. Steam turbine emissions
vary according to the source of the steam (MSW waste). Boiler emissions vary
depending on the synthesis of the fuel type (mostly organic waste combusted) as well
as local environmental conditions. Boiler emissions include Nitrogen Oxides (NOx),
Sulphur Oxides (SOx), Particulate Matter (PM), Carbon Monoxide (CO), Carbon
Dioxide (CO2).
Nitrogen Oxides (NOx):
The pollutant referred to as NOx , is a composite of nitric oxide (NO) mainly
and nitrogen dioxide (NO2) in variable composition. NOx is formed by three
mechanisms: thermal NOx, prompt NOx and fuel-bound NOx. Thermal and fuel-
bound formations are the predominant mechanisms encountered in industrial boilers.
Thermal NOx, formed when nitrogen and oxygen in the combustion combine in the
flame, comprises the majority of NOx, formed during the combustion of gases and
light oils. Fuel-bound NOx is associated with oil fuels and forms when nitrogen in the
fuel and oxygen in the combustion air react. The most significant factors establishing
the levels of NOx emissions from a boiler are the flame temperature and the amount
of nitrogen in the fuel. Equally influential factors are the air excess level during
combustion (at a maximum of 45%) and the combustion air temperature.
Sulphur Compounds (SOx):
Emissions of sulphur relate directly to the fuel’s sulphur content, and are not
dependent on the boiler size or the burner’s design. Sulphur dioxide (SO2) comprises
nearly 95% of the total quantity of sulphur emitted with the remaining 5% emitted
being sulphur trioxide (SO3). SOx are generally considered dangerous pollutants due
to their reaction with water vapour, which leads to the formation of sulphuric and
69
acid mist, which is extremely corrosive in its air-, water-, and soil borne forms. Some
types of MSW contain quantities of sulphur released during combustion.
Particulate Matter (PM):
PM emissions are dependent on the boiler’s grade and consist of many
different compounds such as nitrides, sulphates, carbons, oxides and other
incombustible fuel elements. For industrial boilers the most effective method of PM
control lies in the use of high-grade fuel and the ensuring of a proper burner set-up,
adjustment and maintenance.
Carbon Monoxide (COx):
CO forms during combustion when carbon in the fuel oxidizes incompletely,
ending up as CO instead of the expected CO2. Older boilers possess higher levels of
CO in general than newer equipment because of the fact that older designs do not
have CO control schemes. Poor burner designing and firing conditions are primarily
responsible for the high levels of CO boiler emissions. Proper burner maintenance
maintenance and regular equipment upgrading as well as using an oxygen control
package can control CO emissions successfully.
Carbon Dioxide (CO2):
Although CO2 is not generally considered a pollutant in the sense of affecting
public health, its emissions are considered here due to its contribution to global
warming. Atmospheric warming occurs due to the penetration of solar radiation to
the surface of the Earth. Infrared radiation is absorbed from the CO2 in the
atmosphere, which as a result in creases the atmosphere’s temperature. The amount
of CO2 emitted is in direct relation to the fuel synthesis and the system efficiency.
70
Boiler Emissions Control Options – NOx
NOx control has been the primary focus of extensive research on emission
control and development in boilers. The following methods comprise the most
prominent strategies for emission control approaches employed currently or
anticipated to be employed successfully in the future.
• Combustion Process Emissions Control:
Combustion control techniques feature a more satisfactory financial incentive
than post-combustion control methods and are used on industrial boilers for NOx
control. Combustion temperature controlling has been the principal focus of
combustion process control in boilers. Combustion control requires tradeoffs- high
temperatures favour complete burn up of the fuel and low residual hydrocarbons and
CO, but end up forming NOx particulates. A lean combustion dilutes the combustion
process and reduces combustion temperatures and consecutively NOx formation,
allowing a higher compression ratio or peak firing pressures, which result a higher
overall efficiency. There is a danger though, if the mixture is too lean, of misfiring
and occurrence of an incomplete combustion that produces increasing rates of CO
and VOC emissions.
• Flue Gas Re-circulation (FGR):
FGR is considered one of the most effective methods in reducing NOx emissions
from industrial boilers to date. With FGR, a portion of the relatively cool boiler
exhausts gases re-enters the combustion process, reducing the flame temperatures
and the associated and inevitable NOx formation process. It is the most popular and
effective NOx reduction method for fire-tube and water-tube boilers, the second
configuration specifically applying to the case of the particular 10 MW plant under
research.
External FGR employs a fan to re-circulate the flue gases into the flame, with
external pipe work carrying the gases from the stack to the burner. A valve
71
responding to boiler input controls the re-circulation rate. Induced FGR relies on the
combustion air fan for flue gas re-circulation. Via ducts or via internal flow, a
proportion of the gases is taken to the air fan, where they are pre-mixed with
combustion air and are introduced into the flame in the burner. Induced FGR
employs a relatively uncomplicated and reliable integral design in newer boiler
configurations. The physical limit to NOx reduction via FGR is calculated at 80% in
natural gas-fired and MSW-fired boilers.
• Low Excess Air Firing (LAE):
Excess air is a means of ensuring complete combustion in the interior of the
water walled combustor. Greater excess air levels than 45% can lead to the formation
of thermal NOx due to the combination of the excess nitrogen and oxygen in the
combustion air entering the flame. Low excess firing results the limiting of the
excess air that enters the combustion process, reducing the amounts of nitrogen and
oxygen that eventually enters the flame. Burner design modification accomplishes
this and optimisation employs oxygen trim controls. LAE aids to reduce the overall
NOx emissions at a range of 5% to 10%.
• Burner Modifications:
Modifying the standard burner design in order to create a larger flame achieves
lower flame temperatures and results in a lower thermal NOx formation. While most
boiler types and sizes can accommodate modifications in their burners, it is more
effective for boilers firing natural gas, air and distillate fuel oils, with little
effectiveness in heavy oil-fired boilers. Burner modifications should be
complemented with other NOx reduction methods (e.g. flue gas re-circulation) in
order to comply with the demanding environmental regulations. Positive impact on
boiler operating parameters such capacity, turndown, CO levels and efficiency can
materialize by achieving low NOx levels through burner modifications.
72
• Water/Steam Injection:
Lowering of thermal NOx formation in conjunction with overall NOx emission
rates is achieved if water or steam is injected into the flame, thus reducing the flame
temperature. However, the drawback of this method is that it can lower the boiler
efficiency by a fraction of 3% to 10%. There is also a practical limit concerning the
amount of water or steam that can be injected without causing condensation-related
problems. This particular method is used regularly in conjunction with the burner
modification technique and its application can result NOx reduction of up to 80%.
Post-Combustion Emissions Control
There are a number of techniques for exhaust gas treatment that can be
applied to industrial boilers.
• Selective Catalytic Reduction (SCR):
This particular technology involves the injection of a reducing agent into the
boiler exhaust gas in the presence of a catalyst. The reducing agent is allowed to
operate by the catalyst at lower exhaust temperatures than SNCR, in the range of 260
°C to 650 °C depending of the type of the catalyst. NOx reductions up to a limit of
90% are achievable by adopting this process. The two most-commercially-used
agents are ammonia and aqueous urea. Urea decomposes in the hot exhaust and SCR
reactor, releasing ammonia. An approximation of 0.9 to 1.0 moles of ammonia is
required per mole of NOx at the SCR reactor’s inject inlet in order to achieve 80 to
90% NOx reduction. The drawbacks of SCR are focused on the fact that on-site
storage of ammonia is required, which is a hazardous chemical and can slip through
the process unreacted.
73
• Selective Non-Catalytic Reduction (SNCR):
In boiler SNCR, ammonia or urea are inserted as reducing agents in the boiler
exhaust gases at a temperature ranging from 760 to 870 °C. The aim is to break down
the NOx in the exhaust gases to water and atmospheric nitrogen. However one
problem of SNCR is that in order to reduce the industrial boilers’ NOx emissions at a
rate of 70% the agent must be introduced at a specific flue gas temperature.
Furthermore, the location of the exhaust gases at the necessary temperature is
constantly changing in a cycling boiler, which makes this method inappropriate for
some types of boilers.
Boiler Emissions Control Options – SOx
The most commonly applied method for controlling SOx emissions is
dispersion via a tall stack in order to limit ground level emissions. However, the
demanding SOx emissions legislative requirements in force now imply the use of
reduction methods. These include the use of low in sulphur apportionment fuel,
desuphurising fuel and flue gas desulphurisation (FGD). The application of low in
sulphur apportionment fuels is the most cost effective SOx control method for
industrial boilers, mainly because it does not require installation and maintenance of
specialised equipment.
FGD systems are divided in two categories: regenerable and non-regenerable.
The most common non-regenerable result in a waste product that requires proper
disposal. Regenerable FGD converts the waste product into a sellable product such as
sulphuric acid. SOx emissions are reduced by 95% by the application of the FGD
method.
The advantages of dry absorption on the path to the exhaust stack
Dry processing of gaseous effluents features the injection of reagents in dry
powder form aiming to neutralise acid gases such as HF, SO2, HCL or to captivate
volatile heavy metals such as Hg, Cd, Se, As or organic components such as
74
dioxins/furans, PCB’s and PAH’s. A ceramic barrier filter is employed as the
medium through which the separation of salts and contaminated absorbents as well
as the dust takes place. In order to create a broad-spectrum absorbent, the dry powder
is selectively blended. Calcium chloride Ca(OH2) is commonly used for acid gas
removal. Active carbon is also used for the adsorption of volatile matter and heavy
metals.
Calcium chloride Ca(OH2) is used for some time in removing acid pollutants
from post-incineration flue gases. The following reactions explain its application:
Ca(OH2) + 2HF CaF2 + 2H2O
Ca(OH2) + 2HCL CaCl2 + 2H2O
Ca(OH2) + 2SO2 + ½ O2 CaSO4 + 2H2O
The production of sulphate, calcium chloride and calcium fluoride are the
direct derivatives (calcium based salts) from the neutralisation of the acid gases. The
of Calcium chloride performance is dependant on the temperature, moisture content,
the excess dosing rate and the specific surface area of the reagent. Applying the latest
reagents in a dosing rate of three times the stoichiometric ratio, the removal
efficiencies can reach up to 99% for HF and HCL and 95% for SO2. The
stoichiometric ratio accounts as the theoretically necessary quantity of reagent for
neutralisation.
Activated carbon can also be employed in order to remove environmentally
toxic pollutants such as heavy metals and organic constituents. During the process,
activated carbon is mixed with a ‘carrier’ inert material, most commonly Ca(OH2), in
order to raise the smouldering point of pure activated carbon and to facilitate the
handling of the mixed reagent. The excess dosing rate for carbon is dependant on the
waste input as well as the emissions standards that require to be met.
75
CHAPTER 7- Discussion
Determining the viability of the potential development of the 10 MW MSW
combustion plant for the area of Athens, Greece is a difficult task to accomplish.
Extensive research on the data collected and evaluated in previous sections needs to
be performed in order to reach a cohesive and objective verdict.
From the outset is established that the 10 MW MSW combustion plant load
factor limit of 75% would be achieved by the combustion of 125,152 tonnes of MSW
on a yearly basis. This accounts for almost 8.5% of the quantity of MSW dumped in
designated areas around Athens per year. Although this percentage creates a positive
momentum regarding the potential of the full utilisation of the MSW source for
Athens, the rate of Annual kWh production for the current scheme cannot be
considered satisfactory in relation to the quantity of raw material combusted. It was
expected that a rather higher Annual kWh production rate could be achieved and this
realisation leads to the question why is that not the case.
A review of the Btu/kg rates for the MSW components (Table 3.11) in terms
of the Average % per kg (Table 3.4) provides an answer on why this implication
exists for the current case: The MSW source used for energy generation comprises
50% of Organic material, which, as an element, does not posses a high thermal
content (295.8 Btu/kg) compared with paper and plastics. Particularly for the last two
components their thermal content is established at 5381.89 Btu/kg and 2565.12
Btu/kg equivalent, their low Average % per kg rates though reduce the Average
thermal content rate of the combusted MSW in its total, providing a raw material that
is not very efficient, unless it is used in bulk quantities during combustion.
The evaluation of the thermodynamic cycle efficiency was a task of pivotal
importance to the study, involving an extensive quantitative analysis that is due to
the plant’s complex set-up. At this particular industrial site, an array of feed heaters
(open and closed), an extraction turbine as well as other devices are employed,
aiming to boost the overall thermodynamic efficiency. The operation of the unit is
established in a high-pressure cycle involving six stages of feed heating, the feed
water leaving the open heater at the saturation temperature corresponding to the
saturation temperature of the bleed steam. For the closed feed heaters, the
76
temperature of the feed water leaving the heater is 5K below the saturation pressure
of the bleed steam. The introduction of the high-pressure cycle scheme yields to a
better cycle efficiency and lower fuel costs over the lifespan of the plant, it is
anticipated however that this will imply a greater capital cost for the boiler system.
The thermodynamic efficiency of the cycle calculated based on the above-
mentioned parameters, yields a percentage of 47.49% before utilisation through the
Generator/Gear box apparatus, which is considered satisfactory taking into
consideration the plant’s operational constraints and level of complexity. For the case
where no feed heating applies, it was shown that the thermodynamic efficiency of the
cycle is reduced considerably (42.51%) although the power output per unit mass flow
rate from the boiler was shown to have increased. The steam mass flow rate for this
case is 5.659 kg/s, this stresses the point that for a no feed heating scheme a smaller
boiler could be used. Alternatively, the thermodynamic efficiency increase yields a
reduction in fuel burned that results cash saving. On the assumption that this is great
enough to offset the boiler expenditure, feed heating is proved to be an economic and
ergonomically attractive proposition.
The secondary cycles featuring a temperature difference of 3Kand 7K for the
feed water leaving the heater below the saturation pressure of the bleed steam are
examined in order to identify potential variations in the thermodynamic efficiency of
the cycle. The execution of calculations deducts a thermodynamic efficiency of
47.57% for the 3K-temperature difference scheme and a thermodynamic efficiency
of 41.18% for the 7K-temperature difference scheme. This indicates that a decreasing
stream in the thermodynamic efficiencies is manifested as the temperature of the feed
water (in Kelvin) leaving the heater the saturation pressure of the bleed steam
increases. This information can be used as a general code of practice in improving
the thermodynamic efficiency of an MSW plant, although in the current case
couldn’t boost dramatically the thermodynamic efficiency rate of the primary cycle.
Taking into account the small thermodynamic efficiency loss in the
Generator/Gearbox, the overall plant efficiencies for all cycles examined are found to
follow a pattern, which remains faithful to the principles for the thermodynamic
efficiencies introduced above. The decreasing stream in the overall plant efficiencies
as the temperature of the feed water (in Kelvin) leaving the heater the saturation
77
pressure of the bleed steam increases, still applies when the overall plant efficiency
of the no bleed steam for feed heating scheme is considerably lower compared with
the equivalent value of the 5K-temperature difference cycle. This analysis certifies
the positive attributes of the primary thermodynamic cycle (5K-temperature
difference cycle) employed in the plant and validates its effective operating code.
Environmentally, the MSW combustion plant complies under the current
Emissions Law in that its force focuses primarily on the effective reduction of
emissions from industrial sites (Nitrogen Oxides, Sulphur Compounds, Particulate
Matter, Carbon Monoxide, Carbon Dioxide) as well as on the efficient operation of
the sources from which they are emitted (boiler, steam turbine). The effective
practice of combustion process emissions control and flue gases re-circulation
together with the operation of the dry scrubber and bag house system, are expected to
deliver the optimal environmentally friendly operation of the MSW combustion
plant.
The Economic analysis performed for the particular venture however,
highlights some points of particular interest that raise doubts about the profitability
of the investment. Beginning with the estimation of the plant’s Capital Costs, the
inclusion of all comprising factors leads to a figure of £43,074,148. A 40%
allowance provided by the European Union for the development of the project
reduces the investor’s capital requirements to £25,844,488 , which are paid into equal
portions every year until the end of the plant’s lifetime. This factor affects the
Operational Costs of the investment, raising the total number to £2,433,102 annually.
However, an additional grant of £500,000 may be provided to the plant owner from
the Government on an annual basis for the effective handling of MSW, which
reduces the Operational Costs to £1,933,102. From the forecasting of the Capital
Costs and the Operational Costs presented above it is realised that the potential
investment is extremely financially intensive.
The verification of the Government grant assumption presented above is
included in the execution of the cash flow analysis for the investment. Performing
the analysis by taking into account the Annual Energy Production (kWh) in relation
to the Selling Price (£0.0396) established by the general invoice Γ 22 (Gamma 22)
factors, the estimation of NPV is deducted as negative. The application of the IRR
78
tool also does not lead to a tangible outcome either, verifying the NPV’ s outcomes.
It has been mentioned before that the Annual Energy Production (kWh) was not
considered satisfactory because of a low Average thermal content of the waste due to
the highly organic nature of the MSW fuel. This now becomes an issue, affecting the
viability of the investment. A higher Annual Energy Production rate could possibly
have improved the NPV findings, but in the current case this probability does not
apply.
Employing a trial-and-error process by alternating the Selling Price factor
under the assumption the current Annual Energy Production rate remains constant; a
Selling Price of 0.17 (£/kWh) has to be established in order to consider the
investment financially profitable. That is almost 5 times the current selling price of
the kWh to the supplier specified by the Energy Law in Greece, which is considered
too expensive by any standards.
79
CHAPTER 8- Conclusions
The detailed examination of the Production Assessment, Thermodynamic
Plant Efficiency, Environmental Impact and Economics factors for the potential 10
MW MSW combustion plant for the area of Athens, Greece leads to the conclusion
that although a plant of this size possesses a satisfactory thermodynamic as well as
environmental operation, it is not considered a financially profitable venture for any
external investor under the current regulatory standards. Although the MSW
potential for the 10 MW energy production is tangible in the area, the development
of a mass burning plant utilising it, for the pre-defined rates provided, would not
result in a profitable business.
An alternative approach to the investment, which might yield a more positive
outcome, would be if a higher power capacity were achieved from the combustion
plant. The 10 MW set-up is not adequate to offset the extensive financial
implications of the plant. In order to address this, a new set-up would have to be
introduced from the start and additional research would have to be performed in
order to define what power capacity level would be profitable in relation to the
equivalent capital and operational costs of the venture.
However, it is not solely the issue of financial intensiveness for the external
investor that marks this potential investment as a failure. It is also the fact that such
an investment does not have adequate legislative or financial support from the local
Government in order to allow it to progress because of the fact that other renewable
technologies are under the Government focus for expansion and development for the
time being. Unfortunately, this leads to the conclusion the only conditions under
which the Waste to Energy plant concept could come into fruition would be if the
Government made the breakthrough initially in order to establish a new market, thus
enabling and encouraging external interest and investing to follow later on.
A Selling Price diversification in the general invoice Γ 22 (Gamma 22)
implied from the restructuring of the current Energy Law would also be a step to the
right direction. An effective pricing of the energy generated from other renewable
sources apart from those already established could be achieved by taking into
account the degree of difficulty in which this energy is extracted. In this case, the

80
new invoice would include a breakdown of the kWh pricing, indicating the source
from which it has been extracted. In this situation, energy extracted by a state Waste
to Energy plant could be used as a secondary source of energy consumption from the
customer base initially, and as the Biomass market opens up could progress to
becoming a primary energy providing source next to other well established
renewable technologies.
In summation, by taking into account the infancy stage, in which the concept
of Waste to Energy is placed in Greece at the current time, it would be very difficult
for an external investor to make a breakthrough in this field in the next five years.
Moreover, even if this technology is proved successful in dealing with the problem
of waste handling for Athens, unless considerable legislative and financial incentives
are provided by the Government in addition to creating a momentum by taking the
initiative in opening the market, the Waste to Energy plant concept will not come to
fruition.

81
Appendix A
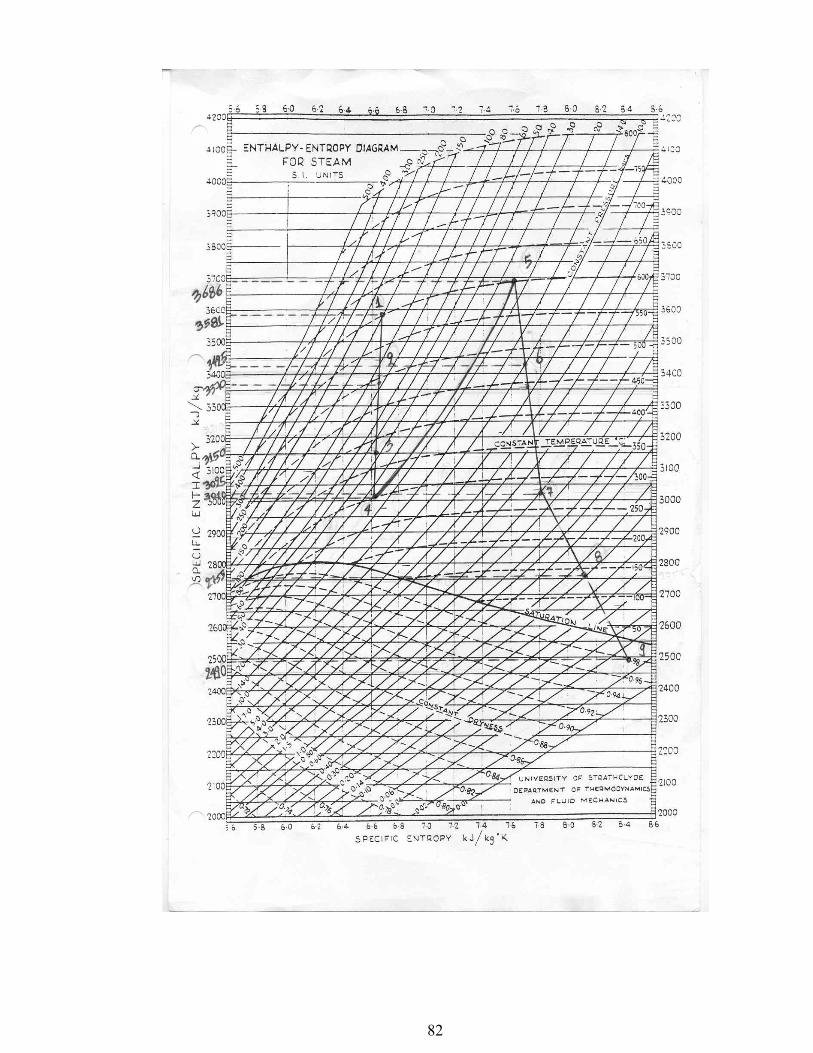
82
83
References:
1. A. Isaakidis, Wastes Thermal Processing with Energy Recovery, Technical
Inspection, 2003.
2. E. Katsigras, Alternative handling of wastes program, 2000.
3. A. Z. Fragkiskos, Municipal Solid Wastes Handling, Pyroforos, 1999.
4. A. Blysidis, Disposal, handling and utilisation technologies of municipal
solid wastes, Pyroforos, 1999.
5. T. Lolos, Dr. G. Parisakis, M.Petropoulou Oksenkioun, A. Skordilis, Biogass
production in Landfill sites: Characteristics, potential and energy utilisation
in Greece, Pyroforos, 1999.
6. Hellenic Energy Law No. 2244/1994
7. Public Power Corporation S.A. official site
8. Ishikawajima-Harima Heavy Industries Co Ltd., Operating data for water
walled rotary combustors.
9. Li Xiasdong, Yan Jianhua, Chi Young, Ni Mingjiang, Cen Kefa,
Development of Municipal Solid Waste Thermal Power Engineering,
Zhejiang University, 2002.
10. Thomas Klasen, Klaus Goerner, Numerical Calculations and optimisation of
a large Municipal Solid Waste incinerator plant, Environmental Process
Engineering and Plant Design, University of Essen, Germany, 2002.
11. TNO Environment, Energy and Process Innovation Energy Systems, The
MSWC FACE model.
12. Maria Izquierdo, Enric Vazquez, Xavier Querol, Marilda Barra, Angel Lopez,
Felicia Plana, Use of bottom ash from Municipal Solid Waste incineration as
a road material, Institute of Earth Sciences ‘Jaume Almera’, Barcelona,
Spain.
13. Powell Fabrication & Manufacturing Inc, ‘Dry’ scrubber versus Powell
Sentry 2000, 1999.
14. 40 CFR 60, subpart BBBB-Emissions Guidelines and Compliance Times for
small Municipal Solid Waste combustion units constructed on or before
August 30, 1999.
84
15. Cate Jones, Emissions Control: Meeting compliance and Profit goals takes
ingenuity, fortitude, Power, 1999.
16. Redding Energy Management, Municipal Solid waste and municipal
wastewater, Australian Greenhouse Office.
17. US TRADE AND DEVELOPMENT AGENCY EXECUTIVE REPORT:
Waste to energy plant, 2001.
18. Md. Alam Jahangir, Energy Recovery from municipal Solid Waste in Dhaka
City, Bangladesh, AT Forum, 2002.
19. J.B. Kitto, Developments in pulverised coal-fired Boiler technology, Babcock
& Willcox Alliance, Ohio, USA, 1996.
20. John B. Doyle, Dan Hagel, Dry scrubber 20 years later, Babcock and
Willcox, 1999.
21. Brightstar Environmental, Solid Waste Energy Facility SWERFTM.
22. J. Randall Freed, Anne Choate, Eugene Lee, Greenhouse gas emission factors
for municipal waste combustion and other practices, ICF Consulting Group.
23. ClearStack Combustion Corporation, ClearGasTM Dry Scrubber: SO2, SO3,
NOx Removal, ESP Performance.
24. The World Bank, Washington D.C., Decision Maker’s Guide to Municipal
Solid Waste Incineration, 1999.
25. MET PRO CORPORATION, DUALL DIVISION Bulletin DS, Dry
Scrubbers, corrosion resistant, horizontal and vertical, mist eliminators, 2001.
26. Energy Nexus Group, Technology Characterisation: Steam Turbines, 2002.
27. Loay Saeed, Ron Zevenhoven, Comparison between Two-stage waste
combustion with HCL recovery and Conventional incineration plants,
Helsinki University of Technology, Laboratory of Energy Engineering and
Environmental Protection, Finland, 2001.
28. Malcolm D. Lemfcort Sc.D., Externally co-firing existing boilers with the
products of combustion of various solid wastes, Heuristic Engineering INC,
Vancouver, Canada, 1999.
29. IDEM: Office of Air Management Rules Guidance, Emission Limits for
municipal waste combustors #98-12 (APCB) Fact Sheet.
85
30. CARNOT Online, Case Study: Large Combustion Plant, Provence 250 MW
ACFB Boiler.
31. BLUE RIDGE Environmental Defence League, Incineration and
Gasification: A toxic comparison, 2002.
32. BALA PRESS AB, Sweden, Waste handling and storing: A state of the art
concept, 2001.
33. Edwin A. Korzun, Melahat T. Duyar, Jose Villanueva, The recycling of
energy values in municipal solid waste: current practices and future trends,
Florida Center for Solid and Hazardous Waste Management, State University
System of Florida Type I Center, Gainesville, Florida.
34. LI Haibn, WU Chuangzhi, CHEN Young, LIU Kexin, A new type of
municipal solid waste comprehensive utilisation technology: energy self-
supported MSW composting system.
35. Kai Sipila, Municipal and Commercial Solid Waste for Pyrolysis (oils) and
Gasification markets, UTT Processes, Finland, 2002.
36. Mashavu Kira, Shirya Tsuneizumi, Tooru Doi, Masao Takuma, Takihiro
Kitta, Development of new stoker incinerator for municipal solid wastes
using oxygen enrichment, 2001.
37. BALA PRESS AB, Sweden, Case Study: Leon, Spain, Long-term storage of
Household waste.
38. Fossil Power Committee, Retrofitting Steam Power Generation Plant for
improved performance, 2001.
39. Mr. C. Pascal, Mr. Ph. Bajeat, Storage of household waste, France.
40. John Joseph Teng, Dr. Norman Jones, Municipal solid waste energy
recovery via mass burn incineration, 1999.
41. Sudhir Kumar, Technology options for municipal solid waste-to-energy
project, Manhattan Energy Development Agency, TIMES (Teri Information
monitor on Environmental Science), 2000.
42. Morton A. Barlaz, Ranji Ranjithan, Keith A. Weitz, Subba R. Nishtala, Life-
Cycle Study of municipal solid waste management: System Description, EPA
Cooperative Agreement, 1995.

86
43. M.Sasha Machler, Managing Municipal Sold Waste: Adding value through
recovery, Earth Engineering Center, Columbia University, 1999.
44. Everett B. Woodruff, Herbert B. Lammers, Thomas F. Lammers, Steam Plant
Operation, 6th Edition, 1992.
45. Rogers & Mayhew, Engineering Thermodynamics: Work and Heat Transfer,
4th Edition, 1992.