Embed Size (px)
Citation preview
i
THESIS REPORT
For the degree
MSc ENVIRONMENTAL MANAGEMENT
In the
DEPARTMENT OF ENVIRONMENTAL SCIENCES AND AGRICULTURE
UNISA
TOPIC:
AN ASSESSMENT OF THE CONTRIBUTION OF AGRICULTURAL NON-POINT
SOURCE POLLUTION ON THE WATER QUALITY OF THE VAAL RIVER WITHIN
THE GROOTDRAAI DAM CATCHMENT
By
SCOTT NCUBE
Student no: 46729836
Supervisor: Dr Luxon Nhamo
Core-supervisor: Malebo Matlala
Contact details: Cell: 0796193239 Email: [email protected]
i
Dedication
To God the Almighty
ii
Declaration
I, Scott Ncube, do solemnly declare that this dissertation represents my own personal work
and has not previously been submitted for any purpose at this or any other university.
Signature............................................................
Date..................................................................
iii
ACKNOWLEDGEMENTS
I gratefully acknowledge the help of Dr Luxon Nhamo and Malebo Matlala who took their
precious time to review and comment on different versions and making corrections of this
thesis.
Special thanks also go to Dr K Sibanda for his precious time, comments, professional advice
and support during the study period.
Special thanks also go to my dear wife Jabulisile Ncube and my children Sukoluhle and
Zibusiso E Ncube. I am ever indebted for their patience, sacrifice and support. Their
endurance and patience enabled me to complete my study.
Special thanks also go to Busisiwe Ngqojana the Principal of Thuto - Thebe high school who
supported me throughout the whole process and my colleagues Zandile Khumalo, Tholakele
Luvuno and Lindiwe Khumalo who also helped and supported me during the data collection
process.
I also acknowledge the support of farmers within the Standerton or the Vaal River catchment
area who allowed me to access their farms to conduct surveys and make observations and
take photographs relevant to the study and the Lekwa Municipality for allowing me to
conduct this research within their jurisdiction.
However I would also like to acknowledge the assistance which was provided by Marica for
contributing and providing the necessary data on the Vaal River.
iv
TABLE OF CONTENTS
ACKNOWLEDGEMENTS ................................................................................................................... iii
TABLE OF CONTENTS ....................................................................................................................... iv
LIST OF FIGURES .............................................................................................................................. vii
LIST OF TABLES ............................................................................................................................... viii
LIST OF APPENDICES ........................................................................................................................ ix
ACRONYMS .......................................................................................................................................... x
DEFINITION OF TERMS .................................................................................................................... xi
ABSTRACT .......................................................................................................................................... xii
Chapter 1 ................................................................................................................................................. 1
1. INTRODUCTION ...................................................................................................................... 1
1.1 INTRODUCTION AND BACKGROUND ........................................................................ 1
1.2 STATEMENT OF THE PROBLEM .................................................................................. 2
1.3 RATIONALE ...................................................................................................................... 3
1.4 AIMS OF THE STUDY ..................................................................................................... 5
1.5 RESEARCH QUESTIONS ................................................................................................. 5
1.6 OBJECTIVES ..................................................................................................................... 5
1.7 DESCRIPTION OF THE STUDY AREA .......................................................................... 5
1.7.1 Soils ................................................................................................................................. 6
1.7.2 Topography ..................................................................................................................... 7
1.7.3 Landuse ........................................................................................................................... 7
1.8 CLASSIFCATION OF DRAINAGE BASINS IN SOUTH AFRICA ............................... 9
Chapter 2 ............................................................................................................................................... 12
2 THEORETICAL FOUNDATION ............................................................................................ 12
2.1 INTRODUCTION ............................................................................................................ 12
2.2 WATER POLLUTION DUE TO AGRICULTURAL ACTIVITIES ............................... 14
2.3 EFFLUENT CHARACTERISTICS AND WATER QUALITY ...................................... 17
2.3.1 Plant Nutrients .............................................................................................................. 17
2.3.2 Nitrogen ........................................................................................................................ 17
2.3.3 Phosphorous .................................................................................................................. 18
2.3.4 Pesticides ....................................................................................................................... 19
Chapter 3 ............................................................................................................................................... 21
3 RESEARCH DESIGN AND METHODOLOGY .................................................................... 21
3.1 INTRODUCTION ............................................................................................................ 21
3.2 RESEARCH DESIGN ...................................................................................................... 21
v
3.2.1 Ex-post factor research .................................................................................................. 21
3.2.2 Survey design ................................................................................................................ 22
3.3 METHODOLOGY............................................................................................................ 23
3.4 SOURCES OF DATA ...................................................................................................... 23
3.4.1 Laboratory analysis ....................................................................................................... 23
3.4.2 Rainfall and discharge data ........................................................................................... 23
3.4.3 Maps .............................................................................................................................. 23
3.4.4 Observation ................................................................................................................... 23
3.4.5 Questionnaires and personal interview ......................................................................... 24
3.5 DATA ANALYSIS PROCEDURE .................................................................................. 25
3.5.1 Quantitative analysis ..................................................................................................... 25
3.6 TRUSTWORTHINESS .................................................................................................... 25
3.7 ETHICAL CONSIDERATION ........................................................................................ 26
3.8 LIMITATIONS OF STUDY ............................................................................................ 26
Chapter 4 ............................................................................................................................................... 27
4 DATA ANALYSIS AND RESULTS ....................................................................................... 27
4.1 INTRODUCTION ............................................................................................................ 27
4.2 FOUL SMELL ON WATER SUPPLIED BY LEKWA MUNICIPALITY ..................... 27
4.3 TYPE OF FARMING IN THE GROOTDRAAI DAM CATCHMENT .......................... 28
4.4 DISTANCE OF FARMS FROM THE VAAL RIVER .................................................... 28
4.5 TYPE OF FERTILISER USED BY FARMERS IN STANDERTON ............................. 30
4.6 AMOUNT OF FERTILISER APPLIED PER HECTARE ............................................... 31
4.7 DURATION OF APPLICATION OF FERTILISER ON FARMS .................................. 31
4.8 KNOWLEDGE OF FERTILISER APPLICATION ......................................................... 32
4.9 OBSERVATION OF THE VAAL RIVER AND ITS TRIBUTARIES ........................... 32
4.10 PHOSPHORUS IN WATER ............................................................................................ 36
4.11 NITRATE IN THE WATER ............................................................................................ 40
4.12 PH IN THE WATER ........................................................................................................ 44
4.13 RUNOFF AND NUTRIENT DYNAMICS ...................................................................... 44
Chapter 5 ............................................................................................................................................... 48
5 DISCUSSION ........................................................................................................................... 48
5.1 INTRODUCTION ............................................................................................................ 48
5.2 AGRICULTURE NUTRIENTS IN WATER ................................................................... 48
vi
5.2.1 Nitrates .......................................................................................................................... 48
5.2.2 Phosphorous .................................................................................................................. 49
5.3 FERTILIZER USE ............................................................................................................ 50
5.4 NEARNESS OF FARMS TO THE RIVER ..................................................................... 50
5.5 OBSERVATION OF VAAL RIVER AND ITS TWO TRIBUTARIES .......................... 52
Chapter 6 ............................................................................................................................................... 54
6 CONCLUSION AND RECOMMENDATIONS ...................................................................... 54
6.1 INTRODUCTION ............................................................................................................ 54
6.2 CONCLUSION ................................................................................................................. 55
6.3 RECOMMENDATIONS .................................................................................................. 56
REFERENCES ..................................................................................................................................... 58
APPENDICES .......................................................................................................................................... 66
APPENDIX 1: Questionare for the local farming community of Standerton for the research project (UNISA) to be filled independently (Afrikaans version). ..................................................................... 66
APPENDIX 2: Questionnaire for the local farming community of Standerton for the research project (University of South Africa) to be filled independently. (English version). ......................................... 68
APPENDIX 3: Questionnaire for local residents of Standerton on water quality for the research project to be filled independently.......................................................................................................... 70
APPENDIX 4 ........................................................................................................................................ 72
APPENDIX 5: The procedure to for t-test ........................................................................................... 74
APPENDIX 6: T - Test table ................................................................................................................ 76
APPENDIX 7: Average monthly concentration of P in the Grootdraai dam........................................ 78
APPENDIX 8: Average monthly concentration of N in the Grootdraai dam ....................................... 79
APPENDIX 9: Average monthly rainfall in Standerton ....................................................................... 80
APPENDIX 10: Average monthly temperature in Standerton ............................................................. 81
vii
LIST OF FIGURES
FIGURE 1.1 ALGAL BLOOM IN THE VAAL RIVER ...................................................................................................... 3
FIGURE 1.2: ALGAL BLOOM IN THE VAAL RIVER.................................................................................................... 4
FIGURE 1.3: LOCATION OF THE GROOTDRAAI DAM CATCHMENT IN SOUTH AFRICA AND ITS ELEVATION ............... 9
FIGURE 1.4: QUATERNARY BASIN AND LANDUSE TYPES OF THE GROOTDRAAI DAM CATCHMENT .................... 10
FIGURE : 2.1: THE NITROGEN CYCLE .................................................................................................................... 18
FIGURE 2.2: THE PHOSPHORUS CYCLE ................................................................................................................. 19
FIGURE 4.1 SHOWS HOW CLOSE FARMS ARE TO THE VAAL RIVER IN STANDERTON AREA .................................... 29
FIGURE 4.2: THE NON-EXISTENCE OF BUFFER ZONES IN SOME FARMS IN STANDERTON........................................ 29
FIGURE 4.3: FERTILISER USED BY FARMERS IN THE GROOTDRAAI DAM CATCHMENT IN 2013 .............................. 30
FIGURE 4.4: ALGAL ACTIVITY OBSERVED AT T1 .................................................................................................. 33
FIGURE 4.5: ALGAL ACTIVITY OBSERVED AT T1 .................................................................................................. 33
FIGURE 4.6: ALGAL ACTIVITY OBSERVED AT T2 .................................................................................................. 34
FIGURE 4.7: ALGAL ACTIVITY OBSERVED AT T2 ................................................................................................... 34
FIGURE 4.8: ALGAL ACTIVITY IN THE MAIN CHANNEL ........................................................................................... 35
FIGURE 4.9: ALGAL ACTIVITY IN MAIN CHANNEL ................................................................................................. 35
FIGURE 4.10: THE AVERAGE ANNUAL DISSOLVED PHOSPHOROUS IN THE GROOTDRAAI DAM FOR THE PERIOD 1988 TO 1997 ........................................................................................................................................................ 36
FIGURE 4.11: THE AVERAGE ANNUAL DISSOLVED P IN THE GROOTDRAAI DAM FOR THE PERIOD 1998 TO 2007 .... 37
FIGURE 4.12: AVERAGE MONTHLY CONCENTRATION OF P IN THE VAAL RIVER. ................................................... 39
FIGURE 4.13: AVERAGE DISSOLVED N IN THE GROOTDRAAI DAM IN THE PERIOD 1988 TO 1997 ........................... 40
FIGURE 4.14: AVERAGE ANNUAL DISSOLVED N IN THE GROOTDRAAI DAM IN THE PERIOD 1998 TO 2007 ............. 41
FIGURE 4.15: AVERAGE MONTHLY CONCENTRATION OF N IN THE GROOTDRAAI DAM .......................................... 43
FIGURE 4.16: AVERAGE YEARLY PH IN THE GROOTDRAAI DAM ............................................................................ 44
FIGURE 5.1: RELATIONSHIP BETWEEN ALGAL GROWTH RATE AND THE NUTRIENTS CONCENTRATION IN THE WATER
..................................................................................................................................................................... 52
viii
LIST OF TABLES
TABLE 1.1: SUMMARY OF SOIL TYPES WITHIN THE CATCHMENT .............................................................................. 6
TABLE 1.2: SUMMARY OF SOIL DEPTHS WITHIN THE CATCHMENT ........................................................................... 7
TABLE 1.3: SUMMARY OF THE TOPOGRAPHY OF THE CATCHMENT .......................................................................... 7
TABLE 1.4: SUMMARY OF THE SLOPE OF THE STUDY AREA ...................................................................................... 7
TABLE 1.5: LANDUSE IN THE CATCHMENT AREA ..................................................................................................... 8
TABLE 2.1: LEADING SOURCES OF WATER IMPAIRMENT IN THE USA .................................................................... 15
TABLE 4.1: TYPES OF AGRICULTURE PRACTICED IN THE CATCHMENT ................................................................... 28
TABLE 4.2: AVERAGE DISTANCE OF FARMS FROM THE VAAL RIVER WITHIN THE CATCHMENT ............................. 30
TABLE 4.3: AMOUNT OF N AND P IN DIFFERENT FERTILISERS USED BY FARMERS IN THE CATCHMENT .................. 31
TABLE 4.4: AVERAGE AMOUNT OF FERTILISER APPLIED BY FARMERS PER HECTARE ............................................. 31
TABLE 4.5: AVERAGE TIME OF FERTILISER APPLICATION BY FARMERS .................................................................. 32
TABLE 4.6: KNOWLEDGE OF FERTILISER APPLICATION AMONG FARMERS IN 2013 ................................................. 32
TABLE 4.7: STUDENT T- TEST FOR PHOSPHOROUS ................................................................................................. 38
TABLE 4.8: DWA WATER GUIDELINES FOR PHOSPHORUS (MG/L) .......................................................................... 39
TABLE 4.9: STUDENT T- TEST FOR NITRATES ........................................................................................................ 42
TABLE 4.10: DWA WATER GUIDELINES FOR NITRATES ......................................................................................... 42
TABLE 4.11: EXCESS NUTRIENTS WASHED AWAY FROM CULTIVATED AREA OF EACH BASIN PER ANNUM ............. 45
TABLE 4.12: TOTAL DISSOLVED NUTRIENT WASHED AWAY BY RUNOFF FROM CULTIVATED LANDS ANNUALLY ... 46
TABLE 4.13: MEASURED AVERAGE ANNUAL DISSOLVED AGRICULTURAL NUTRIENTS IN THE GROOTDRAAI DAM
(MG/L) .......................................................................................................................................................... 47
ix
LIST OF APPENDICES
APPENDIX 1: QUESTIONARE FOR THE LOCAL FARMING COMMUNITY OF STANDERTON FOR THE RESEARCH
PROJECT (UNISA) TO BE FILLED INDEPENDENTLY (AFRIKAANS VERSION). .................................................. 66
APPENDIX 2: QUESTIONNAIRE FOR THE LOCAL FARMING COMMUNITY OF STANDERTON FOR THE RESEARCH
PROJECT (UNIVERSITY OF SOUTH AFRICA) TO BE FILLED INDEPENDENTLY. (ENGLISH VERSION). ................ 68
APPENDIX 3: QUESTIONNAIRE FOR LOCAL RESIDENTS OF STANDERTON ON WATER QUALITY FOR THE RESEARCH
PROJECT TO BE FILLED INDEPENDENTLY. ...................................................................................................... 70
APPENDIX 4: QUESTIONNAIRE FOR THE LEKWA MUNICIPALITY WATER AUTHORITY FOR THE RESEARCH
PROJECT TO BE FILLED INDEPENDENTLY. ...................................................................................................... 72
APPENDIX 5: THE PROCEDURE TO FOR T-TEST ................................................................................................... 74
APPENDIX 6: T - TEST TABLE ............................................................................................................................. 76
APPENDIX 7: AVERAGE MONTHLY CONCENTRATION OF P IN THE GROOTDRAAI DAM ........................................ 78
APPENDIX 8: AVERAGE MONTHLY CONCENTRATION OF N IN THE GROOTDRAAI DAM ....................................... 79
APPENDIX 9: AVERAGE MONTHLY RAINFALL IN STANDERTON .......................................................................... 80
APPENDIX 10: AVERAGE MONTHLY TEMPERATURE IN STANDERTON ................................................................. 81
x
ACRONYMS
� ADP Adenosine diphosphate � AP Apatite phosphorus � ATP Adenosine tri-phosphate � BOD Biological oxygen demand � COD Chemical oxygen demand � CSIR Council for Scientific and Industrial Research � DNA Deoxyribonucleic acid � DO Dissolved oxygen � DWA Department of Water Affairs � GDC Grootdraai dam catchment � IEWA Implementing environmental water allocation � NPS Non-point source pollution � SAC Satellite centre � SADC Southern Africa Development Community � SRP Soluble reactive ortho-phosphorus � RNA Ribonucleic acid � WRC Water Research Commission � OP Organic phosphorus � P Phosphorus � PLARG Pollution from land use activities reference groups � N Nitrogen � N2 Nitrogen gas � NAIP Non apatite inorganic phosphorus � NGI National Geospatial Information � NH3 Ammonia � NH4 Ammonium � NO2 Nitrite � NO3 Nitrate � NPK Nitrogen, phosphorus and potassium � FAO Food and Agriculture Organisation � US – EPA United States Environmental Protection Agency � USA United States of America � UAA Utilised agricultural area � SAC Satellite Application Centre � SANBI South African National Biodiversity Institu te � T1 Tributary one � T2 Tributary two � T3 Vaal River � WHO World Health Organization
xi
DEFINITION OF TERMS
Terms which are used in the study are defined below according to how they are used in this
study.
� Fertiliser: any synthetic inorganic material that is used to enhance plant growth by
supplying nutrients such as nitrogen and phosphorus (UNESCO, 1998).
� Water Contamination: the reduction of possible usefulness of water by chemical
solutes present in water above concentrations determined by national or international
standards for portable, industrial, recreational and other uses (UNESCO, 1998).
� Leaching: the loss of water- soluble plant nutrients from the soil, due to rain and
irrigation.
� Nutrients: chemicals that plants need to grow taken from the environment such as
nitrates, phosphates.
� Pesticides: in this study refers to all chemicals that are used to control or kill pests
such as herbicides, insecticides, nematodes and rodenticides.
� Pollutant: refers to a substance that adversely alters the environment by changing the
population growth rate of species, interferes with food chain, is toxic or interferes with
health, comfort amenities, or property values of people (UNESCO, 1998).
� Pollution: in this study refers to the introduction into fresh or marine waters of
chemical, physical or biological material that degrades the quality of water and affects
organisms living in it.
� Non - point source pollution: refers to the contamination that occurs when rain water,
snowmelts, or irrigation washes off ploughed fields, city streets.
� Runoff: refers to the total amount of water that reaches the stream or river including
immediate surface runoff and the rainfall that joins the stream later by infiltration.
� Water quality : in this study is a term used to describe the chemical, physical and the
biological characteristics of water, usually its suitability to maintain a healthy
ecosystem
� Eutrophication : refers to the enrichment of surface waters with plant nutrients, such
as nitrates and phosphates through fertilizers or sewage.
� Algal bloom: is a rapid increase or accumulation in the population of algae in aquatic
system such as fresh water or marine environment.
xii
ABSTRACT
This study assesses the contribution of agricultural non-point source pollution, to poor water
quality of the Vaal River within the Grootdraai dam catchment area. The study evaluates
agricultural pollutants affecting the quality of water within the study area. The impact of
agricultural non-point source pollution on the water quality of the Vaal River was evaluated
by establishing a correlation between the quantity of polluted runoff reaching the River and
the quantity of measured nitrates and phosphates in its waters. A questionnaire using random
sampling was used to capture data from 15 commercial farmers 35 local residents and the
Department of Water Affairs management. The results of the study show that agricultural
nutrients are heavily impacting and compromising the water quality of the Grootdraai Dam.
The mean concentrations of Nitrogen and Phosphorus were found to be well above the water
quality guidelines there by promoting eutrophication.
Key words: Agricultural non-point source pollution; runoff, water quality, agricultural
nutrients, eutrophication, buffer zones, Phosphorus, Fertiliser, Quaternary basins, nitrogen.
1
Chapter 1
1. INTRODUCTION
1.1 INTRODUCTION AND BACKGROUND
Water comprises 70% of the Earth’s surface making it one of the most valuable natural
resources (Krantz, 2011). Of this about 97.5% is salt water and only about 2.5% is fresh
water, (Sandi & Darrin, 2012). It is a fundamental element to all forms of life for various
functions such as drinking, cleaning, as a reproductive medium and as habitat for aquatic
organisms and for irrigation purposes (Ninhoskinson, 2011). Water makes up 50 to 90% of
the body weight of most living organisms. It is also essential as a transport mechanism and
for metabolic processes of most living organism, (Sandi & Darrin, 2012).
Water pollution is an aspect of pollution that commonly goes under the radar; however it is a
huge aspect of pollution with serious detrimental consequences which needs to be dealt with
swiftly to obtain a clean and healthy environment (Ninhoskinson, 2011).
Water pollution decreases the usefulness of water economically and it brings about danger to
human health and other aquatic forms of life (James, 2008). Although human beings benefit
immensely from water, they are actually one of the main causes of water pollution through
marine dumping, industrial wastes, agricultural effluent and mining wastes, (Ninhoskinson,
2011).
South Africa’s water quality is fast deteriorating (Bega, 2008). It is estimated that the
demand for water in South Africa will exceed available natural supply by the turn of the 21st
century. It is projected that South Africa could run out of fresh water by 2025 (Blaine, 2013).
This constitutes an economic challenge that can only be met by careful planning and
intensifying research on sustainable agriculture, (Cillie & Coombs, 1979). A study by Bega
(2008) found out that the cyanobacteria blooms recorded in most rivers in South Africa were,
due to high levels of eutrophication.
Agricultural nutrients from farmlands are one of the top running contributors of water
pollution. These include fertilizer and pesticides used in agriculture, which find their way into
the river system, contributing significantly to the poor quality of water (Ninhoskinson, 2011).
2
It is therefore of paramount importance that enough information be gathered to understand
the major causes of water pollution. When the causes and sources of water pollution are
identified it paves way for the assessment of the contributions of each of these factors so that
appropriate measures can be taken to address the problem effectively. This study assesses the
impact of agricultural nutrients and chemicals from farms within the Grootdraai Dam
catchment situated near Standerton in the Mpumalanga Province, determining its contribution
to the poor water quality in the Vaal River.
1.2 STATEMENT OF THE PROBLEM
According to a study by the Water Research Commission (WRC), the state of most of South
Africa’s rivers continues to deteriorate (Sapa, 2009). There are clear indications from the
relatively scanty water quality monitoring data available that water quality of most rivers in
South Africa has deteriorated over the past 20 years (Oberholster, 2010). The WRC revealed
at the Implementing Environmental Water Allocation (IEWA) conference in Port Elizabeth
that some rivers in South Africa showed a huge deterioration in water quality (Sapa, 2009).
The Vaal River was classified as the second most polluted river in South Africa after the
Olifants River (Sapa, 2009).
Four main categories of water pollution have been identified in past studies. These include
the municipal, industrial, mining and agriculture. The pollutants can either be organic or
inorganic substances (Wetzel, 1993). Pollutants released from agriculture, are regarded as
non- point source pollution (NPS) and they have been identified as one of the leading sources
of water pollution in South Africa. Nitrogen and phosphorus from agricultural fertilizers,
manure and ammonia is converted into nitrites and phosphates which are then washed into
the river system by runoff water. It has been noted that algal production in most rivers
appears to be limited by the concentration of phosphate (Wetzel, 1993; Edmondson, 1991).
The prevailing monitoring gaps increase uncertainty and undermine decision making in
monitoring water quality (Stuijt, 2012). The assumption is that knowledge is limited to the
causes of water pollution however the question that still remains is, what is the contribution
of this particular source to poor water quality in this part of the river? Hence this study will
estimate the extent of Agricultural contribution to poor water quality of the Vaal River within
the Grootdraai Dam Catchment in Mpumalanga Province. This study exclusively assesses the
3
impact of agricultural non-point source (NPS) pollution on the segment of the Vaal River
within the Grootdraai Dam Catchment.
1.3 RATIONALE
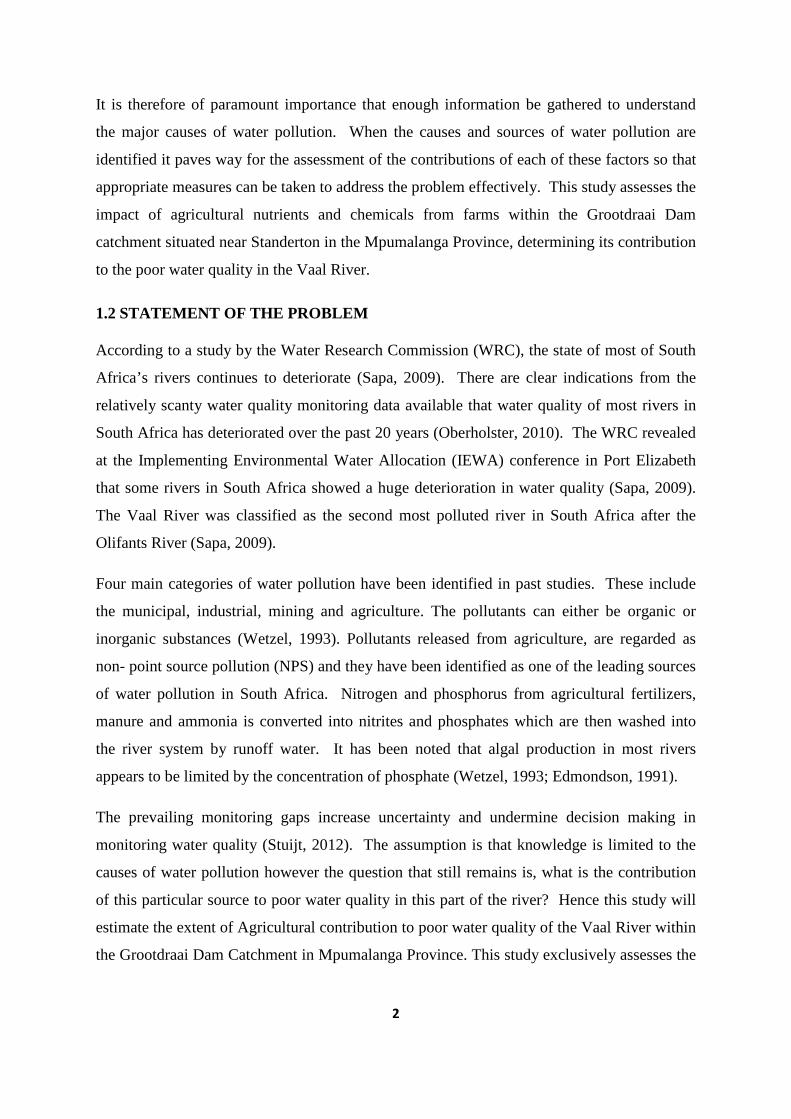
This study is partially informed by observations of the disturbing state of affairs on the Vaal
River situated near Standerton in Mpumalanga Province. There is a disturbing and unusual
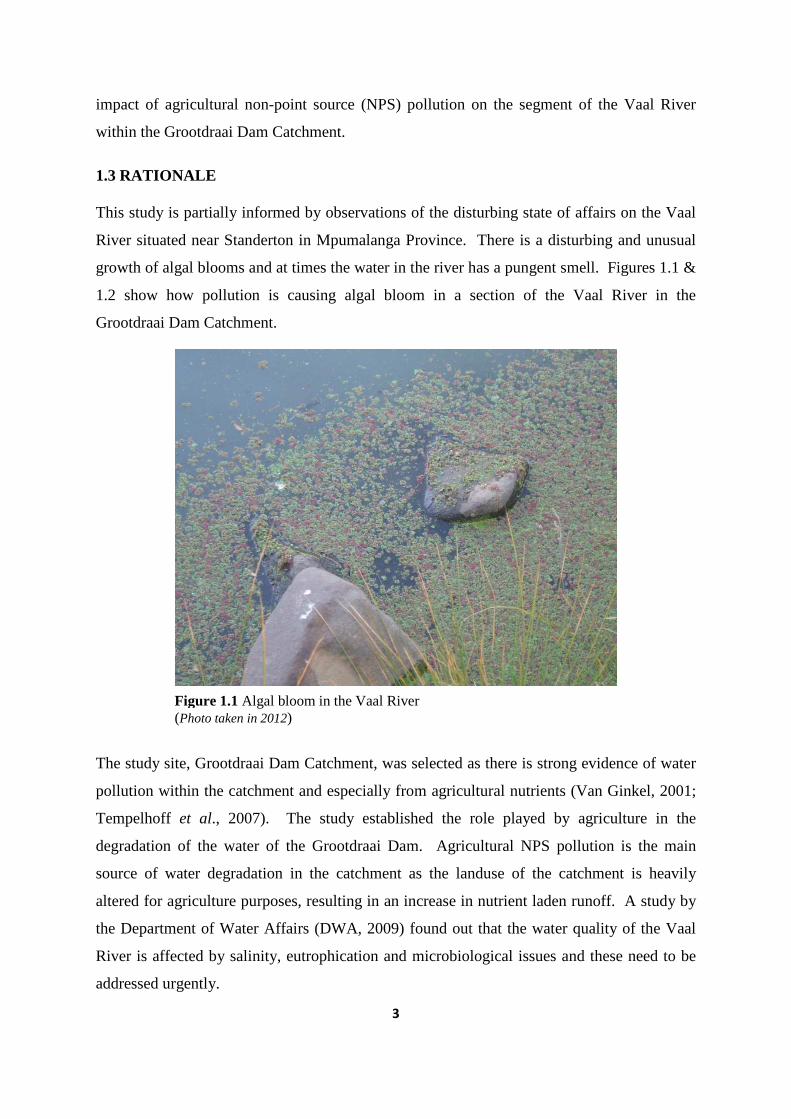
growth of algal blooms and at times the water in the river has a pungent smell. Figures 1.1 &
1.2 show how pollution is causing algal bloom in a section of the Vaal River in the
Grootdraai Dam Catchment.
The study site, Grootdraai Dam Catchment, was selected as there is strong evidence of water
pollution within the catchment and especially from agricultural nutrients (Van Ginkel, 2001;
Tempelhoff et al., 2007). The study established the role played by agriculture in the
degradation of the water of the Grootdraai Dam. Agricultural NPS pollution is the main
source of water degradation in the catchment as the landuse of the catchment is heavily
altered for agriculture purposes, resulting in an increase in nutrient laden runoff. A study by
the Department of Water Affairs (DWA, 2009) found out that the water quality of the Vaal
River is affected by salinity, eutrophication and microbiological issues and these need to be
addressed urgently.
Figure 1.1 Algal bloom in the Vaal River (Photo taken in 2012)
4
The introduction of pollutants into the Vaal River within the Grootdraai Dam Catchment
could be as a result of a number of natural processes or influences by human activities within
the area. These activities include mining, sewage spillage and agricultural activities among
others.
The determination of the extent to which agricultural activities contribute to poor water
quality in the Vaal River and the communication of this information to stakeholders will
provide an impetus for solving problems associated with agricultural non-point source
pollution.
The study shows how the contribution of agricultural nutrients and pesticides have affected
the water quality of the Vaal River, and if the effect is significant enough that proper control
and mitigation measures would be required to improve the quality of water and consequently
the health of downstream biodiversity.
The results of the study benefit decision makers, stakeholders, the community within the
Grootdraai Dam Catchment and the catchment management authorities for sustainable
development. The control of the poor water quality will benefit the Lekwa Municipality since
it could mean a reduction in the cost of purifying water meant for human consumption.
Figure 1.2: Algal bloom in the Vaal River (Photo taken in October 2012)
5
1.4 AIMS OF THE STUDY
This study aims to;
1. To estimate the contribution of the current agricultural activities to the water quality
of the Vaal River within the Grootdraai Dam Catchment, and
2. To explore the current agricultural capacity, competence and commitment of the
local farming community within the catchment so as to achieve compliance with the
environmental legislation.
1.5 RESEARCH QUESTIONS
The major research questions of the study include:
1. Do the local communities within the Grootdraai Dam Catchment have sufficient
knowledge on the threats of poor agricultural methods on the poor water quality of
the Vaal River in general and of the Grootdraai Dam in particular?
2. Do farmers have sufficient knowledge on the efficient use and application of
fertiliser?
3. What are the major agricultural pollutants affecting the water quality of the Vaal
River within the Grootdraai Dam Catchment?
4. What is the level of effect do these pollutants have on the quality of water quality
within the study area?
1.6 OBJECTIVES
The specific objectives of the study are;
1. To determine what the local communities within the Grootdraai Dam Catchment
know and feel about the water quality of the Vaal River,
2. To determine the major type of fertiliser that is used by the farming community,
3. To determine the extent to which agricultural activities contribute to poor water
quality of the Vaal River and the Grootdraai Dam, and
4. To determine the competence and commitment of the local farming community to
achieve compliance with environmental legislation.
1.7 DESCRIPTION OF THE STUDY AREA
The Grootdraai Dam Catchment (GDC) is located in the headwaters of the Vaal River, in
Mpumalanga Province, South Africa. Described as the heartbeat of South Africa, the Vaal
6
River water system is essential to human life, agriculture, industry, aquaculture and an entire
aquatic ecosystem. The Grootdraai Dam, the tenth largest dam in South Africa, is situated in
the upper reaches of the Vaal River less than 10km upstream of Standerton. The Grootdraai
Dam has a catchment area of 8 195 km2, a mean annual precipitation of approximately
750mm, a mean annual potential evaporation at the dam site of 1 400mm and a natural inflow
of 580 million m3/a. The full supply capacity of the reservoir is 364 million m3, making it a
0.7 MAR dam (Midgley et al., 1994). The Grootdraai Dam is one of the major attractions for
recreational activities such as boating, canoeing, swimming and fishing which bring in
revenue from visitors wishing to see the dam and enjoy these activities. Bass fishing in the
dam is very popular amongst the locals. However, the water quality of the dam has been
degrading due to an increase in agricultural non- point source pollution (NPS).
The landuse of the Grootdraai Dam Catchment (GDC) is characterised by agriculture, coal
mining and power generation at the Tutuka, Camden and Majuba Power Stations. The dam
supplies water to Sasol Secunda and the Tutuka Power Station. The supply from Grootdraai
Dam is supported by transfers of water from the Zaaihoek and Heyshope Dams (DWA,
2009). The land use of the Grootdraai Dam Catchment (GDC) is heavily altered due to
human activities, exposing its waters to the impacts of agricultural NPS pollution. The
industries and mining activities in the catchment also contribute to the poor water quality
problems of the dam.
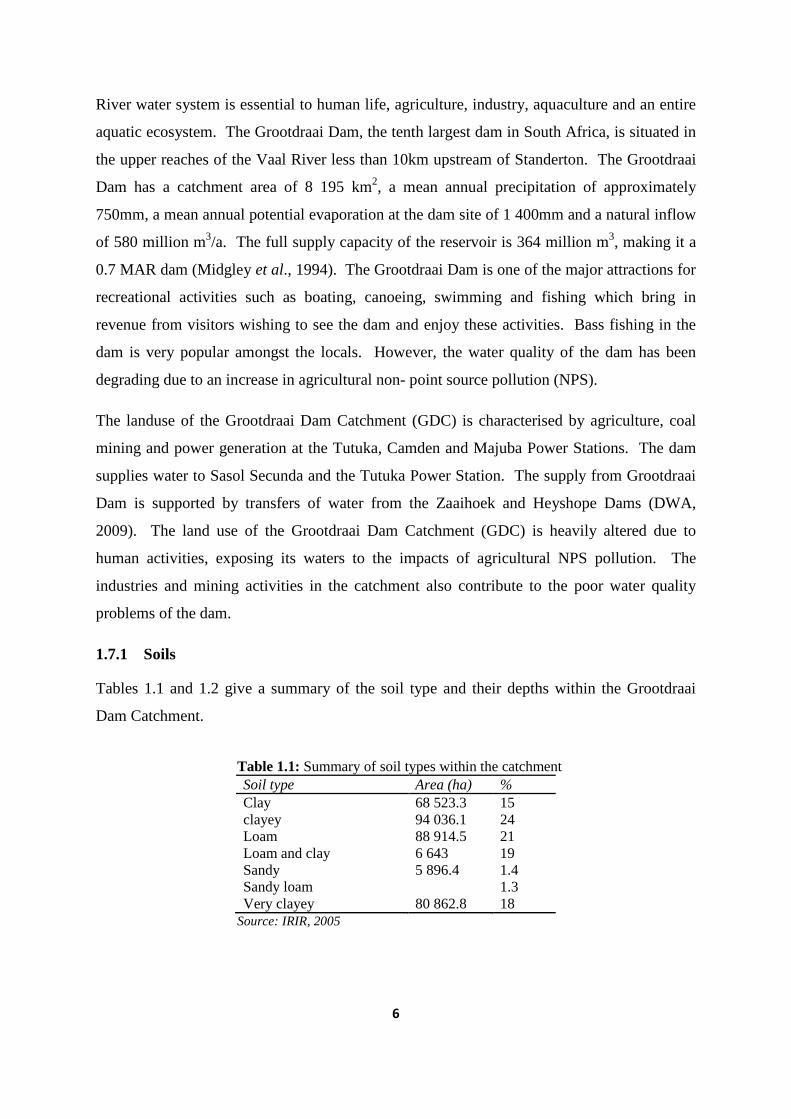
1.7.1 Soils
Tables 1.1 and 1.2 give a summary of the soil type and their depths within the Grootdraai
Dam Catchment.
Table 1.1: Summary of soil types within the catchment
Soil type Area (ha) % Clay 68 523.3 15 clayey 94 036.1 24 Loam 88 914.5 21 Loam and clay 6 643 19 Sandy 5 896.4 1.4 Sandy loam
1.3
Very clayey 80 862.8 18 Source: IRIR, 2005
7
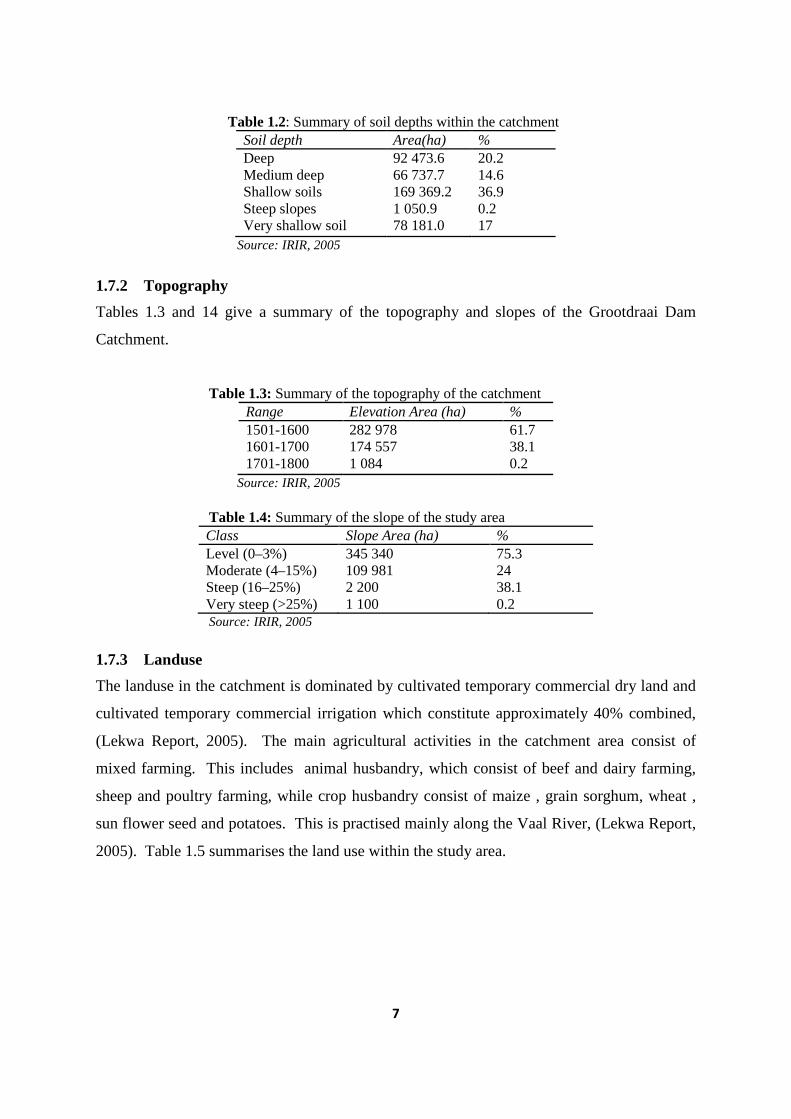
Table 1.2: Summary of soil depths within the catchment
Soil depth Area(ha) % Deep 92 473.6 20.2 Medium deep 66 737.7 14.6 Shallow soils 169 369.2 36.9 Steep slopes 1 050.9 0.2 Very shallow soil 78 181.0 17
Source: IRIR, 2005
1.7.2 Topography
Tables 1.3 and 14 give a summary of the topography and slopes of the Grootdraai Dam
Catchment.
Table 1.3: Summary of the topography of the catchment Range Elevation Area (ha) % 1501-1600 282 978 61.7 1601-1700 174 557 38.1 1701-1800 1 084 0.2
Source: IRIR, 2005
Table 1.4: Summary of the slope of the study area Class Slope Area (ha) % Level (0–3%) 345 340 75.3 Moderate (4–15%) 109 981 24 Steep (16–25%) 2 200 38.1 Very steep (>25%) 1 100 0.2 Source: IRIR, 2005
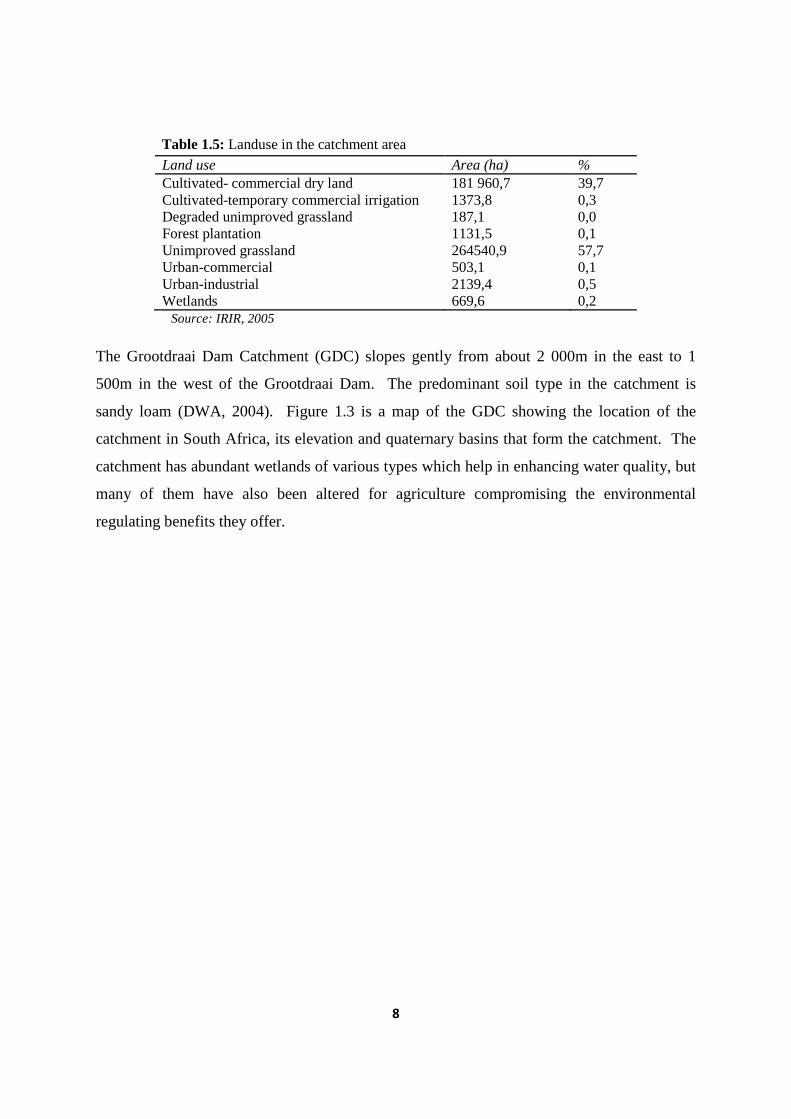
1.7.3 Landuse
The landuse in the catchment is dominated by cultivated temporary commercial dry land and
cultivated temporary commercial irrigation which constitute approximately 40% combined,
(Lekwa Report, 2005). The main agricultural activities in the catchment area consist of
mixed farming. This includes animal husbandry, which consist of beef and dairy farming,
sheep and poultry farming, while crop husbandry consist of maize , grain sorghum, wheat ,
sun flower seed and potatoes. This is practised mainly along the Vaal River, (Lekwa Report,
2005). Table 1.5 summarises the land use within the study area.
8
Table 1.5: Landuse in the catchment area
Land use Area (ha) % Cultivated- commercial dry land 181 960,7 39,7 Cultivated-temporary commercial irrigation 1373,8 0,3 Degraded unimproved grassland 187,1 0,0 Forest plantation 1131,5 0,1 Unimproved grassland 264540,9 57,7 Urban-commercial 503,1 0,1 Urban-industrial 2139,4 0,5 Wetlands 669,6 0,2
Source: IRIR, 2005
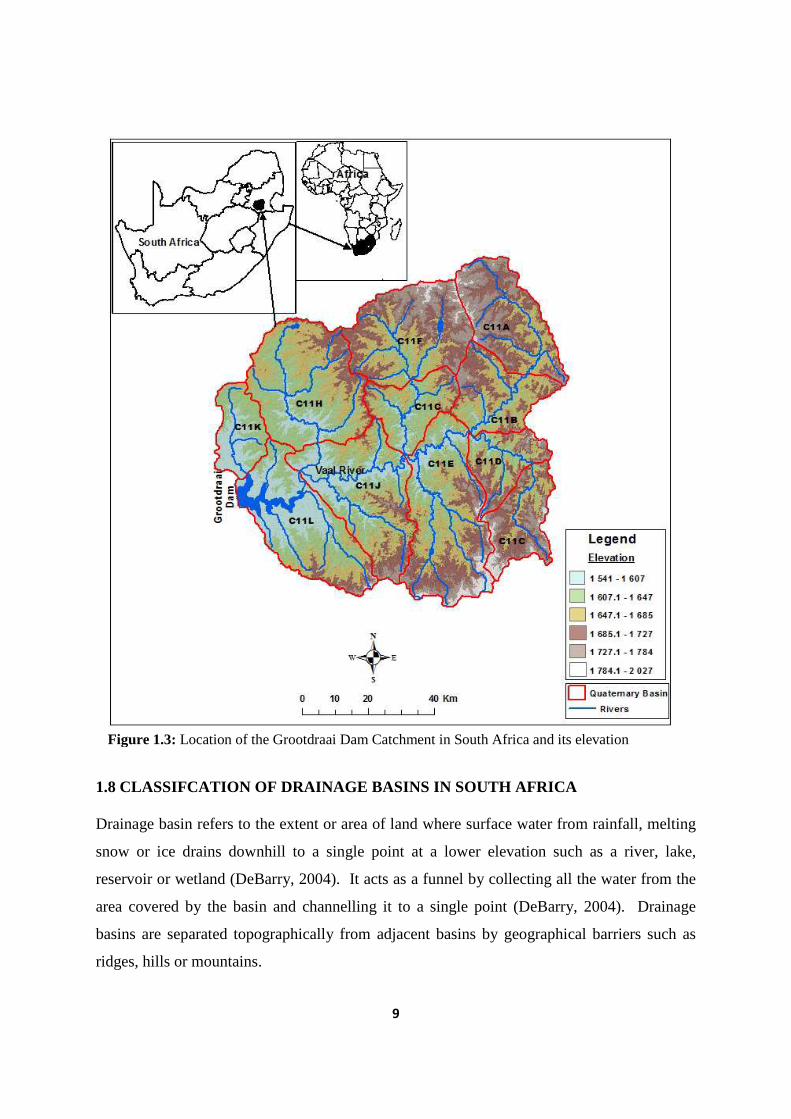
The Grootdraai Dam Catchment (GDC) slopes gently from about 2 000m in the east to 1
500m in the west of the Grootdraai Dam. The predominant soil type in the catchment is
sandy loam (DWA, 2004). Figure 1.3 is a map of the GDC showing the location of the
catchment in South Africa, its elevation and quaternary basins that form the catchment. The
catchment has abundant wetlands of various types which help in enhancing water quality, but
many of them have also been altered for agriculture compromising the environmental
regulating benefits they offer.
9
1.8 CLASSIFCATION OF DRAINAGE BASINS IN SOUTH AFRICA
Drainage basin refers to the extent or area of land where surface water from rainfall, melting
snow or ice drains downhill to a single point at a lower elevation such as a river, lake,
reservoir or wetland (DeBarry, 2004). It acts as a funnel by collecting all the water from the
area covered by the basin and channelling it to a single point (DeBarry, 2004). Drainage
basins are separated topographically from adjacent basins by geographical barriers such as
ridges, hills or mountains.
Figure 1.3: Location of the Grootdraai Dam Catchment in South Africa and its elevation
10
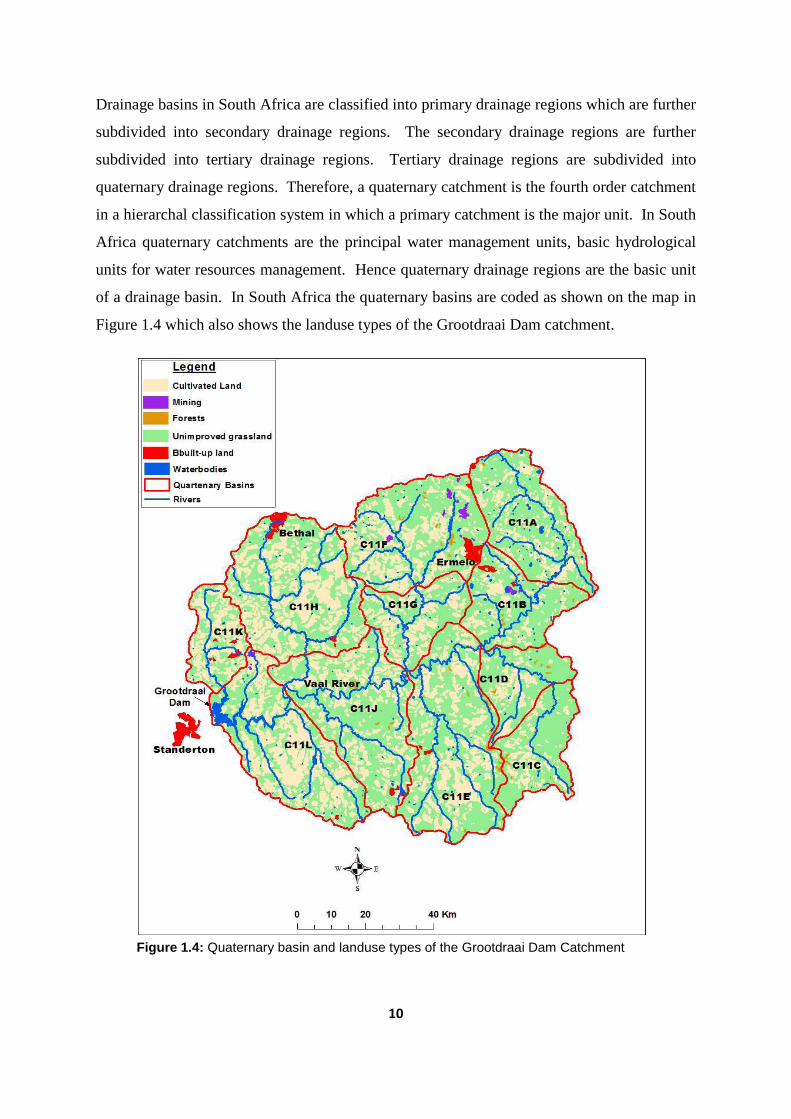
Drainage basins in South Africa are classified into primary drainage regions which are further
subdivided into secondary drainage regions. The secondary drainage regions are further
subdivided into tertiary drainage regions. Tertiary drainage regions are subdivided into
quaternary drainage regions. Therefore, a quaternary catchment is the fourth order catchment
in a hierarchal classification system in which a primary catchment is the major unit. In South
Africa quaternary catchments are the principal water management units, basic hydrological
units for water resources management. Hence quaternary drainage regions are the basic unit
of a drainage basin. In South Africa the quaternary basins are coded as shown on the map in
Figure 1.4 which also shows the landuse types of the Grootdraai Dam catchment.
Figure 1.4: Quaternary basin and landuse types of the Grootdraai Dam Catchment
11
As surface water flows through each quaternary basin it picks up nutrients sediment and
pollutants. These get transported towards the outlet of the basin (DeBarry, 2004). On
reaching the outlet of the basin, these nutrients may affect the ecological processes along the
way and the receiving water sources (DeBarry, 2004). Modern usage of artificial fertilizers
containing nitrogen, phosphorus and potassium has affected the mouths of most watersheds.
Hence the exit point mouths of the quaternary basins are important points to study of the
effects of land usage on the quality of water in the receiving water sources such as rivers,
dams and lakes.
12
Chapter 2
2 THEORETICAL FOUNDATION
2.1 INTRODUCTION
Water quality is a term used to describe the chemical, physical and the biological
characteristics of water, usually its suitability to maintain a healthy ecosystem. Water quality
can be changed or affected by both natural processes and human activities which lead to the
pollution of water bodies (DWA, 2011).
The main causes of poor water quality are the contamination by human and other animal
wastes, poisonous chemicals, heavy metals and oils. These can affect rain, rivers, lakes,
oceans and underground water. The major causes of water pollution can be classified into
industrial wastes, domestic wastes and agricultural wastes. Pollution from the latter involves
rainwater flowing as runoff from farmlands into streams, carrying chemical fertilisers and
pesticides used by farmers (Schueller, 2000).
Water pollution is a major problem in the global context. It has been suggested that it is the
leading cause of deaths and diseases worldwide (Pink, 2006). In addition to the acute
problems of water pollution in developing countries, industrialised countries continue to
struggle with pollution problems as well. For example in a recent national report on water
quality in the United States of America (USA), of the 45% of assessed miles, 47% of
assessed lake acres and 32% of assessed bay and estuarine square miles were classified as
polluted (Schueller, 2000).
Pollution of rivers, lakes and aquifers from domestic and industrial waste water discharge,
mining runoff and agrochemicals is now a growing threat to water resources in most
countries in Southern Africa. The quality of water supplies in the Southern African
Development Committee (SADC) region, once taken for granted, is becoming the focus of
major concern. Due to increased urbanisation in the Southern African Development
Committee (SADC) region, expects say that most of the cities have not been able to develop
basic utilities for water and environmental services (solid waste disposal systems, sewage
treatment and agricultural pollution control) to keep pace with rapid population growth (Cillie
& Coombs, 1979).
13
In South Africa it is estimated that water demand will exceed available natural supplies by
the turn of the 21st century (Cillie & Coombs, 1979), a problem already evident as South
Africa is classified as a water scarce country (Ashton, 2002). This crisis is mainly caused by
low rainfall that the country receives and high rates of evaporation, the expanding economy
and a growing population whose demands for water do not conform to the distribution of
exploitable water supplies (Oberholster, 2010). This anticipated shortage of water constitutes
a challenge that can only be solved by careful planning and intensified research in water
management.
Water research in South Africa involves a variety of government departments’ statutory
bodies, industries and universities (Cillie & Coombs, 1979). Previous studies involving
analysis of water quality in the South African aquatic systems have involved physio-chemical
and microbial assessment (Lin et al., 2004; Mthembu, 2004). Bio-monitoring is another
valuable assessment tool that is receiving increased use in water quality monitoring
programmes of all types (Kennish, 1992). This involves the use of biological response to
assess changes in the rivers. Indicators and indicator species and communities such as fish
and algae are used for this purpose. This type of analysis assesses water quality from a
pollution and human health perspective.
Microbial assessment involves quantification of Escherichia coli (E coli) form of bacteria and
provides an indication of the degree of faecal contamination and the presence of pathogenic
organisms. This is very important in the context of water portability and safety. The Lekwa
Municipality pollution control departments, in their river testing programme, routinely
monitor for the presence of Escherichia coli and other pathogenic organisms.
The presence of different chemical concentration like aluminium, ammonia, chlorine,
chromium, cadmium and selenium among other chemicals may be monitored in the
evaluation of water quality and the presence of high levels of these chemical substances
would be indicative of pollution, possibly from one or any of a range of applicable industrial
and or domestic sources (DWA, 1996). Hence this is very relevant to this study which seeks
to determine the contribution of agriculture to water quality.
Nutrient enriched (eutrophic) water systems are characterised by excessive growth of algae
and macrophytes (algal bloom). Phosphorous is a widely accepted indicator of eutrophic
status of water system due to its strong implication in the growth of algae (Van Ginkel,
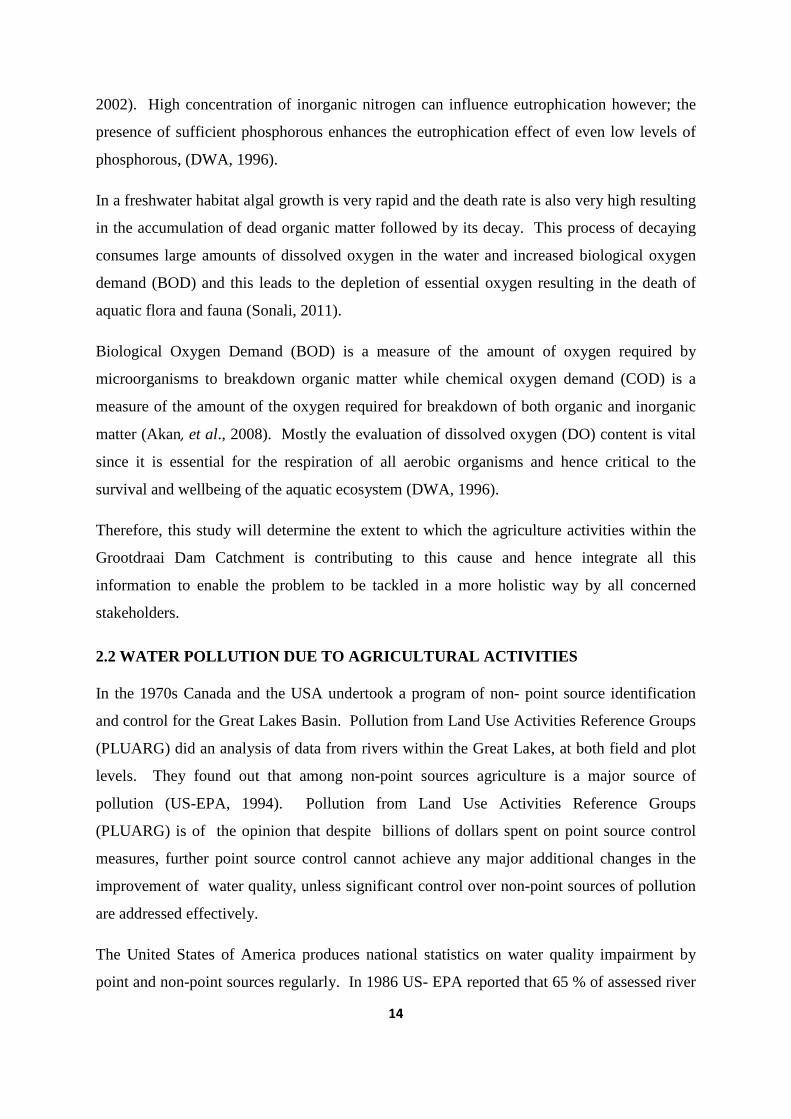
14
2002). High concentration of inorganic nitrogen can influence eutrophication however; the
presence of sufficient phosphorous enhances the eutrophication effect of even low levels of
phosphorous, (DWA, 1996).
In a freshwater habitat algal growth is very rapid and the death rate is also very high resulting
in the accumulation of dead organic matter followed by its decay. This process of decaying
consumes large amounts of dissolved oxygen in the water and increased biological oxygen
demand (BOD) and this leads to the depletion of essential oxygen resulting in the death of
aquatic flora and fauna (Sonali, 2011).
Biological Oxygen Demand (BOD) is a measure of the amount of oxygen required by
microorganisms to breakdown organic matter while chemical oxygen demand (COD) is a
measure of the amount of the oxygen required for breakdown of both organic and inorganic
matter (Akan, et al., 2008). Mostly the evaluation of dissolved oxygen (DO) content is vital
since it is essential for the respiration of all aerobic organisms and hence critical to the
survival and wellbeing of the aquatic ecosystem (DWA, 1996).
Therefore, this study will determine the extent to which the agriculture activities within the
Grootdraai Dam Catchment is contributing to this cause and hence integrate all this
information to enable the problem to be tackled in a more holistic way by all concerned
stakeholders.
2.2 WATER POLLUTION DUE TO AGRICULTURAL ACTIVITIES
In the 1970s Canada and the USA undertook a program of non- point source identification
and control for the Great Lakes Basin. Pollution from Land Use Activities Reference Groups
(PLUARG) did an analysis of data from rivers within the Great Lakes, at both field and plot
levels. They found out that among non-point sources agriculture is a major source of
pollution (US-EPA, 1994). Pollution from Land Use Activities Reference Groups
(PLUARG) is of the opinion that despite billions of dollars spent on point source control
measures, further point source control cannot achieve any major additional changes in the
improvement of water quality, unless significant control over non-point sources of pollution
are addressed effectively.
The United States of America produces national statistics on water quality impairment by
point and non-point sources regularly. In 1986 US- EPA reported that 65 % of assessed river
15
miles in the USA were impacted by non-point sources (US–EPA, 1996). Then in 1994 the
organisation identified agriculture as the leading cause of water quality impairment of rivers
and lakes in the USA, (US–EPA, 1994).
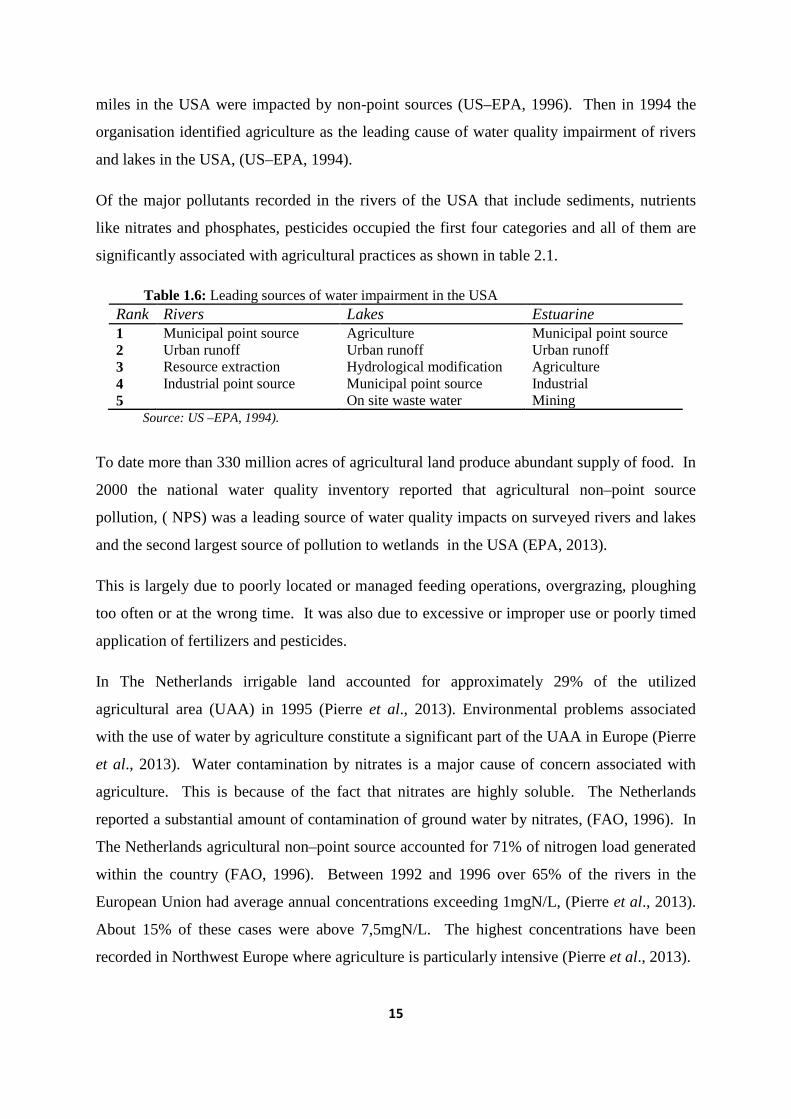
Of the major pollutants recorded in the rivers of the USA that include sediments, nutrients
like nitrates and phosphates, pesticides occupied the first four categories and all of them are
significantly associated with agricultural practices as shown in table 2.1.
Table 1.6: Leading sources of water impairment in the USA Rank Rivers Lakes Estuarine 1 Municipal point source Agriculture Municipal point source 2 Urban runoff Urban runoff Urban runoff 3 Resource extraction Hydrological modification Agriculture 4 Industrial point source Municipal point source Industrial 5 On site waste water Mining
Source: US –EPA, 1994).
To date more than 330 million acres of agricultural land produce abundant supply of food. In
2000 the national water quality inventory reported that agricultural non–point source
pollution, ( NPS) was a leading source of water quality impacts on surveyed rivers and lakes
and the second largest source of pollution to wetlands in the USA (EPA, 2013).
This is largely due to poorly located or managed feeding operations, overgrazing, ploughing
too often or at the wrong time. It was also due to excessive or improper use or poorly timed
application of fertilizers and pesticides.
In The Netherlands irrigable land accounted for approximately 29% of the utilized
agricultural area (UAA) in 1995 (Pierre et al., 2013). Environmental problems associated
with the use of water by agriculture constitute a significant part of the UAA in Europe (Pierre
et al., 2013). Water contamination by nitrates is a major cause of concern associated with
agriculture. This is because of the fact that nitrates are highly soluble. The Netherlands
reported a substantial amount of contamination of ground water by nitrates, (FAO, 1996). In
The Netherlands agricultural non–point source accounted for 71% of nitrogen load generated
within the country (FAO, 1996). Between 1992 and 1996 over 65% of the rivers in the
European Union had average annual concentrations exceeding 1mgN/L, (Pierre et al., 2013).
About 15% of these cases were above 7,5mgN/L. The highest concentrations have been
recorded in Northwest Europe where agriculture is particularly intensive (Pierre et al., 2013).
16
Agriculture is responsible for 60 % of the total riverine flux of nitrogen to the North Sea and
25% of the total phosphorous loading. In Czechoslovakia it was reported that agriculture
contributes 48% of the pollutants of surface waters (FAO, 1996). Norway and Finland
reported a significant eutrophication of surface waters arising from agricultural non–point
source pollution. The extensive use of large quantities of nitrogen and phosphorous
fertilizers is thought to be responsible for the proliferation of algae in the Adriatic and similar
information has been recorded in the Danish coastal waters (FAO, 1996). Danish statistics
indicated that manure contributes at least 50% of the leaching of inorganic nitrogen (FAO,
1996).
A study by FAO reported that 50% of the shallow ground water wells supplying over one
million rural residents in Lithuania are not fit for human consumption because of a wide
range of pollutants like pesticides and nitrates (FAO, 1994). The ECE, (1992) calculations
indicated that livestock wastes accounted for approximately 30% of the total phosphorous
load to the European inland waters, rest of the agriculture accounting for further 17%.
A study by Ryding (1986) demonstrated how lakes which were not affected by industrial or
municipal point sources underwent long term change in nutrient status as a result of
agricultural activities in the watershed. Between 1973 and 1981 the nutrient status of Lake
Oren in Sweden increased from 1000mg/m3 for total nitrogen and from 10mg/m3 to
45mg/m3 for total phosphorous. Lake transparency declined from 6.2m to 2,6m and
increased algal blooms.
In South Africa about 12 % of the landmass is arable land (Blaine, 2013). About 1.5% of this
landmass is under irrigation producing 30 % of the country’s crops (Blaine, 2013). Vast land
has been altered for crop production, resulting in an increase of nutrient laden runoff which is
causing high concentrations of nitrates and phosphates into water systems. Excessive
amounts of nutrients are delivered from cultivated land to streams especially in areas with
poor land management practices (Jackson et al., 1986; Carpenter et al., 1998, Vadas et al.,
2008; Diebel et al., 2009). According to Stone et al. (2003) non-point source (NPS) pollution
from agriculture may occur when nutrients are applied at rates greater than crops can utilize
or when timing of nutrient applications occurs in close proximity to heavy rains. High
concentrations of nutrients in water cause algal blooms and eutrophication, degrading aquatic
ecosystems and impair water use by humans and other uses (Sharpley et al., 1994; USEPA,
17
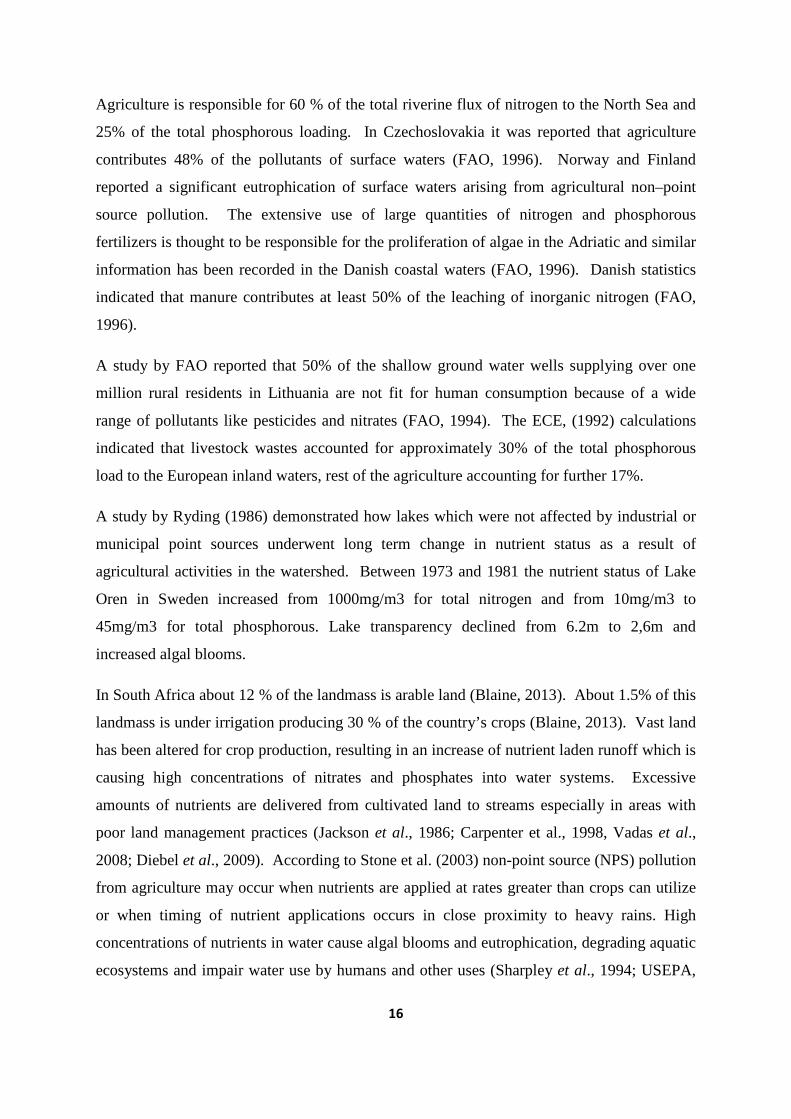
2000). Inappropriate agriculture practices intensify erosion processes raising sediment input
into water sources reducing water levels of reservoirs. Increased sediment loads make
drinking water treatment more difficult while also affecting fish and macro-invertebrates. As
a result agricultural runoff is impacting negatively on the water resources of South Africa
(Burger & Nel, 2008; CSIR, 2010).
2.3 EFFLUENT CHARACTERISTICS AND WATER QUALITY
2.3.1 Plant Nutrients
Plants require food in the form of macro and micro-nutrients for their growth and
development (Uchinda. 2000). For the effective utilisation of these nutrients optimum
conditions must be maintained. Macro nutrients are those that are essential to plant growth
and development and are needed in large quantities. These include elements like nitrogen,
phosphorous and potassium among others. Micro-nutrients are those that are needed by the
plants in minute quantities, however, they also play a vital role in plant growth and
development. Some of these micro–nutrients include copper, magnesium, and zinc, among
others.
2.3.2 Nitrogen
Nitrogen is one of the nutrients that are very essential to plant growth and development. It
exists in various soluble forms namely ammonium, nitrate, nitrites and urea (NRMED, 1996).
Nitrogen that is formed by biological nitrogen fixation within the roots not used by the plant
is released into the soil and converted into nitrate–nitrogen as roots die (Daniel, et al., 2007).
Nitrogen is present in the soil in many different forms like gas (N2); as various oxides of
nitrogen, such as nitrate (NO3) and nitrite (NO2); and as ammonia (NH3), amines (formed
from ammonia), or ammonium (NH4). Organic matter is a major storage area for nitrogen.
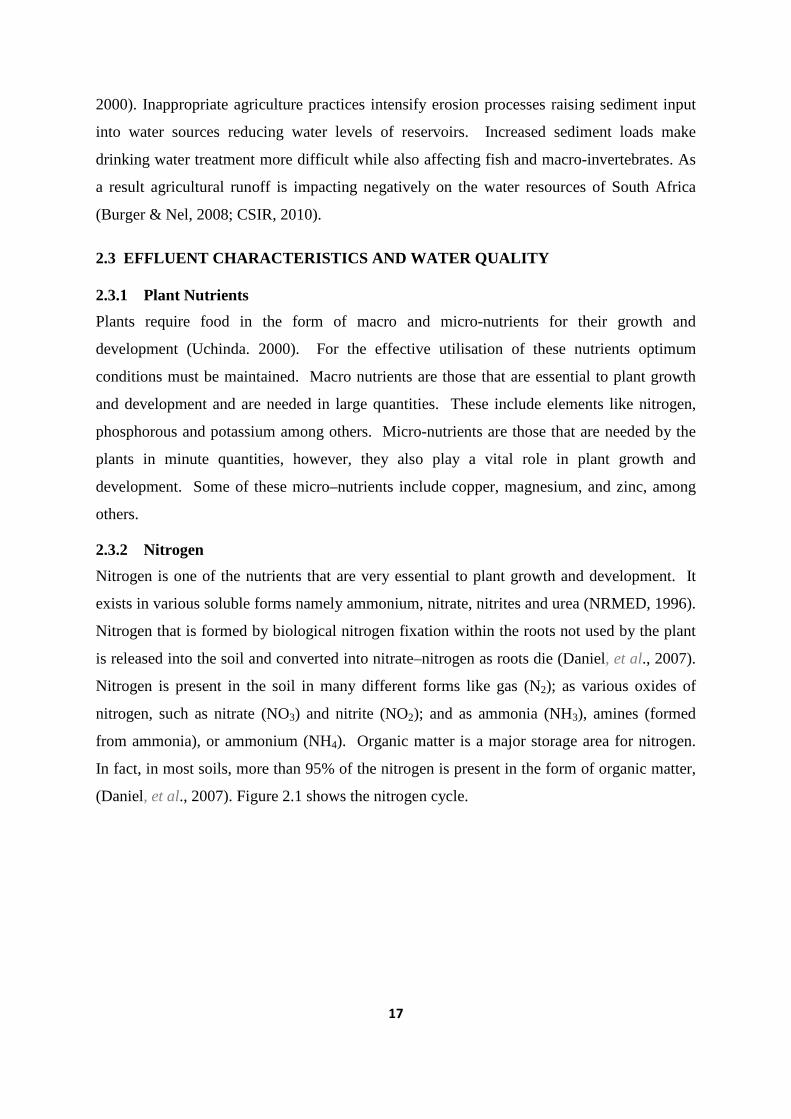
In fact, in most soils, more than 95% of the nitrogen is present in the form of organic matter,
(Daniel, et al., 2007). Figure 2.1 shows the nitrogen cycle.
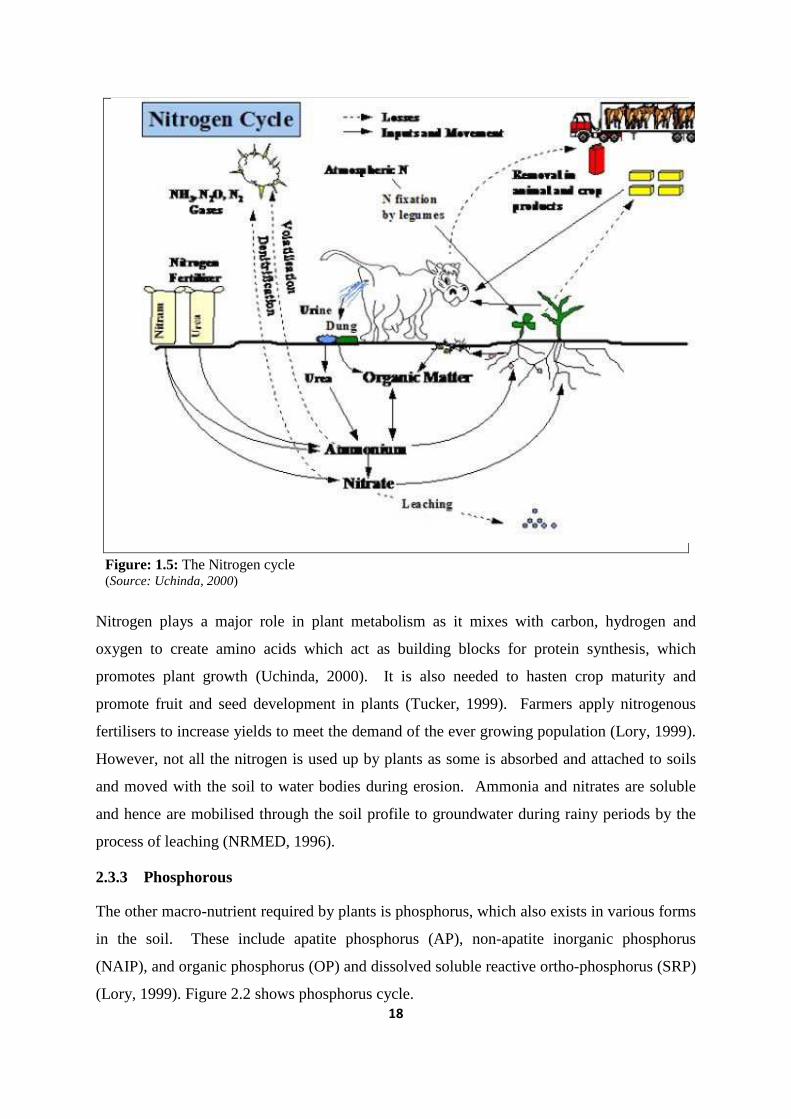
18
Figure: 1.5: The Nitrogen cycle (Source: Uchinda, 2000)
Nitrogen plays a major role in plant metabolism as it mixes with carbon, hydrogen and
oxygen to create amino acids which act as building blocks for protein synthesis, which
promotes plant growth (Uchinda, 2000). It is also needed to hasten crop maturity and
promote fruit and seed development in plants (Tucker, 1999). Farmers apply nitrogenous
fertilisers to increase yields to meet the demand of the ever growing population (Lory, 1999).
However, not all the nitrogen is used up by plants as some is absorbed and attached to soils
and moved with the soil to water bodies during erosion. Ammonia and nitrates are soluble
and hence are mobilised through the soil profile to groundwater during rainy periods by the
process of leaching (NRMED, 1996).
2.3.3 Phosphorous
The other macro-nutrient required by plants is phosphorus, which also exists in various forms
in the soil. These include apatite phosphorus (AP), non-apatite inorganic phosphorus
(NAIP), and organic phosphorus (OP) and dissolved soluble reactive ortho-phosphorus (SRP)
(Lory, 1999). Figure 2.2 shows phosphorus cycle.
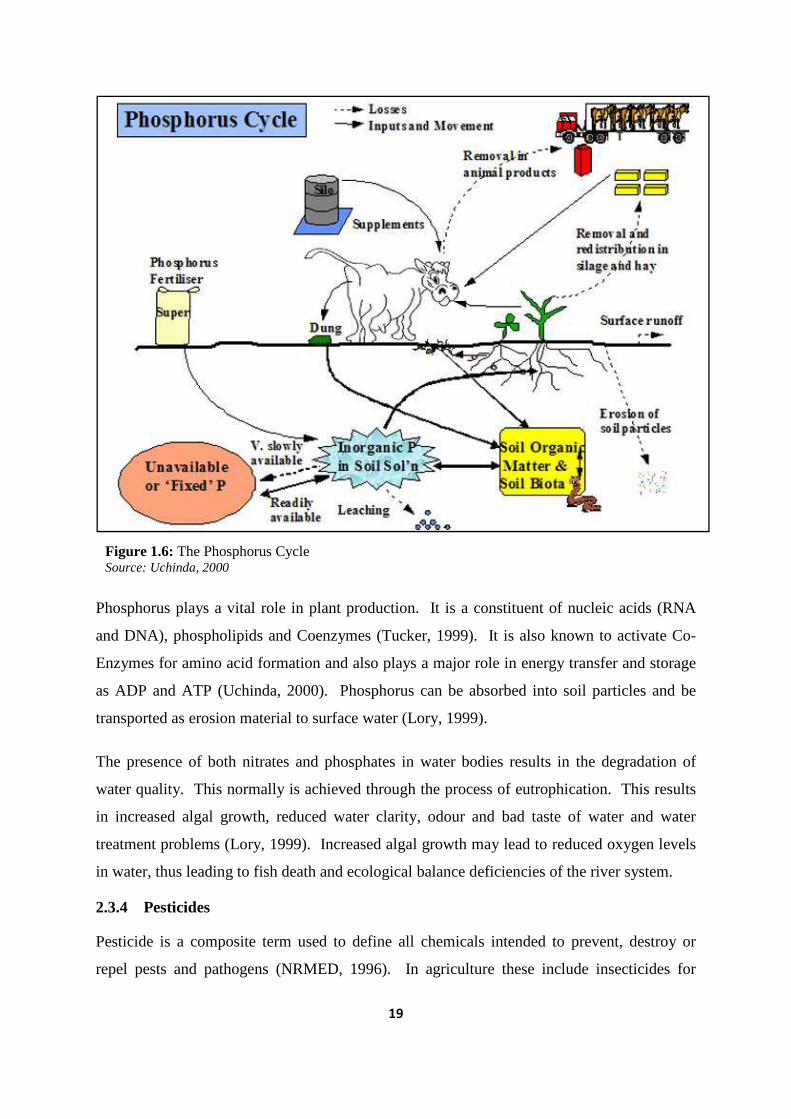
19
Figure 1.6: The Phosphorus Cycle Source: Uchinda, 2000
Phosphorus plays a vital role in plant production. It is a constituent of nucleic acids (RNA
and DNA), phospholipids and Coenzymes (Tucker, 1999). It is also known to activate Co-
Enzymes for amino acid formation and also plays a major role in energy transfer and storage
as ADP and ATP (Uchinda, 2000). Phosphorus can be absorbed into soil particles and be
transported as erosion material to surface water (Lory, 1999).
The presence of both nitrates and phosphates in water bodies results in the degradation of
water quality. This normally is achieved through the process of eutrophication. This results
in increased algal growth, reduced water clarity, odour and bad taste of water and water
treatment problems (Lory, 1999). Increased algal growth may lead to reduced oxygen levels
in water, thus leading to fish death and ecological balance deficiencies of the river system.
2.3.4 Pesticides
Pesticide is a composite term used to define all chemicals intended to prevent, destroy or
repel pests and pathogens (NRMED, 1996). In agriculture these include insecticides for
20
insects, herbicides to control weeds, fungicides for fungi and rodenticides for controlling
rodents.
Irrigation requires the modification of land and the hydrological regime which creates a
habitat that is conducive to breeding insects, e.g. mosquitoes which act as vectors for diseases
such as malaria. The continuous application of excess fertiliser may also trigger the
exponential growth of weeds. This in turn then requires the use of large volumes of pesticides
to control weeds as the insects may drastically reduce the yield if left uncontrolled. These
pesticides may find their way into surface water and groundwater through surface water
runoff or leaching respectively, depending on the soil properties and the slope, type of
pesticide used and the timing of the application.
The introduction of pesticides in groundwater or surface water results in the contamination of
water, which may travel far from the original sources. This may result in increased water
treatment costs. Besides these pesticides are toxic and may cause death to aquatic life.
21
Chapter 3
3 RESEARCH DESIGN AND METHODOLOGY
3.1 INTRODUCTION
The study aims to estimate the contribution of agricultural activities to the poor water quality
of the Vaal River, and to explore the current agricultural capacity, competence and
knowledge on the use and application of fertiliser. Hence in this chapter the research design
and methods that were used during this research are discussed. The relevance of the chosen
design and methods is also highlighted. The first section describes the research design while
the second section outlines the methods that were employed during the study.
3.2 RESEARCH DESIGN
This section discusses the two designs that were selected for this particular study. Each aim
or objective had its own appropriate design best suited for it. The two major designs that
were employed in this study are the ex- post factor research design and the survey design.
3.2.1 Ex-post factor research
To determine the correlation between agriculture effluent and its contribution to poor water
quality in the Grootdraai Dam the ex-post factor research design was selected. This design is
defined as research in which the independent variable or variables have already occurred and
in which the researcher starts with observation of the dependent variable or variables. The
independent variables are then studied in retrospect for their possible relations to and effects
on the dependent variable or variables (Kerlinger, 1964).
This research design can be used to substitute a true experimental research (Simon & Goes,
2013). Ex-post factor research design can be used to test hypothesis about cause and effect or
correlation relationships. This design shares some basic logic of inquiry with experimental
design.
It is characterised by:
� Explanation of a consequence based on antecedent conditions
� Determination of the influence of a variable on another variable.
� Testing a claim using statistics hypothesis testing techniques.
22
� Uses data already collected, but not necessarily amassed for research purpose.
However this method has its limitations which include:
� Non randomization assigned to treatment hence there could be inherent confound
in the variables studied.
� Sample cannot be considered random hence generalisation of the findings is
limited
� Little information about any drop outs from the treatment is known (Simon & Goes
2013).
The advantage in using this research design in this study is that the data was already collected
and hence obtaining permission to conduct the study was less involved (Simon & Goes,
2013). This constituted secondary data which is described as data or information that was
gathered by someone or institutions for other purposes than the one currently being
considered for (MacCaston, 2005). As such the information had already been collected by the
Department of Water Affairs.
3.2.2 Survey design
To explore the current agricultural capacity, competence and commitment of farmers to
achieve compliance with the environmental legislation the cross–sectional survey design was
chosen. A survey design is defined as the assessment of the current status, opinions, beliefs
and attitudes by questionnaires or interviews from a known population (McMillan &
Schumacher, 2001). According to McMillan and Schumacher (2001), a survey design
involves the selection of the samples of the respondents first before administering
questionnaires or conducting interviews
The cross–sectional survey design involves the collection of data at a point in time from a
sample selected to represent a larger population. The choice of this specific design was
informed by the choice of data that needed to be collected from the population group. In this
type of design there was a great potential to generalise to a larger population as an
appropriate sampling design was implemented (Mouton, 2001). Insufficient depth and
insider perspective may have led to criticism of “surface level” analysis according to Mouton,
(2001).
23
3.3 METHODOLOGY
For this research the predominant methodology adopted was quantitative methodology.
Quantitative methodology is regarded as a process that is systematic and objective in its ways
of using numerical data from only a selected subgroup of a universe to generalise the findings
to the universe that is being studied (Maree & Peterson, 2013).
3.4 SOURCES OF DATA
3.4.1 Laboratory analysis
Water samples from the Grootdraai Dam were collected and analysed by the Department of
Water Affairs (DWA). The parameters analysed were pH, Nitrates (N03-N) and Nitrites
(NO2-N) for Nitrogen and Phosphorus for agricultural nutrients and turbidity. These
parameters were analysed for water samples.
3.4.2 Rainfall and discharge data
Rainfall and temperature data was obtained from the South African Weather Services
(Appendix 9 and 10) respectively. Discharge data was collected from DWA. The data was
used to analyse and correlate water hydrological regime and concentration of agriculture
nutrients on the Grootdraai Dam.
3.4.3 Maps
The map showing the location of the Grootdraai Dam Catchment and the Vaal River shown
in Figure 3 was created from datasets obtained from National Geo-Spatial Information (NGI).
The landuse/cover map was derived from the National Land Cover 2000 data set developed
by the Satellite Application Centre (SAC) of The Council for Scientific and industrial
Research (CSIR, 2003). A map of the area of the basin and landuse of the catchment was also
developed from data obtained from the National Geo-Spatial Information (NGI). The datasets
were very useful sources of information for the analysis of agricultural non-point source
pollution.
3.4.4 Observation
A systematic observation method was chosen to record the behavioural patterns of algal
blooms within the Grootdraai Dam and its two tributaries. A structured observation method
was chosen. Monthly observations were made on the Vaal River (mainstream) and two of its
tributaries (T1 and T2). The parameters that were observed were (a) the presence or absence
of algal blooms, and (b) the quantity or amount of algal blooms.
24
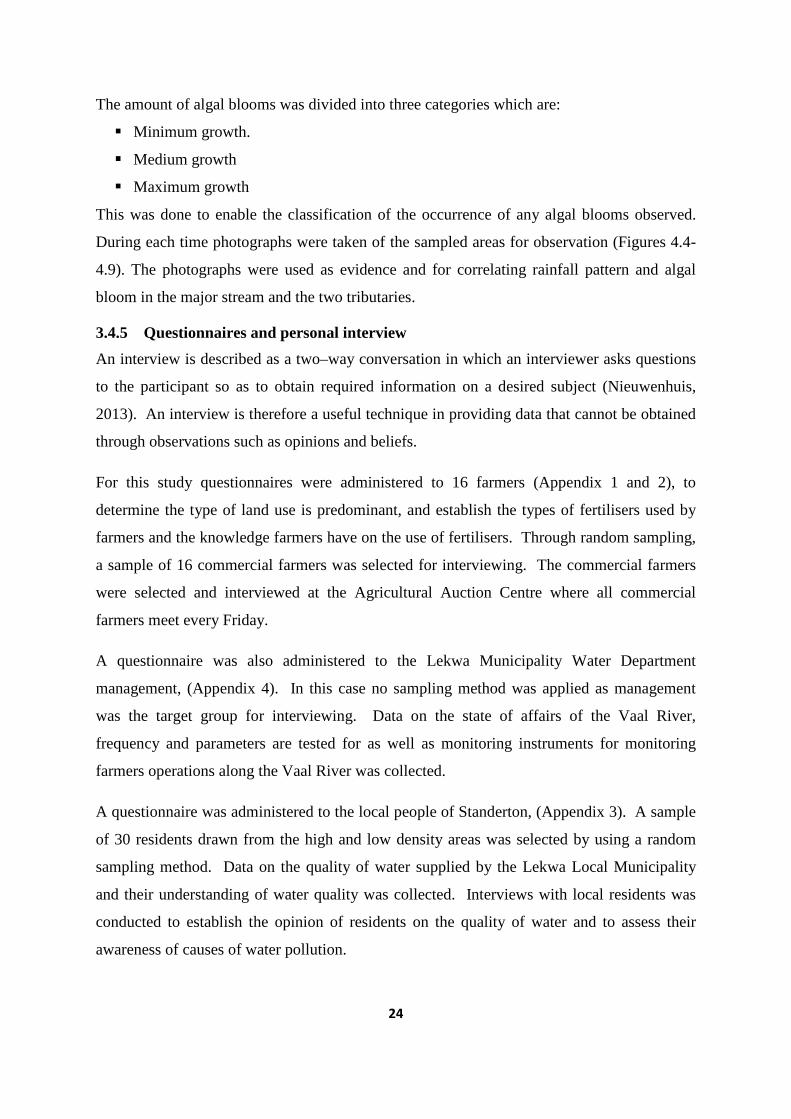
The amount of algal blooms was divided into three categories which are:
� Minimum growth.
� Medium growth
� Maximum growth
This was done to enable the classification of the occurrence of any algal blooms observed.
During each time photographs were taken of the sampled areas for observation (Figures 4.4-
4.9). The photographs were used as evidence and for correlating rainfall pattern and algal
bloom in the major stream and the two tributaries.
3.4.5 Questionnaires and personal interview
An interview is described as a two–way conversation in which an interviewer asks questions
to the participant so as to obtain required information on a desired subject (Nieuwenhuis,
2013). An interview is therefore a useful technique in providing data that cannot be obtained
through observations such as opinions and beliefs.
For this study questionnaires were administered to 16 farmers (Appendix 1 and 2), to
determine the type of land use is predominant, and establish the types of fertilisers used by
farmers and the knowledge farmers have on the use of fertilisers. Through random sampling,
a sample of 16 commercial farmers was selected for interviewing. The commercial farmers
were selected and interviewed at the Agricultural Auction Centre where all commercial
farmers meet every Friday.
A questionnaire was also administered to the Lekwa Municipality Water Department
management, (Appendix 4). In this case no sampling method was applied as management
was the target group for interviewing. Data on the state of affairs of the Vaal River,
frequency and parameters are tested for as well as monitoring instruments for monitoring
farmers operations along the Vaal River was collected.
A questionnaire was administered to the local people of Standerton, (Appendix 3). A sample
of 30 residents drawn from the high and low density areas was selected by using a random
sampling method. Data on the quality of water supplied by the Lekwa Local Municipality
and their understanding of water quality was collected. Interviews with local residents was
conducted to establish the opinion of residents on the quality of water and to assess their
awareness of causes of water pollution.
25
3.5 DATA ANALYSIS PROCEDURE
The selection of data analysis method is a key factor in achieving the aim and objectives of
the study (Johnson & Gray, 2010). In this study, the constant comparison method was used.
According to (Cohen et al., 2007), this method allows for the comparison of indicators,
categories and theories that have been developed with primary data to achieve a perfect fit
between categories and data.
3.5.1 Quantitative analysis
Data obtained from DWA was analysed quantitatively. Correlation methods were used to
establish the relationship between rainfall within the catchment and the concentration of
agriculture nutrients in the Grootdraai Dam. A student t-test was used to determine the
significance between the means of the first and second decades for both nitrogen and
phosphorus. Descriptive statistics such percentages were used to analyse information
obtained from survey questionnaires and frequency of fertilizer application. Graphical and
tabulation methods were also used to summarise data.
3.6 TRUSTWORTHINESS
Credibility is used in qualitative research to refer to the correspondence between what the
participants said and how interviewer portrays their points of view. In this particular study
the credibility of the interviews was evaluated by employing various methods which includes
consistency checks or stakeholder checks, comparison with previous research on similar topic
and independent coding as suggested by (Thomas, 2003).
Consistency checks involved providing the opportunities for stakeholders, like farmers,
participants and the Lekwa Local Municipality to comment on the categories, interpretations
and conclusions made. This process of engagement was a continuous process meaning that it
was done at each and every stage throughout the study. It eliminated any irregularities that
arose during the study.
An independent coding method, which involved giving an independent coder the research
objectives and the raw data that was used to create categories to create his own codes, was
done as suggested by (Thomas, 2003). These were then compared to the one done to
establish if there was any inconsistency.
26
3.7 ETHICAL CONSIDERATION
During the data collection process it was of paramount importance to get an in-depth account
of the phenomenon which required that participants should be free to express their
experience. This required a mutual understanding between the researcher and the
participants. Creswell (2012) suggested that this could be achieved by informed consent
entered into between the participant and the researcher, voluntary participation, right to
privacy, respect towards all the participants and confidentiality. Before data collection an
ethical clearance certificate was obtained from the University of South Africa. Once cleared,
permission was granted by the Lekwa Local Municipality to conduct the research. The
purpose of the research was clearly explained to the participants. Confidentiality contracts
were designed and entered into with the participants to ensure that whatever information
obtained was protected. Consent forms were also designed and sighed by the participants as
proof of their consent to be interviewed.
It was explicitly explained to the participants of their rights to take part or refuse or even pull-
out at any time if they felt uncomfortable to continue with the interview. All participants
were treated equally and with due respect they deserved. All the information obtained was
treated confidentially and anonymity was guaranteed.
3.8 LIMITATIONS OF STUDY
There were some gaps on the data that was obtained from DWA. Data was not consistent in
the collection of samples and consequent analysis was not uniform. There were months
without or with incomplete data, hence this made it difficult to calculate the means for each
year.
Data for pesticides analysis was not readily available from DWA. Hence the only
information obtained was from the survey from farmers on the frequency and application of
pesticides.
27
Chapter 4
4 DATA ANALYSIS AND RESULTS
4.1 INTRODUCTION
To further substantiate the physical-chemical properties of water in the Vaal River within the
study area and their possible causes a survey was carried out on the local residents of
Standerton, the Department of Water Affairs in Lekwa Municipality and the local farmers.
The survey was based on a number of parameters that could affect the physical-chemical
properties of the quality of water such as type of farming, types of fertilisers used and their
frequency of use and any control measures implemented on their use. The legislation that
governs the protection of the environment and water resources within the study area was also
implored. Therefore, this chapter presents and analyses all the findings in this regard.
4.2 FOUL SMELL ON WATER SUPPLIED BY LEKWA MUNICIPALITY
Residents were asked if they had at any point in time detected any foul smell from the tap
water supplied by Lekwa Municipality. The results of that survey indicated that 80% of the
sample population confirmed having detected a foul smell on tap water and 20% did not
detect any foul smell on the tap water.
Furthermore the sample population was asked to give an opinion on the quality of water
supplied by the municipality. About 54% of the sample population rated the water as of poor
quality while 17% rated the water as of good quality and 29% was unsure if the water was of
poor quality or not.
On the observation of green algae in any section of the Vaal River within the study area 57%
of the sample population confirmed having observed green algae growing in the river while
43% had not observed any form of algal growth within the Vaal River at any point in time.
About 51% of the population confirmed having observed dead aquatic animals such as fish
within the Vaal River while 49% did not observe any dead organisms at all.
The Lekwa Municipality water department acknowledged that the quality of water in the
Vaal River was generally deteriorating. However the reason given for the poor water quality
was a dysfunctional or poor sewer treatment quality works. The Lekwa water department
pointed out that nutrient testing and analysis of Phosphorus and Nitrogen was not done or
28
carried out by Lekwa Municipality and as such the municipality was not responsible for any
such tests and analysis on the Vaal River in the study area.
Questions on the environmental legislation governing farmers operations along the Vaal
River catchment area were not answered by the Department of Water Affairs and the same
was done for the questions on any visits paid to farmers to monitor and ensure compliance.
4.3 TYPE OF FARMING IN THE GROOTDRAAI DAM CATCHMENT
Agriculture has many sub-sectors such as animal husbandry, crop farming, horticulture
and etc. Most farmers in the Grootdraai Dam Catchment practice mixed farming that is
they practise both crop farming and animal husbandry. Mixed farmers constituted 56%
of the sample population. About 31 % of the farmers in the study area practice animal
husbandry only while 13 % are limited to plant or crop production as indicated in table
4.1 which shows the types and percentage representative of agriculture types practiced in
within the study area.
Table 4.1: Types of agriculture practiced in the catchment Type of farming Frequency (%) Animal husbandry 5 31 Crop farming 2 13 Mixed farming 9 56
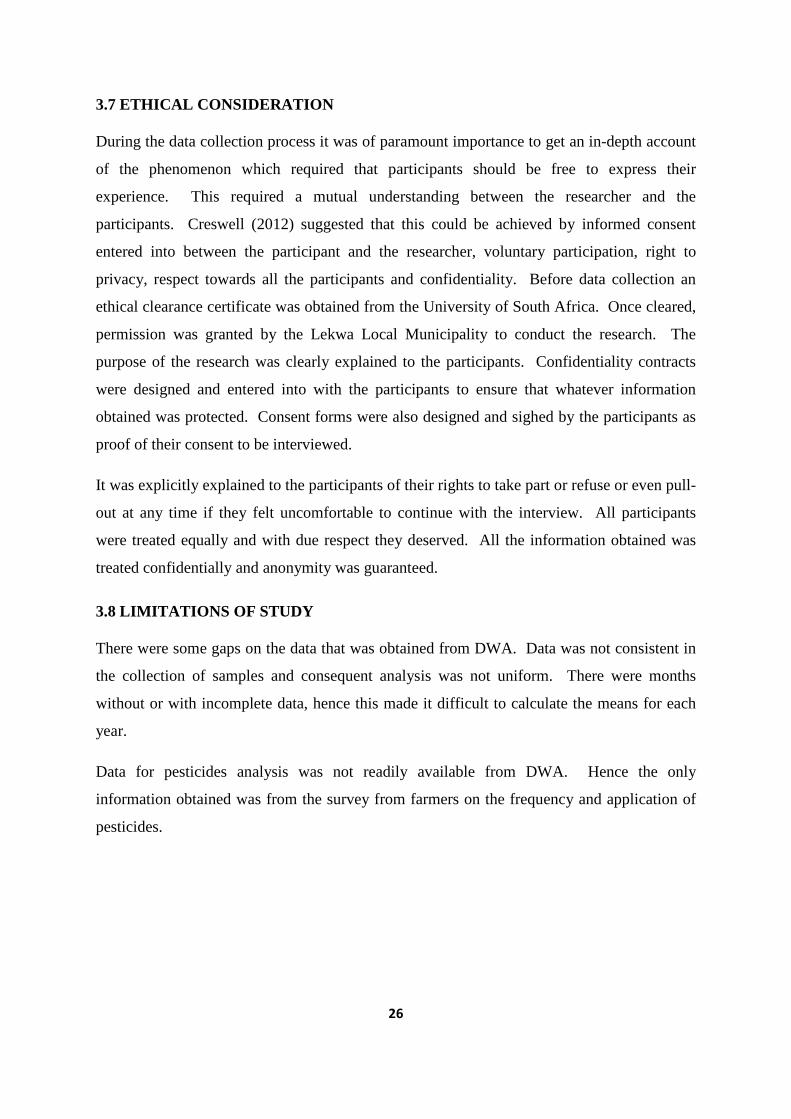
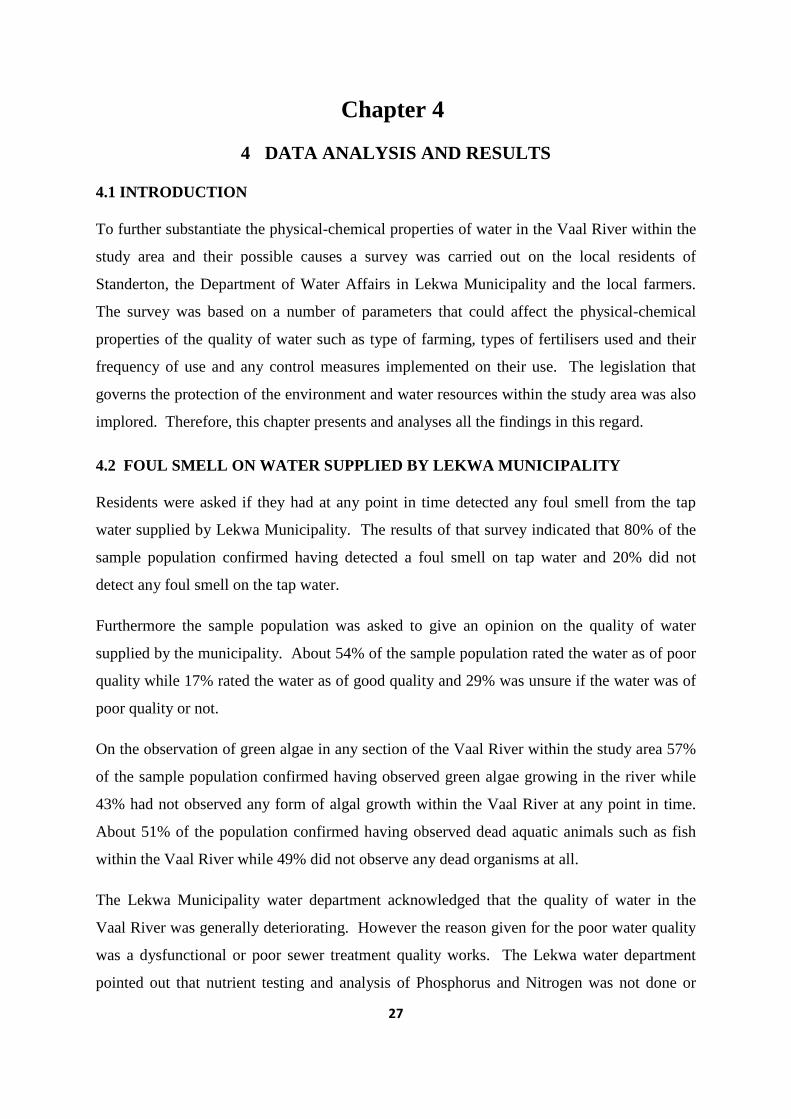
4.4 DISTANCE OF FARMS FROM THE VAAL RIVER
In a survey conducted to determine the distance of farms from the river it was established that
about 56% of the commercial farms in the study area are located very close to the water
bodies, within a distance of 0 to 5km from the river. This information is also supported by
the visual observations made during the study period. Figures 4.1 and 4.2 show how close
some farms are to water bodies.
The distance between the farmlands and water-bodies has been gradually reduced as can be
appreciated in Figures 4.1 and 4.2. This could be caused by the need to produce more food to
meet the demands of the ever increasing population hence leading to the gradual destruction
of buffer zones.
29
Figure 4.1 Shows how close farms are to the Vaal River in Standerton area (Photo taken in February 2014)
Figure 4.2: The non-existence of buffer zones in some farms in Standerton (Photo taken in February 2014)
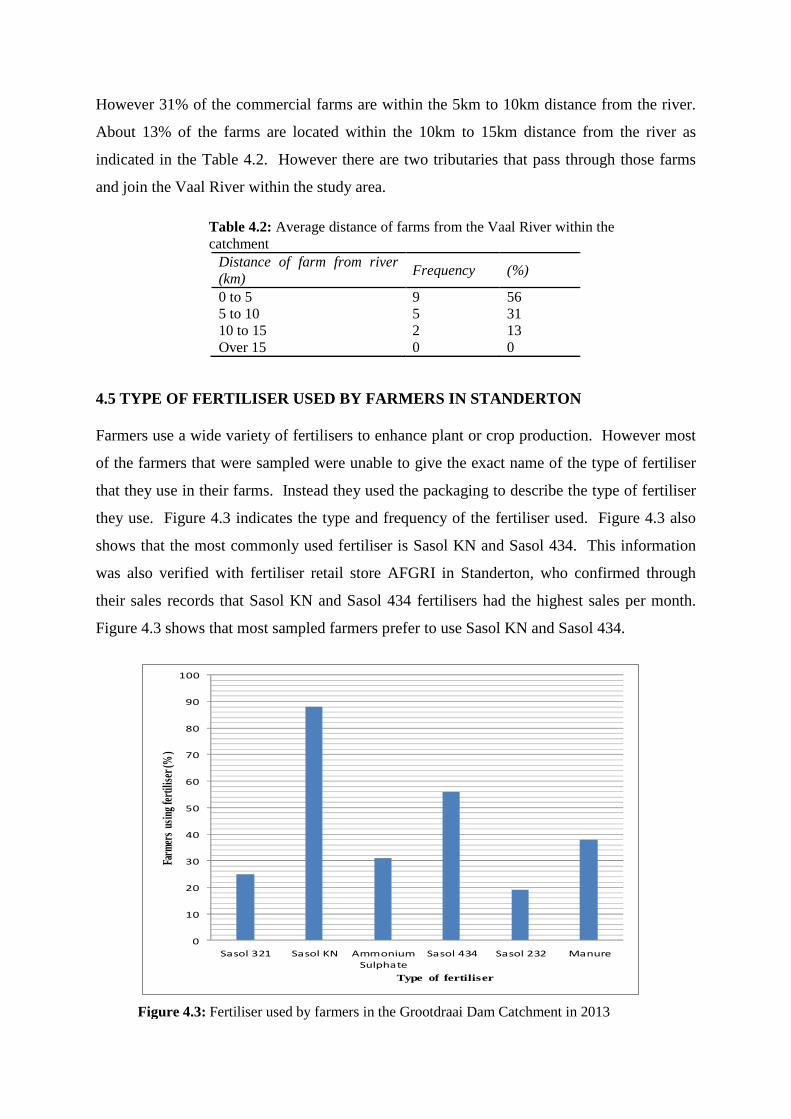
30
However 31% of the commercial farms are within the 5km to 10km distance from the river.
About 13% of the farms are located within the 10km to 15km distance from the river as
indicated in the Table 4.2. However there are two tributaries that pass through those farms
and join the Vaal River within the study area.
Table 4.2: Average distance of farms from the Vaal River within the catchment
Distance of farm from river (km)
Frequency (%)
0 to 5 9 56 5 to 10 5 31 10 to 15 2 13 Over 15 0 0
4.5 TYPE OF FERTILISER USED BY FARMERS IN STANDERTON
Farmers use a wide variety of fertilisers to enhance plant or crop production. However most
of the farmers that were sampled were unable to give the exact name of the type of fertiliser
that they use in their farms. Instead they used the packaging to describe the type of fertiliser
they use. Figure 4.3 indicates the type and frequency of the fertiliser used. Figure 4.3 also
shows that the most commonly used fertiliser is Sasol KN and Sasol 434. This information
was also verified with fertiliser retail store AFGRI in Standerton, who confirmed through
their sales records that Sasol KN and Sasol 434 fertilisers had the highest sales per month.
Figure 4.3 shows that most sampled farmers prefer to use Sasol KN and Sasol 434.
0
10
20
30
40
50
60
70
80
90
100
Sasol 321 Sasol KN Ammonium
Sulphate
Sasol 434 Sasol 232 Manure
Farm
ers
using
ferti
liser
(%)
Type of fertiliser
Figure 4.3: Fertiliser used by farmers in the Grootdraai Dam Catchment in 2013
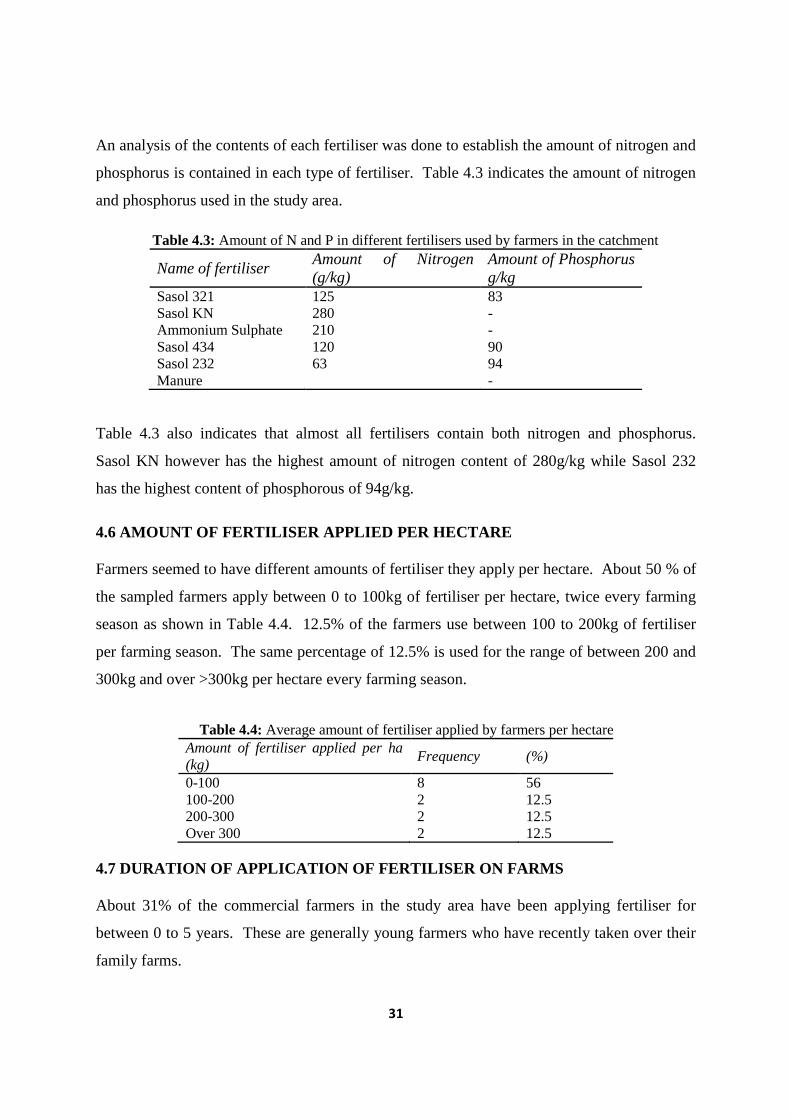
31
An analysis of the contents of each fertiliser was done to establish the amount of nitrogen and
phosphorus is contained in each type of fertiliser. Table 4.3 indicates the amount of nitrogen
and phosphorus used in the study area.
Table 4.3: Amount of N and P in different fertilisers used by farmers in the catchment
Name of fertiliser Amount of Nitrogen (g/kg)
Amount of Phosphorus g/kg
Sasol 321 125 83 Sasol KN 280 - Ammonium Sulphate 210 - Sasol 434 120 90 Sasol 232 63 94 Manure
-
Table 4.3 also indicates that almost all fertilisers contain both nitrogen and phosphorus.
Sasol KN however has the highest amount of nitrogen content of 280g/kg while Sasol 232
has the highest content of phosphorous of 94g/kg.
4.6 AMOUNT OF FERTILISER APPLIED PER HECTARE
Farmers seemed to have different amounts of fertiliser they apply per hectare. About 50 % of
the sampled farmers apply between 0 to 100kg of fertiliser per hectare, twice every farming
season as shown in Table 4.4. 12.5% of the farmers use between 100 to 200kg of fertiliser
per farming season. The same percentage of 12.5% is used for the range of between 200 and
300kg and over >300kg per hectare every farming season.
Table 4.4: Average amount of fertiliser applied by farmers per hectare Amount of fertiliser applied per ha (kg)
Frequency (%)
0-100 8 56 100-200 2 12.5 200-300 2 12.5 Over 300 2 12.5
4.7 DURATION OF APPLICATION OF FERTILISER ON FARMS
About 31% of the commercial farmers in the study area have been applying fertiliser for
between 0 to 5 years. These are generally young farmers who have recently taken over their
family farms.
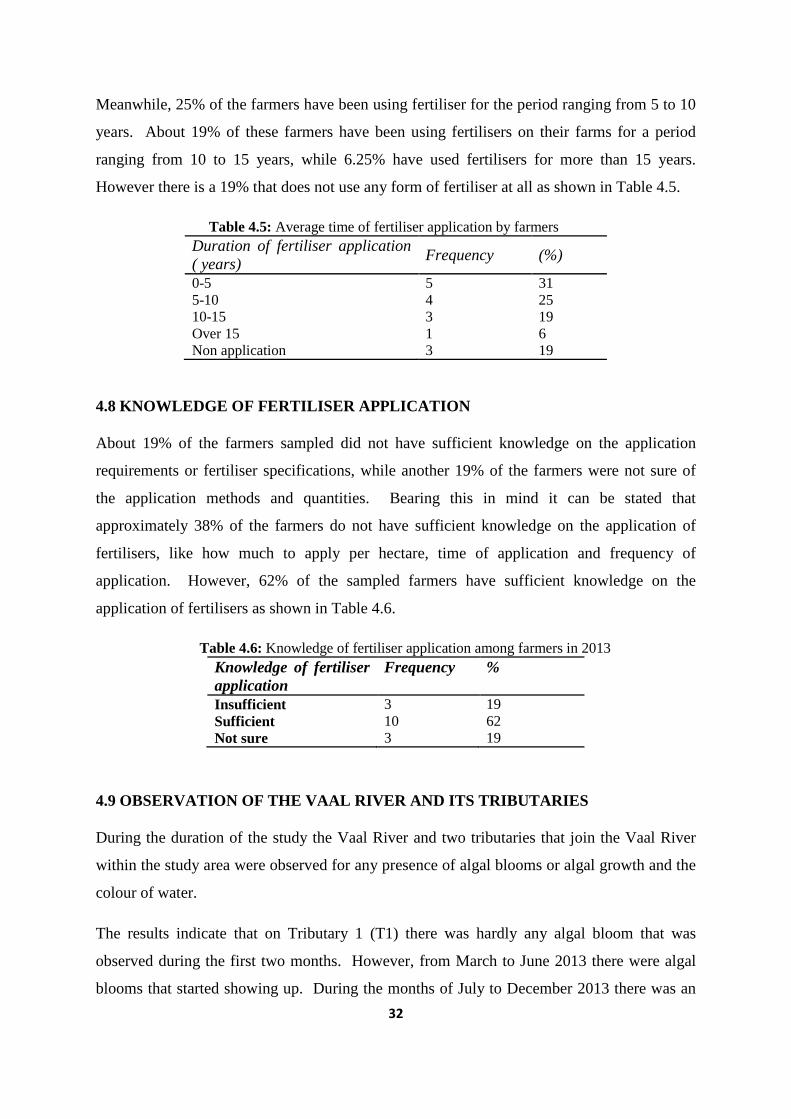
32
Meanwhile, 25% of the farmers have been using fertiliser for the period ranging from 5 to 10
years. About 19% of these farmers have been using fertilisers on their farms for a period
ranging from 10 to 15 years, while 6.25% have used fertilisers for more than 15 years.
However there is a 19% that does not use any form of fertiliser at all as shown in Table 4.5.
Table 4.5: Average time of fertiliser application by farmers Duration of fertiliser application ( years)
Frequency (%)
0-5 5 31 5-10 4 25 10-15 3 19 Over 15 1 6 Non application 3 19
4.8 KNOWLEDGE OF FERTILISER APPLICATION
About 19% of the farmers sampled did not have sufficient knowledge on the application
requirements or fertiliser specifications, while another 19% of the farmers were not sure of
the application methods and quantities. Bearing this in mind it can be stated that
approximately 38% of the farmers do not have sufficient knowledge on the application of
fertilisers, like how much to apply per hectare, time of application and frequency of
application. However, 62% of the sampled farmers have sufficient knowledge on the
application of fertilisers as shown in Table 4.6.
Table 4.6: Knowledge of fertiliser application among farmers in 2013 Knowledge of fertiliser application
Frequency %
Insufficient 3 19 Sufficient 10 62 Not sure 3 19
4.9 OBSERVATION OF THE VAAL RIVER AND ITS TRIBUTARIES
During the duration of the study the Vaal River and two tributaries that join the Vaal River
within the study area were observed for any presence of algal blooms or algal growth and the
colour of water.
The results indicate that on Tributary 1 (T1) there was hardly any algal bloom that was
observed during the first two months. However, from March to June 2013 there were algal
blooms that started showing up. During the months of July to December 2013 there was an
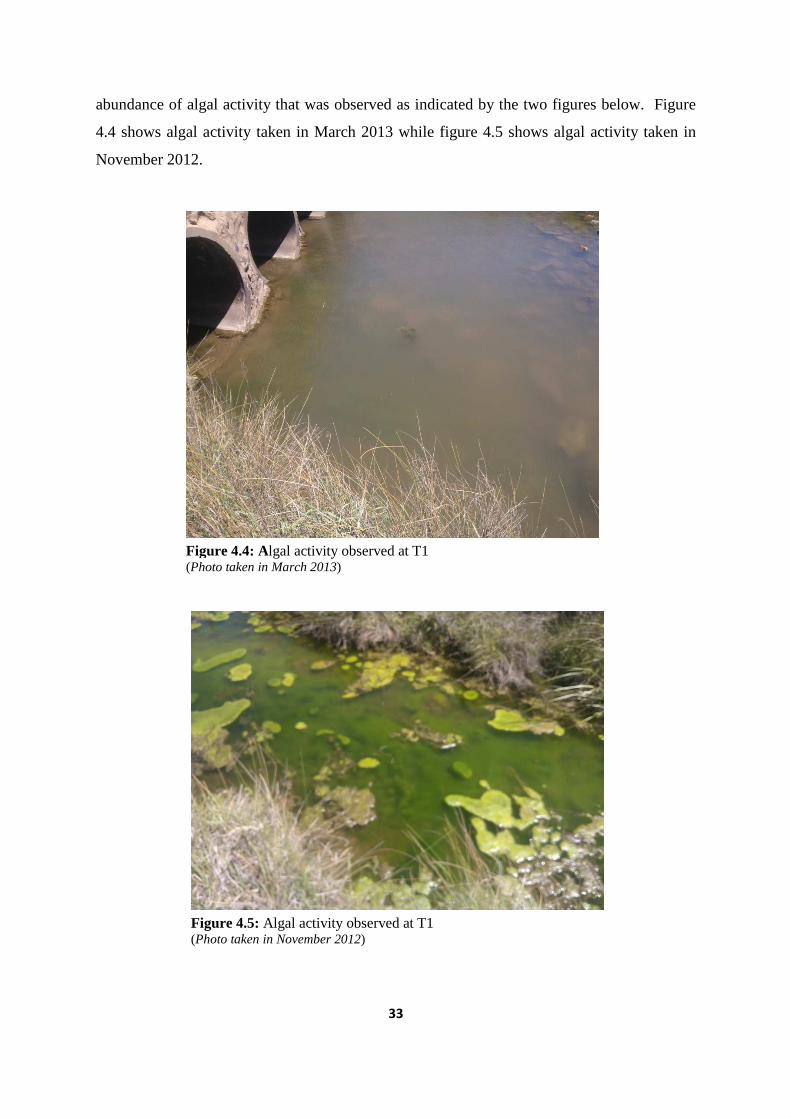
33
abundance of algal activity that was observed as indicated by the two figures below. Figure
4.4 shows algal activity taken in March 2013 while figure 4.5 shows algal activity taken in
November 2012.
Figure 4.4: Algal activity observed at T1 (Photo taken in March 2013)
Figure 4.5: Algal activity observed at T1 (Photo taken in November 2012)
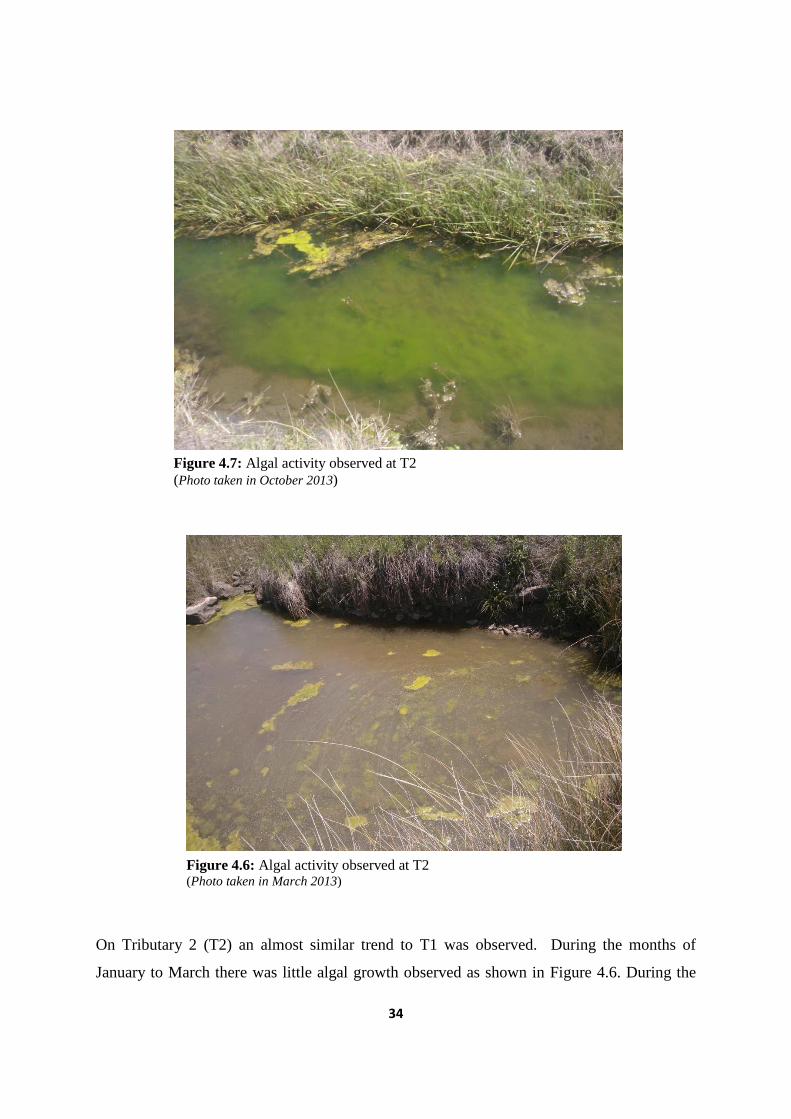
34
On Tributary 2 (T2) an almost similar trend to T1 was observed. During the months of
January to March there was little algal growth observed as shown in Figure 4.6. During the
Figure 4.6: Algal activity observed at T2 (Photo taken in March 2013)
Figure 4.7: Algal activity observed at T2 (Photo taken in October 2013)
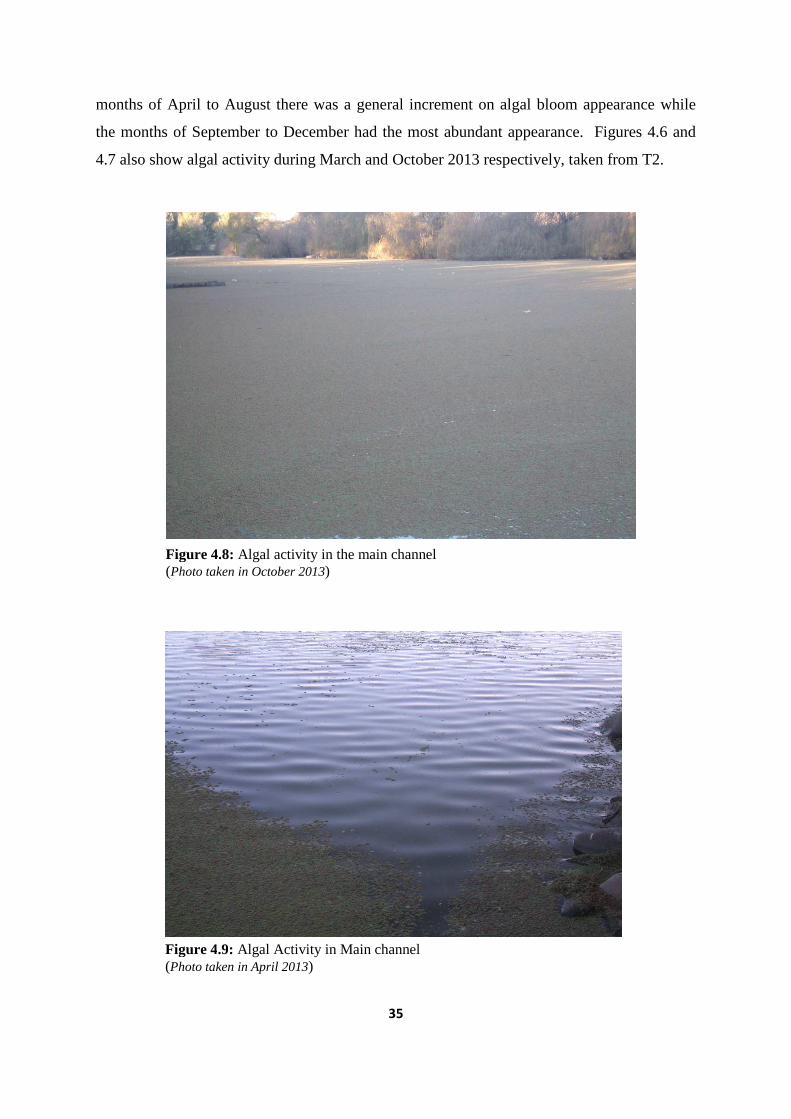
35
months of April to August there was a general increment on algal bloom appearance while
the months of September to December had the most abundant appearance. Figures 4.6 and
4.7 also show algal activity during March and October 2013 respectively, taken from T2.
Figure 4.8: Algal activity in the main channel (Photo taken in October 2013)
Figure 4.9: Algal Activity in Main channel (Photo taken in April 2013)
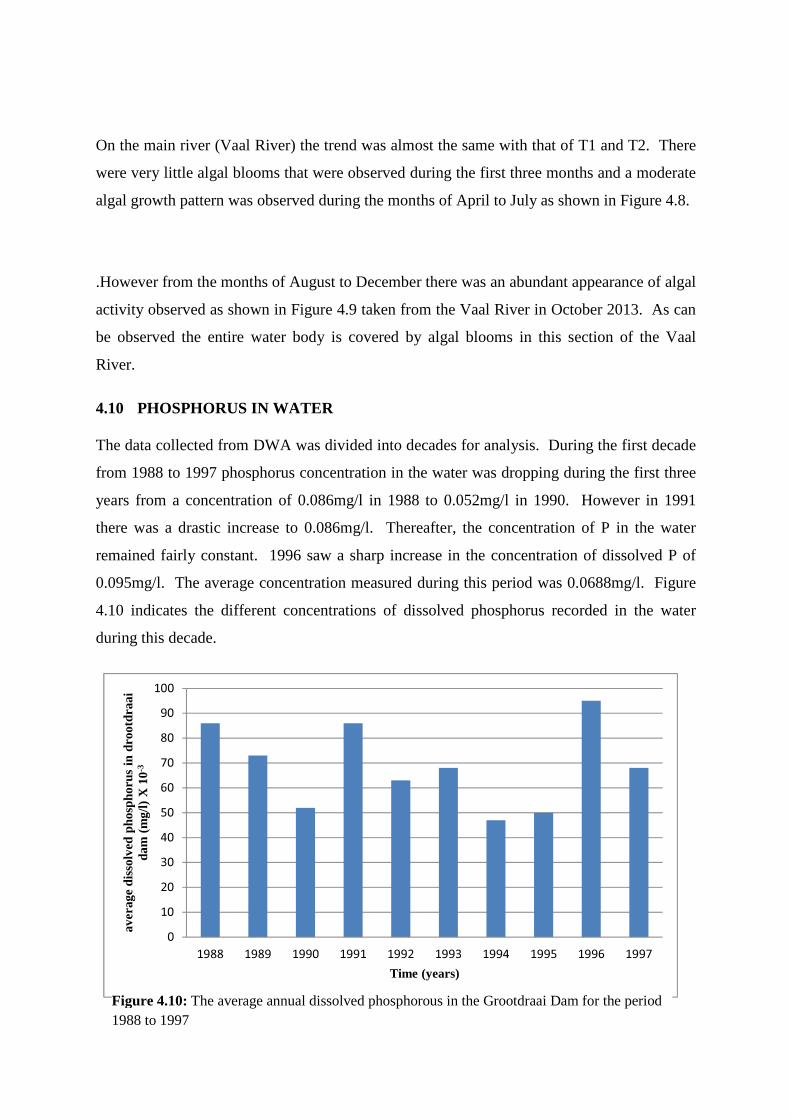
36
On the main river (Vaal River) the trend was almost the same with that of T1 and T2. There
were very little algal blooms that were observed during the first three months and a moderate
algal growth pattern was observed during the months of April to July as shown in Figure 4.8.
.However from the months of August to December there was an abundant appearance of algal
activity observed as shown in Figure 4.9 taken from the Vaal River in October 2013. As can
be observed the entire water body is covered by algal blooms in this section of the Vaal
River.
4.10 PHOSPHORUS IN WATER
The data collected from DWA was divided into decades for analysis. During the first decade
from 1988 to 1997 phosphorus concentration in the water was dropping during the first three
years from a concentration of 0.086mg/l in 1988 to 0.052mg/l in 1990. However in 1991
there was a drastic increase to 0.086mg/l. Thereafter, the concentration of P in the water
remained fairly constant. 1996 saw a sharp increase in the concentration of dissolved P of
0.095mg/l. The average concentration measured during this period was 0.0688mg/l. Figure
4.10 indicates the different concentrations of dissolved phosphorus recorded in the water
during this decade.
0
10
20
30
40
50
60
70
80
90
100
1988 1989 1990 1991 1992 1993 1994 1995 1996 1997
aver
age
diss
olve
d ph
osph
orus
in d
root
draa
i da
m (
mg/
l) X
10-
3
Time (years)
Figure 4.10: The average annual dissolved phosphorous in the Grootdraai Dam for the period 1988 to 1997
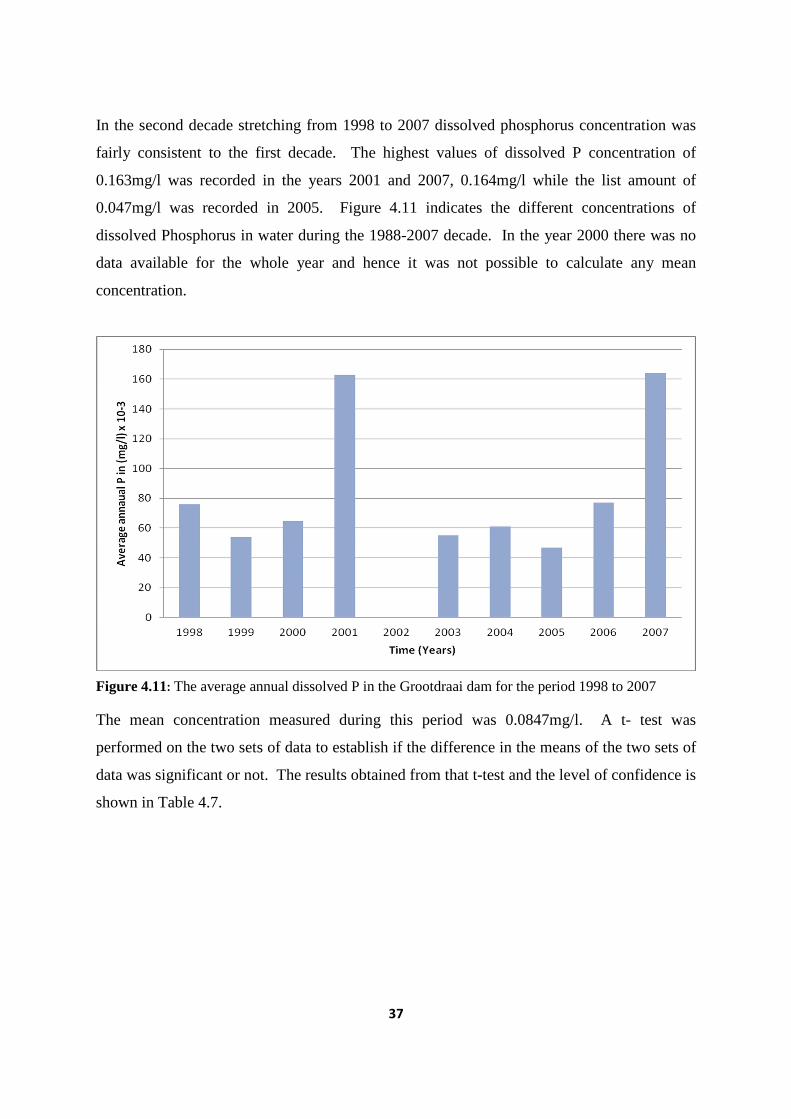
37
In the second decade stretching from 1998 to 2007 dissolved phosphorus concentration was
fairly consistent to the first decade. The highest values of dissolved P concentration of
0.163mg/l was recorded in the years 2001 and 2007, 0.164mg/l while the list amount of
0.047mg/l was recorded in 2005. Figure 4.11 indicates the different concentrations of
dissolved Phosphorus in water during the 1988-2007 decade. In the year 2000 there was no
data available for the whole year and hence it was not possible to calculate any mean
concentration.
The mean concentration measured during this period was 0.0847mg/l. A t- test was
performed on the two sets of data to establish if the difference in the means of the two sets of
data was significant or not. The results obtained from that t-test and the level of confidence is
shown in Table 4.7.
Figure 4.11: The average annual dissolved P in the Grootdraai dam for the period 1998 to 2007
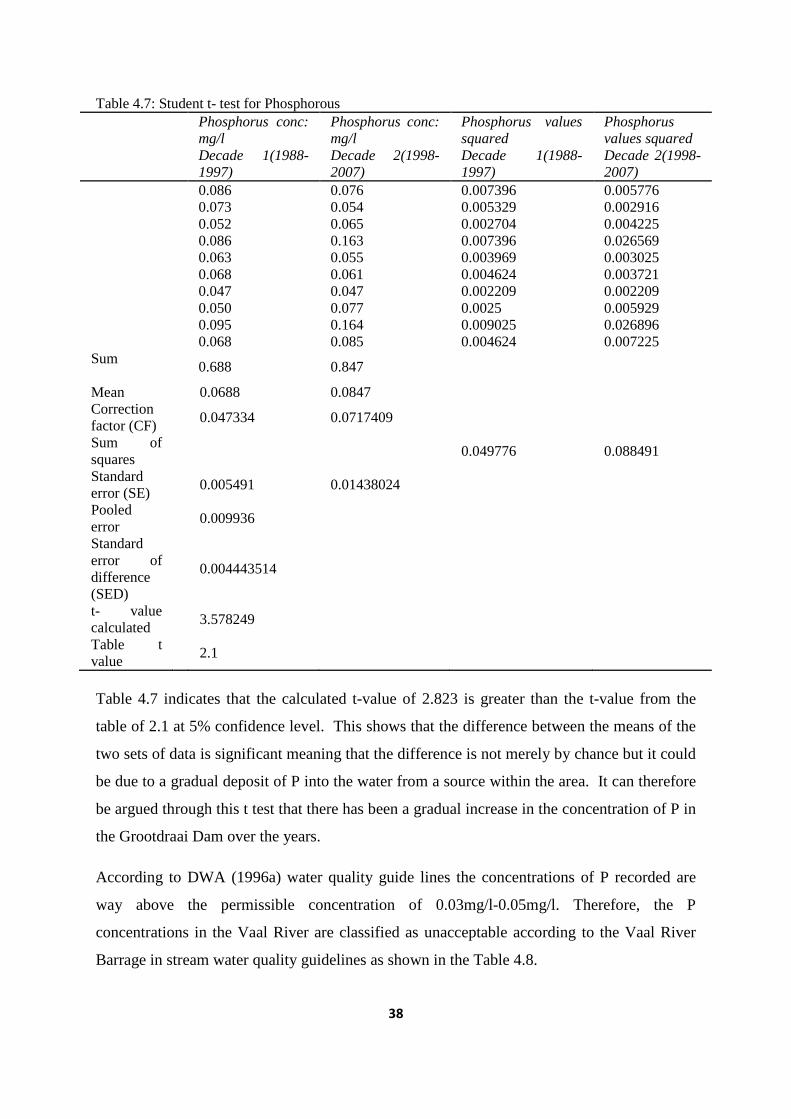
38
Table 4.7: Student t- test for Phosphorous Phosphorus conc:
mg/l Decade 1(1988-1997)
Phosphorus conc: mg/l Decade 2(1998-2007)
Phosphorus values squared Decade 1(1988-1997)
Phosphorus values squared Decade 2(1998-2007)
0.086 0.076 0.007396 0.005776 0.073 0.054 0.005329 0.002916 0.052 0.065 0.002704 0.004225 0.086 0.163 0.007396 0.026569 0.063 0.055 0.003969 0.003025 0.068 0.061 0.004624 0.003721 0.047 0.047 0.002209 0.002209 0.050 0.077 0.0025 0.005929 0.095 0.164 0.009025 0.026896 0.068 0.085 0.004624 0.007225 Sum
0.688 0.847
Mean 0.0688 0.0847 Correction factor (CF)
0.047334 0.0717409
Sum of squares
0.049776 0.088491
Standard error (SE)
0.005491 0.01438024
Pooled error
0.009936
Standard error of difference (SED)
0.004443514
t- value calculated
3.578249
Table t value
2.1
Table 4.7 indicates that the calculated t-value of 2.823 is greater than the t-value from the
table of 2.1 at 5% confidence level. This shows that the difference between the means of the
two sets of data is significant meaning that the difference is not merely by chance but it could
be due to a gradual deposit of P into the water from a source within the area. It can therefore
be argued through this t test that there has been a gradual increase in the concentration of P in
the Grootdraai Dam over the years.
According to DWA (1996a) water quality guide lines the concentrations of P recorded are
way above the permissible concentration of 0.03mg/l-0.05mg/l. Therefore, the P
concentrations in the Vaal River are classified as unacceptable according to the Vaal River
Barrage in stream water quality guidelines as shown in the Table 4.8.
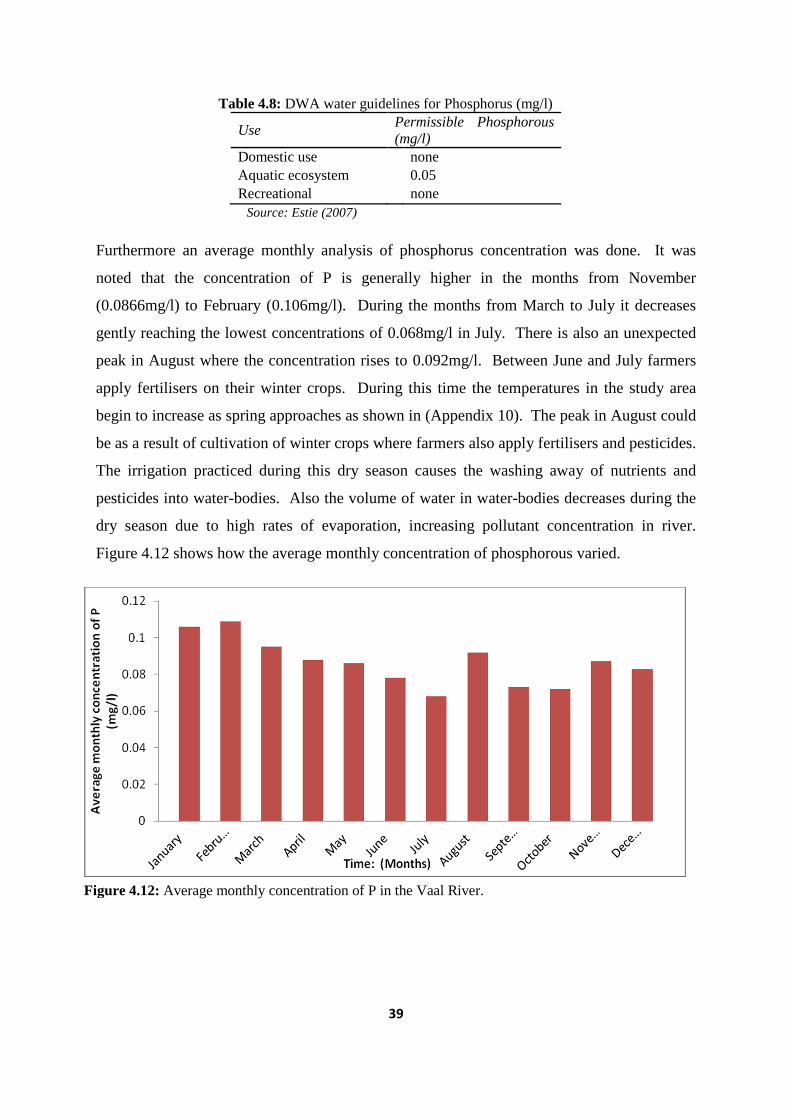
39
Table 4.8: DWA water guidelines for Phosphorus (mg/l)
Use Permissible Phosphorous (mg/l)
Domestic use none Aquatic ecosystem 0.05 Recreational none
Source: Estie (2007)
Furthermore an average monthly analysis of phosphorus concentration was done. It was
noted that the concentration of P is generally higher in the months from November
(0.0866mg/l) to February (0.106mg/l). During the months from March to July it decreases
gently reaching the lowest concentrations of 0.068mg/l in July. There is also an unexpected
peak in August where the concentration rises to 0.092mg/l. Between June and July farmers
apply fertilisers on their winter crops. During this time the temperatures in the study area
begin to increase as spring approaches as shown in (Appendix 10). The peak in August could
be as a result of cultivation of winter crops where farmers also apply fertilisers and pesticides.
The irrigation practiced during this dry season causes the washing away of nutrients and
pesticides into water-bodies. Also the volume of water in water-bodies decreases during the
dry season due to high rates of evaporation, increasing pollutant concentration in river.
Figure 4.12 shows how the average monthly concentration of phosphorous varied.
Figure 4.12: Average monthly concentration of P in the Vaal River.
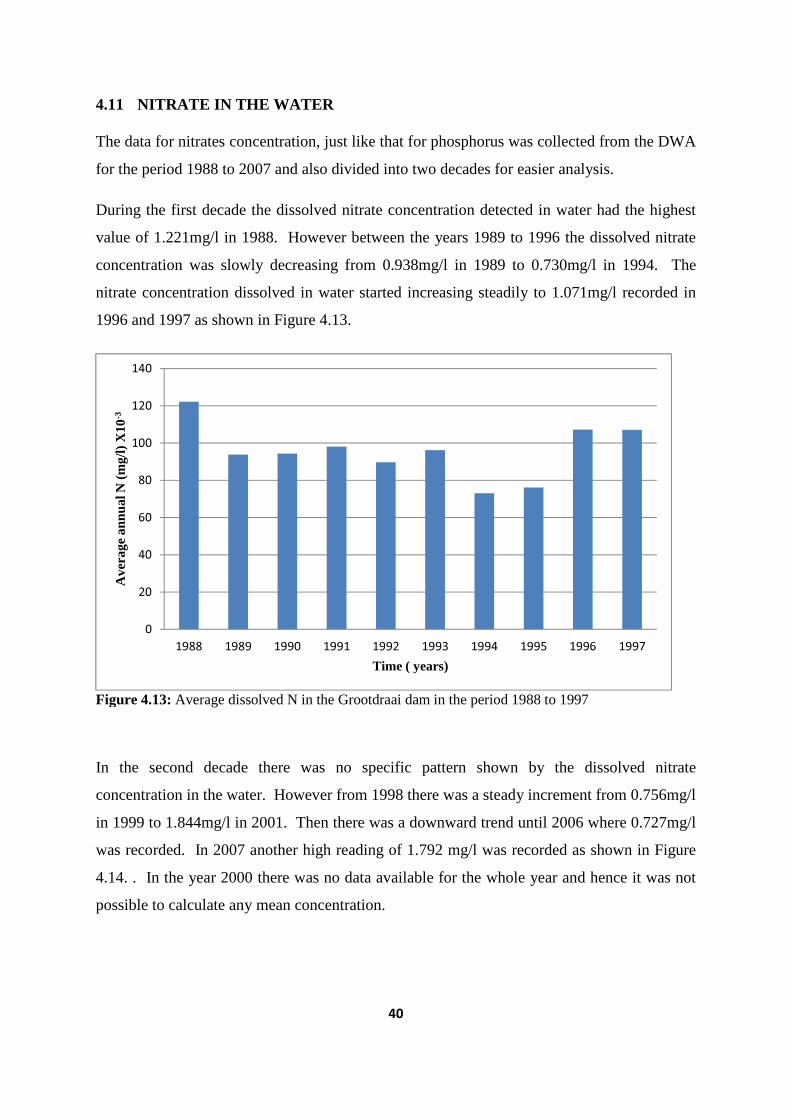
40
4.11 NITRATE IN THE WATER
The data for nitrates concentration, just like that for phosphorus was collected from the DWA
for the period 1988 to 2007 and also divided into two decades for easier analysis.
During the first decade the dissolved nitrate concentration detected in water had the highest
value of 1.221mg/l in 1988. However between the years 1989 to 1996 the dissolved nitrate
concentration was slowly decreasing from 0.938mg/l in 1989 to 0.730mg/l in 1994. The
nitrate concentration dissolved in water started increasing steadily to 1.071mg/l recorded in
1996 and 1997 as shown in Figure 4.13.
In the second decade there was no specific pattern shown by the dissolved nitrate
concentration in the water. However from 1998 there was a steady increment from 0.756mg/l
in 1999 to 1.844mg/l in 2001. Then there was a downward trend until 2006 where 0.727mg/l
was recorded. In 2007 another high reading of 1.792 mg/l was recorded as shown in Figure
4.14. . In the year 2000 there was no data available for the whole year and hence it was not
possible to calculate any mean concentration.
0
20
40
60
80
100
120
140
1988 1989 1990 1991 1992 1993 1994 1995 1996 1997
Ave
rage
ann
ual N
(m
g/l)
X10
-3
Time ( years)
Figure 4.13: Average dissolved N in the Grootdraai dam in the period 1988 to 1997
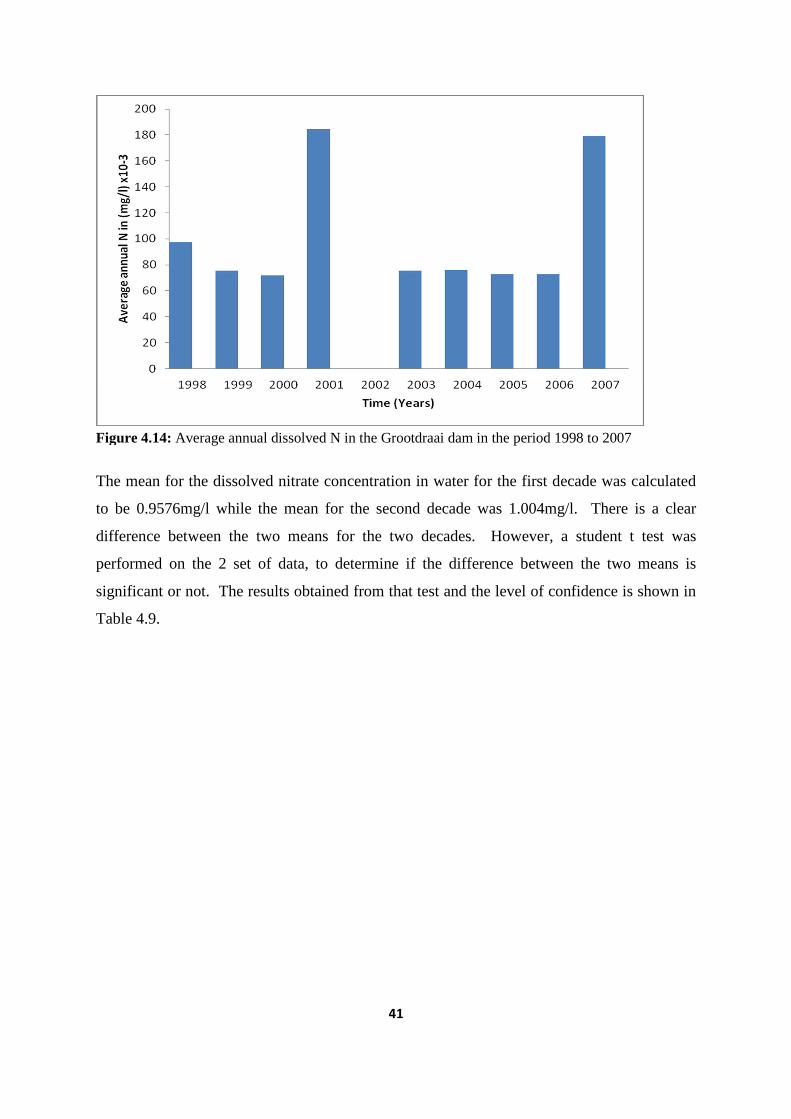
41
The mean for the dissolved nitrate concentration in water for the first decade was calculated
to be 0.9576mg/l while the mean for the second decade was 1.004mg/l. There is a clear
difference between the two means for the two decades. However, a student t test was
performed on the 2 set of data, to determine if the difference between the two means is
significant or not. The results obtained from that test and the level of confidence is shown in
Table 4.9.
Figure 4.14: Average annual dissolved N in the Grootdraai dam in the period 1998 to 2007
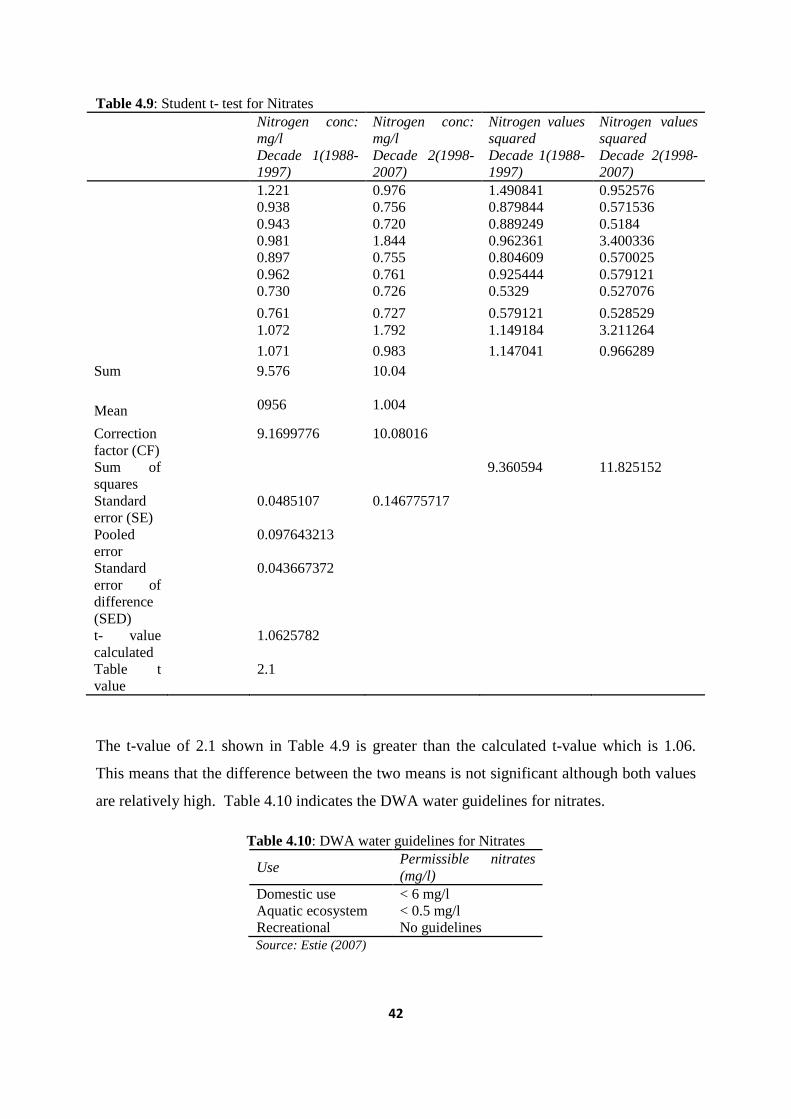
42
Table 4.9: Student t- test for Nitrates
Nitrogen conc: mg/l Decade 1(1988-1997)
Nitrogen conc: mg/l Decade 2(1998-2007)
Nitrogen values squared Decade 1(1988-1997)
Nitrogen values squared Decade 2(1998-2007)
1.221 0.976 1.490841 0.952576 0.938 0.756 0.879844 0.571536 0.943 0.720 0.889249 0.5184 0.981 1.844 0.962361 3.400336 0.897 0.755 0.804609 0.570025 0.962 0.761 0.925444 0.579121 0.730 0.726 0.5329 0.527076
0.761 0.727 0.579121 0.528529 1.072 1.792 1.149184 3.211264
1.071 0.983 1.147041 0.966289 Sum
9.576 10.04
Mean 0956 1.004
Correction factor (CF)
9.1699776 10.08016
Sum of squares
9.360594 11.825152
Standard error (SE)
0.0485107 0.146775717
Pooled error
0.097643213
Standard error of difference (SED)
0.043667372
t- value calculated
1.0625782
Table t value
2.1
The t-value of 2.1 shown in Table 4.9 is greater than the calculated t-value which is 1.06.
This means that the difference between the two means is not significant although both values
are relatively high. Table 4.10 indicates the DWA water guidelines for nitrates.
Table 4.10: DWA water guidelines for Nitrates
Use Permissible nitrates (mg/l)
Domestic use < 6 mg/l Aquatic ecosystem < 0.5 mg/l Recreational No guidelines Source: Estie (2007)
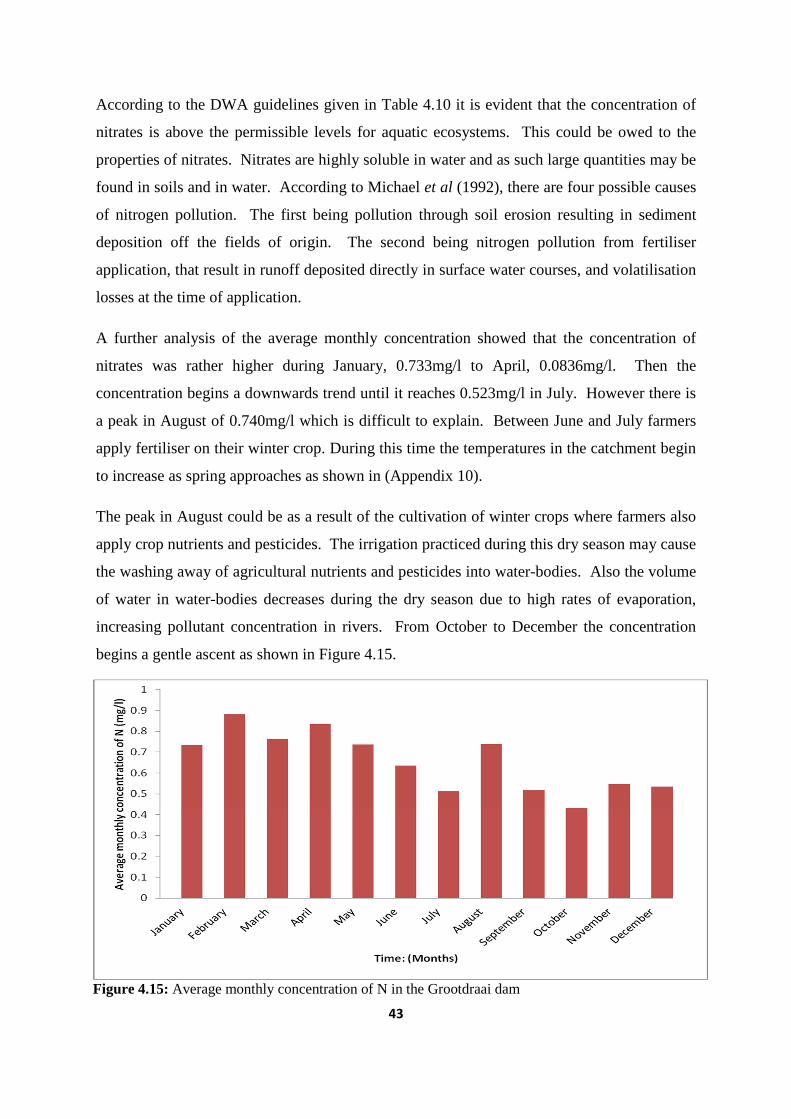
43
According to the DWA guidelines given in Table 4.10 it is evident that the concentration of
nitrates is above the permissible levels for aquatic ecosystems. This could be owed to the
properties of nitrates. Nitrates are highly soluble in water and as such large quantities may be
found in soils and in water. According to Michael et al (1992), there are four possible causes
of nitrogen pollution. The first being pollution through soil erosion resulting in sediment
deposition off the fields of origin. The second being nitrogen pollution from fertiliser
application, that result in runoff deposited directly in surface water courses, and volatilisation
losses at the time of application.
A further analysis of the average monthly concentration showed that the concentration of
nitrates was rather higher during January, 0.733mg/l to April, 0.0836mg/l. Then the
concentration begins a downwards trend until it reaches 0.523mg/l in July. However there is
a peak in August of 0.740mg/l which is difficult to explain. Between June and July farmers
apply fertiliser on their winter crop. During this time the temperatures in the catchment begin
to increase as spring approaches as shown in (Appendix 10).
The peak in August could be as a result of the cultivation of winter crops where farmers also
apply crop nutrients and pesticides. The irrigation practiced during this dry season may cause
the washing away of agricultural nutrients and pesticides into water-bodies. Also the volume
of water in water-bodies decreases during the dry season due to high rates of evaporation,
increasing pollutant concentration in rivers. From October to December the concentration
begins a gentle ascent as shown in Figure 4.15.
Figure 4.15: Average monthly concentration of N in the Grootdraai dam
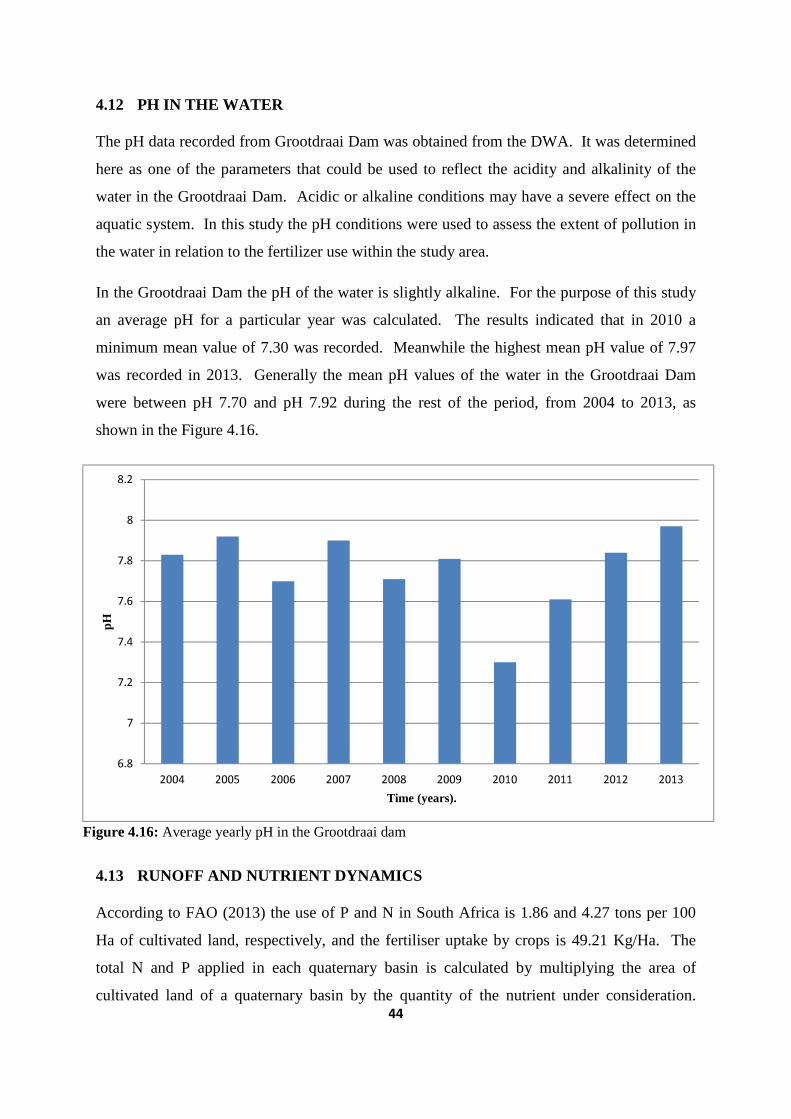
44
4.12 PH IN THE WATER
The pH data recorded from Grootdraai Dam was obtained from the DWA. It was determined
here as one of the parameters that could be used to reflect the acidity and alkalinity of the
water in the Grootdraai Dam. Acidic or alkaline conditions may have a severe effect on the
aquatic system. In this study the pH conditions were used to assess the extent of pollution in
the water in relation to the fertilizer use within the study area.
In the Grootdraai Dam the pH of the water is slightly alkaline. For the purpose of this study
an average pH for a particular year was calculated. The results indicated that in 2010 a
minimum mean value of 7.30 was recorded. Meanwhile the highest mean pH value of 7.97
was recorded in 2013. Generally the mean pH values of the water in the Grootdraai Dam
were between pH 7.70 and pH 7.92 during the rest of the period, from 2004 to 2013, as
shown in the Figure 4.16.
4.13 RUNOFF AND NUTRIENT DYNAMICS
According to FAO (2013) the use of P and N in South Africa is 1.86 and 4.27 tons per 100
Ha of cultivated land, respectively, and the fertiliser uptake by crops is 49.21 Kg/Ha. The
total N and P applied in each quaternary basin is calculated by multiplying the area of
cultivated land of a quaternary basin by the quantity of the nutrient under consideration.
6.8
7
7.2
7.4
7.6
7.8
8
8.2
2004 2005 2006 2007 2008 2009 2010 2011 2012 2013
pH
Time (years).
Figure 4.16: Average yearly pH in the Grootdraai dam
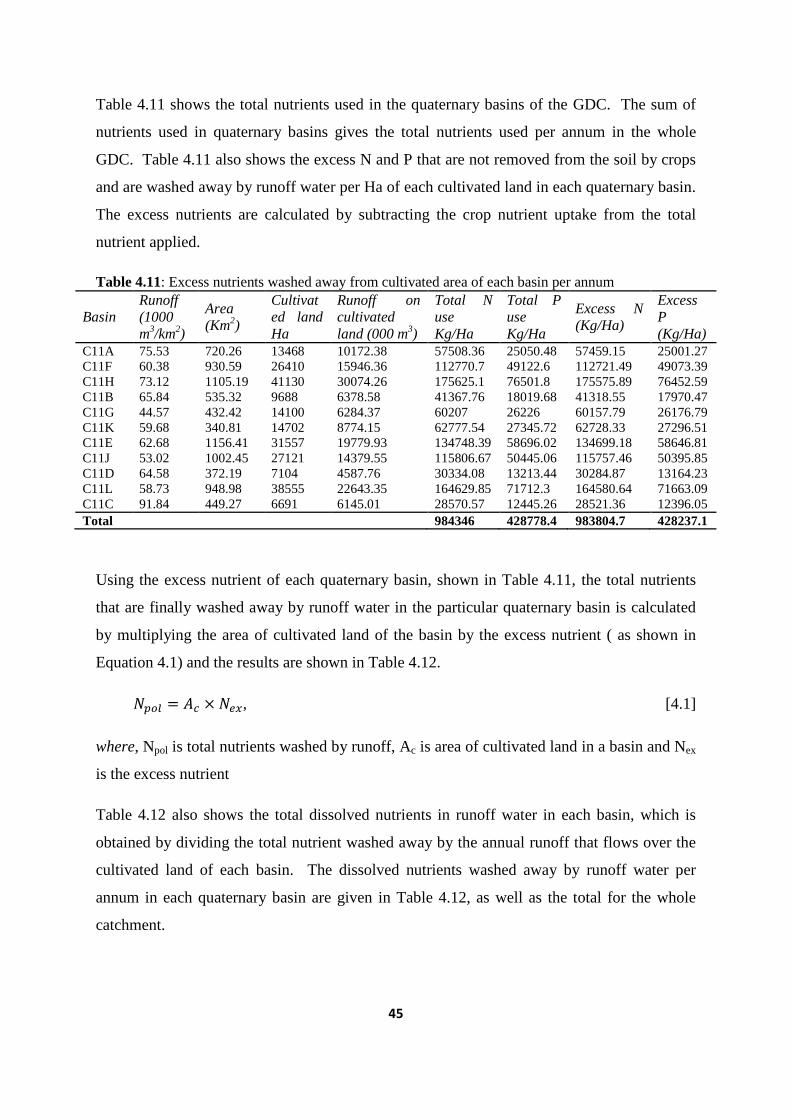
45
Table 4.11 shows the total nutrients used in the quaternary basins of the GDC. The sum of
nutrients used in quaternary basins gives the total nutrients used per annum in the whole
GDC. Table 4.11 also shows the excess N and P that are not removed from the soil by crops
and are washed away by runoff water per Ha of each cultivated land in each quaternary basin.
The excess nutrients are calculated by subtracting the crop nutrient uptake from the total
nutrient applied.
Table 4.11: Excess nutrients washed away from cultivated area of each basin per annum
Basin Runoff (1000 m3/km2)
Area (Km2)
Cultivated land Ha
Runoff on cultivated land (000 m3)
Total N use Kg/Ha
Total P use Kg/Ha
Excess N (Kg/Ha)
Excess P (Kg/Ha)
C11A 75.53 720.26 13468 10172.38 57508.36 25050.48 57459.15 25001.27 C11F 60.38 930.59 26410 15946.36 112770.7 49122.6 112721.49 49073.39 C11H 73.12 1105.19 41130 30074.26 175625.1 76501.8 175575.89 76452.59 C11B 65.84 535.32 9688 6378.58 41367.76 18019.68 41318.55 17970.47 C11G 44.57 432.42 14100 6284.37 60207 26226 60157.79 26176.79 C11K 59.68 340.81 14702 8774.15 62777.54 27345.72 62728.33 27296.51 C11E 62.68 1156.41 31557 19779.93 134748.39 58696.02 134699.18 58646.81 C11J 53.02 1002.45 27121 14379.55 115806.67 50445.06 115757.46 50395.85 C11D 64.58 372.19 7104 4587.76 30334.08 13213.44 30284.87 13164.23 C11L 58.73 948.98 38555 22643.35 164629.85 71712.3 164580.64 71663.09 C11C 91.84 449.27 6691 6145.01 28570.57 12445.26 28521.36 12396.05 Total 984346 428778.4 983804.7 428237.1
Using the excess nutrient of each quaternary basin, shown in Table 4.11, the total nutrients
that are finally washed away by runoff water in the particular quaternary basin is calculated
by multiplying the area of cultivated land of the basin by the excess nutrient ( as shown in
Equation 4.1) and the results are shown in Table 4.12.
���� = �� × ���, [4.1]
where, Npol is total nutrients washed by runoff, Ac is area of cultivated land in a basin and Nex
is the excess nutrient
Table 4.12 also shows the total dissolved nutrients in runoff water in each basin, which is
obtained by dividing the total nutrient washed away by the annual runoff that flows over the
cultivated land of each basin. The dissolved nutrients washed away by runoff water per
annum in each quaternary basin are given in Table 4.12, as well as the total for the whole
catchment.
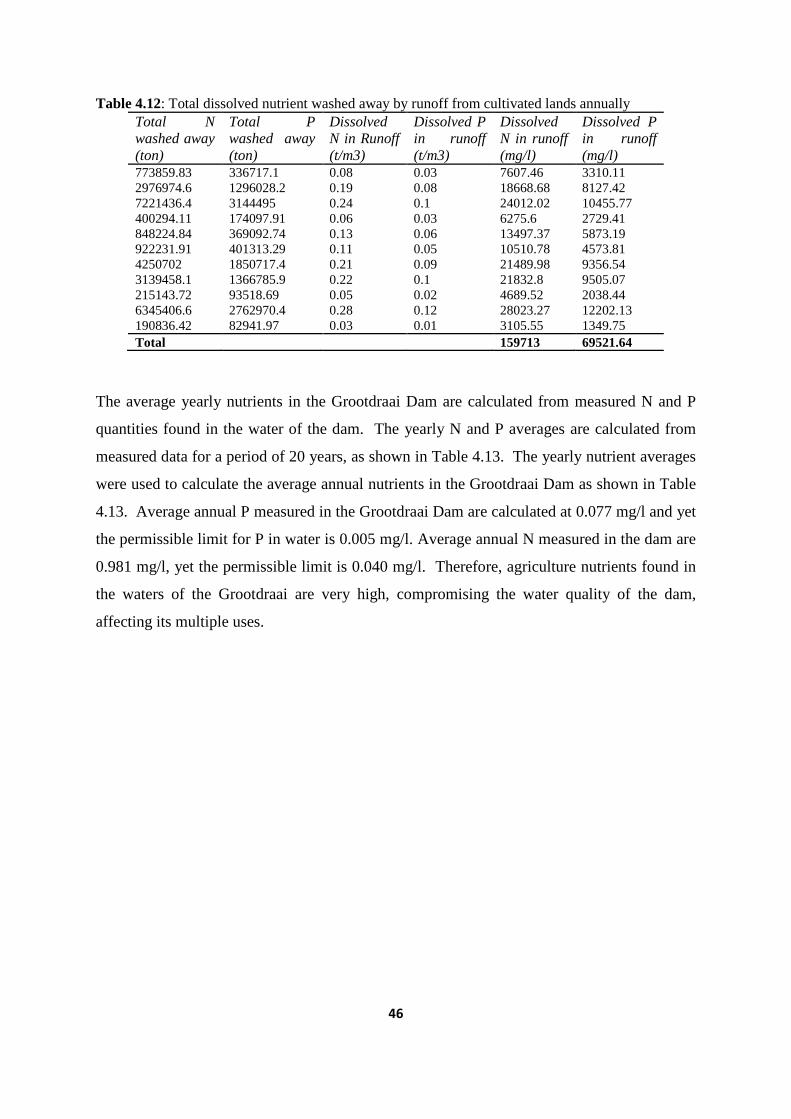
46
Table 4.12: Total dissolved nutrient washed away by runoff from cultivated lands annually Total N washed away (ton)
Total P washed away (ton)
Dissolved N in Runoff (t/m3)
Dissolved P in runoff (t/m3)
Dissolved N in runoff (mg/l)
Dissolved P in runoff (mg/l)
773859.83 336717.1 0.08 0.03 7607.46 3310.11 2976974.6 1296028.2 0.19 0.08 18668.68 8127.42 7221436.4 3144495 0.24 0.1 24012.02 10455.77 400294.11 174097.91 0.06 0.03 6275.6 2729.41 848224.84 369092.74 0.13 0.06 13497.37 5873.19 922231.91 401313.29 0.11 0.05 10510.78 4573.81 4250702 1850717.4 0.21 0.09 21489.98 9356.54 3139458.1 1366785.9 0.22 0.1 21832.8 9505.07 215143.72 93518.69 0.05 0.02 4689.52 2038.44 6345406.6 2762970.4 0.28 0.12 28023.27 12202.13 190836.42 82941.97 0.03 0.01 3105.55 1349.75 Total 159713 69521.64
The average yearly nutrients in the Grootdraai Dam are calculated from measured N and P
quantities found in the water of the dam. The yearly N and P averages are calculated from
measured data for a period of 20 years, as shown in Table 4.13. The yearly nutrient averages
were used to calculate the average annual nutrients in the Grootdraai Dam as shown in Table
4.13. Average annual P measured in the Grootdraai Dam are calculated at 0.077 mg/l and yet
the permissible limit for P in water is 0.005 mg/l. Average annual N measured in the dam are
0.981 mg/l, yet the permissible limit is 0.040 mg/l. Therefore, agriculture nutrients found in
the waters of the Grootdraai are very high, compromising the water quality of the dam,
affecting its multiple uses.
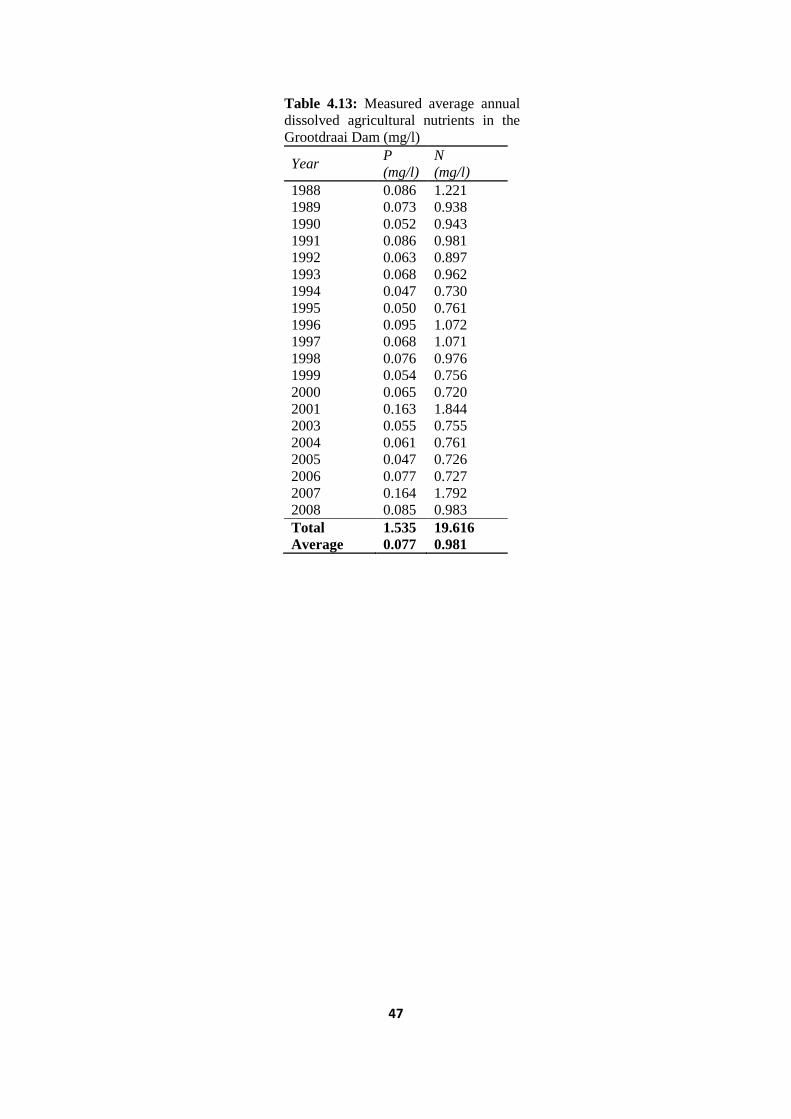
47
Table 4.13: Measured average annual dissolved agricultural nutrients in the Grootdraai Dam (mg/l)
Year P
(mg/l) N (mg/l)
1988 0.086 1.221 1989 0.073 0.938 1990 0.052 0.943 1991 0.086 0.981 1992 0.063 0.897 1993 0.068 0.962 1994 0.047 0.730 1995 0.050 0.761 1996 0.095 1.072 1997 0.068 1.071 1998 0.076 0.976 1999 0.054 0.756 2000 0.065 0.720 2001 0.163 1.844 2003 0.055 0.755 2004 0.061 0.761 2005 0.047 0.726 2006 0.077 0.727 2007 0.164 1.792 2008 0.085 0.983 Total 1.535 19.616 Average 0.077 0.981

48
Chapter 5
5 DISCUSSION
5.1 INTRODUCTION
There are a number of important environmental and agronomic factors to be considered in
dealing with water pollution. Together these factors in the long run affect the quality of
water in rivers, lakes and dams. Some of these factors include climatic conditions, such as
the amount of rainfall the area receives, soil properties, type of agriculture practised, type of
crops and water management among others. Hence there is a need for a thorough
understanding of the interaction of these factors if water pollution can be effectively reduced.
In this chapter the results obtained will be discussed and critically analysed.
5.2 AGRICULTURE NUTRIENTS IN WATER
5.2.1 Nitrates
To better understand the dynamics of nitrates in the waters of the Vaal River the data
obtained from the DWA was grouped into two decades. The first decade stretches from 1988
to 1997, and the second decade stretching from 1998 to 2007. As explained in section 4.11
the nitrate concentration in the water was generally high, ranging between 0.73mg/l in 1994
and 1.22mg/l in 1998.
The high concentration of nitrates in the Vaal River coincides with two very crucial periods
of the cropping season in the commercial farms. Nitrates concentration is high from October
to April and this corresponds with the farming season. During this period, commercial
farmers start planting and hence it is during this time that they start applying fertilisers to
their farms. This could probably be the cause of the observed high trends in the
concentration of nitrates. The second event is a climatic one. During this period the study
area also experiences a gradual increase in the amount of rain received generally above
70mm from October through to March. Since nitrates are highly soluble in water the
probability is very high that not all of the fertiliser applied during this period is absorbed by
plants as intended. Some of this fertiliser is probably washed by surface runoff directly into
the water, increasing the concentration of nitrates in the water as observed and analysed.
49
According to Johnson, (1987) plants only use 50–70% of the amount of applied fertiliser.
The remainder is either transported by erosion or runoff which could be responsible for the
trend observed in the Vaal River.
In normal circumstances where nitrate concentrations are found in permissible levels they are
good for plant nutrition and are responsible for a healthy aquatic system. However, in higher
concentrations it has the potential to cause tiredness chronic in nature, in extreme cases
cyanosis and difficulty to breathe may occur in bottle fed infants (DWAF, 1996g). Higher
concentrations of nitrates, together with phosphates may cause nutrient enrichment to water
bodies thereby stimulating growth of algae which may be associated to bad odours and poor
water taste (DWAF, 1996g).
5.2.2 Phosphorous
Normal level of Phosphorous concentration is necessary for plant and animal growth as it
stimulates growth of biota leading to an increase in consumer populations such as fish hence
leading to an improvement in the water body’s quality of life. However, levels higher/above
the tolerable concentration may have detrimental effects on aquatic system, like accelerating
algal bloom and water weeds leading to a depletion of available oxygen (DWAF, 1996a).
According to Sawyer, (1947) and Vollenweider, (1968) surface water concentrations of
inorganic P and total P between 0,01mg/l and 0,02mg/ l are considered critical values above
which eutrophication is accelerated. Bearing this in mind the concentration levels recorded in
Grootdraai are way higher than the above critical values, making the Vaal River highly prone
to eutrophication.
Just like nitrates, higher phosphorous concentrations occur during the period from October to
March. This could possibly be as a result of farmers applying two much fertiliser during this
period, leading to an increase of these nutrients in the soil. It is during this period when
rainfall season begins and according to Sharply et al (1992) export of P in runoff occurs in
particulate and dissolved forms eroded during flow events. This constitutes a major
proportion of transported form of nutrients from cultivated land. As a result it is highly
probable that the higher concentrations observed during the periods of higher rainfall could
be as a result of this form of transport.
50
5.3 FERTILIZER USE
The study has observed that commercial farmers in the study area, the Grootdraai Dam
Catchment, use a variety of fertilisers. This use of a variety of fertiliser as shown in Table 9
is an indication that large quantities of fertilizer are being used at Standerton farming
community. Figure 9 shows that the most commonly used fertiliser is Sasol KN and Sasol
434. An analysis of the contents of each fertiliser used showed that Sasol KN has the highest
content of Nitrogen of 280g/kg, while Sasol434 has 120g/kg. Hence the continued use of
these fertilisers could lead to nutrient enrichment of the soils and consequently water bodies.
Fertilisers are applied routinely during the farming season. Most farmers indicated that they
apply fertilisers during the beginning of the season, between October and November and then
thereafter application is per need. However not all farmers knew which type of fertiliser they
were using on their farms. This shows that farmers lack knowledge on the basics of fertiliser
application and use. Most of the farmers, about 69%, have been applying fertilisers in their
farms for over 5 years. This could probably explain the high concentration levels of nitrogen
and phosphorous in the water.
In most of the farms it was observed that application of fertilisers is done by farm workers
who are not trained in handling and application of fertilisers. This practice could easily lead
to excessive use of fertiliser. There is a lack of agricultural extension workers to visit farms
regularly to advice, train and monitor the farm workers or farmers to effectively use
fertilisers. In general the farmers rely on different sources of information for information on
the use and application of fertilisers.
Excessive use of fertiliser leads to soil and water pollution. This can lead to nutrient
enrichment which in turn results in algal blooms. These algal blooms may lead to the
depletion of oxygen in the water and consequently causing the death of aquatic organisms. In
the Vaal River seasonal algal blooms have been observed although death of aquatic
organisms has not been observed. However, if the trend continues the problem of fish death
maybe observed soon.
5.4 NEARNESS OF FARMS TO THE RIVER
According to studies conducted by Petersen et al (1987) in agricultural areas, buffer zones
have almost been eliminated. The determination of the closeness of farms to the Vaal River
51
helped to establish how much of the riparian zone had been destroyed in the study area.
Buffer zones help to absorb or retain most of the pollutants from the farmlands. Hence their
elimination means that most of the pollutants cannot be retained, entering into the water
bodies directly from croplands during and after heavy rains.
In the Grootdraai Dam Catchment 56% of the commercial farms are located between 0–5m
from the river as shown in Table 8. This shows that most of the buffer zones in this area have
been destroyed, allowing the free flow of pollutants from agriculture fields into the water
system.
However levels higher/ above the tolerable concentration have detrimental effects on aquatic
system, like accelerating algal blooms and water weeds leading to a depletion of available
oxygen (DWAF, 1996a). According to Sawyer, 1947: Volleywieder (1968) surface water
concentrations of inorganic P and total P between 0, 01mg/ l and 0,02mg/l are considered
critical values above which eutrophication is accelerated. Bearing this in mind the
concentration levels recorded in the Grootdraai Dam are way higher than the above critical
values making the Vaal River highly prone to eutrophication.
Higher pollutant concentrations occur during the period from October to March; this could
possibly be due to farmers applying fertilisers in excess during this period. This leads to an
increase of nutrients in the soil which plants cannot absorb. During this time the rainfall
season begins and according to Sharply et al (1992), export of P in runoff occurs in
particulate and dissolved forms eroded, during flow events. This constitutes a major
proportion of transport from most cultivated lands. Considering this, it is highly probable that
the higher concentrations observed during the periods of higher rainfall could be as a result of
this form of transportation of these nutrients. The destruction of the buffer zones in this part
could be one of the reasons why the seasonal concentrations of N and P in the water is high
during the rainy season and slowly decrease as winter approaches with very low or no rainfall
at all.
The destruction of buffer zones in the study area is a cause for concern. One wonders why
these buffer zones have been destroyed. Perhaps the only possible reasons could be lack of
awareness on the part of farmers on the role these riparian zones play in preventing water
pollution or over nourishment of the river system or the need by farmers to increase
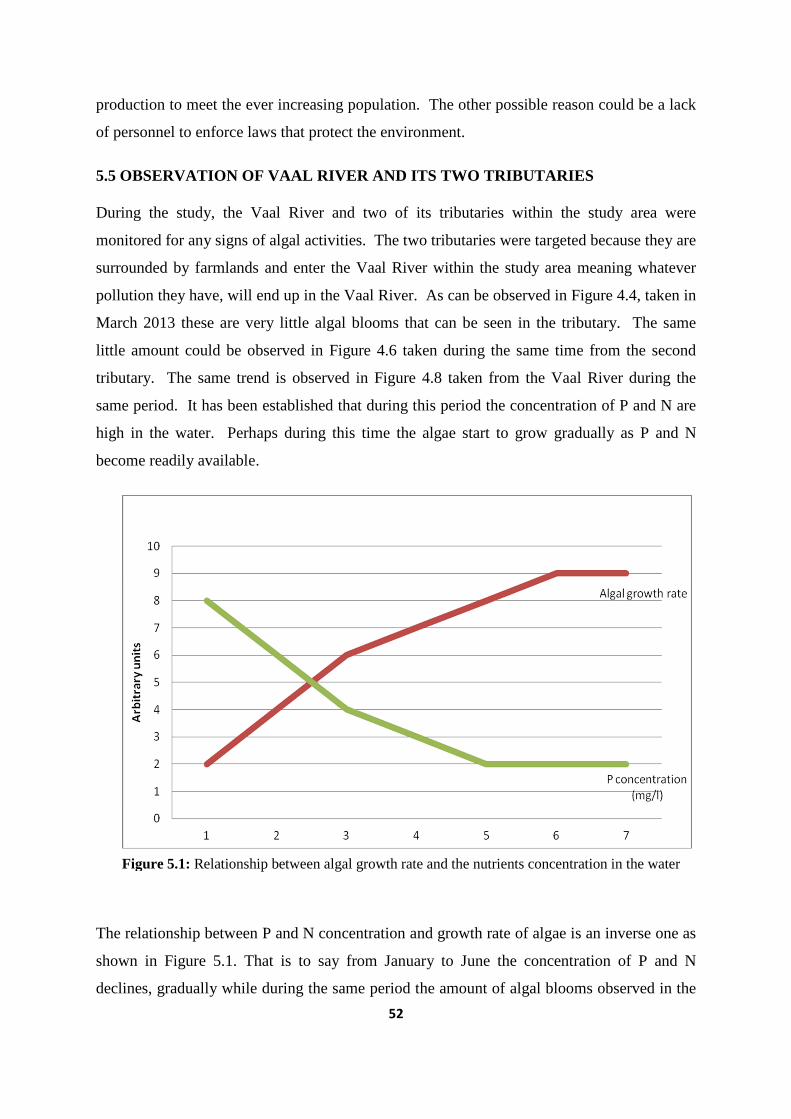
52
production to meet the ever increasing population. The other possible reason could be a lack
of personnel to enforce laws that protect the environment.
5.5 OBSERVATION OF VAAL RIVER AND ITS TWO TRIBUTARIES
During the study, the Vaal River and two of its tributaries within the study area were
monitored for any signs of algal activities. The two tributaries were targeted because they are
surrounded by farmlands and enter the Vaal River within the study area meaning whatever
pollution they have, will end up in the Vaal River. As can be observed in Figure 4.4, taken in
March 2013 these are very little algal blooms that can be seen in the tributary. The same
little amount could be observed in Figure 4.6 taken during the same time from the second
tributary. The same trend is observed in Figure 4.8 taken from the Vaal River during the
same period. It has been established that during this period the concentration of P and N are
high in the water. Perhaps during this time the algae start to grow gradually as P and N
become readily available.
The relationship between P and N concentration and growth rate of algae is an inverse one as
shown in Figure 5.1. That is to say from January to June the concentration of P and N
declines, gradually while during the same period the amount of algal blooms observed in the
Figure 5.1: Relationship between algal growth rate and the nutrients concentration in the water
53
river seems to increase gradually. This could be because during periods of high
concentrations of P and N algae begin to absorb these nutrients which they require for their
metabolic processes and growth. Then gradually algae begins to flourish with time, by then
as the algae population increases more nutrients are absorbed from the water leading to a
steady decline in the concentration of P and N. From August to October the algae population
could have possibly reached maximum growth rate and hence begin to die as oxygen is also
gradually declining. Figure 23 below shows the relationship that exists between algal growth
rate and P and N concentrations. The units used are arbitrary.
It is observed that the nutrients minimum levels correspond with the maximum algal growth
rate, meaning that it is during this period that corresponds with the highest population of
algae. This means that large amounts of nutrients are absorbed by algae leading to a low
concentration in the water. When the algal population begins to decline the levels of the
nutrients concentration begin to slowly rise possibly because some algae on their death
recycle these nutrients back into the water. This coupled with the beginning of the farming
season eventually cause the nutrient levels to increase in the water as has been observed
during the study period.
54
Chapter 6
6 CONCLUSION AND RECOMMENDATIONS
6.1 INTRODUCTION
The area around Standerton Town is a very important commercial farming area. Farmers in
the area use fertiliser to improve crop yields and pesticides to prevent crop damages. To
further boost crop yields, land in the study area has been severely altered for agricultural
purposes and buffer zones from water sources have been destroyed to maximize production.
This study has estimated the contribution of the agricultural activities to the poor water
quality of the Vaal River within the Grootdraai Dam Catchment and their impact on the
whole aquatic system. The study has explored the current capacity, competence and
commitment of farmers to achieve compliance with the environmental legislation governing
water management.
To achieve the objectives of the study a survey was carried out to determine the type and
amount of fertiliser used by farmers. The survey was random and captured from fifteen
commercial farmers. The distance between the water-bodies and the farmlands was
determined through this survey and physical observation. It was established that farmers
could be using excess fertiliser as untrained farm workers are the ones charged with the
application of fertilisers.
The distance between the farms and water-bodies was also found to be too small and the
buffer zones no longer exist. A regular observation of the river was also done to detail any
algal bloom activities.
Data collected from the DWA was analysed for nitrates and phosphates concentrations in the
water. The data obtained was divided into two decades for analysis. Yearly average
concentrations were calculated for the first decade from 1988 to 1997 and then compared to
monthly means for the second decade 1998 to 2007. For the nitrates the two values were
different and a statistical analysis was done and the difference between the two means found
to be statistically insignificant although the concentration of nitrates was high.
55
For phosphorous the values for the two means were also found to be different and as such a
statistical analysis was also done and the difference was found to be statistically significant.
All this data was analysed aiming to establish the link between each factor investigated.
Monthly average rainfall for the study area was also analysed and correlated to the
occurrence of higher concentrations of agrochemicals in the water. It was established that
there is a positive correlation between the months of high rainfall and the months of higher
concentrations in the water.
General information on the study area was also obtained through informal interviews with
farmers, farm workers and other stakeholders. A survey was also conducted on the general
population where a random sampling method was used to select the sample. The survey
showed that the water delivered to the general population was of poor quality, producing an
unpleasant odour and sometimes muddy.
The data that was collected can be used to create awareness among farmers to control water
pollution and promote sustainable use of the natural resources such as water. This is also
necessary to create a more sustainable and efficient use of agrochemicals.
6.2 CONCLUSION
From the study the following conclusions can be made:
� Analysis of data from the Vaal River showed that water was polluted by nutrients and
phosphates from runoff due to high use of fertilisers. Considering data from DWA,
questionnaires and the literature review, it can be concluded that pollution by
nutrients (P and N) in the Vaal River is evident as shown by the high concentration of
P an N in the water and the observed algal blooms during the period of study.
� The study shows that the Vaal River is actually at a risk of direct pollution from
agrochemicals due to unrestricted use of fertilisers. The most frequently used type of
fertiliser has higher quantities of N and P and as such higher concentrations of the
said nutrients are relatively high.
� The study revealed that the quality of water received by the local population in
Standerton is of poor quality as the water produces a foul smell at times. The foul or
odour can be attributed to dead algae.
56
� The study showed that there was a general lack of knowledge on fertiliser application
which is responsible for nutrient enrichment.
� The study showed that there is little commitment to achieve compliance as evidenced
by the destruction of buffer zones, which help to reduce amount of nutrients directly
entering the river by acting as sinks for such nutrients between farmlands and the
river.
� Environmental problems are generally related to human activities in the resource
exploitation resulting in the degradation of the environment if not exploited
responsibly. The problem of poor water quality in the Vaal River are as a result of
poor farming methods by both commercial and subsistence farmers, and also of the
responsible authority by failing to enforce legislation.
� The conducted survey showed that there are no enough agricultural extension workers
to train, monitor and regulate the use of agrochemicals in the study area.
6.3 RECOMMENDATIONS
� Since the study did not do any tests or analysis of pesticides it is recommended that
further study be conducted to quantify the effects of pesticides with the study area.
� The DWA together with the department of agriculture should consider deploying
extension workers on a regular basis to educate, monitor and enforce regulations
related to the pollution and use of agrochemicals.
� Buffer zones should be protected in order to control soil and agricultural nutrients and
pesticides from entering water-bodies.
� Farmers should become less dependent on chemical fertilisers. Other forms of
fertiliser like green fertilisers should be introduced to reduce the amount of chemicals
finding their way into the river. Biological methods should be introduced for pest
control. This is a natural way of controlling pests by using their natural enemies
referred to as biological control agents. This process involves the rearing and realising
natural enemies of those pests which need to be controlled, for example a small wasp
can be used to control the corn borer
57
� There is a great need to increase awareness among farmers towards environmental
protection and sustainable water management.
� Farmers could try to prevent the leaching of nutrient after the growing season by
increasing the area under autumn/winter green cover.
� The Department of Agriculture and the Department of Water Affairs (DWA) should
promote or subsidise better fertiliser application methods and develop new
environmentally sound fertilisers and promote regular soil testing.
� Farmers should be educated on the rational nitrogen and phosphorus application
which can be calculated on the basis of the crop nitrogen balance taking into account
the plant needs of the nutrients.
� The DWA should decentralise the testing and monitoring of water quality to
municipal authority so that Municipalities can have direct access to the testing
facilities and therefore be responsible for ensuring good water quality management
programmes are developed and implemented. This could be achieved by building
sound laboratories within each local Department of Water Affairs.
� The DWA should embark on a large scale recruitment and training of personnel to
assist in collecting and processing water samples from different points as lack of
trained personnel emerged to be one of the major factors contributing to the Lekwa
Municipality being unable to collect and process water samples.
58
REFERENCES
Akan JC, Abdulruhman FIA, Dimari GA and Ogubuaja VO 2008: Physicochemical
Determination of Pollutants in Wastewater and Vegetable Samples along the Jakara
Wastewater Channelin Kano Metropolis, Kano State, Nigeria. European Journal of Scientific
Research, 23(1), 122-133.
Ashton PJ 2002: Avoiding Conflicts over Africa’s Water Resources. Ambio, 31(3): 236-242.
Baker LA 1992: Introduction to nonpoint source pollution in the United States and prospects.
Ecological Engineering. 1: 1-26.
Bega S 2008: South Africa water quality is fast deteriorating. IOL News, Available at:
www.iol.co.za/index.php?set_id=1&click_id=13&art_id=vn20081115091504526C425147.
[Accessed in June 2013]
Blaine S 2013: Agriculture is putting South Africa in deep water. www.bdlive.co.za.
Braune E & Rogers KH 1987: The Vaal River catchment: Problems and research needs.
National Scientific Programmes unit: CSIR, SANSP Report 143.pp 44.
Burger AEC & Nel A 2008: Scoping Study to Determine the Potential Impact of Agricultural
Chemical Substances (Pesticides) with Endocrine Disruptor Properties on the Water
Resources of South Africa. WRC Report Number 1774-1-08, Pretoria, South Africa.
Cillie GG & Coombs P 1979: National institute for water research, Pretoria. Water Pollution
Research in South Africa, 51(3) 1.
Cohen L, Manion L & Morrison R 2007: Research methods in education. Routlege Falmer
(Eds), London, UK.
Creswell JW 2012: Educational research: Planning, conducting and evaluating quantitative
and qualitative research, 4th edition, Pearson (Eds), Boston, USA.
CSIR (Council for Scientific and Industrial Research) 2010: A CSIR perspective on water in
South Africa – 2010.CSIR Report No. CSIR/NRE/PW/IR/2011/0012/A. CSIR, Pretoria,
South Africa.
59
CSIR (Council for Scientific and Industrial Research) 2003: National Land cover dataset
attributes. Satellite Applications Centre, ICOMTEX. Council for Scientific and Industrial
Research, Pretoria, South Africa.
Daniel JH, Franklin G & Donald T 2007: Effluent nitrogen management for agricultural re-
use applications. ITRC paper NO. P07-003. California Polytechnic State University. San
Luis Obispo.
Daniel TC, Sharpley AN & Lemunyon JL 1998: Agricultural phosphorus and Eutrophication.
A symposium overview. Journal of Environment, 27:251-257.
DeBarry PA 2004: Watersheds: Processes, Assessment and Management. John Wiley &
Sons, New York. DeWalle, D.R. and Rango.
Diebel MW, Maxted JT, Robertson DM, Han S, Vander and Zanden MJ 2009: Landscape
Planning for Agricultural Nonpoint Source Pollution Reduction III: Assessing Phosphorus
and Sediment Reduction Potential. Environ. Manage. 43 69–83.
DWA (Department of Water Affairs) 1996: South African water quality guidelines volume
2. Recreational use. (2nd edition). S Holmes (Eds) ISBN 0-7988-5338-7 (Set), ISBN 0-7988-
5340-9 (Volume 2), Pretoria, South Africa.
DWA (Department of Water Affairs) 2004: Upper Vaal Water Management Area: Internal
Strategic Perspective. Prepared by PDNA, WRP Consulting Engineers (Pty) Ltd, WMB and
Kwezi-V3 on behalf of the Directorate: National Water Resource Planning. DWA Report No
P WMA 08/000/00/0304, Pretoria, South Africa
DWA (Department of Water Affairs) 2009: Integrated water quality management plan for
the Vaal River system: Task 8: Water Quality Management Strategy for the Vaal River
System. Report No. P RSA C000/00/2305/7, Pretoria, South Africa.
DWA (Department of Water Affairs) 2009: Integrated water quality management plan for
the Vaal River system: Task 8: Water Quality Management Strategy for the Vaal River
System. Report No. P RSA C000/00/2305/7, Pretoria, South Africa.
60
DWA (Department of Water Affairs) 2011: Water quality management in South Africa.
Available at http://www.dwaf.gov.za/Dir_WQM/wqm.asp. [Accessed in April 2013]
DWAF (Department of water affairs and forestry) 1996a: South African water quality
Guideline - Domestic water use. Volume 1. Pretoria. Government Printers.
DWAF (Department of water affairs and forestry) 1996g: South African water quality
Guideline - Aquatic Ecosystems. Volume 7 Pretoria. Government Printers.
ECE 1992: Protection of Inland Waters against Eutrophication. United Nations Economic
Commission for Europe, Paper # ECE/ENVWA/26, Geneva, Switzerland.
Edmondson WT 1991: The uses of ecology: Lake Washington and beyond. University of
Washington press, Washington DC, USA.
Estie O. 2007: Seasonal rainfall influences on main pollutants in the Vaal River barrage
reservoir: a temporal-spatial perspective. Magister Artium MA, University of Johannesburg.
FAO (Food and Agricultural Organisation) 2013: Environmental Indicators: Land and
Agriculture Use of Fertilisers. Resource STAT, Food and Agriculture Organization of the
United Nations; Environment Statistics Section, Rome, Italy. (Available at
http://faostat.fao.org/site/405/default.aspx). [Accessed in February 2013]
FAO Food and Agriculture Organization of the United Nations
(1996) 1996: Control of water pollution from agriculture. Natural Resources Management
and Environmental Department. Rome. Italy.
IRIR (Integrated Resource information report, Lekwa Municipality) 2005: Mpumalanga
Provincial Government, Department of Agriculture. South Africa.
Jackson WA, Pan WL, Moll RH & Kamprath EJ l986: Uptake, translocation, and reduction
of nitrate. In Neyra CA, ed., Biochemical Basis of Plant Breeding. CRC Press, Boca Raton,
Florida.
James PN 2008: Water quality for ecosystem and human health. 2nd Edition. United
Nations Environmental Programme, Global Environment Monitoring Systems. GEMS.
61
Johnson B & Gray R 2010: A history of philosophical and theoretical issues for mixed
methods research. In A.Tashakkori and C.B Teddle (eds). Handbook of mixed methods in
social and behavioural research. Thousand oaks, CA, USA: SAGE Publications.
Kennish MJ 1996: Practical handbook of estuarine and marine pollution (Vol. 10). CRC
press.
Kerlinger FN 1964: Foundations of behavioural Research. New York: Holt, Rinehart, and
Winstron, USA.
Krantz D & Kifferstein B 2011: Water pollution and society: Hydrosphere and water
pollution. Slide share. Available at: www.slideshare.netjhinkie/hydrosphere-and-water-
pollution. [Accessed in March 2013]
Lin J, Biyela PT, Puckree T & Bezuidenhout CC 2004: A study of water quality of the
Umhlathuze River, Kwazulu Natal (RSA): Microbial and physicochemical factors
(Electronic Version). Water SA, 30(1), 17 - 22.
Lory JA 1999: Agricultural phosphorus and water quality. University of Missouri Extension
G9181.
MacCaston MK 2005: Tips for collection reviewing and analyzing secondary data. HLS.
Maree K & Peterson J 2013: The quantitative research process. First steps in research. Van
Shaik, Publishers, Pretoria.
McMillan JH & Schumacher S 2001: Research in Education: A conceptual introduction, 5th
edition. New York: Addition-Wesley Longman.
McMillan JH & Schumacher S. 2010: Research in Education: Evidence-Based Inquiry
Seventh Edition Pearson
Michael LT, Richard MA & Stanely FM 1992: Farm level response to agricultural effluent
control strategies: The case of Willamette valley. Journal of Agricultural and resource
economics, 17(1): 173-185, Oregon state university.
62
Midgley DC, Pitman WV & Middleton BJ 1994: Surface Water Resources of South Africa,
Volumes I, II, III, IV, V and VI. WRC Reports No’s. 298/1.1/94, 298/2.1/94, 298/3.1/94,
298/4.1/94, 298/5.1/94 and 298/6.1/94. Water Research Commission (WRC), Pretoria, South
Africa.
Mouton J 2001: How to succeed in your Master’s and Doctoral studies. A South African
guide and resource book. Published by Van Schaik Publishers, Pretoria.
Mthembu N 2004: Evaluation of the Mhlathuze River in Kwazulu-Natal. Department of
biochemistry and microbiology, University of Zululand.
Natural Resources Management and Environmental Department (NRMED) 1996: Waste
water treatment and use in Agriculture. FAO Corporate Document Repository.
Nieuwenhuis J 2013: Introducing qualitative research. First steps in research. Van Shaiks
Publishers. Pretoria.
Ninhoskinson 2011: Research Draft 2: Water Pollution: Humans Contributing to their
Downfall. Available at: envirowriters.wordpress.com/2011/.../
Oberholster P 2010: Current status of water quality in South Africa. From the CSIR
perspective. Available at: http://www.businessmasters.co.za/showthread.php/1921-The-
current-status-of-water-quality-in-South-Africa. [Accessed in January 2013]
Peterson RC, Madsen B., Wilzbach MA, Magadza CHD, Paarlberg A, Kullberg A &
Cummins KW 1987: Stream management: Emerging global similarities, Ambio 16: 166 –
179.
Pierre S, Maria PVP & Eva P 2013: Water and agriculture: Contribution to an analysis of a
critical but difficult relationship. Agriculture and environment. European Commission.
Pink DH 2006: Investing in tomorrow’s liquid gold “(http: // finance.
Yahoo.Com/columnist/article trend desk/3748.yahoo. [Accessed in February 2013].
Ramakrishnan N 2003: Bio-monitoring Approaches for water assessment in two water
bodies at Tiruvannamalai, Tami, India Chennai: Department of Geography, University of
Madras and faculty of Environmental studies, York University. Pgs. 374-385.
63
Resources of South Africa. Water Resources Commission (WRC) Report No 1774/1/0
Ryding SO 1986: Identification and quantification of nonpoint source pollution as a base for
effective lake management. In: Land Use Impacts on Aquatic Ecosystems. J. Lauga, 8.
Sandi DQ 2012: Importance of water. Independent distributors #241630. Solid Carbon
Block Drinking Water Systems Information Library. Available at:
http://www.aomega.com/mpure/infomp.htm. [Accessed in April 2013].
Sapa 2009: Long- term pollution killing SA Rivers. Available at:
http://www.iol.co.za/news/south-africa/long-term-pollution-killing-sa-rivers-1.435619
Sawyer CN 1947: Fertilization of lakes by agricultural and urban drainage. Journal New
England Water Works Assoc. 61:109-127.
Schueller TR 2000: Microbes and urban watersheds: Concentrations, sources, and pathways:
http://www.cwp.org/Resource-library/Centre-bocs/pwp/Elc-PWP17 pdf. [Accessed in April
2013]
Sharpley AN, Chapra SC, Wadepohl R, Sims JT, Daniel TC & Reddy KR 1994: Managing
agricultural phosphorus for protection of surface waters: issues and options. J. Environ. Qual.
23 437-451.
Sharpley AN, Smith SJ, Jones OR, Berg WA & Coleman GA 1992: The transport of bio
available phosphorus in agricultural runoff. Journal of. Environmental Quality. 21:30-35
Simon MK & Goes J 2013: Dissertation and Scholarly Research: Recipes for success,
Seattle, WA: Dissertation Success LLC.
Sonali B 2011: Toxic effects of algal blooms. Biotecharticles.com Available at:
http://m.biotecharticles.com/. [Accessed in June 2013]
Stone KC, Hunt PG, Novak JM & Johnson MH 2003: In–stream wetland design for non–
point source pollution abatement. Appl. Eng. Agric. 19 171–175.
Stuijt A 2012: Google censors: SA water pollution Available at:
nolstuijt.wordpress.com/.../nolstuijt/page/...[Accessed in April 2013]
64
Tempelhoff J, Munnik V & Viljoen M 2007: The Vaal River Barrage, South Africa’s hardest
working water way: an historical contemplation. The Journal for Transdisciplinary Research
in Southern Africa 3:107-133.
Thomas DR 2003: A general inductive approach for qualitative data analysis. School of
Population Health. University of Auckland.
Tucker MR 1999: Essential plant nutrients. Their presence in North Carolina soils and role in
plant nutrition. North Carolina.
Uchinda R 2000: Essential nutrients for plant growth: Nutrient functions and deficiency
symptoms. College of Tropical agriculture and Human resources, University of Hawaii,
Manoa.
UNESCO 2006: How can human actions seriously affect water resources? United Nations
world water development Report 2. Green facts Scientific Board. Available at:
www.unesco.org/water/wwap/wwdr2/pdf/wwdr2. [Accessed in April 2013]
US-EPA (US Environmental Protection Agency) 2000: National water quality inventory
report. Office of Water. EPA 841/R-02/ 001.
US- EPA (US Environmental Protection Agency) 1996: Control of water pollution from
Agriculture. GEMS/ Water Collaborating Centre. Canada Centre for Inland Waters. Canada.
US-EPA (US Environmental Protection Agency) 1994: Chapter 1: Introduction to
agricultural water pollution. Water quality as a global issue. Produced by the natural
Resources Management and Environment Department
US-EPA (US Environmental Protection Agency) 2000: National water quality inventory
report. Office of Water. EPA 841/R-02/ 001.
US-EPA (US Environmental Protection Agency) 2013: Nonpoint source pollution biggest
water quality problem- EPA. Produced by the natural Resources Management and
Environment Department
VadaS PA, Owens LB & Sharpley AN 2008: An empirical model for dissolved phosphorus
in runoff from surface applied fertiliser. Agr. Ecosyst Environ. 127 59-65.
65
Van Ginkel CE 2001: Toxic algal incident in the Grootdraai Dam. Institute for Water Quality
Studies, Department of Water Affairs (DWA), Report No.: N/C110/02/DEQ/0401, DWA,
Pretoria. South Africa.
Van Ginkel CE 2002: Trophic status assessment. Institute for Water Quality Studies,
Department of Water Affairs, Pretoria, South Africa.
Vollenweider RA 1968: Scientific fundamentals of eutrophication of lakes and flowing
waters with particular reference to nitrogen and phosphorus. OECD Rep.DSA/CSI/68.27.
Paris, France.
Wetzel RG 1993: Limnology, 2nd edition, 919p. Saunders Company, Toronto, Canada
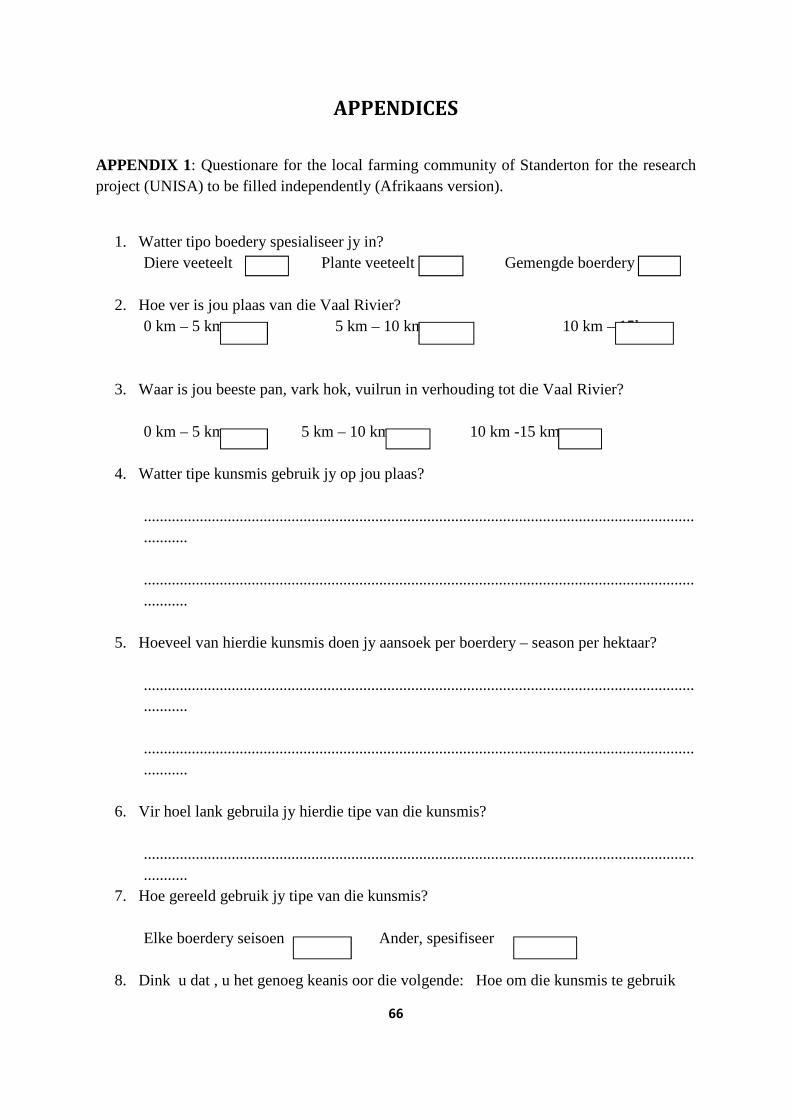
66
APPENDICES
APPENDIX 1: Questionare for the local farming community of Standerton for the research project (UNISA) to be filled independently (Afrikaans version).
1. Watter tipo boedery spesialiseer jy in? Diere veeteelt Plante veeteelt Gemengde boerdery
2. Hoe ver is jou plaas van die Vaal Rivier? 0 km – 5 km 5 km – 10 km 10 km – 15km
3. Waar is jou beeste pan, vark hok, vuilrun in verhouding tot die Vaal Rivier? 0 km – 5 km 5 km – 10 km 10 km -15 km
4. Watter tipe kunsmis gebruik jy op jou plaas? ..................................................................................................................................................... .....................................................................................................................................................
5. Hoeveel van hierdie kunsmis doen jy aansoek per boerdery – season per hektaar? ..................................................................................................................................................... .....................................................................................................................................................
6. Vir hoel lank gebruila jy hierdie tipe van die kunsmis? .....................................................................................................................................................
7. Hoe gereeld gebruik jy tipe van die kunsmis? Elke boerdery seisoen Ander, spesifiseer
8. Dink u dat , u het genoeg keanis oor die volgende: Hoe om die kunsmis te gebruik
67
Nie genoeng Genoeg Nie seker nie
a. Hoeveel kunsmis te gebruik per hektaar vir verskillende plante. Nie genoeg Genoeg Ni esker nie
b. Wanneer moet die kunsmis gebruik Nie genoeg Genoeg Ni seker nie
9. Hoe het u die inligting van die kunsmis gekry? ..................................................................................................................................................... .....................................................................................................................................................
10. Is daar a forum waaria die boere die inligting gekommunikeer? .....................................................................................................................................................
11. Hoe word die inligting aan die boere gekommunikeer? ..................................................................................................................................................... ....................................................................................................................................................
12. Hoeveel per week of per maad word die inligting aan hulle gekommunikeer? ..........................................................................................................................................................................................................................................................................................................
Baie dankie u die vorm gevoltooi.
68
APPENDIX 2: Questionnaire for the local farming community of Standerton for the research project (University of South Africa) to be filled independently. (English version).
1. What type of farming do you specialise in?
Animal husbandry Plant husbandry Mixed farming
2. How far is your farm from the Vaal River?
0km – 5km 5km -- 10km 10km --- 15km
3. Where is the your : a) cattle pan, b) pig sty, c) foul run in relation to the Vaal River?
0km – 5km 5km -- 10km 10km --- 15km
4. Which type of fertiliser do you use on your farm?
..........................................................................................................................................
..........................................................................................................................................
5. How much of this fertiliser do you apply per farming season per hectare?
..........................................................................................................................................
6. For how long have you been using this type of fertiliser?
..........................................................................................................................................
7. How frequent do you use this fertiliser?
Every farming season other, specify
8. Do you feel like you have sufficient knowledge on?
a) How to apply the fertiliser.
Insufficient sufficient Not sure
b) How much to apply per hectare for different crops
Insufficient Sufficient Not sure
c) When to apply it.
69
Insufficient Sufficient Not sure
9. How did you acquire such information?
......................................................................................................................................................
......................................................................................................................................................
......................................................................................................................................................
10. Is there a forum where information is communicated to farmers?
......................................................................................................................................................
......................................................................................................................................................
......................................................................................................................................................
11. How is information communicated to farmers?
......................................................................................................................................................
......................................................................................................................................................
......................................................................................................................................................
......................................................................................................................................................
......................................................................................................................................................
12. How often is information communicated to farmers?
......................................................................................................................................................
......................................................................................................................................................
......................................................................................................................................................
Thank you for your co-operation.
70
APPENDIX 3: Questionnaire for local residents of Standerton on water quality for the research project to be filled independently.
1. What is your understanding of water quality?
..............................................................................................................................................
..............................................................................................................................................
2. Does tap water sometimes have a bad test?
Yes No
3. Does tap water sometimes have a foul smell or odour?
Yes No
4. What is your opinion of the water quality supplied by the Lekwa municipality?
Poor Good Not sure
5. Have you brought your concerns to knowledge of the relevant authority?
Yes No
6. What do you think could be the cause of the state you described above?
..............................................................................................................................................
7. Have you at any given time observed any excess of growth of plants in the Vaal River?
E.g. Green algae.
Yes No
8. Have you at any given time seen any dead aquatic organisms in the river? e.g. fish?
Yes No
9. If any, in which section of the river have you observed that?
............................................................................................................................................

71
10. At what time of year did you observe any of the above? E.g. Month?
...........................................................................................................................................
11. What do you think could be responsible for all this above?
..............................................................................................................................................
12. What do you think could be the solution to all this?
..............................................................................................................................................
72
APPENDIX 4: Questionnaire for the Lekwa Municipality water authority for the research project to be filled independently.
1. What is the general state of affairs in the Vaal River?
..............................................................................................................................................
..............................................................................................................................................
..............................................................................................................................................
..............................................................................................................................................
2. When the last time water was tested for phosphates and nitrates and what was the
outcome?
..............................................................................................................................................
..............................................................................................................................................
..............................................................................................................................................
..............................................................................................................................................
..............................................................................................................................................
3. How often does the municipality carry out these phosphates tests?
..............................................................................................................................................
4. What are the parameters used to guide the tests?
..............................................................................................................................................
..............................................................................................................................................
5. Is it possible to access the results of the previous 20 year tests?
..............................................................................................................................................
6. What do you think could be affecting the quality of water in the Vaal River?
..............................................................................................................................................
..............................................................................................................................................
7. Is there any monitoring instrument on the operation of farmers along the Vaal River?
73
..............................................................................................................................................
8. Is there any environmental legislation governing farmers operation in such areas?
..............................................................................................................................................
9. Are there any visits paid to the farms to ensure compliance with said legislation?
..............................................................................................................................................
10. How often are these visits scheduled?
............................................................................................................................................
11. Do you organise any workshops to ensure awareness on river pollution and possible
solutions?
..............................................................................................................................................
12. How often are these organised?
..............................................................................................................................................
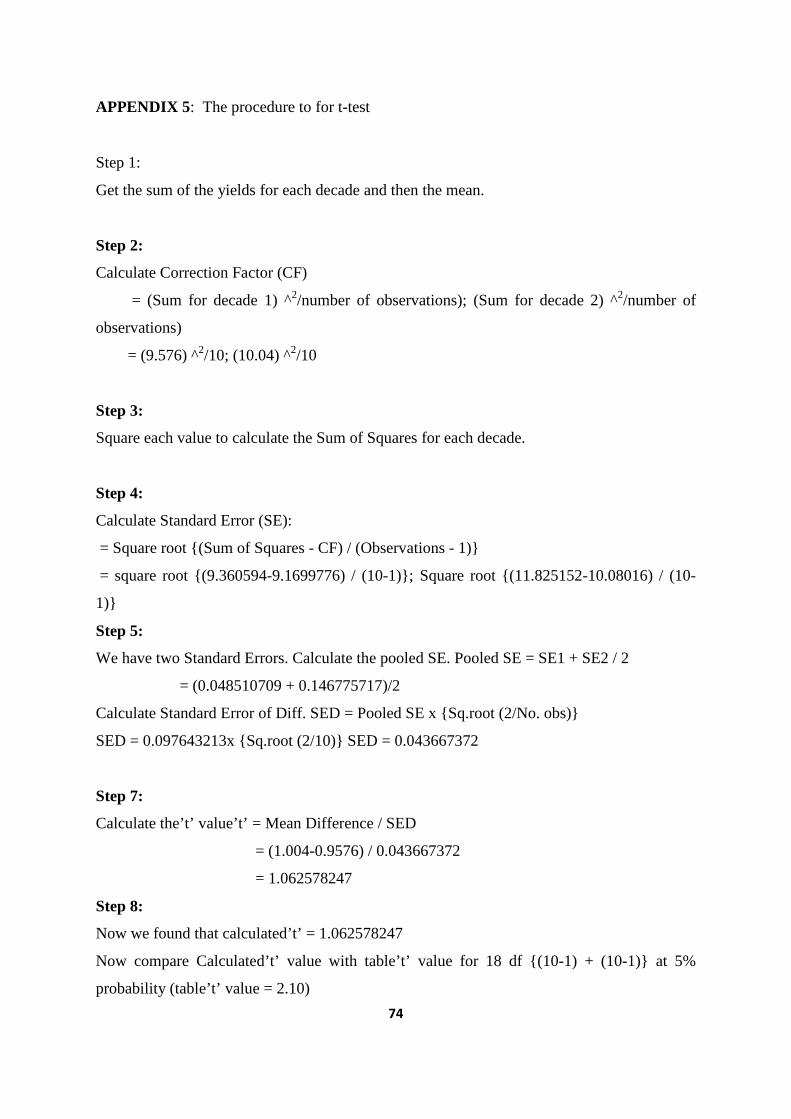
74
APPENDIX 5: The procedure to for t-test
Step 1:
Get the sum of the yields for each decade and then the mean.
Step 2:
Calculate Correction Factor (CF)
= (Sum for decade 1) ^2/number of observations); (Sum for decade 2) ^2/number of
observations)
= (9.576) ^2/10; (10.04) ^2/10
Step 3:
Square each value to calculate the Sum of Squares for each decade.
Step 4:
Calculate Standard Error (SE):
= Square root {(Sum of Squares - CF) / (Observations - 1)}
= square root {(9.360594-9.1699776) / (10-1)}; Square root {(11.825152-10.08016) / (10-
1)}
Step 5:
We have two Standard Errors. Calculate the pooled SE. Pooled SE = SE1 + SE2 / 2
= (0.048510709 + 0.146775717)/2
Calculate Standard Error of Diff. SED = Pooled SE x {Sq.root (2/No. obs)}
SED = 0.097643213x {Sq.root (2/10)} SED = 0.043667372
Step 7:
Calculate the’t’ value’t’ = Mean Difference / SED
= (1.004-0.9576) / 0.043667372
= 1.062578247
Step 8:
Now we found that calculated’t’ = 1.062578247
Now compare Calculated’t’ value with table’t’ value for 18 df {(10-1) + (10-1)} at 5%
probability (table’t’ value = 2.10)
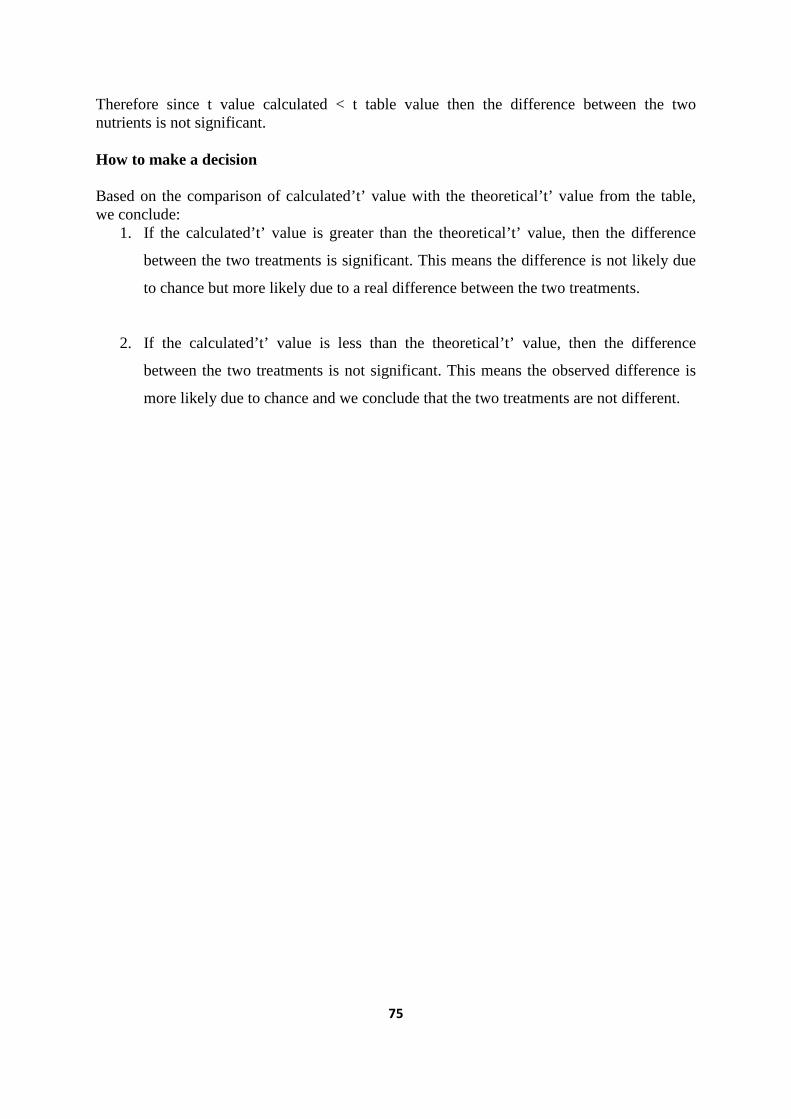
75
Therefore since t value calculated < t table value then the difference between the two nutrients is not significant. How to make a decision Based on the comparison of calculated’t’ value with the theoretical’t’ value from the table, we conclude:
1. If the calculated’t’ value is greater than the theoretical’t’ value, then the difference
between the two treatments is significant. This means the difference is not likely due
to chance but more likely due to a real difference between the two treatments.
2. If the calculated’t’ value is less than the theoretical’t’ value, then the difference
between the two treatments is not significant. This means the observed difference is
more likely due to chance and we conclude that the two treatments are not different.
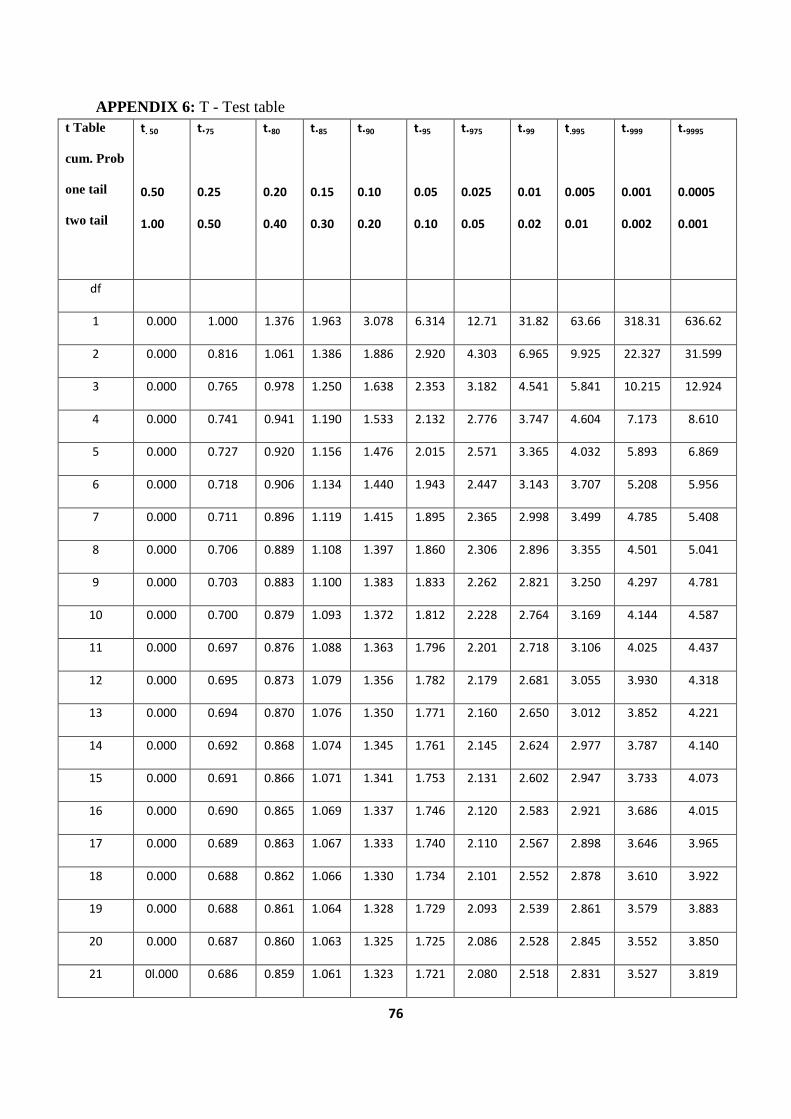
76
APPENDIX 6: T - Test table t Table
cum. Prob
one tail
two tail
t. 50
0.50
1.00
t.75
0.25
0.50
t.80
0.20
0.40
t.85
0.15
0.30
t.90
0.10
0.20
t.95
0.05
0.10
t.975
0.025
0.05
t.99
0.01
0.02
t.995
0.005
0.01
t.999
0.001
0.002
t.9995
0.0005
0.001
df
1 0.000 1.000 1.376 1.963 3.078 6.314 12.71 31.82 63.66 318.31 636.62
2 0.000 0.816 1.061 1.386 1.886 2.920 4.303 6.965 9.925 22.327 31.599
3 0.000 0.765 0.978 1.250 1.638 2.353 3.182 4.541 5.841 10.215 12.924
4 0.000 0.741 0.941 1.190 1.533 2.132 2.776 3.747 4.604 7.173 8.610
5 0.000 0.727 0.920 1.156 1.476 2.015 2.571 3.365 4.032 5.893 6.869
6 0.000 0.718 0.906 1.134 1.440 1.943 2.447 3.143 3.707 5.208 5.956
7 0.000 0.711 0.896 1.119 1.415 1.895 2.365 2.998 3.499 4.785 5.408
8 0.000 0.706 0.889 1.108 1.397 1.860 2.306 2.896 3.355 4.501 5.041
9 0.000 0.703 0.883 1.100 1.383 1.833 2.262 2.821 3.250 4.297 4.781
10 0.000 0.700 0.879 1.093 1.372 1.812 2.228 2.764 3.169 4.144 4.587
11 0.000 0.697 0.876 1.088 1.363 1.796 2.201 2.718 3.106 4.025 4.437
12 0.000 0.695 0.873 1.079 1.356 1.782 2.179 2.681 3.055 3.930 4.318
13 0.000 0.694 0.870 1.076 1.350 1.771 2.160 2.650 3.012 3.852 4.221
14 0.000 0.692 0.868 1.074 1.345 1.761 2.145 2.624 2.977 3.787 4.140
15 0.000 0.691 0.866 1.071 1.341 1.753 2.131 2.602 2.947 3.733 4.073
16 0.000 0.690 0.865 1.069 1.337 1.746 2.120 2.583 2.921 3.686 4.015
17 0.000 0.689 0.863 1.067 1.333 1.740 2.110 2.567 2.898 3.646 3.965
18 0.000 0.688 0.862 1.066 1.330 1.734 2.101 2.552 2.878 3.610 3.922
19 0.000 0.688 0.861 1.064 1.328 1.729 2.093 2.539 2.861 3.579 3.883
20 0.000 0.687 0.860 1.063 1.325 1.725 2.086 2.528 2.845 3.552 3.850
21 0l.000 0.686 0.859 1.061 1.323 1.721 2.080 2.518 2.831 3.527 3.819
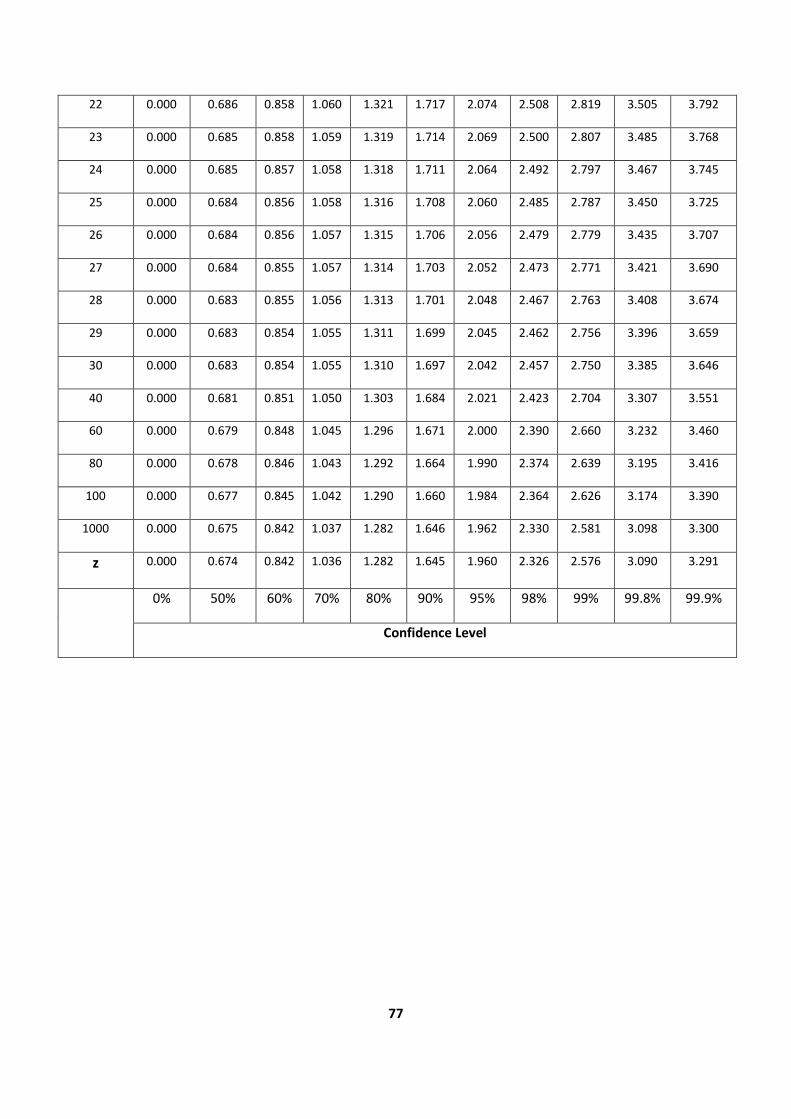
77
22 0.000 0.686 0.858 1.060 1.321 1.717 2.074 2.508 2.819 3.505 3.792
23 0.000 0.685 0.858 1.059 1.319 1.714 2.069 2.500 2.807 3.485 3.768
24 0.000 0.685 0.857 1.058 1.318 1.711 2.064 2.492 2.797 3.467 3.745
25 0.000 0.684 0.856 1.058 1.316 1.708 2.060 2.485 2.787 3.450 3.725
26 0.000 0.684 0.856 1.057 1.315 1.706 2.056 2.479 2.779 3.435 3.707
27 0.000 0.684 0.855 1.057 1.314 1.703 2.052 2.473 2.771 3.421 3.690
28 0.000 0.683 0.855 1.056 1.313 1.701 2.048 2.467 2.763 3.408 3.674
29 0.000 0.683 0.854 1.055 1.311 1.699 2.045 2.462 2.756 3.396 3.659
30 0.000 0.683 0.854 1.055 1.310 1.697 2.042 2.457 2.750 3.385 3.646
40 0.000 0.681 0.851 1.050 1.303 1.684 2.021 2.423 2.704 3.307 3.551
60 0.000 0.679 0.848 1.045 1.296 1.671 2.000 2.390 2.660 3.232 3.460
80 0.000 0.678 0.846 1.043 1.292 1.664 1.990 2.374 2.639 3.195 3.416
100 0.000 0.677 0.845 1.042 1.290 1.660 1.984 2.364 2.626 3.174 3.390
1000 0.000 0.675 0.842 1.037 1.282 1.646 1.962 2.330 2.581 3.098 3.300
z 0.000 0.674 0.842 1.036 1.282 1.645 1.960 2.326 2.576 3.090 3.291
0% 50% 60% 70% 80% 90% 95% 98% 99% 99.8% 99.9%
Confidence Level
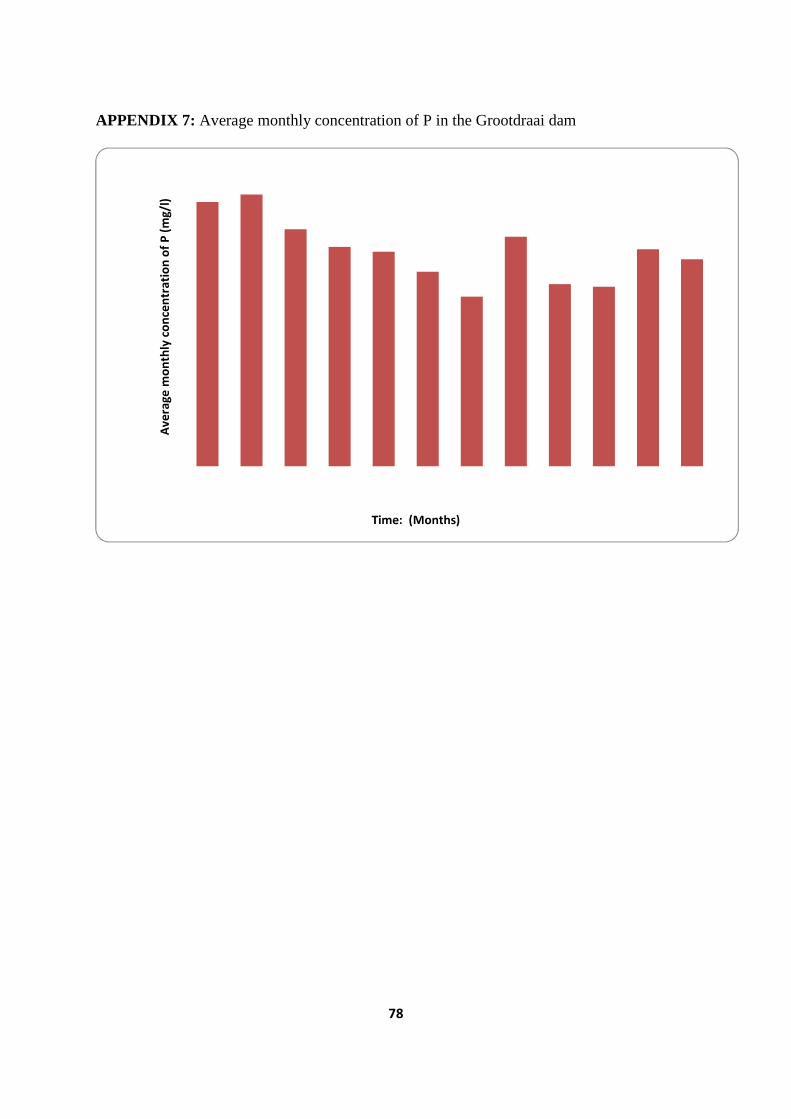
78
APPENDIX 7: Average monthly concentration of P in the Grootdraai dam
Av
era
ge
mo
nth
ly c
on
cen
tra
tio
n o
f P
(m
g/l
)
Time: (Months)
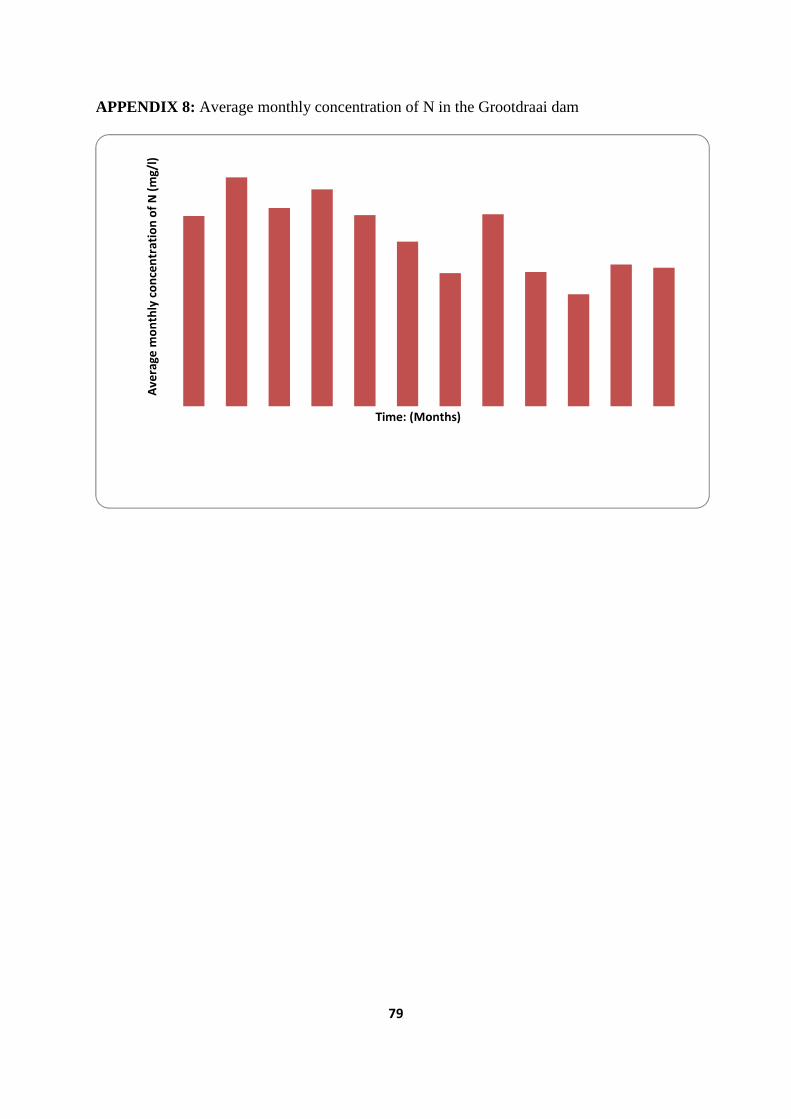
79
APPENDIX 8: Average monthly concentration of N in the Grootdraai dam
Av
era
ge
mo
nth
ly c
on
cen
tra
tio
n o
f N
(m
g/l
)
Time: (Months)
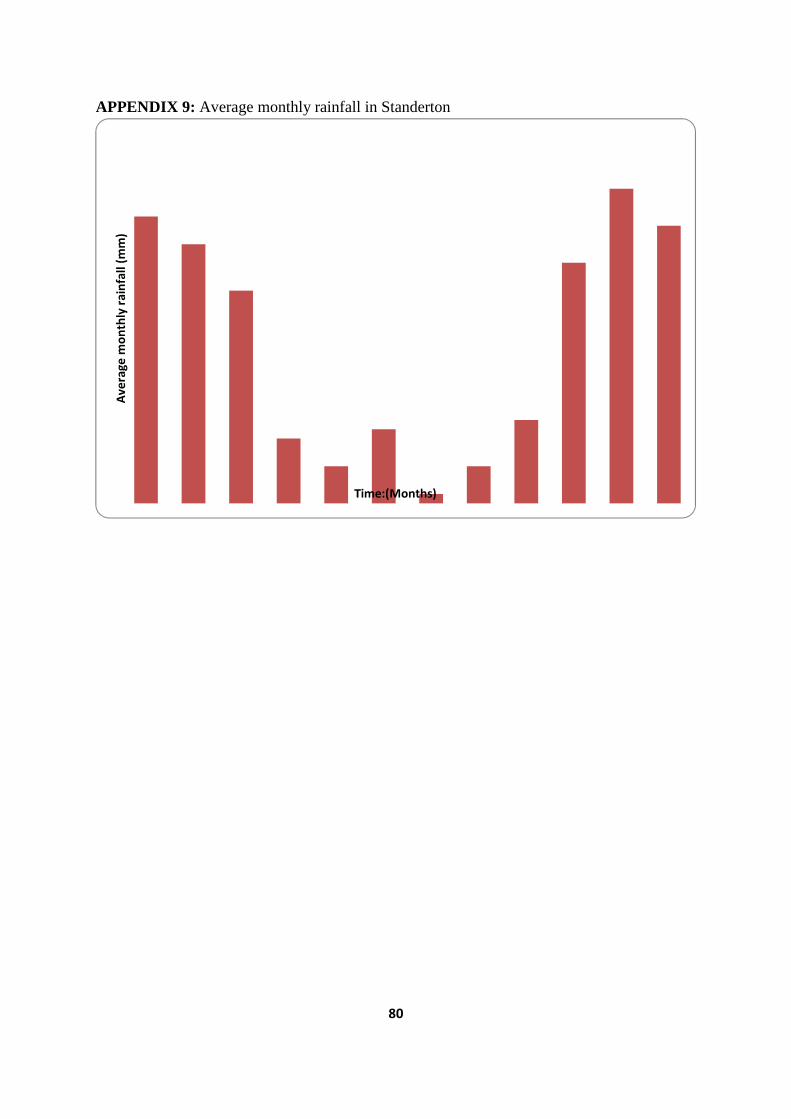
80
APPENDIX 9: Average monthly rainfall in Standerton
Av
era
ge
mo
nth
ly r
ain
fall
(m
m)
Time:(Months)
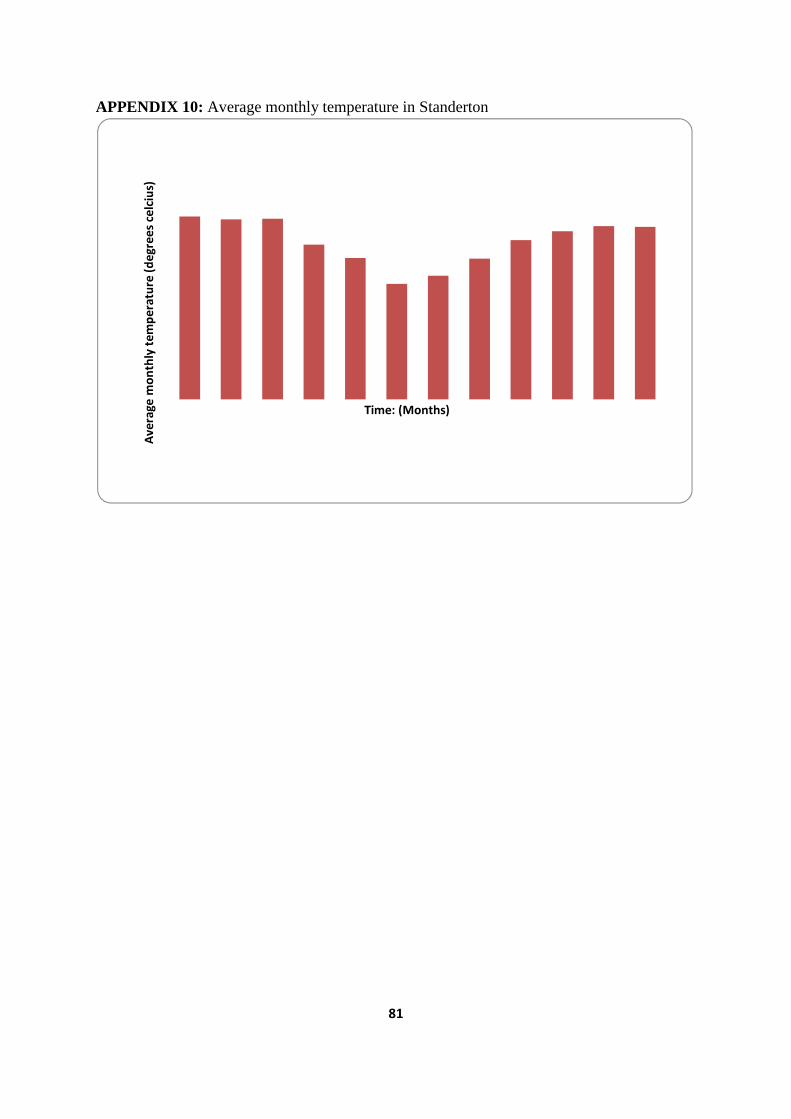
81
APPENDIX 10: Average monthly temperature in Standerton
Av
era
ge
mo
nth
ly t
em
pe
ratu
re (
de
gre
es
celc
ius)
Time: (Months)